Article

Characteristics and Deformation Mechanisms of Neogene Red-Bed Soft Rock Tunnel Surrounding Rock: Insights from Field Monitoring and Experimental Analysis

School of Civil Engineering and Architecture, Xinjiang University, Urumqi 830047, China
*
Author to whom correspondence should be addressed.
Buildings 2025, 15(11), 1820; https://doi.org/10.3390/buildings15111820
Submission received: 22 April 2025 / Revised: 20 May 2025 / Accepted: 22 May 2025 / Published: 26 May 2025

Abstract

This study focuses on Neogene red-bed soft rock tunnels in the Huicheng Basin, China. Through engineering geological investigation, remote wireless monitoring systems, and total station multi-parameter monitoring, the deformation characteristics of red-bed soft rock surrounding rock under high in situ stress environments and their influencing factors were systematically analyzed. The findings reveal that the surrounding rock deformation follows a three-stage evolutionary pattern of “rapid, slow, and stable”. Construction disturbances can disrupt the stable state, leading to “deep V-shaped” anomalies or double-step responses in deformation curves. Spatially, the deformation exhibits significant anisotropy, with the haunch area showing the maximum deformation (95 mm) and the vault the minimum (65–73 mm). Deformation stabilization requires 30–42 days, and a reserved deformation of 10 cm is recommended based on specifications. Mechanical behavior analysis indicates that the stress–strain curves of red-bed argillaceous sandstone are stepped, with increased confining pressure enhancing both peak and residual strengths, validating the necessity of timely support. The study elucidates a multi-factor coupling mechanism: rock mass classification, temporal–spatial effects (excavation face constraints and rheological properties), construction methods, in situ stress levels, and support timing (timely support during the rapid phase inhibits strength degradation) significantly influence deformation evolution. The spatiotemporal distribution of surrounding rock pressure shows that invert pressure increases most rapidly, while vault pressure reaches the highest magnitude, with construction disturbances triggering stress redistribution. This research provides theoretical and practical guidance for the design, construction optimization, and disaster prevention of red-bed soft rock tunnels.

1. Introduction

Red beds are widely distributed across continents globally [1,2,3,4,5]. As a typical continental sedimentary rock mass, red-bed soft rock primarily consists of interbedded argillaceous sandstone, sandy mudstone, shale, and sandy conglomerate. Its characteristics of poor diagenesis, weak cementation, and water-induced softening/disintegration significantly affect its mechanical properties and engineering stability [6,7,8]. Particularly in tunnel engineering, red-bed soft rock frequently triggers hazards such as large surrounding rock deformation, support structure cracking, and even collapse due to its strong rheological behavior, low strength, and small deformation modulus, posing serious threats to construction safety and long-term tunnel operation [9,10,11]. Neogene red-bed soft rock exhibits more pronounced strength degradation due to its younger geological age and weaker diagenesis. Under high in situ stress conditions, the expansion of plastic zones and abrupt deformation caused by excavation-induced disturbances become particularly prominent [12,13].
In recent years, domestic and international scholars have conducted systematic research on the geological genesis, mechanical properties, and construction technologies of red-bed soft rock. Regarding geological characteristics and formation mechanisms, studies focus on sedimentary environments, diagenetic evolution, mineral composition, and tectonic responses to reveal spatial distribution patterns and geological evolution mechanisms. For instance, research demonstrates that red-bed soft rock’s mineral composition features quartz and feldspar as framework components, with clay minerals (montmorillonite, illite, etc.) and ferruginous cement (hematite, goethite, etc.) as primary interstitial materials [14,15,16,17,18]. The high montmorillonite content contributes to water-absorption expansion, while oxidation-reduction cycles of iron cement exacerbate the vulnerability of cementation structures, collectively influencing the rock’s durability [19,20,21,22,23,24]. In terms of mechanical properties, investigations concentrate on hydro-mechanical coupling characteristics (e.g., softening thresholds, expansibility) and long-term strength evolution to elucidate mechanical behaviors and instability mechanisms [25,26,27,28,29]. Multiple studies highlight water’s critical influence on mechanical properties and engineering stability—increased moisture content significantly reduces strength, anchoring capacity, and surrounding rock stability [30,31,32]. Regarding construction technologies, tunnel surrounding rock stability remains a key focus due to the rock’s low strength and high deformability. Ma et al. [33] proposed graded support technology for deep-buried fractured soft rock tunnels to address deformation challenges under complex geological conditions. Laurent Thum et al. [34], along with Li et al. [35], Sun et al. [36], and Chen et al. [37], investigated large deformations in soft rock tunnels through data monitoring and numerical simulation, enabling real-time perception and quantitative assessment of damage zones. Zhang et al. [38] studied deformation mechanisms and control measures for water-rich, red-bed sandstone roadways in China’s Huaibei mining area, proposing an “advanced grouting reinforcement + full-length anchor-grouting support” scheme that effectively enhanced roadway stability. These studies significantly improve construction safety in red-bed soft rock tunnels.
However, current research exhibits notable limitations. First, insufficient attention has been paid to multi-factor coupling mechanisms in red-bed soft rock. Most studies follow conventional laboratory test specifications while neglecting environmental condition impacts on engineering characteristics, particularly the unquantified interactions between high in situ stress, construction disturbances, and support delays on deformation evolution [39,40]. Additionally, traditional monitoring methods prove inadequate under complex geological conditions, failing to comprehensively capture the spatiotemporal dynamics of surrounding rock deformation [41,42,43].
This study focuses on tunnels in Neogene red-bed soft rock of the Huicheng Basin in China. Using a wireless remote monitoring system, it analyzes the “rapid—slow—stable” three-stage evolution pattern of deformation of the surrounding rock and its spatial anisotropy. The research aims to systematically analyze the deformation characteristics of surrounding rock in red-bed soft rock tunnels and the deformation mechanisms under multi-factor coupling. The results will provide scientific evidence for the design, construction, and disaster prevention of such tunnels.

2. Experimental Materials and Methods
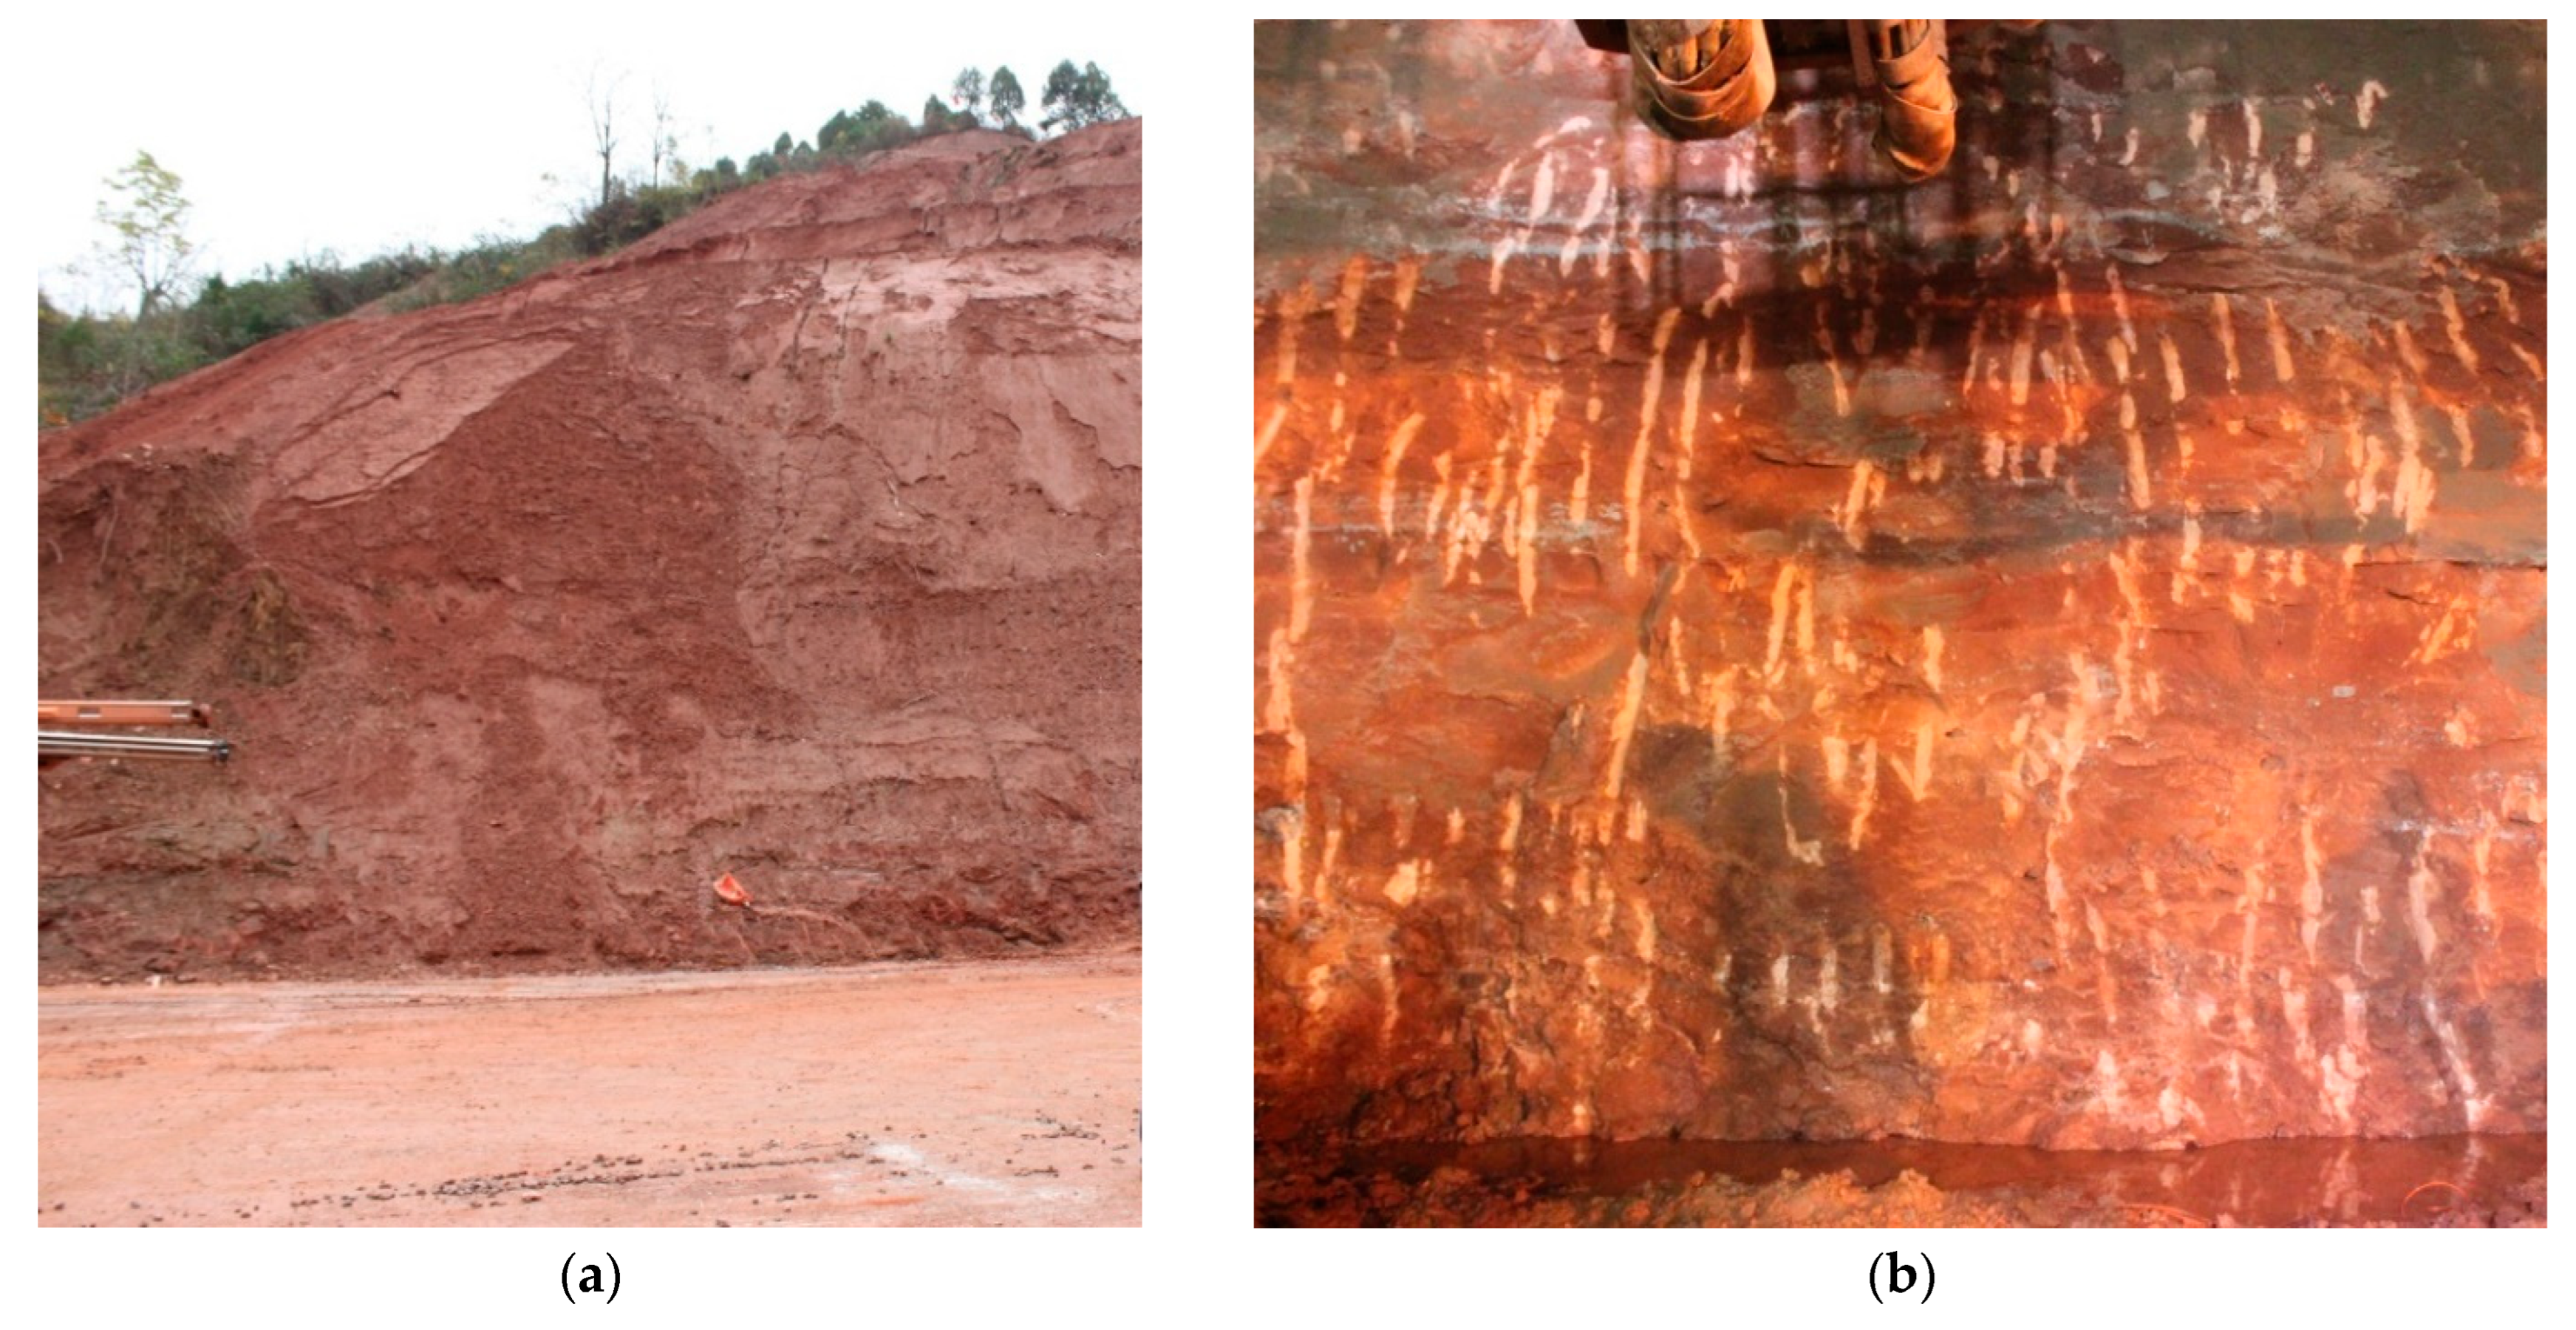
2.1. Study Objects

The studied Neogene red-bed soft rock tunnel is located at the margin of the Huicheng Basin, within a denudational low-middle mountain hilly landform, with a maximum burial depth of 255 m. The natural slopes at the tunnel’s entrance and exit are 15–25° and 15–23°, respectively, both areas being cultivated as farmland and covered with dense vegetation at higher elevations. The tunnel site lies between the Yongning River and Luojia River watersheds, with minor intermittent flows (0.3–2 L/s) in valleys, significantly influenced by surface precipitation. Groundwater primarily comprises bedrock fissure water, recharged by atmospheric precipitation. The red-bed strata exhibit weak groundwater circulation, slow runoff, and discharge into valleys and Quaternary deposits at lower elevations.
The tunnel primarily traverses Neogene argillaceous sandstone and sandy conglomerate (N2): reddish-brown, weakly cemented with clay, poorly diagenetic, and exhibiting a medium-thick bedded structure. The conglomerate contains particles up to 3–4 cm in diameter, mostly subrounded to rounded, and prone to softening upon water exposure. Classified as extremely soft to soft rock, the stratum is easily fragmented under hammer impact, susceptible to desiccation cracking upon dehydration, and features interbedded soft and hard lithologies. This stratum constitutes the primary layer traversed by the tunnel, with field photographs shown in Figure 1.

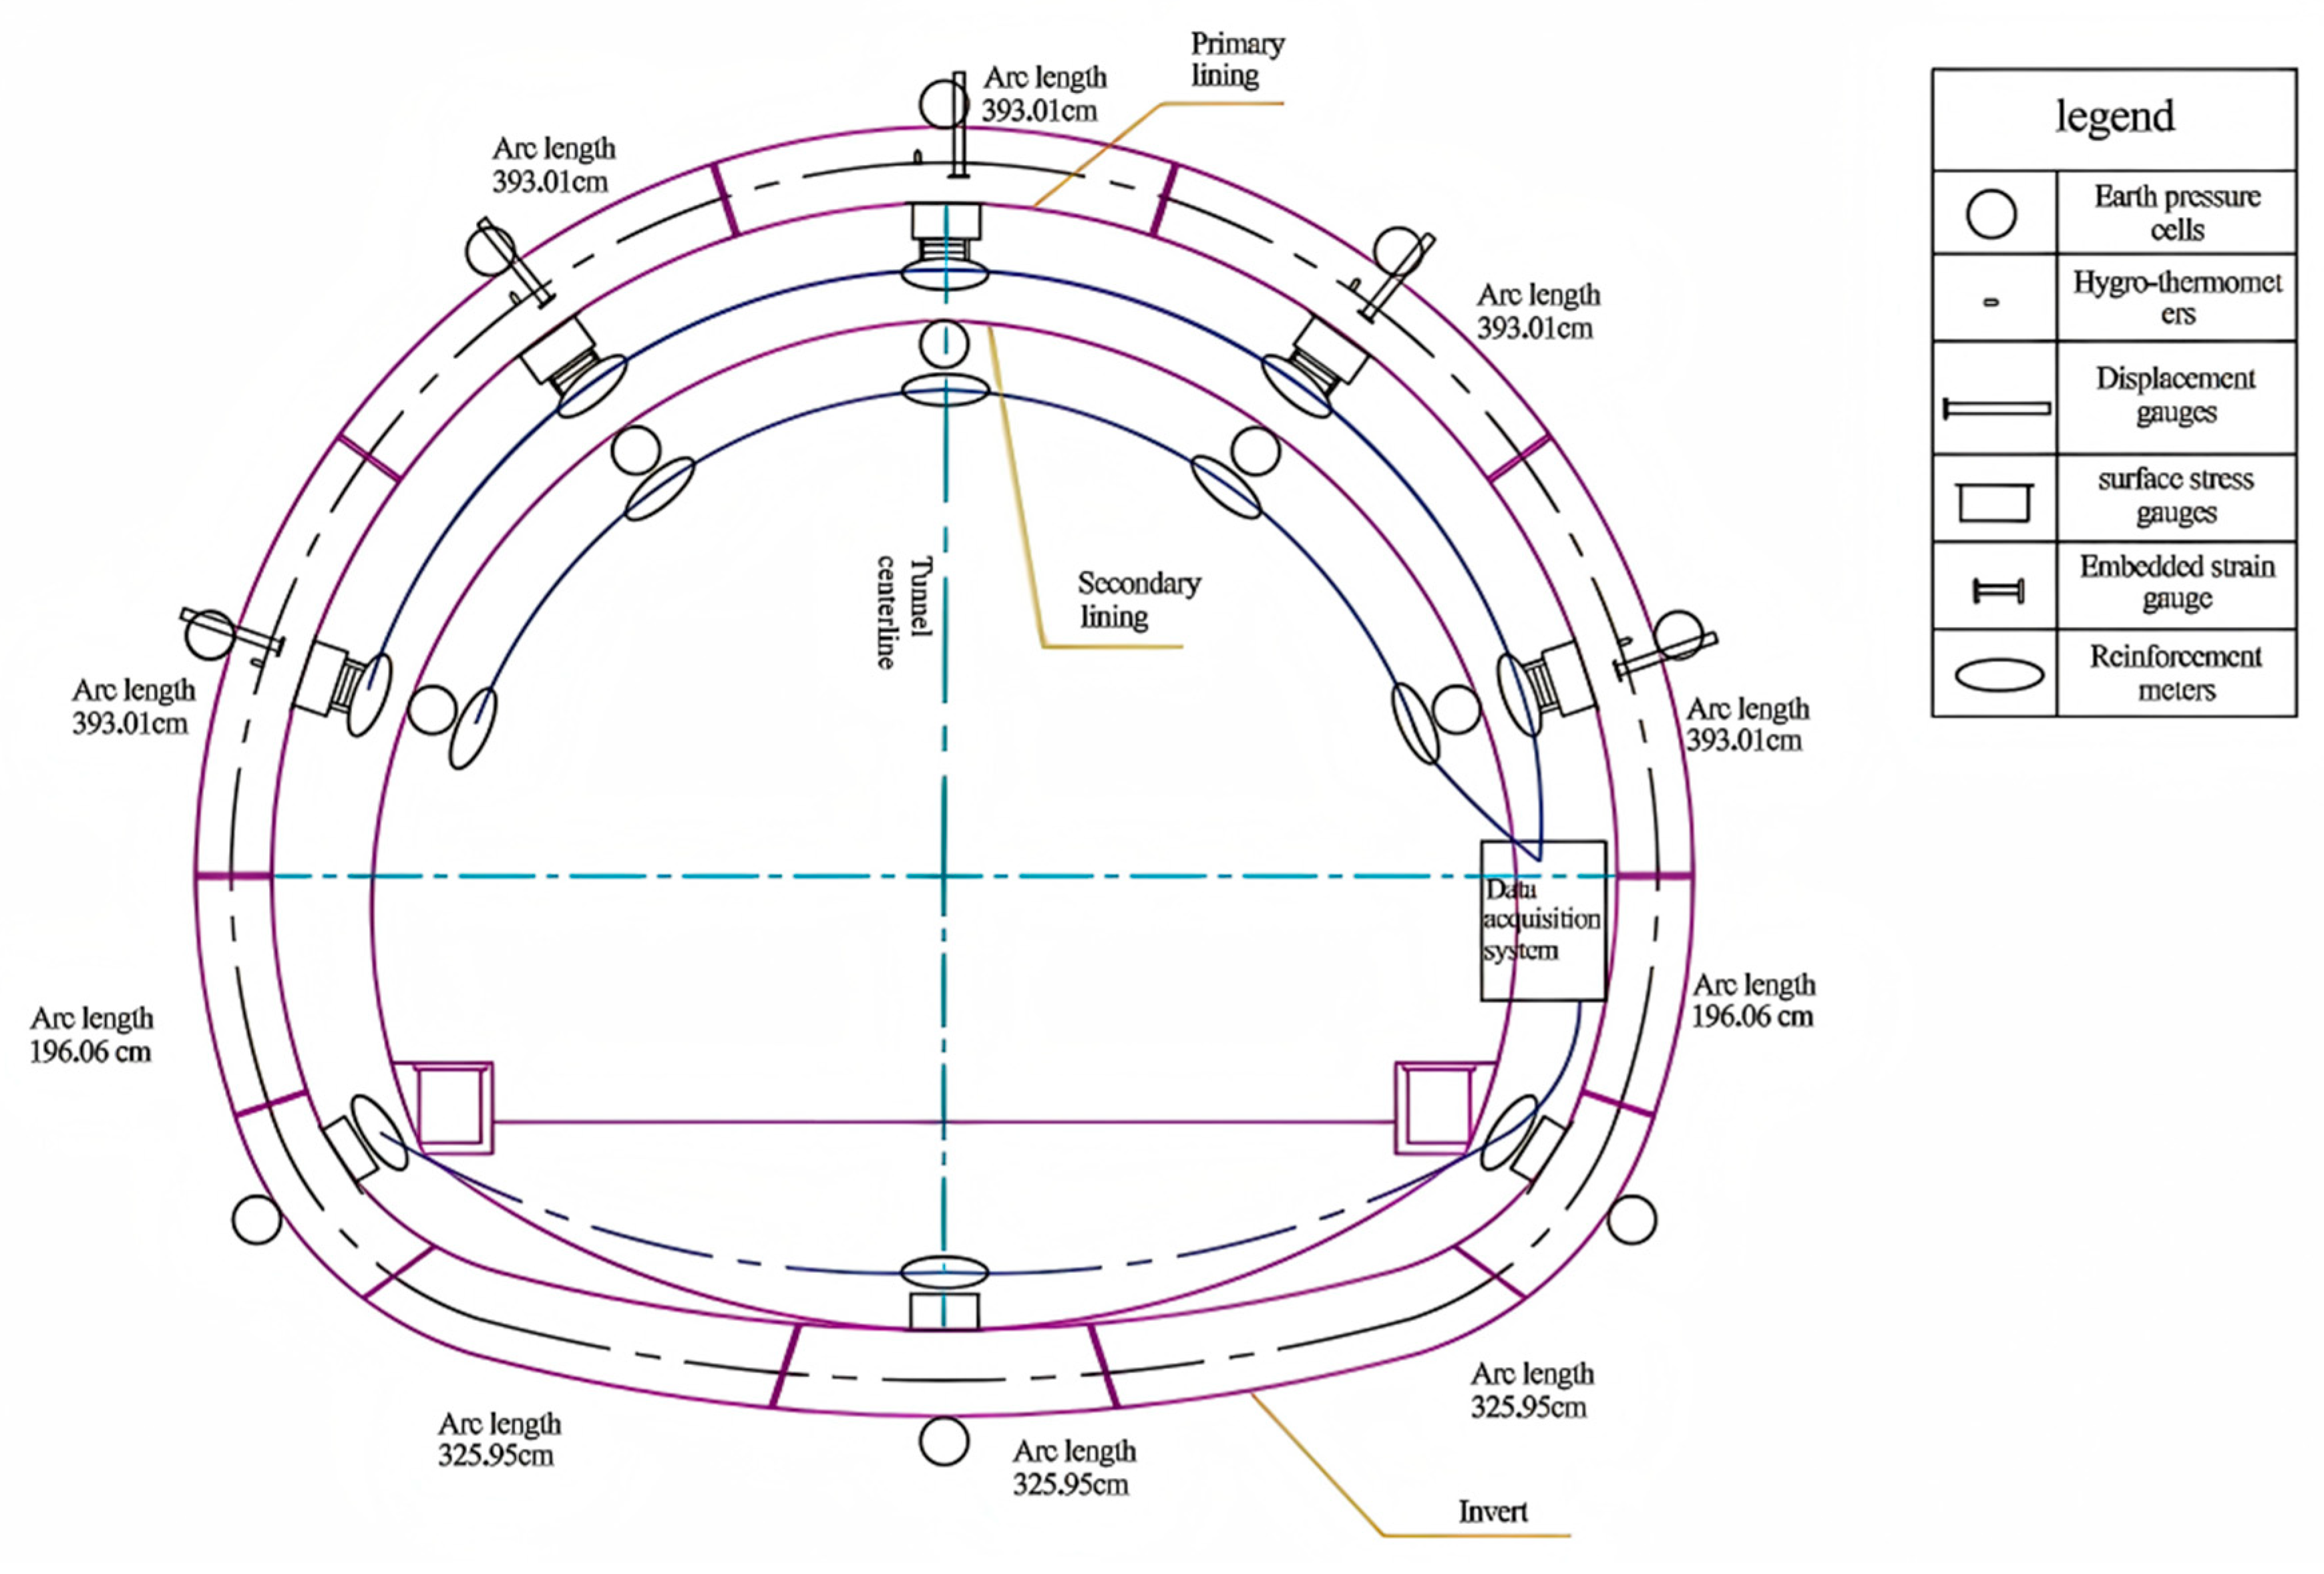
2.2. Surrounding Rock Deformation Monitoring

Monitoring and measurement provide real-time data on the deformation and stress evolution of surrounding rock and support structures over time, enabling the evaluation of construction feasibility, design parameter rationality, and critical assessments of surrounding rock stability, support effectiveness, secondary lining timing, relaxation zone determination, reserved deformation design, and lining stability.
Based on the engineering and hydrogeological characteristics of red-bed soft rock, combined with geological survey results and construction progress, remote wireless monitoring systems were deployed in Huizhou Tunnel No. 1 and Huizhou Tunnel No. 2 along the Liangdang–Huixian Expressway. These tunnels traverse typical Neogene red-bed argillaceous sandstone sections. The systems monitored parameters including surrounding rock pressure, internal forces of support measures, deformations of rock mass and supports, and rock temperature/humidity. The monitoring items and number of measurement points are detailed in Table 1; the sensor layout diagram is shown in Figure 2.
The experimental instruments used include earth pressure cells, hygro-thermometers, displacement gauges, surface stress gauges, embedded stress gauges, and reinforcement meters.
Monitoring data can be collected manually or automatically. For manual collection, a portable integrated tester is employed to record initial values (e.g., sensor ID, calibration coefficients, and monitoring data) after each sensor is installed. Once all sensors are in place, they are integrated into an automated wireless monitoring system for remote data acquisition and transmission. This system utilizes a wireless data transmission module composed of a terminal unit and a host unit. Leveraging mature GPRS/GSM/3G/4G networks, it rapidly establishes data communication within network-covered areas to enable real-time remote data transmission.

3. Experimental Results and Analysis

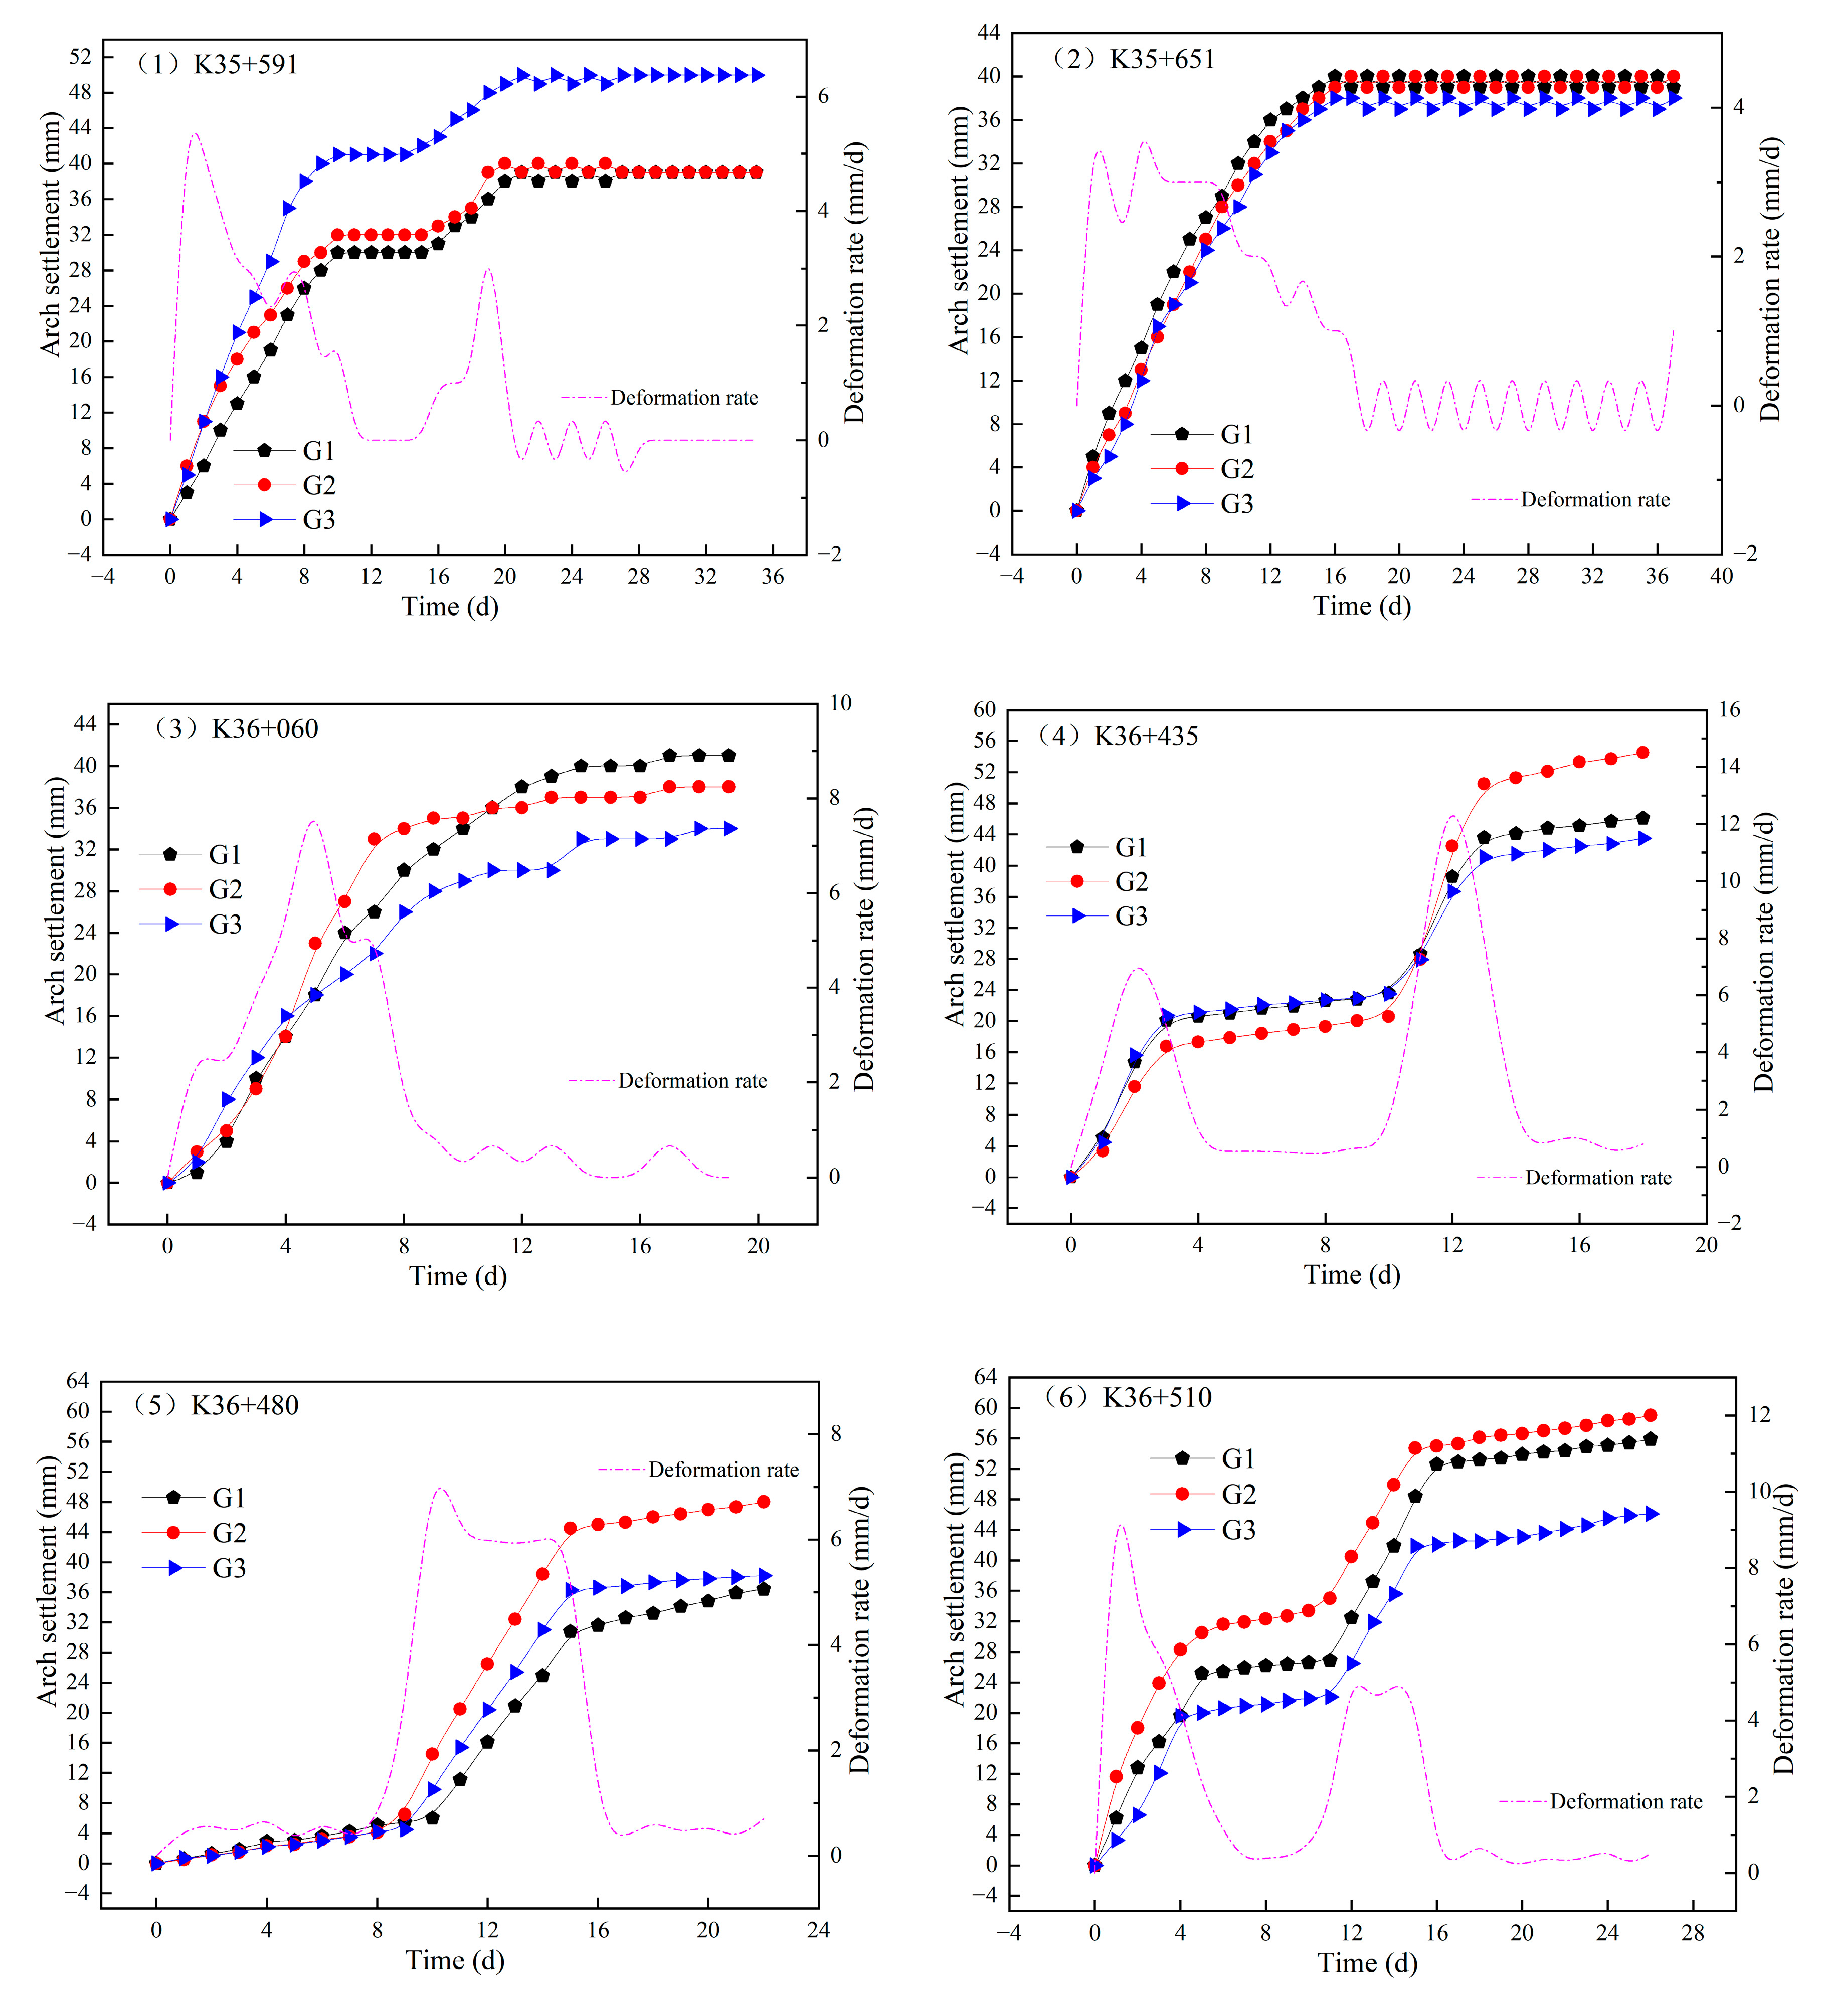
3.1. Temporal Characteristics of Surrounding Rock Deformation

Deformation monitoring was conducted on the surrounding rock at the vault, left spandrel, right spandrel, left haunch, and right haunch positions of the monitoring cross-section in Huizhou Tunnel No. 1.
Figure 3 show the temporal deformation curves of the surrounding rock at the vault, left spandrel, right spandrel, left haunch, and right haunch of the monitoring cross-section. The monitoring data reveal that the surrounding rock deformation can be broadly divided into three stages: rapid deformation, slow deformation, and stable deformation. The rapid deformation stage accounts for the largest proportion of total deformation, while the slow deformation stage persists the longest.
The tunnel was constructed using the three-bench method. According to construction logs, subsequent excavation disturbances disrupted the stable deformation state, causing the monitoring curves to exhibit deep V-shaped anomalies and reinitiating the cycle of rapid–slow–stable deformation. However, the deformation rate during the renewed rapid stage significantly decreased compared to the previous cycle, and the time required to reach stability was shortened. This phenomenon provides critical insights for determining the optimal timing of secondary lining in soft rock tunnels and should not be overlooked.
Using a total station, the vault settlement deformation and sidewall convergence deformation of the red-bed surrounding rock were monitored, as shown in Figure 4. The monitoring data reveal strong consistency between the total station measurements and the remote wireless monitoring results, both indicating that the surrounding rock deformation follows a three-stage evolution: rapid deformation, slow deformation, and stable deformation.
Key differences emerged in response to subsequent construction disturbances: the remote wireless system detected “deep V-shaped” anomalies in deformation curves after disturbance, and the total station measurements showed double-step patterns in vault settlement and sidewall convergence curves.
After stabilization, sidewall convergence deformations from both methods aligned closely. However, total station-measured vault settlements were slightly smaller than those from remote wireless monitoring, likely due to subjective factors in manual measurements, anisotropy in rock engineering properties, and construction phase variations.
Integrated analysis of both monitoring methods indicates that the temporal deformation curves of the red-bed soft rock tunnel primarily exhibit four patterns: parabolic, S-shaped, stepped, and inverted-L shaped.

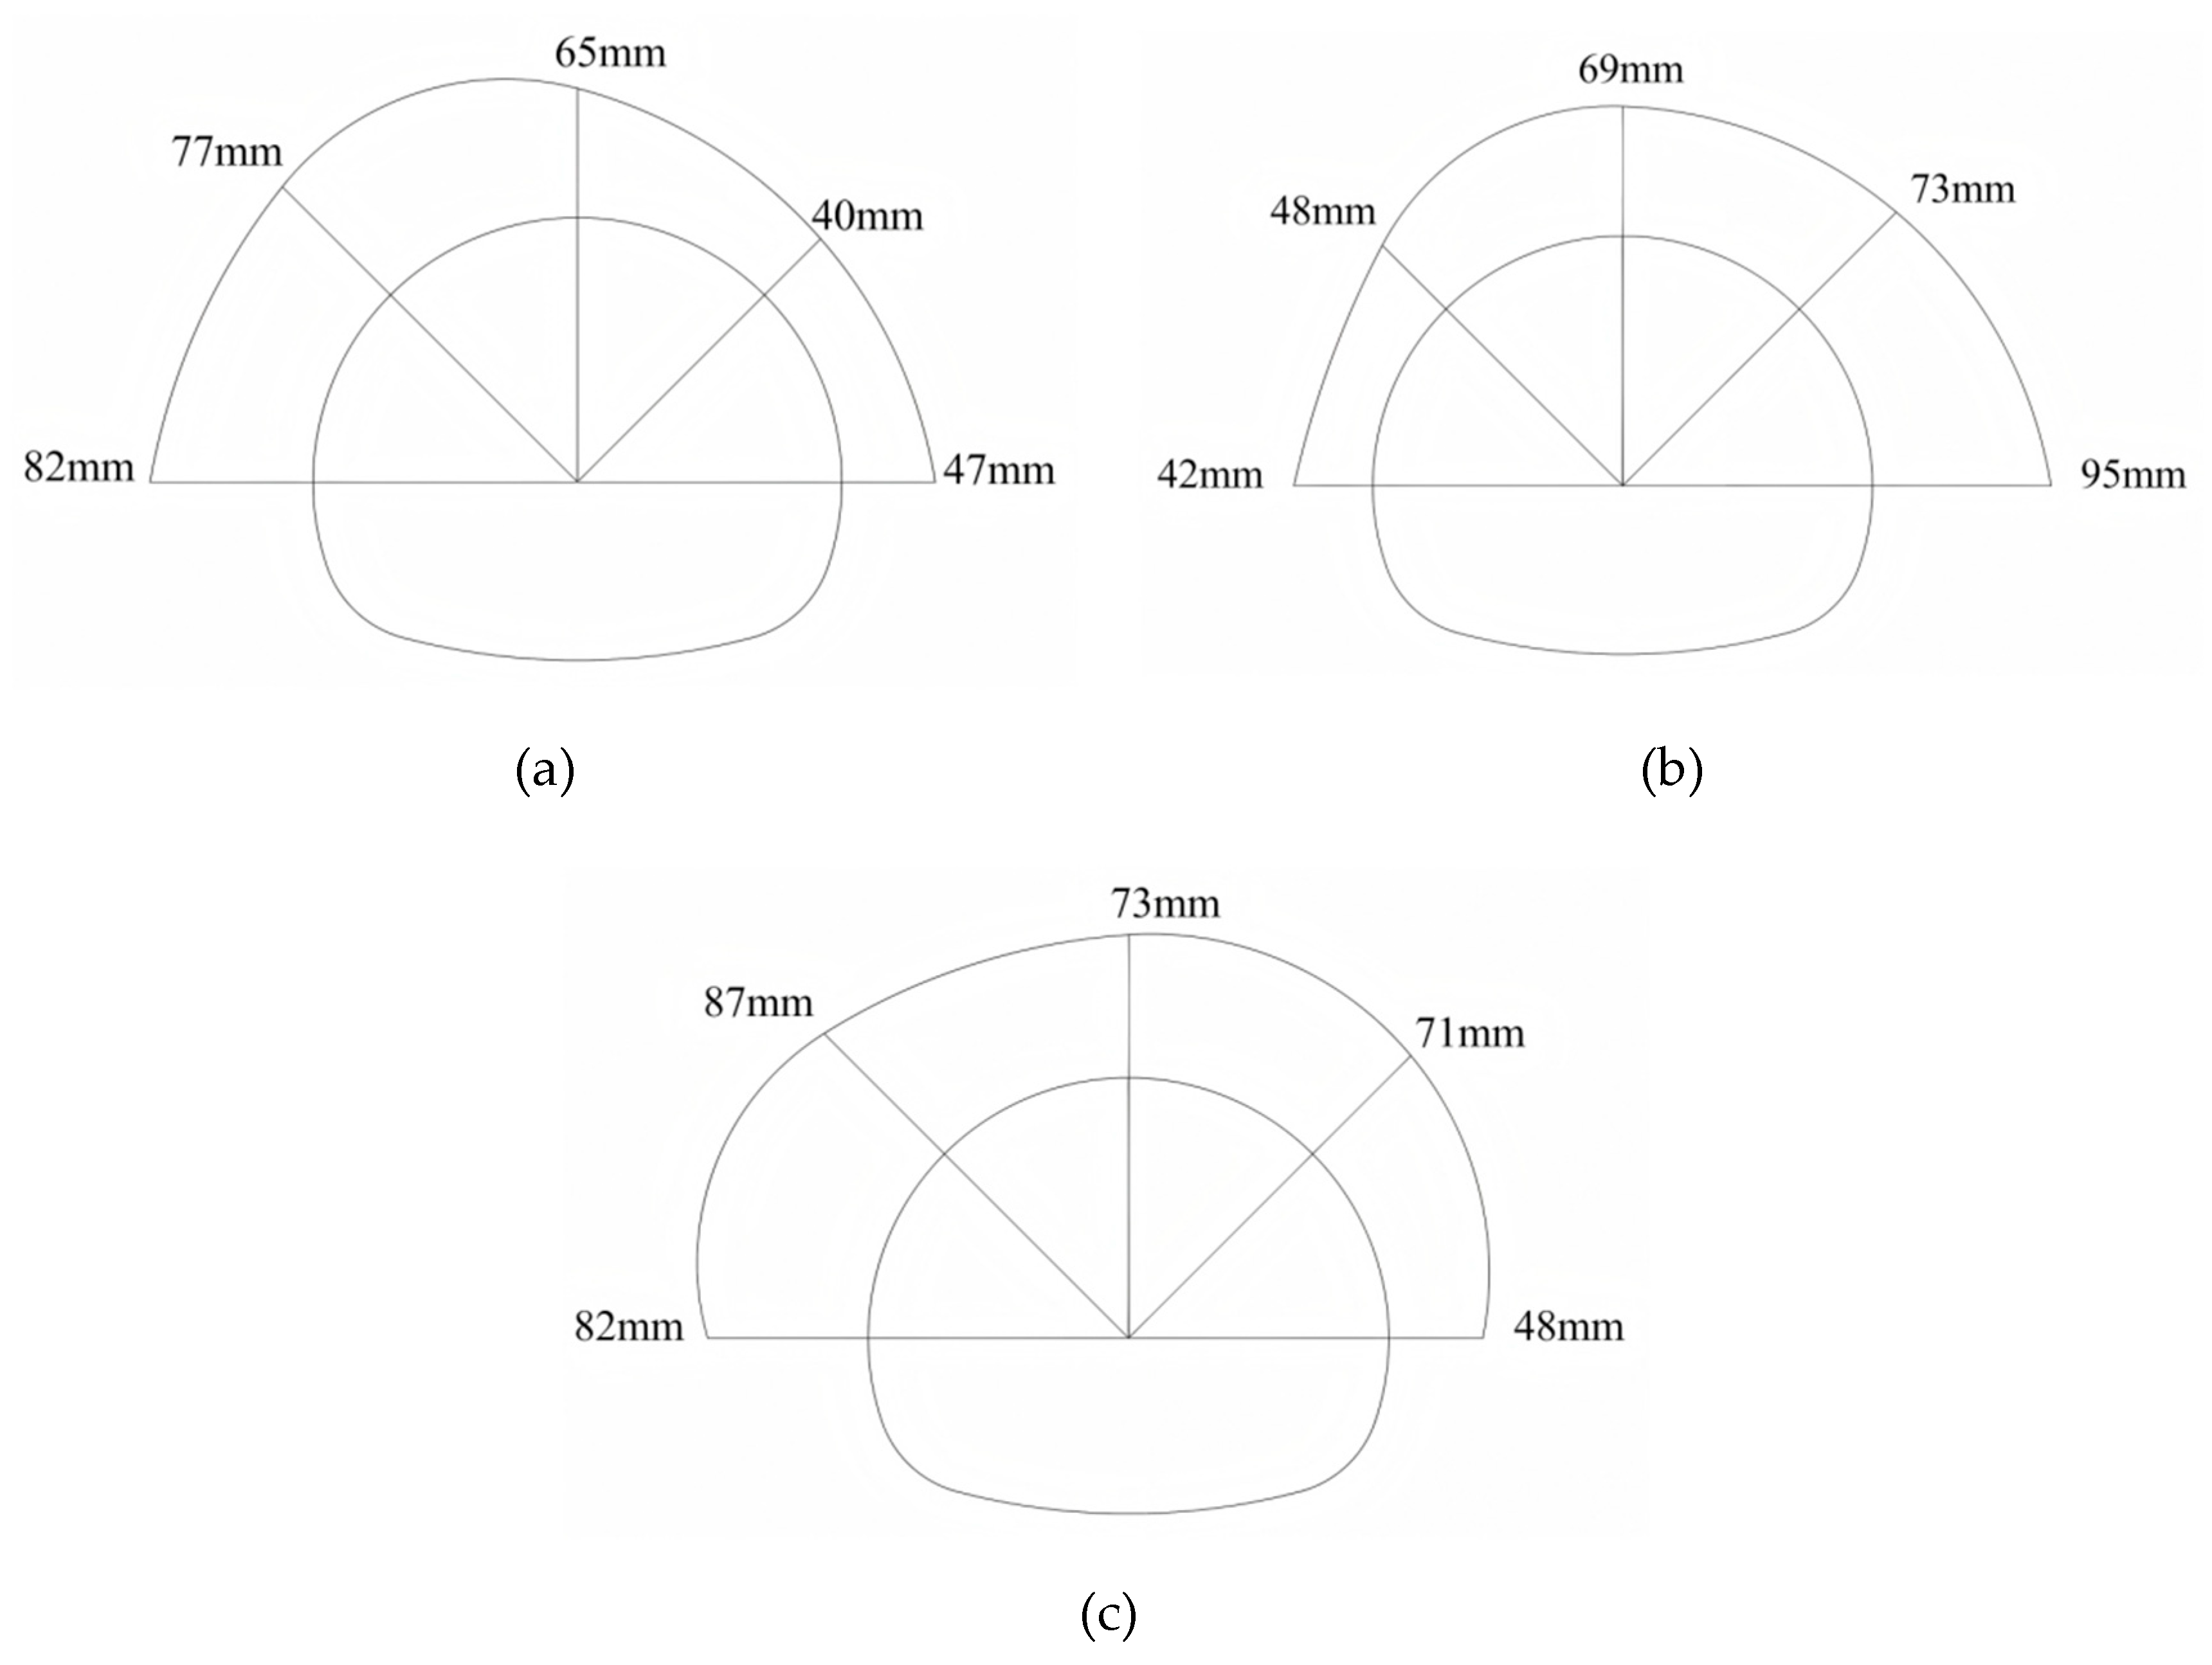
3.2. Spatial Distribution of Surrounding Rock Deformation

Figure 5 illustrates the deformation characteristics of surrounding rock at different arch rings within the same cross-section during the stable stage, highlighting significant anisotropy in deformation. This anisotropy diminishes with increasing distance from the excavation boundary. Within the 0–2 m range from the tunnel face, radial deformation differences are minimal, but the maximum deformation zone exhibits pronounced asymmetry with greater radial depth.
The data further reveal that, after excavation of this soft rock tunnel, the maximum radial deformation occurs at the haunch areas, followed by the adjacent spandrel regions. The stable stage displayed the following: Crown deformation: 65–73 mm, Haunch deformation: 42 to 95 mm, Spandrel deformation: 48–87 mm, Stabilization time: 30–42 days.
According to the Technical Specifications for Construction of Highway Tunnels [44], since this tunnel is designed as a two-lane structure passing through Grade V surrounding rock, the reserved deformation allowance stipulated by the specifications is 80–120 mm. Considering the observed deformation magnitude and anisotropy, it is recommended to set the reserved deformation allowance at 100 mm during tunnel excavation.

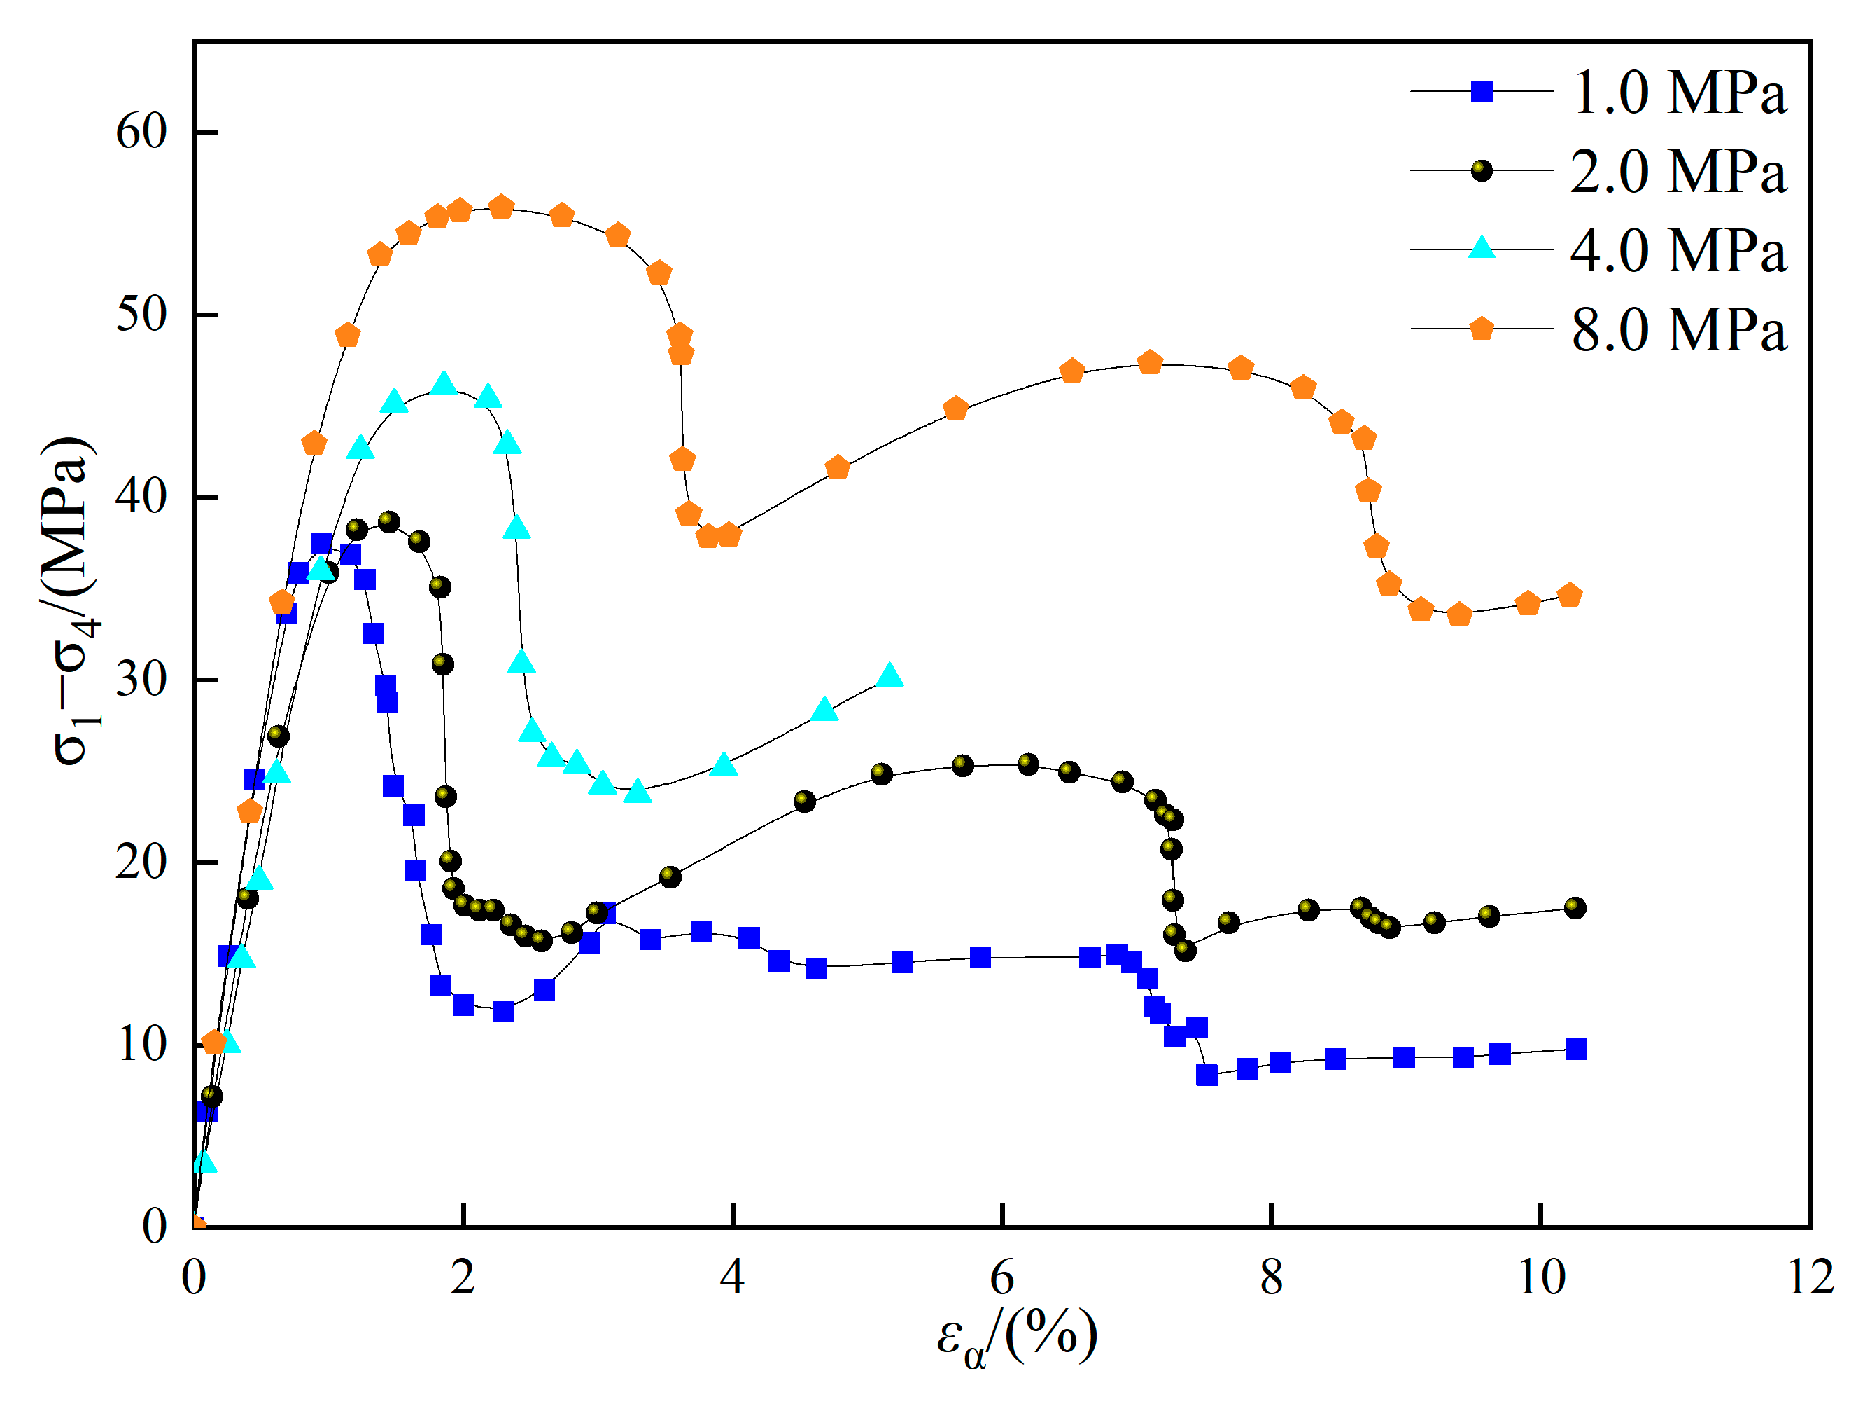
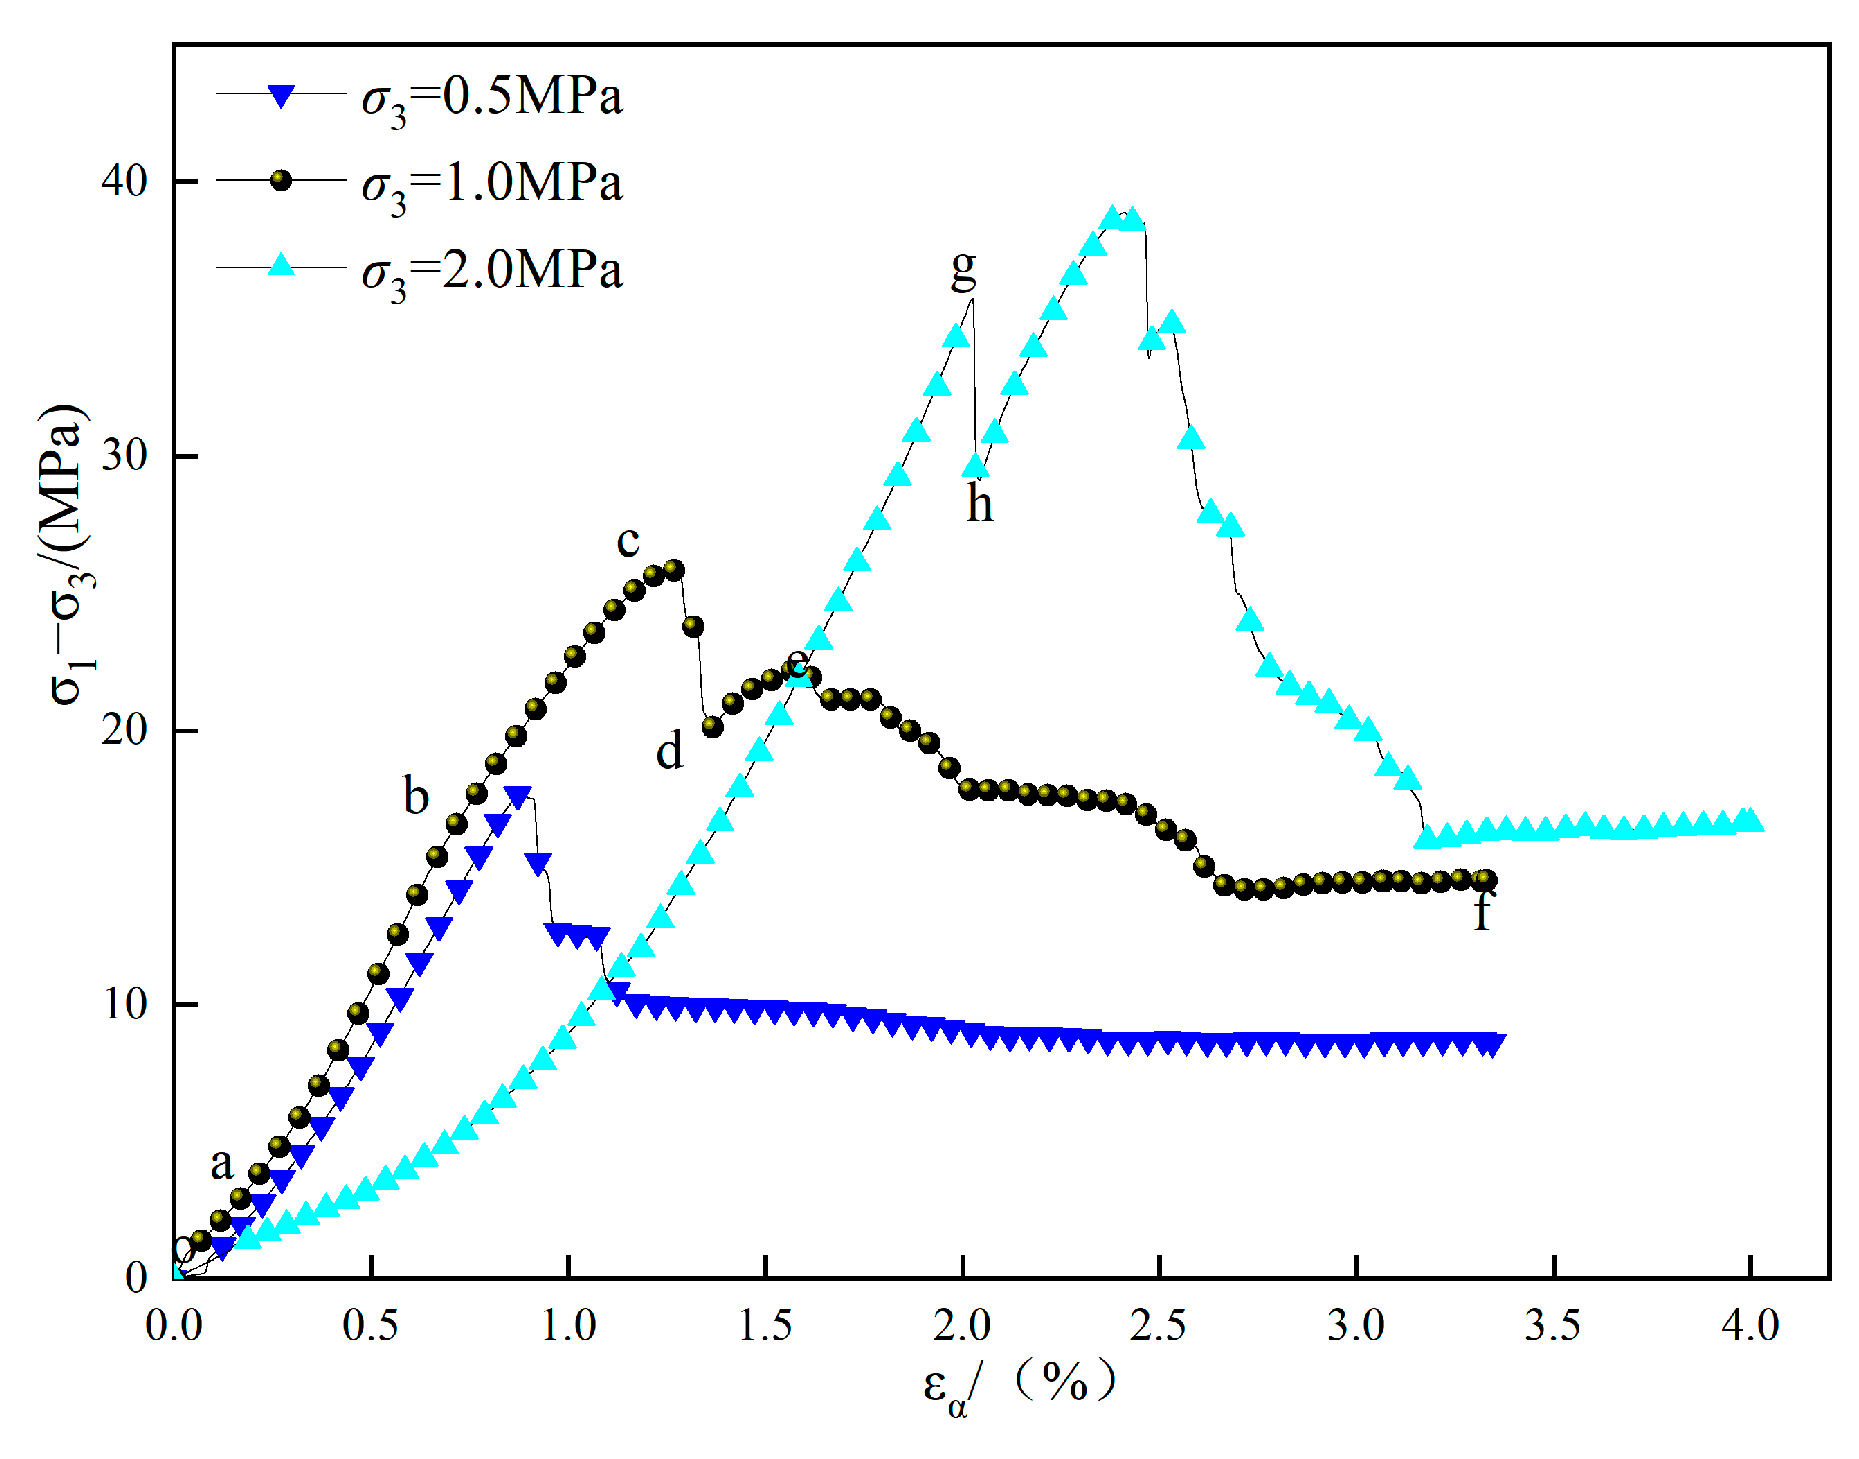
3.3. Mechanical Behavior of Surrounding Rock

From Figure 6 and Figure 7, it is evident that both the peak strength and residual strength of red-bed argillaceous sandstone increase with rising confining pressure. Additionally, the deformation required to reach peak strength grows with higher confining pressures. After the initial failures, all specimens exhibit a notable strength recovery as deformation continues, followed by a sudden strength drop at critical strain levels, resulting in stepped stress–strain curves. This suggests that red-bed sandy conglomerate retains significant post-peak strength recovery potential. Specifically, when excavation-induced disturbances reduce rock mass strength, timely support (providing adequate confining pressure or reinforcement) can markedly restore strength, underscoring the critical importance of support timing in practical engineering.
Tunnel surrounding rock deformation typically progresses through three stages: elastic deformation, plastic deformation, and plastic flow. Once entering the plastic flow stage, deformation accelerates abruptly, leading to sudden instability. Due to factors such as tunnel depth and rock strength, the applied stress may exceed the compressive strength of the surrounding rock, causing localized failure and transitioning portions of the rock into a plastic state. Notably, even without further stress increases, deformation continues to develop under sustained plastic flow.

4. Discussion

4.1. Factors Influencing Surrounding Rock Deformation

  • Engineering properties of surrounding rock.
The classification of surrounding rock is the primary factor determining tunnel support strategies and engineering measures, as well as being a critical influence on deformation behavior. Tang et al. [45] investigated large squeezing deformations in high-stress soft rock tunnels, noting that poor-quality surrounding rock (e.g., weak, fractured, or high-stress conditions) leads to significant deformations with wide data variability. Aydan et al. [46] addressed limitations in traditional rock mass classification systems by proposing a novel rating system integrating rock integrity parameters and empirical indices to estimate the geomechanical properties of complex rock masses. Their findings indicate that higher-quality surrounding rock requires less time to stabilize, shortening the overall stabilization period. Red-bed soft rock, classified as extremely soft rock, exhibits strain-softening behavior, exacerbated by groundwater effects and strength degradation. Laboratory tests demonstrate that the peak and residual strengths of red-bed argillaceous sandstone increase with confining pressure (Figure 7 and Figure 8). The stepped stress–strain curves suggest partial strength recovery post-failure, validating the necessity of timely support to restore load-bearing capacity.
2.
Temporal–Spatial Effects.
The surrounding rock in the monitoring cross-section is significantly influenced by the spatial effects of deformation. The fundamental principle of the New Austrian Tunneling Method (NATM) lies in treating the rock mass as a continuous medium. Guided by viscoelastic and elastoplastic theories, it emphasizes the timely construction of support structures based on the time-dependent process from deformation initiation to rock failure after tunnel excavation, enabling the surrounding rock and support system to jointly form a robust load-bearing ring. The “time-dependent effects” mentioned here, referring to the process from deformation generation to rock failure, primarily manifest as the continuous growth of surrounding rock stress and deformation over time. This includes two aspects:
The first aspect is the inherent elastoplastic and rheological properties of red-bed surrounding rock media. The second aspect is gradual stress and deformation release over time, constrained by the “virtual supporting force” along the tunnel’s longitudinal direction (originating from the tunnel face) and the transverse “bearing arch effect” of the surrounding rock.
During and after excavation, the surrounding rock exhibits two distinct support mechanisms derived from the spatial effects of the tunnel face:
Transverse Arching Effect: In the cross-sectional direction, this manifests as an “annular constraint,” forming a closed load-bearing arch composed of the crown, sidewalls, and invert. This arch, with a thickness significantly exceeding the tunnel radius, possesses substantial bearing capacity determined by the rock strength and stability.
Longitudinal Virtual Support: Near the tunnel face, a temporary “virtual supporting force” arises due to the face’s spatial geometric effect, acting as a semi-circular bending constraint in the longitudinal direction. This support diminishes once the tunnel is fully excavated or at locations far from the face. Current interpretations of this longitudinal support include the “semi-arch effect” [47] and the “bridge effect” [48].
3.
Construction methods and techniques.
Tunnel excavation methods and construction rates are critical factors influencing surrounding rock deformation. Timely and appropriate engineering support measures are prerequisites for effectively controlling deformation. The tunnel employs the three-bench method, which incrementally excavates tunnel sections across upper, middle, and lower benches, thereby minimizing abrupt stress redistribution and deformation. Liu et al. [49] concluded that the tunnel cross-sectional area significantly impacts deformation, with larger sections correlating to increased deformation values. After upper bench excavation, stress redistribution triggers a distinct rapid deformation phase in monitoring curves. Bizjak et al. [50] emphasized that ultimate displacement depends not only on surrounding rock classification but also on tunnel size, shape, support type, support thickness, construction methods, and failure states (e.g., cracking, damage).
Practical challenges persist: Construction techniques remain a critical yet often overlooked factor in soft rock deformation. Tight schedules and insufficient understanding of weak rock behavior often lead to conventional construction practices, inadequate preventive measures, and mismatched or delayed shotcrete-bolt support systems. Prolonged closure of the support ring exacerbates deformation. Critical flaws in construction control—particularly during steel arch leg connections—result in ineffective settlement and convergence management. Subsequent leg connections fail to correct deviations, leading to cumulative deformation and primary lining encroachment.
Under self-weight stress fields, tunnel depth directly correlates with in situ stress levels. Increased burial depth deteriorates surrounding rock conditions, expanding the plastic zone post-excavation. Deeper tunnels exhibit distinct plastic zone geometries (e.g., elliptical vs. circular) and higher ultimate displacements due to elevated confining pressures.
4.
Support timing.
Support timing intrinsically relates to the time-dependent deformation characteristics of surrounding rock engineering properties. The temporal influence on tunnel engineering manifests as progressive increases in surrounding rock deformation and ground pressure over time. This arises from two primary mechanisms: (1) the rheological or creep properties of rock masses, where deformation continuously grows under constant stress or stress relaxes under constrained deformation, accompanied by time-dependent strength degradation—particularly pronounced in clay-rich rocks, mudstones, and other weak formations; (2) prolonged exposure to post-excavation environmental dynamics, such as temperature fluctuations, humidity variations, and groundwater erosion, which progressively weaken rock strength.
As surrounding rock pressure predominantly originates from time-dependent deformation and failure processes, its magnitude varies significantly across different phases. Consequently, optimal support timing critically determines support efficacy. From the perspective of rock–support interaction, effective support should harness the inherent load-bearing capacity of the surrounding rock. Mismatched support rigidity or delayed installation—where support systems fail to adapt to evolving deformation patterns—compromises deformation control. Support systems are broadly categorized into conventional supports (rigid or flexible, e.g., masonry, steel arches) and shotcrete-bolt supports (e.g., shotcrete-bolt, shotcrete-bolt-mesh), with selection guided by compatibility with rock deformation behavior.
Surrounding rock pressure, defined as the interfacial stress between the primary lining and rock mass during stress redistribution post-excavation, comprises two components: loosening pressure (load from fractured relaxation zones) and deformation pressure (constraint-induced stress from rock–support co-deformation). Quantifying these pressures forms the cornerstone of tunnel design and remains a fundamental research challenge in tunneling engineering. The determination of surrounding rock pressure requires balancing empirical observations with analytical models that account for spatial–temporal stress evolution, support reactivity, and environmental interactions.
Figure 8 shows the temporal curves of surrounding rock pressure. During tunnel construction, partial stress release occurs before the installation of pressure sensors. Thus, the measured surrounding rock pressure reflects only post-installation values, not the total initial pressure prior to excavation. The evolution of surrounding rock pressure over time follows a three-phase pattern: rapid increase, slowed growth, and gradual stabilization.
Key observations include:
  • Invert measurement points exhibit faster pressure growth rates compared to upper and middle bench points.
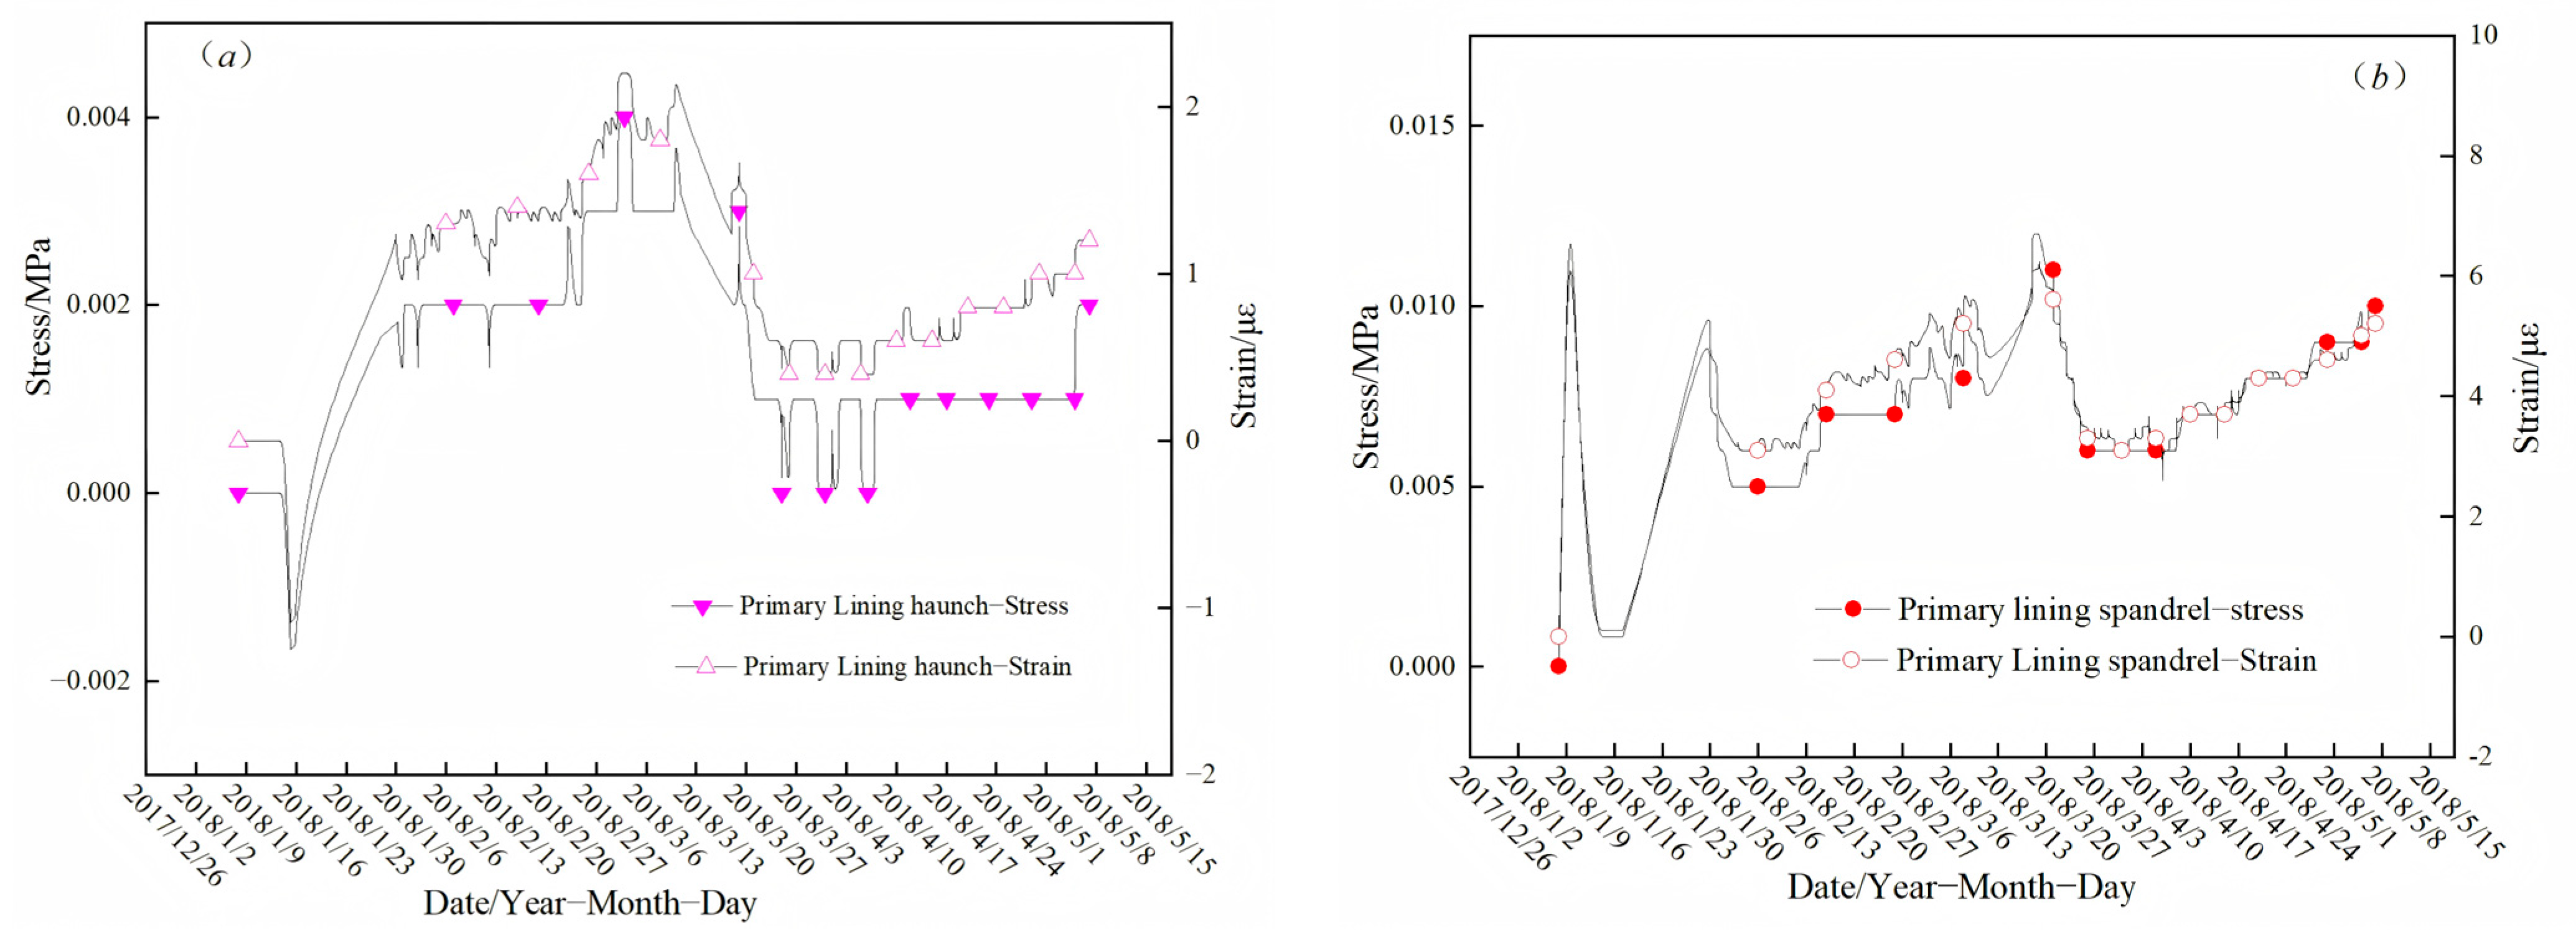
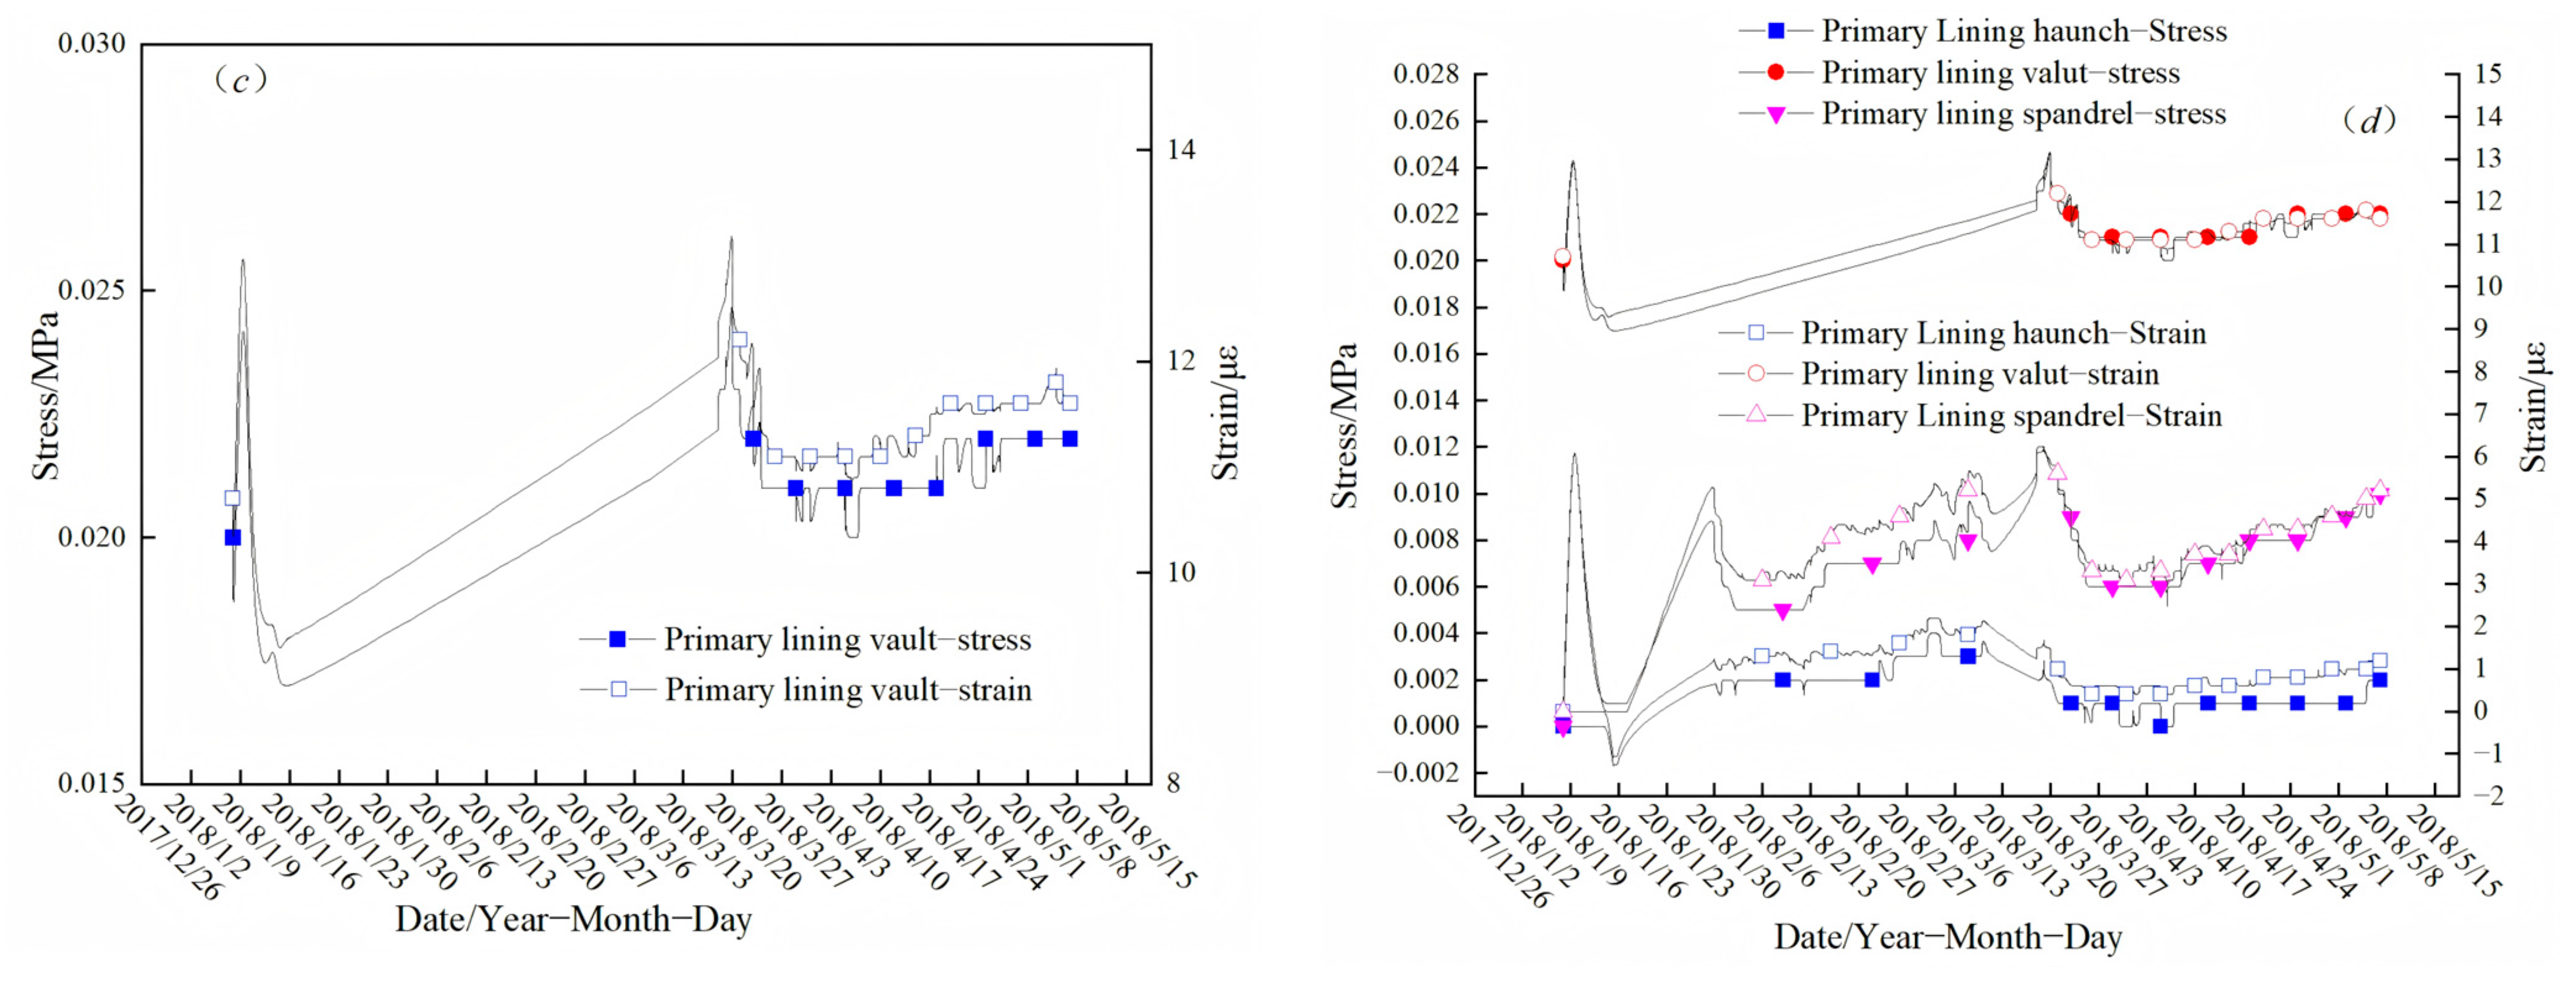
  • The vault experiences the highest surrounding rock pressure, followed by the spandrel, though the spandrel shows the fastest stress release rate. This aligns with surface strain monitoring results.
  • Under subsequent construction disturbances, stress redistribution occurs, manifesting as a sudden drop in the previously stable pressure curve termed “platform”, followed by a repetition of the three-phase evolution.
Combined with on-site construction logs, it is observed that significant variations in support pressure predominantly occur during excavation and support operations. Following the excavation of the middle bench, the surrounding rock pressure at the upper bench monitoring points exhibits a transient decrease, followed by a continuous increasing trend. This phenomenon indicates that the removal of the lower support of the upper bench’s support structure after middle bench excavation reduces the tightness between the surrounding rock and the primary support to some extent, leading to a decline in contact pressure. Similarly, the excavation of the lower bench and invert exerts analogous effects on the upper monitoring points.
Monitoring data reveal that the surrounding rock pressure generally manifests as compressive stress, suggesting that the surrounding rock tends to squeeze inward into the tunnel after excavation. The magnitude of surrounding rock pressure is typically influenced by factors such as rock mass structure, rock strength, tunnel geometry, cross-sectional dimensions, burial depth, and geological structures.

4.2. Limitations and Shortcomings of the Study

Although the research findings of this paper have provided certain guidance for the construction of red-bed soft rock tunnels, the following limitations remain: The monitoring data are affected by sensor accuracy, human errors, and environmental interference, resulting in incomplete coverage of long-term deformation behaviors such as multi-year rheological characteristics. The coupling effects of multiple factors including high in situ stresses, construction disturbances, and groundwater seepage have not been fully quantified. Future efforts should focus on implementing long-term monitoring systems and conducting refined environmental–mechanical coupling experiments to enhance both theoretical completeness and practical guidance for engineering applications.

5. Conclusions

1. The deformation of surrounding rock can be divided into three stages: rapid deformation, slow deformation, and stable deformation. The rapid deformation stage accounts for the largest proportion of total deformation, while the slow deformation stage persists the longest. Construction disturbances disrupt the stable deformation state, causing monitoring curves to exhibit deep V-shaped anomalies or double-step patterns. However, during re-stabilization, the deformation rate in the rapid stage decreases, and the time required to achieve stability shortens. This phenomenon provides critical insights for determining the optimal timing of secondary lining in red-bed soft rock tunnels.
2. Surrounding rock deformation exhibits anisotropy, which diminishes with proximity to the excavation boundary. Within the 0–2 m range from the tunnel face, radial deformation differences are minimal. However, as radial depth increases, the maximum deformation zone displays pronounced asymmetry. Following excavation in soft rock tunnels, the largest radial deformation occurs at the haunch areas, followed by the spandrel regions. Vault deformation ranges between 65 and 73 mm, while haunch deformation reaches up to 95 mm. Stabilization requires 30–42 days, and a reserved deformation of 10 cm is recommended for this tunnel during excavation.
3. Surrounding rock deformation is influenced by multiple factors, including the classification of surrounding rock, engineering properties of the rock mass, temporal–spatial effects, construction methods and techniques, in situ stress, and support timing. The classification of surrounding rock determines support strategies and engineering measures, with higher-grade rock typically exhibiting greater deformation values. The strain-softening behavior of red-bed soft rock and groundwater effects lead to deformation variability. Temporal–spatial effects manifest as time-dependent increases in rock stress and deformation, coupled with the constraining influence of the excavation face. Rational construction methods and techniques effectively control deformation, while increasing in situ stress with burial depth expands the plastic zone in surrounding rock. Support timing critically impacts support efficacy, as proper support timing leverages the self-bearing capacity of the surrounding rock to mitigate deformation.
4. The temporal evolution of surrounding rock pressure follows a three-phase pattern: “rapid increase, slowed growth, and gradual stabilization.” Measurement points at the invert exhibit faster pressure growth rates compared to those at the upper and middle benches. The vault experiences the highest pressure, followed by the spandrel, though the spandrel shows the highest stress release rate. Construction disturbances trigger stress redistribution, manifesting as a sudden drop in the previously stable pressure plateau on monitoring curves, followed by a repetition of the three-phase pattern.
Support pressure fluctuations predominantly occur during excavation and support activities. Lower bench and invert excavation influence upper measurement points, reducing contact pressure by weakening structural integrity. Surrounding rock pressure predominantly manifests as compressive stress, governed by factors such as rock mass structure, strength, tunnel geometry, cross-sectional size, burial depth, and tectonic conditions.

Author Contributions

Validation, J.W., G.C. and Z.J.; Investigation, J.W.; Data curation, J.W., G.C., Z.H. and F.P.; Writing—original draft, J.W. and G.C.; Writing—review & editing, J.W., Z.J. and J.J. All authors have read and agreed to the published version of the manuscript.

Funding

This research received no external funding.

Data Availability Statement

The original contributions presented in the study are included in the article, further inquiries can be directed to the corresponding author.

Acknowledgments

The authors would like to express their gratitude to Xin Jiang Key Lab of Building Structure and Earthquake Resistance, Xinjiang University, and Tianchi Talent Plan of Xinjiang Uygur Autonomous Region.

Conflicts of Interest

No potential conflicts of interest were reported by the authors.

References

  1. Huang, W.T.; Jackson, M.J.; Dekkers, M.J.; Solheid, P.; Zhang, Y.; Li, S.H.; Guo, Z.J.; Ding, L. Remagnetization of Red Beds on the Tibetan Plateau: Mechanism and Diagnosis. J. Geophys. Res.-Solid. Earth 2020, 125, e2020JB020068. [Google Scholar] [CrossRef]
  2. Lucero, D.; Bailey, L.; Kim, J.H.; Voller, V.; Hughes, A.; Krantz, R.; Lingrey, S.; Barton, M.D.; Barton, I.; Reiners, P.; et al. Influence of internal fluid driving mechanisms on red bed bleaching in the Paradox Basin (Colorado Plateau, Utah and Colorado, USA). Geol. Soc. Am. Bull. 2025, 137, 2765–2783. [Google Scholar] [CrossRef]
  3. Bábek, O.; Vodrázková, S.; Kumpan, T.; Kalvoda, J.; Holá, M.; Ackerman, L. Geochemical record of the subsurface redox gradient in marine red beds: A case study from the Devonian Prague Basin, Czechia. Sedimentology 2021, 68, 3523–3548. [Google Scholar] [CrossRef]
  4. Rasmussen, B.; Muhling, J.R.; Zi, J.W.; Tsikos, H.; Fischer, W.W. A 1.25 Ga depositional age for the “Paleoproterozoic” Mapedi red beds, Kalahari manganese field, South Africa: New constraints on the timing of oxidative weathering and hematite mineralization. Geology 2020, 48, 44–48. [Google Scholar] [CrossRef]
  5. Retallack, G.J.; Broz, A.P. Ediacaran and Cambrian paleosols from central Australia. Paleogeogr. Paleoclimatol. Paleoecol. 2020, 560, 110047. [Google Scholar] [CrossRef]
  6. Wu, Y.Z.; Wang, H.L.; Zhang, Y.J.; Lyu, C.H.; Liu, Y.X.; Wang, W.X. Deterioration Mechanism and Statistical Damage Constitutive Model of Red-Bed Soft Rock with Different Moisture Content. Pure Appl. Geophys. 2025, 182, 189–208. [Google Scholar] [CrossRef]
  7. He, J.L.; Niu, F.J.; Luo, F.; Jiang, H.Q.; He, P.F.; Ju, X. Mechanical properties and modified binary-medium constitutive model for red-bed soft rock subjected to freeze-thaw cycles. Cold Reg. Sci. Tech. 2023, 209, 103803. [Google Scholar]
  8. Qin, Y.G.; Yang, G.L.; Liu, B.Y.; Xu, J.X. Study on deformation and failure mechanism of low-dip red bed slope with soft-hard interbedded structure: A case study of Chishui, China. Nat. Hazards 2024, 120, 10539–10557. [Google Scholar]
  9. Wu, K.; Jin, B.; Hong, S.P.; Chen, J.; Nie, Q.Q.; Liu, H.L.; Cai, H.; Gao, X. Analysis of macroscopic, microcosmic, and microscopic characteristics of red-bed soft rock in Central Yunnan and its mechanical response in construction. Phys. Fluids 2024, 36, 106607. [Google Scholar] [CrossRef]
  10. Yan, J.S.; Xue, X.W.; Gong, C.F.; Zhang, K.X. Study on the Characteristics and Mechanism of Shield Tunnel Mud Cake Disintegration in Complex Red-Bed Geology. Coatings 2024, 14, 567. [Google Scholar] [CrossRef]
  11. Allen, W.K.; Ridgway, K.D.; Benowitz, J.A.; Waldien, T.S.; Roeske, S.M.; Fitzgerald, P.G.; Gillis, R.J. Neogene sedimentary record of the evolution of a translated strike-slip basin along the Denali fault system: Implications for timing of displacement, composite basin development, and regional tectonics of southern Alaska. Geosphere 2022, 18, 585–615. [Google Scholar] [CrossRef]
  12. Li, S.Q.; Yang, Z.P.; Gao, Y.H.; Li, H.M.; Xu, W.J.; Jin, X.G. Study on deformation characteristics and damage mechanisms of soil-red stratum soft rock mixture undergoing tunnel excavation unloading considering wetting. Transp. Geotech. 2025, 50, 101468. [Google Scholar] [CrossRef]
  13. Liu, D.X.; Huang, S.L.; Ding, X.L.; Chi, J.J.; Zhang, Y.T. Characteristics and Mechanism of Large Deformation of Tunnels in Tertiary Soft Rock: A Case Study. Buildings 2023, 13, 2262. [Google Scholar] [CrossRef]
  14. Asadzadeh, S.; Souza Filho, C.R. Characterization of microseepage-induced diagenetic changes in the Upper-Red Formation, Qom region, Iran. Part II: A new insight using reflectance spectroscopic analysis. Mar. Pet. Geol. 2020, 117, 104387. [Google Scholar] [CrossRef]
  15. Wang, J.; Cao, Y.C.; Liu, K.Y.; Costanzo, A.; Feely, M. Diagenesis and evolution of the lower Eocene red-bed sandstone reservoirs in the Dongying Depression, China. Mar. Pet. Geol. 2018, 94, 230–245. [Google Scholar] [CrossRef]
  16. Liao, Y.; Cao, J.; Wu, Z.; Luo, S.; Wang, Z. Near Infrared Spectroscopy of the Cretaceous Red Beds in Inner Mongolia Dongshengmiao. Spectrosc. Spectr. Anal. 2015, 35, 2521–2525. [Google Scholar]
  17. Hillier, S.; Wilson, M.J.; Merriman, R.J. Clay mineralogy of the Old Red Sandstone and Devonian sedimentary rocks of Wales, Scotland and England. Clay Min. 2006, 41, 433–471. [Google Scholar] [CrossRef]
  18. Quandt, D.; Schmidt, B.B.C.; Schmidt, C. Diagenesis and controls on reservoir quality of Lower Triassic red bed sandstones (Buntsandstein) from a marginal basin facies, southwest Germany. Mar. Pet. Geol. 2022, 142, 105744. [Google Scholar] [CrossRef]
  19. Han, Z.E.A.; Hu, X.; Ji, J.; Huang, Y.; Huang, Z. View Correspondence. Origin of the Aptian Albian high cyclic oceanic red beds in the ODP hole 1049C, north Atlantic: Mineralogical evidence(Article). Acta Geol. Sin.-Engl. Ed. 2008, 82, 124–132. [Google Scholar]
  20. Wang, R.-Z.; Zhang, X.-C.; Gu, H.-H.; Li, K.-S.; Wen, J.-F.; Miura, H.; Suzuki, K.; Tu, S.-T. Oxidation-involved life prediction and damage assessment under generalized creep-fatigue loading conditions based on engineering damage mechanics. J. Mater. Res. Technol. 2023, 23, 114–130. [Google Scholar] [CrossRef]
  21. Li, J.; Shao, L.Y.; Chang, L.L.; Xing, J.P.; Wang, W.H.; Li, W.J.; Zhang, D.Z. Physicochemical Characteristics and Possible Sources of Individual Mineral Particles in a Dust Storm Episode in Beijing, China. Atmosphere 2018, 9, 269. [Google Scholar] [CrossRef]
  22. He, W.; Yang, Z.; Du, H.; Hu, J.; Zhang, K.; Hou, W.; Li, H. Micro-Mechanisms and Implications of Continental Red Beds. Minerals 2022, 12, 934. [Google Scholar] [CrossRef]
  23. Grygar, T.; Dedecek, J.; Kruiver, P.P.; Dekkers, M.J.; Bezdicka, P.; Schneeweiss, O. Iron oxide mineralogy in late Miocene red beds from La Gloria, Spain: Rock-magnetic, voltammetric and Vis spectroscopy analyses. Catena 2003, 53, 115–132. [Google Scholar] [CrossRef]
  24. Symons, D.T.A.; Kawasaki, K.; Diehl, J.F. Magnetization age from paleomagnetism of the Copper Harbor red beds, Northern Michigan, USA, and its Keweenawan geologic consequences. Can. J. Earth Sci. 2019, 56, 1–15. [Google Scholar] [CrossRef]
  25. Zhang, G.; Ling, S.; Xiao, C.; Liao, Z.; Wu, X. Crack evolution of soft red-bed rock under drying-wetting cycles. J. Rock Mech. Geotech. Eng. 2025, in press. [CrossRef]
  26. Wen, T.; Wang, Y.K.; Tang, H.M.; Zhang, J.R.; Hu, M.Y. Damage Evolution and Failure Mechanism of Red-Bed Rock under Drying-Wetting Cycles. Water. 2023, 15, 2684. [Google Scholar] [CrossRef]
  27. Xia, C.; Zhou, C.Y.; Zhu, F.X.; Liu, Z.; Cui, G.J. The Critical Indicator of Red-Bed Soft Rocks in Deterioration Process Induced by Water Basing on Renormalization Group Theory. Appl. Sci. 2021, 11, 7968. [Google Scholar] [CrossRef]
  28. Verstrynge, E.; Adriaens, R.; Elsen, J.; Van Balen, K. Multi-scale analysis on the influence of moisture on the mechanical behavior of ferruginous sandstone. Constr. Build. Mater. 2014, 54, 78–90. [Google Scholar] [CrossRef]
  29. Yu, C.; Zhong, W.W.; Zhang, X.; Li, T.; Fei, Z. Study on the Damage Characteristics of Red Sandstone Foundation Under Rainfall Infiltration in the Red-Bed Area of the Sichuan Basin-Taking Zhongjiang County as an Example. Buildings 2024, 14, 3406. [Google Scholar] [CrossRef]
  30. Zhang, W.G.; Chang, Z.G.; Bai, J.B.; Wang, R. Study on the Evolution Laws of Anchoring Property of Surrounding Rock of Argillaceous Weakly Cemented Roadway in Water Environment. Geofluids 2022, 2022, 7571371. [Google Scholar] [CrossRef]
  31. Guo, S.T.; Wen, S.J.; Guo, H.Y.; Fu, H.L. The Creep Test Study and Macro-Detail Analysis of Argillaceous Red Sandstone in Different Water-Containing States. Adv. Civ. Eng. 2022, 2022, 9698675. [Google Scholar] [CrossRef]
  32. Zhang, H.; Hu, Z.Q.; Ma, B.; Chen, X.Z. Stability analysis of a red bed slope reservoir bank considering water-rock interaction characteristics. Desalination Water Treat. 2021, 239, 289–300. [Google Scholar] [CrossRef]
  33. Ma, J.Y.; Tu, S.H.; Tu, H.S.; Miao, K.J.; Tang, L.; Zhao, H.B.; Guo, B.H. Classification Support Technology for Roadways in Deep Broken Soft Rock: A Case Study. Mining Metall. Explor. 2024, 41, 1859–1872. [Google Scholar] [CrossRef]
  34. Thum, L.; De Paoli, R. 2D and 3D GIS-based geological and geomechanical survey during tunnel excavation. Eng. Geol. 2015, 192, 19–25. [Google Scholar] [CrossRef]
  35. Li, S.Q.; Yang, Z.P.; Gao, Y.H.; Liu, X.R.; Jin, X.G. The effect of clay swelling on crack generation in red stratum soft rock during water-induced disintegration: A matrix-based discrete element simulation study. Bull. Eng. Geol. Environ. 2024, 83, 489. [Google Scholar] [CrossRef]
  36. Sun, Y.P.; Xu, N.W.; Xiao, P.W.; Sun, Z.Q.; Li, H.L.; Liu, J.; Li, B. Characterizing large deformation of soft rock tunnel using microseismic monitoring and numerical simulation. J. Rock. Mech. Geotech. Eng. 2025, 17, 309–322. [Google Scholar] [CrossRef]
  37. Chen, L.; Liu, T.Y.; Jia, B.X.; Tang, J.P.; Liu, J.S. Acoustic emission and fractal characteristics of red beds soft rock under water-force coupling. Sci. Rep. 2024, 14, 4424. [Google Scholar] [CrossRef]
  38. Zhang, Z.S.; Fan, Y.K.; Xu, Q.; Li, K.; Han, M.K.; Fei, L.X. Deformation and Failure Mechanism and Control of Water-Rich Sandstone Roadways in the Huaibei Mining Area. Appl. Sci. 2025, 15, 1177. [Google Scholar] [CrossRef]
  39. Lu, Y.L.; Wang, L.G.; Sun, X.K.; Wang, J. Experimental study of the influence of water and temperature on the mechanical behavior of mudstone and sandstone. Bull. Eng. Geol. Environ. 2017, 76, 645–660. [Google Scholar] [CrossRef]
  40. Zhang, G.D.; Ling, S.X.; Liao, Z.X.; Xiao, C.J.; Wu, X.Y. Mechanism and influence on red-bed soft rock disintegration durability of particle roughness based on experiment and fractal theory. Constr. Build. Mater. 2024, 419, 135504. [Google Scholar] [CrossRef]
  41. Woods, A.; Hendry, M.T.; Macciotta, R.; Stewart, T.; Marsh, J. GB-InSAR monitoring of vegetated and snow-covered slopes in remote mountainous environments. Landslides 2020, 17, 1713–1726. [Google Scholar] [CrossRef]
  42. Wu, Y.Z.; Wang, H.L.; Guo, X.Y. Inversion of Surrounding Red-Bed Soft Rock Mechanical Parameters Based on the PSO-XGBoost Algorithm for Tunnelling Operation. Appl. Sci. 2023, 13, 13341. [Google Scholar] [CrossRef]
  43. Zhou, Z.L.; Zhao, Y.Q.; Zhang, H.; Chen, S.G.; Chen, L.; Wang, L. Analysis of Rheological Factors of Soft Rock Tunnel Based on Constitutive Model of Rock Parameters Attenuation with Equivalent Effect. Symmetry 2022, 14, 2432. [Google Scholar] [CrossRef]
  44. JTG/T 3660-2020; Technical Specifications for Highway Tunnel Construction. Ministry of Transport of the People’s Republic of China: Beijing, China, 2020.
  45. Tang, H.; Ji, X.; Zhang, H.Y.; Li, T.B. Numerical Simulation of Large Compression Deformation Disaster and Supporting Behavior of Deep Buried Soft Rock Tunnel with High In Situ Stress Based on CDEM. Adv. Civ. Eng. 2022, 2022, 5985165. [Google Scholar] [CrossRef]
  46. Aydan, Ö.; Ulusay, R.; Tokashiki, N. A New Rock Mass Quality Rating System: Rock Mass Quality Rating (RMQR) and Its Application to the Estimation of Geomechanical Characteristics of Rock Masses. Rock. Mech. Rock. Eng. 2014, 47, 1255–1276. [Google Scholar] [CrossRef]
  47. Chen, X.J.; Fang, P.P.; Chen, Q.N.; Hu, J.; Yao, K.; Liu, Y. Influence of cutterhead opening ratio on soil arching effect and face stability during tunnelling through non-uniform soils. Undergr. Space 2024, 17, 45–59. [Google Scholar] [CrossRef]
  48. Kou, H.; Yang, W.B.; He, C.; Nie, J.C.; Zhang, H.; Yang, L.L.; Xiao, L.G. Model test of excavation and double primary support time for soft rock tunnel considering creep characteristics. Acta Geotech. 2024, 19, 2775–2803. [Google Scholar] [CrossRef]
  49. Liu, Y.Q.; Yao, C.F.; Luo, W.; He, C.; Sun, M.H.; Wang, E.R.; Yuan, F.Y. Deformations and damages of tunnels subjected to strike-slip faulting: Effects of tectonic stress and cross-sectional shape. Eng. Fail. Anal. 2024, 160, 108159. [Google Scholar] [CrossRef]
  50. Bizjak, K.F.; Petkovsek, B. Displacement analysis of tunnel support in soft rock around a shallow highway tunnel at Golovec. Eng. Geol. 2004, 75, 89–106. [Google Scholar] [CrossRef]
Figure 1. Massive-bedded rock mass structure dominated by sandy conglomerate. (a) Entrance to Huizhou Tunnel No. 2. (b) Working face of Huizhou Tunnel No. 2.
Buildings 15 01820 g001
Figure 2. Cross-sectional layout of measurement points and instruments.
Buildings 15 01820 g002
Figure 3. Surrounding rock convergence deformation curve (wireless remote monitoring system) (Huizhou Tunnel No. 1). (a) Primary lining vault settlement curve (Huizhou Tunnel No. 1). (b) Primary lining right spandrel convergence deformation curve (Huizhou Tunnel No. 1). (c) Primary lining left spandrel convergence deformation curve (Huizhou Tunnel No. 1). (d) Primary lining right haunch convergence deformation curve (Huizhou Tunnel No. 1). (e) Primary lining left haunch convergence deformation curve (Huizhou Tunnel No. 1).
Buildings 15 01820 g003
Figure 4. Deformation temporal curve of the vault in the red-bed soft rock tunnel (Total Station) (Huizhou Tunnel No. 1). (1) Red Bed Soft Rock Tunnel Section K35+591 vault Time Deformation Curve. (2) Red Bed Soft Rock Tunnel Section K35+651 vault Time Deformation Curve. (3) Red Bed Soft Rock Tunnel Section K36+060 vault Time Deformation Curve. (4) Red Bed Soft Rock Tunnel Section K36+435 vault Time Deformation Curve. (5) Red Bed Soft Rock Tunnel Section K36+480 vault Time Deformation Curve. (6) Red Bed Soft Rock Tunnel Section K36+510 vault Time Deformation Curve. (7) Red Bed Soft Rock Tunnel Section K36+517 vault Time Deformation Curve. (8) Red Bed Soft Rock Tunnel Section K36+552 vault Time Deformation Curve.
Buildings 15 01820 g004aBuildings 15 01820 g004b
Figure 5. Convergence deformation of surrounding rock (stable stage) (Huizhou Tunnel No. 1). (a) Primary lining displacement meter (inner, 3.3 m). (b) Primary lining displacement meter (middle, 2.2 m). (c) Primary lining displacement meter (outer, 1.3 m).
Buildings 15 01820 g005
Figure 6. Stress–strain relationship of argillaceous sandstone surrounding rock in Huizhou Tunnel No. 1 under different surrounding rock conditions.
Buildings 15 01820 g006
Figure 7. Stress–strain curve of argillaceous sandstone surrounding rock in Huizhou Tunnel No. 2 under different surrounding rock conditions.
Buildings 15 01820 g007
Figure 8. Temporal curves of enclosing rock pressure. (a) Primary lining haunch time−stress−strain curve. (b) Primary lining spandrel time−stress−strain curve. (c) Primary lining valut time−stress−strain curve. (d) Typical section time−stress−strain curve.
Buildings 15 01820 g008aBuildings 15 01820 g008b
Table 1. Monitoring items and number of measurement points for tunnel surrounding rock.
Monitoring ProjectsMonitoring InstrumentMonitoring LocationNumber of Measurement Points
Surrounding rock pressureEarth pressure cells1.2 MPa at the crown1
0.8 MPa at the spandrel2
0.8 MPa at the haunch2
1.2 MPa at the invert corner2
1.2 MPa at the mid-invert1
Pressure between primary support and secondary liningEarth pressure cells1.2 MPa at the crown1
0.8 MPa at the spandrel2
0.8 MPa at the haunch2
Internal and external forces of steel framesSurface stress gaugesCrown1
Spandrel2
Haunch2
Invert corner2
Mid-invert1
Stress in secondary liningReinforcement metersCrown1
Spandrel2
Haunch2
Invert corner2
Mid-invert1
Stress in initial shotcrete supportEmbedded strain gaugeCrown1
Spandrel2
Haunch 2
DisplacementDisplacement meterCrown1
Spandrel2
Haunch 2
Temperature and humidity of rock massHygro-thermometersCrown1
Spandrel1
Haunch 1
Internal force measurement of anchor boltsLoad-measuring anchor boltCrown1
Spandrel2
Haunch 2
Disclaimer/Publisher’s Note: The statements, opinions and data contained in all publications are solely those of the individual author(s) and contributor(s) and not of MDPI and/or the editor(s). MDPI and/or the editor(s) disclaim responsibility for any injury to people or property resulting from any ideas, methods, instructions or products referred to in the content.

