1. Introduction
With the continuous advancement of underground engineering, deep-buried soil [
1] tunnels have become increasingly important in transportation, municipal, and water conservancy projects. These tunnels are typically constructed in geologically complex areas characterized by high in situ stress and weak or fractured surrounding rock. Under such conditions, challenges such as excessive deformation, surrounding rock instability, and support structure failure frequently arise, posing significant risks to the construction safety and schedule [
2,
3]. Therefore, the selection of appropriate construction methods adapted to specific geological conditions is essential for ensuring structural stability and controlling project costs [
4,
5,
6,
7].
To address these challenges, a variety of tunneling techniques have been developed, including the New Austrian Tunneling Method (NATM), Full-Face Excavation, the double-side wall pilot tunnel method, and shield pre-support methods. Prior studies have evaluated their applicability under different conditions. For example, Sun et al. [
8] analyzed stress evolution in ultra-large cross-section tunnels, while Huang et al. [
9] compared construction techniques and proposed optimization strategies. Han et al. [
10] focused on surface settlement control using field monitoring data. For tunnels in soft, fractured, or water-bearing strata, method selection becomes even more critical due to complex ground responses. Recent research has introduced reinforcement schemes and simulation-based approaches to improve stability and support effectiveness [
11,
12,
13].
Additionally, for tunnels with shallow overburden, large cross-sections, narrow clearances, or bifurcated geometries, scholars have proposed optimized excavation sequences to mitigate deformation and ensure safety [
14,
15,
16,
17]. Advances in numerical modeling, 3D simulation, and real-time monitoring technologies have also played a significant role in enhancing construction adaptability and efficiency [
18,
19,
20].
Despite these efforts, there remains a lack of systematic and comparative evaluations of construction methods under deep-buried, soft ground conditions. In particular, few studies have integrated numerical simulations with field monitoring to validate model accuracy and comprehensively assess the deformation control and stress performance of support structures. This gap limits the practical applicability of existing research in real-world tunnel construction under complex geological environments.
To address this gap, this study investigates a deep-buried soil tunnel project in Baotai District, Yan’an City, Shaanxi Province, China. A comparative evaluation of four representative construction methods is conducted: the three-step method, the three-step temporary inverted arch method, the double-side wall pilot tunnel method, and the CD (center diaphragm) method. This evaluation integrates numerical simulation and field monitoring to ensure a comprehensive and realistic analysis.
The main contributions of this study are summarized as follows: a comparative validation framework combining numerical simulation and field data to assess the performance of multiple tunneling methods under deep-buried, soft ground conditions; a quantitative analysis of deformation control and stress distribution for each method, providing practical insights into their mechanical behavior and suitability; a practical recommendation for the optimal construction method, based on a comprehensive consideration of safety, efficiency, and economic feasibility, which can serve as a reference for similar complex tunnel projects.
2. Research Background
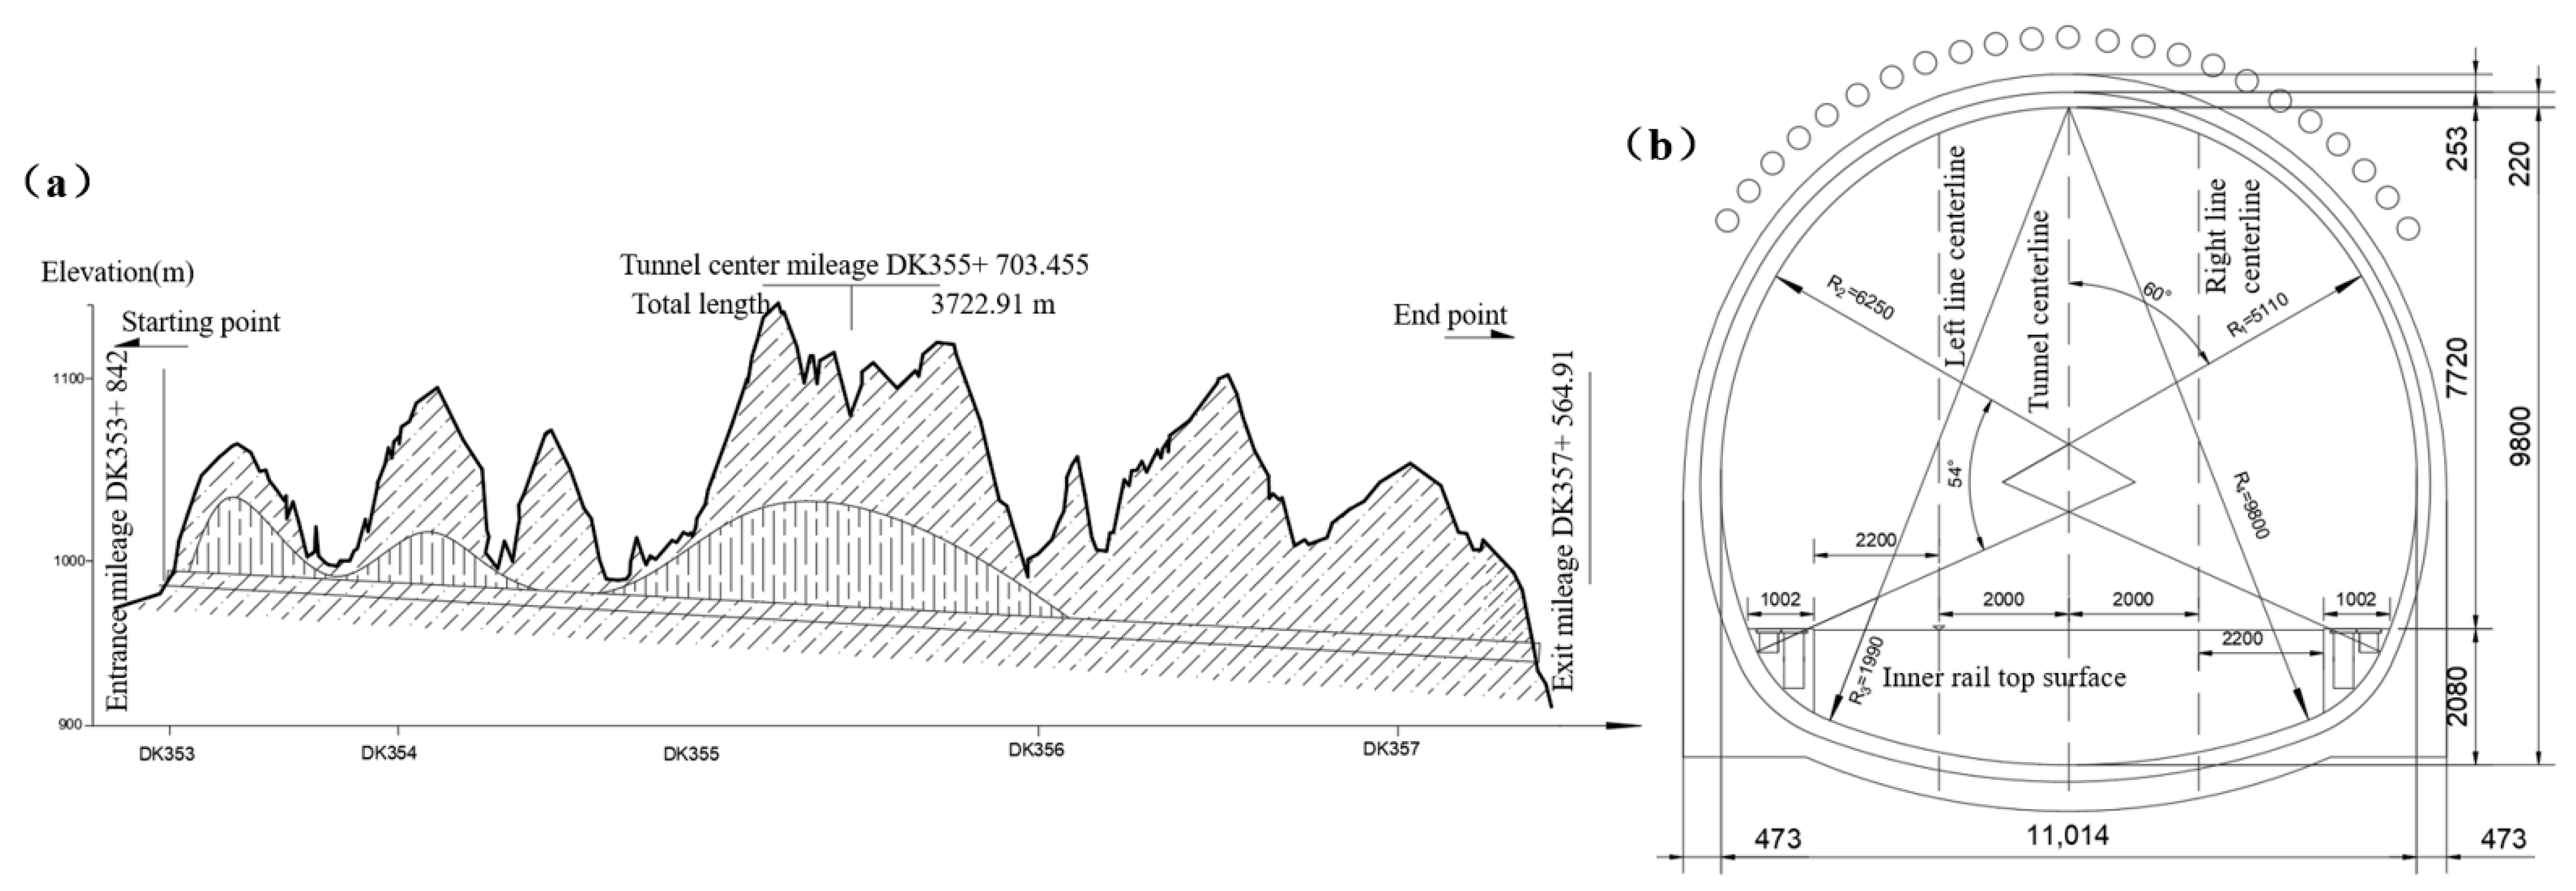
The tunnel is situated in the loess ridge and ridge-top area of Baotai District, Yan’an City, Shaanxi Province, where the terrain slopes from east to west, featuring well-developed gullies and scattered loess plateaus. The site is primarily covered by thick loess, with ground elevations ranging from 919 to 1139 m, and a relative height difference of 50 to 150 m. The tunnel, a single-dike and double-track structure, runs from east to west, passing through Nan Gou, Yangzhuang Gou Village, Zhongju, Taoshu’an, and Yangjiabian Village. It primarily traverses the upper Pleistocene wind-blown loess (Q
3eol). The tunnel extends from DK353+ 842 to DK357+ 564.91, covering a total length of 3722.91 m, with a maximum burial depth of around 171.33 m and a minimum depth of 14.83 m. The longitudinal slope is −11‰, and the exit connects to the Yanhe Special Bridge. The tunnel’s composite lining structure has an utmost width of 11 m and a vertical dimension of 9.8 m, a net area of 71.15 m
2, and a maximum excavation section area exceeding 134 m
2. The specific structure can be seen in
Figure 1.
The tunnel area exhibits weak regional tectonic deformation, with inconspicuous folding and faulting. It features a gently inclined single anticline, with an inclination angle typically between 1 and 3°, and a maximum of 5 to 7°. Some local gullies contain seasonal water, with fluctuating water levels. A landslide area, 79 m long and 128 m wide, is situated on the left side of the tunnel entrance, between DK353+ 800 and DK353+ 900. Cave dwellings exist at the tunnel exit, though uninhabited. In areas with poor rock mass surrounding the tunnel conditions, deep-buried soil tunnels are prone to landslides and large deformations. The geological complexity is outlined in
Table 1.
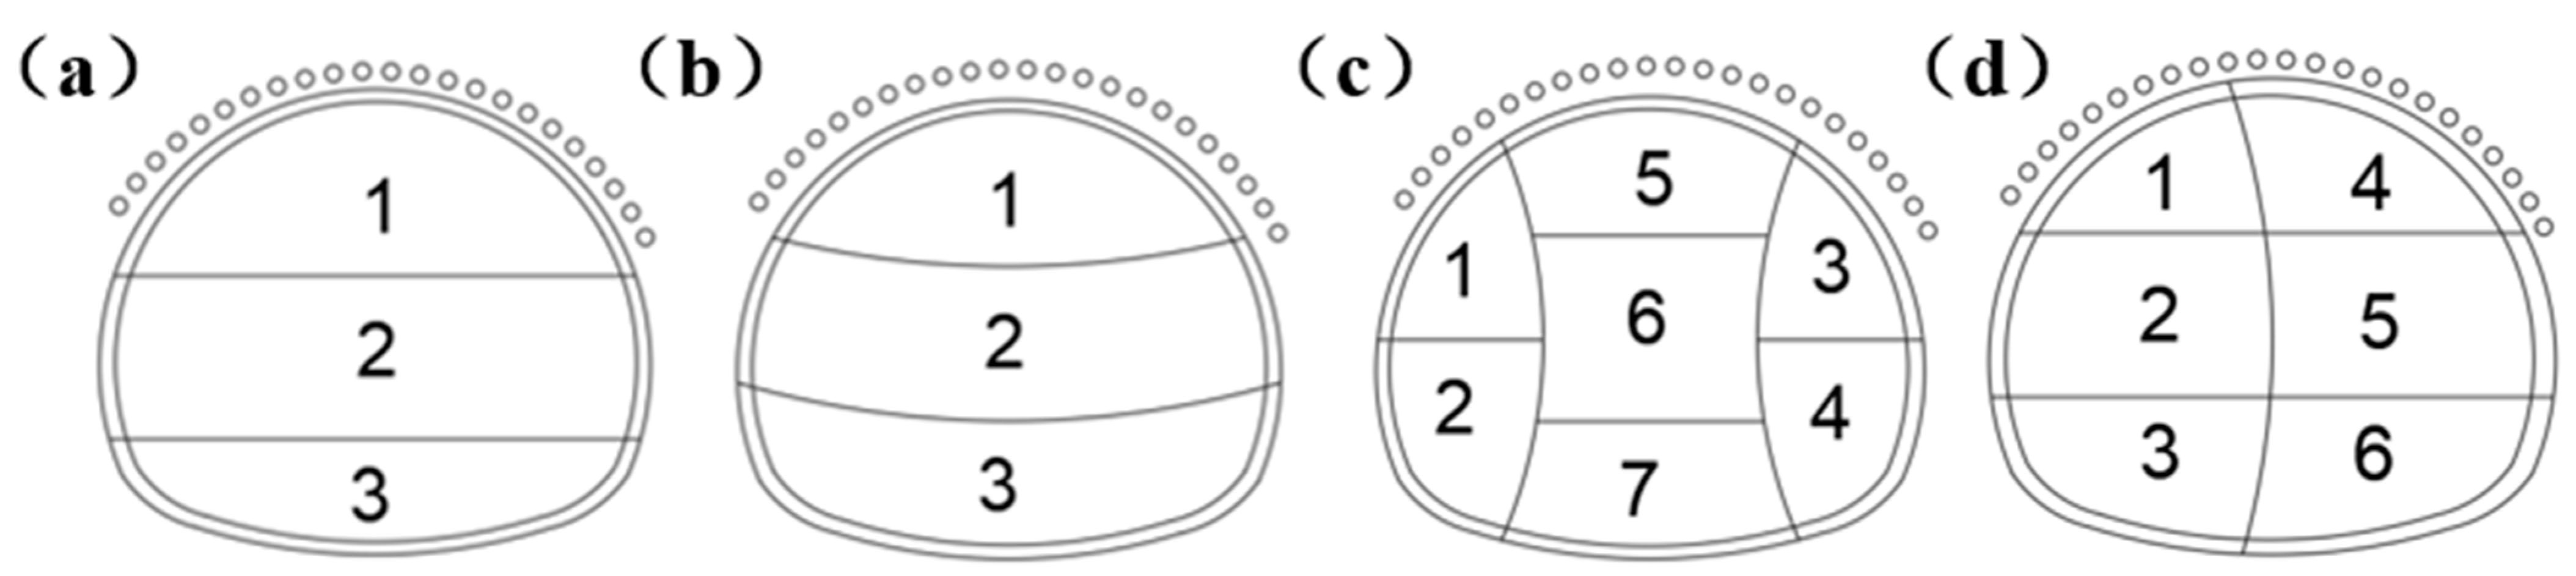
Except for the Myeongdong section, which uses the open-cut method, the tunnel construction primarily employs the three-step method for a class IV rock mass. For a class V rock mass, depending on the geological conditions, construction methods such as the three-step method, three-step temporary inverted arch method, double-side wall pilot tunnel method, or CD method (centralized excavation) are used. A schematic of the construction methods for a class V rock mass can be seen in
Figure 2. Given the poor rock mass surrounding the tunnel conditions, which increase the risk of collapse or large deformation, numerical simulation software is used to compare construction methods for the class V rock mass before construction. This allows for selecting the most suitable method and optimizing support parameters to guide construction.
Table 2 summarizes the applicable conditions, advantages, and limitations of the methods.
3. Numerical Simulation for Deformation Control of Rock Mass Surrounding the Tunnel in Tunnels
3.1. Fundamental Assumptions
To improve computational feasibility and simplify the numerical model, several assumptions were adopted in the simulation process, as outlined below:
- (1)
The surrounding rock was modeled using the Mohr–Coulomb constitutive model, while the primary lining, rock bolts, temporary supports, and advanced small pipe grouting were represented by linear elastic models.
- (2)
All soil layers and structural components were assumed to be homogeneous and isotropic materials, disregarding material heterogeneity and anisotropy.
- (3)
The influence of tectonic stress fields was neglected; only the initial stress induced by the self-weight of the soil and structural elements was considered.
- (4)
The effect of groundwater on tunnel excavation and supporting structures was not included, and the hydraulic interaction with materials was omitted.
- (5)
The mechanical parameters of both the soil and the support structures were assumed to remain constant throughout the simulation, without accounting for material property variations during construction.
3.2. Model Calculation Parameters
In this study, an elastic model was used for the support structure, while the Mohr-Coulomb model simulated the tunnel excavation process for the rock and soil materials. The rock mass surrounding the tunnel was modeled with 3D solid elements, and 2D plate elements were used for the initial and temporary supports. To simulate the anchor rods, 1D embedded truss elements were applied, and 1D embedded beam elements were used for the advanced small pipes.
Table 3 shows the mechanical properties of the rock mass surrounding the tunnel and support materials.
The tunnel’s initial support structure is designed using the corresponding method, where the elastic property of the steel mesh is transformed into that of concrete according to Equation (1). The resulting values are presented in
Table 3.
In the formula, indicates the concrete’s elastic modulus after conversion, denotes the original the elastic property of the concrete, denotes the steel mesh section’s cross-sectional area, denotes the steel mesh material’s elastic modulus, and represents the concrete section’s cross-sectional area.
The material’s elastic modulus in small-diameter pipes is modified to its equivalent value as per Equation (2), with the converted results provided in
Table 3.
In the equation, represents the adjusted the material’s stiffness in advancing small pipes; represents the elastic modulus of the slurry within the pipe; denotes the inertia of the slurry within the advancing small pipe; represents the stiffness of the advancing small pipe; and denotes the rotational inertia of the advancing small pipe.
3.3. Model Construction
This study examines the DK357+ 250 section of a deep-buried soil tunnel in Baotai District, Yan’an City, Shaanxi Province. It analyzes the impact of four construction methods—the three-step method, three-step temporary inverted arch method, double-side wall pilot tunnel method, and CD method—on the stability of the rock mass surrounding the tunnel. The goal is to identify the most effective construction method suitable for a V-level rock mass surrounding the tunnel. The tunnel section is situated at a depth of 91 m. Within the coordinate system of the model, the y-axis denotes the excavation direction, in which the x and z axes represent the horizontal and vertical directions, respectively. To mitigate boundary effects based on the Saint–Venant principle, the model’s boundaries are defined as ranging from 3 to 5 times the tunnel diameter in all directions, with overall dimensions of 100 m (width) × 100 m (height) × 60 m (length). The model’s top represents the ground surface, and the tunnel arch top is located 50 m from the model’s upper boundary. A uniformly distributed load equivalent to 41 m of overburden is exerted on the upper boundary of the model to account for the influence of overburden soil weight. The model’s size is illustrated in
Figure 3.
In the calculation process, the tunnel’s initial lining consists of 22 cm-thick C25 sprayed concrete, an H180 grid steel frame, and ∅8 steel mesh. The anchor rods are 3.5 m long, with a Φ22 hollow grouting type. The advance small pipes are 42 mm in diameter and 3.5 m long.
3.4. Boundary Conditions and Mesh Generation
The bottom boundary of the model was defined with fixed constraints (Uₓ = Uᵧ = U_z = 0) to simulate a rigid foundation support, while the lateral boundaries were assigned horizontal displacement constraints (Uₓ = 0), allowing vertical movement to represent the lateral confinement of an infinite soil domain. Prior to mesh generation, two lines above the stratigraphic layers were assigned a linear gradient size control to refine mesh transitions. The mesh size for the surrounding soil was set to 7, and that for the tunnel zone was refined to 1.5. The total number of elements and nodes for each construction method were as follows: the three-bench method included 26,347 elements and 18,426 nodes; the three-bench with temporary invert method had 32,258 elements and 18,528 nodes; the double side drift method used 20,169 elements and 15,482 nodes; and the CD method consisted of 20,605 elements and 15,260 nodes.
3.5. Simulation of Excavation Steps
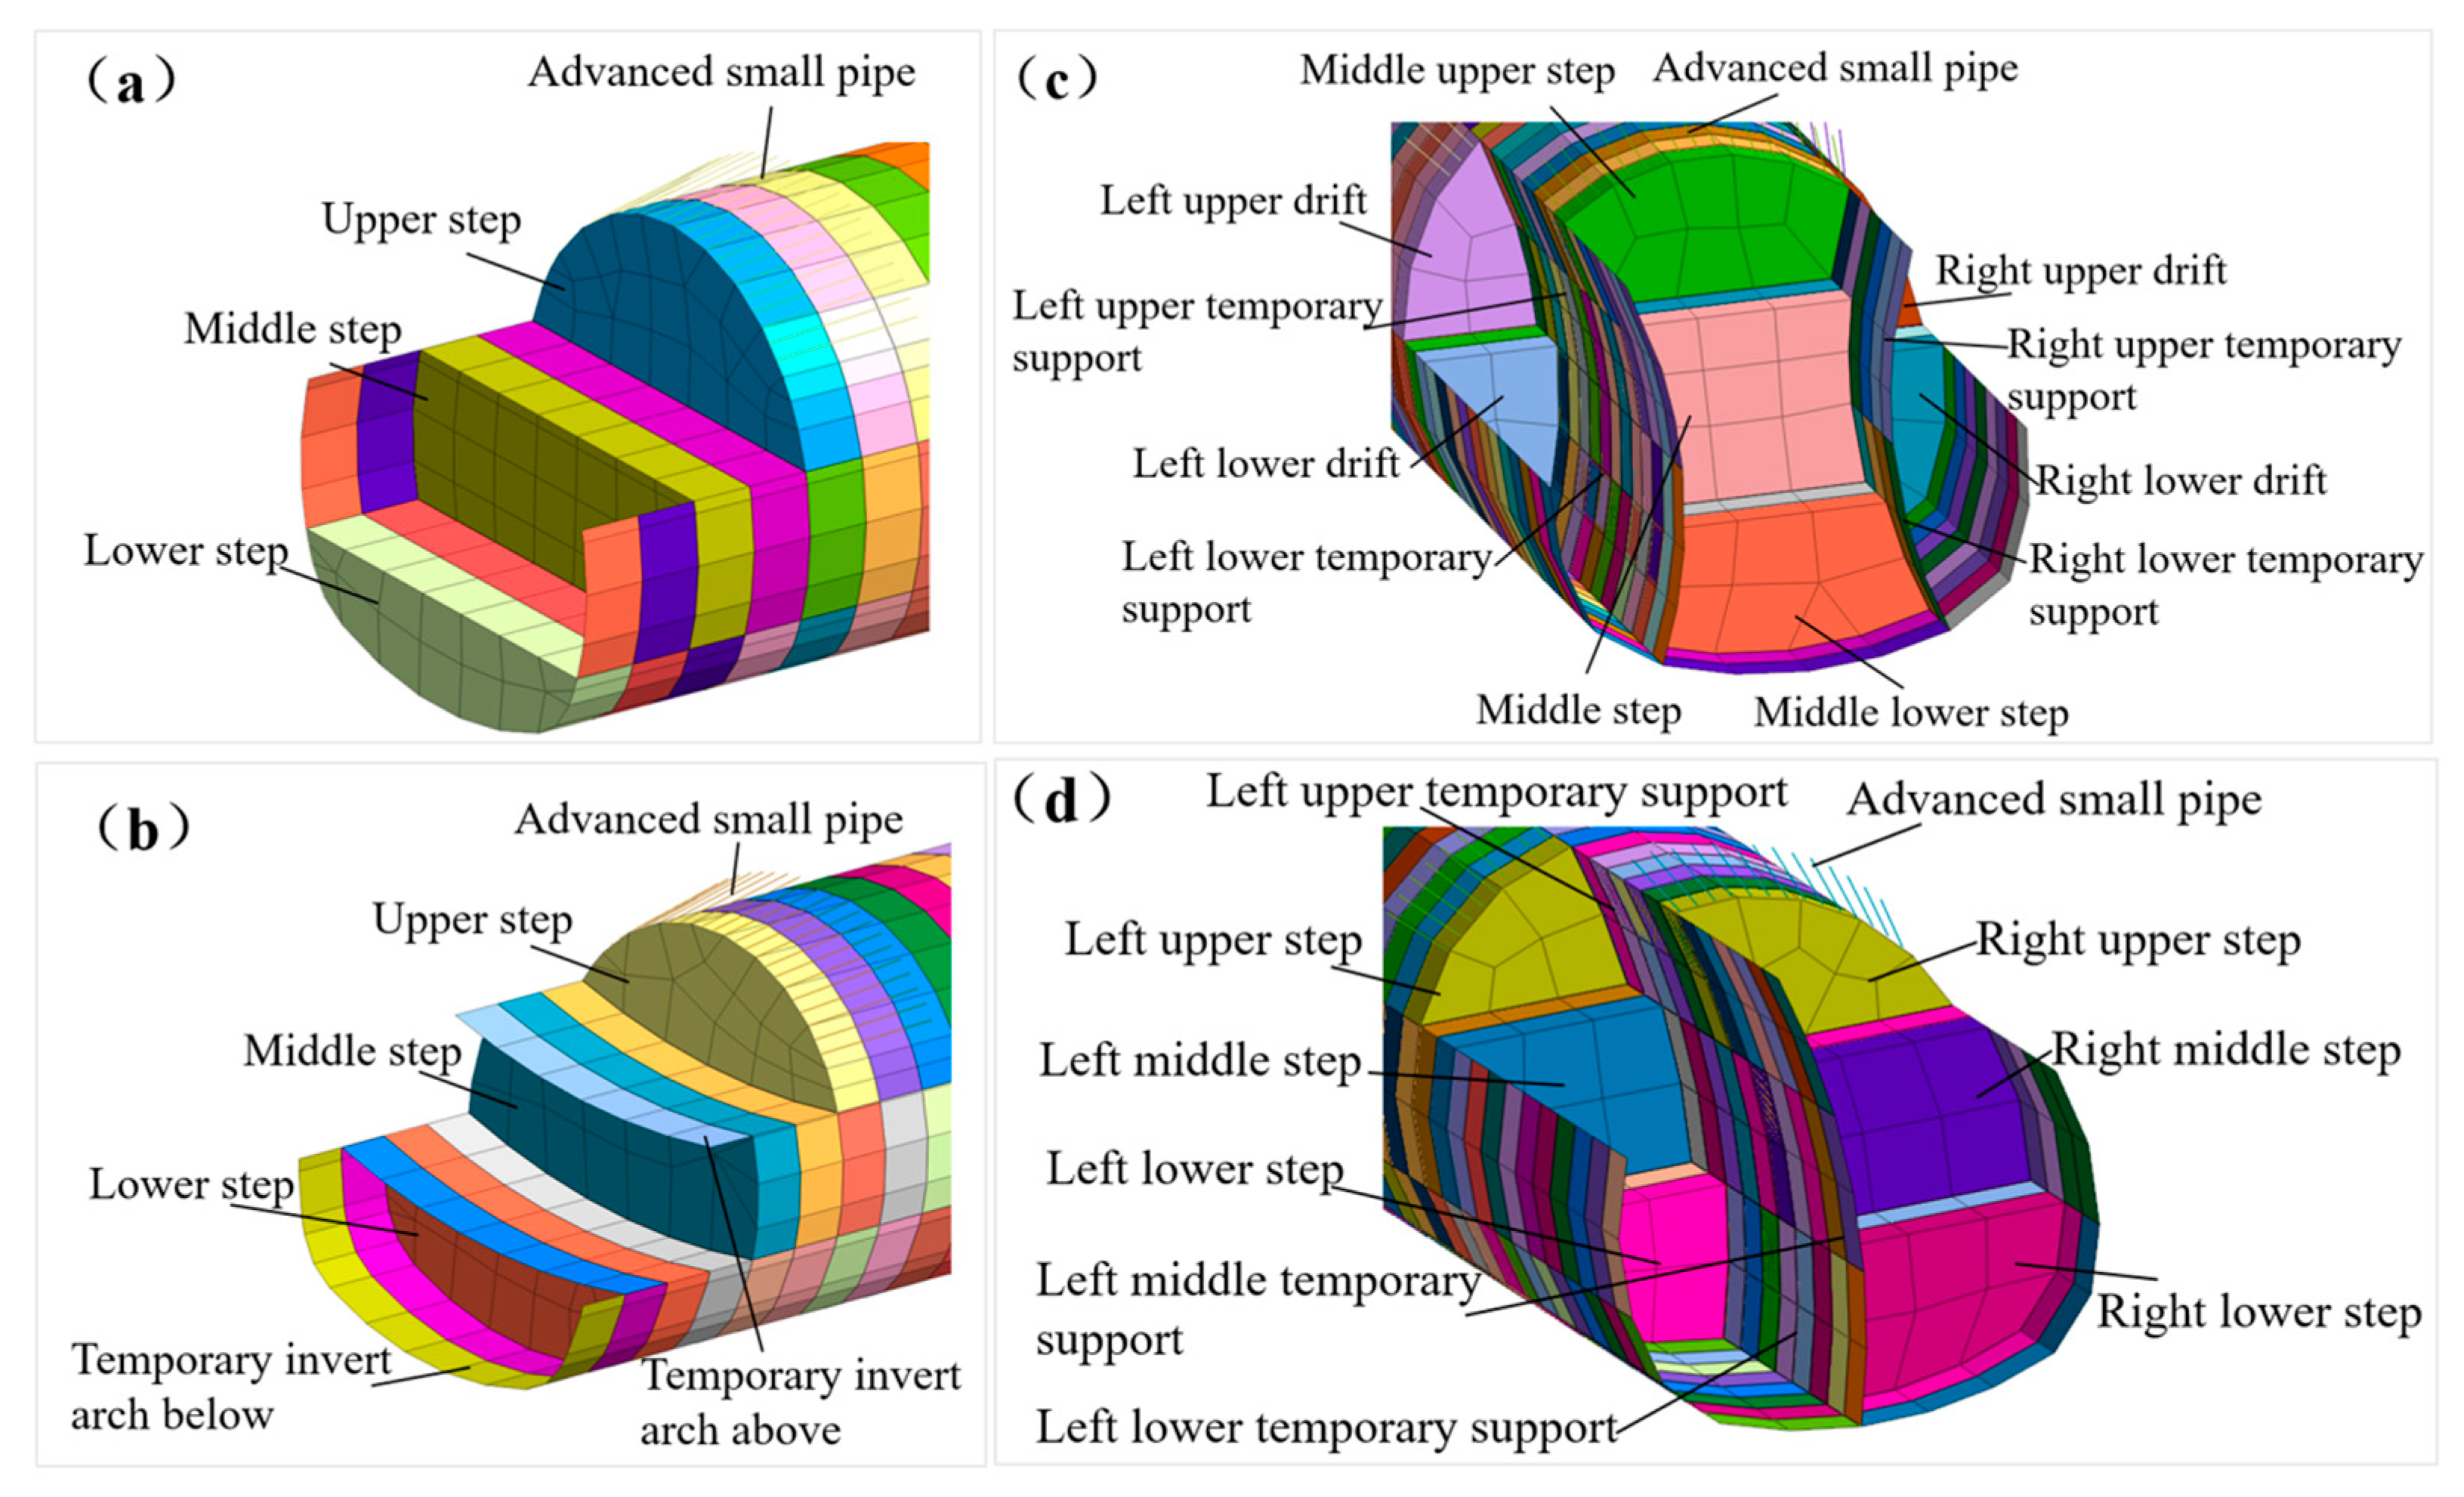
The construction procedures for the three-step method, the three-step temporary inverted arch method, the double-side wall pilot tunnel method, and the CD method were incorporated as excavation steps in the numerical model. A comparative analysis was carried out with the same tunnel model. To mitigate the impact of fluctuating excavation dimensions, the advance length for all four methods was set to 1.5 m, in line with the New Austrian Tunneling Method’s short advance length principle.
Figure 4 shows the tunnel excavation models for each construction method.
The excavation sequences for different construction methods are presented in
Table 4. In the simulation, the initial stress state is first established to ensure the stability of the surrounding rock. Subsequently, excavation is carried out step by step according to the selected construction method, with all excavation steps executed sequentially and cyclically until tunnel breakthrough is achieved.
4. Analysis of Numerical Calculation Results
To examine the strain and stress distribution of the rock mass surrounding the tunnel under various construction methods, a detailed analysis was conducted on critical sections of the tunnel, including the arch top, arch waist, and arch bottom. These areas are typically the most vulnerable parts of the tunnel structure and are particularly affected by the construction mechanics and rock mass surrounding the tunnel deformation. Analyzing these sections provides a clearer understanding of how different construction methods influence the strain and stress changes in the rock mass surrounding the tunnel, offering valuable theoretical insights for on-site monitoring.
4.1. Analysis of Rock Mass Surrounding the Tunnel Displacement
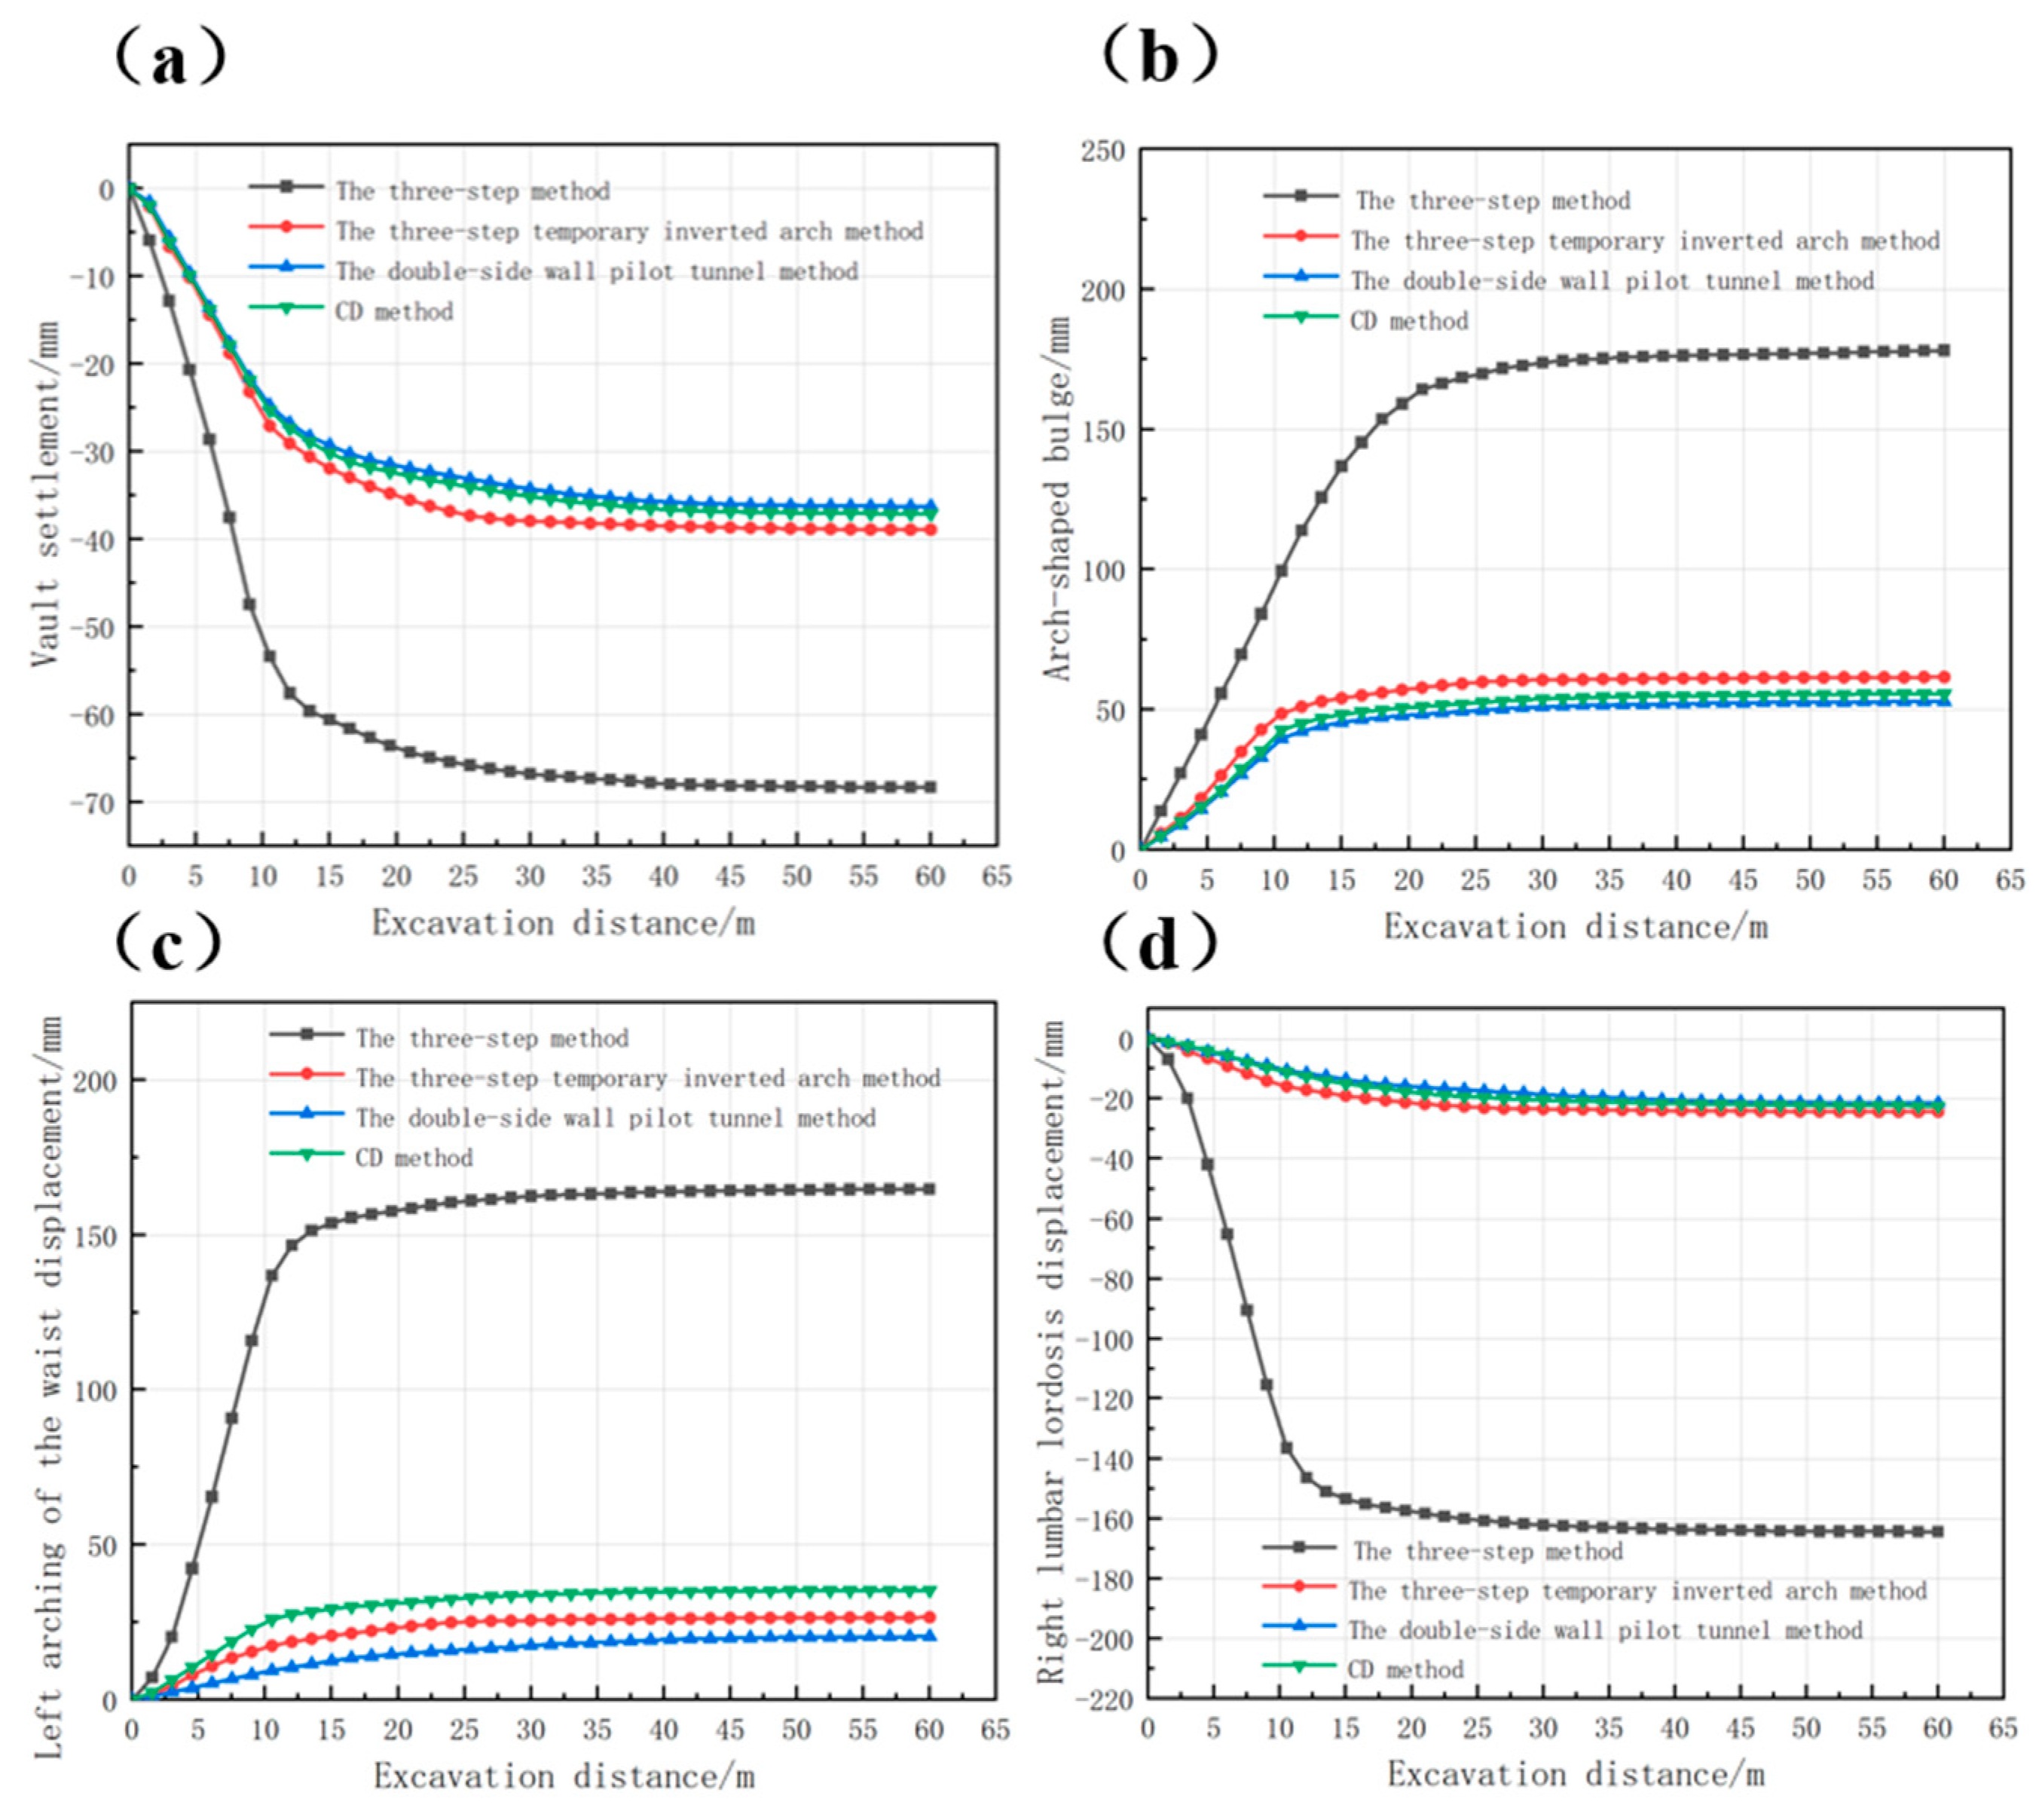
Figure 5 presents curves showing the changes in arch top settlement, arch bottom uplift, horizontal displacements at the arch bases on the left and right, and excavation length for the four construction methods.
According to
Figure 5, the arch roof settlement rose quickly during the initial excavation phase for all four construction methods, with the three-step method exhibiting the highest subsidence rate. With the progress of excavation, the subsidence growth became more stable, indicating that the support structure began to effectively control deformation. The maximum settlement values were −68.33 mm for the three-step method, −38.92 mm for the three-step temporary inverted arch method, −36.25 mm for the double-side wall pilot tunnel method, and −37.12 mm for the CD method. The three-step method, having a larger excavation area, faced difficulties in effectively suppressing soil deformation, resulting in a larger settlement. The other three methods displayed similar and relatively good control over arch roof settlement.
Regarding the arch bottom bulge, each method experienced rapid bulge increase in the initial stage, stabilizing after excavating about 30 m, signaling the formation of the inverted arch structure and gradual adjustment of the rock mass surrounding the tunnel stress. The double-side wall pilot tunnel method performed best, with a final bulge of 52.83 mm.
Regarding lateral displacement at the arch waist, the three-step method showed the greatest displacement and notable deformation. In contrast, the three-step temporary inverted arch method, double-side wall pilot tunnel method, and CD method showed better control over horizontal displacement, with smaller deformations. Among these, the double-side wall pilot tunnel method was the most effective, followed by the CD method and the three-step temporary inverted arch method.
In conclusion, the double-side wall pilot tunnel method, CD method, and three-step temporary inverted arch method had similar performance in controlling the arch roof settlement, with all methods providing good control. The double-side wall pilot tunnel method was most effective in minimizing arch bottom bulge deformation. The three-step method resulted with the greatest lateral displacement at the arch wais, with significant deformation even after stabilization. Conversely, the other three methods demonstrated more effective control over horizontal displacement, with the double-side wall pilot tunnel method being the most effective, followed in sequence by the CD method and the three-step temporary inverted arch method.
4.2. Rock Mass Stress Analysis
Examining the stress state within the rock mass surrounding the tunnel after tunnel excavation is crucial for assessing construction methods. This analysis aids in identifying stress variations in the rock mass surrounding the tunnel during excavation, which is critical for assessing rock stability and determining support requirements. It offers a scientific foundation for choosing and refining construction techniques, ensuring construction safety and quality. Additionally, understanding the stress distribution aids in controlling rock deformation and minimizing environmental impact, forming a crucial foundation for efficient and safe construction.
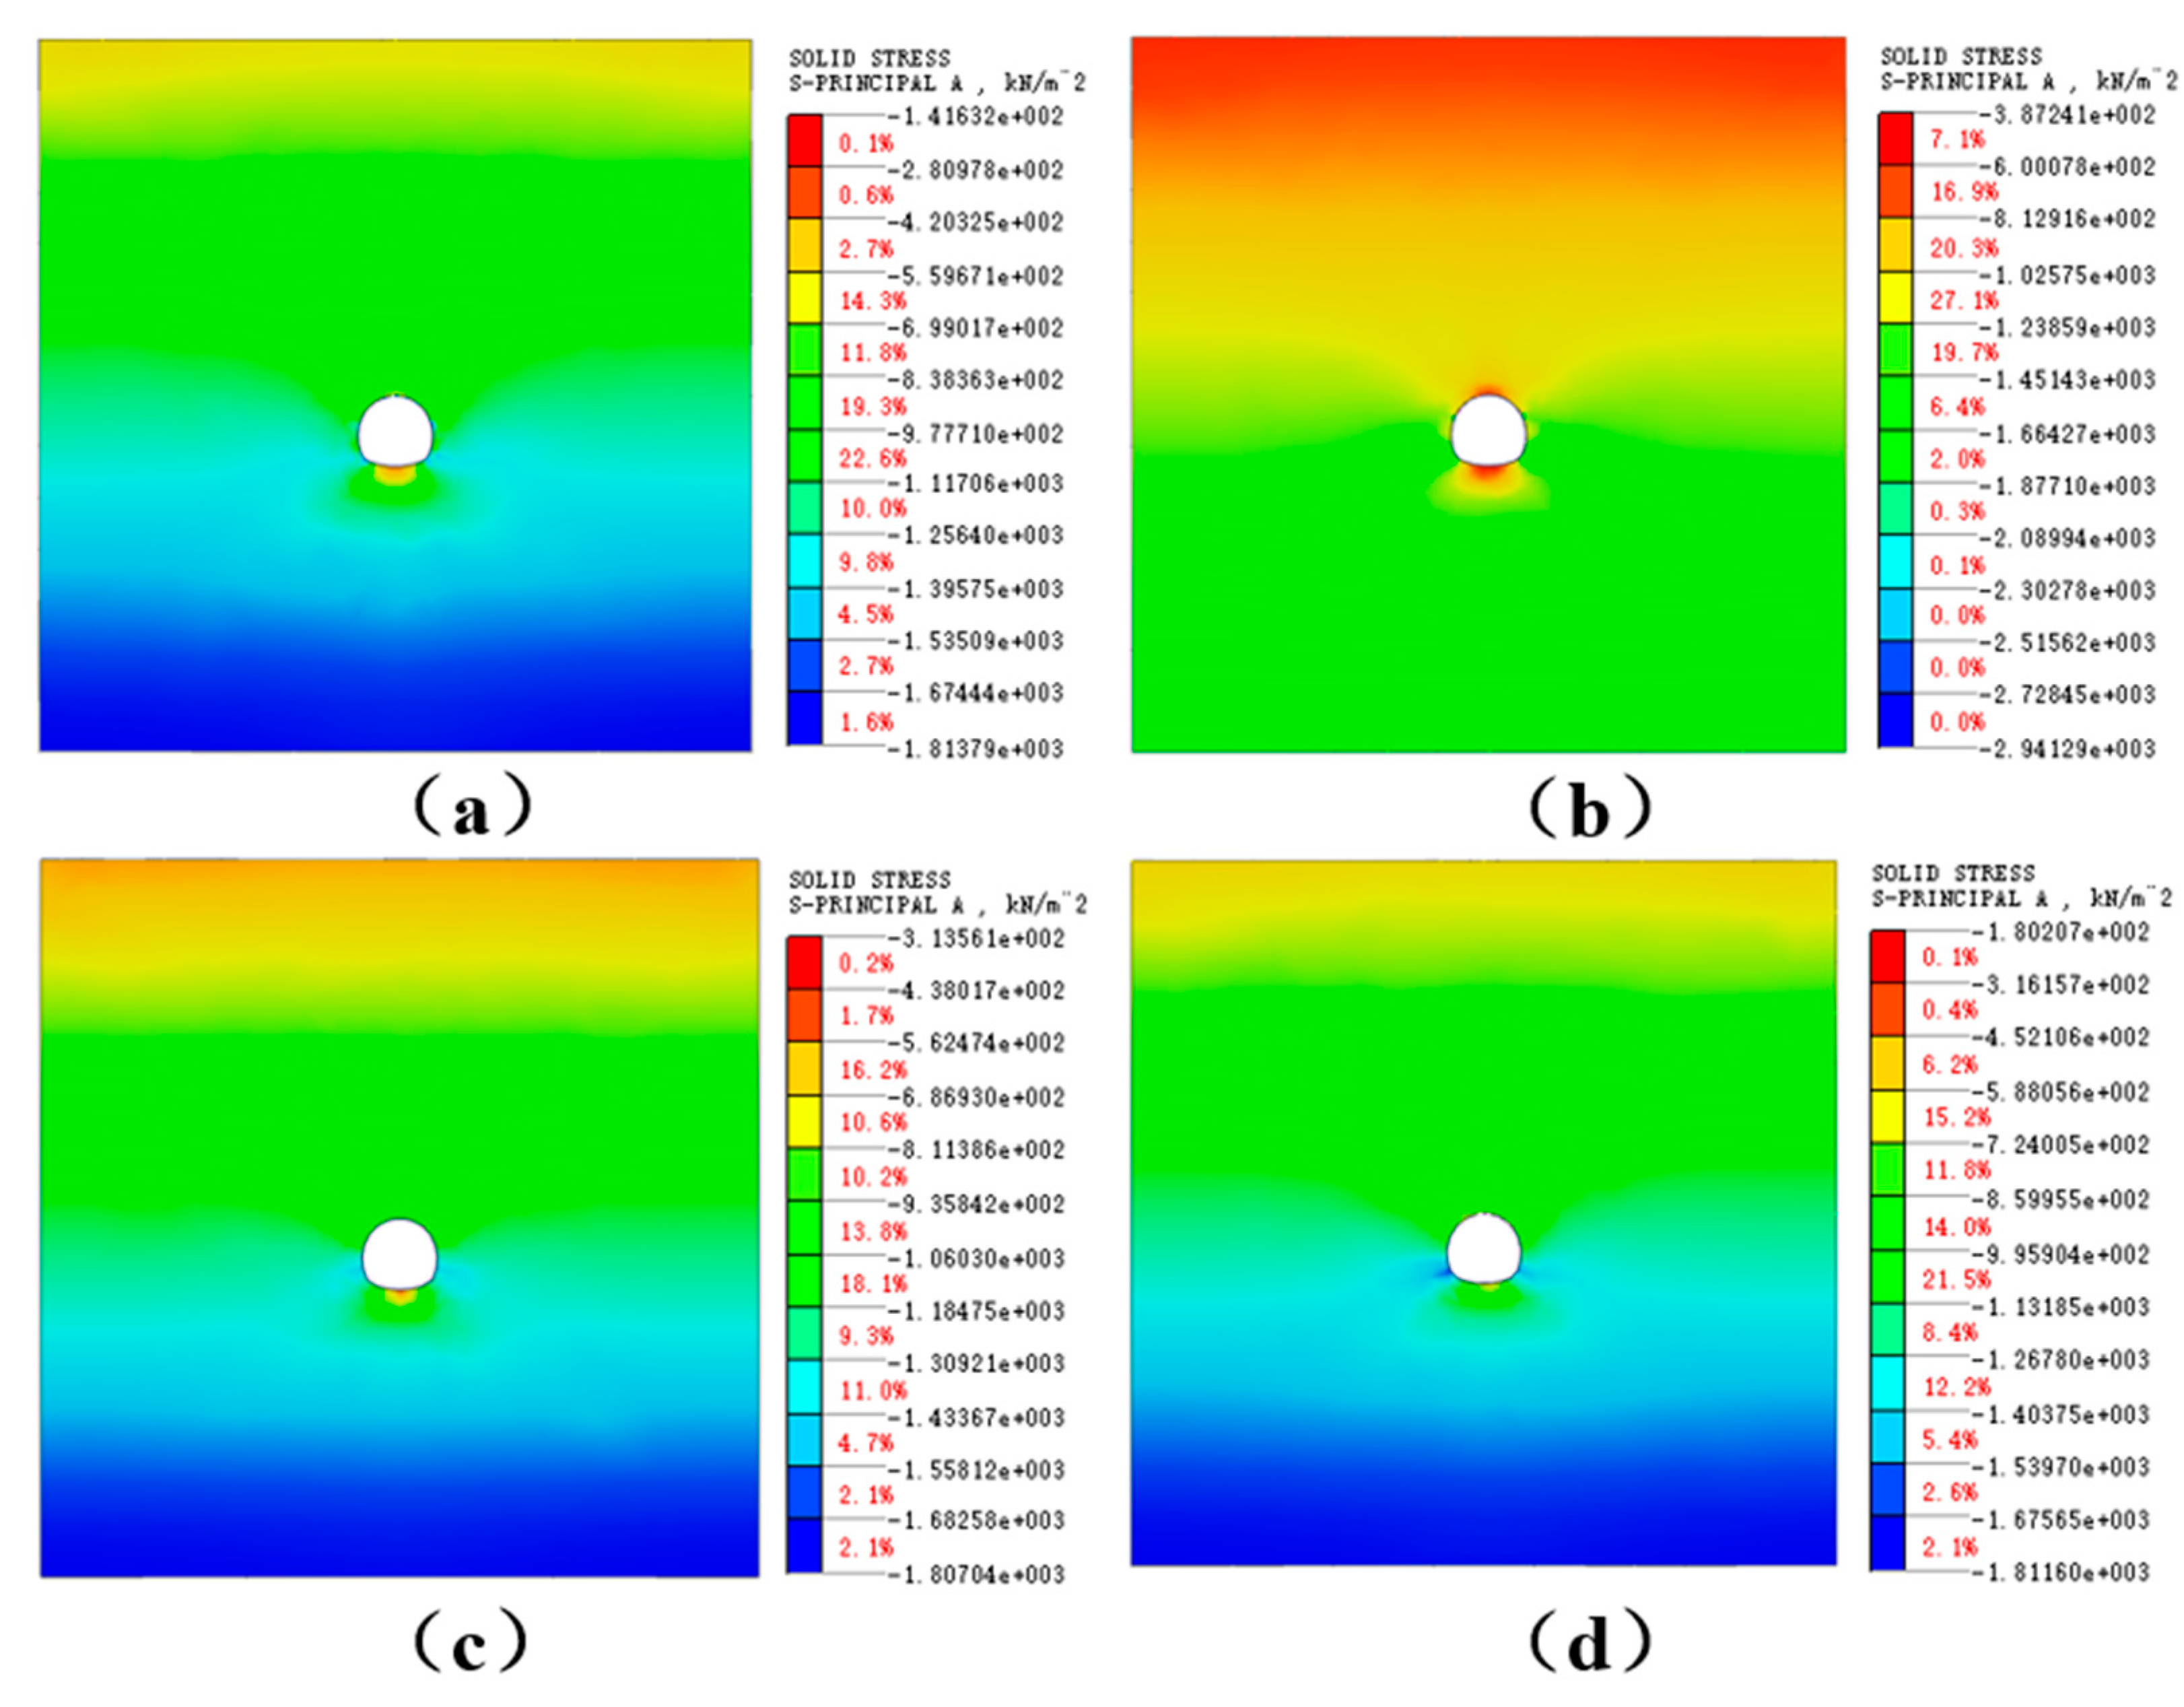
Figure 6 displays the contour lines for the peak principal stress in the rock mass surrounding the tunnel for the four construction methods.
According to
Figure 6, which illustrates the distribution of the peak principal stress, tunnel stress variations are observed at key locations, including the arch’s top, bottom, waist, and foot. An analysis of the simulation results revealed that the peak principal stress occurred at the arch’s lower part for all four construction methods. The three-step method showed the highest peak principal stress at −0.14 MPa, indicating stronger impact on the rock mass surrounding the tunnel and a higher potential for stress concentration. In contrast, the three-step temporary upside-down arch method had the lowest peak principal stress of −0.39 MPa, suggesting a buffering effect that adjusts the rock mass surrounding the tunnel stress, with stress focused at the arch bottom. The double-side wall pilot tunnel method achieved a peak principal stress of −0.31 MPa, indicating moderate compressive stress on the rock mass surrounding the tunnel, along with some capacity to control deformation. The CD method, with a peak principal stress of −0.18 MPa, fell between the three-step method and the remaining two methods, suggesting a balancing effect in controlling the rock mass surrounding the tunnel stress.
4.3. Support Stress Analysis
4.3.1. Stress Analysis of Initial Support
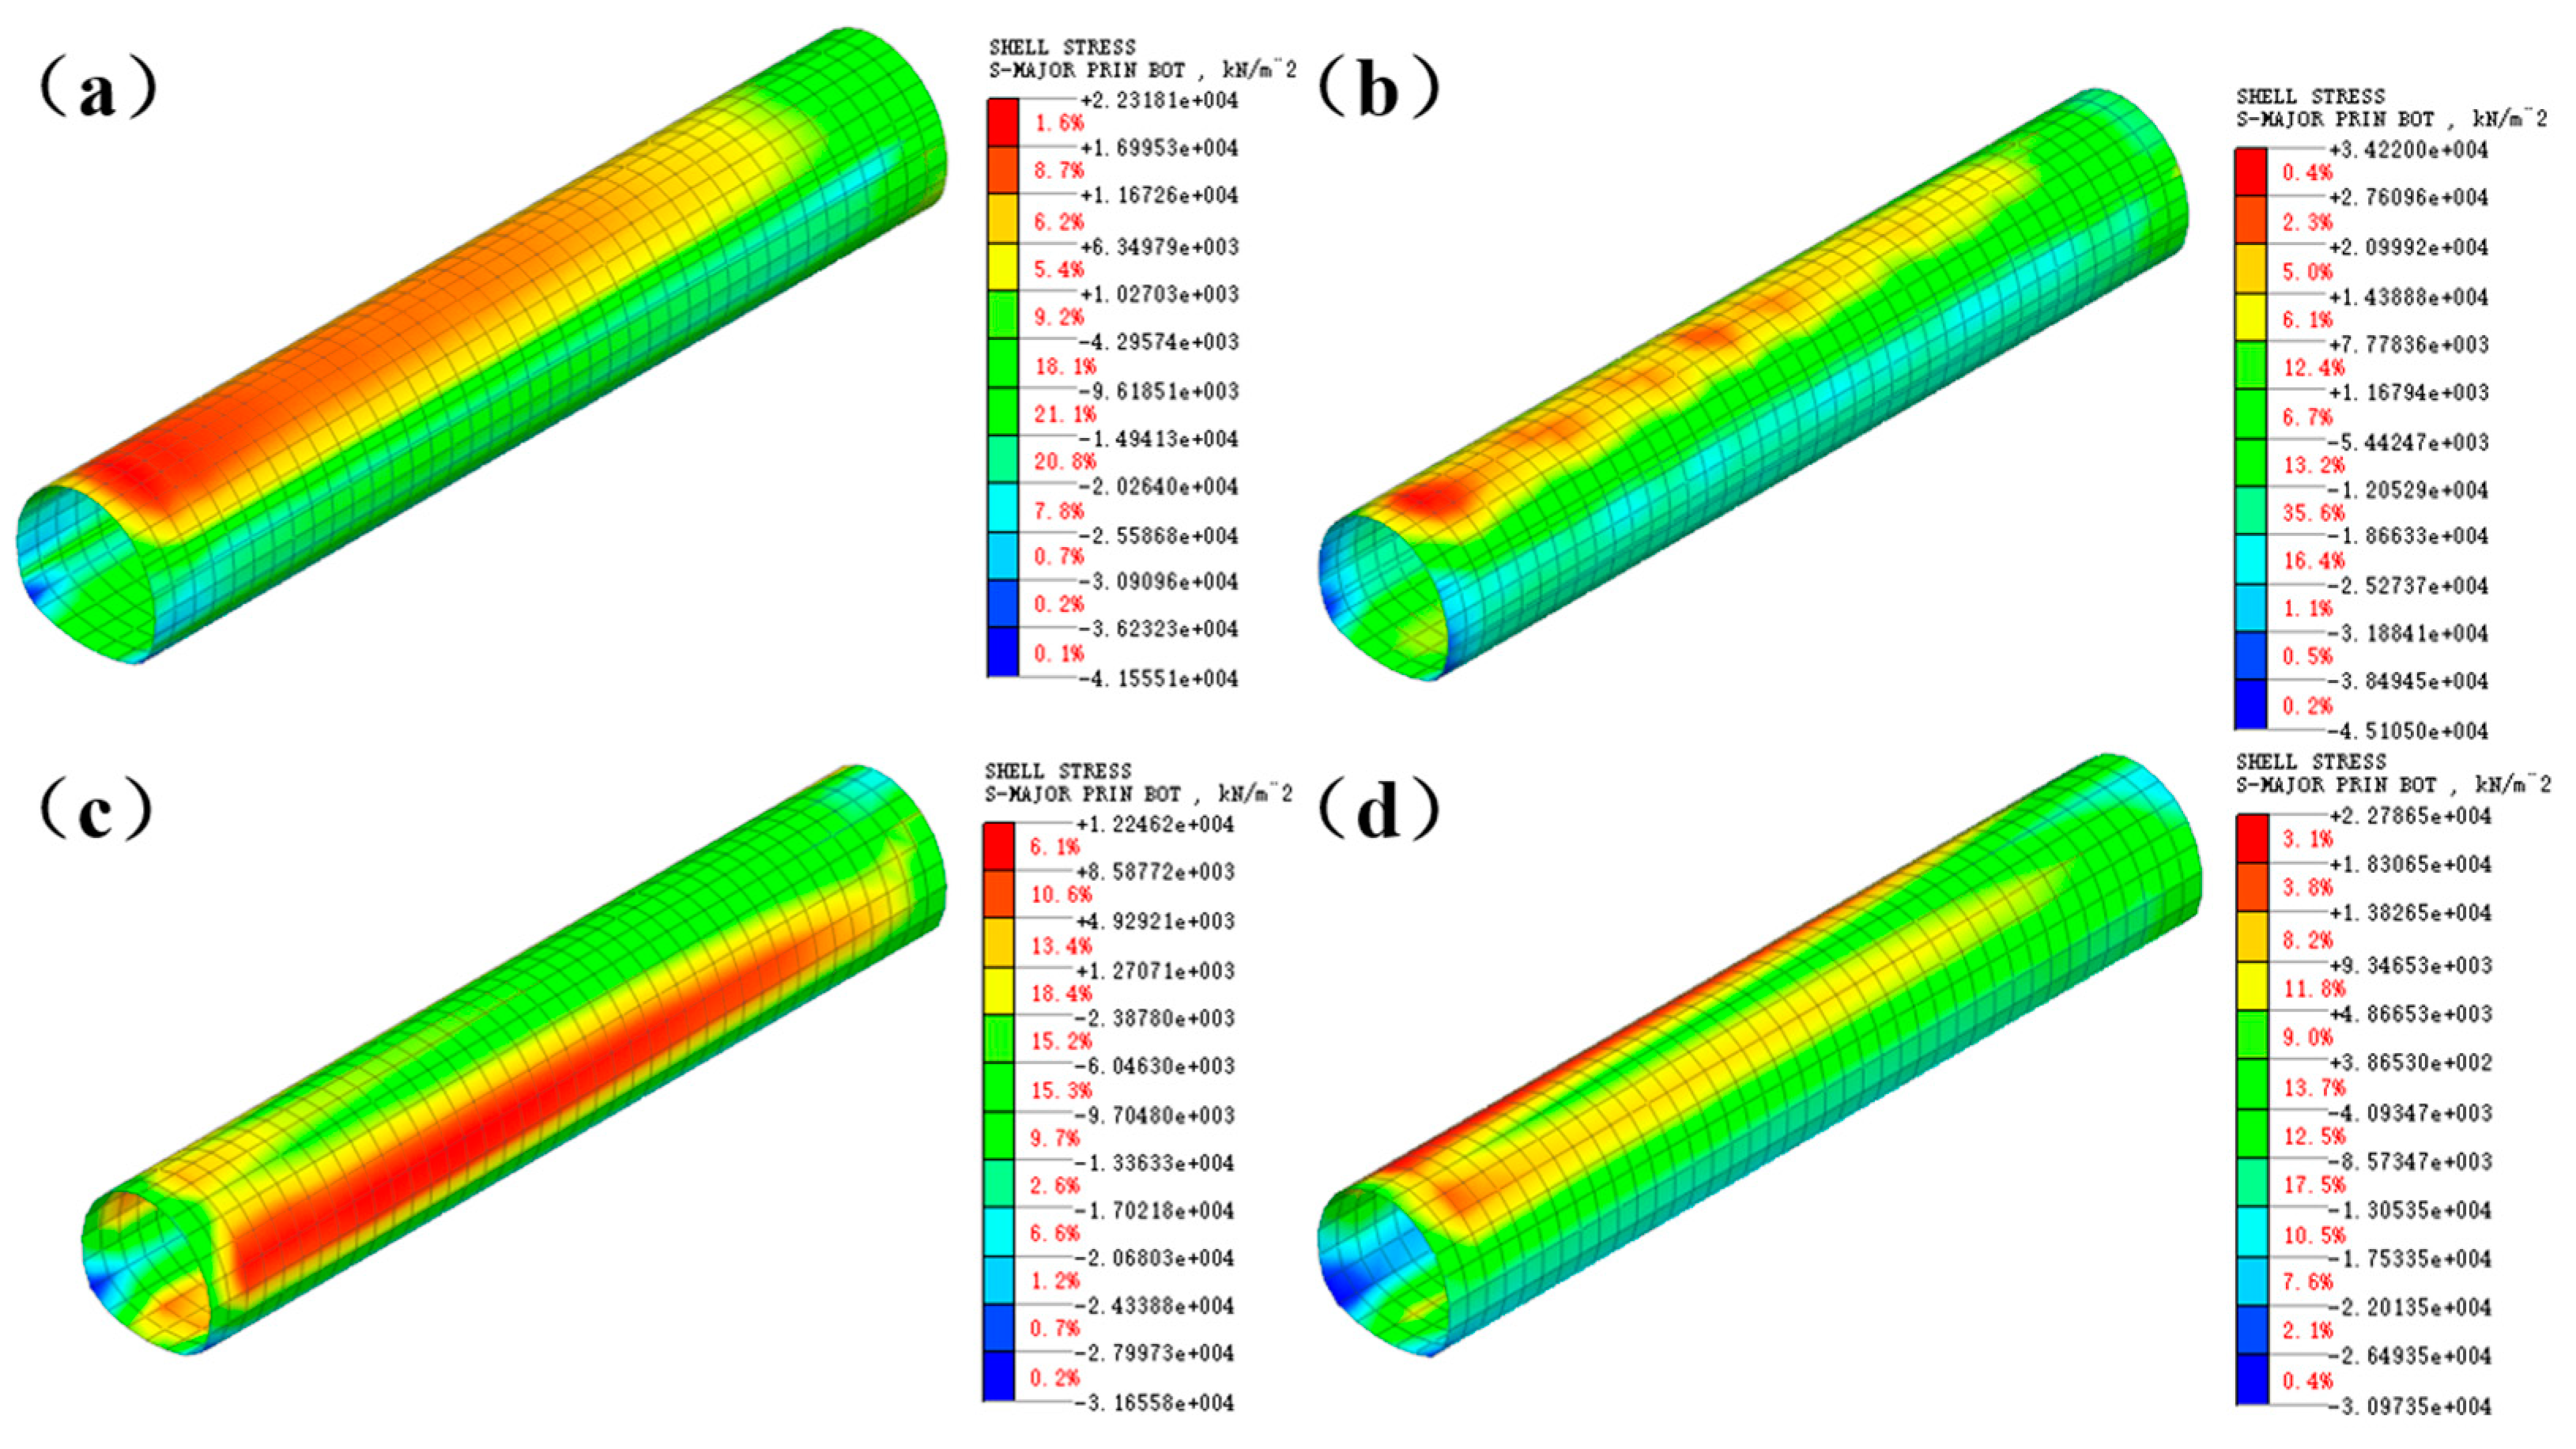
Figure 7 displays the stress pattern of the initial support following excavation for the four construction methods. Compressive stress is indicated by negative values, while tensile stress is indicated by positive values. As depicted in the figure, the tensile stress in the initial support of the three-step method, three-step temporary inverted arch method, and CD method primarily occurs at the arch top, with compressive stress concentrated near the arch foot. In contrast, the tensile stress for the double-side wall pilot tunnel method is mainly concentrated around the arch waist, while compressive stress is more focused at the arch foot. This distribution pattern is due to the tunnel excavation process, where the roof rock subsides and the floor rock bulges upward, causing an extrusion effect on the upper support and inverted arch.
Table 5 shows the distribution and maximum values of tension and compression stresses in the initial support after excavation for the various construction methods.
As shown in
Figure 7 and
Table 5, the stress distribution of the three-step temporary inverted arch method and the CD method is more uniform compared to the three-step method and the double-side wall pilot tunnel method, with no noticeable stress concentration. The peak tensile stress for the three-step method is 22.32 MPa, and the peak compressive stress is −41.56 MPa. For the three-step temporary inverted arch method, the peak tensile stress is 34.22 MPa, and the compressive stress is −45.11 MPa. The double-side wall pilot tunnel method shows a peak tensile stress of 12.25 MPa, with a compressive stress of −31.66 MPa. Lastly, for the CD method, the peak tensile stress is 22.79 MPa, and the compressive stress is −30.97 MPa. In all cases, the stress values remain within the design strength limits of the support structure, which combines C25 sprayed concrete, an H180 grid steel frame, and ∅8 steel wire mesh.
4.3.2. Analysis of Anchor Bolt Stress
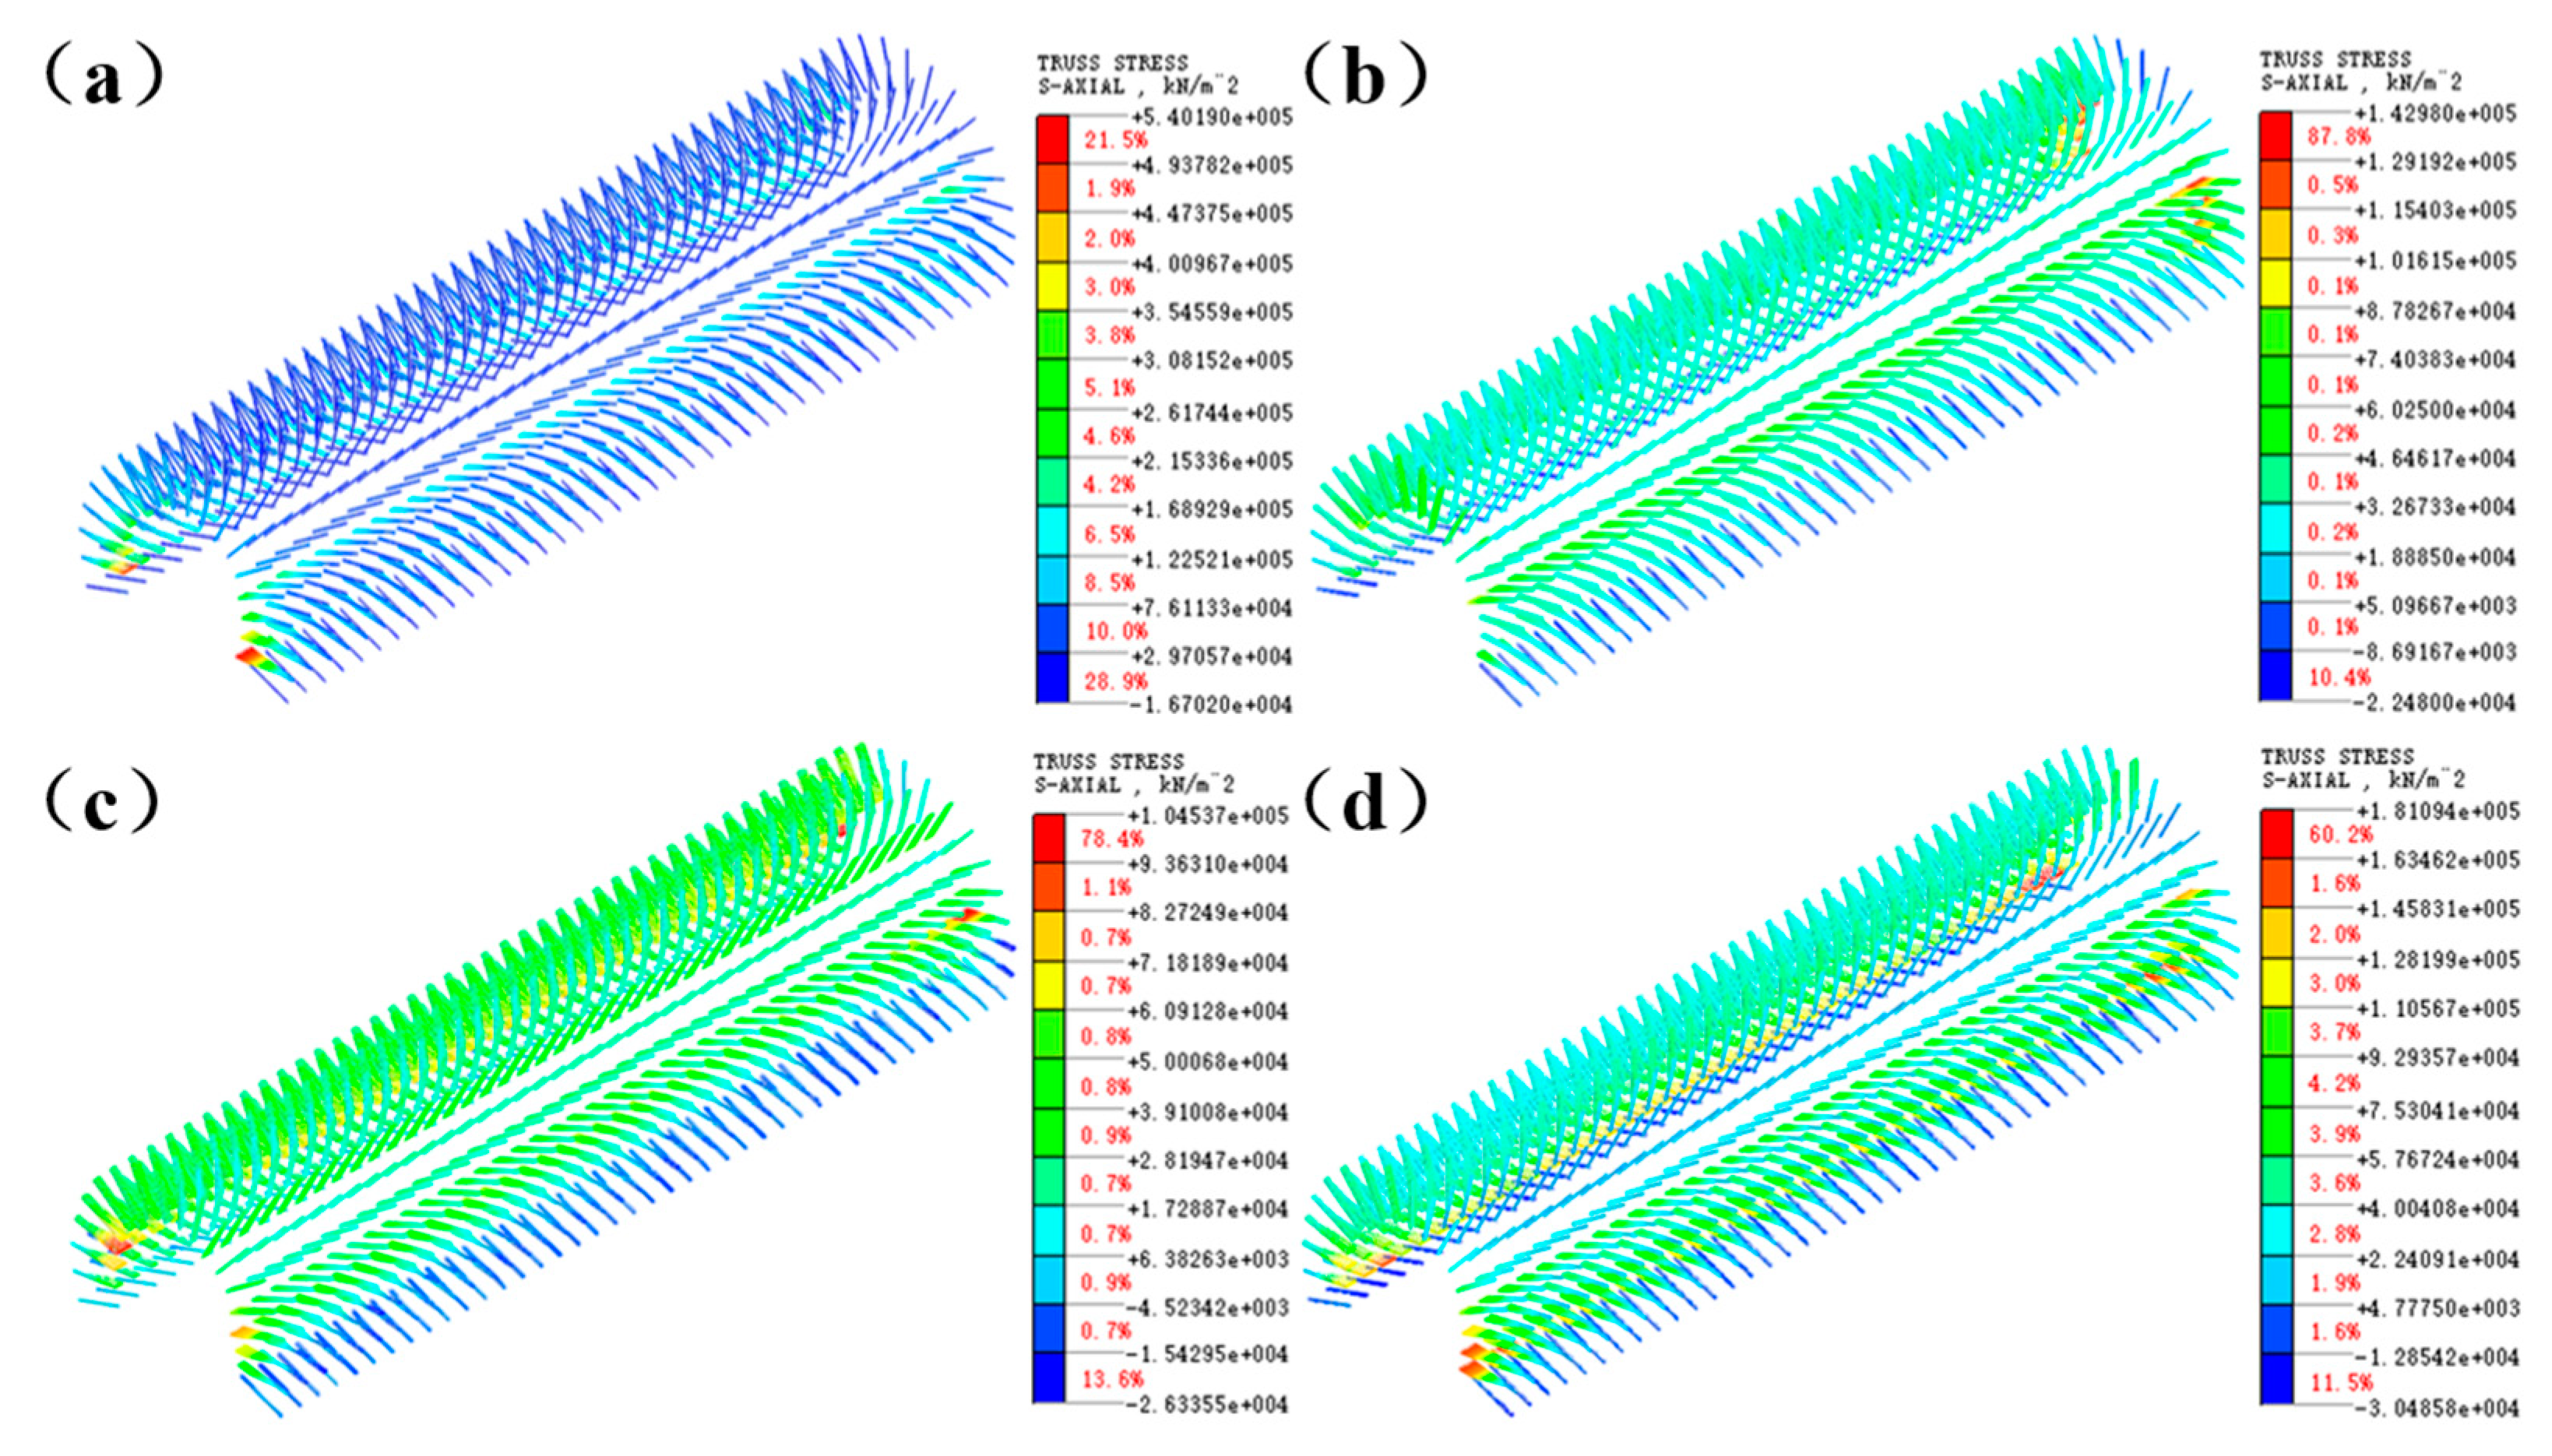
Figure 8 shows the stress distribution diagrams of the anchor rods after excavation for the four construction methods. The diagrams illustrate the stress distribution of the anchor rods, with compressive stress shown, where negative values correspond to compressive stress and positive values to tensile stress. Notable differences in the stress distribution of the anchor rods are observed among the various construction methods, highlighting the variations in tensile and compressive stress areas. This analysis serves as a foundation for selecting the appropriate construction method in subsequent stages.
In the three-step method, the three-step temporary inverted arch method, the double-side wall pilot tunnel method, and the CD method, the anchor rods experience tensile stress from the arch waist to its uppermost point, while compressive stress is observed near the arch foot.
Table 6 presents the distribution and maximum values of both tensile and compressive stresses in the anchor rods after excavation under each construction method.
Table 6 indicates that in the three-step method, the peak tensile stress of the anchor rods occurs near the arch waist at 540.19 MPa, while the compressive stress is −16.70 MPa near the arch foot. In the three-step temporary inverted arch method, the peak tensile stress near the arch waist is 142.98 MPa, and the compressive stress near the bottom of the arch is −22.48 MPa. For the double-side wall pilot tunnel method, the tensile stress near the arch waist is 104.54 MPa, and the compressive stress near the bottom of the arch is −26.34 MPa. In the CD method, the peak tensile stress at the arch waist is 181.09 MPa, with compressive stress near the arch foot at −30.49 MPa. Of the four methods, only the three-step method exceeds the design strength of the anchor rods for tensile stress, while the others stay within the design limits.
4.4. Comparison Conclusion
In the discussion of the results, we further explored the performance of different construction methods in controlling surrounding rock displacement and the stress characteristics of the support structure. Compared with the three-step method, the three-step temporary inverted arch method, double-sidewall pilot tunnel method, and CD method demonstrate more significant advantages in controlling the surrounding rock displacement, effectively reducing the deformation of the surrounding rock and ensuring the stability of the tunnel excavation process. Additionally, these three methods exhibit superior stress characteristics in anchor bolt axial force and initial support bending moments, showing better structural stress coordination, which enhances the safety of tunnel construction and the reliability of the support system.
Through a comprehensive analysis of these construction methods, we found that the three-step temporary inverted arch method stands out in deformation control, plastic zone distribution, and the coordination of surrounding rock and support stresses. Its superior mechanical performance and structural response not only ensure the safety of tunnel construction but also offer the advantages of a simplified construction process, easy management, and high construction efficiency, which significantly improve the overall project efficiency. Compared to other construction methods, the three-step temporary inverted arch method has clear advantages in terms of cost-effectiveness, significantly reducing construction costs.
Therefore, considering deformation control, construction convenience, and economic benefits, the three-step temporary inverted arch method is recommended as the optimal construction method for V-grade surrounding rock conditions. It effectively balances these key factors and provides valuable practical experience and references for similar tunnel projects. We suggest prioritizing this method in similar geological conditions to achieve safe, economical, and efficient tunnel construction.
5. Analysis of Comparison Between Monitoring Results and Numerical Simulation Results
5.1. Monitoring Items
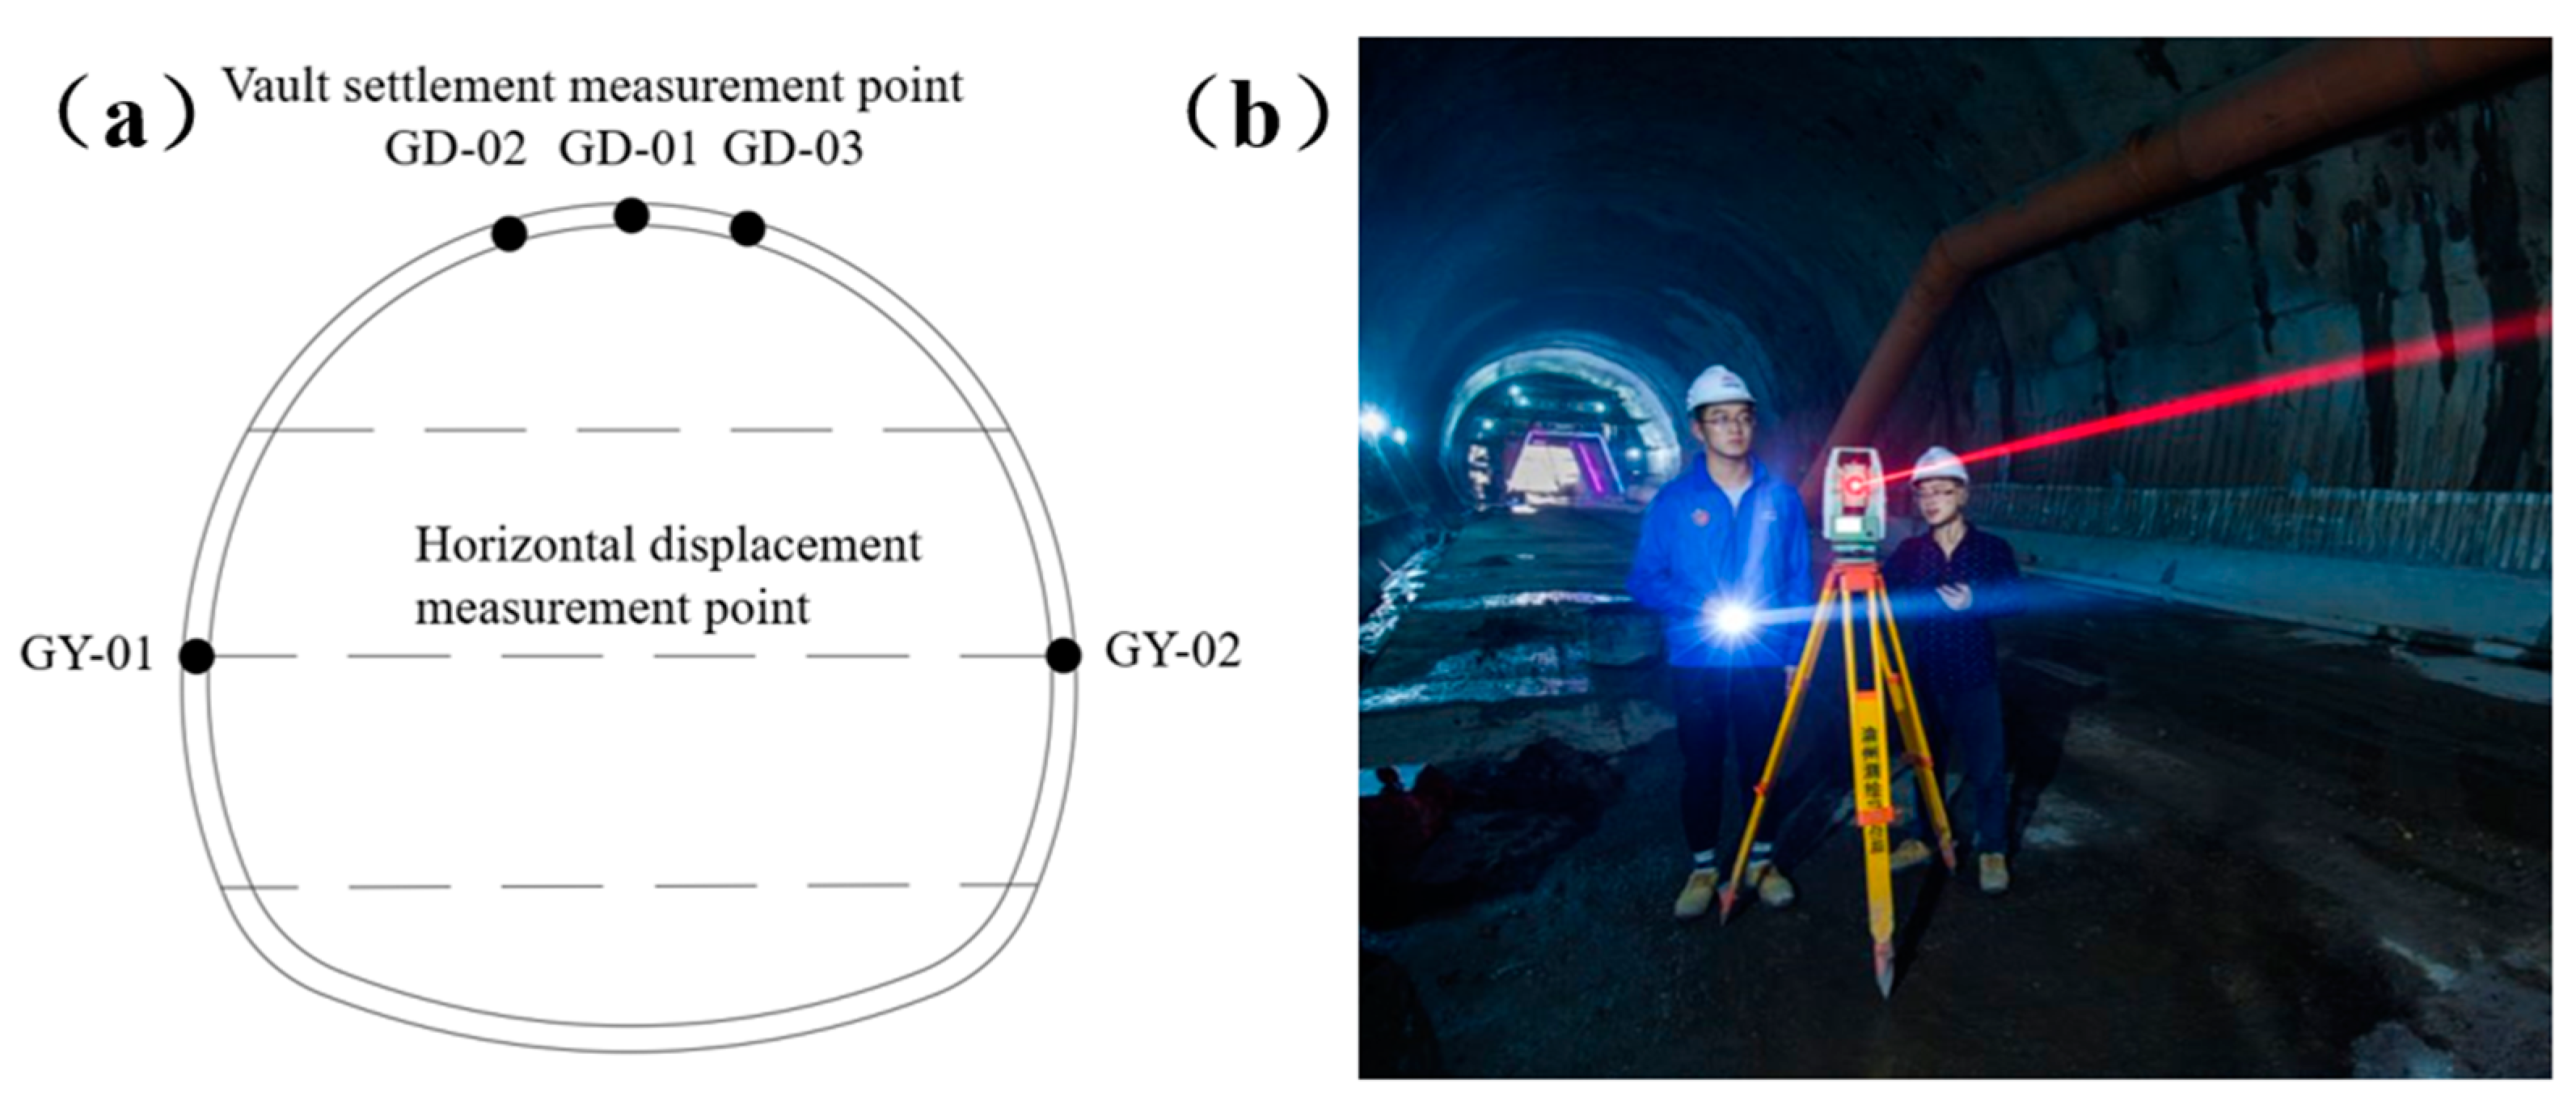
This experiment selected the tunnel section DK357+ 250 as the monitoring target, aiming to study the deformation characteristics of deeply buried soil surrounding rock during the construction process. This section has typical geological features, which can realistically reflect the possible deformation patterns and their evolution during excavation. The study primarily monitors two parameters: crown settlement and horizontal convergence, with high-precision total stations being the commonly used monitoring instruments. The monitoring setup follows the principle of placing one monitoring section every 5 m, with each section having at least one crown settlement monitoring point and two horizontal convergence monitoring points, forming a uniformly distributed and responsive monitoring system.
To ensure the accuracy and reliability of the monitoring data, the measurement frequency should be dynamically adjusted based on construction progress and changes in the field geology, thus accurately reflecting the surrounding rock deformation and promptly identifying potential instability factors. In the early stages of tunnel excavation, due to surrounding rock stress redistribution, plastic zone expansion, and the gradual effectiveness of initial support, the deformation rate of the surrounding rock is relatively fast. During this period, the monitoring frequency should be increased to obtain timely and accurate data support. The crown settlement monitoring point GD-01 is set at the center of the tunnel crown, with GD-02 and GD-03 located 1 m horizontally from GD-01 on either side, serving as reference points. This three-point monitoring setup is used to accurately capture vertical settlement trends. The horizontal convergence monitoring points GY-01 and GY-02 are symmetrically placed on both sides of the tunnel crown waist. By monitoring horizontal displacements at these points, the convergence trend of the surrounding rock is analyzed to assess the coordination of forces and deformation in the support system. Through the comprehensive analysis of crown settlement and horizontal convergence data, the stability of the surrounding rock and the effectiveness of the support system can be thoroughly evaluated, providing scientific basis for subsequent construction and ensuring tunnel structural safety and construction progress. The tunnel monitoring layout is shown in
Figure 9.
5.2. Monitoring and Analysis
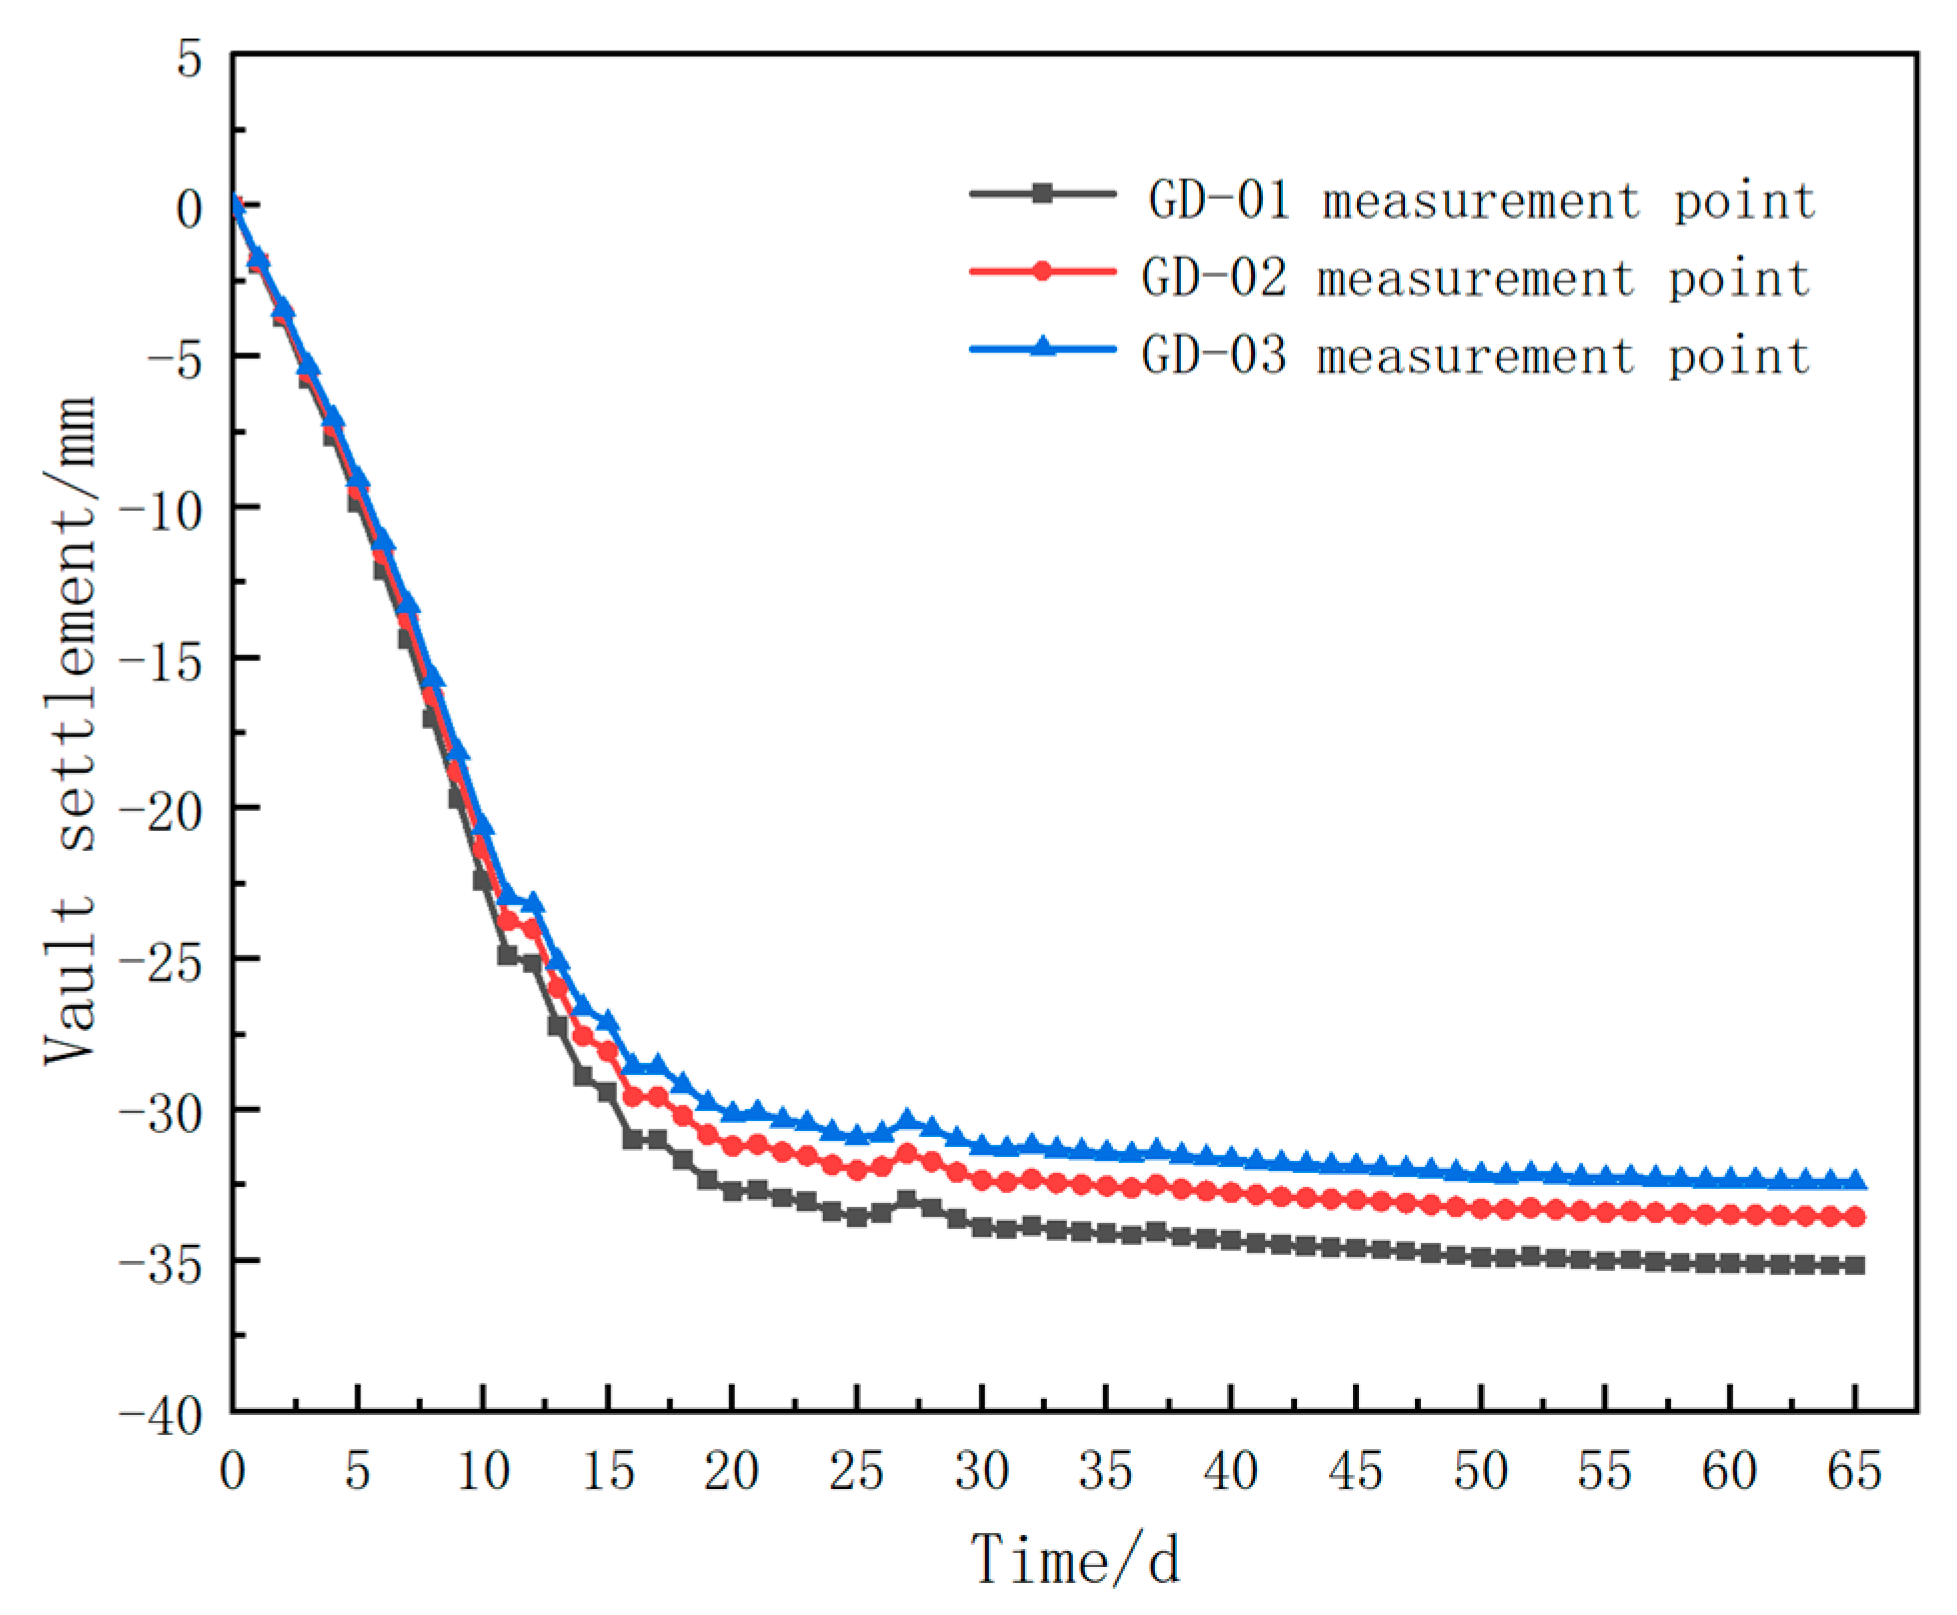
To examine the variation of arch top displacement during tunnel excavation, the monitoring points GD-01, GD-02, and GD-03 at the DK357+ 250 section were tracked for the arch top settlement. The cumulative monitoring data over time were then plotted, as illustrated in
Figure 10.
During the construction process, 65-day crown settlement monitoring was conducted on the DK357+ 250 section, and the cumulative settlement changes are shown in
Figure 10. The monitoring results indicate that during the first 15 days of excavation, the crown settlement rate was relatively high, with significant deformation. As the excavation face moved further from the monitoring section, the settlement rate significantly slowed down after approximately 30 days, and the surrounding rock gradually stabilized. The settlement value at the GD-01 crown center monitoring point was the largest, while the settlements at the GD-02 and GD-03 monitoring points on either side were 4.63% and 7.85% lower than at GD-01, respectively. The difference is mainly attributed to the distribution of surrounding rock joints and the uneven effect of grouting reinforcement.
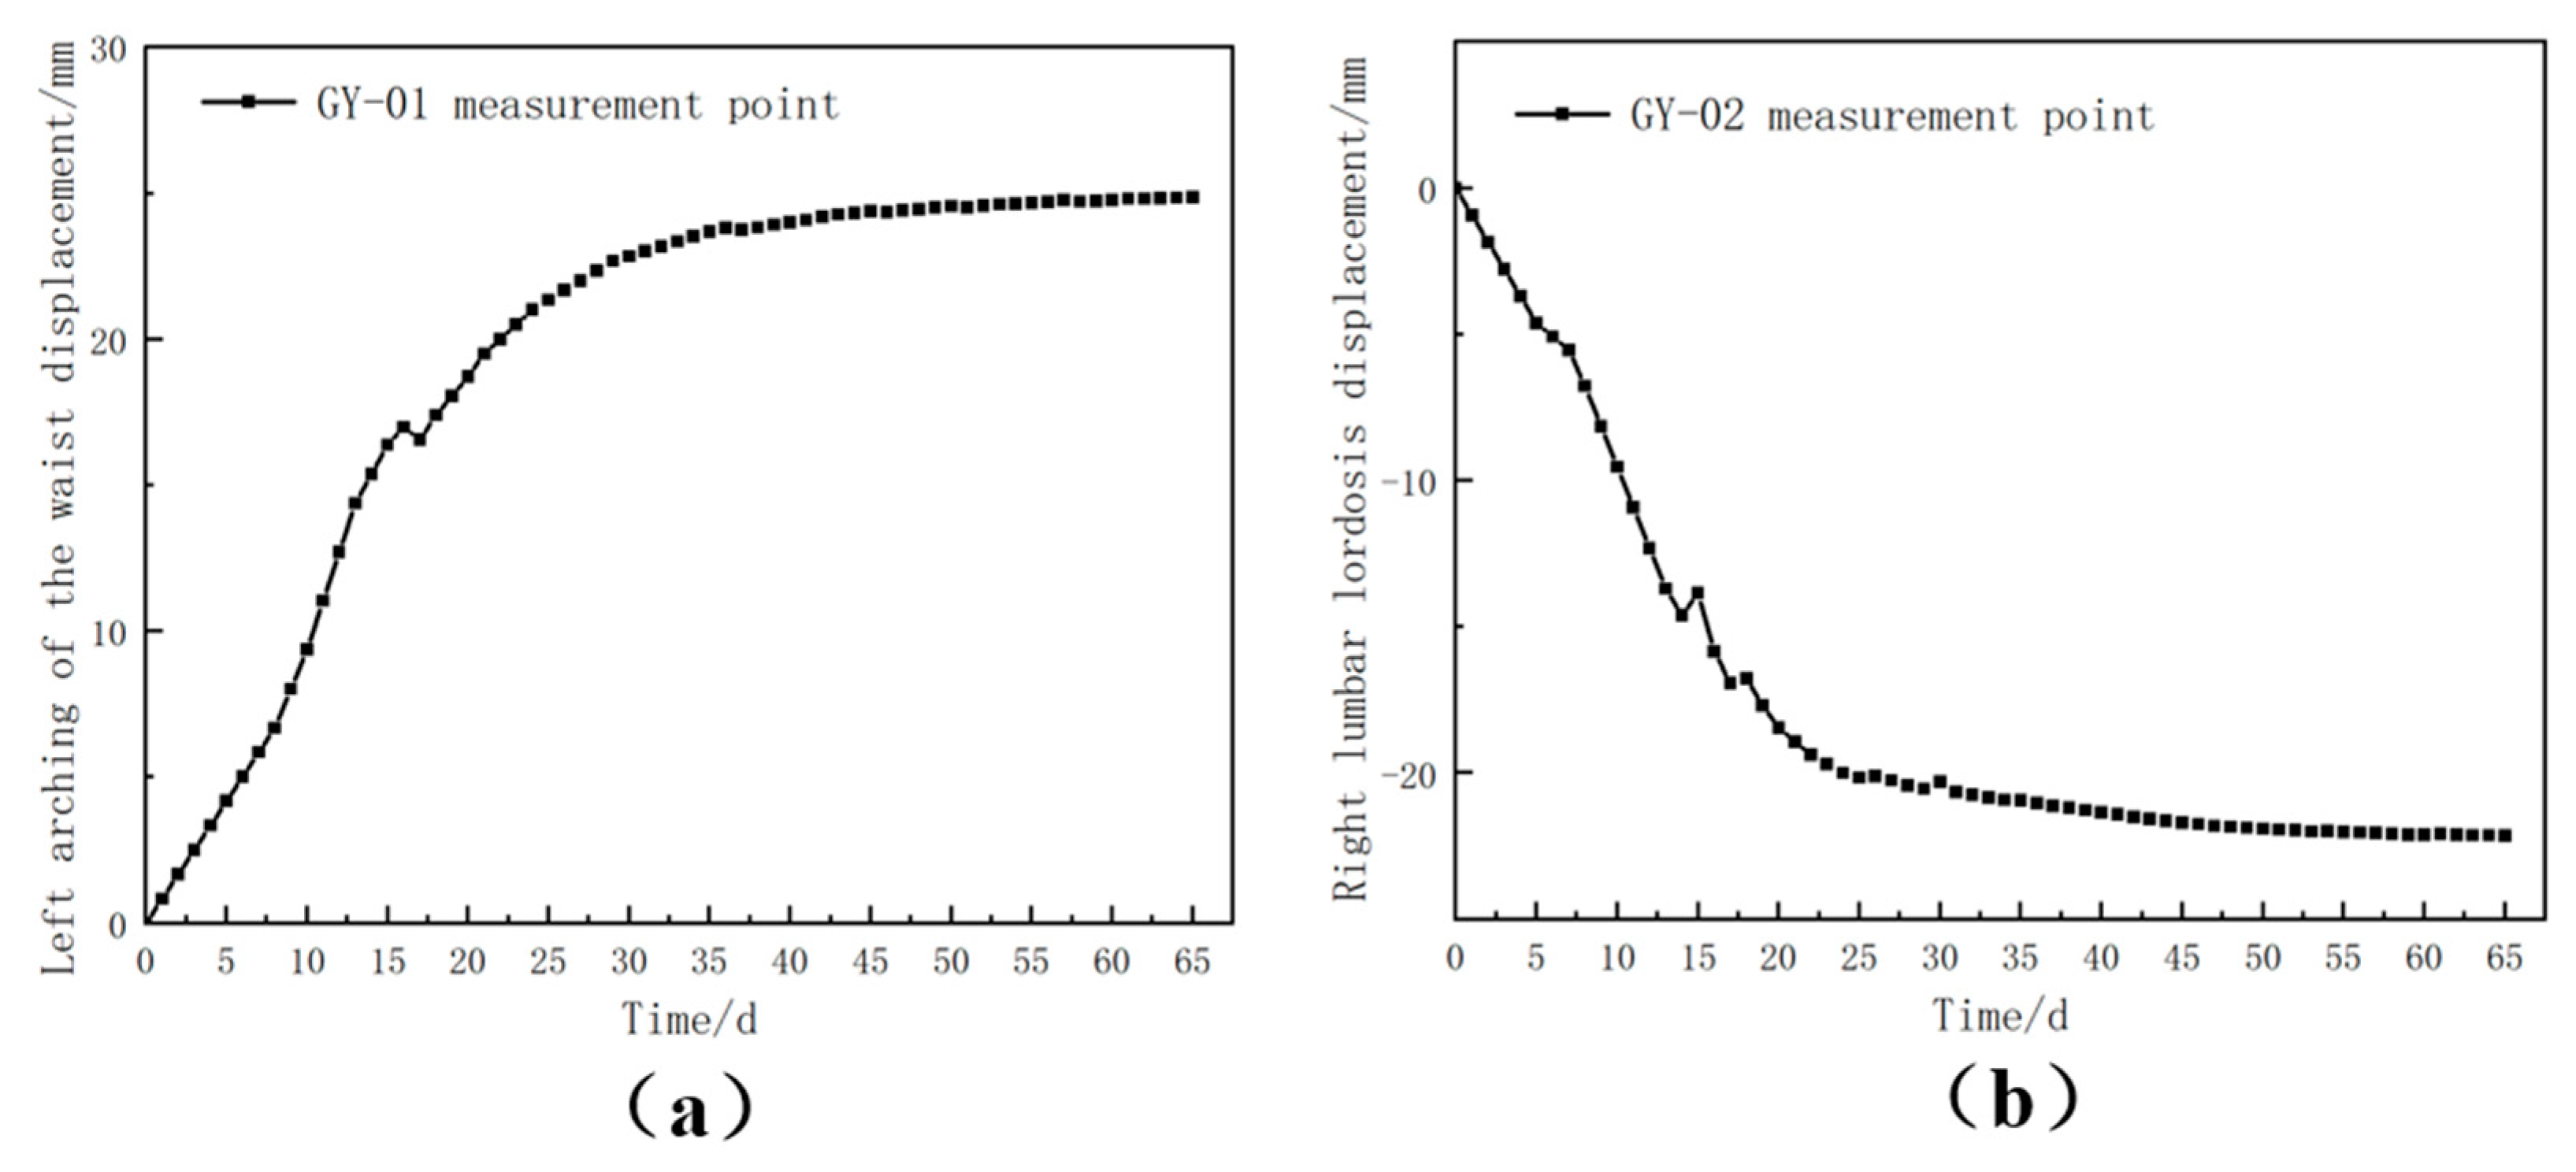
Additionally, horizontal convergence was measured at points GY-01 and GY-02 at the DK357+ 250 section, and the cumulative monitoring data over time were plotted in
Figure 11.
According to the horizontal displacement data in
Figure 11, the left and right arch waists exhibited different displacement patterns over time. Initially, the rock mass surrounding the tunnel stress release caused a gradual increase in the displacements of the arch waists. As excavation continued, the displacement rates decreased, and the curves stabilized. After 30 days of construction, the horizontal displacements of both arch waists became relatively stable.
To verify the fidelity of the numerical simulation results, a comparison was made between the simulated data and the field monitoring results. This comparison was crucial for confirming the construction process’s stability. Since rock mass deformation is fundamental in assessing tunnel stability, the arch top settlement and horizontal displacement from the numerical model were compared with the corresponding monitoring data from section DK357+ 250. The findings of this comparison can be found in
Table 7.
A comparison of the field data and the numerical simulation findings showed some discrepancies in certain numerical values. The deviation for the GD-01 measuring point, which monitored the arch roof settlement, was 9.64%. For horizontal convergence, the deviations for the left and right arch waist measuring points (GY-01 and GY-02) were 6.26% and 9.07%, respectively. Despite these discrepancies, the overall trends of the simulation results and the field monitoring data were generally aligned. This confirms the validity and reliability of the optimization scheme and demonstrates that the numerical simulation results can serve as effective technical guidance for tunnel construction.
6. Conclusions
This study investigates the impact of four typical construction methods on the deformation behavior of surrounding rock and the stress response of the support structure in a deep-buried soil tunnel located in Baota District, Yan’an City, Shaanxi Province. The methods analyzed include the double-sidewall pilot tunnel method, CD method, and three-step temporary arch method. All four methods proved effective in controlling deformation at critical locations, with the double-sidewall pilot tunnel method showing superior performance in alleviating crown uplift and restricting horizontal displacement. The CD method and three-step method followed closely in terms of controlling crown settlement.
An analysis of stress distribution revealed that all methods exhibited significant stress concentration at the crown bottom. The three-step temporary arch method, however, showed the lowest stress levels, indicating better structural coordination. The other methods maintained stress levels within design limits, ensuring compliance with safety standards. These findings underscore the effectiveness of the three-step temporary arch method in managing structural stress while providing a safer response compared to the other methods.
Considering deformation control, structural stress performance, construction efficiency, and economic factors, the three-step temporary arch method demonstrated the best overall performance. This method offers strong adaptability, ease of management, and high construction efficiency, making it particularly suitable for tunnel construction in V-grade surrounding rock conditions. Furthermore, numerical simulations aligned closely with field measurements, confirming the reliability and applicability of the simulation method in assessing the surrounding rock behavior. Based on these findings, the three-step temporary arch method is recommended for priority application in similar deep-buried, soil surrounding rock tunnel projects, due to its excellent performance and practical advantages.
Author Contributions
Conceptualization, Z.Z. and M.Z.; Data curation, L.Z. and L.W.; Methodology, Z.Z. and M.Z.; Formal analysis, L.W. and Y.H.; Investigation. L.Z. and Y.H.; Writing—original draft, M.Z. and Y.H.; Writing—review and editing, Z.Z. and L.Z.; Project administration, L.Z. and L.W.; Resources, Z.Z.; Supervision, Z.Z. and L.W.; Validation, M.Z. and Y.H.; Visualization, M.Z. and Y.H. All authors have read and agreed to the published version of the manuscript.
Funding
This study was supported by the Provincial Natural Science Research Project for Universities in Anhui Province (KJ2021A0611), the Science and Technology Plan of Housing and Urban-Rural Construction in Anhui Province (2020-F038), and Science and technology development project (HYB20240110, HYB20250019, HYB20250012).
Data Availability Statement
The data used to support the findings of this study are available from the corresponding author upon request.
Conflicts of Interest
Author Lei Zhang was employed by the company The First Engineering Co., Ltd., CTCE Group. Author Lin Wei was employed by the company Chengji Railway Engineering Technology Limited Company. The remaining authors declare that the research was conducted in the absence of any commercial or financial relationships that could be construed as a potential conflict of interest.
References
- Wang, L.; Shi, W.; Zhou, Y. Adaptive-passive tuned mass damper for structural aseismic protection including soil–structure interaction. Soil. Dyn. Earthq. Eng. 2022, 158, 107298. [Google Scholar] [CrossRef]
- Bian, K.; Liu, J.; Liu, Z.; Liu, S.; Ai, F.; Zheng, X.; Ni, S.; Zhang, W. Mechanisms of large deformation in soft rock tunnels: A case study of Huangjiazhai Tunnel. Bull. Eng. Geol. Environ. 2019, 78, 431–444. [Google Scholar] [CrossRef]
- Wang, F.N.; Guo, Z.B.; Qiao, X.B.; Fan, J.Y.; Li, W.; Mi, M.; Tao, Z.G.; He, M.C. Large deformation mechanism of thin-layered carbonaceous slate and energy coupling support technology of NPR anchor cable in Minxian Tunnel: A case study. Tunn. Undergr. Space Technol. 2021, 117, 104151. [Google Scholar] [CrossRef]
- Belachew, M.; Yamamoto, K.; Nichols, E.; Zhang, D.; Frost, J.D.; Arson, C. Ant nest geometry, stability, and excavation–inspiration for tunneling. Acta Geotech. 2024, 19, 1295–1313. [Google Scholar] [CrossRef]
- Morya, P.; Chansutham, T.; Phienwej, N.; Chanrungautai, S.; Inkoom, P.; Jongpradit, P. Design and construction of Map Kabao Tunnel, longest rail tunnel in Thailand. Geomech. Tunn. 2023, 16, 292–303. [Google Scholar] [CrossRef]
- Wang, P.; Xu, C.; Yin, Z.-Y.; Song, S.-X.; Xu, C.; Dai, S. A DEM-based Generic Modeling Framework for Hydrate-Bearing Sediments. Comput. Geotech. 2024, 171, 106287. [Google Scholar] [CrossRef]
- Yang, S.; Zhang, D.; Wang, M.; Li, J. Ground and tunnel deformation induced by excavation in pipe-roof pre-construction tunnel: A case study. Tunn. Undergr. Space Technol. 2023, 131, 104832. [Google Scholar] [CrossRef]
- Sun, Y.; Xu, S.; Xu, C.; Huang, W.; He, J.; Rong, Y.; Zheng, F.; Ding, L. Study on the Stress and Deformation of Rock mass surrounding the tunnel and Support Structure of Super Large Section Tunnels Based on Different Excavation Methods. Appl. Sci. 2024, 14, 7025. [Google Scholar] [CrossRef]
- Huang, Y.; Fang, T.; Wang, N. Excavation Method Comparison and Optimization for a Super Large Cross-Section Tunnel. Appl. Sci. 2024, 14, 6544. [Google Scholar] [CrossRef]
- Han, Y.; Wei, C.; Cui, M.; Xie, H.; Ou, Y.; Zhu, H.; Liu, T. Ground Settlement of Deeply Buried Two-Lane Tunnels with Large Cross-Sections Using Different Construction Methods. Appl. Sci. 2022, 12, 11105. [Google Scholar] [CrossRef]
- Zhao, C.; Lei, M.; Shi, C.; Cao, H.; Yang, W.; Deng, E. Function mechanism and analytical method of a double layer pre-support system for tunnel underneath passing a large-scale underground pipe gallery in water-rich sandy strata: A case study. Tunn. Undergr. Space Technol. 2021, 115, 104041. [Google Scholar] [CrossRef]
- Chen, F.; Zeng, K.; Li, X.; Xu, M.; Dai, H. Construction monitoring and numerical simulation of water-rich tuff soft rock tunnel. IOP Conf. Ser. Earth Environ. Sci. 2020, 455, 012163. [Google Scholar] [CrossRef]
- Zeng, K.; Yu, J.; Li, X. Construction Monitoring and Numerical Simulation Analysis of the Yangwujian Soft Rock Tunnel. IOP Conf. Ser. Earth Environ. Sci. 2019, 283, 012046. [Google Scholar] [CrossRef]
- Wu, S.; Wu, J.; Liu, D. Research on Construction Sequences and Construction Methods of the Small Clear-Distance, Double-Arch Tunnel under an Asymmetrical Load. Appl. Sci. 2023, 13, 8242. [Google Scholar] [CrossRef]
- Wu, X.; Li, Y.; Gong, M.; Wu, H.; Wu, Y. Deformation and Stress Law of Rock mass surrounding the tunnel for a Bifurcated Tunnel with a Super-Large Section: A Case Study. Appl. Sci. 2023, 13, 12852. [Google Scholar] [CrossRef]
- Zhang, Z.; Zhao, C.; Peng, L.; Zhang, X.; Lei, M. Research on the Stability of Shallow-Buried Large Cross-Section Tunnel by Construction Method Conversion. Front. Earth Sci. 2022, 10, 831169. [Google Scholar] [CrossRef]
- Li, S.; Zhang, Y.; Cao, M.; Wang, Z. Study on Excavation Sequence of Pilot Tunnels for a Rectangular Tunnel Using Numerical Simulation and Field Monitoring Method. Rock. Mech. Rock. Eng. 2022, 55, 3507–3523. [Google Scholar] [CrossRef]
- Song, Z.P.; Su, W.Y.; Tian, X.X.; Zhang, Y.W.; Zhou, G.N. Risk analysis of tunnel construction scheme change based on field monitoring and numerical analysis. Adv. Civ. Eng. 2021, 2021, 8888886. [Google Scholar] [CrossRef]
- Song, Z.; Tian, X.; Liu, Q.; Zhang, Y.; Li, H.; Zhou, G. Numerical analysis and application of the construction method for the small interval tunnel in the turn line of metro. Sci. Progress. 2020, 103. [Google Scholar] [CrossRef] [PubMed]
- Tang, X.; Wang, Y.; Li, Y. Numerical researches on the optimization of construction methods in tunnels with super large section. IOP Conf. Ser. Earth Environ. Sci. 2019, 304, 032024. [Google Scholar] [CrossRef]
Figure 1.
Detailed drawing of tunnel structure: (a) tunnel longitudinal section drawing; (b) tunnel lining drawing.
Figure 1.
Detailed drawing of tunnel structure: (a) tunnel longitudinal section drawing; (b) tunnel lining drawing.
Figure 2.
The section of the tunnel with a class V rock mass surrounding the tunnel is shown in the construction schematic diagram: (a) the three-step method; (b) the three-step temporary inverted arch method; (c) the double-side wall pilot tunnel method; (d) CD method.
Figure 2.
The section of the tunnel with a class V rock mass surrounding the tunnel is shown in the construction schematic diagram: (a) the three-step method; (b) the three-step temporary inverted arch method; (c) the double-side wall pilot tunnel method; (d) CD method.
Figure 3.
Model dimension drawing: (a) overall model size drawing; (b) tunnel model size.
Figure 3.
Model dimension drawing: (a) overall model size drawing; (b) tunnel model size.
Figure 4.
Model diagrams of tunnel excavation under different construction methods: (a) the three-step method; (b) the three-step temporary inverted arch method; (c) the double-side wall pilot tunnel method; (d) CD method.
Figure 4.
Model diagrams of tunnel excavation under different construction methods: (a) the three-step method; (b) the three-step temporary inverted arch method; (c) the double-side wall pilot tunnel method; (d) CD method.
Figure 5.
The deformation curves of each key position of the tunnel rock mass surrounding the tunnel with respect to the excavation length: (a) vault settlement; (b) arch-shaped bulge; (c) left arching of the waist horizontal displacement; (d) right arching waist horizontal displacement.
Figure 5.
The deformation curves of each key position of the tunnel rock mass surrounding the tunnel with respect to the excavation length: (a) vault settlement; (b) arch-shaped bulge; (c) left arching of the waist horizontal displacement; (d) right arching waist horizontal displacement.
Figure 6.
Peak principal stress contour maps of rock mass surrounding the tunnel under different construction methods: (a) the three-step method; (b) the three-step temporary inverted arch method; (c) the double-side wall pilot tunnel method; (d) CD method.
Figure 6.
Peak principal stress contour maps of rock mass surrounding the tunnel under different construction methods: (a) the three-step method; (b) the three-step temporary inverted arch method; (c) the double-side wall pilot tunnel method; (d) CD method.
Figure 7.
Stress cloud diagrams of the initial support after excavation using different construction methods: (a) the three-step method; (b) the three-step temporary inverted arch method; (c) the double-side wall pilot tunnel method; (d) CD method.
Figure 7.
Stress cloud diagrams of the initial support after excavation using different construction methods: (a) the three-step method; (b) the three-step temporary inverted arch method; (c) the double-side wall pilot tunnel method; (d) CD method.
Figure 8.
Stress cloud diagrams of anchor rods after excavation using different construction methods: (a) the three-step method; (b) the three-step temporary inverted arch method; (c) the double-side wall pilot tunnel method; (d) CD method.
Figure 8.
Stress cloud diagrams of anchor rods after excavation using different construction methods: (a) the three-step method; (b) the three-step temporary inverted arch method; (c) the double-side wall pilot tunnel method; (d) CD method.
Figure 9.
Tunnel monitoring and measurement: (a) monitoring point layout diagram; (b) on-site monitoring and measurement diagram.
Figure 9.
Tunnel monitoring and measurement: (a) monitoring point layout diagram; (b) on-site monitoring and measurement diagram.
Figure 10.
Cumulative value curve of vault settlement.
Figure 10.
Cumulative value curve of vault settlement.
Figure 11.
Cumulative value curve of horizontal displacement: (a) GY-01 measurement point; (b) GY-02 measurement point.
Figure 11.
Cumulative value curve of horizontal displacement: (a) GY-01 measurement point; (b) GY-02 measurement point.
Table 1.
Tunnel geological complexity table.
Table 1.
Tunnel geological complexity table.
| Starting Mileage | Ending Mileage | Length (m) | Rock Mass Surrounding the Tunnel Grade | Geological Complexity Level |
|---|
| DK353+ 842 | DK354+ 390 | 548 | V | More complex |
| DK354+ 390 | DK354+ 640 | 250 | IV | Moderate complexity |
| DK354+ 640 | DK354+ 800 | 160 | V | More complex |
| DK354+ 800 | DK354+ 980 | 180 | IV | Moderate complexity |
| DK354+ 980 | DK355+ 230 | 250 | V | More complex |
| DK355+ 230 | DK357+ 140 | 1910 | IV | Moderate complexity |
| DK357+ 140 | DK357+ 500 | 360 | V | Simple |
| DK357+ 500 | DK357+ 564.91 | 64.91 | V | More complex |
Table 2.
Comparison and analysis table of tunnel construction methods.
Table 2.
Comparison and analysis table of tunnel construction methods.
| Comparison Item | The Three-Step Method | The Three-Step Temporary Inverted Arch Method | The Double-Side Wall Pilot Tunnel Method | CD Method |
|---|
| Applicable rock class | Class III–V | Class IV–V | Class V–VI | Class IV–VI |
| Deformation control | Moderate | Good | Good | Better |
| Construction difficulty | Moderate | High | High | Relatively high |
| Construction procedure | Simple | Complex | Relatively complex | Relatively complex |
| Safety | Moderate | Relatively high | High | High |
| Project cost | Moderate | High | High | Relatively high |
Table 3.
Computational parameters of the numerical simulation model.
Table 3.
Computational parameters of the numerical simulation model.
| Material Classification | (GPa) | | (kN/m3) | (kPa) | (°) |
|---|
| Rock mass surrounding the tunnel | 0.20 | 0.4 | 19.7 | 45.6 | 25 |
| Initial support | 31.4 | 0.2 | 22.0 | — | — |
| Rock bolt | 210 | 0.3 | 78.5 | — | — |
| Advanced small pipe umbrella | 93 | 0.3 | 78.5 | — | — |
| Temporary support | 31.4 | 0.2 | 22.0 | — | — |
Table 4.
Table of simulated excavation steps for different construction methods.
Table 4.
Table of simulated excavation steps for different construction methods.
| Excavation Steps | The Three-Step Method | The Three-Step Temporary
Inverted Arch Method | The Double-Side Wall Pilot Tunnel Method | CD Method |
|---|
| First Step | Initial stress | Initial stress | Initial stress | Initial stress |
| Second Step | Activation of forepoling pipes | Activation of forepoling pipes | Activation of left forepoling pipes | Activation of left forepoling pipes |
| Third Step | Excavation of upper step | Excavation of upper step | Excavation of upper left pilot tunnel | Excavation of the upper left step |
| Fourth Step | Activation of primary support and rock bolts for the upper step | Activation of primary support, Rock bolts, and upper temporary invert for the upper step | Activation of primary support, rock bolts, and upper left temporary support for the left upper pilot tunnel | Activation of primary support, rock bolts, and upper left temporary support for the left upper step |
| Fifth Step | Excavation of the middle step | Excavation of the middle step | Excavation of the lower left
pilot tunnel | Excavation of the left middle step |
| Sixth Step | Activation of the primary support and rock bolts for the middle step | Activation of the primary support, rock bolts, and temporary arching for the middle step | Activation of the primary support, rock bolts, and left-side lower temporary support for the left-side lower guiding tunnel | Activation of the primary support, rock bolts, and left-side middle temporary support for the left-side middle step |
| Seventh Step | Excavation of the lower step | Excavation of the lower step | Activation of the right-side advanced small casing | Excavation of the left-side lower step |
| Eighth Step | Activation of the initial support and anchor bolts for the lower step | Activation of the initial support and anchor bolts for the lower step | Excavation of the right upper guide pit | Activation of the initial support, anchors, and left lower temporary support for the left lower bench excavation |
| Ninth Step | —— | Deactivation of the temporary arch | Activation of the initial support, anchor bolts, and right-side upper temporary support for the right-side upper pilot tunnel | Activation of the right-side advanced small pilot tube |
| Tenth Step | —— | Excavation of the right-side lower pilot tunnel | Excavation of the right-side upper step |
| Eleventh Step | Activation of initial support, anchor bolts, and temporary support on the right-side lower guide tunnel | Activation of initial support and anchor bolts on the right-side upper bench |
| Twelfth Step | Activation of advanced small guide pipes in the central section | Excavation of the right-side middle bench |
| Thirteenth Step | Excavation of the central upper bench | Activation of initial support and rock bolts for the right middle bench |
| Fourteenth Step | Activation of initial support and rock bolts for the central upper bench | Excavation of the right lower bench |
| Fifteenth Step | Excavation of the middle middle bench | Activation of initial support and rock bolts for the right lower bench |
| Sixteenth Step | Excavation of the lower bench in the central section | Temporary support passivation |
| Seventeenth Step | Activation of initial support for the lower middle step | —— |
| Eighteenth Step | Temporary support passivation |
Table 5.
The distribution and extreme values of the tension and compression stresses of the initial support after excavation using different construction methods.
Table 5.
The distribution and extreme values of the tension and compression stresses of the initial support after excavation using different construction methods.
| Construction Method | Tensile Stress (MPa) | Location | Compressive Stress (MPa) | Location |
|---|
| The three-step method | 22.32 | Vault | −41.56 | Arch springing |
| The three-step temporary inverted arch method | 34.22 | Vault | −45.11 | Arch springing |
| The double-side wall pilot tunnel method | 12.25 | spandrel | −31.66 | Arch springing |
| CD method | 22.79 | Vault | −30.97 | Arch springing |
Table 6.
The maximum and minimum values, as well as the distribution of the axial tension and compression stresses of anchor rods, after excavation using different construction methods.
Table 6.
The maximum and minimum values, as well as the distribution of the axial tension and compression stresses of anchor rods, after excavation using different construction methods.
| Construction Method | Tensile Stress (MPa) | Location | Compressive Stress (MPa) | Location |
|---|
| The three-step method | 540.19 | spandrel | −16.70 | Arch springing |
| The three-step temporary inverted arch method | 142.98 | spandrel | −22.48 | Arch springing |
| The double-side wall pilot tunnel method | 104.54 | spandrel | −26.34 | Arch springing |
| CD method | 181.09 | spandrel | −30.49 | Arch springing |
Table 7.
Comparison between numerical simulation results and on-site monitoring results.
Table 7.
Comparison between numerical simulation results and on-site monitoring results.
| Monitoring Items | Numerical Simulation (mm) | Monitoring and Measurement (mm) | Deviation (mm) | Percentage Deviation |
|---|
| Vault Settlement (GD-01) | −38.92 | −35.17 | 3.75 | 9.64% |
| Horizontal Displacement (GY-01) | 26.52 | 24.86 | 1.66 | 6.26% |
| Horizontal Displacement (GY-02) | −24.36 | −22.15 | 2.21 | 9.07% |
| Disclaimer/Publisher’s Note: The statements, opinions and data contained in all publications are solely those of the individual author(s) and contributor(s) and not of MDPI and/or the editor(s). MDPI and/or the editor(s) disclaim responsibility for any injury to people or property resulting from any ideas, methods, instructions or products referred to in the content. |
© 2025 by the authors. Licensee MDPI, Basel, Switzerland. This article is an open access article distributed under the terms and conditions of the Creative Commons Attribution (CC BY) license (https://creativecommons.org/licenses/by/4.0/).


