1. Introduction
In recent years, with the rapid development of the national economy and the increasingly complex engineering geological environment, the functional requirements of underground space have become more diverse, which has led to the significant expansion of the tunnel engineering scale [
1,
2]. In the current situation, in which the traditional drilling and blasting method is dominant, construction ventilation, as a key measure to maintain the air quality of underground working environments, has become an indispensable technical guarantee in tunnel construction [
3,
4,
5]. In the closed tunnel working space, the simultaneous operation of various heavy machinery often produces negative conditions, such as dust, noise disturbances, and unbearable high temperatures, which seriously endanger the physical and mental health of construction workers [
6,
7,
8,
9]. Therefore, it is particularly important to build an efficient and scientific ventilation system, which can not only ensure the sufficient supply of oxygen in the construction area and meet the normal operation needs of personnel and equipment, but also effectively adjust the temperature, control the dust concentration, and create a relatively comfortable and safe working environment for construction personnel. At the same time, the introduction of advanced and environmentally friendly construction technology and equipment can significantly reduce the negative impact of the project on the environment and effectively guarantee the health and safety of construction personnel [
10,
11,
12]. In the practice of tunnel construction, in addition to strengthening the ventilation system, we should actively explore and apply more green construction strategies, such as adopting low-noise and low-emission mechanical equipment, implementing wet operations to reduce dust generation, and strengthening real-time monitoring and the scientific management of environmental parameters on the construction site, so as to jointly promote the tunnel construction to move steadily towards a greener and healthier direction [
13].
Generally speaking, many scholars tend to use computational fluid dynamics (CFD) technology for the numerical simulation and theoretical analysis of tunnel ventilation, and on this basis, implement model verification and optimization to deepen the understanding of tunnel ventilation characteristics [
14,
15,
16]. Guo et al. [
17] innovatively developed an intelligent ventilation technology by combining CFD numerical simulation and fuzzy control theory, which successfully reduced the energy consumption of the original ventilation mode and significantly improved the ventilation efficiency. Yang et al. [
18], based on the Funiushan extra-long highway tunnel project, optimized the structural parameters of the wind chamber through numerical simulation, determined the optimal structural configuration with the improvement of the ventilation efficiency of the axial flow fan as the core, and comprehensively evaluated the overall ventilation efficiency. Chen et al. [
19] and others combined the finite difference method and finite element software, considered the initial ground temperature distribution and heat exchange in the tunnel face, and established a numerical model that can quickly calculate the longitudinal temperature field in tunnel construction environments. Ren et al. [
20] designed an adaptive ventilation control system, which uses artificial neural network to accurately capture the complex relationship between the operating frequency of tunnel fans and environmental parameters. The distribution of methane and hydrogen sulfide during the excavation of the Huayingshan tunnel is simulated by Ansys Fluent 2022R1, and the layout of gas monitoring sensors is optimized. Zhang et al. [
21], based on the ventilation technology of the wind chamber relay construction used in the Jiufengshan Tunnel of Qu-Ning Railway as the practical basis, used numerical simulation technology to deeply explore the specific effects of the wind chamber length, partition setting, and fan layout on the ventilation efficiency of axial flow fans. Through in-depth comparative analysis, this study revealed the significant differences between traditional forced ventilation and wind chamber relay ventilation in the internal CO migration characteristics of the Jiufengshan Tunnel of Qu-Ning Railway. Zhao et al. [
22] systematically studied the concrete influence of four factors, such as different duct diameters, the distance from the outlet of the duct to the working face, the hanging position of the duct, and the gap between the duct and the tunnel wall, on the Nevas distribution law of the tunnel by using the scientific method of orthogonal experimental design. Lu et al. [
23], in order to solve the problem of the thermal damage caused by hot air in the deep-buried high-speed railway tunnel to operators, developed a theoretical model for the front temperature changing with distance when the hot air spreads in the tunnel is, which is derived according to the law of conservation of energy, and CFD software is used to simulate the air temperature change along a deep-buried high-speed railway tunnel under different working conditions. Qiu et al. [
24] used AHP-CRITIC to calculate combination weight and improved the TOPSIS evaluation model, which can be effectively applied to the ventilation system of phosphate rock. Yang et al. [
25], based on the theoretical framework of computational fluid dynamics, compared and studied the sewage discharge efficiency in tunnels under various ventilation conditions; in Wu et al. [
26], through a three-dimensional numerical calculation technology, the specific distribution mode of airflow and the characteristics of resistance along a snake-shaped curved tunnel under different working conditions are deeply discussed. Tao et al. [
27], aimed at the ventilation conditions in the construction of an extra-long railway tunnel with an inclined shaft and double positive holes, adopted wind cabin ventilation to effectively extend the ventilation distance and improve the ventilation efficiency; Zhang et al. [
28] made a detailed study on the external condition parameters of a tunnel ventilation system and made a systematic statistics and comparative analysis on the dust suppression effect and sewage discharge efficiency under different layout forms. Zheng [
29] used the CFD numerical method to simulate the influence of many factors on pollutant migration and dilution in the ventilation process of double-track railway tunnel construction by drilling and blasting. The above have opened up a new method of ventilation in the construction of long and extra-long tunnels, and the research results can provide useful references and technical support for similar tunnel projects.
As a multi-criterion decision analysis method, the TOPSIS theory has been applied to different aspects of tunnel construction by many scholars at home and abroad. In order to evaluate the risk of water inrush during tunnel construction, Kong et al. [
30] introduced an innovative risk assessment method (FAHP-I-TOPSIS) to improve the reliability of on-site risk assessment. In order to select the most suitable gas explosion overpressure mitigation measures, Xu et al. [
31] developed an AHP-TOPSIS decision model based on CFD, taking the selection of gas explosion overpressure mitigation measures for underground integrated pipeline corridor (UUT) as an example. In order to ensure the stability of the tunnel, Wu et al. [
32] took the surface deformation, tunnel convergence deformation, and surrounding soil stress as evaluation indexes and established a model of fuzzy analytic hierarchy process of ordered performance (FAHP) and gray correlation technology (TOPSIS) based on the similarity of ideal solutions to realize the multi-index evaluation of tunnel stability. In order to improve the blasting effect of tunnels crossing under existing buildings, Zhang et al. [
33] innovatively proposed a three-level index system and 15 key indicators and combined them with the LFPP-FAHP model to evaluate the blasting scheme. But, the use of TOPSIS related models to solve the problems of construction ventilation is rarely mentioned by domestic and foreign scholars.
This paper innovatively combines an orthogonal experimental design with an improved TOPSIS theory to achieve a major breakthrough. The synergistic improvement of experimental efficiency and decision-making accuracy is improved. The key parameter combination is efficiently screened by the orthogonal experiment and then the multi-index is comprehensively sorted by TOPSIS combined with the entropy weight method (objective weight) and AHP (subjective weight), which solves the defects of traditional methods ‘emphasizing experiment and ignoring decision-making’ or ‘emphasizing subjectivity and ignoring data’ [
34,
35,
36]. Moreover, in the case of this article, the applicability of the method is well verified.
2. Project Overview
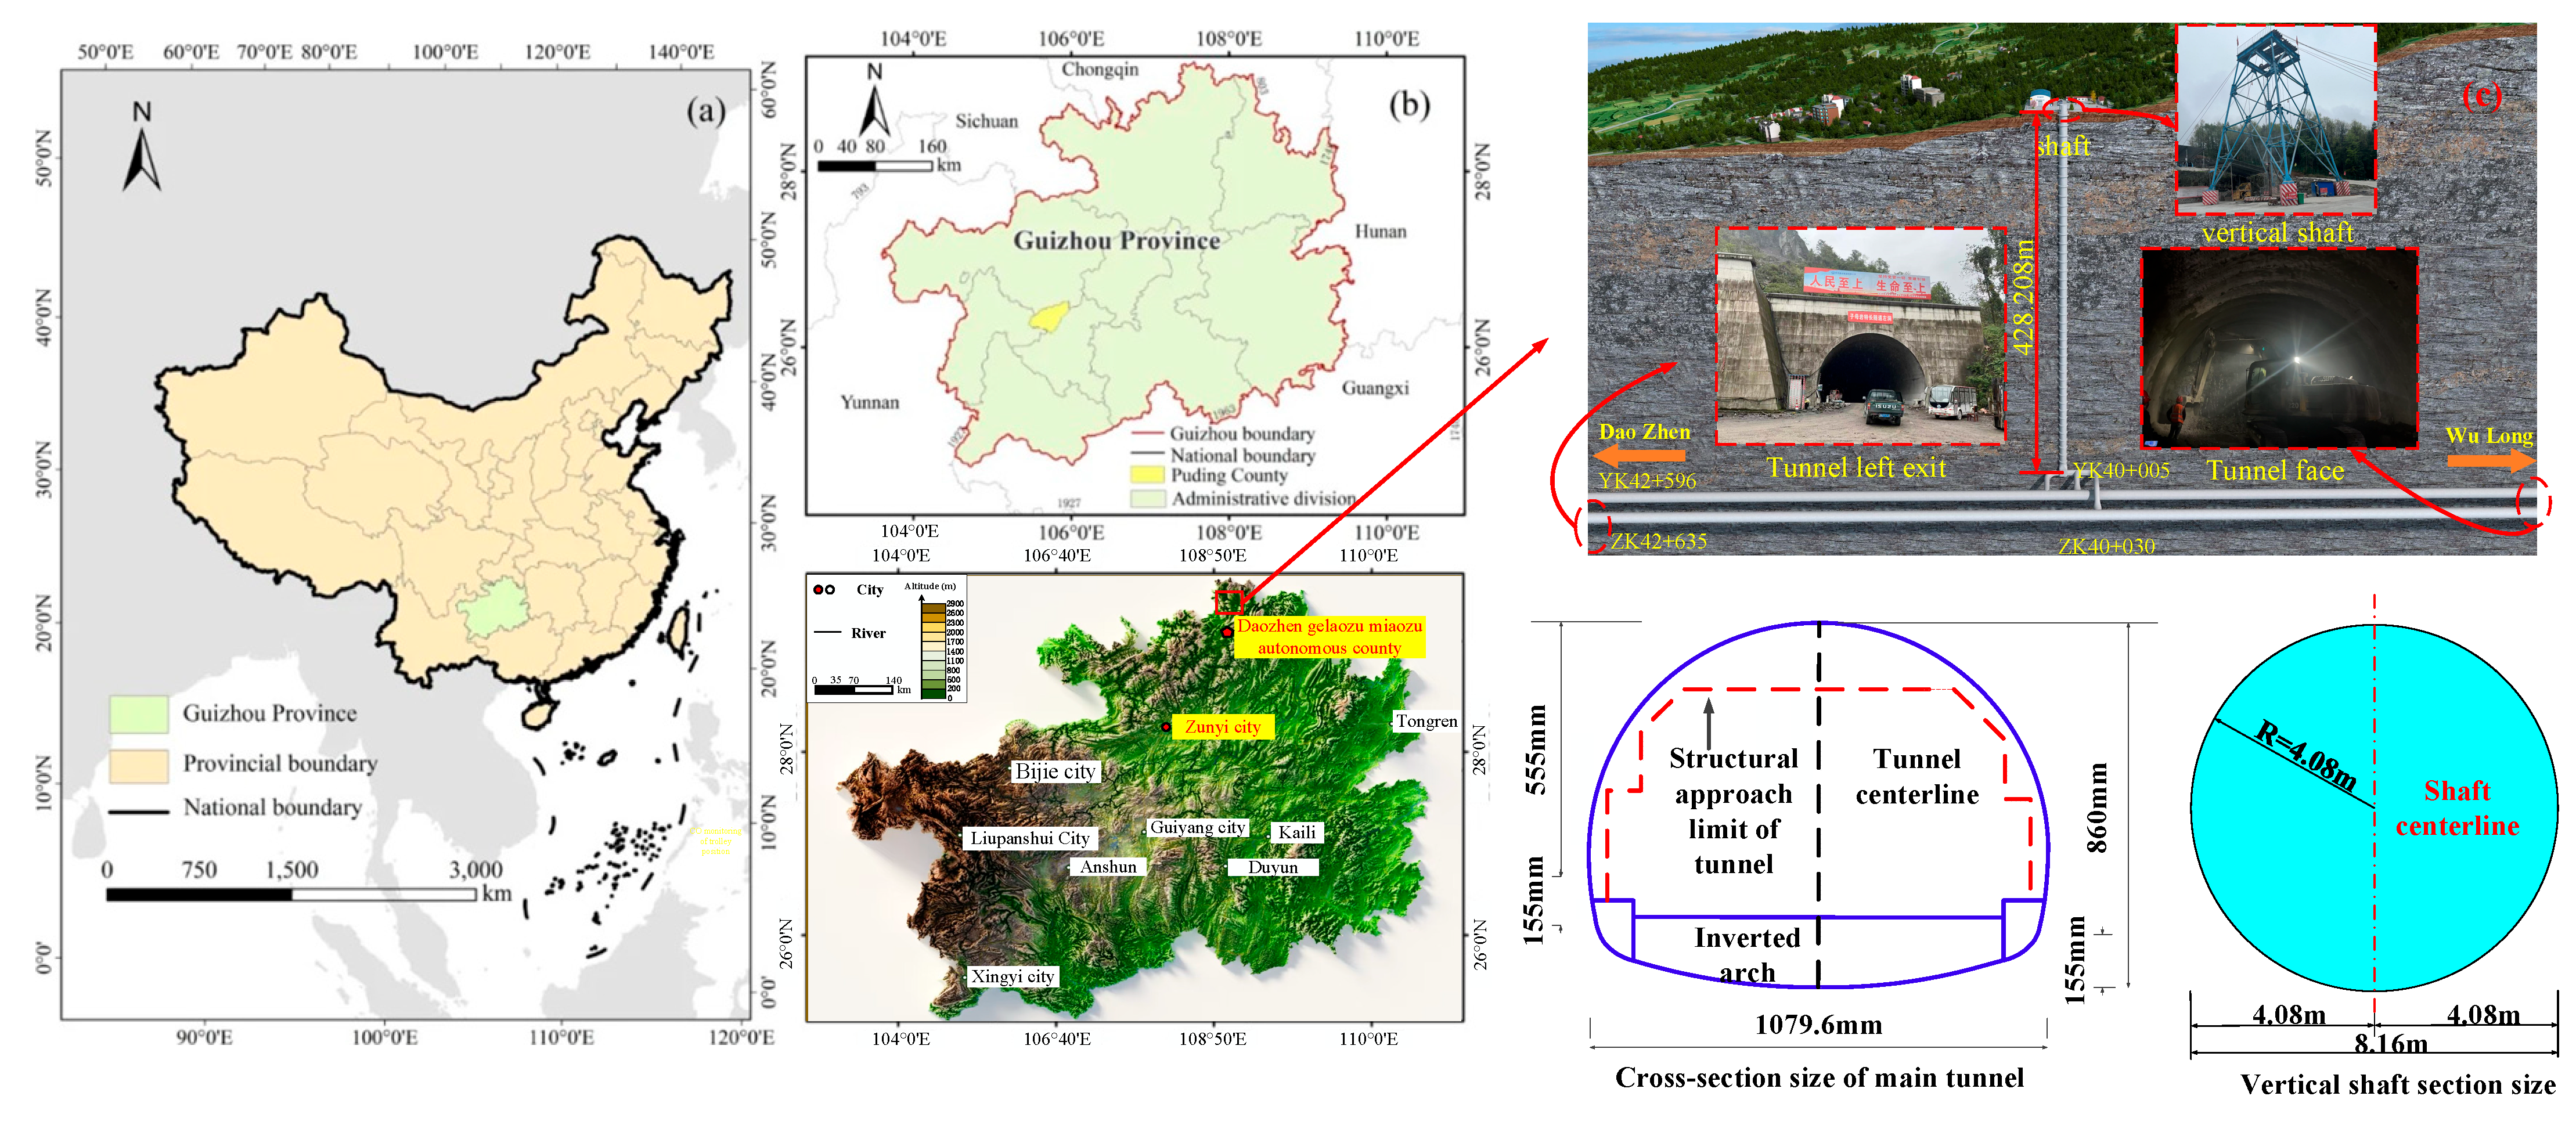
The Zimuyan tunnel is located at the junction of NE and SE structures in Sichuan and Guizhou, in Luolong Town, Daozhen County. As a separated extra-long tunnel, the starting pile number of the Guizhou tunnel section is ZK37 + 287/YK37 + 203, and the ending pile is ZK42 + 635/YK42 + 596, with a length of 5348 m/5393 m and a maximum buried depth of about 695 m. The plane alignment of the left entrance end of the tunnel is located on a curve, the radius of the circular curve is R = 961 m, the junction of Chongqing and Guizhou is a straight line, and the plane alignment of the exit end is located on a straight line. On the right, the plane alignment of the entrance end is on the curve, the radius of the circular curve is
R = 959 m, the junction of Chongqing and Guizhou is on the straight line, and the plane alignment of the exit end is on the straight line. The left and right sides of the tunnel are single-sided slopes, with a left longitudinal slope of 1.75% and a right longitudinal slope of 1.77%. Due to the long-term in situ stress, the tunnel site area is affected by multi-stage tectonic action, forming a structural strain image with many folds, complex faults, and a clear connection relationship. The vegetation at the holes at both ends is lush, mainly trees and shrubs. The cave body mainly passes through the central canyon area of the South Qinling Mountains, and the terrain fluctuates greatly, with an elevation of 775–914 m and a relative height difference of about 139 m. The shaft is located at 40 m on the right side (facing the direction of large mileage) of the right line tunnel YK40 + 021. The air outlet of the shaft intersects with the right tunnel at YK40 + 040, and the air outlet of the shaft intersects with the right tunnel at YK40 + 005. The air outlet divides the right tunnel into two sections of 2802 m and 2591 m, and the shaft depth is 428.208 m. The smoke outlet of the shaft intersects with the left tunnel at ZK40 + 030. The smoke outlet divides the left tunnel into two sections of 2743 m and 2605 m, with a radius of
R = 3.2 m and an area of 30.1 m
2. The detailed information is shown in
Figure 1.
3. Field Monitoring
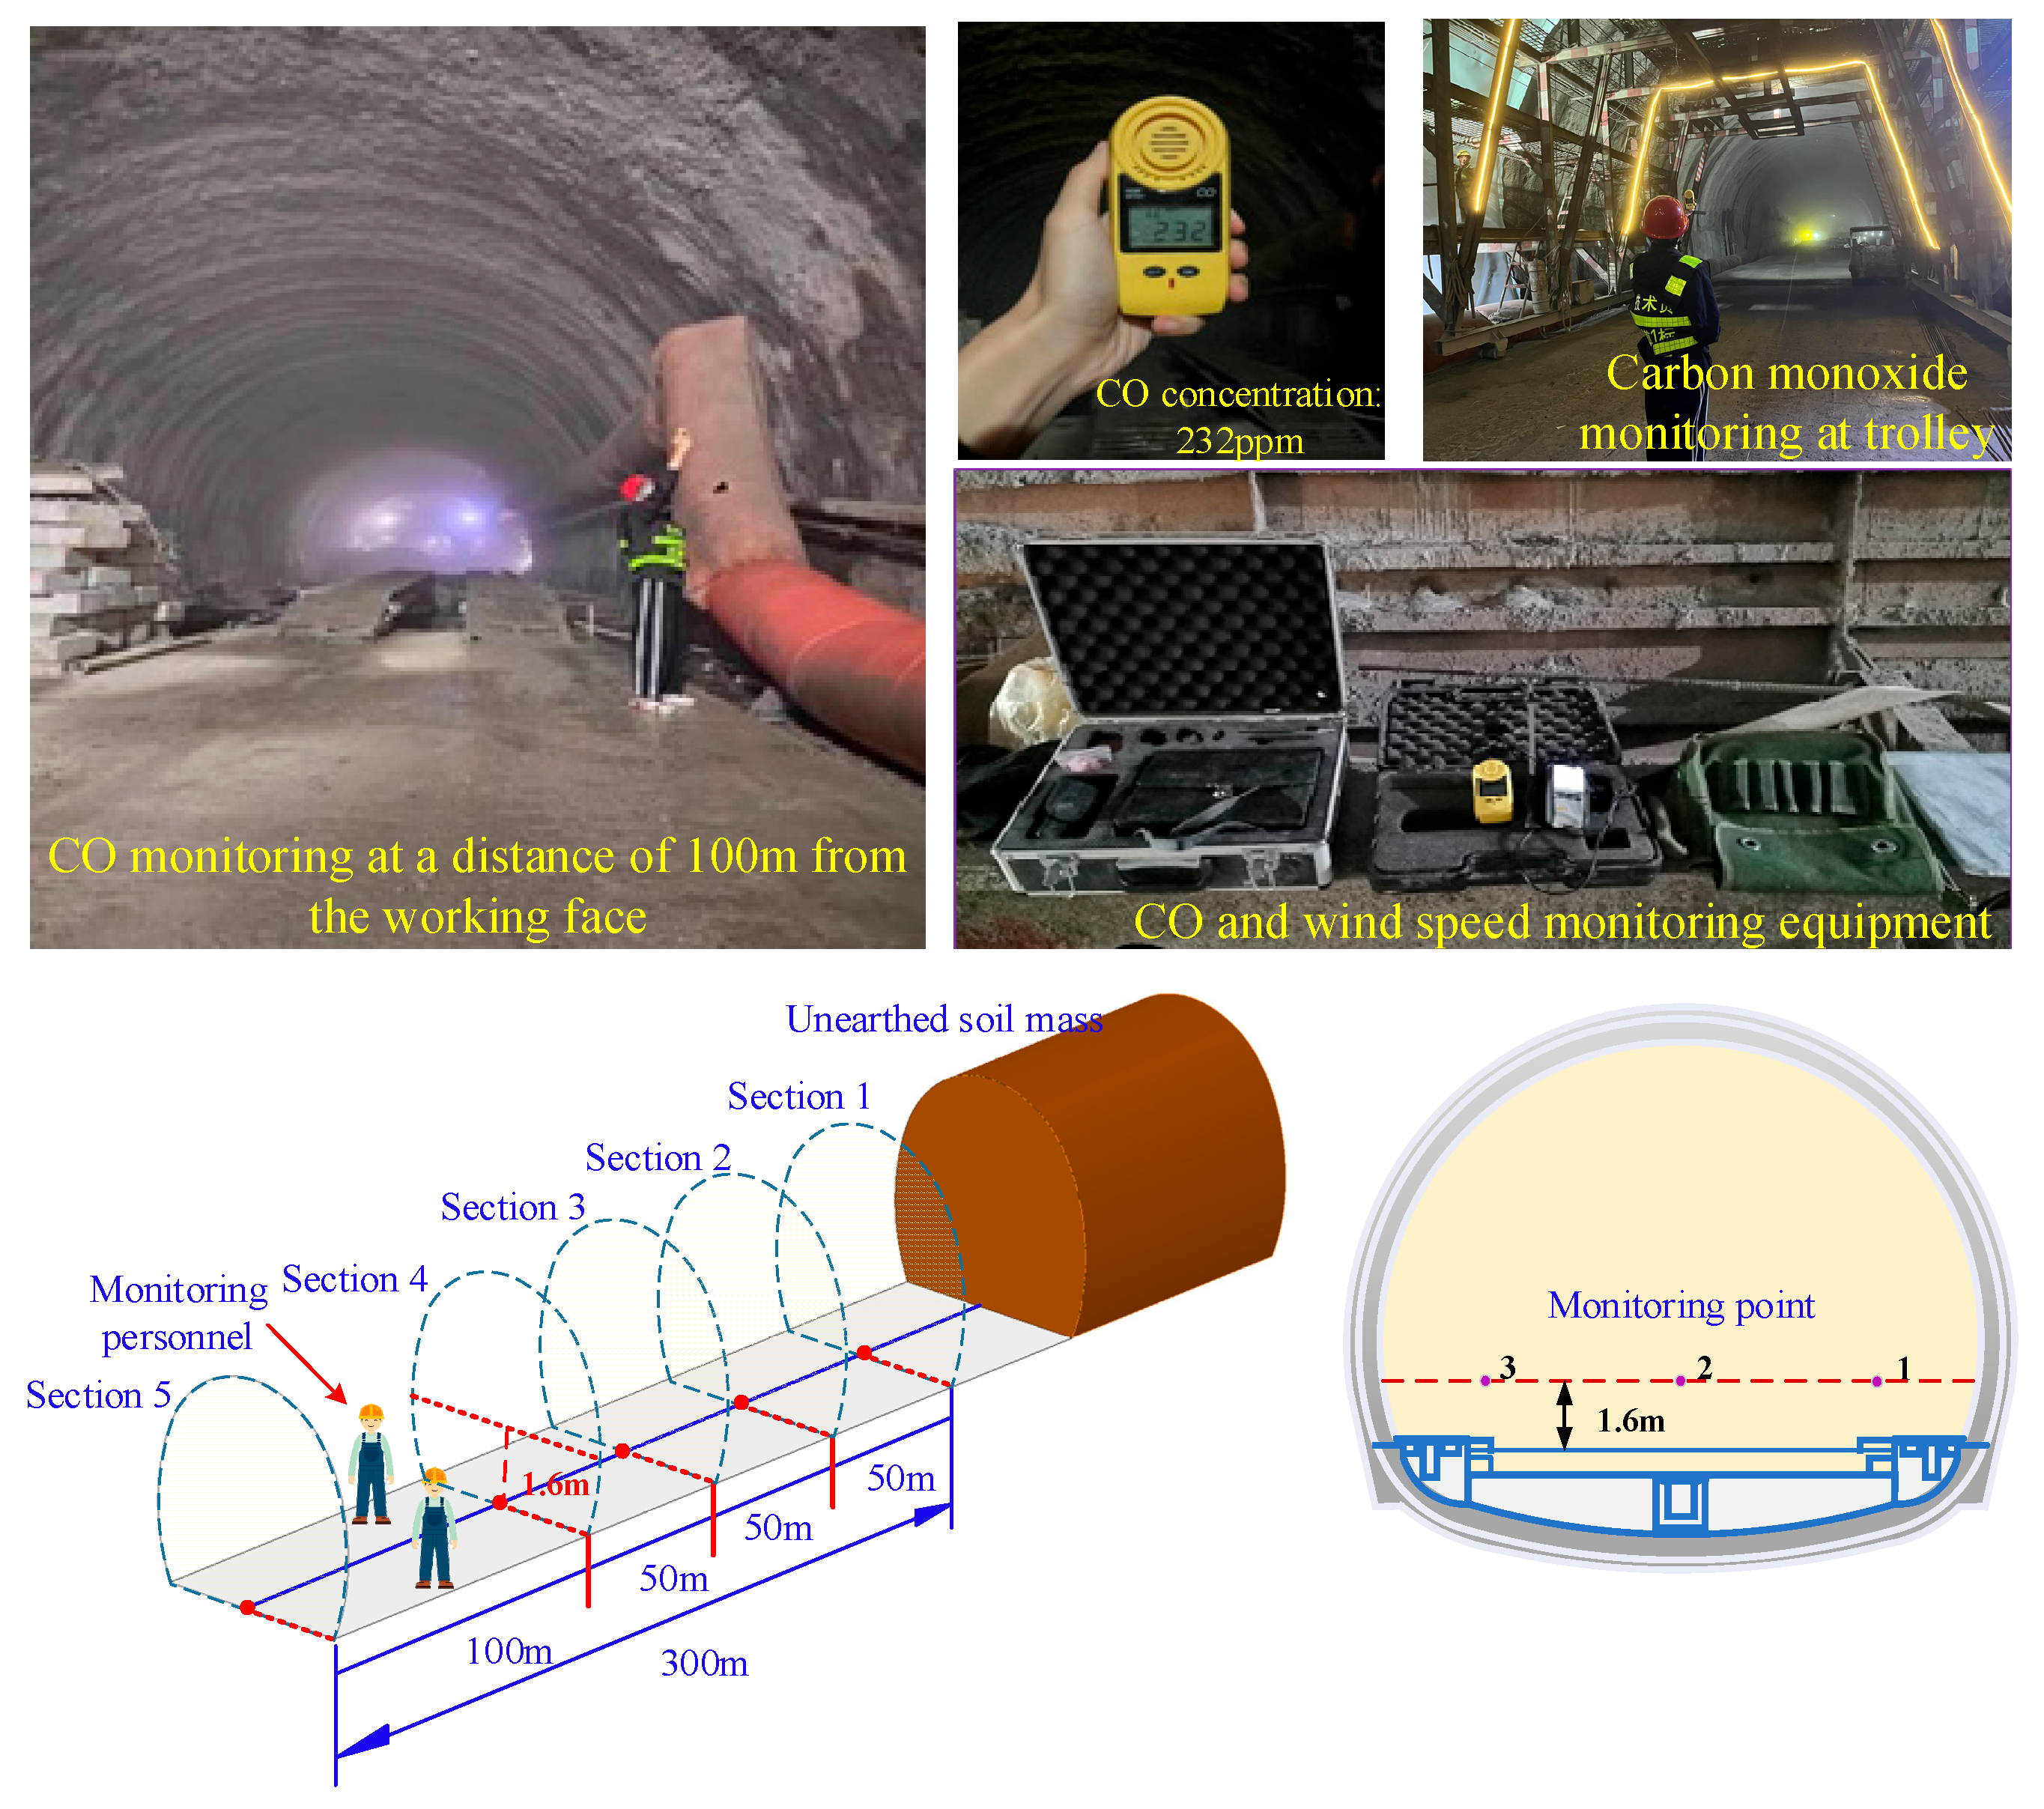
The diameter of the air duct in the tunnel is 1.6 m, the distance between the air outlet and the working face is 15 m, and the height arrangement of the axial air duct is 4 m. We arrived at the designated test section position in advance before each tunnel construction blasting, and made preparations for equipment assembly and measurement. After the tunnel blasting, on the premise of safety, we started the measurement plan to conduct on-site monitoring for each measurement one by one and recorded the blasting time of the tunnel and the start time of the monitoring operation. The on-site monitoring is shown in
Figure 2.
Five sections, 50 m, 100 m, 150 m, 200 m, and 300 m away from the tunnel face, were set within 300 m. The monitoring was started at the breathing height, and the CO concentration was monitored with EM-20 carbon monoxide monitor. Three monitoring points were set in each section, and the average values of the three monitoring points were taken to record the data. Record the data of CO concentration within 30 min, for a total of one set of data, as shown in
Figure 2.
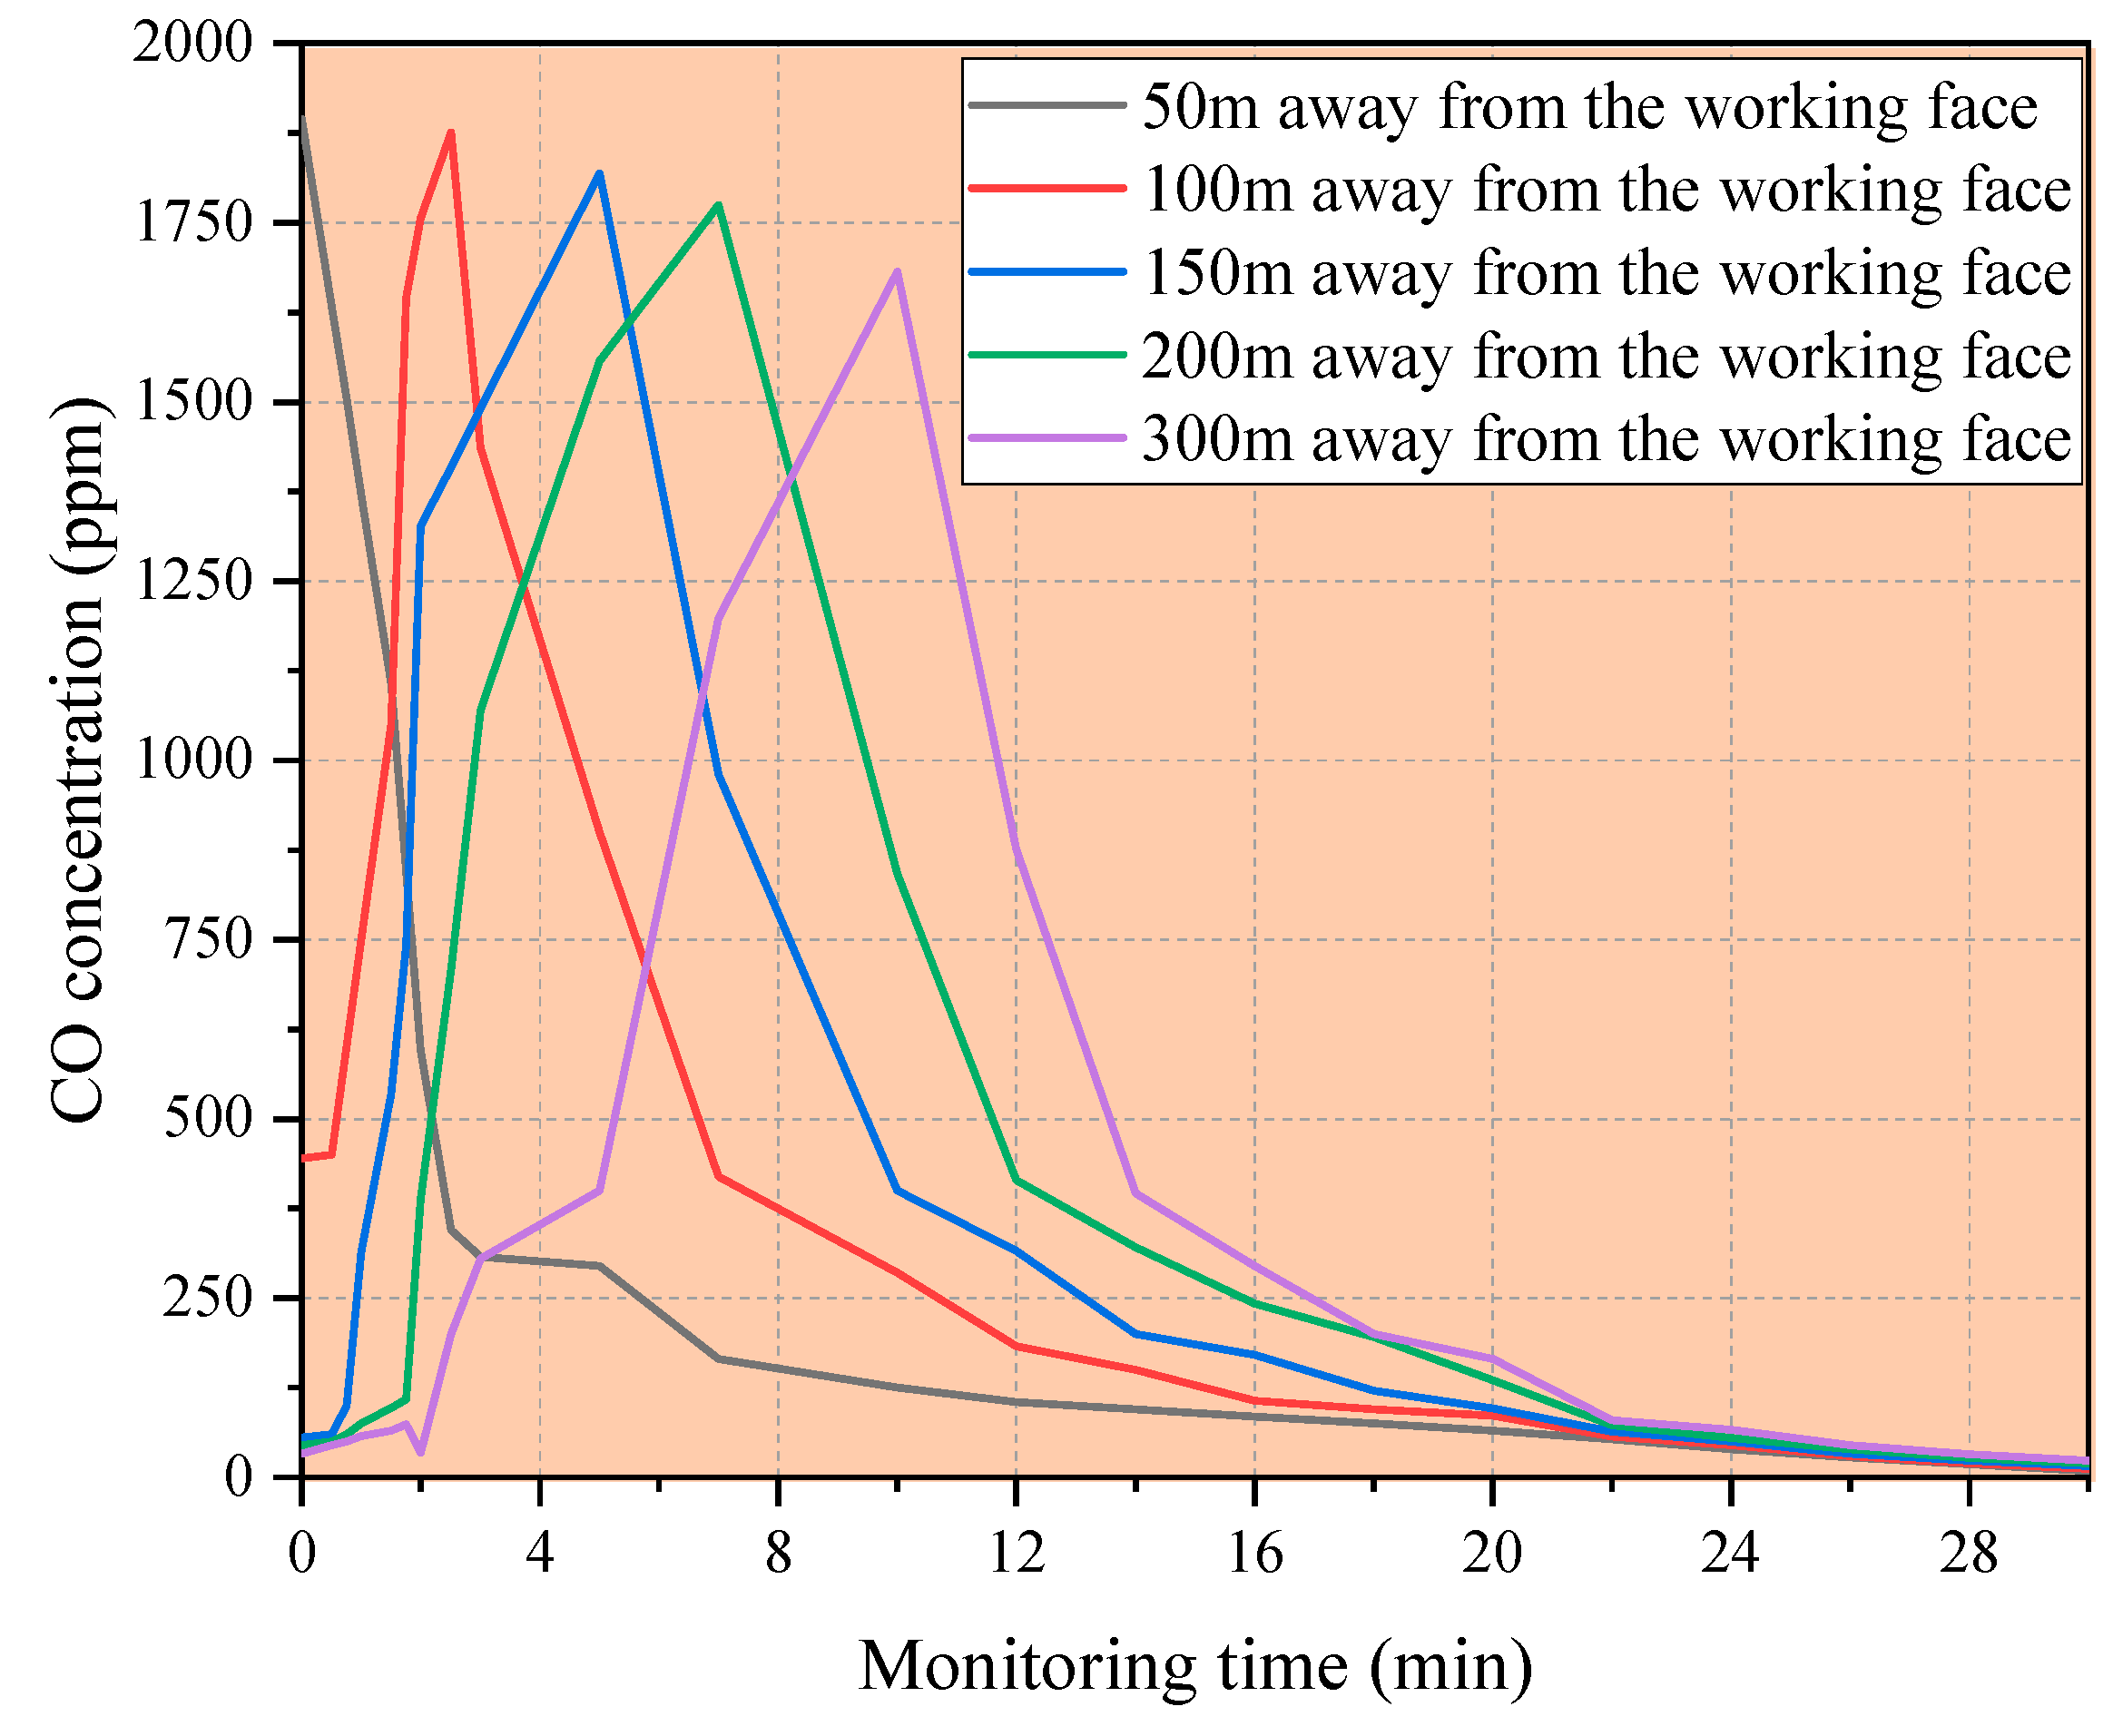
The data obtained by on-site CO concentration monitoring are plotted as shown in
Figure 3. After blasting, the concentration of CO in each monitoring section in the main tunnel of the Zimuyan tunnel gradually increased with time. The concentration of the CO decreases with the distance from the working face, and the increase is smaller at the same time. The data in
Figure 3 reveal the migration, dilution, and diffusion process of the CO driven by tunnel airflow, in which the peak value of the CO concentration gradually decreases with its migration outside the tunnel, clearly showing the dispersion effect of the “advection” migration and “diffusion” of pollutants in the discharge process. During the excavation of the heading face of the main tunnel, the influence range of the blasting smoke reached 86.16 m, so a significant CO concentration was detected at the beginning of the section 50 m away from the heading face, which was close to 1908 ppm in the direct action area of blasting smoke. Subsequently, the change in the CO concentration in each section showed a trend of a sharp increase at first, and then gradually slowed down until it was stable, which was particularly significant within 30 s after the start of the ventilation, indicating the rapid mixing and diffusion under the initial action of the airflow.
The data obtained by the on-site CO concentration monitoring are plotted as shown in
Figure 3. After 30 s of ventilation, the peak value of the CO concentration began to migrate away from the tunnel face, which showed that the CO concentration at the 100 m section began to rise. However, the section farther away from the tunnel face kept a low level of CO concentration. When the ventilation time is extended to 500 s, the CO concentration in the 50 m section has been effectively reduced to below 100 ppm, while the 300 m section has become a new area where the CO concentration rises rapidly. After ventilation for 600 s, the 300 m section reached its peak concentration of about 1678 ppm and then followed a similar downward trend to the first four sections.
There is a time lag effect in the process in which the CO concentration in the first four sections drops from the initial peak to the safe level, which reflects the limitation of the airflow on the diffusion speed of pollutants. Farther away from the tunnel face, the impact of the airflow on the environment and the time required for pollutants to be diluted will increase accordingly. Finally, after 1200 s of ventilation, the CO concentration in the remaining sections of the tunnel fell below the allowable concentration value stipulated by the industry.
4. Theoretical Method
The TOPSIS theory (technique for order preference by similarity to ideal solution) is a commonly used multi-attribute decision analysis method, also known as the ranking method of approaching the ideal solution or the optimal (maximum) and inferior (minimum) solution distance method [
29]. This theory ranks the evaluation objects according to the calculation results of the closeness between them and the idealized targets. The improved TOPSIS evaluation method is innovative on the basis of the classical method by combining the weighting strategy of the entropy weight method and analytic hierarchy process, so as to use the original data information more objectively and accurately to capture and quantify the subtle differences between the evaluation schemes and between them and the optimal scheme [
31]. This improvement abandons the traditional subjective weight setting and realizes the optimization and upgrading of the TOPSIS evaluation method, making it a more scientific and comprehensive evaluation method. This method combines the advantages of objective weighting (entropy weight method) and subjective weighting (analytic hierarchy process), making the evaluation process more scientific, reasonable, and accurate [
37,
38].
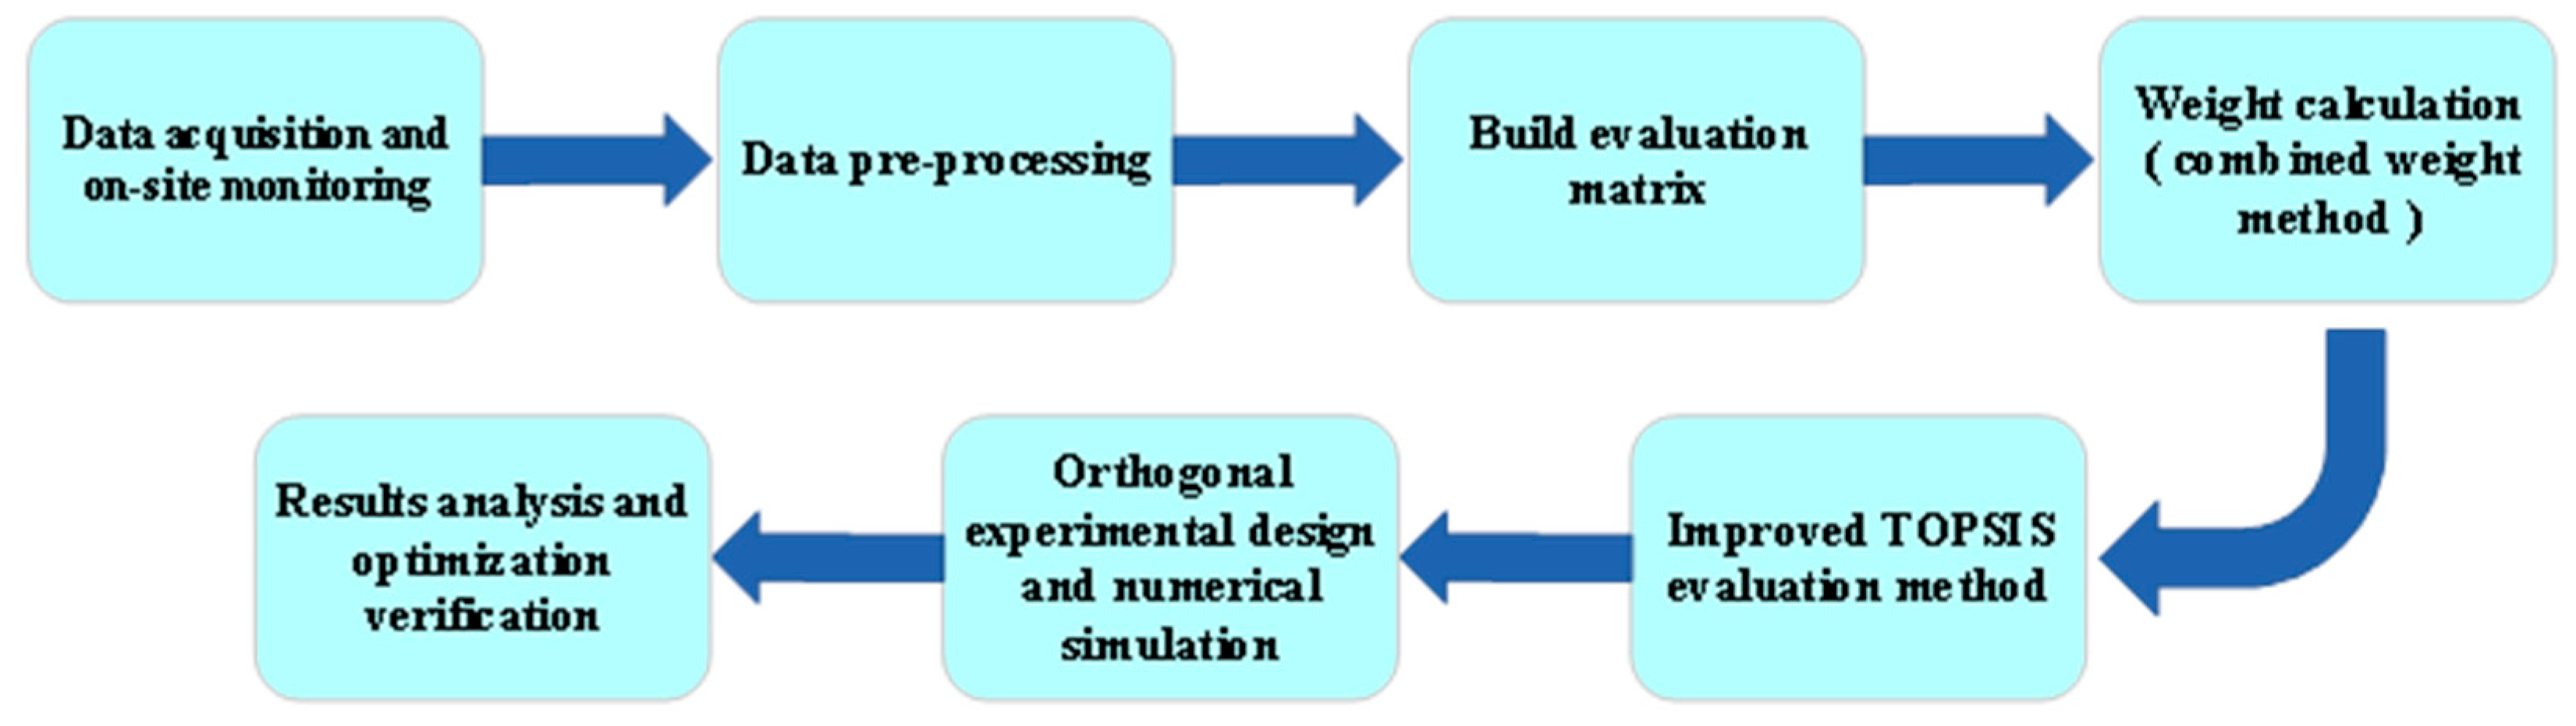
Based on the improved TOPSIS theory, this study constructs a rigorous scheme evaluation process to ensure that the optimal design of the tunnel construction ventilation has high reliability in theory and engineering application. Through the on-site monitoring of the tunnel (CO concentration and wind speed), the data are obtained, and the data are normalized and standardized to eliminate dimensional differences, so as to construct a multi-index evaluation matrix and provide data support for subsequent evaluation. In order to achieve the purpose of taking into account the objectivity of data and the subjective experience of experts, this study organically integrates the entropy weight method and the analytic hierarchy process to form a comprehensive weight system. With the help of this weight system, the score of each scheme is calculated by improving the TOPSIS method, and the scientific ranking and optimization are realized. At the same time, the orthogonal test design is used to carry out the system variable combination experiment on the key parameters of the air duct layout, and the numerical simulation is used to reveal the influence of each parameter on the ventilation flow field and CO diffusion characteristics. Each link supports each other, which jointly verifies the significant advantages of the optimization scheme in improving ventilation efficiency, reducing harmful gas concentrations, and ensuring construction safety.
4.1. Improve TOPSIS Theory
(1) Index forward processing
In the process of the evaluation, first of all, it is necessary to deeply study and analyze the original data in the evaluation indicators to determine the types of each indicator, which may cover extremely small indicators, intermediate indicators, and indicators in a specific interval. Subsequently, according to the different types of indicators, corresponding forward processing methods are adopted to ensure that all indicators have a unified trend and direction in the evaluation process.
(2) Data preprocessing
To standardize the index data that have been processed forward, we aim for unifying all index values into a dimensionless form, which is convenient for the subsequent horizontal comparison and in-depth analysis. Among them, the very small indicators refer to those types of indicators whose smaller values are better to the achieve evaluation goals or meet expectations. In the evaluation process of these indicators, smaller values represent a better performance or more ideal state.
Intermediate indicators refer to those indicators whose expected values are in a moderate range, rather than extreme values (too high or too low).
The interval index refers to the best performance when the expected value is taken from a specific interval in the evaluation process; that is, when the index value falls within this specific interval, the performance of the evaluation object is considered to be the best.
(3) Constructing a forward initial matrix
In the case where there are n objects to be evaluated and m evaluation indexes, the data after the index forward processing can be arranged in a given order to form a matrix structure containing n rows and m columns. This matrix is called forward matrix
X, which contains the forward values of all the objects on various indexes, as shown in the following formula.
(4) The normalized matrix is further standardized to generate a standardized matrix
Z.
(5) In the process of evaluation, in order to compare and choose, it is necessary to determine an optimal scheme; that is, the scheme with the best performance in all the objects to be evaluated. At the same time, it is also necessary to determine the worst scheme; that is, the scheme with the worst performance in all indicators. These two schemes will be used as reference points for subsequent analysis and decision-making.
The optimal scheme
W+ is a vector consisting of the maximum value of each column element in matrix
W:
The worst scheme
W− is a vector consisting of the minimum value of each column element in matrix W:
(6) In order to measure the performance of each evaluation object, we need to quantify their proximity or deviation from the optimal scheme and the worst scheme. This closeness can quantitatively represent the similarity or distance between each evaluation object and these two extreme schemes.
(7) Determine the specific score under the evaluation condition
4.2. Combination Weighting Method
In the optimal selection analysis of the tunnel forced ventilation scheme, it is a crucial step to accurately determine the weight calculation of each evaluation index, which is directly related to the accuracy of the evaluation results and the effectiveness of the practical application. In order to ensure the fairness and accuracy of the prediction results and avoid the deviation caused by subjective or objective factors, we usually adopt the method of combination weighting to comprehensively evaluate. In view of the above background, we innovatively integrated the analytic hierarchy process (AHP) and the entropy weight method as a scientific method to optimize the weight of evaluation indicators. The AHP constructs a hierarchical structure model through experts’ empirical knowledge and subjective judgment and gives subjective weight to each index. The entropy weight method automatically calculates the objective weight of each index according to the inherent discrete characteristics of the data. This combination strategy skillfully balances the weight distribution between subjective cognition and objective data, thus enhancing the comprehensive coverage of the evaluation system and the high accuracy of the results.
(1) Entropy weight method to determine the objective weight
The entropy weight method’s, as a highly respected objective weighting technology, core essence lies in assigning its weight according to the amount of information contained in each evaluation index. This method is based on a key assumption; that is, in the evaluation system, the weight of indicators should directly reflect the degree of difference, and the greater the difference, the heavier the weight. Specifically, when an evaluation index shows great differences among different evaluation objects, it means that the index can provide more valuable information, so it should be given greater weight. On the contrary, if the difference in an evaluation index is limited, that is the degree of dispersion between data points is not high, this means that the index carries less effective information. Therefore, in the process of weight distribution, such indicators should be given lower weights accordingly.
Through the entropy weight method we can objectively and quantitatively determine the weight of each evaluation index in the tunnel forced ventilation scheme to ensure the accuracy and effectiveness of the evaluation results. The application of this method not only helps us to understand the importance of each evaluation index in the evaluation system more comprehensively but also provides a scientific basis for the selection of the optimal ventilation scheme.
Step 1: Forward conversion is performed by the matrix shown below.
Step 2: Implement the standardized conversion process of the forward matrix.
The standardized matrix can be obtained from the following:
Calculate the ratio of the
j-th sample value to the sum of all sample values of the index in the
i-th index.
Step 3: Calculate the information entropy of each evaluation index.
Step 4: Assign the index weight.
(2) Analytic hierarchy process to determine the subjective weight
The analytic hierarchy process (AHP) is an empowerment strategy based on subjective judgment, the core of which is to logically decompose the influencing factors closely related to the goal and then build a clear hierarchical structure framework according to the internal relations between these factors. Through this step, the complex decision-making problem is disassembled into several manageable sub-problems, and the qualitative factors that were originally difficult to quantify are transformed into operational quantitative data by pairwise comparison, thus enhancing the rationality of the decision-making process and the effectiveness of the final result to a considerable extent.
Step 1: Make clear the hierarchical logical relationship among the influencing factors, and construct a system framework with a clear hierarchy and clear structure.
Step 2: Construct a judgment matrix.
Suppose there is a judgment matrix
r, in which the element
indicates the importance of the i-th index relative to the j-th index in the evaluation system. According to the preset importance comparison table (which lists the quantified values of different importance levels in detail), we can construct the corresponding judgment matrix R by comparing each evaluation index one by one.
Step 3: Calculate the maximum eigenvalue λmax of the judgment matrix R, and then perform the consistency check process to ensure that the constructed judgment matrix is logically consistent and reasonable.
Step 4: Weight calculation.
In order to overcome the possible deviation caused by a single calculation method and ensure that the calculation of the evaluation index weight is reasonable and scientific, this paper adopts a diversified strategy and specifically uses three different methods, including the arithmetic average method and eigenvalue method, to calculate the weight, respectively. Then, through a comprehensive and in-depth comprehensive analysis, this paper finally selects the calculation results obtained by the eigenvalue method as the basis for determining the weight.
(3) Implementing the combination weighting strategy of evaluation indicators.
In view of the fact that the entropy weight method focuses on determining the weight through the objective analysis of the information differences among the influencing factors of the evaluation object, which mainly reflects the objective information of the data itself, the analytic hierarchy process (AHP) relies more on experts’ subjective experience and judgment to set weights. Therefore, a more comprehensive and balanced combination weight can be formed by combining these two subjective and objective weight methods. In the specific calculation, we can operate according to the combined weight formula proposed in the literature, which aims to integrate subjective and objective weights. The specific form is as follows:
5. CO Diffusion Analysis Based on Orthogonal Test
As a representative method of the partial factor design, the orthogonal test significantly reduces the cost and shows a high efficiency on the premise of maintaining the reliability of the test. This method effectively reduces the experimental scale by selecting the combination of factors, while retaining key information. It is an important means to optimize the experimental process and improve the research economy. In order to ensure the “uniformity” and “neatness” of the orthogonal experiment, thus enhancing its representativeness and reliability, the orthogonal experiment must follow two core requirements: first, all levels of each factor should participate in the experiment in equal amounts to ensure that the effects at all levels are evaluated fairly; second, the horizontal combination between any two factors should also appear in the same amount, so as to eliminate the interference of the combination effect on the evaluation of the single factor effect.
One of the core concepts of the orthogonal experiment is the orthogonal table, which is a tabular tool specially designed for multi-factor experiments, and it runs through the whole process of the experiment’s arrangement and result analysis. The identification system of the orthogonal table is unique, and it is named by . Among them, “L” is the English abbreviation of the orthogonal table; “n” represents the total number of tests that need to be carried out in the orthogonal table design; “q” indicates the different levels taken by each factor; and “m” means the maximum number of factors that can be accommodated in the orthogonal table—that is, the number of columns, which fully embodies the efficiency and convenience of the orthogonal table in complex experimental arrangements.
5.1. Establishment of Test Model
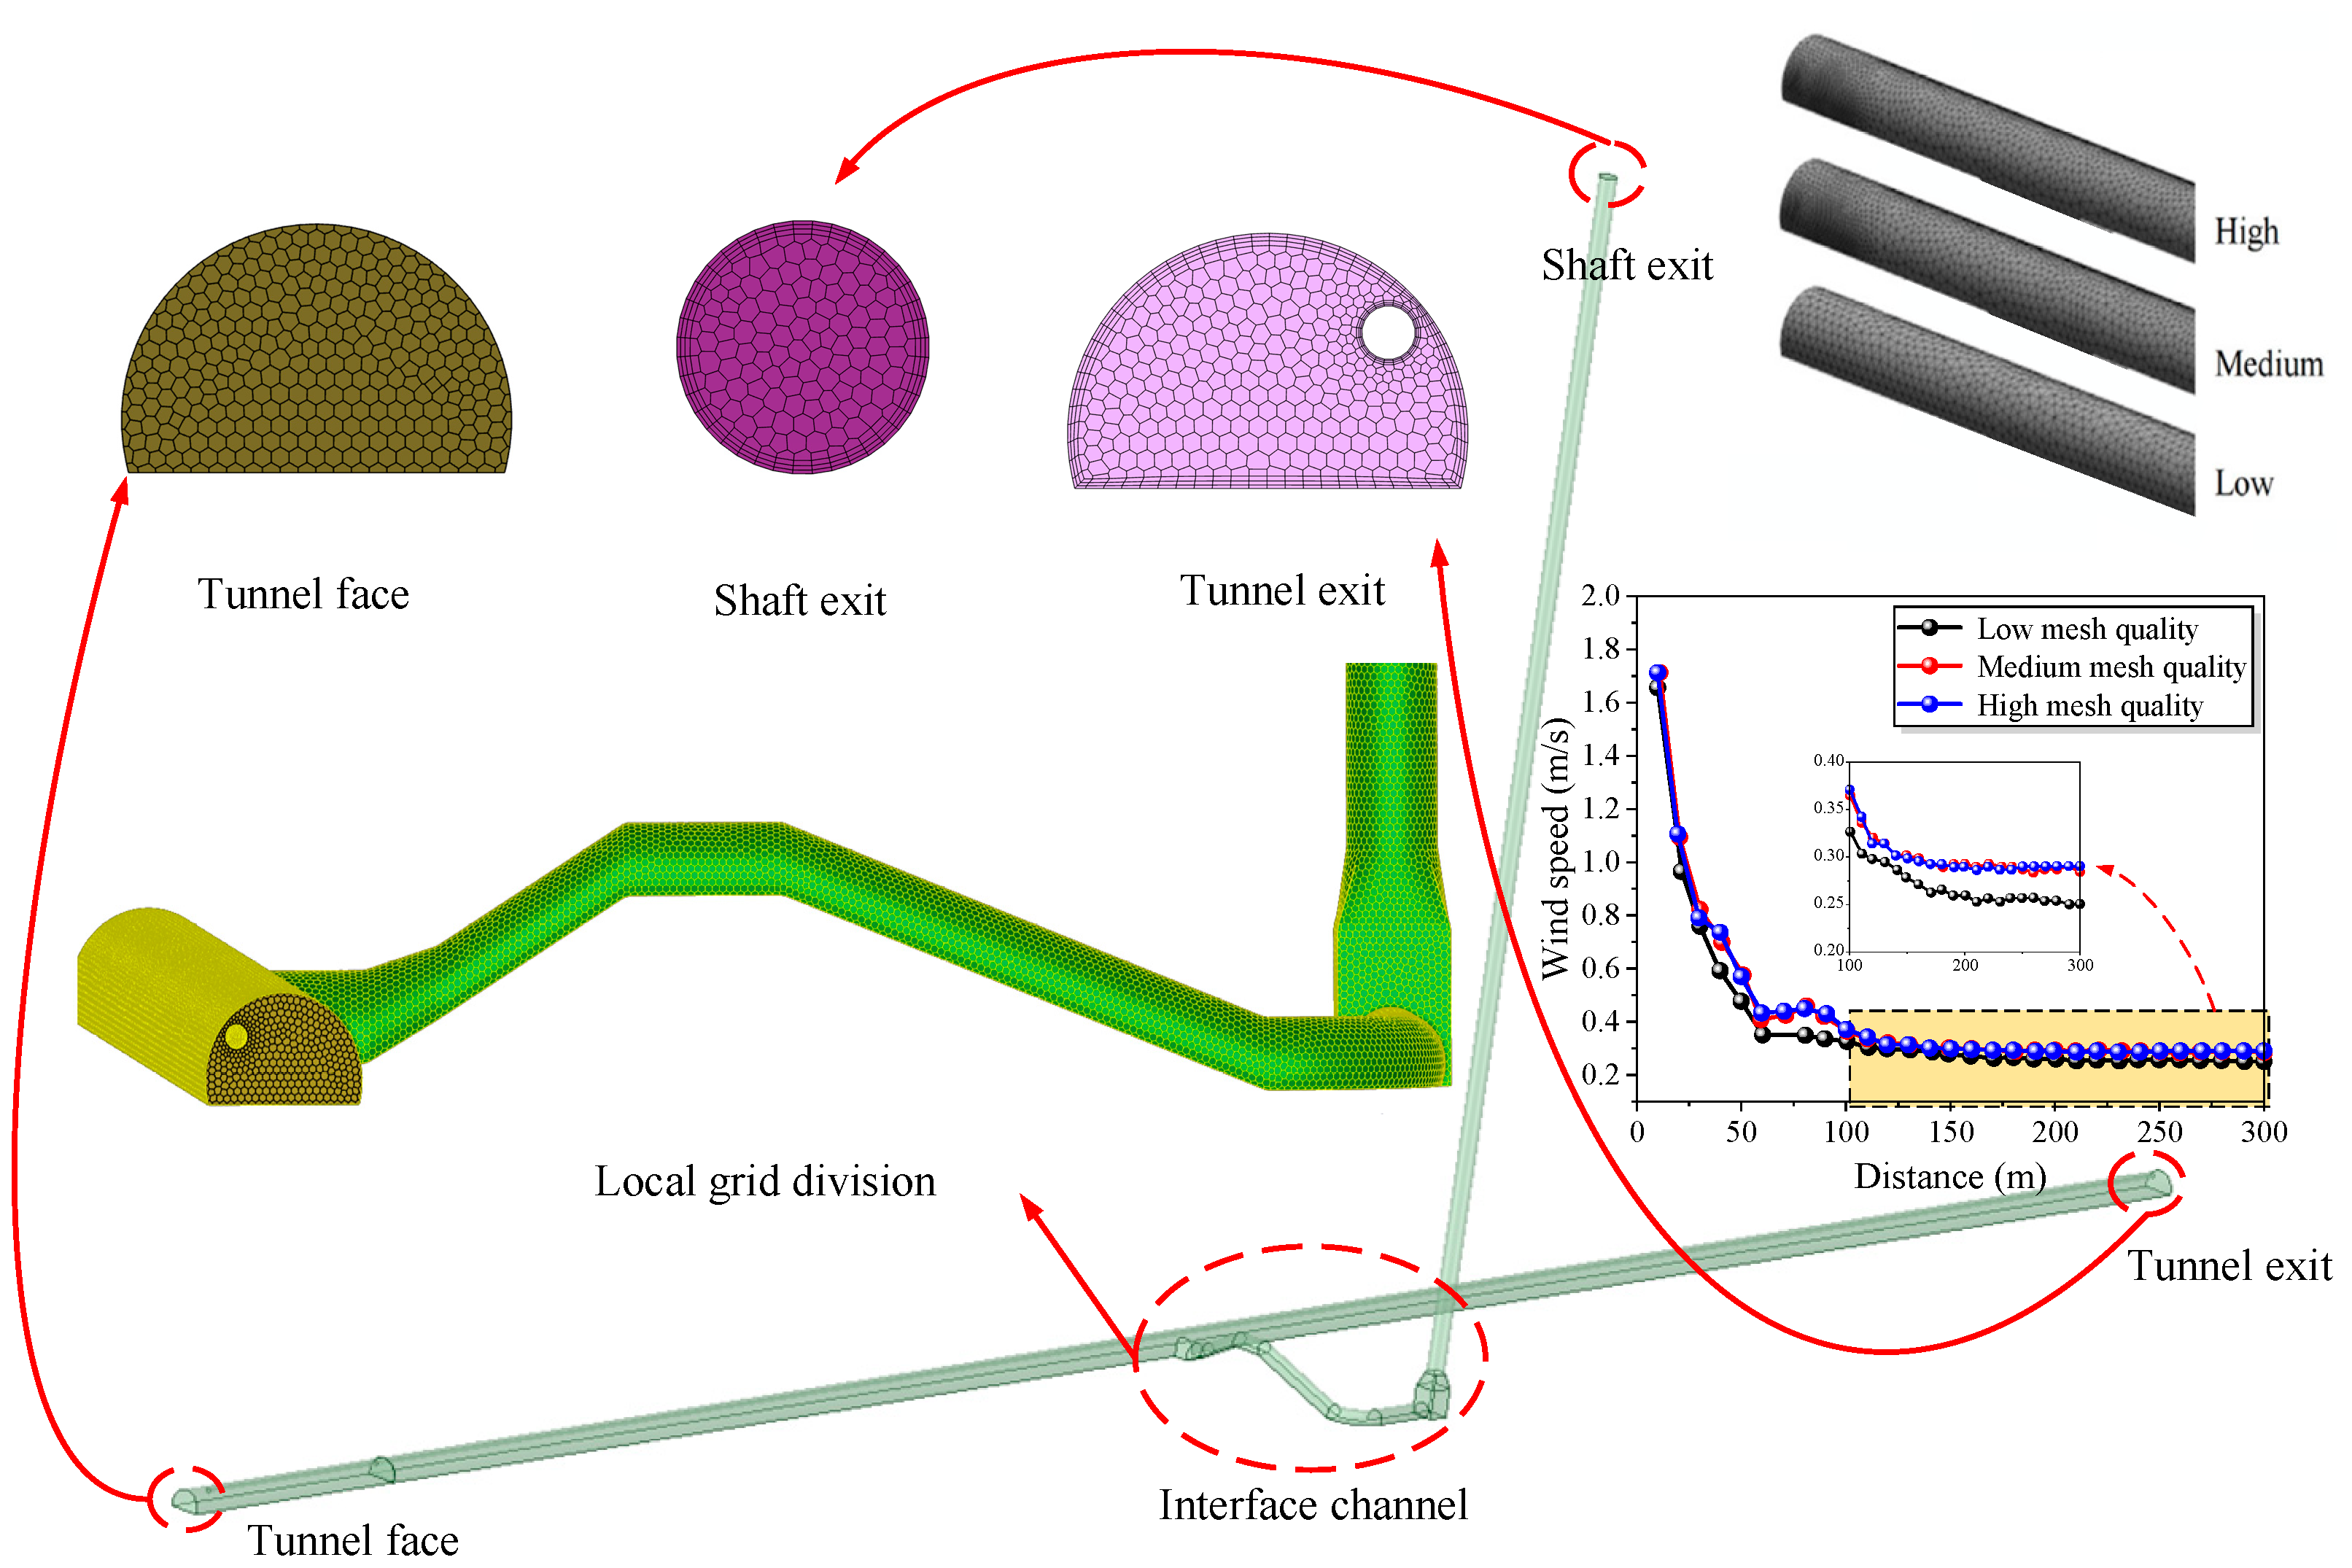
Firstly, the three-dimensional geometric structure of the tunnel is established with the prototype of the Daozhen–Wulong Zimuyan tunnel by using the three-dimensional modeling software Space Claim2022 R1. The structural dimensions and the tunnel model are the same as the actual project. In the numerical simulation analysis, the quality of the grid affects the accuracy of the simulation results, so it is very important to verify the independence of the grid. When studying the dust pollution effect under different conditions, wind speed is the main factor affecting the simulation results, so wind speed is the primary index to verify the grid independence. The model is divided into three grid division schemes by grid division software: low grid quality (463,376 cells), medium grid quality (888,686 cells), and high grid quality (1,159,557 cells). Under three different grid division schemes, the area-weighted average velocity amplitude of the tunnel along different sections is shown in
Figure 4. The variability in the simulation results of the three schemes is small. Considering the computer performance and simulation error, the medium grid quality scheme is adopted, with a total of 888,686 grids, and the average grid quality is 0.83 [
30], with a maximum of 1.0 and a minimum of 0.21.
A numerical model that is compatible with the tunnel’s field working conditions is established for numerical calculation, and the flow field’s evolution over time and its change over space are compared to confirm the consistency between the numerical simulation model and the actual field construction process. After continuous ventilation for 30 min, the CO concentration and cross-section wind speed of the monitored section 1 are extracted, and the measured results are compared with the numerical simulation results, as shown in
Figure 5, in which the maximum error between the simulated and measured values of the CO concentration in the cross-section is about 19.4% and the minimum error is about 1%. The maximum error between the simulated wind speed and measured wind speed is about 16%, and the minimum error is about 6.7%. Therefore, the simulation results are in good agreement with the measured results, which verifies the reliability of this model.
The maximum error occurs only in a specific period of time, while the overall trend is highly consistent (
Figure 5). After 600 s, the error between the simulated and measured CO concentration and wind speed are reduced to a small value, indicating the reliability of the model in evaluating the ventilation system compliance time.
5.2. Orthogonal Experimental Design
In the framework of the orthogonal experimental design in this paper, we focus on the key factors affecting the distribution of CO in the tunnel. Among the core variables of the experiment, the diameter of the air duct, the distance between the air duct outlet and the working face, and the hanging position of the air duct are identified as three crucial factors. For each variable, we set three different levels to investigate its influence comprehensively: the diameter of air duct is set to 1.6 m, 1.8 m, and 2.0 m, respectively; the distance between the air outlet and the working face is 5 m, 15 m, and 25 m; and the height arrangement of the axial flow duct is set to three key positions, namely 2 m, 3 m, and 4 m in order to investigate its impact on the distribution of CO in greater detail.
Through the well-designed orthogonal test, we aim to reveal the optimal configuration of the above factors and their different level combinations on the distribution law of CO in railway tunnels. As listed in
Table 1, the detailed parameter settings of each influencing factor and its corresponding level number have laid a solid foundation for the subsequent data analysis and conclusion extraction.
The analysis of the results by the orthogonal test needs to select the target factor in the airflow range, and the average CO concentration of each working face after blasting in the tunnel is selected as the target factor to represent the ventilation effect of the construction. The ventilation effect increases with the decrease in the CO concentration; that is, the lower the CO concentration, the better the ventilation effect.
This experiment mainly investigates the influence of three factors on the distribution law of the CO concentration. Because the interaction among factors is neglected, the L(3) orthogonal table is selected to plan the experimental scheme, and the specific design is shown in
Table 2.
5.3. Result Processing
Based on the principle of the orthogonal experiment design, the ventilation flow in the construction tunnel was successfully simulated in the Fluent 2022 R1 software platform. The simulation described the complex phenomena such as the airflow trajectory, spatial distribution characteristics of the CO concentration, dynamic change in wind speed, and vortex formation in the limited space of the tunnel. Based on the detailed data of the simulation, we focus on the x = 0 plane, y = 1.6 m plane (the approximate height of human respiration), Z = 0 plane (the vertical section of the construction face), and the average wind speed in the whole tunnel area as the key quantitative indicators to evaluate the ventilation effect and systematically analyze the flow field characteristics.
Table 3 summarizes the experimental design and the corresponding numerical simulation output and obtains the comprehensive evaluation of the tunnel’s ventilation performance.
Based on the numerical simulation results in
Table 3, we directly use these data as the basis of analysis, because the average speed of each plane and the whole tunnel is a positive influence index, so the forward processing step is not needed. Subsequently, we convert these raw data into the standardized matrix Z, which is convenient for further data optimization and in-depth analysis.
In the process of evaluating the characteristics of the flow field, we directly apply the entropy weight method (Equations (1)–(3)) to calculate the information entropy of each index reflecting the characteristic of the flow field. This method effectively quantifies the information contained in each evaluation index, thus objectively determining the weight of each evaluation index.
The assessment indexes of the flow field features are thoroughly examined and compared in a methodical manner in order to determine the subjective weight based on the predetermined important evaluation criteria. Through this method, the relative importance of each index can be judged intuitively, and then the judgment matrix of the AHP can be constructed to quantify these subjective evaluations.
The maximum eigenvalue of the matrix
R is
λmax = 3.8853. Through the formulas of Equations (15) and (16), we establish that the consistency ratio DR is 0.08087, in which the consistency index DI is 0.94265. Since DR is less than 0.10, it shows that the consistency of the judgment matrix R is within the acceptable range. Therefore, we can use the weight result calculated by the eigenvalue method as the effective weight:
When comprehensively evaluating the characteristics of the flow field, we combine the objective weights calculated earlier with the subjective weights obtained through expert judgment. Using a specific combination formula (as shown in Formula (17)), we have calculated the weights, and, finally, we have successfully obtained a comprehensive weight that fully considers the objective characteristics of the data and effectively integrates the subjective experience of experts.
Based on the improved TOPSIS scoring method, we first define the optimal and worst reference solutions under each working condition according to Formula (8). Then, we quantify the closeness of each working condition evaluation index to these reference solutions, specifically by calculating the closeness to the optimal solution and the separation from the worst solution. Based on these calculation results, a score is assigned to each working condition to quantify its comprehensive performance. Finally, we obtain the scoring results of each working condition, which can be used for further analysis and decision support.
As an evaluation tool, matrix C clearly reveals the closeness between each evaluation object and the ideal optimal state, and the closer the value is to one, the more excellent the comprehensive performance of the evaluation object is. To sum up, as shown in
Table 4, the scores of each working condition in the orthogonal test after evaluation are shown. According to this table, condition 7 was identified as the worst performance design scheme, and its score was only 0.0431, which was significantly lower than other cases. On the contrary, condition 5 became the optimal design scheme, with a score of 0.1997, which also pointed out the specific layout position of the air duct under the optimal design scheme.
5.4. Theoretical Sensitivity Analysis
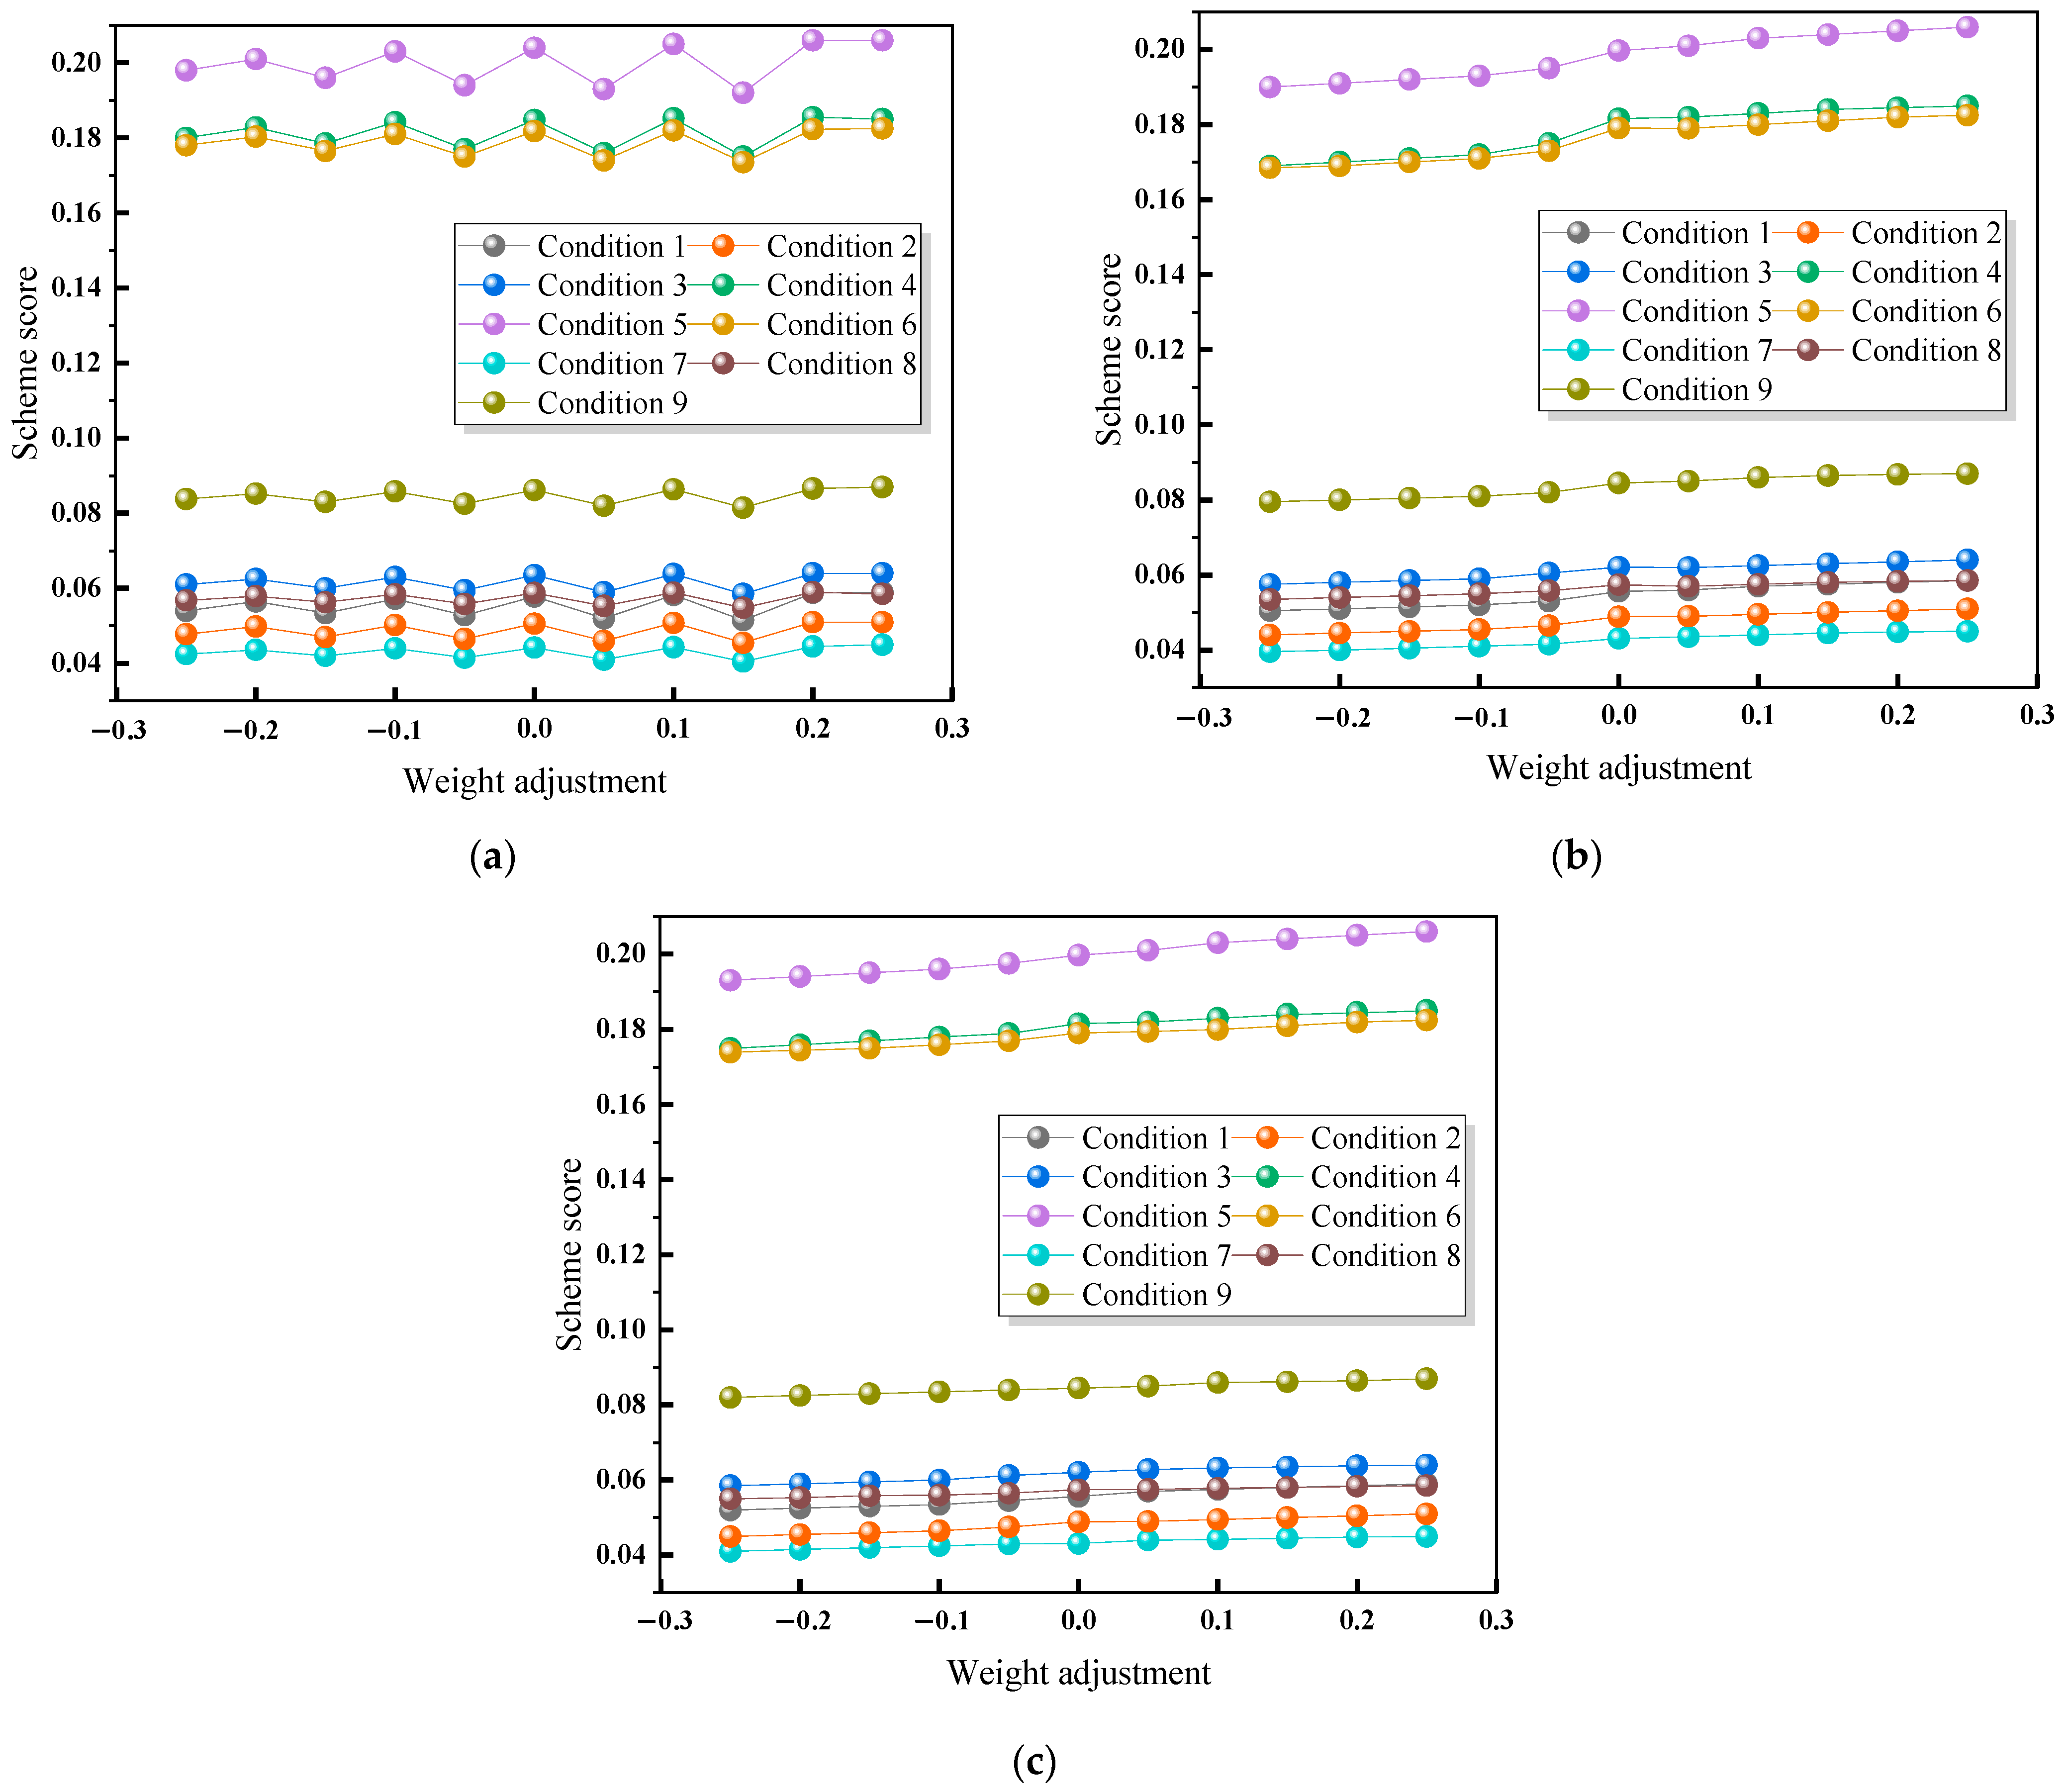
In order to evaluate the robustness of our orthogonal experiment in the improved TOPSIS theory, we conducted a sensitivity analysis to address potential concerns about model assumptions and variable manipulation. We adjusted the weights of the three factors in the orthogonal experimental design (range from ±5% to ±25%) and obtained the sensitivity analysis of each factor, as shown in
Figure 6.
It can be seen from the above figure that although we have adjusted the weight of each of the three factors to varying degrees, the relative proximity (score) of each working condition has changed slightly, but the overall ranking remains stable. This shows that the orthogonal test combined with the improved TOPSIS model has a low sensitivity to the three factors, and the model has good robustness. The ranking of different working conditions obtained by this theory has a strong adaptability to the uncertainty of weight in the engineering application.
6. Optimal Parameter Verification
To avoid the limitations caused by improving the TOPSIS method and promote the development of optimization design in a more accurate and scientific direction, we focused on working conditions with high scores for in-depth exploration after a careful analysis of various evaluation results. Specifically, we focus on the wind speed, CO concentration, and their distribution characteristics in the ventilation flow field, with the goal of empirical verification, and may adjust or improve tunnel ventilation optimization design schemes based on mathematical theory only according to the actual situation, so that the final scheme not only meets theoretical expectations but is also feasible and effective for practical application.
The numerical simulation results show that in the tunnel ventilation system, the behavior pattern of the airflow has a significant impact on the gas distribution and dilution efficiency in the tunnel face area. Part of the airflow deflects due to the wall effect, while the rest flows close to the tunnel face. After mixing with the CO released by the tunnel face, the airflow direction changes again near the tunnel wall, forming a vortex region, and then the velocity field gradually returns to a stable state. With the extension of the distance between the air supply pipeline and the tunnel face, the air flow trajectory at the outlet of the pipeline deviates. Importantly, when the distance reaches 25 m, the distance is beyond the effective coverage of the jet, which means that the jet cannot reach the tunnel face directly and causes the reverse backflow phenomenon, which significantly reduces the permeability of fresh air to the tunnel face, which is extremely unfavorable for the effective discharge of CO. Therefore, the generation of the vortex around the tunnel face is significantly enhanced, which further hinders the effective dilution and discharge of CO.
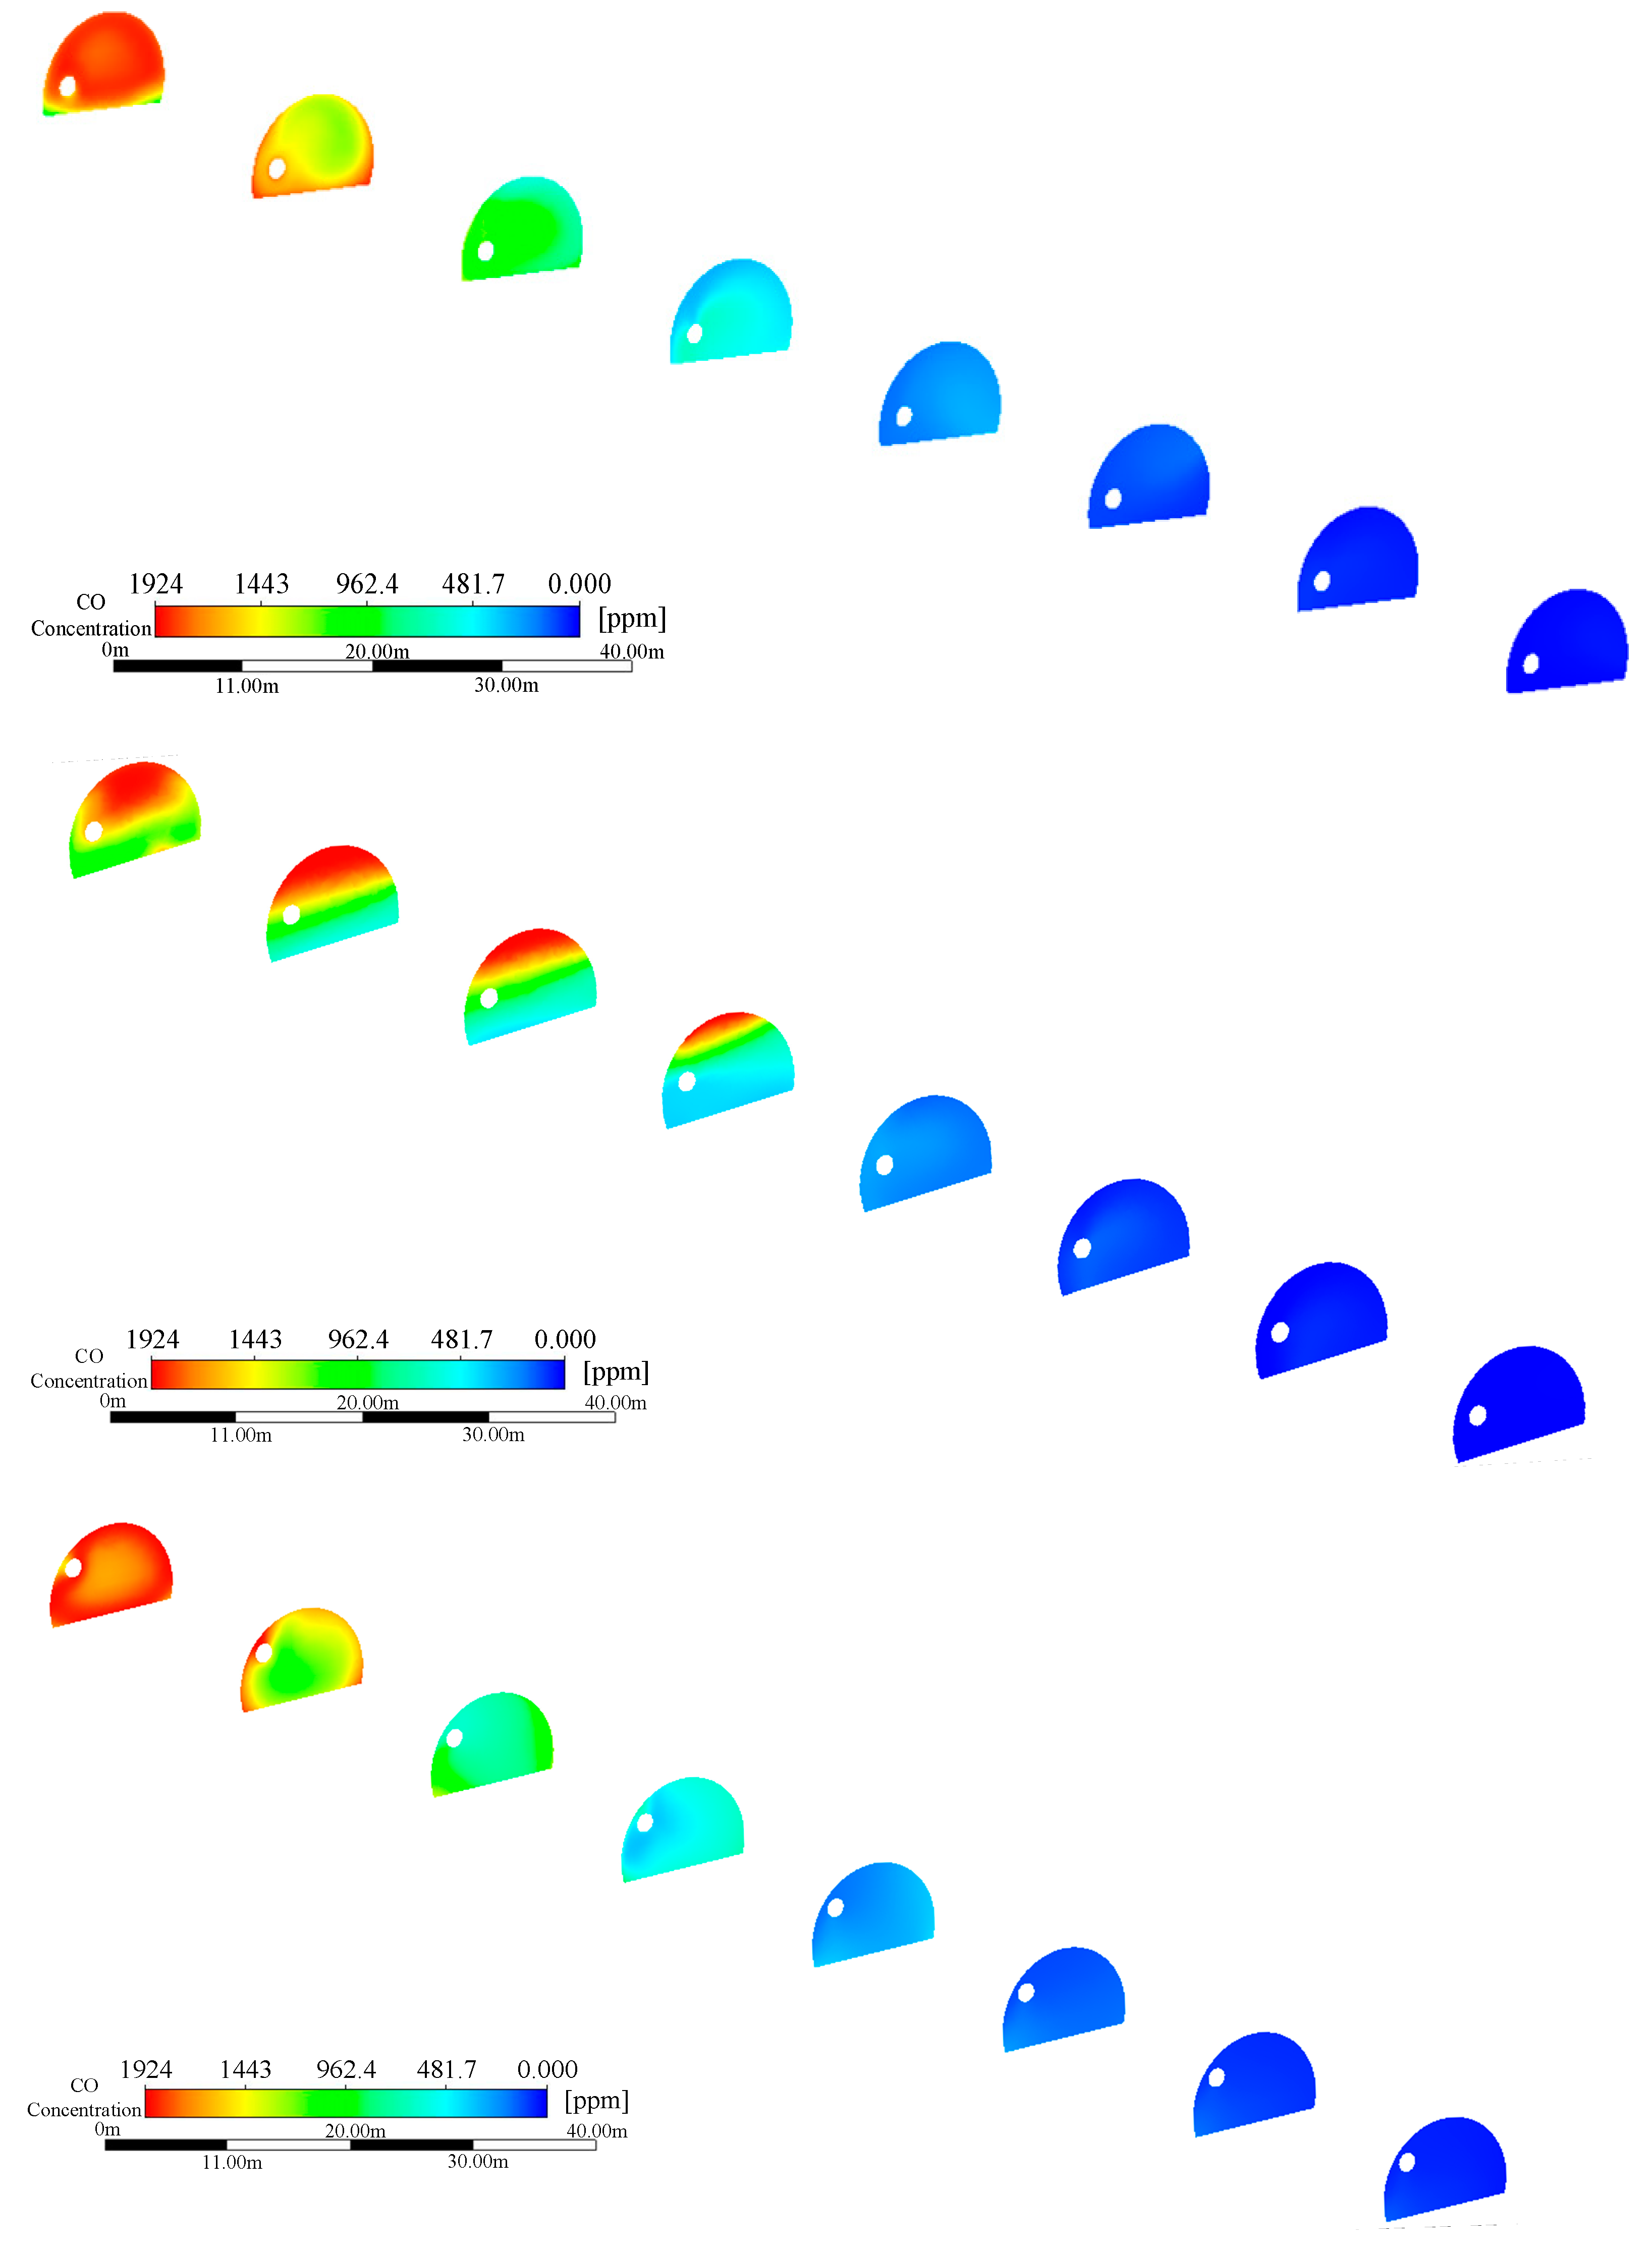
The spatial distribution characteristics of the CO concentration in the tunnel face under various working conditions show some commonness; that is, the CO concentration on the side where the air duct is arranged is relatively low, while the opposite area shows a higher CO concentration, and the high concentration area is mainly concentrated around the wall.
Figure 7 visually shows the high wind speed area of the tunnel face on the side of the air duct, and its maximum wind speed can reach 18 m/s, but the range of this high wind speed area is limited, while the opposite side presents a low and widely distributed wind speed, indicating that the arrangement of the air duct and the tunnel face too close to one another will aggravate the non-uniformity of the wind speed on both sides.
With the increase in the distance between the air duct and the tunnel face, the local maximum CO concentration and the average CO concentration of the tunnel face all show an upward trend, which indicates that the excessive spacing will weaken the effective CO emission capacity of the tunnel face. The importance of setting the air duct position reasonably is emphasized for optimizing the ventilation effect of the tunnel and ensuring the safety of the working environment.
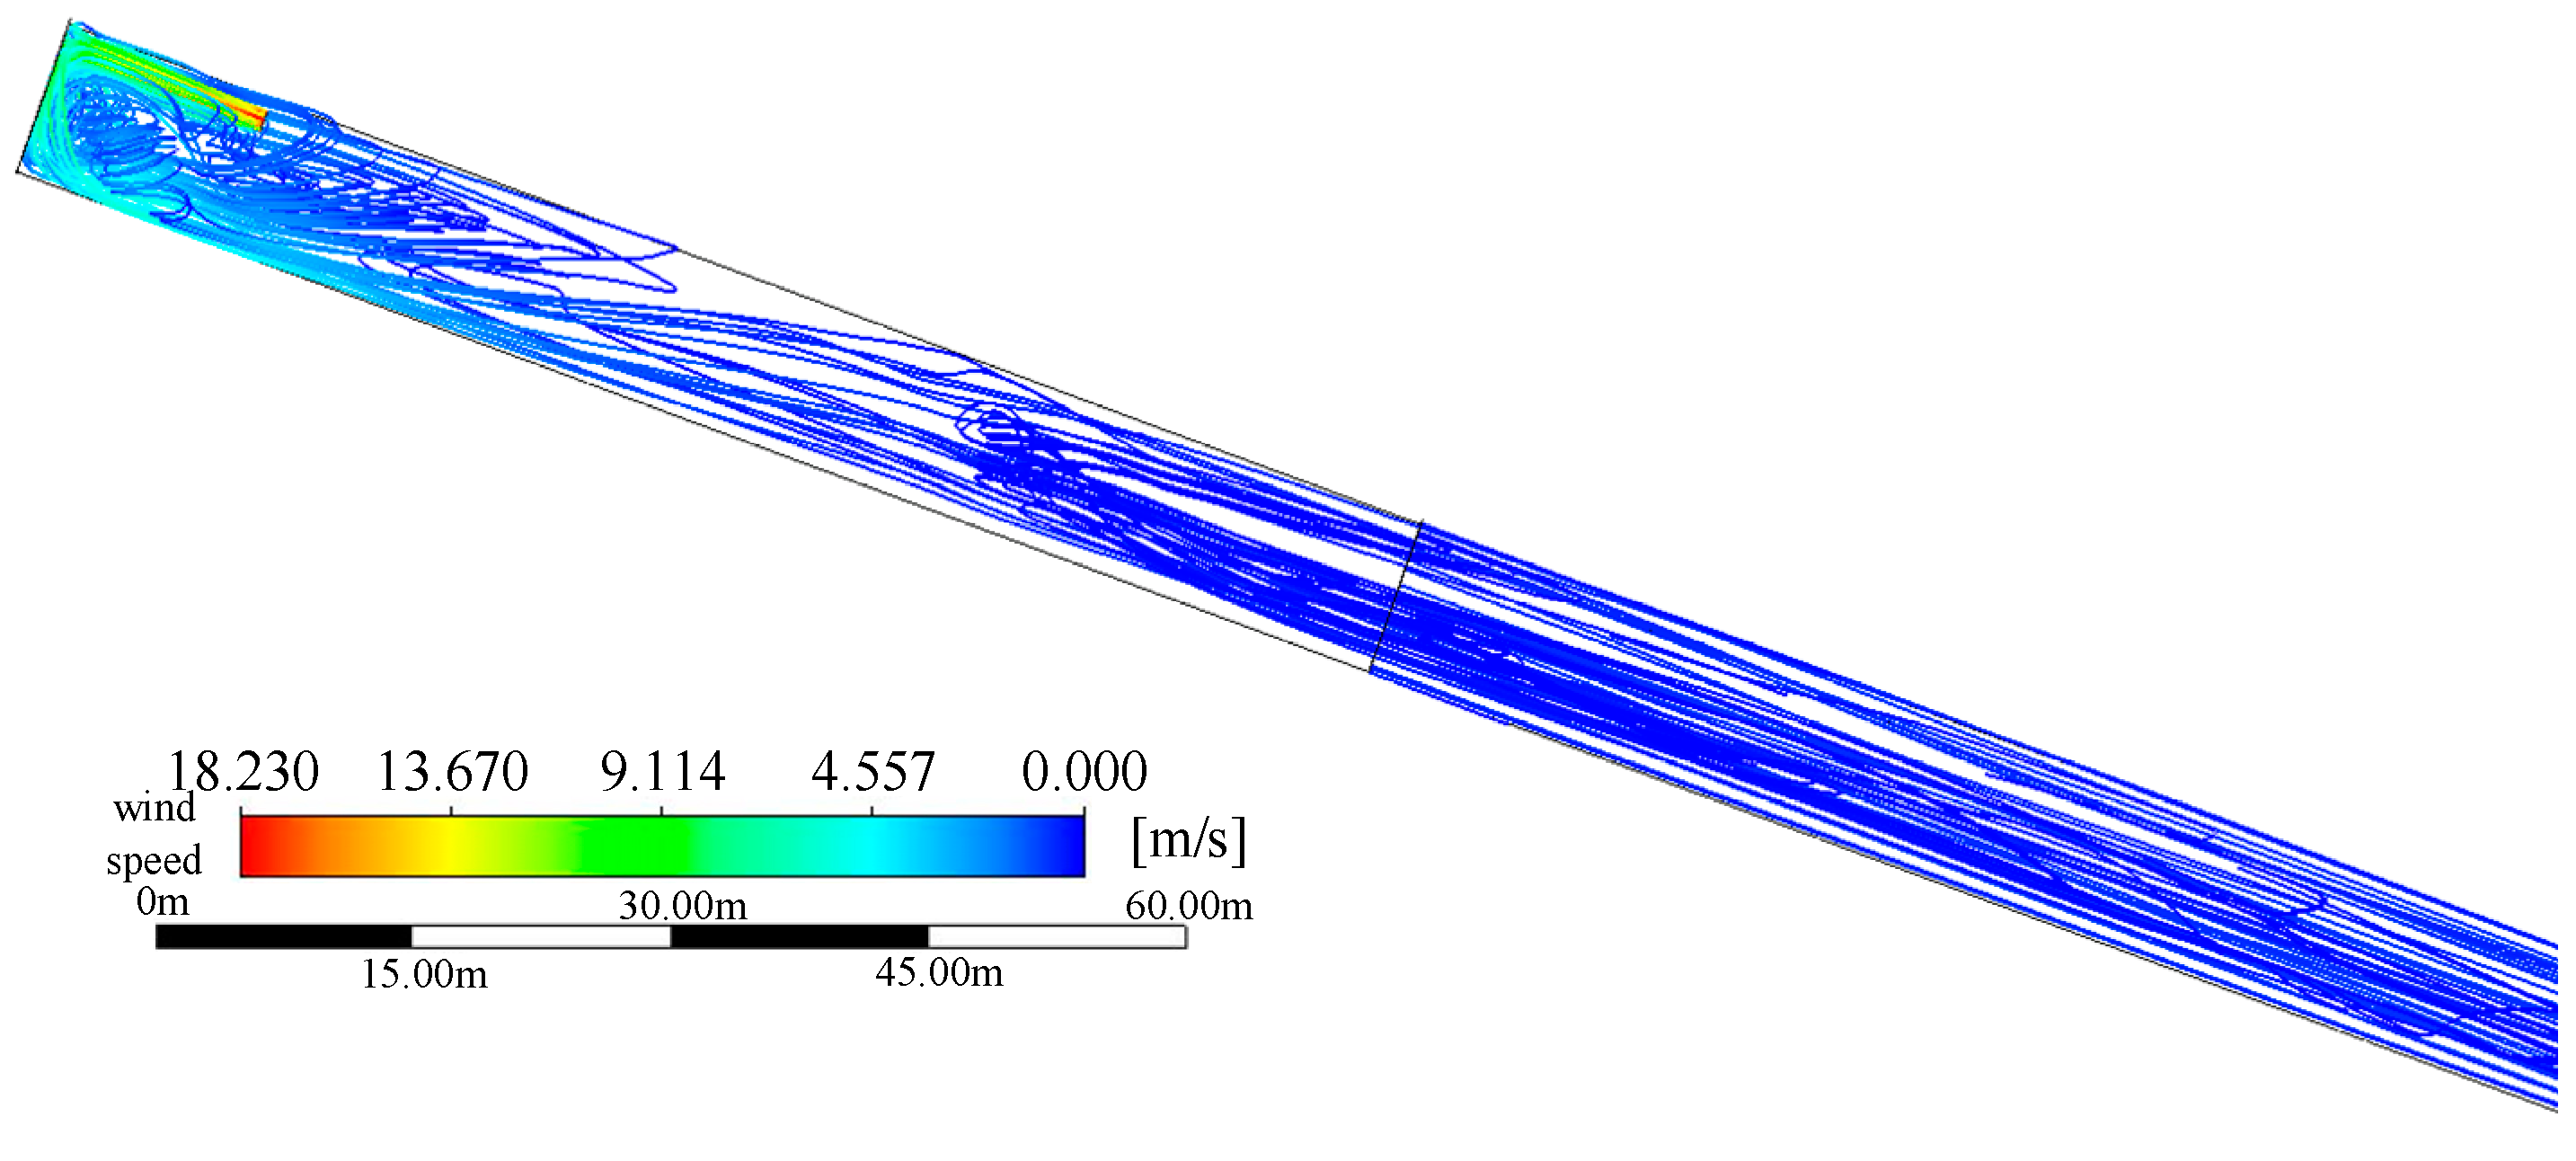
Using the improved TOPSIS theory, the data covered by the orthogonal test are deeply studied and analyzed, aiming at comprehensively evaluating and verifying the flow field inside the tunnel under various working conditions and finally determining the optimal combination of construction parameters; that is, the distance between the outlet of the air duct and the working face is 15 m, and the air duct diameter is
D = 1.6 m at the side wall of the air duct. The airflow path within 300 m in front of the tunnel face of this scheme is shown in
Figure 8.
The optimized parameter configuration is applied to the numerical simulation of the tunnel engineering, and the extracted data are compared with the field monitoring data. As shown in
Figure 8, it is found that the improved working conditions significantly improve the ventilation efficiency during tunnel construction. The wind speed of the return air flow in the tunnel is stable, and, at the same time, the detection of the carbon monoxide (CO) concentration in each key area shows that its value is lower than the safety threshold of 24 ppm, which fully meets the strict requirements of ventilation safety in tunnel construction.
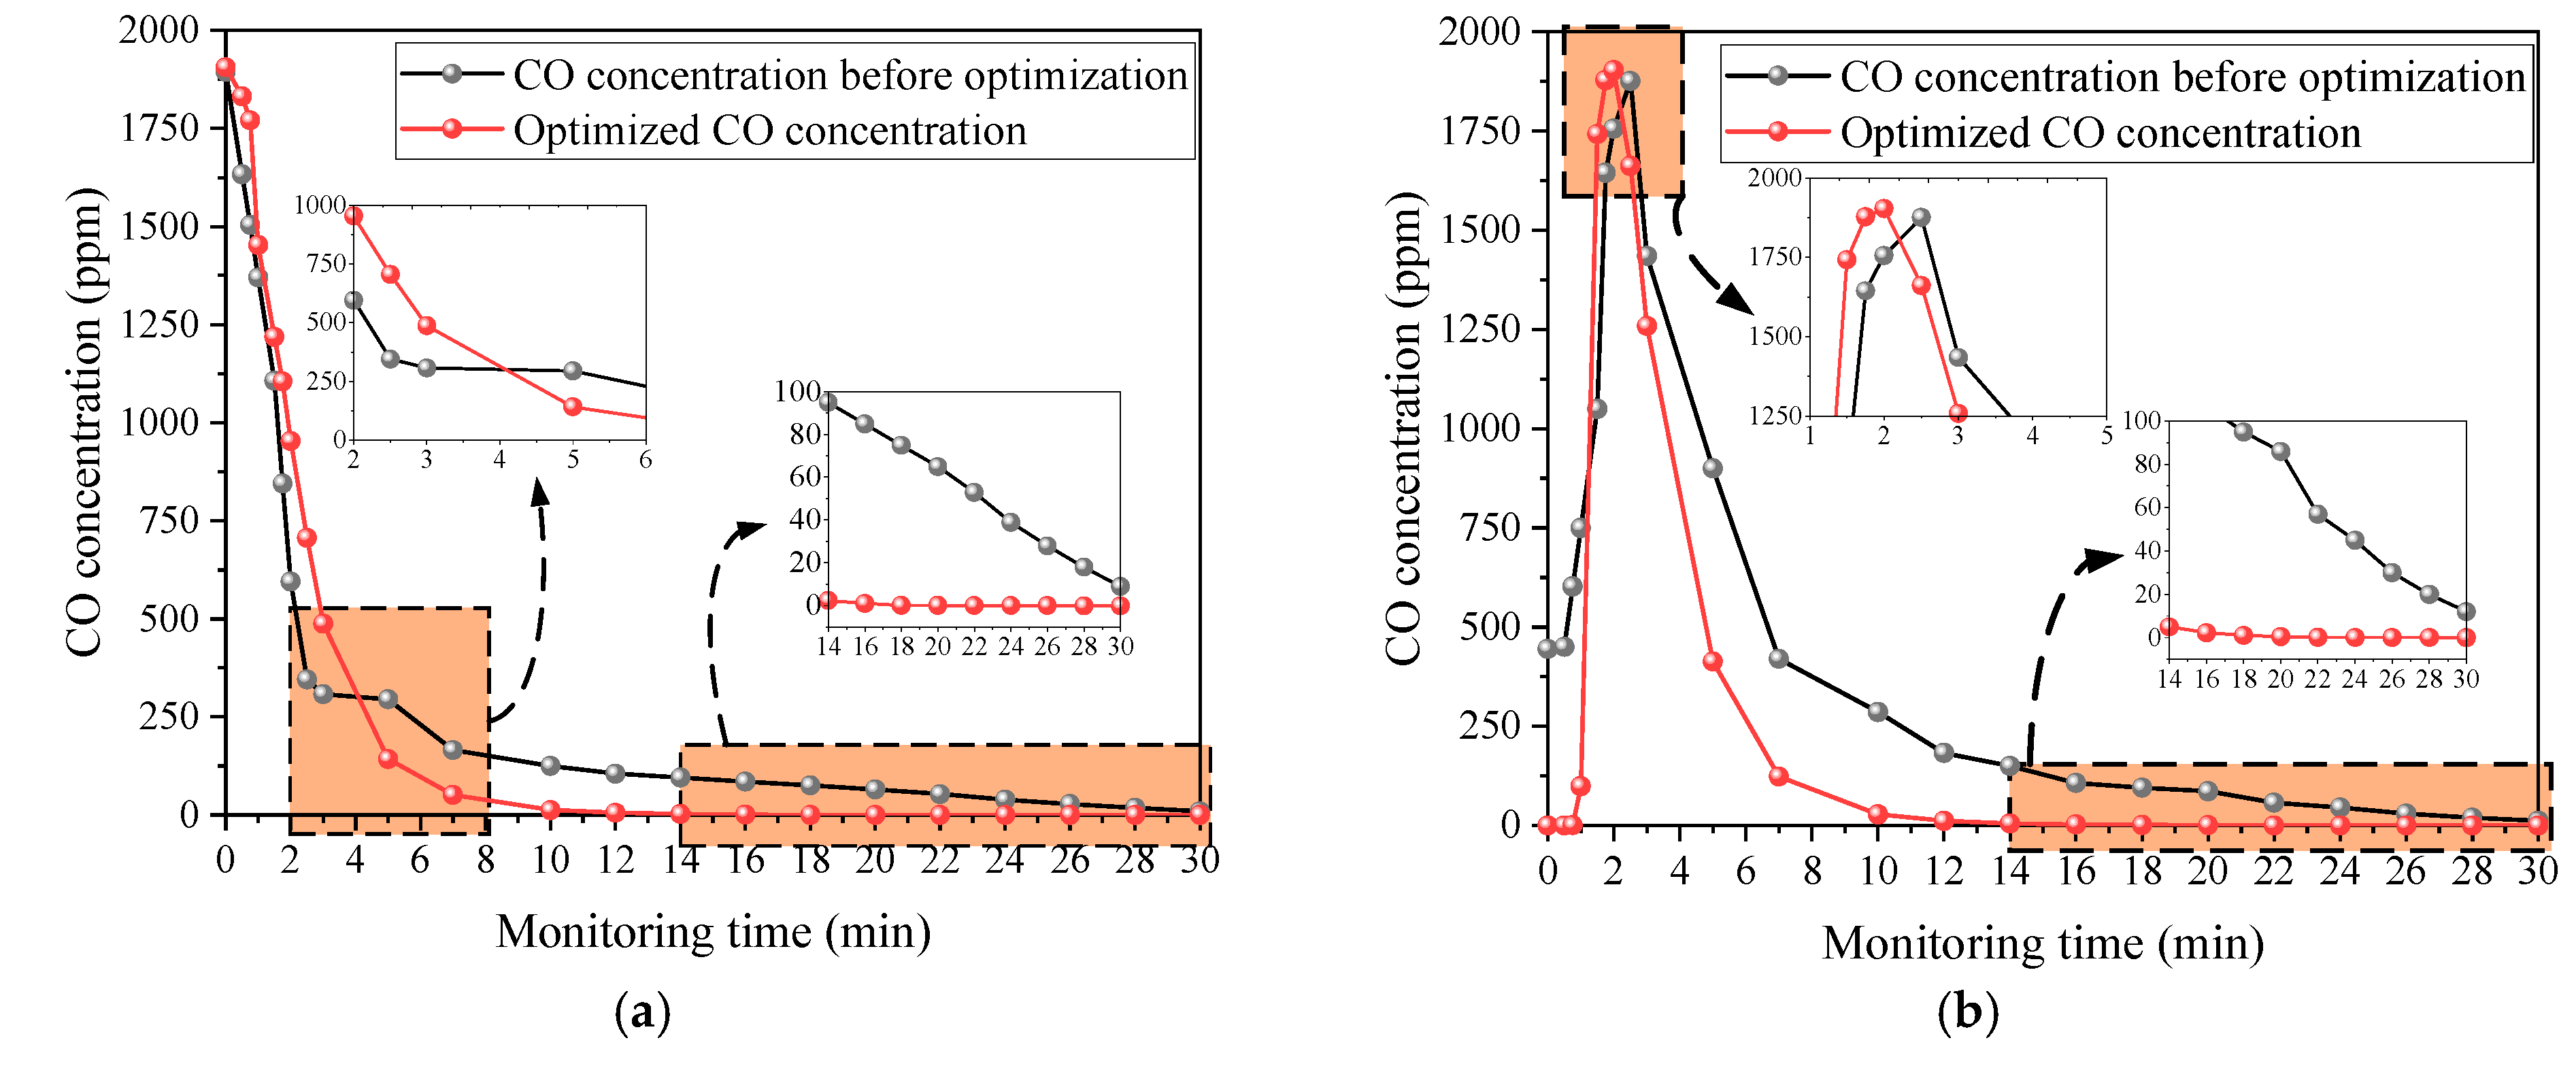
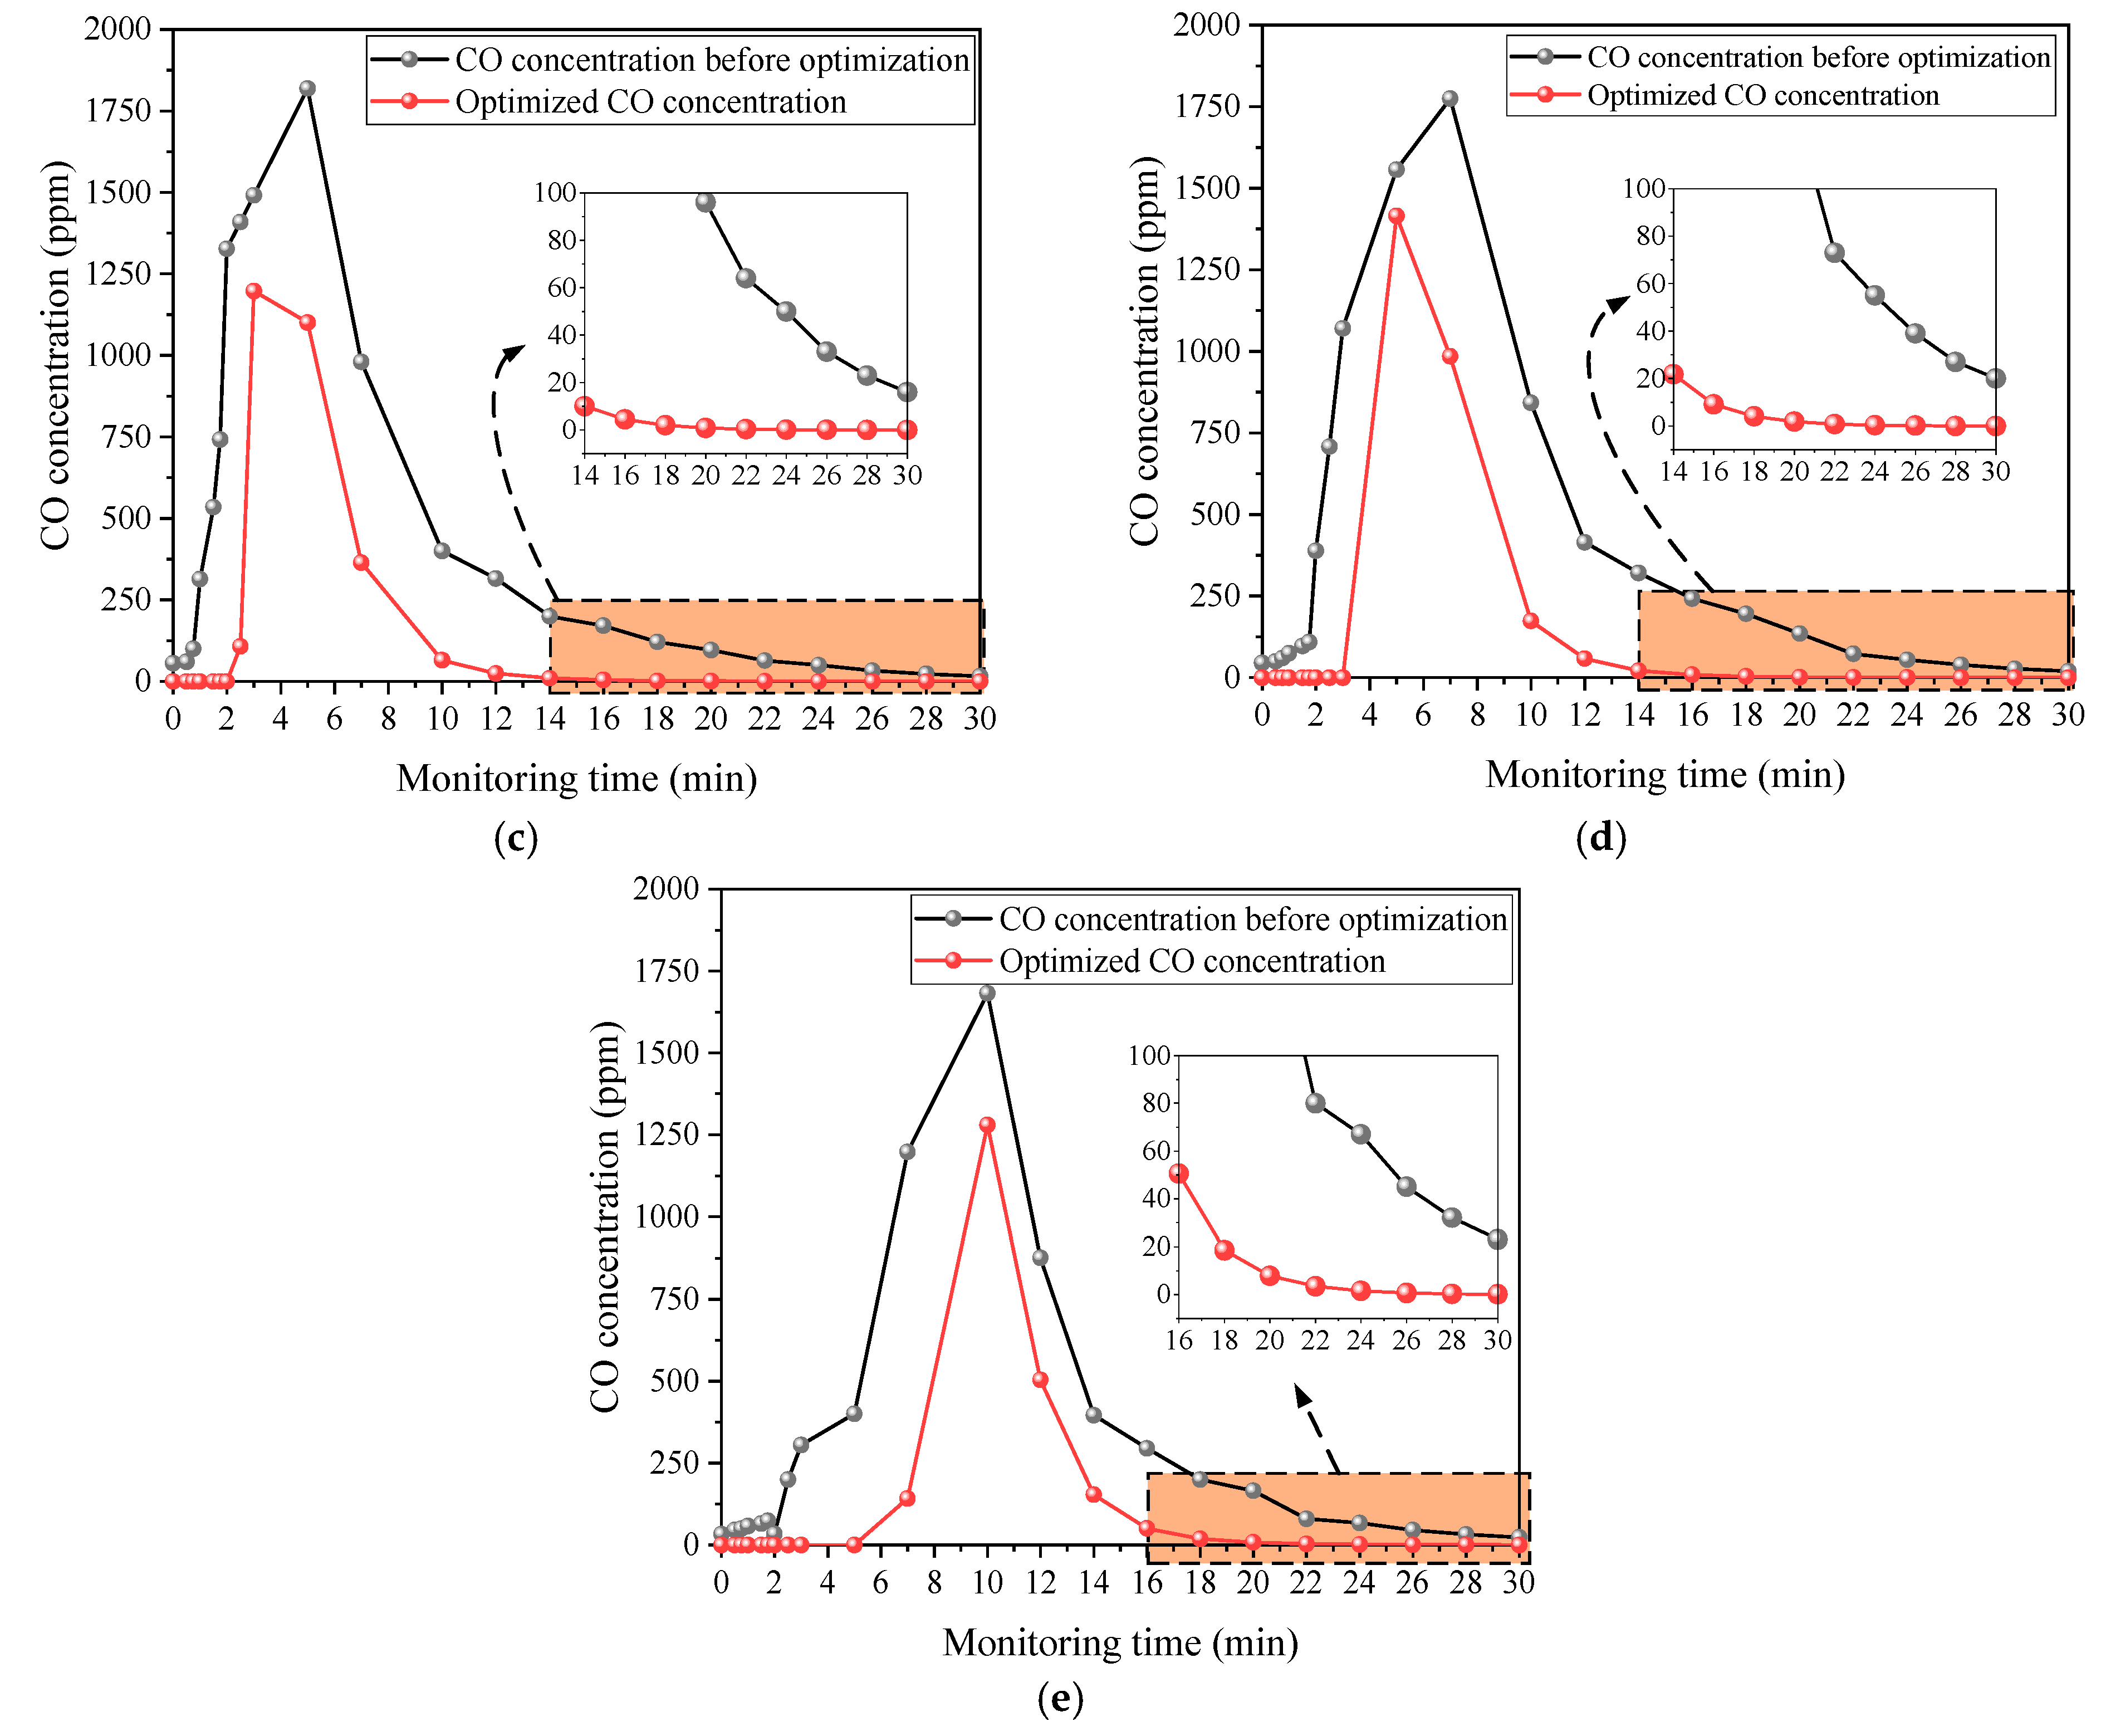
From
Figure 9, it can be found that the change trend of the CO concentration shows a consistent behavior on the sections at different positions (100 m, 150 m, 200 m, and 300 m) from the tunnel face. Specifically, in the section 100 m away from the tunnel face, the CO concentration rose rapidly 30 s after blasting, reached a peak of 1905 ppm, and then gradually decreased until it fell below 27 ppm at 600 s. With the increase in distance, the rising time of the CO concentration is delayed, and the peak value gradually decreases: the peak value of the 150 m section reaches 1790 ppm 100 s after blasting, the peak value of the 200 m section reaches 1580 ppm 100 s after blasting, and the peak value of the 300 m section reaches 1240 ppm 190 s after blasting. It is worth noting that at about 900 s in all the sections, the CO concentration dropped below the allowable concentration value stipulated by the industry. According to the comparison in
Figure 8, we can see the advantages of the optimization scheme. In the optimization scheme, the time points of the CO concentration rise and fall in some sections earlier than those in the field scheme, which indicates that the ventilation conditions in the optimization scheme promote the rapid diffusion of CO. In addition, with the passage of the monitoring time, the gap between the peak value of the CO concentration in each section of the optimization scheme and the peak value of the field scheme gradually increases, which further proves the superiority of the optimization scheme for the ventilation effect. With the passage of time, the ventilation effect of the optimized scheme becomes more and more obvious.
It is worth noting that in the dynamic diffusion process of the CO concentration in the tunnel, the time lag characteristics of different sections in the simulation results show that the farther away from the working face, the longer the time lag of the CO concentration reaching its peak. As shown in
Figure 10, although there are errors between the simulated and measured data, the main reasons are the complexity of the transient process and the delay of the sensor response. It is difficult to accurately model the instantaneous changes in the CO release rate and airflow turbulence intensity after blasting. And the on-site monitoring equipment has a response delay of about 2–3 s in the high-concentration rapid change scenario. However, these errors do not affect the consistency of the core conclusion; that is, the lag law: the model accurately reflects the law of ‘the farther the distance, the longer the lag time’ (
Figure 10), which provides a reliable basis for the optimization of the ventilation strategy.
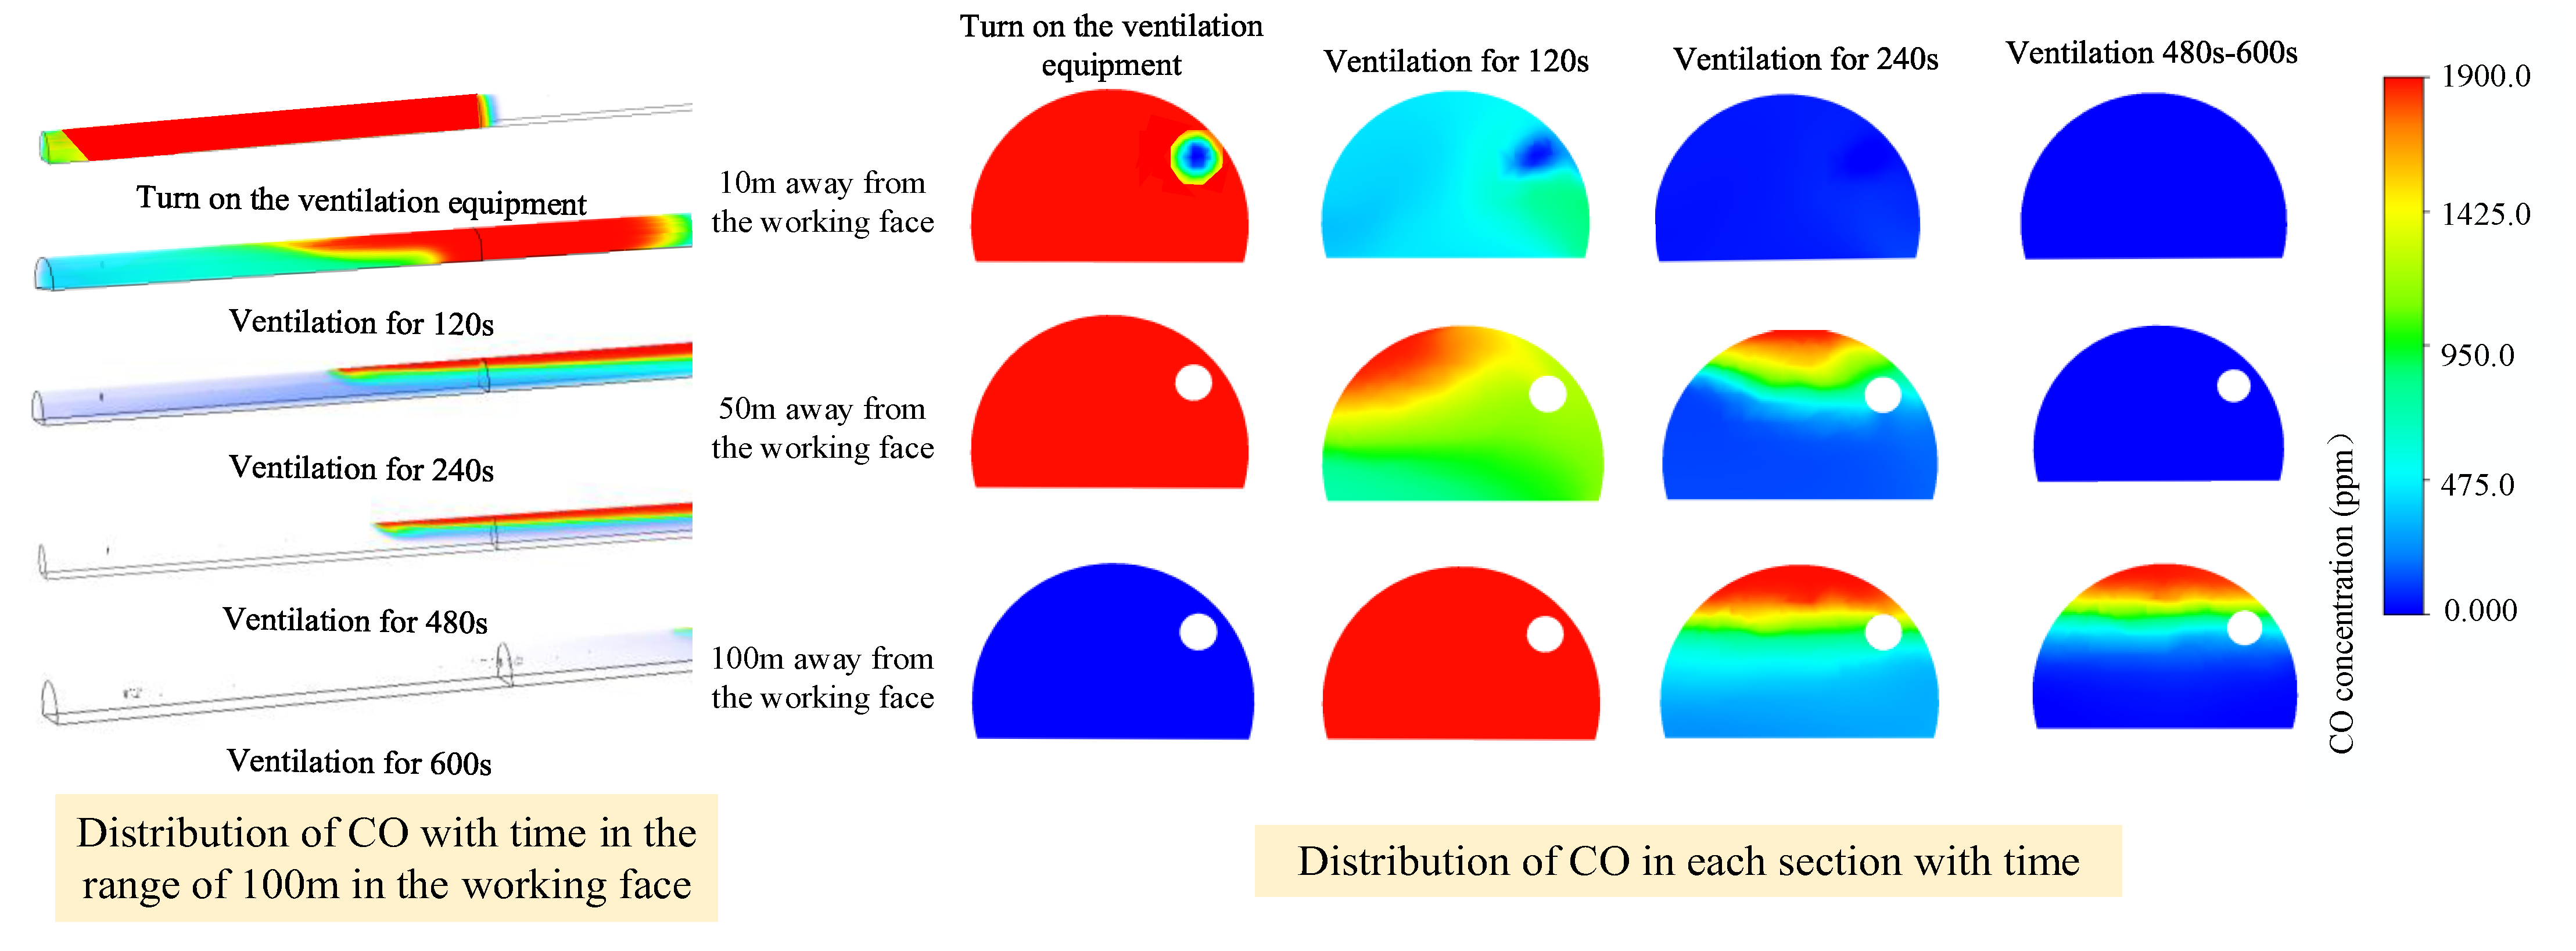
To determine the entrance time for safe construction following blasting construction, the change in the CO concentration at 100 m of the tunnel face is examined. The following graphic depicts a simulated cloud picture of the CO diffusion within 100 m of the tunnel face under various ventilation time conditions.
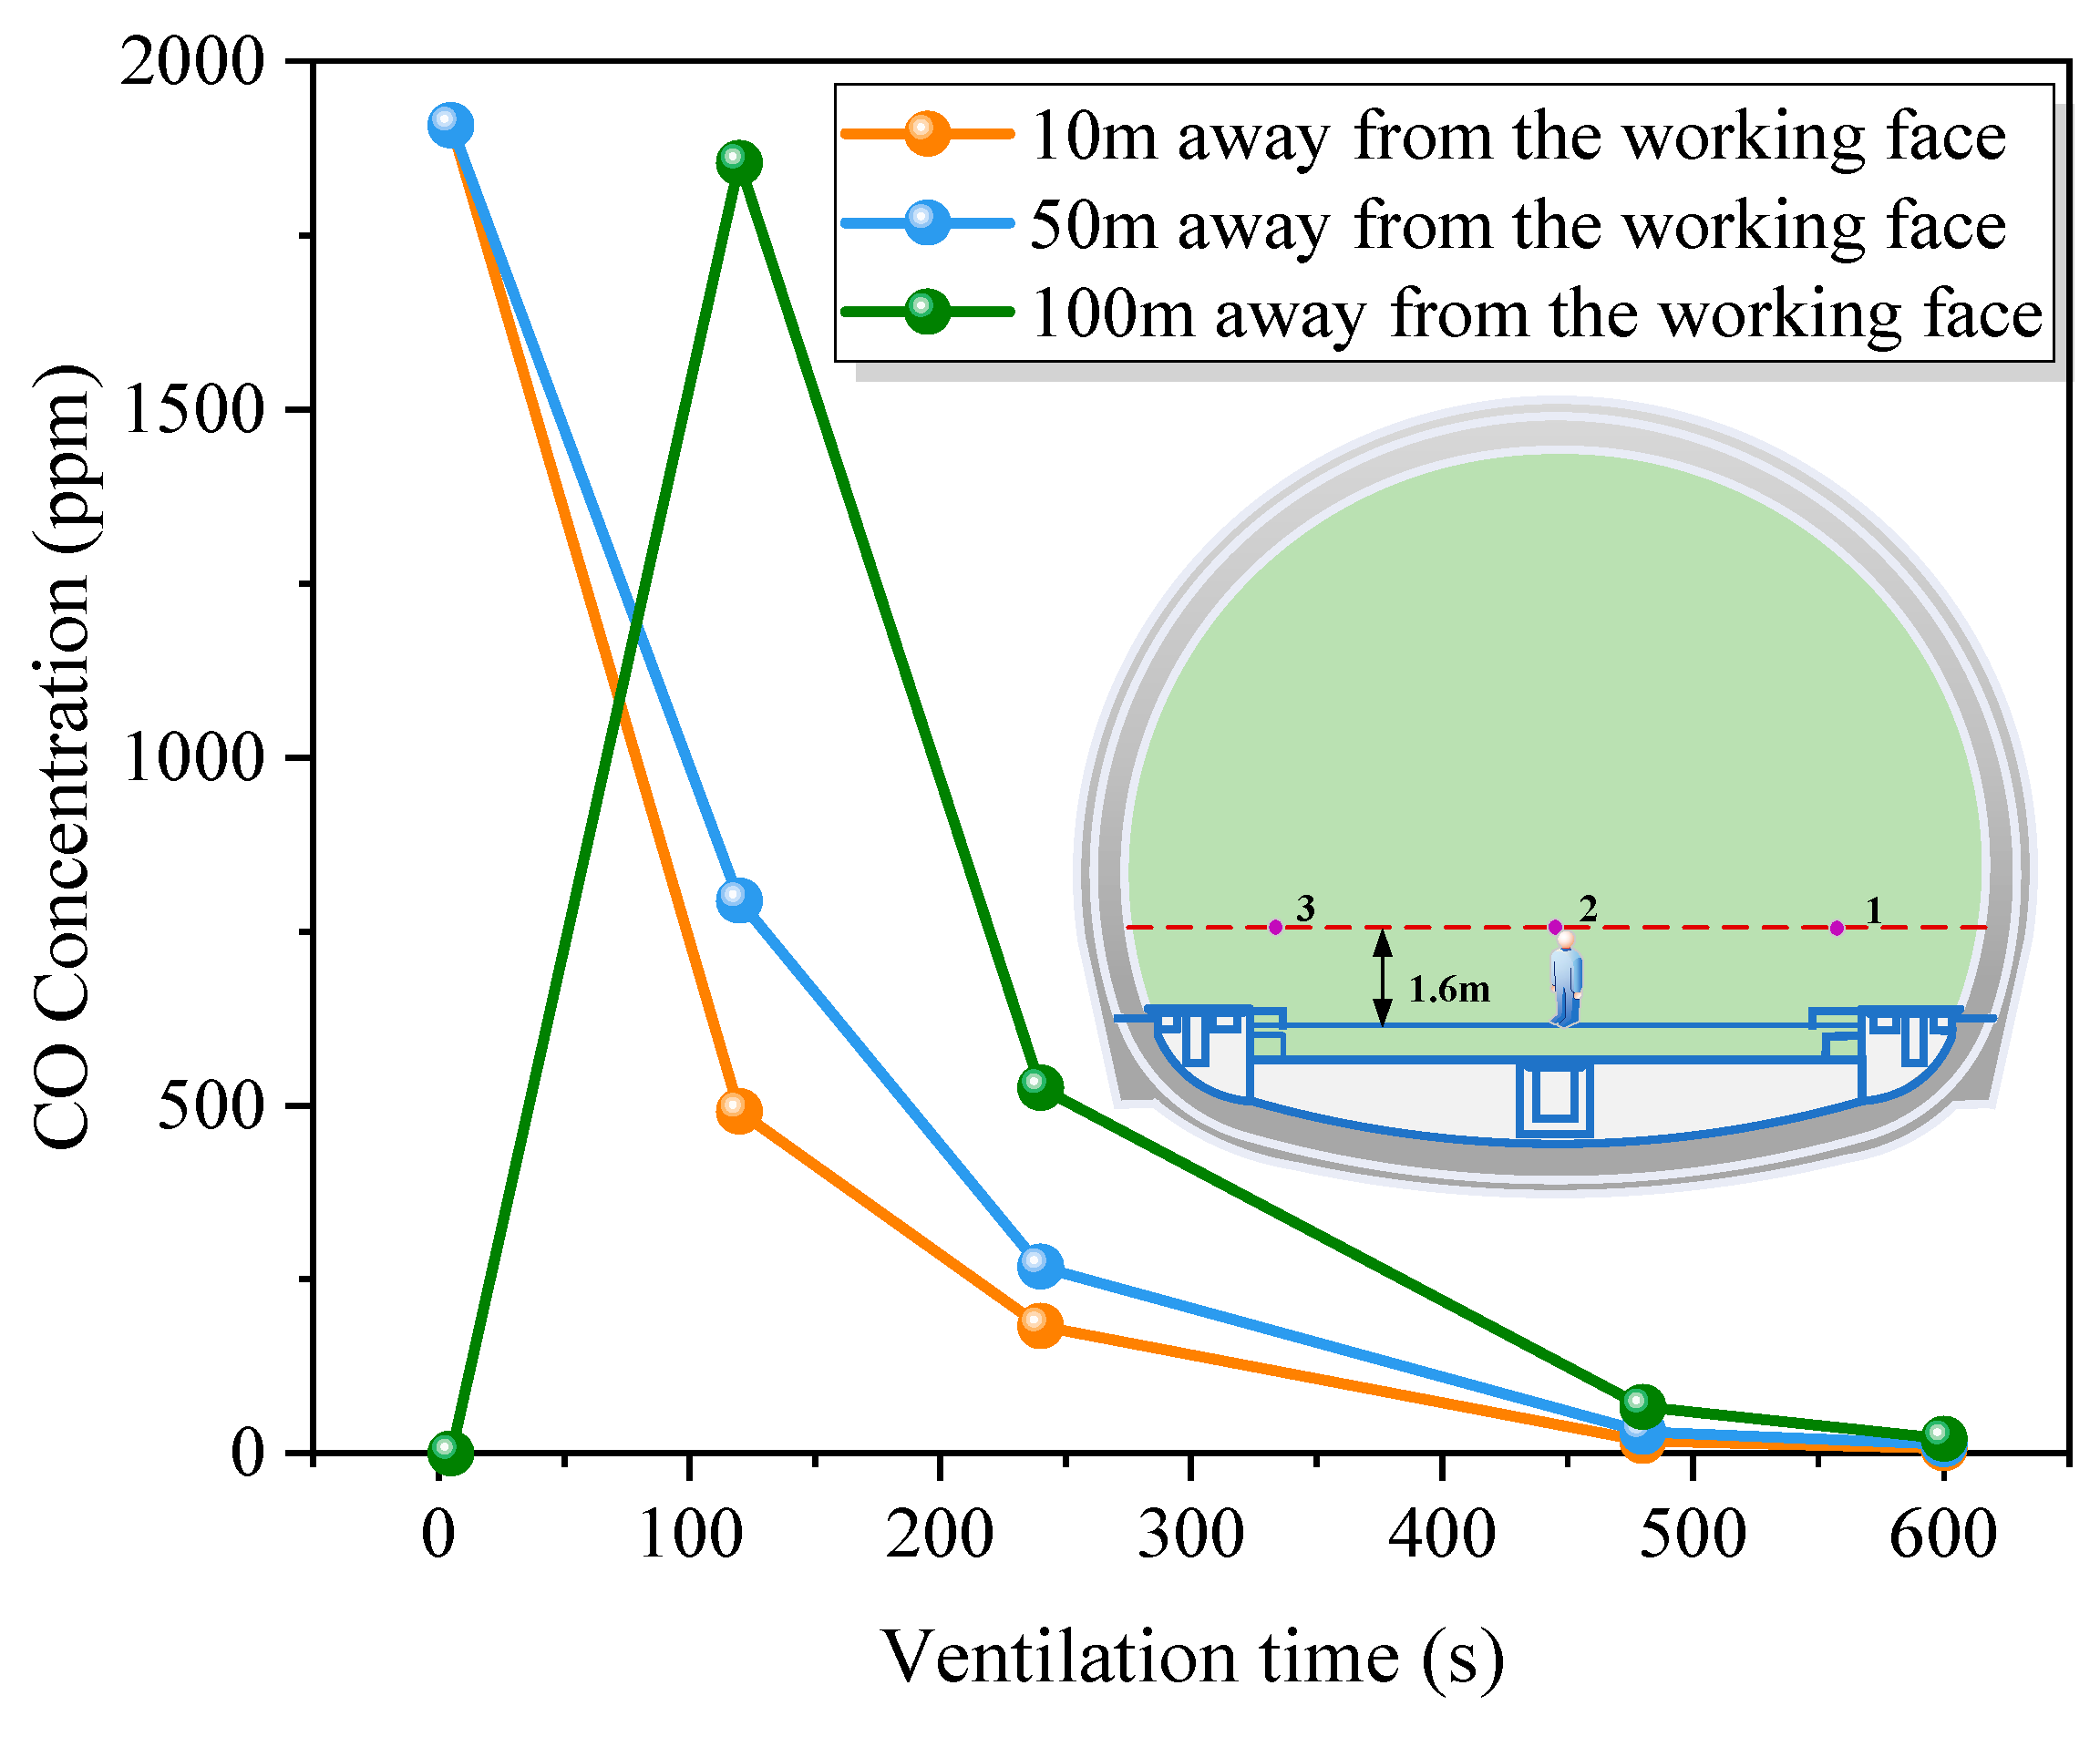
To investigate the variations in the CO concentration at the breathing height within a 100 m radius of the tunnel face after blasting, a height of Z = 1.6 m was selected for research purposes. Monitoring points were established at this height to create a curve depicting the CO concentration changes at the breathing height (1.6 m), as illustrated in
Figure 11.
As can be seen from
Figure 12, with the increase in time, the CO in the throwing length of the cannon smoke moves outward in a cone-shaped trend from low to high under the action of the airflow. After 480 s of ventilation, the CO concentration first drops below 24 ppm in the range of 15 m from the heading. At this time, the CO concentration at 50 m from the heading is 31 ppm, and there is still slight pollution. After ventilation for 600 s, the CO concentration in the 100 m range of the tunnel face is reduced to below 24 ppm; at this time, the CO concentration in the first 50 m range is reduced to below 10 ppm, and the CO concentration at the breathing height is around 7 ppm. Therefore, after ventilation for 10 min, the CO concentration in the 100 m range of the tunnel face meets the requirements for the underground engineering construction environment.
7. Discussion
Applying the improved TOPSIS theory to the optimization of the tunnel construction ventilation system can quickly obtain the optimal layout scheme. However, due to the complexity of the tunnel construction ventilation system, there are many factors (such as temperature, humidity, altitude, and the obstruction of construction machinery in the tunnel). In order to accurately obtain the appropriate TOPSIS decision parameters for the layout of the construction ventilation system, it is still necessary to further study the following aspects:
(1) A tunnel construction ventilation system is a nonlinear, multi-coupling, and multi-interference system, which is restricted by a variety of environmental factors. It is necessary to further study the superposition effect of key gas phase environmental parameters, such as the wind speed, pollutant concentration, air oxygen content, airflow temperature, and humidity in the construction tunnel, and to explore the relative membership degree and coupling evaluation analysis of complex environmental factors. The characteristics of the smoke–air flow coupling migration after tunnel construction blasting under multi-feature fusion conditions are analyzed, including the variation in thee pollutant concentration, diffusion rate, flow pattern, attenuation gradient, and subsidence characteristics with time and space, so as to obtain the TOPSIS decision parameters of the optimal ventilation scheme of the tunnel under a multi-field coupling environment.
(2) Based on the improved TOPSIS method, combined with the subjective and objective combination weighting strategy of the analytic hierarchy process and entropy weight method, this study effectively coordinates the data-driven objective analysis and the subjective judgment of expert experience. However, the existing weight calculation models mainly focus on technical performance indicators, while ignoring the key engineering practice factors of the construction ventilation system. Subsequent research can include economic indicators (ventilation costs, etc.), construction safety indicators (such as the probability of the excessive concentration of harmful gases on the working surface caused by poor ventilation), and engineering applicability indicators (such as system deployment flexibility, synergy with existing construction processes, and extreme environmental adaptability) into the comprehensive evaluation system, thereby improving the scientific nature and engineering guidance value of the construction ventilation system decision model.
(3) In view of the limitations of the above methods in practical engineering applications, such as a static model and insufficient dynamic adaptability, this study proposes that machine learning techniques (such as a long-term and short-term memory network LSTM or Bayesian optimization algorithm) can be used to dynamically model the construction ventilation system in the future. Specifically, by deploying distributed sensor networks to collect multi-source monitoring data, such as wind pressure, wind speed, CO concentration, temperature and humidity, in real time, the weight coefficient and ideal solution threshold of the TOPSIS model can be dynamically updated, so as to improve the prediction accuracy of the evaluation system under time-varying conditions.
8. Conclusions
In this paper, the distance from the outlet of the air duct to the tunnel face and the diameter of the air duct are studied by an orthogonal experimental design. Aiming at the influence of the position of the air duct of the axial fan in the tunnel on the ventilation flow field, the improved TOPSIS theory is used to conduct detailed data analysis, and the flow field characteristics are thoroughly examined to identify the optimal working condition configuration. The following conclusions can be drawn:
(1) The distance between the outlet of the air duct and the tunnel face is one of the key factors to improve the diffusion speed of CO. With the increase in the distance between the air duct and the tunnel face, the local CO concentration will first decrease and then increase, indicating that too large or too small a distance will weaken the effective emission capacity of the tunnel face. Therefore, the distance between the outlet of the air duct of the highway tunnel and the tunnel face is 15 m, which is the best scheme. In this scheme, there are obviously fewer vortex areas in the airflow field and fewer ventilation dead angles in the tunnel, so the accumulation of harmful gases in the tunnel is less.
(2) The application of the entropy weight method, analytic hierarchy process (AHP), and TOPSIS theory in the evaluation and optimization of ventilation tunnel flow field data constitutes a scientific, systematic, and reliable system. The combination of the entropy weight method and AHP can achieve an objective, subjective, more comprehensive, and reasonable weight distribution scheme. Using the TOPSIS theory, according to the weight determined by the entropy weight method and AHP, the decision matrix of the ventilation scheme is constructed. Then, the relative closeness of each scheme to the ideal solution and negative ideal solution is calculated. Finally, according to the size of the proximity, the schemes are sorted and the optimal scheme is selected.
(3) Through data analysis and processing, the specific optimization scheme is determined by relevant mathematical theories and verifying the flow field in the tunnel. Specifically, when the outlet of the air duct is 15 m away from the working face, the side wall of the air duct is 3 m away from the air, and the diameter of the air duct is 1.8 m; the CO concentration at the breathing height (1.6 m) within 100 m of the tunnel face is reduced to below 24 ppm after 600 s of ventilation, which meets the requirements of the underground engineering construction environment. The flow field in the tunnel shows a high degree of stability, and the wind speed is significantly increased. At the same time, the vortex area that may hinder the air flow is effectively eliminated, the ventilation efficiency is greatly improved, and the overall stability of the tunnel is enhanced to some extent.
(4) Considering that the environmental parameters in tunnel construction will change dynamically with the progress of the tunnel excavation, future research can combine the deep learning model to train the historical monitoring data samples, predict the CO diffusion trend and ventilation demand in real time, and dynamically adjust the fan power or air duct layout. Fans, ducts, and other equipment are connected to the Internet of Things platform, and the global optimization of ventilation systems is realized by collaborative control algorithms.


