Article

Improved Autogenous Healing of Concrete with Superabsorbent Polymers Evaluated Through Coupled and Air-Coupled Ultrasound

Department of Mechanics of Materials and Constructions, Vrije Universiteit Brussel, Pleinlaan 2, 1050 Brussels, Belgium
Buildings 2025, 15(10), 1691; https://doi.org/10.3390/buildings15101691
Submission received: 7 April 2025 / Revised: 23 April 2025 / Accepted: 14 May 2025 / Published: 17 May 2025

Abstract

Superabsorbent polymers have been introduced into cementitious materials to solve issues related to early-age cracking, caused by shrinkage, and manual repair. A general improvement of autogenous healing is noticed, while the extent and effectiveness depend on the type of hydrogel and the amount included. To evaluate the self-healing effectiveness, the regain of mechanical performance needs to be assessed. However, such evaluation requires destructive testing, meaning that the healing progress cannot be followed over time. As a solution, air-coupled ultrasonic testing was used within this study, adopting a novel laser interferometer as a receiver, to estimate the regained properties of cementitious mixtures with and without superabsorbent polymers. The sensitivity of ultrasonic waves to the elastic properties of the material under study allows us to monitor the crack healing progress, while the semi-contactless nature of the procedure enables an easy and reliable measurement. Up to 80% recovery in ultrasonic velocity was achieved with reference concrete, while SAP concrete demonstrated up to 100% recovery after wet–dry curing. Following microscopic analysis, up to 19% visual crack closure was obtained for reference concrete, compared to a maximum of 50% for SAP mixtures, for average crack widths between 250 µm and 450 µm.

1. Introduction

Concrete is abundantly used within the construction industry, owing to its high compressive strength. However, its tensile strength is relatively low, which increases the risk of cracking and the possibility of harmful substances entering the concrete element. These can cause damage to both the cementitious matrix and the included reinforcement [1,2,3], and limit the mechanical performance. Therefore, the repair of concrete structures is of high importance, but comprises a large part of the construction budget. Additionally, such repairs are mostly short-lived and cannot always be executed due to the inaccessibility of structures. The concept of self-healing concrete provides a solution to these issues.
Cementitious materials possess the ability to repair damage incurred through so-called autogenous healing [4]. The latter mainly includes the continued hydration of unhydrated cement at early age, while at later ages, the carbonation of calcium hydroxide is more pronounced [5]. To enable the occurrence of these processes, the availability of unhydrated cement and Ca(OH)2 is essential, as is the presence of water within the cracked region. Therefore, the effectiveness of autogenous healing remains limited to the (partial) closure of relatively narrow cracks, i.e., below 100 µm to maximum 300 µm [6,7]. In an effort to improve the autogenous healing capacity, the inclusion of superabsorbent polymers (SAPs) has been investigated [8,9]. SAPs provide the ability to absorb and store large amounts of fluids relative to their own weight. In this way, when present inside the cracks, the SAPs absorb moisture from the outer environment and release it when the relative humidity has lowered, so that the autogenous healing process can be prolonged. It should be mentioned, however, that care should be taken with the amount of SAPs added to the cementitious mixtures, as the swelling of SAPs during the mixing process increases the final porosity of the hardened material. A higher amount of voids reduces the durability and negatively affects the compressive strength [10,11].
It is clear that self-healing cementitious materials provide an inexpensive and fast solution for concrete repair, since it is automatically activated upon cracking and no manual labor is involved. Moreover, considering the ease of cracking in concrete elements under tensile stresses, either due to external tensile loading or restrained shrinkage, improved autogenous healing seems to provide a solution to maintain the strength and durability and to increase the lifetime of concrete structures. An assessment of the regained performance is, however, necessary to ensure a safe environment for the user. Up to now, many techniques have proven their capability to evaluate the closure of cracks but are mostly limited to lab-scale applications or do not allow for a direct link with the regained strength. In the latter category, optical microscopy [12] and water permeability tests [13] are included. While microscopy allows us to visualize the closure of cracks at the outer boundary, the deposition of healing material provides no guarantee for a physical connection between the crack faces, nor does it mean that healing occurred inside the crack. In case of permeability tests, the physical blocking of the water flow through the crack gives an indication of the sealing effect, but the mechanical strength of the healing material remains unknown. This property can be assessed through mechanical tests [14], but these are not applicable in situ because of their destructive nature. Therefore, recent research has focused on the use of elastic waves to monitor the healing and repair processes within cementitious materials [15,16,17]. As the application of elastic waves is nondestructive and they are sensitive to the elastic properties of the material under study, an estimation of the regained mechanical performance becomes possible. So far, the adoption of ultrasound (US) has mostly been limited to contact experiments, where transducers are physically connected to the element under study by means of a coupling agent, or semi-coupled, where the generated signal is emitted in a non-contact manner and the received signals are captured through contact transducers. The coupling of sensors has the drawback of increasing the measuring time significantly, due to the manual labor involved. Additionally, the manual application of the coupling agent and the connection of the transducers cause inherent errors in the measuring results, though these are limited to a certain extent when conducted by an experienced individual.
As a next step towards the fully air-coupled monitoring of self-healing cementitious materials, a coupled ultrasonic emitter and a contactless receiver are applied in this research. Due to the high acoustic impedance mismatch between concrete and air, air-coupled ultrasonic measurements are characterized by low signal-to-noise ratios, complicating the resulting conclusions. For this reason, a specific stacking procedure was adopted to analyze the data. Details of this method are briefly explained in later sections. To bridge the gap between coupled and air-coupled ultrasound, semi-contactless measurements can be conducted that utilize an air-coupled emitter or receiver, while the other remains coupled. It should be mentioned that, while semi-contactless ultrasonic monitoring of self-healing was performed by the authors before and can be found in the literature, the present study utilizes a new type of air-coupled receiver that is not piezoelectric. The acquisition principle is based on laser optics and the response is flat, allowing variations of the studied frequency in the future. To complement these measurements, fully coupled ultrasonic measurements were conducted alongside the air-coupled experiments, and microscopic images of the crack width were taken over time as a means of comparison. Through the use of both coupled and air-coupled ultrasound, the potential of air-coupled measurements was confirmed, while the effect of SAPs for self-healing purposes was studied. This study therefore provides a step forward in the development of a reliable, fully air-coupled ultrasonic set-up to assess the damage and repair of cementitious specimens.

2. Materials and Methods

2.1. Raw Materials and Sample Preparation

Two concrete mixtures were utilized within this study, i.e., one reference material and one blend with SAPs to promote self-healing ability. Both mixtures were nearly identical, except for the added SAP particles and additional water in the SAP concrete. The cement used was Portland cement CEM I 52.5N Strong from Holcim (Nivelles, Belgium). Concerning the aggregates, sand, small stones, and gravel were added. All aggregates were dried in an oven at 60 °C for 48 h to remove excessive moisture. The sand was sieved to a maximum particle size of 850 µm after drying. The small stones had particle sizes between 4 mm and 8 mm, and the gravel measured between 6.3 mm and 14 mm. The weight ratios of aggregates compared to cement were equal to 1.27, 1.27, and 2.36 for sand, small stones, and gravel, respectively. The water-to-cement ratio was equal to 0.35, and a superplasticizer was used to improve the workability. The superplasticizer was MasterGlenium 51 from BASF (Ludwigshafen, Germany) and was added in an amount of 0.6% by weight of the cement.
For the mixtures with superabsorbent polymers, 0.5% Floset27 CC from SNF (Andrézieux-Bouthéon, France) was added. The SAP under study is a cross-linked copolymer of acrylamide and acrylic acid, with particle sizes up to 600 µm. The d25, d50 and d75 are approximately equal to 180 µm, 250 µm, and 320 µm, respectively [18]. Due to the absorption of water during mixing, additional water was added to the SAP concrete to compensate for the loss of workability. A preliminary flow table test was conducted to determine the amount of extra water needed to obtain identical workability compared to the reference concrete. The amount of water was equal to 20 g per gram of SAP added.
Two beams measuring 100 mm × 100 mm × 300 mm were cast per composition and were left to cure for 28 days at 20 ± 2 °C. The beams were then cut to obtain four cubical specimens per mix, with a rib size of 100 mm (see Figure 1). The cast side edges were avoided. For the ultrasonic measurements, a through-the-thickness mapping technique was applied, which will be explained later. Therefore, the cut faces of the cubes were divided into 49 square zones, by means of a marker, as can be seen in Figure 1. To create a crack that can eventually be healed, a Brazilian splitting test was conducted. The loading beam was positioned parallel to the cut faces with a measuring grid in the middle of the specimen. After splitting, two separate halves were received, which were reassembled using a small metal tab and glue on all four sides. Average crack widths between 250 µm and 450 µm were obtained.
To promote crack closure, three out of the four cracked specimens per mixture were placed within wet–dry curing cycles, consisting of 1 h submersion in water at 20 ± 2 °C and 23 h of dry conditions at 20 ± 2 °C and 60 ± 5% relative humidity. The total healing period lasted for 28 days. The remaining specimen was kept for 28 days at ambient conditions of 20 ± 2 °C and varying relative humidity, so little to no healing was expected.

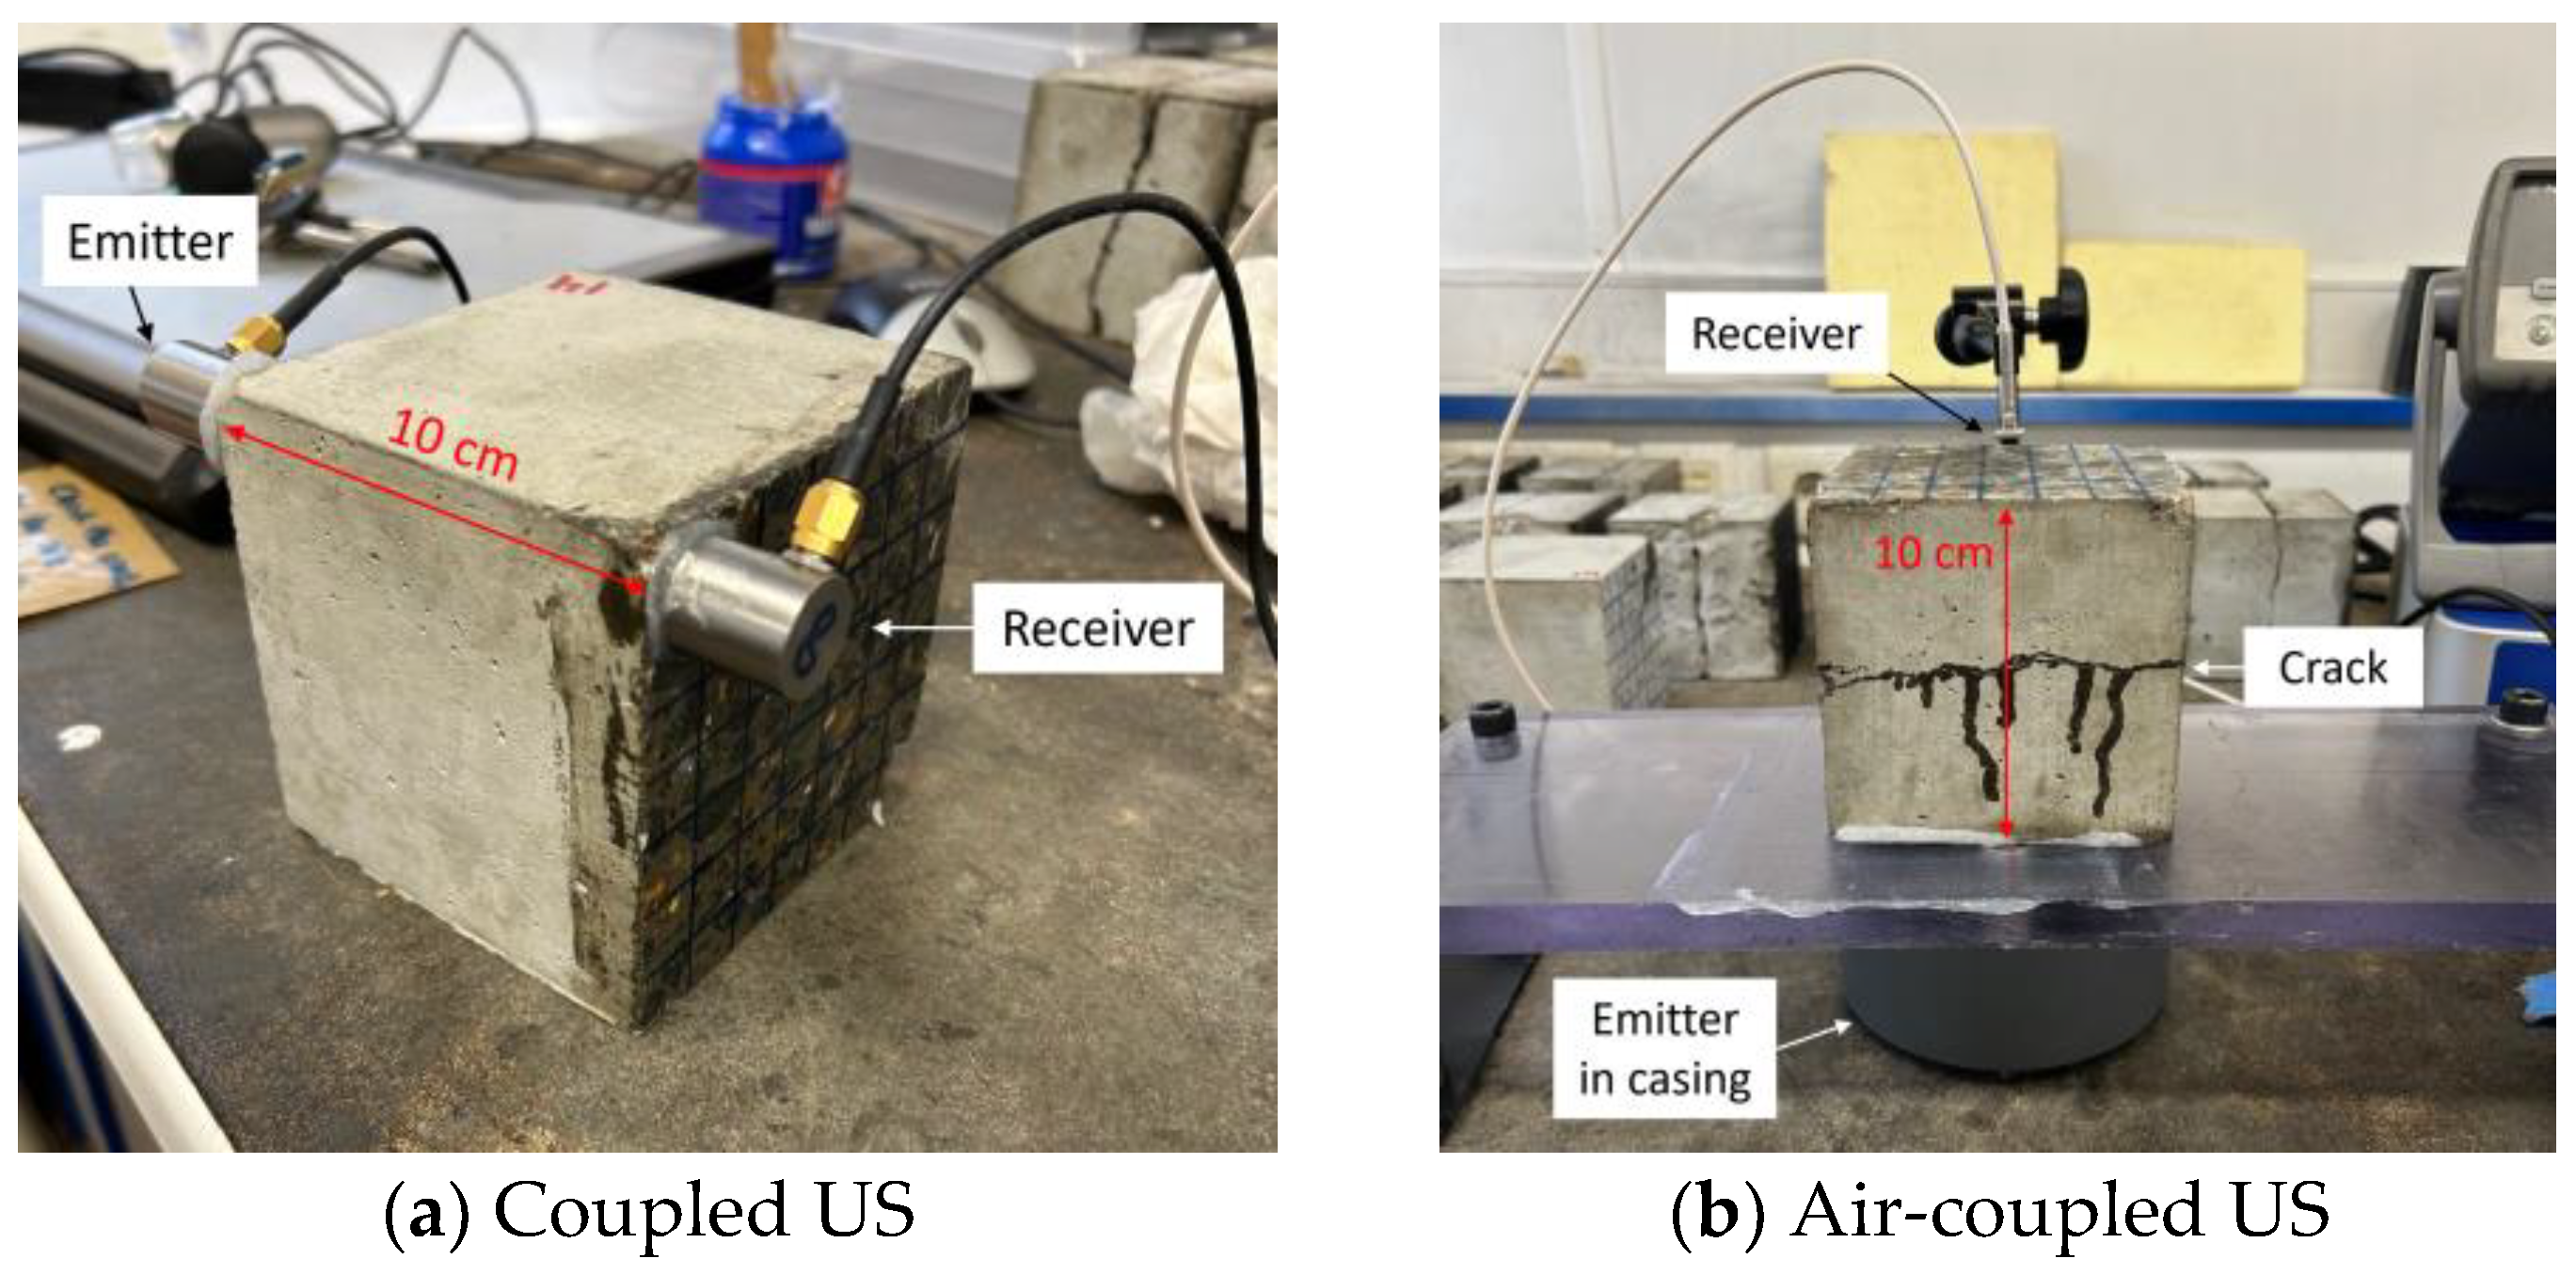
2.2. Ultrasonic Transmission Measurements

The monitoring of the cracking and healing stages was performed through ultrasonic transmission measurements, meaning that the emitter is placed on one side of the specimen and the receiver captures the signal at the opposing surface after it travels through the entire concrete specimen. During a single measurement, the emitter and receiver are positioned within one of the square zones, with a travel path of 10 cm (specimen thickness) perpendicular to the faces with the marked grid. An example can be seen in Figure 2a, for the coupled ultrasonic set-up. Measurements were taken in the different marked areas by changing the position of the two transducers step by step. Each specimen, as well as the one kept in dry conditions, was monitored before cracking, after cracking, and after 3, 7, 14, and 28 days of healing. Regarding the specimens stored in wet–dry curing cycles, the moment in time of the ultrasonic measurements was important with respect to the submersion period, as the saturation of the specimens changes the ultrasonic parameters. Therefore, a drying period of 16 h after the submersion was maintained at all times.
The coupled ultrasonic set-up consisted of two R15α piezoelectric sensors, with a physical size of 17 mm and a resonance frequency of 150 kHz. Both transducers were attached to the concrete specimen by means of a coupling agent and were kept in place by hand so that a nearly identical pressure was applied for all measuring points. The emitted signal was created through a waveform generator and was a single-cycle sine wave with a frequency of 150 kHz and an amplitude of 5 V. After each measurement, i.e., the emission and reception of one signal, the sensors were placed onto the next measuring square. All 49 locations were monitored throughout the entire healing period.
For the air-coupled measurements, a Panametrics V413 sensor was used as the emitter, while a contactless Eta450 Ultra was used as the receiver. The Panametrics V413 transducer is a relatively broadband piezoelectric sensor with a center frequency of 250 kHz and a physical size of 41 mm. The Eta450 Ultra is referred to as an optical microphone. This receiver is a “Fabry-Pérot” laser interferometer, which is sensitive to the periodic variations of the refractive index of air after wave excitation. Its response is nominally flat as it does not include vibrating parts (no resonance). The set-up consisted of placing the specimen, with one of the sides having a measuring grid, on top of the emitter with the coupling agent as in Figure 2b, aligning the center of the emitter with the center of one measuring location. The Eta450 Ultra was then positioned on the top side, aligned with the centers of both the transducer and the measuring location, maintaining an air gap of approximately 1 cm between the specimen and sensor. Because of the center frequency of the Panametrics V413 sensor, the emitted signal was in this case a sine cycle with a frequency of 250 kHz. Also, an amplifier was used to increase the voltage level up to 600 V, so that the low transmission through air was partially compensated. The impedance mismatch, however, still causes a relatively low signal-to-noise ratio compared to the coupled measurements. This makes it difficult to pinpoint the arrival of the longitudinal wave. As will be explained in the Results Section later, the response after cracking of the concrete cubes showed an even stronger reduction in the signal-to-noise ratio compared to the uncracked state, and the arrival of the longitudinal wave was not detectable any longer. For this reason, not one signal, but 300 waveforms were emitted and received per measuring location, so that an average response could be calculated with compressed noise. Due to this significant enlargement of the received data, the number of measuring locations was limited to the 25 central squares in the case of the uncracked specimens and to the central 9 squares for cracked and healed specimens. The center points of the grid were chosen as there would be no other way to characterize the healing within this part of the specimens, while microscopic measurements were taken from the outer boundaries.

2.3. Microscopic Measurements of the Crack Width

The physical closure of the cracks was monitored throughout the wet–dry curing cycles by means of microscopic analysis. A Leica S8 APO microscope with a DFC 295 camera was utilized to acquire pictures of the crack openings over time, so that measurements of the crack size could be taken. Six locations were chosen per specimen, divided into two opposing surfaces with three measuring locations. These locations are coplanar with the measuring grid’s line numbers 2, 4, and 6 (top to bottom when considering the set-up shown in Figure 2a). The top and bottom surfaces of the cubes were thus not monitored because of the crushing of concrete that occurred during the Brazilian splitting test.

3. Results

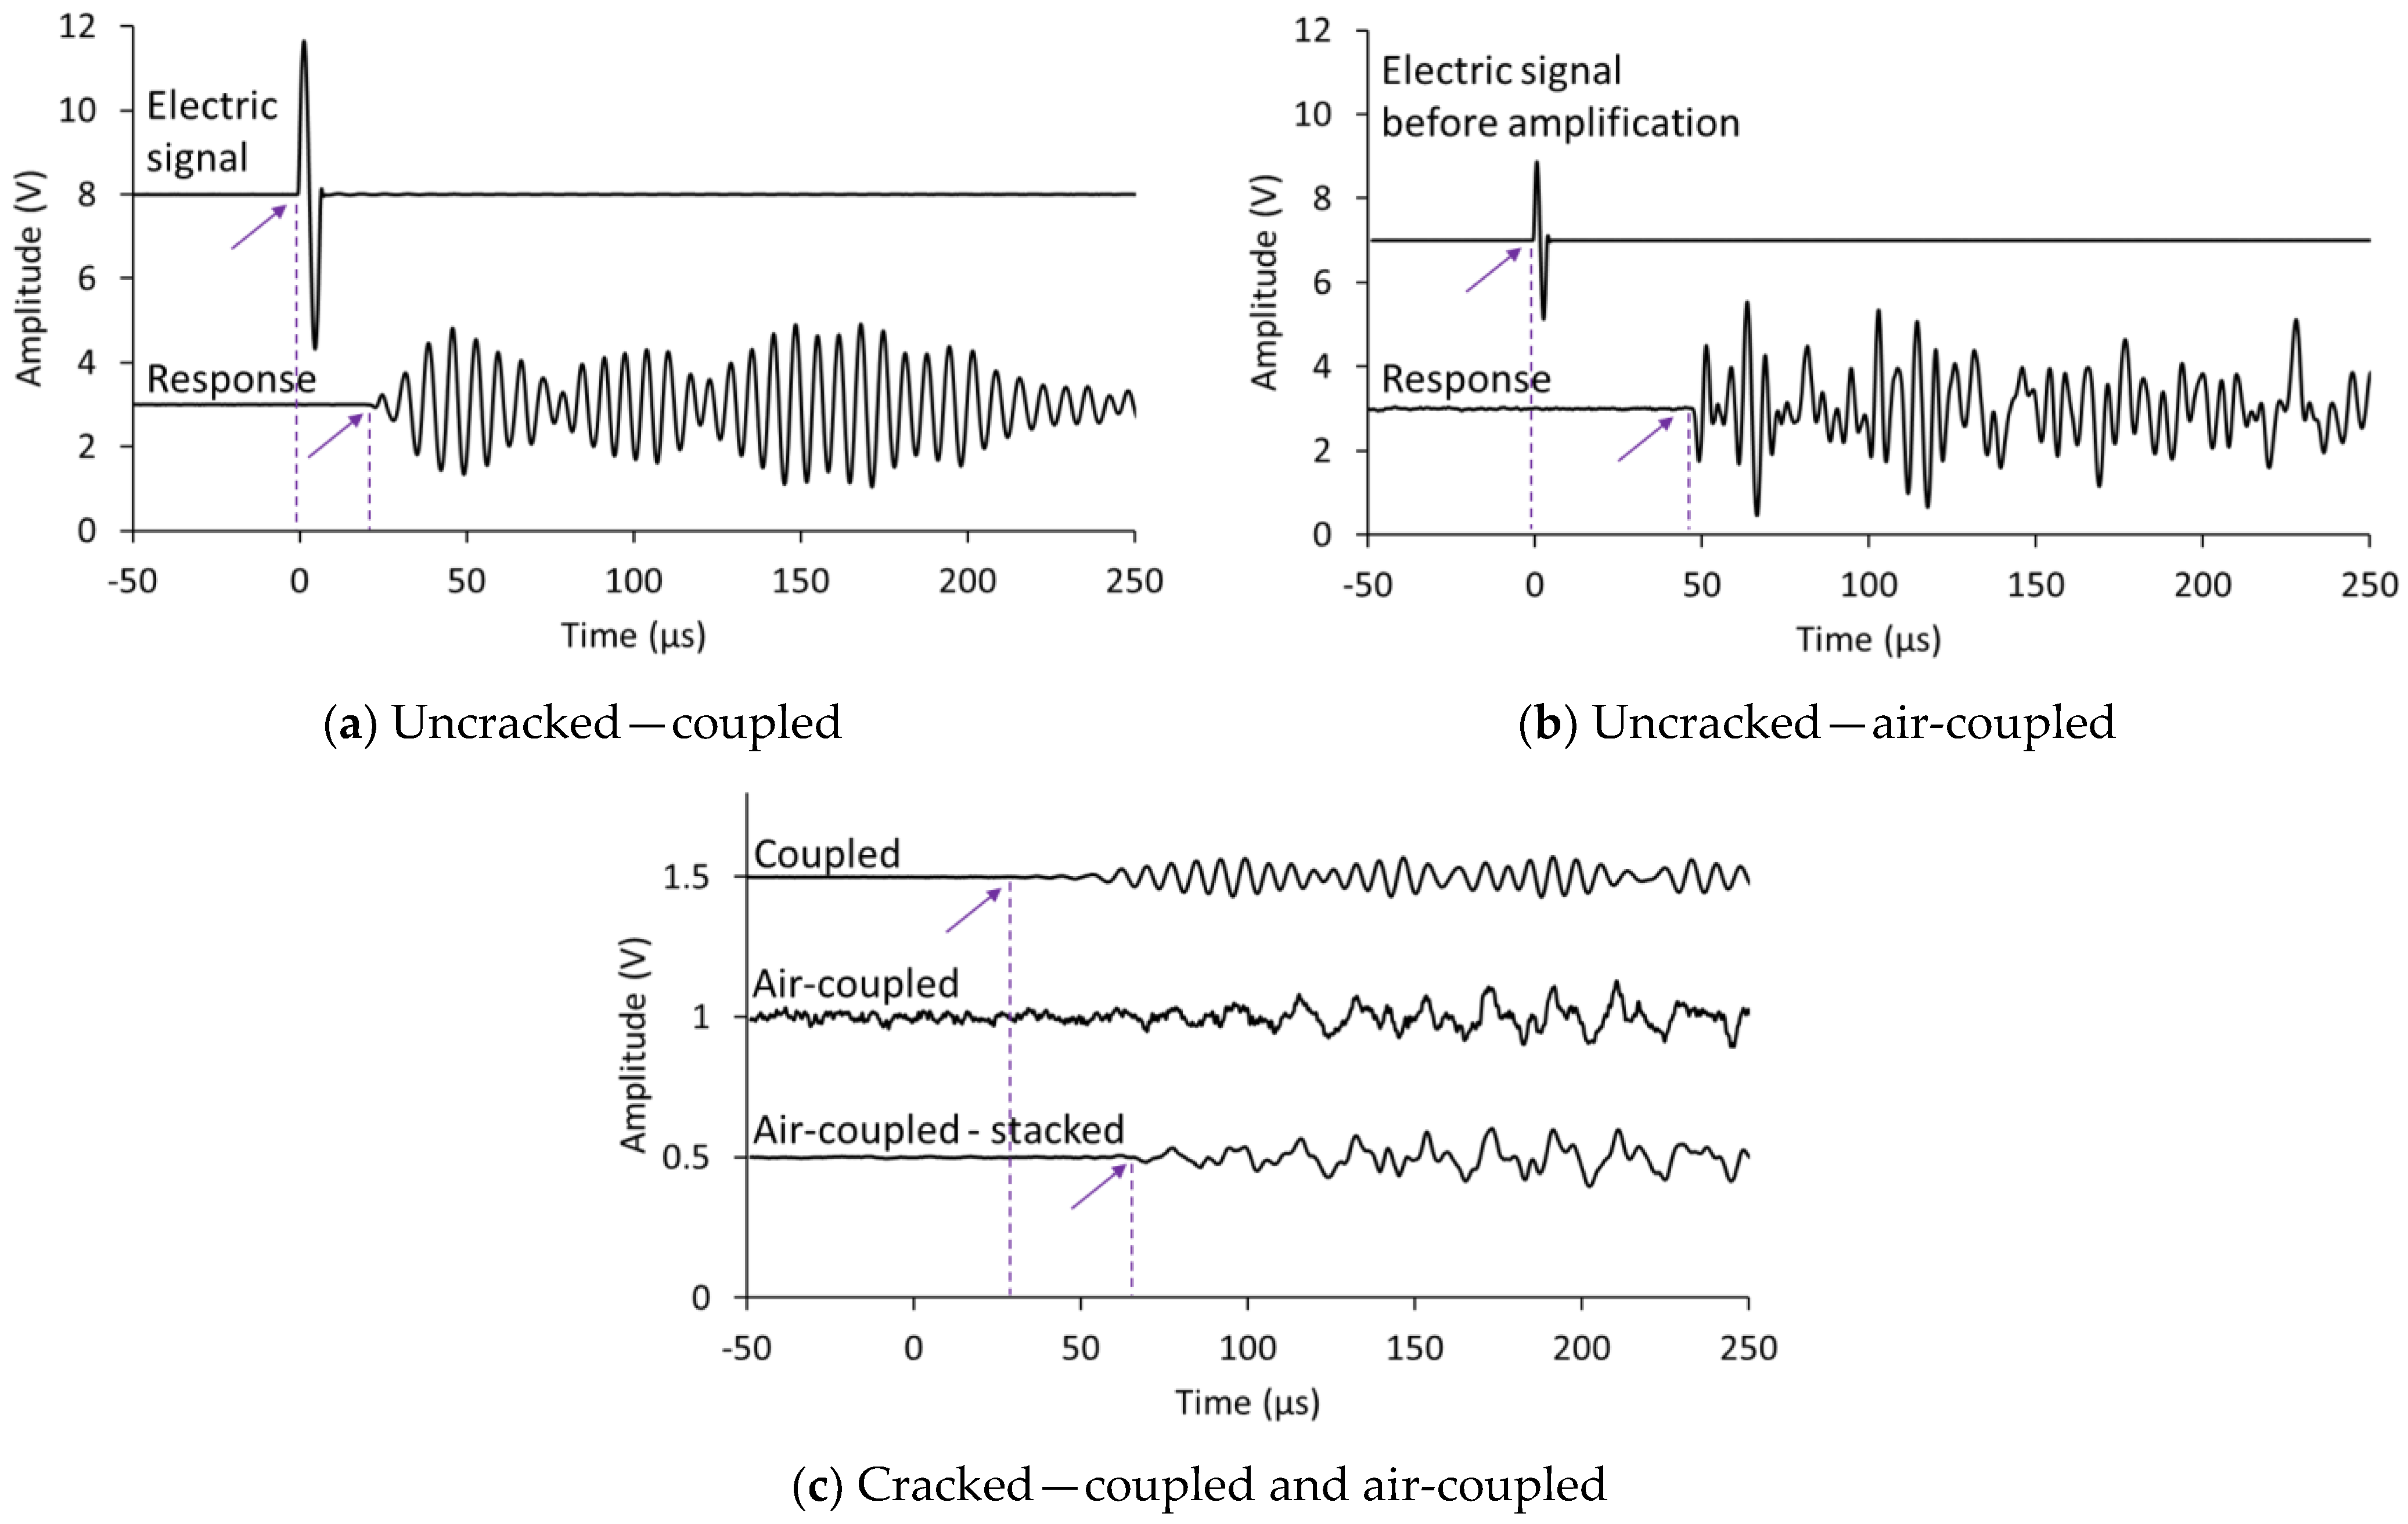
3.1. Introduction to the Raw Data and Analysis Procedure

The raw data of ultrasonic measurements simply consists of received waveforms. Both the electric signal and the signal captured after traveling through the specimen are stored by the data acquisition system. In the case of the coupled experiments and the air-coupled measurements in the uncracked state, one signal is linked to one measuring location. An example of the obtained data is shown in Figure 3a,b for coupled and air-coupled measurements on uncracked reference concrete. The electric signal is the one created by the waveform generator and starts at time 0. A time delay should be taken into account for the conversion of this signal to a pressure wave within the emitting sensor (sensor delay effect) and is equal to 1.3 µs for the coupled set-up. The arrival of the response at the receiver comes later, i.e., about 21 µs in the example in Figure 3a, and is related to the conditions of the travel path of 100 mm inside the concrete. A lower travel time indicates a better quality of the material under study.
The air-coupled response of the same measuring location is shown in Figure 3b. The response shows a significant delay in the arrival of the longitudinal wave, which is mostly caused by the air gap between the receiver and the specimen. Therefore, the travel time through air was subtracted from the total travel time, to obtain information on the concrete specimen only. Besides the delay in arrival, it is also noticed that the amplitude of the received signal is comparable to, and even higher than, the signal from the coupled measurements. However, one should keep in mind that the amplitude of the electric signal of the coupled measurements was equal to 5 V, while the amplitude in air-coupled experiments was amplified to 600 V.
Figure 3c depicts the response of this reference specimen after crack creation. The electric signal is not included, since it is identical to the uncracked experiments. For the coupled response, a delay in the arrival of the wave compared to the uncracked state can be noticed, i.e., the arrival is at 32 µs, together with a reduction of the amplitude received. Both phenomena are caused by the discontinuity within the travel path, which leads to a longer travel time and an attenuation of the signal. Continuing with the air-coupled response, the exact arrival of the longitudinal wave could not be distinguished, due to the high level of noise. Therefore, 300 wave signals were recorded from one measuring location and an average response was calculated. This procedure is referred to as “stacking”. The obtained stacked wave, shown in Figure 3c, reveals a reduction in the noise level and thereby an increase in the signal-to-noise ratio from 3 to 33. Thanks to stacking, the onset of the waveform could again be pinpointed, also showing a delay compared to the uncracked air-coupled case.

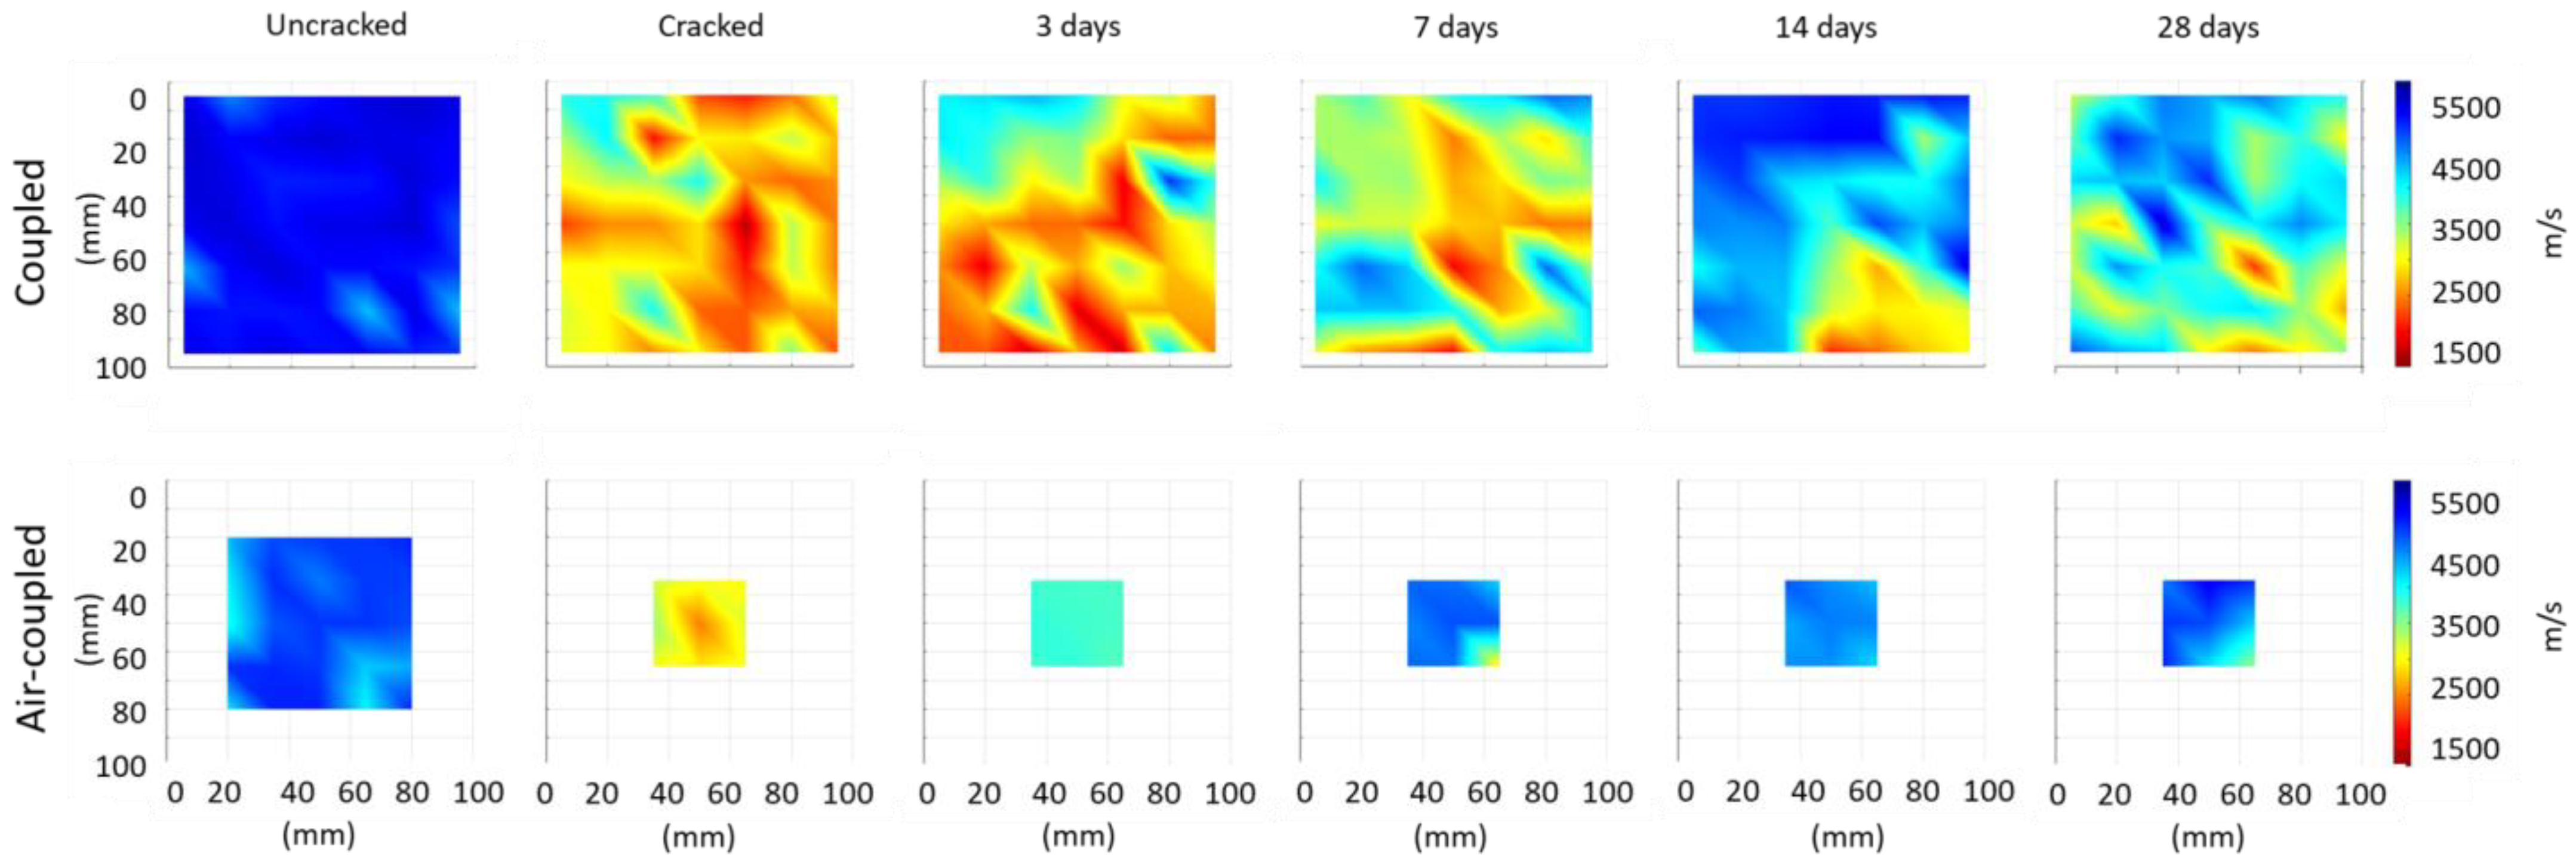
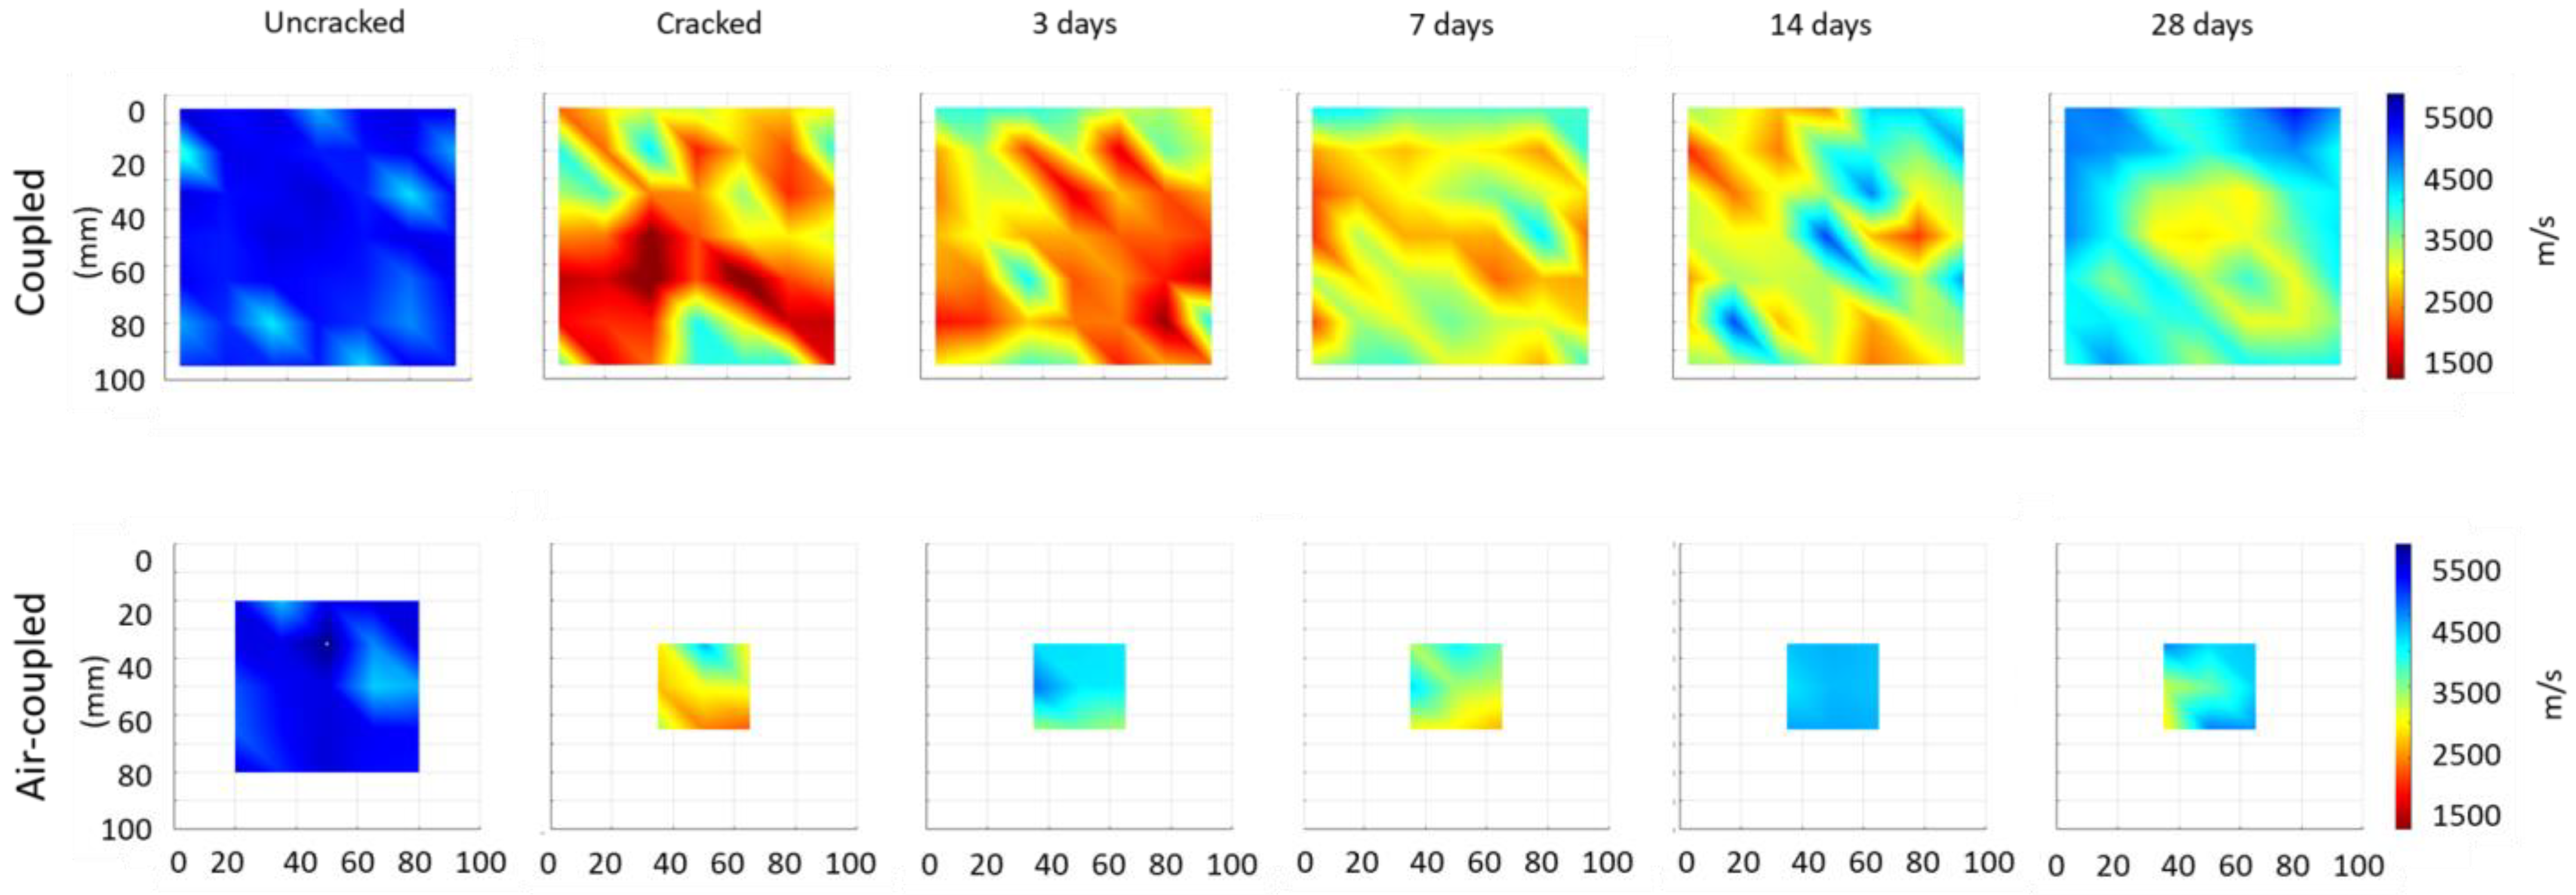
3.2. Ultrasonic Transmission Measurements

From the raw data presented above, the longitudinal wave velocity was calculated for all measured points. Firstly, the travel time through the concrete specimen was determined by subtracting the travel time through the air gap, considering the correct distance of air, from the total travel time. Afterwards, the thickness of the concrete specimen was simply divided by the travel time through the concrete. The velocities of each point were then utilized to create colored velocity maps (see Figure 4), obtained by interpolation of the exact results in the various measuring points. Since the interpolation can only be conducted between two or more measured values, the outer boundaries do not show any velocity values.
In Figure 4, an example of a reference specimen healed in wet–dry curing cycles is shown. The wet–dry cured specimen is representative of the others from the same blend, as similar velocity trends were found. The goal of presenting this first set of color maps is to explain the basic evolution of the velocity during healing and compare the coupled results with the air-coupled ones. When focusing on the coupled results, comprising all 49 measuring points, one can clearly distinguish the uncracked from the cracked state by the large reduction in velocity values upon fracture. For the uncracked specimen, a fairly homogeneous map with values around 5000 m/s was obtained, while after cracking, the velocities reduced to values of 2000 m/s. Also, the variation between the different measuring points is much higher, indicating that the cracking (and reassembling) leads to a certain variability in crack size and geometry, as expected. During the curing in wet–dry cycles, the velocity gradually increased at all of the measuring points, meaning that partial crack healing was achieved. Between 14 and 28 days, however, a reduction in velocity in some of the points occurred, as can be noticed in the bottom left and top right zones of Figure 4. These localized velocity drops could have been caused by the removal of debris and healing products that were not attached well through the flow of water present during the wet–dry curing cycles.
Underneath the coupled ultrasonic results, the velocities measured using air-coupled US are shown. As a reminder, the maps are smaller because the number of measuring points was reduced. The coordinates, however, correspond to the ones of the coupled results. It was noticed that the trends obtained from air-coupled measurements are similar to the ones explained above, i.e., relatively high velocity values were received in the uncracked state, while after cracking, the velocity was significantly lowered. Over time, the velocity increased thanks to the wet–dry curing cycles, reaching values up to 5000 m/s after 28 days. To obtain a more global comparison between coupled and air-coupled ultrasound, the average velocity was calculated per specimen and is presented in Figure 5. To make the comparison valid, the average of the coupled measurements only comprised the common points (central ones) measured from both techniques. Figure 5a reveals the evolution of the average velocity of all reference specimens using coupled US. The uncracked situation is represented by the higher velocity values at day 0, while the lower ones were obtained after cracking of the specimens. The intact specimens all show similar velocities close to 5000 m/s, which indicates a well-compacted, high-quality concrete mixture [19]. Moreover, after cracking, the received velocities are closely related, ranging from around 2800 m/s to 3100 m/s. The three specimens placed in wet–dry curing cycles then showed an improvement in velocity over time, which indicates that partial healing occurred. For two of these specimens, a reduction was observed between 14 and 28 days, similar to what was seen in the velocity maps in Figure 4. The loss of debris or deposited healing products through the flow of water is a possible reason for this phenomenon. Besides these healed specimens, one sample was kept in dry conditions. For this specimen, few fluctuations in the average velocity were obtained during the four-week period, while the final velocity value was much lower compared to the healing specimens. This result also supports the fact that wet–dry curing aids the self-healing process, as continued hydration and calcium carbonate precipitation only occur in the presence of water.
Next to the coupled results, the velocities received from air-coupled measurements are depicted in Figure 5b. Uncracked concrete specimens led to relatively high velocities between 4600 m/s and 5000 m/s on average. The subsequent cracking of the specimens is responsible for the lower velocities, ranging from 2800 m/s to 3400 m/s. Afterwards, thanks to the wet–dry curing cycles, a restoration of the velocity towards the initial, intact values was observed in all three specimens. The sample that was kept in dry conditions, however, despite some fluctuations, showed essentially no improvement over time. It can be concluded from these results that both coupled and air-coupled ultrasound are capable of monitoring the cracking and healing progress within cementitious materials. When directly comparing the velocity values between both techniques, it can be seen that these are not identical, though similar. Since the frequencies utilized are distinct, meaning that the wavelength differs and therefore also the interaction between the ultrasonic signal and the microstructure changes, identical velocities should not be expected [20]. Most important is the fact that the trends are closely related, e.g., the discrepancy between specimens healed in wet–dry cycles and a dry specimen, supporting the validity of the air-coupled method.
Figure 6 presents the coupled and air-coupled ultrasonic velocities for a SAP specimen that was healed in wet–dry cycles. Before cracking, velocity values around 5000 m/s were observed with both techniques used. The creation of a crack then lowered the velocity within the SAP specimen and induced more heterogeneous spreading of the values. While we attempted to obtain similar crack widths from all sides of the cubes during the reassembly, exerting pressure on one side of the specimen tended to open the crack on the opposite side, leading to a certain range of crack sizes within all specimens tested. The cracked samples represent these dissimilar sizes clearly, showing different velocities within the discrete measuring locations, as seen in the reference specimen. Over time, thanks to the wet–dry curing process, the wave velocity was partially restored. When comparing the coupled and air-coupled results, similar trends were observed, highlighting the general restoration of the ultrasonic pulse velocity.
The comparison between the coupled and air-coupled results thus demonstrated the validity and potential of the air-coupled set-up for monitoring the self-healing process. This was a necessary step to allow for a comparison between the different mixtures tested, based on air-coupled US, as this optical microphone was used for the first time. Subsequently, the reference and SAP mixtures are compared to one another in Figure 7. Firstly, the behavior of the SAP specimens should be explained in detail. The trends observed in the velocity maps of Figure 6 seem to be representative of the three specimens healed in wet–dry cycles, shown in Figure 7b. Velocities between 4600 m/s and 5000 m/s were present in the intact state, while the velocity lowered after cracking to 3000–3300 m/s. For the samples placed in wet–dry curing cycles, some fluctuations in the average velocity were noticed during the first week, whereafter a restoration took place. After four weeks of healing, the velocity attained values between 3900 m/s and 4800 m/s, indicating that partial filling of the crack occurred. The SAP concrete cube that was kept in dry conditions for the same period showed a little recovery over time. Still, the restoration was higher compared to the reference, as the SAPs are able to store moisture from the environment for a longer period of time.
A comparison between the reference and SAP specimens immediately shows similar trends for all specimens tested. While the samples kept in dry conditions did not reveal any sign of healing, all other cubes demonstrated an improvement of the wave velocity from after cracking to 28 days of wet–dry curing. However, the rate of improvement was different between the two mixtures tested. For reference specimens, one can observe a fast restoration during the first week of curing, which is mostly linked to the continued hydration of unhydrated cement. Since a w/c ratio of 0.35 was used, a certain amount of unhydrated cement was present in all mixtures. Thanks to the one-hour submersion in water, moisture entered the cracked specimen and continued hydration took place. Afterwards, the velocity increase slowed down, whereas for one reference specimen, a reduction was noticed. The lower recovery rate is most likely caused by the fact that less unhydrated cement is present within the concrete specimens. While healing can continue through the carbonation of Ca(OH)2 and its precipitation within the crack, the deposition of previously formed healing products also hinders access to water. Concerning the SAP concrete, a strong increase within the first three days was seen, caused by the intrusion of water and continued hydration, also seen in the literature [21,22]. Later, the healing process slowed down, which can be linked to the sealing effect induced by SAPs, i.e., as water tends to enter the material, the SAPs swell and block the crack entrance. When SAPs block the crack entrance, no water is available for further hydration and calcium carbonate precipitation. The further improvement in velocity, after one week of curing, is more gradual than seen during the first three days but continues at a steadier rate compared to the reference cubes. The reader is reminded that here, for the analysis shown in Figure 7, only nine measuring points within the center of the specimen are included for the average velocity. The blockage of the crack, either caused by SAP swelling or through deposition of healing products at the outer boundaries, is a major factor in the self-healing process and therefore strongly affects the results in the inner cracked region. The outer boundaries, which have easier access to water, are more likely to heal (faster), which is why microscopic analysis was performed.

3.3. Microscopic Analysis

Microscopic pictures of the crack openings were taken during the healing period to determine the self-healing performance. Concerning the results shown below, the average crack width per specimen was calculated. It should be noted that relatively high standard deviations on the average values were observed, even reaching more than 100%, since the healing process strongly depends on the availability of water, unhydrated cement particles, SAPs, and Ca(OH)2 inside the crack. One position can therefore be sealed completely, while another remains open throughout the entire period of healing. To give an idea of the collected data, i.e., the microscopic pictures, the evolution of the crack opening of two specific positions is presented in Figure 8. This figure contains one partially healed crack and one non-healed crack. It can be seen that for the position measured in the SAP specimen, the crack size gradually decreases, while between 14 and 28 days, deposition of healing products can be seen through the whitish filling of the crack. In the reference specimen, the crack width reduces marginally, and no healing products could be found. This specimen was not placed in wet–dry curing cycles.
The average crack widths per specimen are depicted in Figure 9 for all reference and SAP specimens. For the reference concrete, average crack widths between 230 µm and 330 µm were obtained upon reattachment of the two halves after cracking. During the 28-day healing period, it was noticed that the average crack widths were reduced for all specimens, also for the one cured in ambient conditions, though only to a relatively small extent. In the absence of forces, this means that the lower crack widths were caused by partial sealing of the openings. A low effectiveness is thus expected, due to the limited amount of unhydrated cement and Ca(OH)2, in combination with the availability of water. A comparison with the crack widths obtained from the SAP specimen reveals the larger openings upon reassembly of the cracked halves. Subsequently, thanks to the curing in wet–dry cycles, the crack widths decreased to similar or even lower values compared to the reference specimens, indicating a higher healing effectiveness. The specimen that was cured in ambient conditions also demonstrated a certain decline in crack opening, though less strong compared to the cubes cured in wet–dry cycles. Still, the crack closure was more significant compared to all reference specimens.
In Figure 10, the average crack widths were normalized with respect to their average crack width on day 0. Focusing on the reference samples, the disparity between the cubes cured in wet–dry cycles and those in ambient conditions can be clearly observed. The absence of water inside the crack leads to minimal closure, i.e., below 10% recovery, while wet–dry curing leads to an up to 19% reduction in crack size. For the SAP concrete, again, this difference between dry and wet–dry healing is noticed; however, the crack closure after 28 days is significantly improved thanks to the presence of SAPs. The specimen healed in ambient conditions shows a recovery of about 20%, like the best healed reference specimen. The wet–dry curing cycles enhanced the healing process, leading to an average recovery of 36%, as well as even 50% in one of the SAP specimens. These results clearly demonstrate the necessity of water availability for self-healing and the added value of SAPs within the concrete mixture.

4. Discussion

In this study, coupled and air-coupled ultrasonic measurements were conducted together with microscopic analysis for the evaluation of self-healing within concrete specimens. While the results of coupled and air-coupled ultrasound were compared to confirm the validity and sensitivity of the contactless set-up to the self-healing process, microscopy was used to complement the air-coupled measurements. It can be seen from the results above that, in general, a reduction in the crack width accompanies an increase in the ultrasonic velocity, as all specimens demonstrated restoration of the velocity and closure of the cracks after 28 days of healing. Both coupled and air-coupled measurements followed the increase in ultrasonic velocity and even allowed mapping of the cross-section. The microscopic analysis confirmed the trends, revealing higher crack closure in SAP cubes.

5. Conclusions

An assessment of the self-healing effectiveness of concrete cubes with and without superabsorbent polymers was performed through air-coupled ultrasound and microscopic analysis. The conclusions of this study can be summarized as follows:
  • The new air-coupled set-up established within this research, using a coupled piezoelectric emitter and an air-coupled laser interferometer as a receiver, showed its potential for self-healing evaluation, after a comparison with coupled ultrasonic measurements. Not only the trends, but also the absolute values of wave velocity measured by air-coupled ultrasound were comparable to the traditional coupled measurements.
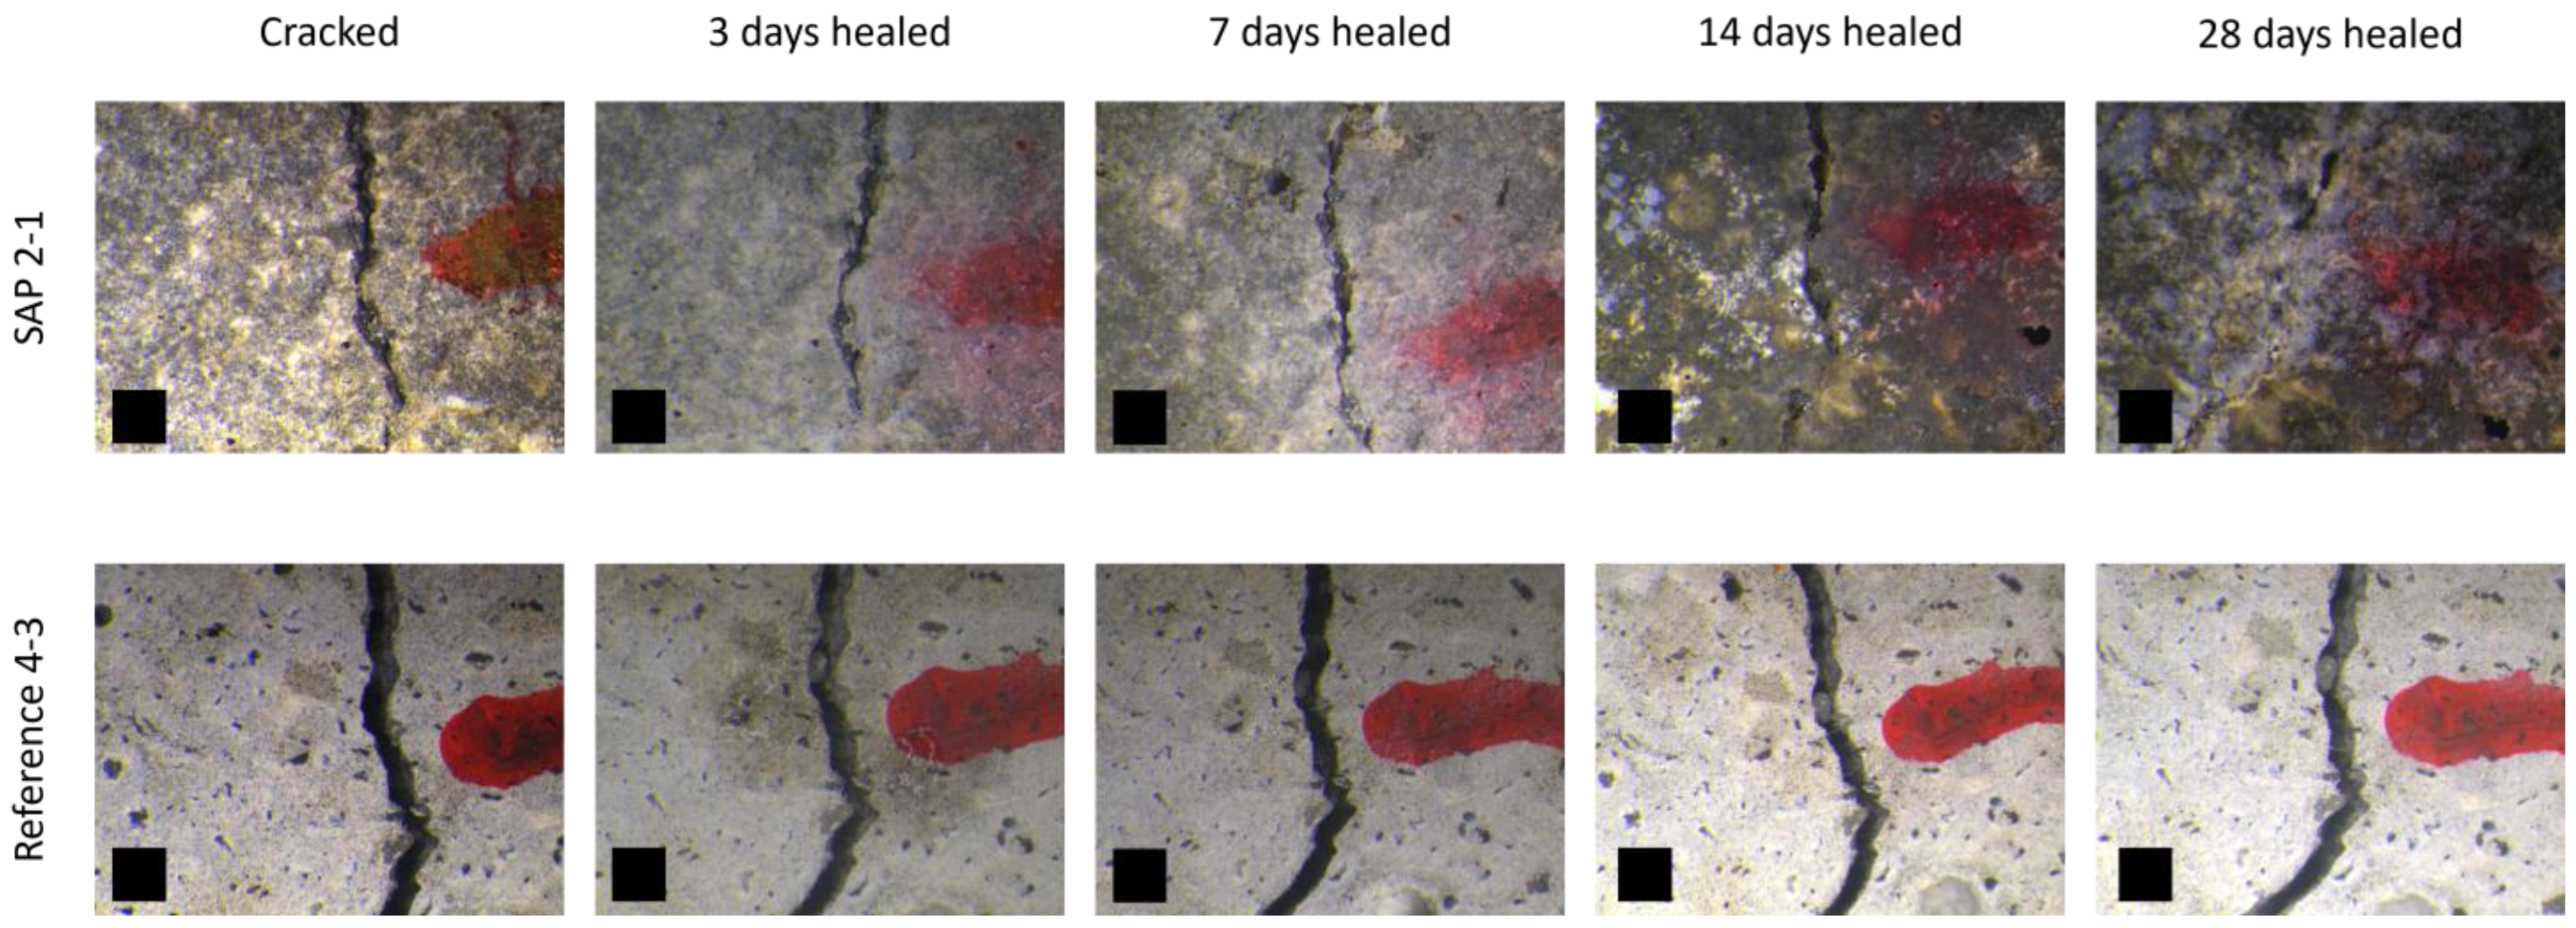
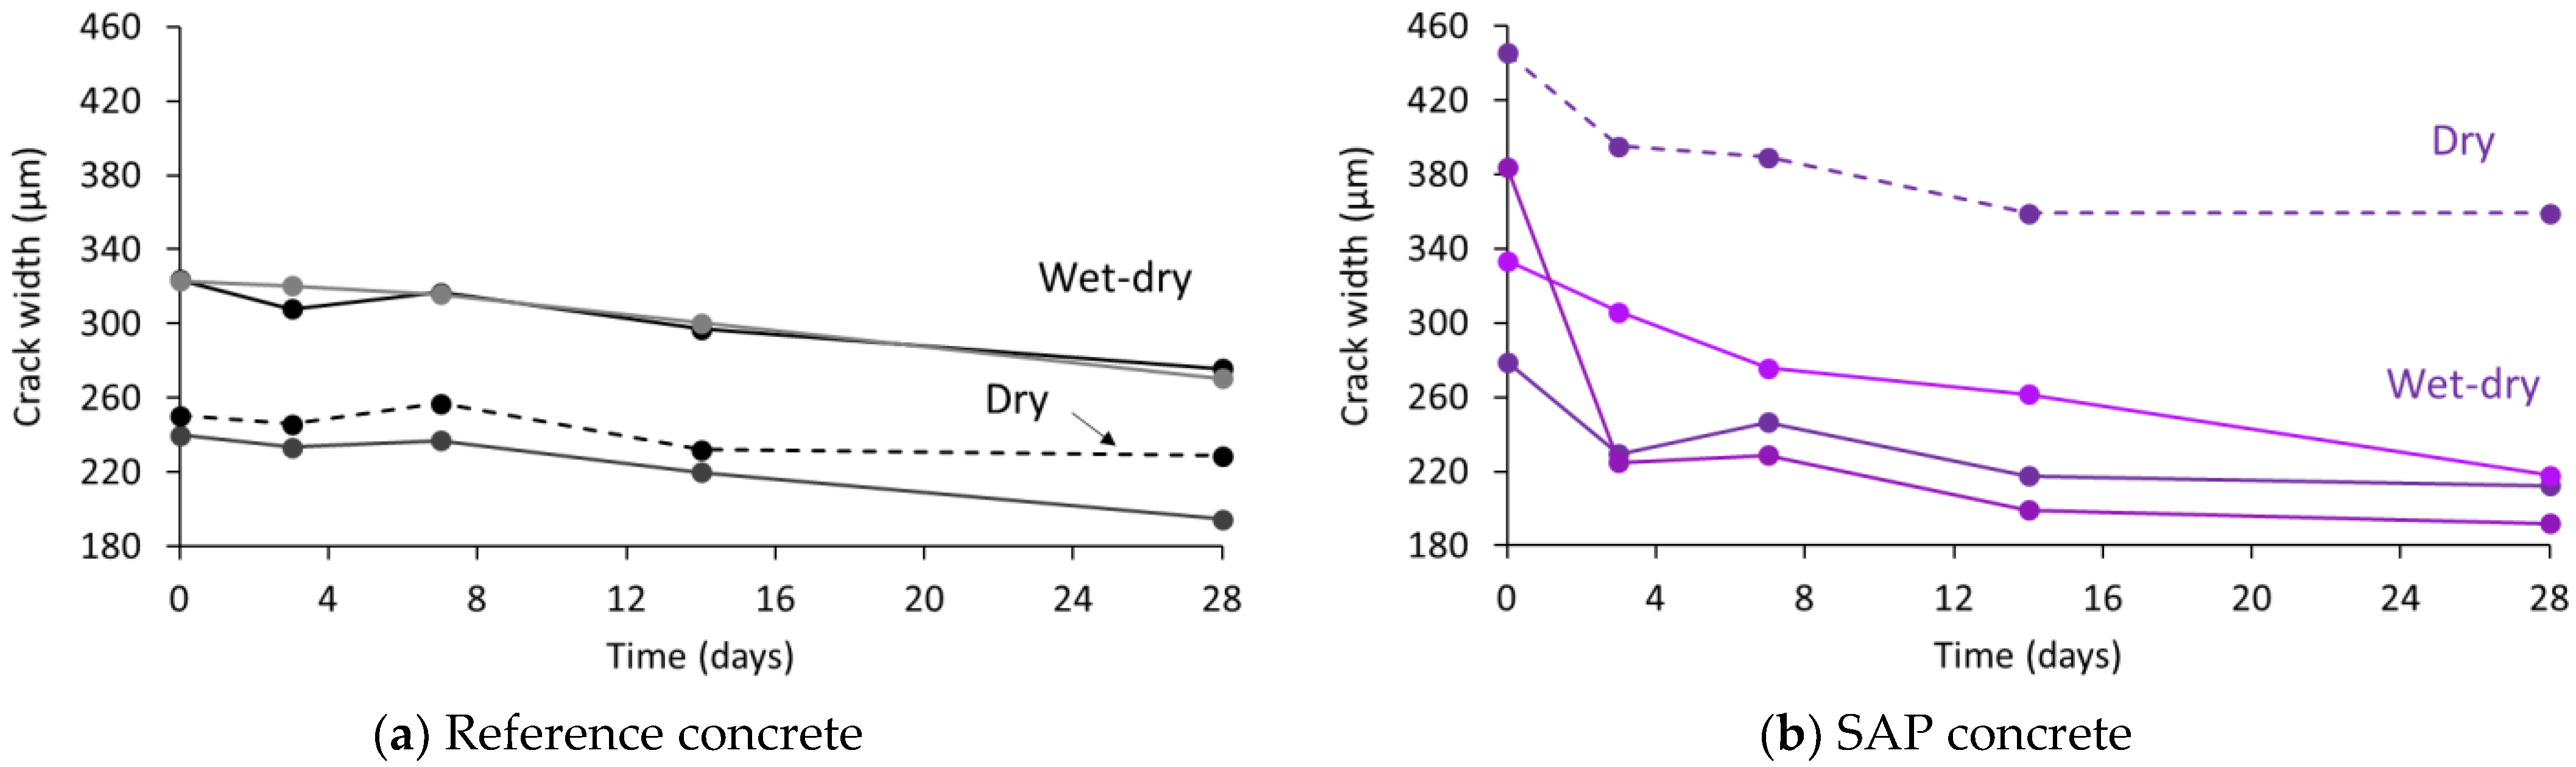
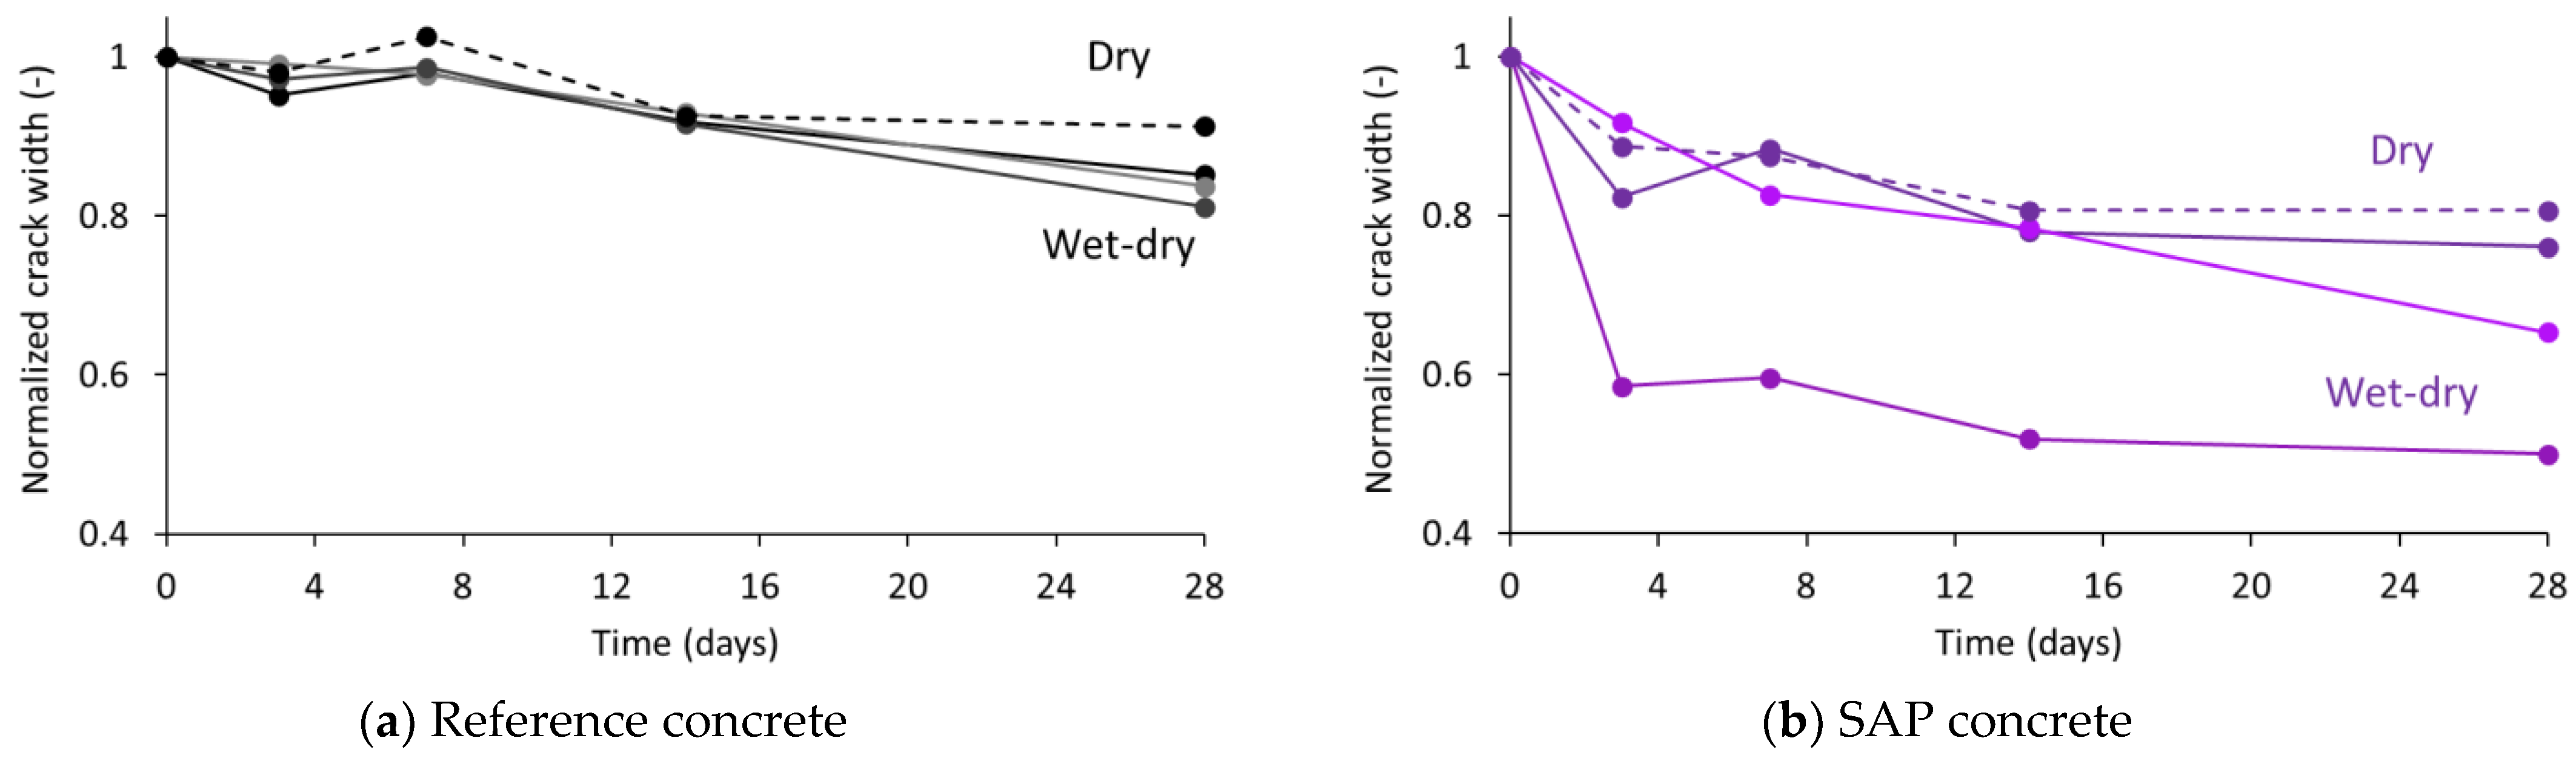
  • Microscopic analysis revealed the partial closure of cracks over a 28-day healing period through a reduction in the average crack width per specimen.
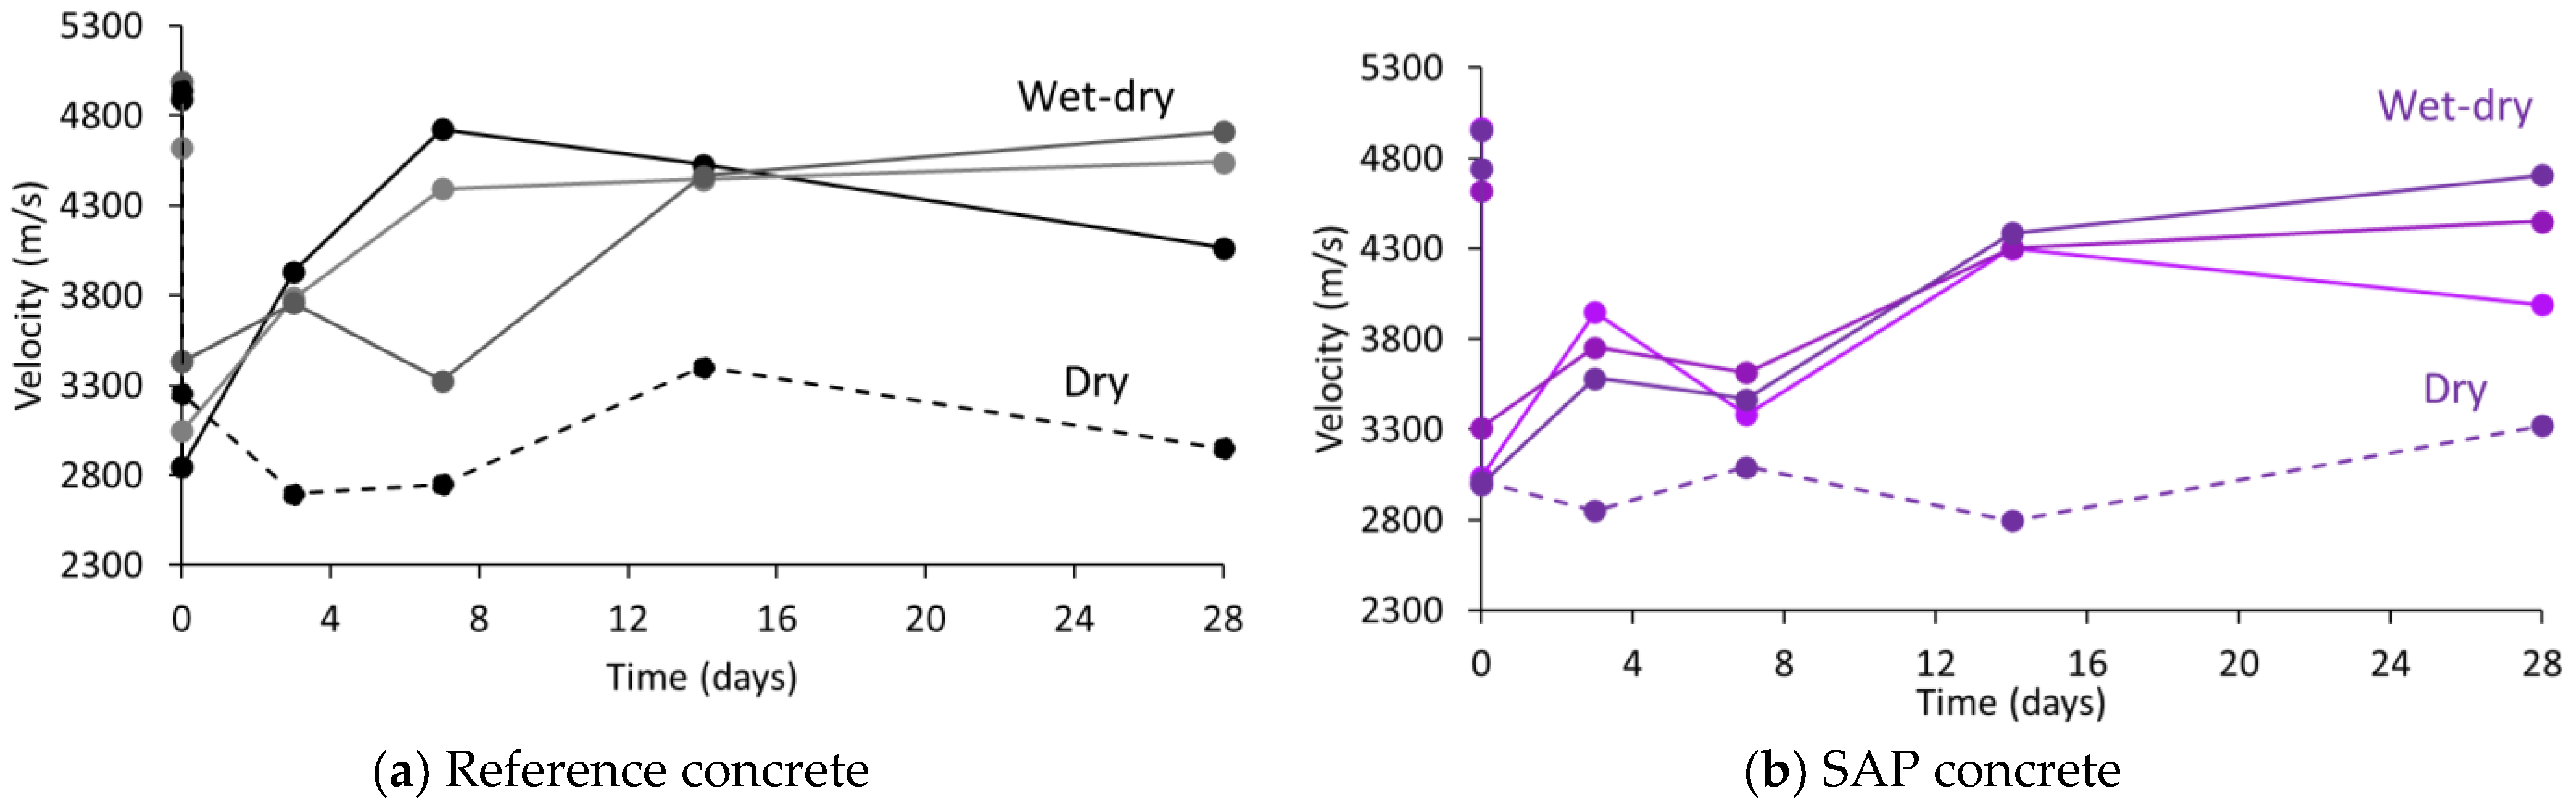
  • The difference between reference and SAP concrete was noticed in the rate of recovery of the ultrasonic velocity, i.e., the velocity restored strongly within the first week of wet–dry curing for reference concrete specimens, while for SAP cubes, the fast recovery was limited to the first three days, most likely due to the blockage of the crack by SAP swelling, and continued more gradually later on. On the other hand, microscopic analysis proved the benefit of SAP addition for self-healing through a significant reduction in average crack width compared to the reference mix.
  • A comparison between specimens cured in wet–dry cycles and samples kept in ambient conditions demonstrated the necessity of water availability for self-healing purposes: both the ultrasonic results and the microscopic pictures indicated a much lower restoration for dry cured specimens compared to wet–dry cycling.
The adoption of the semi-contactless set-up in this study showed its potential for the evaluation of self-healing within cementitious materials. Thanks to the use of air-coupled ultrasound, the manual connection of transducers to the substrate under study can be omitted, which reduces both the measuring time and the inherent error caused by manual coupling. Thereby, this novel set-up paves the way towards fully air-coupled measurements, which would allow for automated measurements in the future.

Funding

This research was funded by Fonds Wetenschappelijk Onderzoek—Vlaanderen (FWO), grant number 1299923N.

Data Availability Statement

The raw data supporting the conclusions of this article will be made available by the author on request.

Acknowledgments

The author wishes to express gratitude to Laiba Jamshaid, Dimitrios G. Aggelis and D. Snoeck for the support given towards the establishment of this research study.

Conflicts of Interest

The authors declare no conflicts of interest.

Abbreviations

The following abbreviations are used in this manuscript:
SAPSuperabsorbent polymer
USUltrasound

References

  1. Angst, U.; Elsener, B.; Larsen, C.K.; Vennesland, O. Critical chloride content in reinforced concrete—A review. Cem. Concr. Res. 2009, 39, 1122–1138. [Google Scholar] [CrossRef]
  2. Fuhaid, A.; Niaz, A. Carbonation and corrosion problems in reinforced concrete structures. Building 2022, 12, 586. [Google Scholar] [CrossRef]
  3. Liang, C.; Li, B.; Guo, M.-Z.; Hou, S.; Wang, S.; Gao, Y.; Wang, X. Effects of early-age carbonation curing on the properties of cement-based materials: A review. J. Build. Eng. 2024, 84, 108495. [Google Scholar] [CrossRef]
  4. Van Tittelboom, K.; De Belie, N. Self-Healing in Cementitious Materials—A Review. Materials 2013, 6, 2182–2217. [Google Scholar] [CrossRef] [PubMed]
  5. Snoeck, D.; De Belie, N. Autogenous healing in strain-hardening cementitious materials with and without superabsorbent polymers: An 8-year study. Front. Mater. 2019, 6, 48. [Google Scholar] [CrossRef]
  6. Reinhardt, H.-W.; Jooss, M. Permeability and self-healing of cracked concrete as a function of temperature and crack width. Cem. Concr. Res. 2003, 33, 981–985. [Google Scholar] [CrossRef]
  7. Cement and Concrete Association. The Effects of Autogenous Healing upon the Leakage of Water Through Cracks in Concrete; No. Technical Report 559; Cement and Concrete Association: Nottingham, UK, 1985. [Google Scholar]
  8. Schröfl, C.; Erk, K.; Siriwatwechakul, W.; Wyrzykowski, M.; Snoeck, D. Recent progress in superabsorbent polymers for concrete. Cem. Concr. Res. 2022, 151, 106648. [Google Scholar] [CrossRef]
  9. Lefever, G.; Van Hemelrijck, D.; Aggelis, D.; Snoeck, D. Evaluation of self-healing in cementitious materials with superabsorbent polymers through ultrasonic mapping. Constr. Build. Mater. 2022, 344, 128272. [Google Scholar] [CrossRef]
  10. Craeye, B.; Geirnaert, M.; De Schutter, G. Super absorbing polymers as an internal curing agent for mitigation of early-age cracking of high-performance concrete bridge decks. Constr. Build. Mater. 2011, 25, 1–13. [Google Scholar] [CrossRef]
  11. Wehbe, Y.; Ghahremaninezhad, A. Combined effect of shrinkage reducing admixtures (SRA) and superabsorbent polymers (SAP) on the autogenous shrinkage, hydration and properties of cementitious materials. Constr. Build. Mater. 2017, 138, 151162. [Google Scholar] [CrossRef]
  12. Suleiman, A.; Nelson, A.; Nehdi, M. Visualization and quantification of crack self-healing in cement-based materials incorporating different minerals. Cem. Concr. Compos. 2019, 103, 49–58. [Google Scholar] [CrossRef]
  13. Van Mullem, T.; Gruyaert, E.; Debbaut, B.; Caspeele, R.; De Belie, N. Novel active crack width control technique to reduce the variation on water permeability results for self-healing concrete. Constr. Build. Mater. 2019, 203, 541–551. [Google Scholar] [CrossRef]
  14. Qian, S.; Zhou, J.; de Rooij, M.; Schlangen, E.; Ye, G.; van Breugel, K. Self-healing behavior of strain hardening cementitious composites incorporating local waste materials. Cem. Concr. Compos. 2009, 31, 613–621. [Google Scholar] [CrossRef]
  15. Aggelis, D.; Shiotani, T.; Polyzos, D. Characterization of surface crack depth and repair evaluation using Rayleigh waves. Cem. Concr. Compos. 2009, 31, 77–83. [Google Scholar] [CrossRef]
  16. Ahn, E.; Kim, H.; Park, B.; Shin, M. Long-term autogenous healing and re-healing performance in concrete: Evaluation using air-coupled surface-wave method. Constr. Build. Mater. 2021, 307, 124939. [Google Scholar] [CrossRef]
  17. Lefever, G.; Van Hemelrijck, D.; Snoeck, D.; Aggelis, D. Self-healing assessment of cementitious mortars through ultrasonic monitoring. Cem. Concr. Compos. 2022, 133, 104683. [Google Scholar] [CrossRef]
  18. Rodriquez, C.; Deprez, M.; Filho, F.M.; Offenwert, S.; Cnudde, V.; Schlangen, E.; Savija, B. X-ray micro tomography of water absorption by superabsorbent polymers in mortar. In Proceedings of the International Conference on Application of Superabsorbent Polymers & Other New Admixtures Towards Smart Concrete, Skukuza, South Africa, 25–27 November 2019. [Google Scholar]
  19. Mata, R.; Ruiz, R.; Nunez, E. Correlation between compressive strength of concrete and ultrasonic pulse velocity: A case of study annd a new correlation method. Constr. Build. Mater. 2023, 369, 130569. [Google Scholar] [CrossRef]
  20. Vasanelli, E.; Calia, A.; Luprano, V.; Micelli, F. Ultrasonic pulse velocity test for non-destructive investigations of historical masonries: An experimental study of the effect of frequency and applied load on the response of a limestone. Mater. Struct. 2017, 50, 38. [Google Scholar] [CrossRef]
  21. Gruyaert, E.; Debbaut, B.; Snoeck, D.; Diaz, P.; Arizo, A.; Tziviloglou, E.; Schlangen, E.; De Belie, N. Self-healing mortar with pH-sensitive superabsorbent polymers: Testing of the sealing efficiency by water flow tests. Smart Mater. Struct. 2016, 25, 084007. [Google Scholar] [CrossRef]
  22. Pelto, J.; Leivo, M.; Gruyaert, E.; Debbaut, B.; Snoeck, D.; De Belie, N. Application of encapsulated superabsorbent polymers in cementitious materials for stimulated autogenous healing. Smart Mater. Struct. 2017, 26, 105043. [Google Scholar] [CrossRef]
Figure 1. Cutting scheme for cubical specimens (left) and indication of the measuring grid (right).
Buildings 15 01691 g001
Figure 2. (a) Coupled ultrasonic set-up and (b) air-coupled ultrasonic set-up in the laboratory.
Buildings 15 01691 g002
Figure 3. Example waveforms of an uncracked reference specimen through (a) coupled and (b) air-coupled US. (c) Example responses of a cracked specimen through both coupled and air-coupled US. The amplitudes are shifted with respect to. their original values to obtain a global view of all results. The purple arrows indicate the arrival of the longitudinal wave. The air-coupled signals are delayed due to the wave propagation through air (lift-off distance).
Buildings 15 01691 g003
Figure 4. Velocity maps after coupled and air-coupled measurements in a reference specimen healed in wet–dry cycles.
Buildings 15 01691 g004
Figure 5. Average velocity of reference specimens for (a) coupled ultrasound and (b) air-coupled ultrasound. The full lines signify the specimens healed in wet-dry curing cycles and the dotted line marks the evolution of the specimens kept in dry conditions.
Buildings 15 01691 g005
Figure 6. Velocity maps after coupled and air-coupled measurements in a SAP specimen healed in wet–dry cycles.
Buildings 15 01691 g006
Figure 7. Average velocity for a (a) reference and (b) SAP specimen from air-coupled ultrasound. Black color represents reference concrete, while purple represents SAP specimens. The full lines signify the specimens healed in wet-dry curing cycles and the dotted line marks the evolution of the specimens kept in dry conditions.
Buildings 15 01691 g007
Figure 8. Microscopic pictures of a partially healed position in a SAP specimen and an unhealed position in a reference specimen. The size of the black square equals 500 µm.
Buildings 15 01691 g008
Figure 9. Average crack width per specimen of (a) reference and (b) SAP concrete. Black color represents reference concrete, while purple represents SAP specimens. The full lines signify the specimens healed in wet-dry curing cycles and the dotted line marks the evolution of the specimens kept in dry conditions.
Buildings 15 01691 g009
Figure 10. Normalized average crack width per specimen of (a) reference and (b) SAP concrete. Black color represents reference concrete, while purple represents SAP specimens. The full lines signify the specimens healed in wet-dry curing cycles and the dotted line marks the evolution of the specimens kept in dry conditions.
Buildings 15 01691 g010
Disclaimer/Publisher’s Note: The statements, opinions and data contained in all publications are solely those of the individual author(s) and contributor(s) and not of MDPI and/or the editor(s). MDPI and/or the editor(s) disclaim responsibility for any injury to people or property resulting from any ideas, methods, instructions or products referred to in the content.

