Article

Numerical Study on Hydraulic Coupling and Surrounding Rock Deformation for Tunnel Excavation Beneath Reservoirs

1
Xiamen Road and Bridge Baicheng Construction Investment Co., Ltd., Xiamen 361000, China
2
School of Transportation, Southeast University, Nanjing 211189, China
3
China State Construction Engineering Corporation Ltd., Beijing 100020, China
*
Author to whom correspondence should be addressed.
Buildings 2025, 15(10), 1693; https://doi.org/10.3390/buildings15101693
Submission received: 1 April 2025 / Revised: 6 May 2025 / Accepted: 15 May 2025 / Published: 17 May 2025
(This article belongs to the Section Building Structures)

Abstract

Tunnels beneath reservoirs are prone to significant geohazards, such as water and mud surges during excavation. To mitigate construction risks during the excavation of the Dajianshan Tunnel, a three-dimensional refined numerical model was developed. This study employed a fluid–solid coupling numerical model to analyze the temporal and spatial variations of the filtration field during the excavation and drainage of the tunnel section beneath the reservoir, and to assess its impact on pore pressure at the reservoir bottom. The results indicate that excavation and drainage initially cause a rapid decrease in pore water pressure at the tunnel vault, which gradually stabilizes. Furthermore, the extent of disturbance in the surrounding rock’s filtration field increases with distance from the tunnel vault. When the excavation intersects fault zones, water surges significantly affect filtration conditions at the reservoir bottom, resulting in a pore pressure reduction of approximately 5.2 kPa. Additionally, under blasting disturbance conditions, a larger disturbance range and higher permeability in the loosened zone led to greater pore pressure fluctuations, posing increased challenges for excavation safety and drainage management. This study provides a predictive model and methodology to prevent construction accidents during tunnel excavation, offering valuable insights for ensuring safety during the construction process.

1. Introduction

With the implementation of China’s ‘The Belt and Road Initiative’ policy, the construction of major infrastructural transport facilities such as motorways and high-speed railways has ushered in a period of rapid development, and the increasing saturation of China’s highway transport network has greatly stimulated the construction of tunnel projects [1,2,3]. In addition, with the implementation of China’s ‘Western Development’ strategy, the transport network gradually developed towards the western mountainous areas and karst regions, which led to the emergence of many long and deep tunnels with the characteristics of great depth, long tunnel length, strong karst, high stress, and high water pressure [4,5]. Due to the special geological environment of tunnels under reservoirs, the tunnel construction process can easily induce serious geological hazards such as water and mud surges in tunnels, and the tunnel construction process therefore faces serious challenges [6].
To reduce accidents caused by sudden water surges during the construction of tunnels under reservoirs and ensure construction safety, scholars have conducted investigations into the causes of tunnel excavation accidents. The deformation of surrounding rock caused by tunnel excavation and drainage is the main cause of accidents and hazards to construction safety [7]. Construction activities such as tunnel excavation have a direct impact on the distribution of stress and filtration fields in the geotechnical medium, and filtration and stress fields also affect each other in the process of change, which in turn has a negative effect on the tunneling project, and thus affects the development of the construction program and construction technology [8,9]. For example, in the process of excavation of underground structures, pore water in the rock and soil is discharged or injected; this will produce obvious hydraulic coupling, the pore pressure changes lead to changes in the effective stress of the geotechnical medium, and when the geotechnical medium reaches the limit of plastic yield, the volume of the geotechnical medium is subsequently changed, which also produces further pore pressure changes [10].
To prevent tunnel water surges, many scholars have attempted to explore the causes of tunnel water surges through theoretical research. Terzaghi (1996) [11] established a one-dimensional consolidation model in 1923, and put forward the one-dimensional consolidation theory and the principle of effective stress, which can find the deformation of a saturated soil layer in the process of filtration and consolidation at any time using basic assumptions; this is the basis of the theory of fluid–solid coupling of geotechnical media. In the middle of the 20th century, Biot (1941) [12] extended the one-dimensional consolidation of geotechnical media to three dimensions and gave the corresponding formulas. Witherspoon et al. (1981) [13] developed a physical model to discuss the hydrodynamics of flow in a single fissure, proposing the coupling of stress and filtration fields. Zhuo and Zhang (2000) [14] found that the ratio of the maximum fracture spacing to the minimum boundary size should be greater than 1/50 or 1/20 in a continuous media study. Huyakorn et al. (1983) [15] developed four conceptual models of groundwater filtration in fractured rock media, proposed two numerical solutions to the governing equations associated with flow models, and analyzed and discussed the simulation results utilizing the finite element method. However, the above theoretical studies mainly focus on geotechnical media under ideal conditions, and do not involve the hydraulic coupling of geotechnical media under complex working conditions.
Due to the extremely complex hydraulic coupling problem in the construction of tunnels under reservoirs, theoretical research cannot fully solve the problem of tunnel water inflow under different working conditions. Therefore, many scholars use numerical models as well as corresponding procedures to simulate the actual situation before construction starts. In order to facilitate their research, most scholars have omitted the two key factors of non-uniformity and permeability of rock in the research process [16,17]. Tang et al. (1998) [18] and Yang et al. (2004, 2007, 2011) [19,20,21] developed a coupled filtration–stress analysis system for the rock fracture process, which simulates and analyses the law of permeability evolution and its mechanism of hydraulic coupling during the process of crack initiation and extension, and deepens the hydraulic coupling study from the stress state to the damage process. Kong (2017) [22], based on hydraulic coupling theory and numerical simulation, evaluated the Xiuning Tunnel exit in the context of the perimeter rock reinforcement scheme under a reservoir, and a reasonable optimization scheme was given. Peng et al. (2017) [23] make a comparative analysis of whether the design of the lining structure of the below-reservoir tunnel section of the Dayaoshan No. 1 Tunnel takes into account the pressure of the external water, and put forward design ideas which could provide a reference point for other projects. Hou et al. (2006) [24] considered a deeply buried highway tunnel project and, based on the filtration analysis module SEEP/W of GEO-SLOPE, analyzed the filtration influence of the reservoir on the tunnel under the action of head difference, simulated the corresponding filtration field distribution, predicted the filtration volume of the tunnel and proposed prevention and control measures. Yang (2009) [25] analyzed the impacts of tunnel excavation on the hydrogeological environment of the area around the tunnel and the local hot spring area in conjunction with the cross-basin diversion project of the Tseng-Wen Reservoir in Taiwan. Mao et al. (2010) [26] analyzed the ground settlement of a tunnel based on different underground filtration conditions on the south side of a tunnel, simulated the stabilization time of the ground settlement, and derived the effects of filtration in the tunnel on the tunnel surroundings, including filtration and groundwater level. Zhang et al. (2023) [27] used finite difference software to establish a numerical model of active damage in the palm face of a shaped shield tunnel considering the effect of flow–force coupling, and extracted the pore water pressure distribution of the strata in the vicinity of the palm face of the shaped tunnel using a program written in FISH language. Jin et al. (2010) [28] used numerical methods to study the hydraulic coupling effect in the construction process of a trans-river tunnel, established the basic equations of filtration–stress coupling under steady flow conditions, and analyzed the change rule of pore water pressure during the tunnel excavation process and the extent of the influence of hydraulic coupling on peripheral rock displacements, stresses, and stresses on the supporting structures. However, limited research has addressed hydraulic coupling under complex reservoir-fault geomorphologies with fully integrated 3D simulations.
Researchers have conducted studies on the coupling phenomenon between the filtration and stress fields in geotechnical media, leading to the development of various coupling models. The coupled problem of filtration (unsteady) with the displacement field of the soil or rock medium is now widely applied in tunnel engineering and construction. However, existing studies on the impact of tunnel water influx on surrounding rock are primarily based on simplified hydrogeological conditions. Research on the interaction between tunnel drainage and surrounding rock under complex hydrogeological conditions—such as geomorphology, faults, abundant groundwater, and nearby reservoirs—remains limited. Additionally, hydraulic coupling studies regarding tunnel excavation through reservoirs in macroscopic geological settings are insufficient.
This study establishes a three-dimensional geological model that accurately reflects real geomorphic relief to investigate the response of the surrounding rock to the coupled effects of stress and filtration fields under tunnel excavation-induced unloading and drainage conditions. The results aim to guide safe tunnel construction and mitigate the risks of reservoir water-level reduction caused by water surges and filtration. Through extensive numerical simulations, the study examines the impacts of factors such as surrounding rock properties, permeability coefficients, and fault structures on displacement, stress, and filtration fields, as well as the distribution characteristics of the surrounding rock. The main contributions of this study are as follows: (1) clarification of the deformation characteristics of surrounding rock under the combined effects of tunnel excavation and drainage, (2) analysis of the changes in the filtration and stress fields of the surrounding strata under hydraulic action, and (3) prevention of potential safety accidents during tunnel excavation and guidance for safe construction.

2. Numerical Simulation and Methods

In the filtration field simulation conducted using FLAC3D 7.0, the permeability coefficient can be modeled as either isotropic or anisotropic. Based on geological measurement data, the equivalent permeability coefficient of the fissured rock mass is simplified to an isotropic permeability coefficient, and the degree of fissure development is represented by porosity in numerous numerical analyses. To streamline the numerical simulation, the following assumptions were adopted: (1) the surrounding rock is homogeneous, isotropic, and treated as a continuous permeable medium [29,30]; (2) pore water within the rock mass remains static prior to tunnel excavation, and following excavation, pore water flow is governed by Darcy’s law as a steady-state, single-phase saturated flow [7]; (3) the surrounding rock obeys an elastoplastic stress–strain constitutive relationship [31].

2.1. Governing Equations

Coupled fluid–solid numerical simulations using the finite-difference method include fluid motion equations, mechanical equilibrium equations, and constitutive relationships. In FLAC3D simulations of fluid–solid coupling mechanisms within rock masses, an equivalent continuum medium approach is adopted, modeling the rock as a porous medium. In this method, the permeability resulting from rock fissures is assumed to be uniformly distributed throughout the rock mass. Fluid flow within this porous medium obeys Darcy’s law and satisfies Biot’s consolidation equations. The governing equations utilized in finite-difference calculations for fluid–solid coupling are presented below.
For small deformations, the fluid mass balance equation is described as follows:
q i , j , k + q v = ζ t
where qi,j,k are the unit dissipation vectors of the filtration; qv is the fluid source of the measured volume; and ζ is the fluid volume change per unit volume of the pore medium.
In FLAC3D, the change in fluid volume is linearly related to the changes in pore pressure P, mechanical volume ε, and temperature T. The law of fluid continuity is expressed as follows:
ζ t = 1 M P t + α ε t β T t
where M is the Biot modulus; P is the pore pressure; α is the Biot coefficient, which is a grid area parameter defined using the PROPERTY command; ε is the volumetric strain; T is the temperature; and β is the undrained thermal coefficient.
Substituting Equation (1) into Equation (2) yields the following:
q i , j , k + q v * = 1 M P t
q v * = q v α ε t + β T t
Biot coefficient α is the ratio of the volume of fluid in a material cell to the value of the volume change, which can be obtained in a drainage experiment to obtain the bulk modulus of the material. In the special case of a material with inelastic skeletal structure, α is 1. For an ideally porous material, α is correlated with the bulk modulus Ks of the solid part of the material:
α = 1 K K s
The Biot modulus M is a grid point variable defined using the INITIAL command. The Biot modulus M is defined as follows:
M = K u K α 2
where K is the undrained bulk modulus of the material.
For an ideally porous material, the Biot modulus M is correlated with the fluid bulk modulus Kf:
M = K f n + α n 1 α K f / K
where n is the pore ratio. Thus, when α = 1, the Biot modulus M can be expressed as the following:
M = K f / n
For the compressible skeleton, the liquid mass balance relationship is as follows:
ζ t = q i x i + q v
where ζ is the variable fraction of the liquid volume; qv is the density of the liquid.
The momentum balance is of the following form:
σ i j x j + ρ g i = ρ d u i d t
ρ = ( 1 n ) ρ s + n ρ w
where ρ is the integrated bulk density and ρs and ρw are the bulk densities of solids and liquids, respectively.
The motion of the fluid is described by Darcy’s law, which can be expressed as follows:
q i = k p ρ f x i g i
φ = p ρ f x j g j ρ f g
where k is the permeability coefficient of the medium; ρf is the fluid density; xi is the distance gradient in three directions; gi is the three components of gravitational acceleration; and φ is the water head.
The incremental form of the pore solid structure equation is as follows:
Δ σ i j + α Δ p δ i j = H i j ( σ i j , Δ ε i j Δ ε i j T )
where Δσij is the associated cyclic stress increment, Hij is the given function, Δεij is the total strain, ΔεijT is the thermal strain, and δij is the Kronecker increment.
The elasticity relationship can be expressed by the following equation:
σ i j σ i j 0 + α p p 0 δ i j = 2 G ε i j ε i j T + α 2 ε k k ε k k T
α 2 = K 2 G / 3
where σij0 and p0 respectively represent the stress and pressure in the initial state.
The change in pore pressure can lead to the occurrence of volumetric strain, and the incremental form of the constitutive equation for pore media is as follows:
Δ σ i j + α Δ p δ i j = H i j ( σ i j , Δ ε i j )
For the compatibility equation, the relationship between strain rate and velocity gradient is the following:
ε i j = 1 2 u i x j + u j x i
where u is the velocity at a point in the medium, and x is the displacement of the point.
Prior to any coupling analysis, the time step must be ensured to be consistent with the time required to pass from one grid point to another [32,33]. The formula for calculating the number of time steps in connection with mechanical calculations is given below:
Δ t m e c h = ρ K + 4 / 3 G L c
where ρ is the solid density. Therefore, the ratio of time steps for fluid volume calculations and mechanical calculations has the following form:
Δ t f l Δ t m e c h = K + 4 / 3 G ρ L c k M
The distribution of the filtration field during tunnel excavation is analyzed by applying the theory of equivalent continuous medium filtration calculation, which is a method that distributes the permeability of the rock fissures uniformly into the rock medium, thus achieving equivalent calculation of filtration volume. The permeability tensor plays an important role in the calculation process as a key parameter of the fractured rock medium as an equivalent continuous medium.

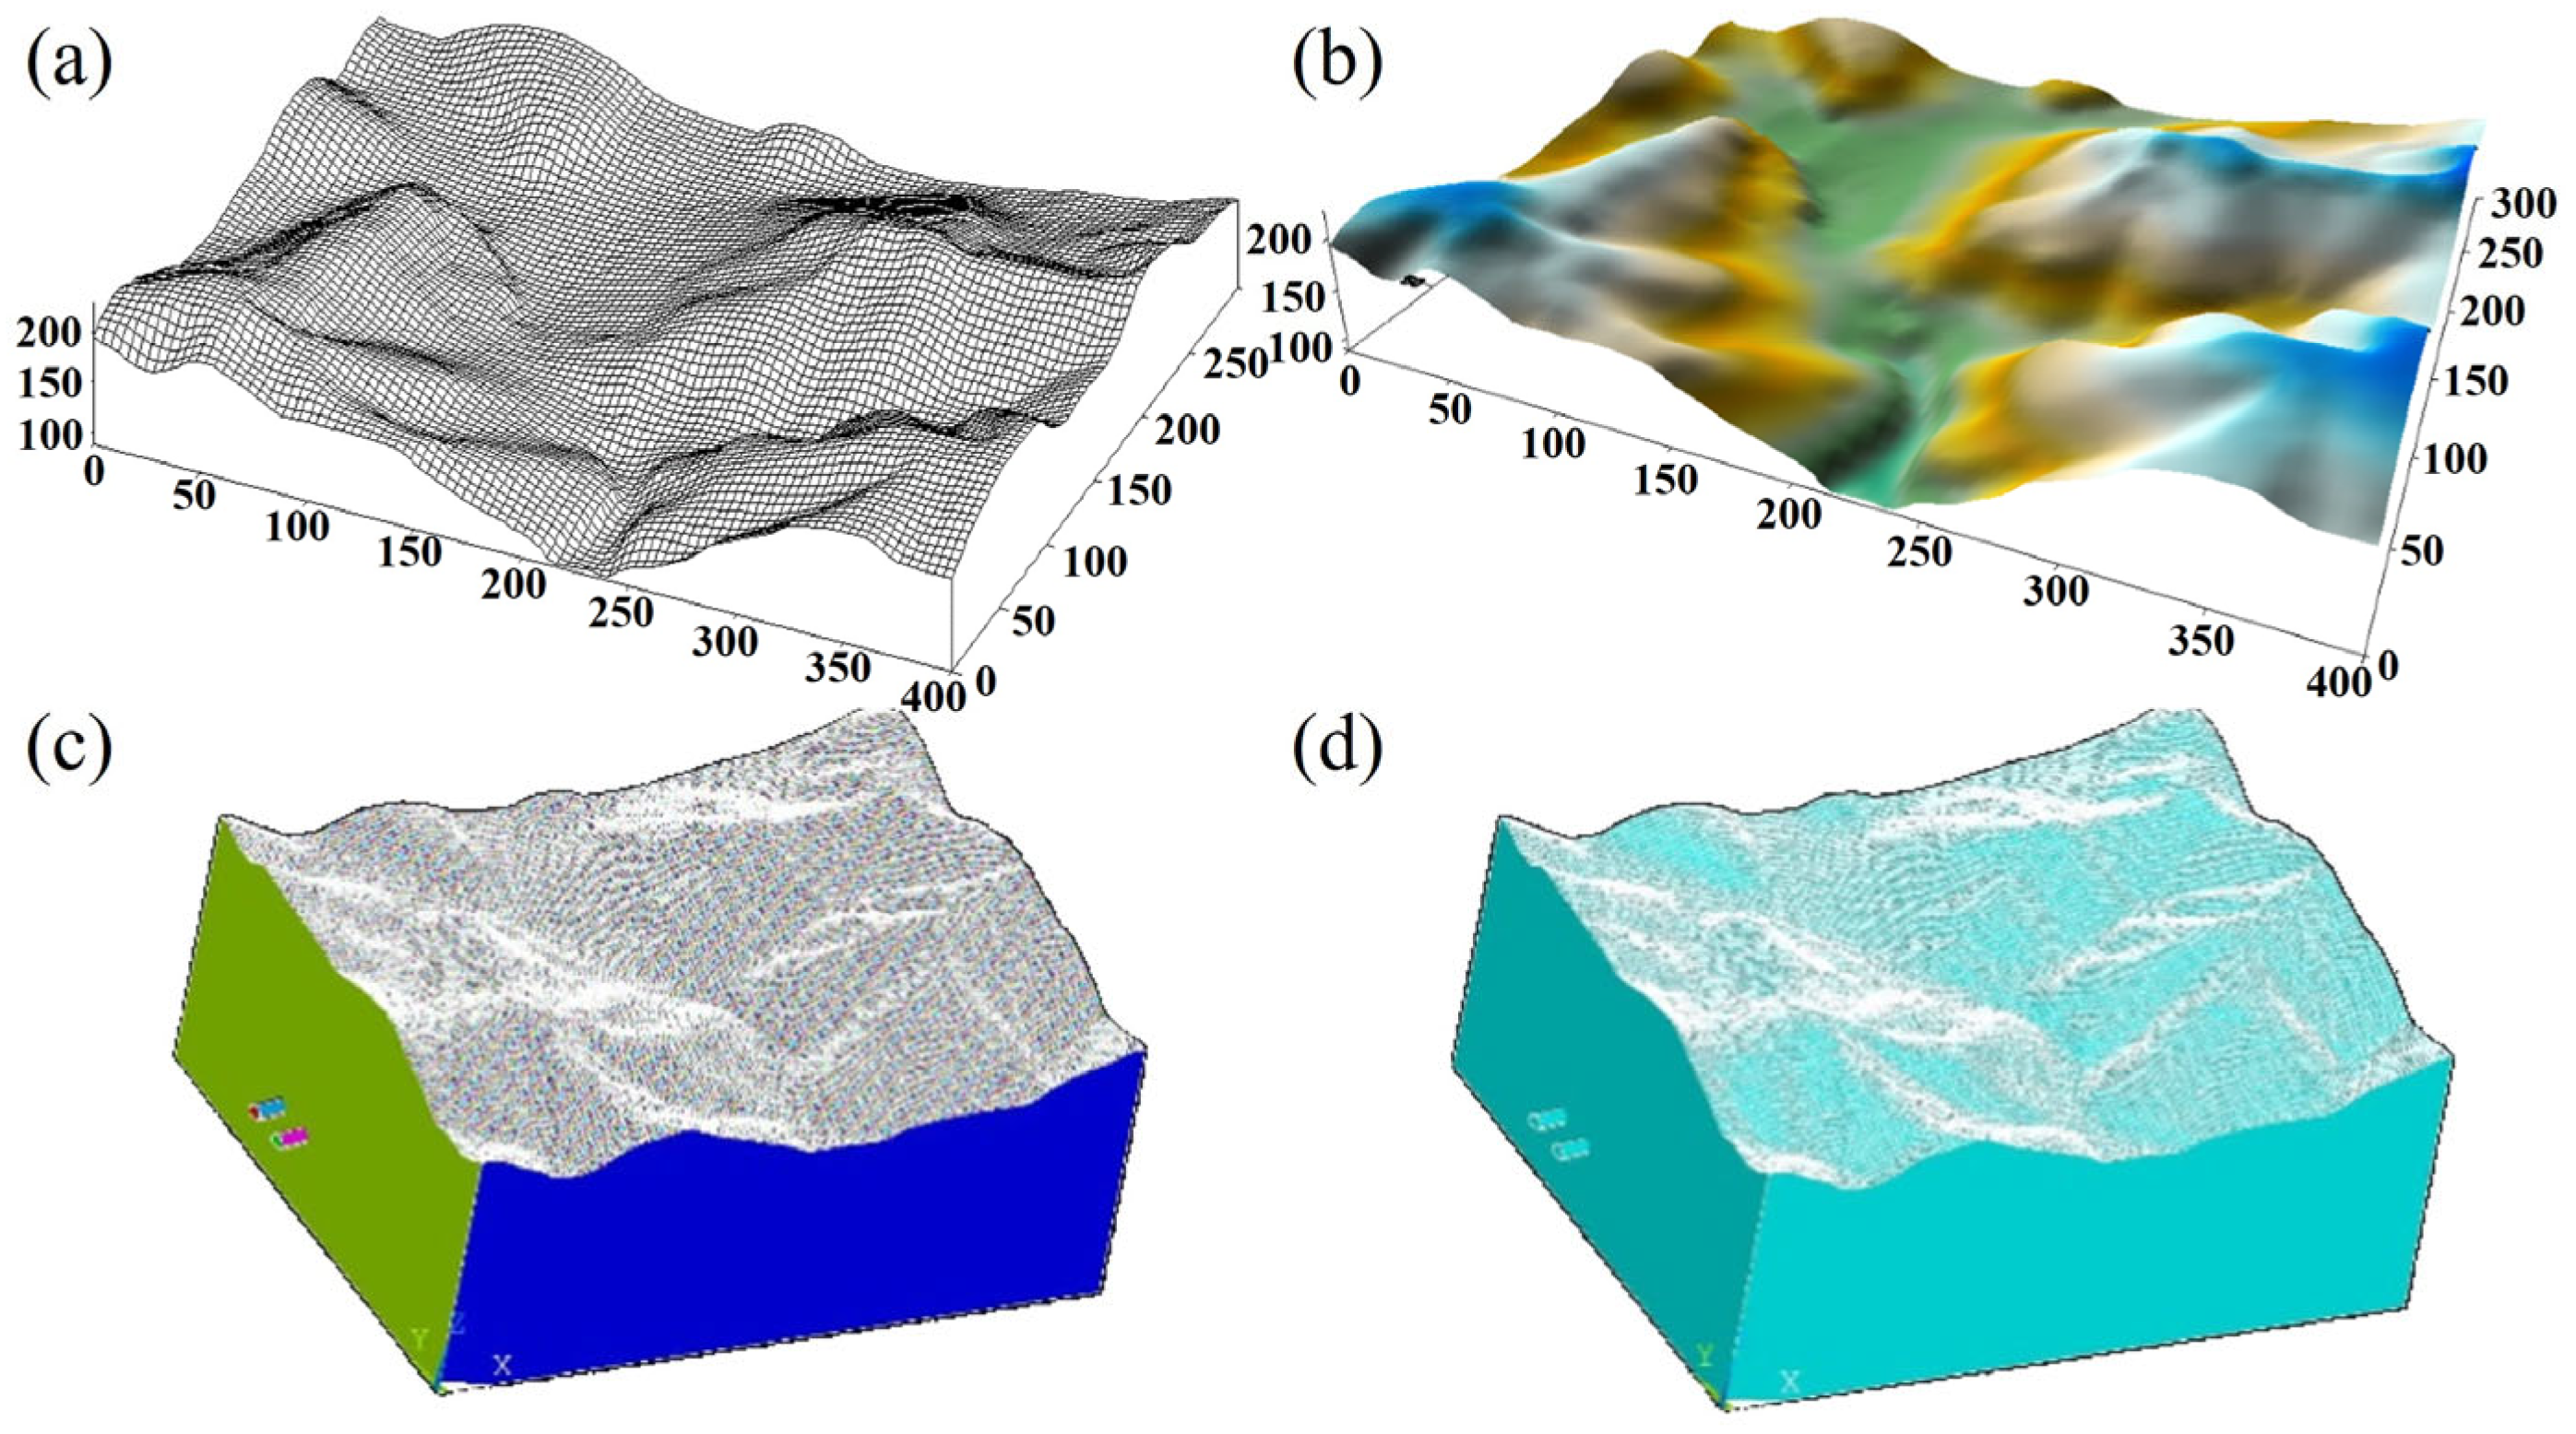
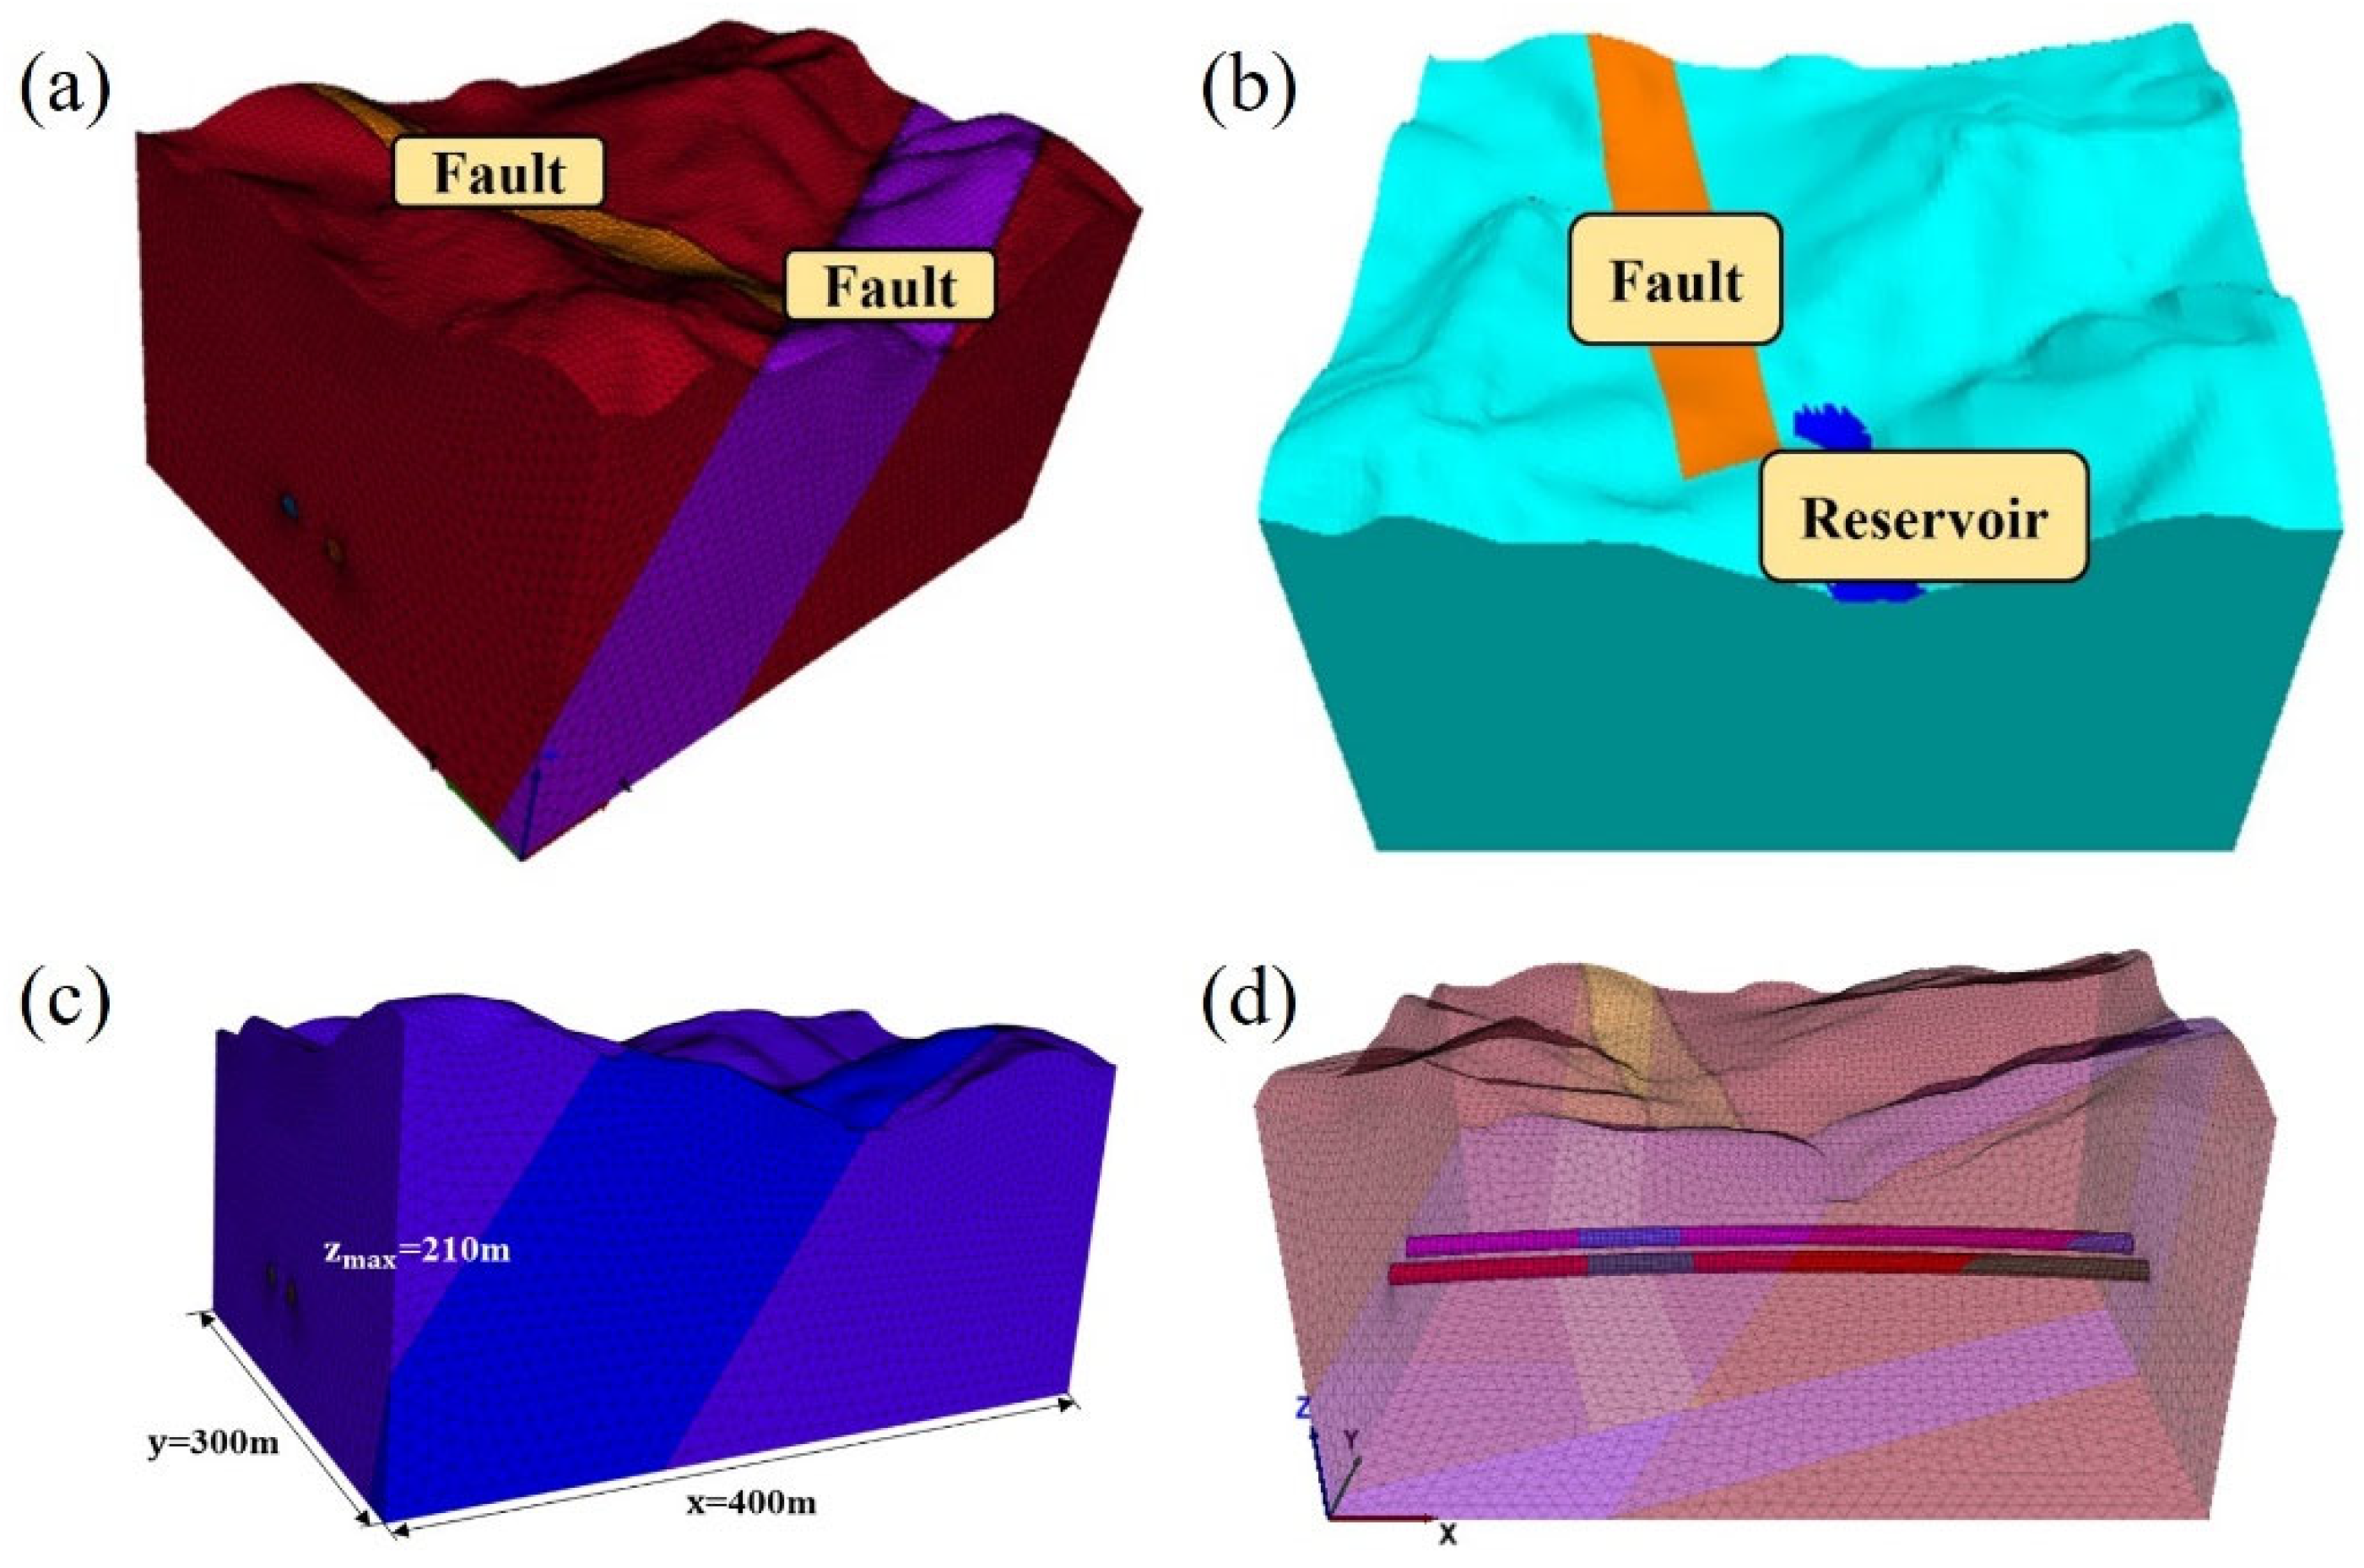
2.2. Modeling Process and Geometry

In this study, CAD 2008, SURFER 11, and ANSYS 16.0 software were employed to construct a refined three-dimensional numerical model for the segment of the Dajianshan Tunnel located beneath the reservoir. As illustrated in Figure 1, CAD software was utilized first to process and refine contour lines within the modeling domain, ensuring their closure and a uniform gradient distribution. Subsequently, the elevations of the tunnel and the reservoir were identified, thereby establishing their spatial relationships in the three-dimensional domain. Finally, the strike, inclination, and dip angle of faults were determined, along with their relative positions and widths within the three-dimensional numerical model.
The coordinate information of contour lines in CAD was imported into SURFER software and gridded as shown in Figure 2a. The gridded terrain surface map was converted into a terrain surface map, as shown in Figure 2b. Subsequently, the surface grid model in SURFER was imported into ANSYS software to automatically generate the terrain surface, and the ANSYS modelling function was used to establish the four sides and bottom surfaces and generate the 3D geoid, as shown in Figure 2c,d.
The 3D wireframes of faults, tunnel and reservoir from the CAD 3D model were imported into ANSYS to establish the corresponding solid models. According to the real geological data of the Dajianshan Tunnel, a 3D refined numerical model containing the tunnel, reservoir, and faults was established, as shown in Figure 3a,b. The mesh information from the ANSYS model was imported into FLAC3D for subsequent numerical calculation and analysis. The size of the three-dimensional numerical model is shown in Figure 3c. Due to the large influence range of the tunnel excavation and the reservoir section, in order to avoid boundary effects, the model size is relatively large, i.e., 400 m in length, 300 m in width, and 210 m in maximum thickness, and the distance between the bottom of the model and the bottom of the tunnel is about 52 m.
The model mesh is shown in Figure 3d, with hexahedral solid cells for the tunnel structure and tetrahedral solid cells for the geotechnical layer. The mesh is uniformly divided to ensure the accuracy of the numerical analysis results; the model includes 719,000 cells and 137,000 nodes. In addition, the dimensions of the tunnel are consistent with those of the actual project.

2.3. Initial and Boundary Conditions

Boundary conditions are usually expressed in terms of pore pressures or specific flow vectors perpendicular to the boundary. In FLAC3D, the form of the permeability boundary is as follows:
q n = h p p e
where qn is the portion of the specific flow vector perpendicular to the boundary in the direction of the outer vertical line, h is the permeability coefficient, p is the pore pressure at the boundary surface, and pe is the pore pressure at the permeable layer.
The boundary conditions for the known head can be described as follows:
H ( x , y , z ) Γ 1 = φ ( x , y , z , t ) ( x , y , z ) S 1
where φ (x, y, z, t) is the known head distribution function and S1 is the set of known boundaries of heads in the region.
The boundary conditions for a known flow rate can be described as follows:
k H n Γ 2 = q ( x , y , z ) ( x , y , z ) S 2
where q is the inflow-outflow per unit area on the boundary of the filtration region, S2 is the set of boundaries in the region where the normal flow velocity is known, and n is the direction normal to the boundary.
The free surface and spillover surface boundary conditions can be respectively described as follows:
H n = 0 H ( x , y , z ) Γ 3 = z ( x , y ) ( x , y , z ) S 3
H n = 0 H ( x , y , z ) Γ 4 = z ( x , y ) ( x , y , z ) S 4
where z (x, y) is the elevation of the location point within the flow field, and S3 and S4 are the free surface and spillage surface boundaries, respectively.
The displacement boundary conditions of the three-dimensional model are as follows: the four side boundaries can displace freely in the vertical and tangential directions; the top boundary is a free boundary; the bottom boundary is a fixed boundary, and displacement in all three directions is constrained. The filtration boundary conditions of the 3D model are as follows: the four side boundaries are infiltration boundaries, and the water table can flow freely through the four sides, with the pore water pressure unchanged; the water table boundary is a variable infiltration boundary; and the bottom boundary is an impermeable boundary.

2.4. Grid Validation and Model Validation

The initial stress field in equilibrium is solved under the condition of no filtration, and the initial stress distribution of the model is shown in Figure 4a. The stress on the surface of the model is 1.75 kPa, and with increasing depth, the stress decreases to 0 and then gradually increases to 5.01 MPa. The stress distribution in the horizontal direction shows a uniform laminar distribution, and the geostress in which the tunnel is situated is roughly in the range of 2.5–3.5 MPa. Therefore, the model has no mesh distortions and the stress distribution in the model is normal. Additionally, the initial stress and displacement field distributions of the numerical model with this number of meshes and mesh size are in accordance with the actual engineering laws, and therefore satisfy the requirements of calculation accuracy. Trial calculations of initial pore water pressure were carried out, and the pore water pressure in the formation was set to increase linearly with depth, obtaining the initial pore pressure distribution as shown in Figure 4b. The water pressure is distributed in layers and increases gradually with depth, from 0 kPa at the surface to 1601 kPa at the bottom, and the initial pore pressure at the tunnel vault is 976 kPa.
The comparison of simulated and measured values is shown in Table 1. The average influx of water per unit length of tunnel was calculated to be approximately 0.72 m3/d using equation 6. In the MODFLOW model, the simulation with the same parameters resulted in an influx of 0.88 m3/d per unit length of the tunnel without considering the effect of silt at the bottom of the lake; when considering the effect of silt at the bottom of the lake, the influx of water per unit length of the tunnel is 0.69 m3/d. The error between the simulated value and theoretical value was within 4~22%. Most reservoirs have silt at the bottom, and in this study, the Tianzhuhu reservoir had silt at the bottom. When considering silt, the error between theoretical and calculated values is only 4%, far lower than the requirement in the engineering field to control the error within 20%. Therefore, the MODFLOW model and parameter values are reasonable and can be used to perform groundwater system analysis.

2.5. Parametric Analysis

According to the field measurements data, the model is divided into 10 types of continuously distributed rock layers from top to bottom, each rock layer is an homogeneous isotropic material, and the geotechnical medium parameters of each rock layer obtained from field measurements are shown in Table 2 and Table 3. The elastic parameters of the tunnel lining and grouting are obtained from lab tests and shown in Table 4. The modulus of elasticity of the rock medium adopts the modulus of rebound. When there is no reference value for the modulus of rebound, the modulus of elasticity of the rock medium is calculated based on the compression modulus, according to the following empirical equation [34]:
E = 3 E S , 1 2
where ES,1-2 is the compression modulus of the rock.
The shear modulus and bulk modulus of the rock mass are related to the modulus of elasticity, as shown below:
G = E S 2 ( 1 + μ )
K = E S 3 ( 1 2 μ )
where G is the shear modulus, K is the bulk modulus, and μ is the Poisson’s ratio of the rock mass.
This study primarily investigates the response of surrounding rock under the combined effects of unloading and drainage during tunnel excavation. Thus, numerical simulations were conducted to analyze variations in the filtration field, deformation, and stress distribution characteristics of the surrounding rock, considering the stepwise excavation method for the reservoir tunnel segment without accounting for grouting or pipe-shed supports above the excavation face. The impact of varying parameters of surrounding rock on filtration, deformation, and stress was also explored. While shotcrete, steel profiles, and anchors would typically enhance lining stiffness and improve tunnel support performance, this simulation deliberately excludes these factors, focusing instead on the most unfavorable scenario by neglecting the influence of intermediate construction processes.
The numerical simulation assumes that the excavation faces of the left and right tunnels are both situated within the fault zone, with the left tunnel face lagging 20 m behind the right tunnel face. Given that hydraulic connectivity between the tunnel and reservoir is significantly greater in fault zones than in non-fault zones, excavation through fault zones presents the highest risk for construction safety and rock stability; hence, this scenario forms the primary focus of analysis.
Additionally, considering the inherent spatial variability of rock parameters in actual engineering contexts, permeability characteristics can differ markedly among similar rock masses under various hydrological and geological conditions. Guided by field sampling tests and engineering practice, the study evaluates the impacts of tunnel excavation and drainage on surrounding rock deformation within a specified range of variation for the elastic modulus and permeability coefficient. Specifically, the elastic modulus of moderately weathered granite used in numerical simulations is based on field measurements, ranging between 3 and 16 GPa in the tunnel area. Condition 3 corresponds closely to the recommended parameter values from the geotechnical investigation report. Table 5 details the numerical calculation parameters for each simulation scenario, with other parameters held constant during sensitivity analyses.

3. Results and Discussion

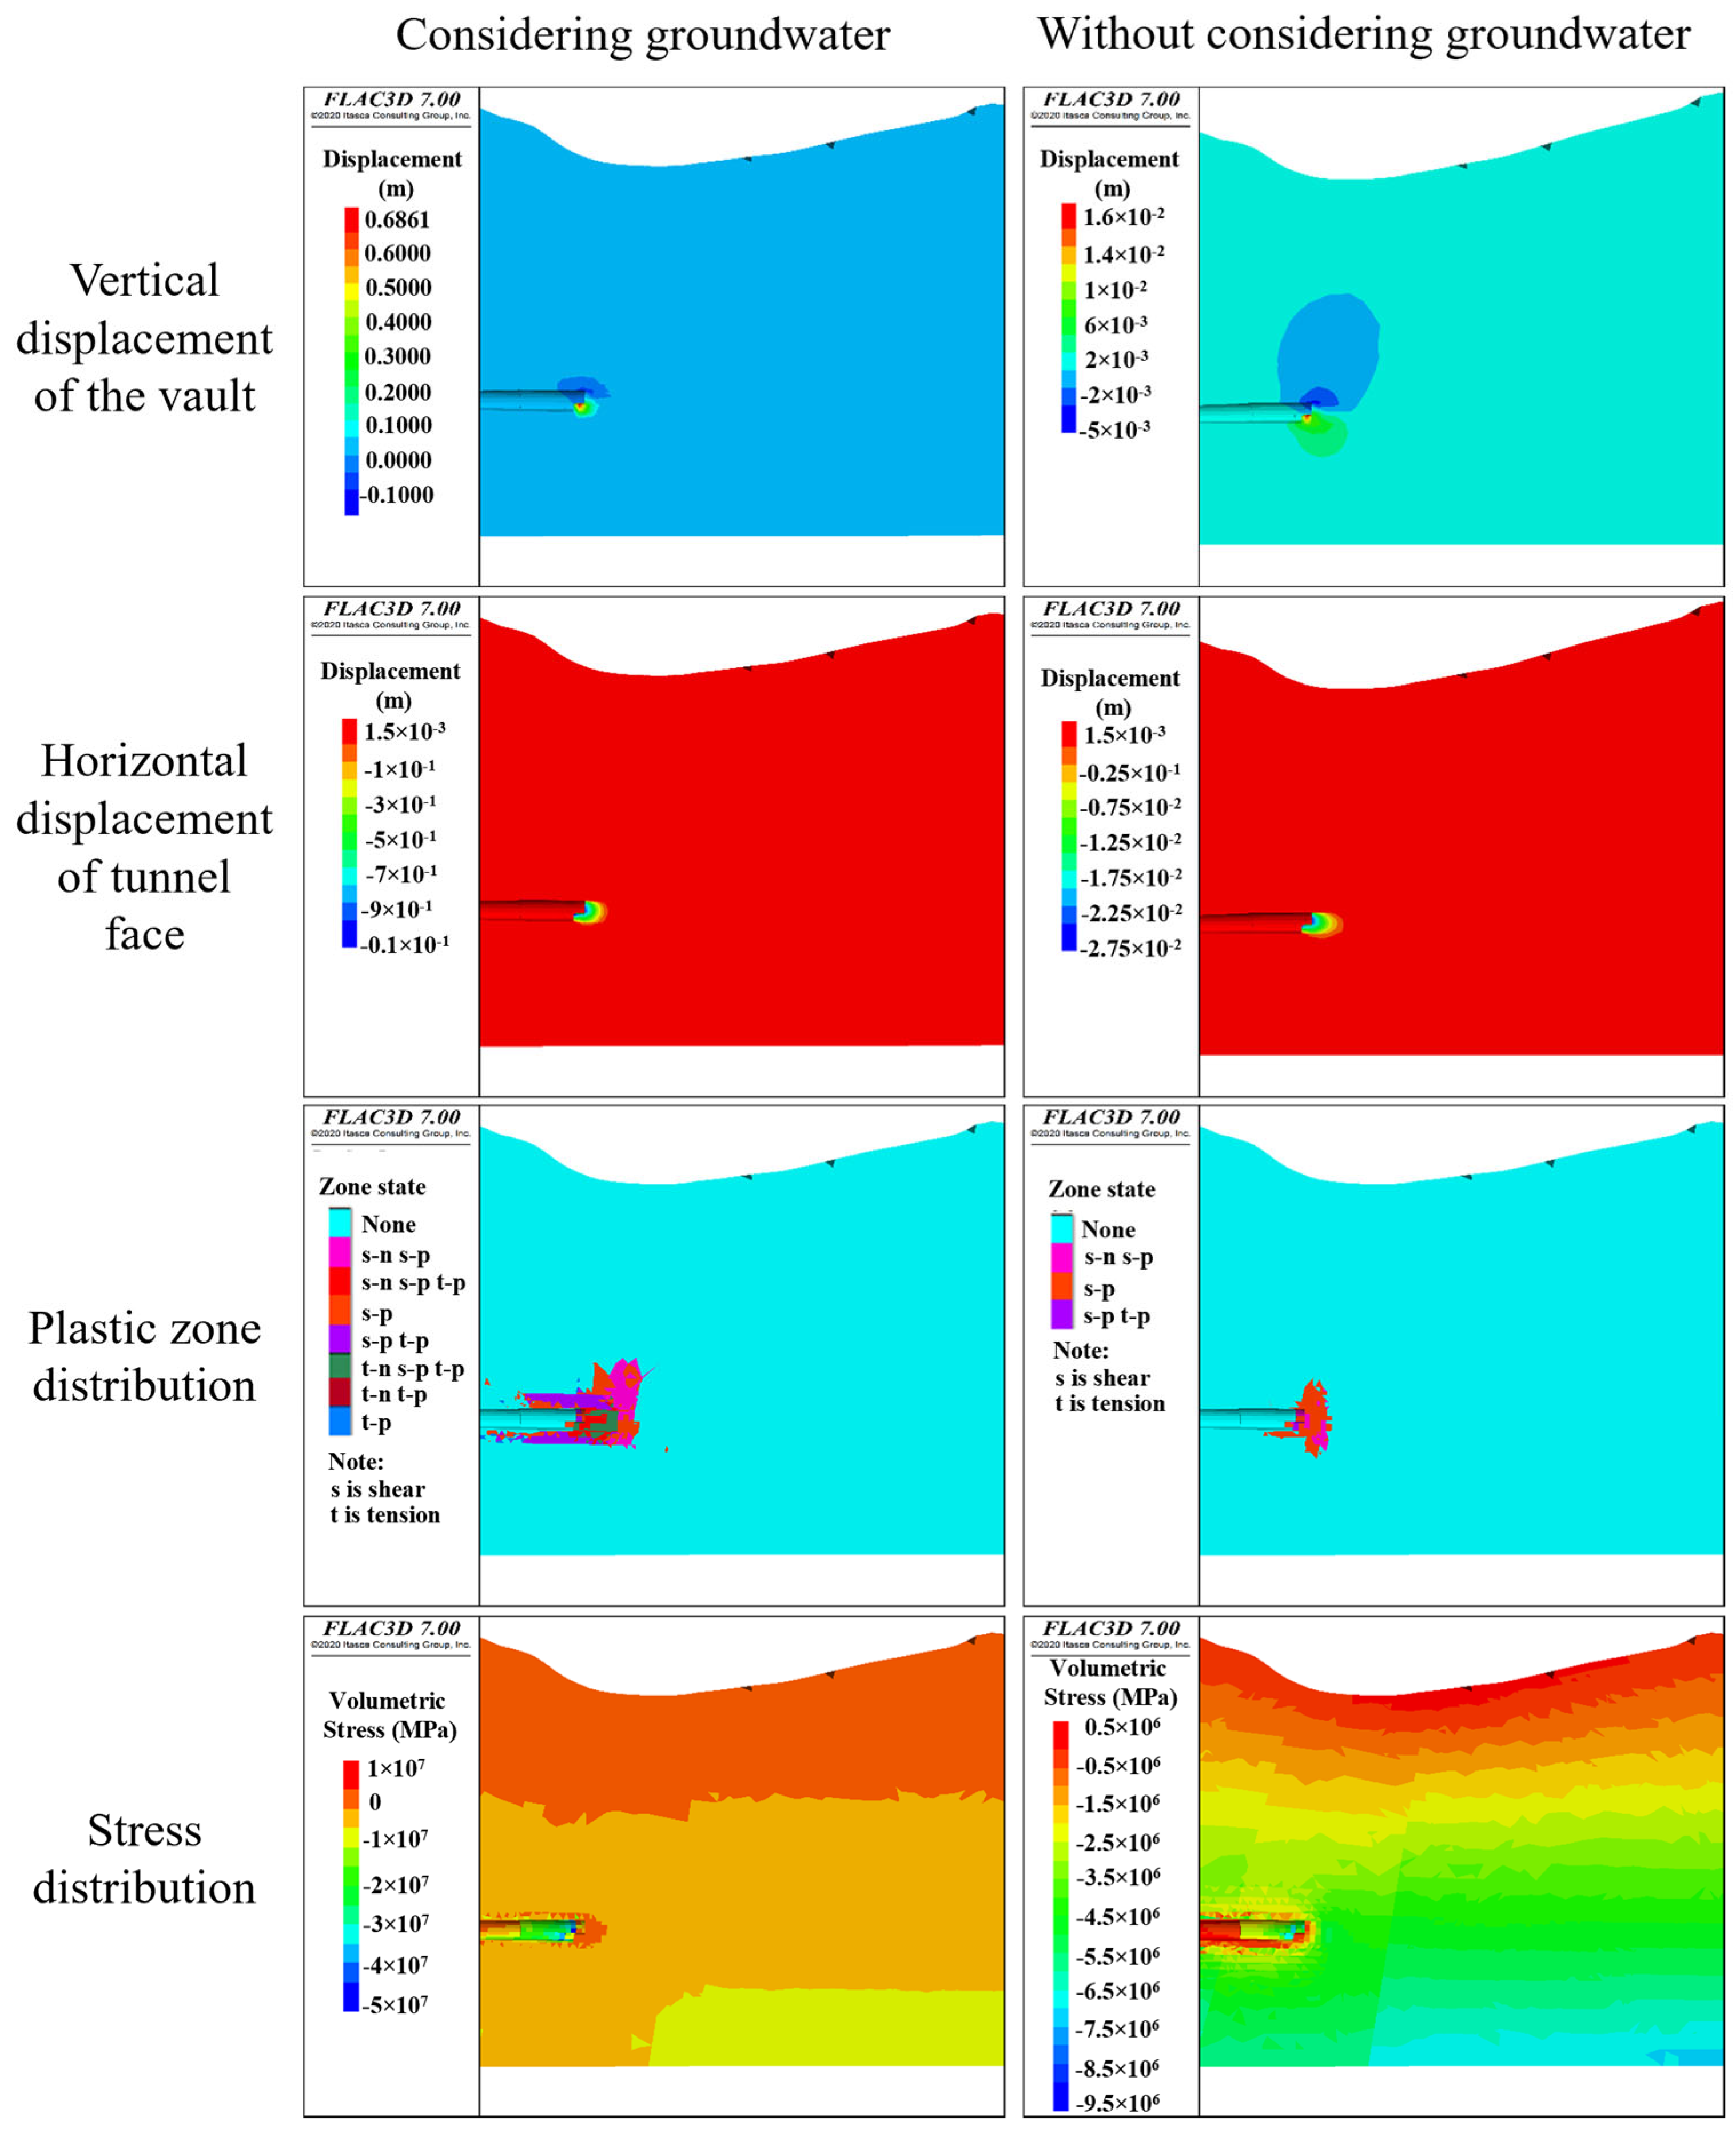
3.1. Deformation and Stress Analysis of Surrounding Rock Induced by Tunnel Excavation and Drainage

The deformation of surrounding rock and distribution of the plastic zone caused by tunnel excavation in the fault section, without considering grouting reinforcement and overrun support, are shown in Figure 5. The results show that the maximum settlement of the vault is 4.8 mm when groundwater is not considered, and the maximum settlement of the tunnel vault is 142.4 mm when groundwater is considered, which is 2970% of the value when groundwater is not considered. According to GB 50911 [35], the settlement of the vault should be controlled within 20 mm after the construction of the tunnel is completed. The main reason is that the appearance of plastic zones occurs when groundwater is considered, which leads to much greater arch settlement in the presence of groundwater than in the absence of groundwater. The results indicate that the presence of groundwater is not conducive to the safety of tunnel excavation and may lead to serious accidents, such as collapse during the excavation process. Therefore, when tunnels are excavated in underground water-rich strata, methods such as grouting need to be adopted to ensure construction safety. The maximum horizontal displacement of the palm face is 26.36 mm when groundwater is not considered, and the maximum horizontal displacement of the palm face is 1173.8 mm when groundwater is considered, which is about 4450% of the value when groundwater is not considered; in addition, at this time, the palm face is damaged by large deformation. The distribution map of the plastic zone shows that the distribution range of the plastic zone of the surrounding rock is obviously larger when considering groundwater. The maximum compressive stress near the excavated perimeter rock is larger when considering groundwater, and the area of the tensile stress zone near the palm face is also obviously larger when considering groundwater. Therefore, the hydraulic coupling calculation can more realistically simulate the surrounding rock response caused by tunnel excavation and drainage under groundwater-rich stratum conditions.
Construction at the fault fracture zone is the most unfavorable situation of tunnel excavation; the surrounding rock deformation caused by the water surge of tunnel excavation under these circumstances is shown in Table 6. The peripheral rock settlement at the tunnel vault changes significantly at 0.5 h of excavation, after which the growth rate of peripheral rock settlement decreases gradually, and the peripheral rock settlement at the vault reaches its maximum value at 6h of excavation. When the modulus of elasticity of the surrounding rock is 3, 6, 8 and 12 GPa, the maximum settlement of the surrounding rock at the arch top is 816 mm, 470 mm, 314.8 mm and 26 mm, respectively, which shows that with the decrease of the modulus of elasticity of the surrounding rock, the settlement of the surrounding rock caused by the excavation of the tunnel is gradually increased, and the deformation rate of the surrounding rock is gradually increased. In addition, when the modulus of elasticity of the surrounding rock is greater than 12 GPa, the maximum settlement of surrounding rock caused by tunnel excavation is less than 26 mm, which is relatively safe for tunnel construction, and the stability of surrounding rock is better; the other three conditions are riskier for tunnel construction, and the surrounding rock is prone to large deformation damage.
The settlements of the surrounding rock at different sections behind the tunnel face caused by a single advance of tunnel excavation in Working condition 3 are shown in Figure 6. The maximum settlements of the vault at 0, 2, 4 and 6 m from the tunnel face are 136.49 mm, 311.23 mm, 11.41 mm and 6.48 mm, respectively. The results illustrate that the maximum settlement of the surrounding rock behind the tunnel face occurs at 2 m from the tunnel face. In addition, the deformation range of the surrounding rock is about 0.5 times the tunnel diameter. Due to the mutual influence of the excavation and drainage of the two tunnels, the deformation of the surrounding rock near the tunnel palm face is asymmetrical, and the deformation of the surrounding rock in the middle of the two tunnels is larger.
The maximum settlement of the vault at 2 m from the tunnel face was investigated for Working condition 3 with different permeability coefficients of the surrounding rock. The variation of maximum settlement with excavation time is shown in Figure 7. The maximum settlement of the vault gradually increases with the increase of the permeability coefficient of the surrounding rock of the fault. This result shows that the larger the permeability coefficient is, the more abrupt the change of the settlement of the vault is, and the easier it is to cause large deformation damage to the surrounding rock. When the permeability coefficient of the fault is 0.24 m/d, the arch settlement reaches the maximum value after 0.5 h of excavation, and sequentially, when the permeability coefficient of the fault is 0.096 m/d, 0.048 m/d, and 0.0048 m/d, the arch settlement reaches the maximum value after 1 h, 6 h and 12 h of excavation, respectively.
The variation of the maximum stress of the surrounding rock and the maximum strain of the tunnel lining with the elasticity modulus of the surrounding rock is shown in Figure 8a,b. As the modulus of elasticity of the surrounding rock increases, the maximum strain of the surrounding rock gradually decreases, and the maximum compressive stress acting on the primary and secondary linings also gradually decreases. When the modulus of elasticity of the surrounding rock is 3, 6, 8 and 12 GPa, the maximum strains of the surrounding rock in the arch are 0.56, 0.32, 0.234, and 0.02, the maximum compressive stresses acting on the primary lining are 8.3, 6.6, 4.4, and 2.7 MPa, and the maximum compressive stresses acting on the secondary lining are 0.46, 0.33, 0.28, and 0.19 MPa, respectively.
The variation of the maximum stress of the surrounding rock and the maximum strain of the tunnel lining with the permeability coefficient of the surrounding rock is shown in Figure 9a,b. As the permeability coefficient of the fault-surrounding rock keeps increasing, the maximum strain of the surrounding rock and the maximum compressive stress of the lining keep increasing, but the overall increase of the maximum compressive stress of the lining is smaller. When the permeability coefficients of the fault-surrounding rock are 0.0048, 0.048, 0.096, 0.24, 0.48, and 0.96 m/d, the maximum strains of the surrounding rock of the arch at 2 m from the palm face are 0.174, 0.234, 0.235, 0.253, 0.285 and 0.311, and the maximum perimeter rock pressures of the initial lining of the arch at 2 m from the palm face are 4.2, 4.4, 4.41, 4.49, 4.52 and 4.63 MPa, and the maximum peripheral rock pressures of the second lining of the arch top 2 m from the palm face are 0.27, 0.28, 0.28, 0.285, 0.293 and 0.298 MPa, respectively.

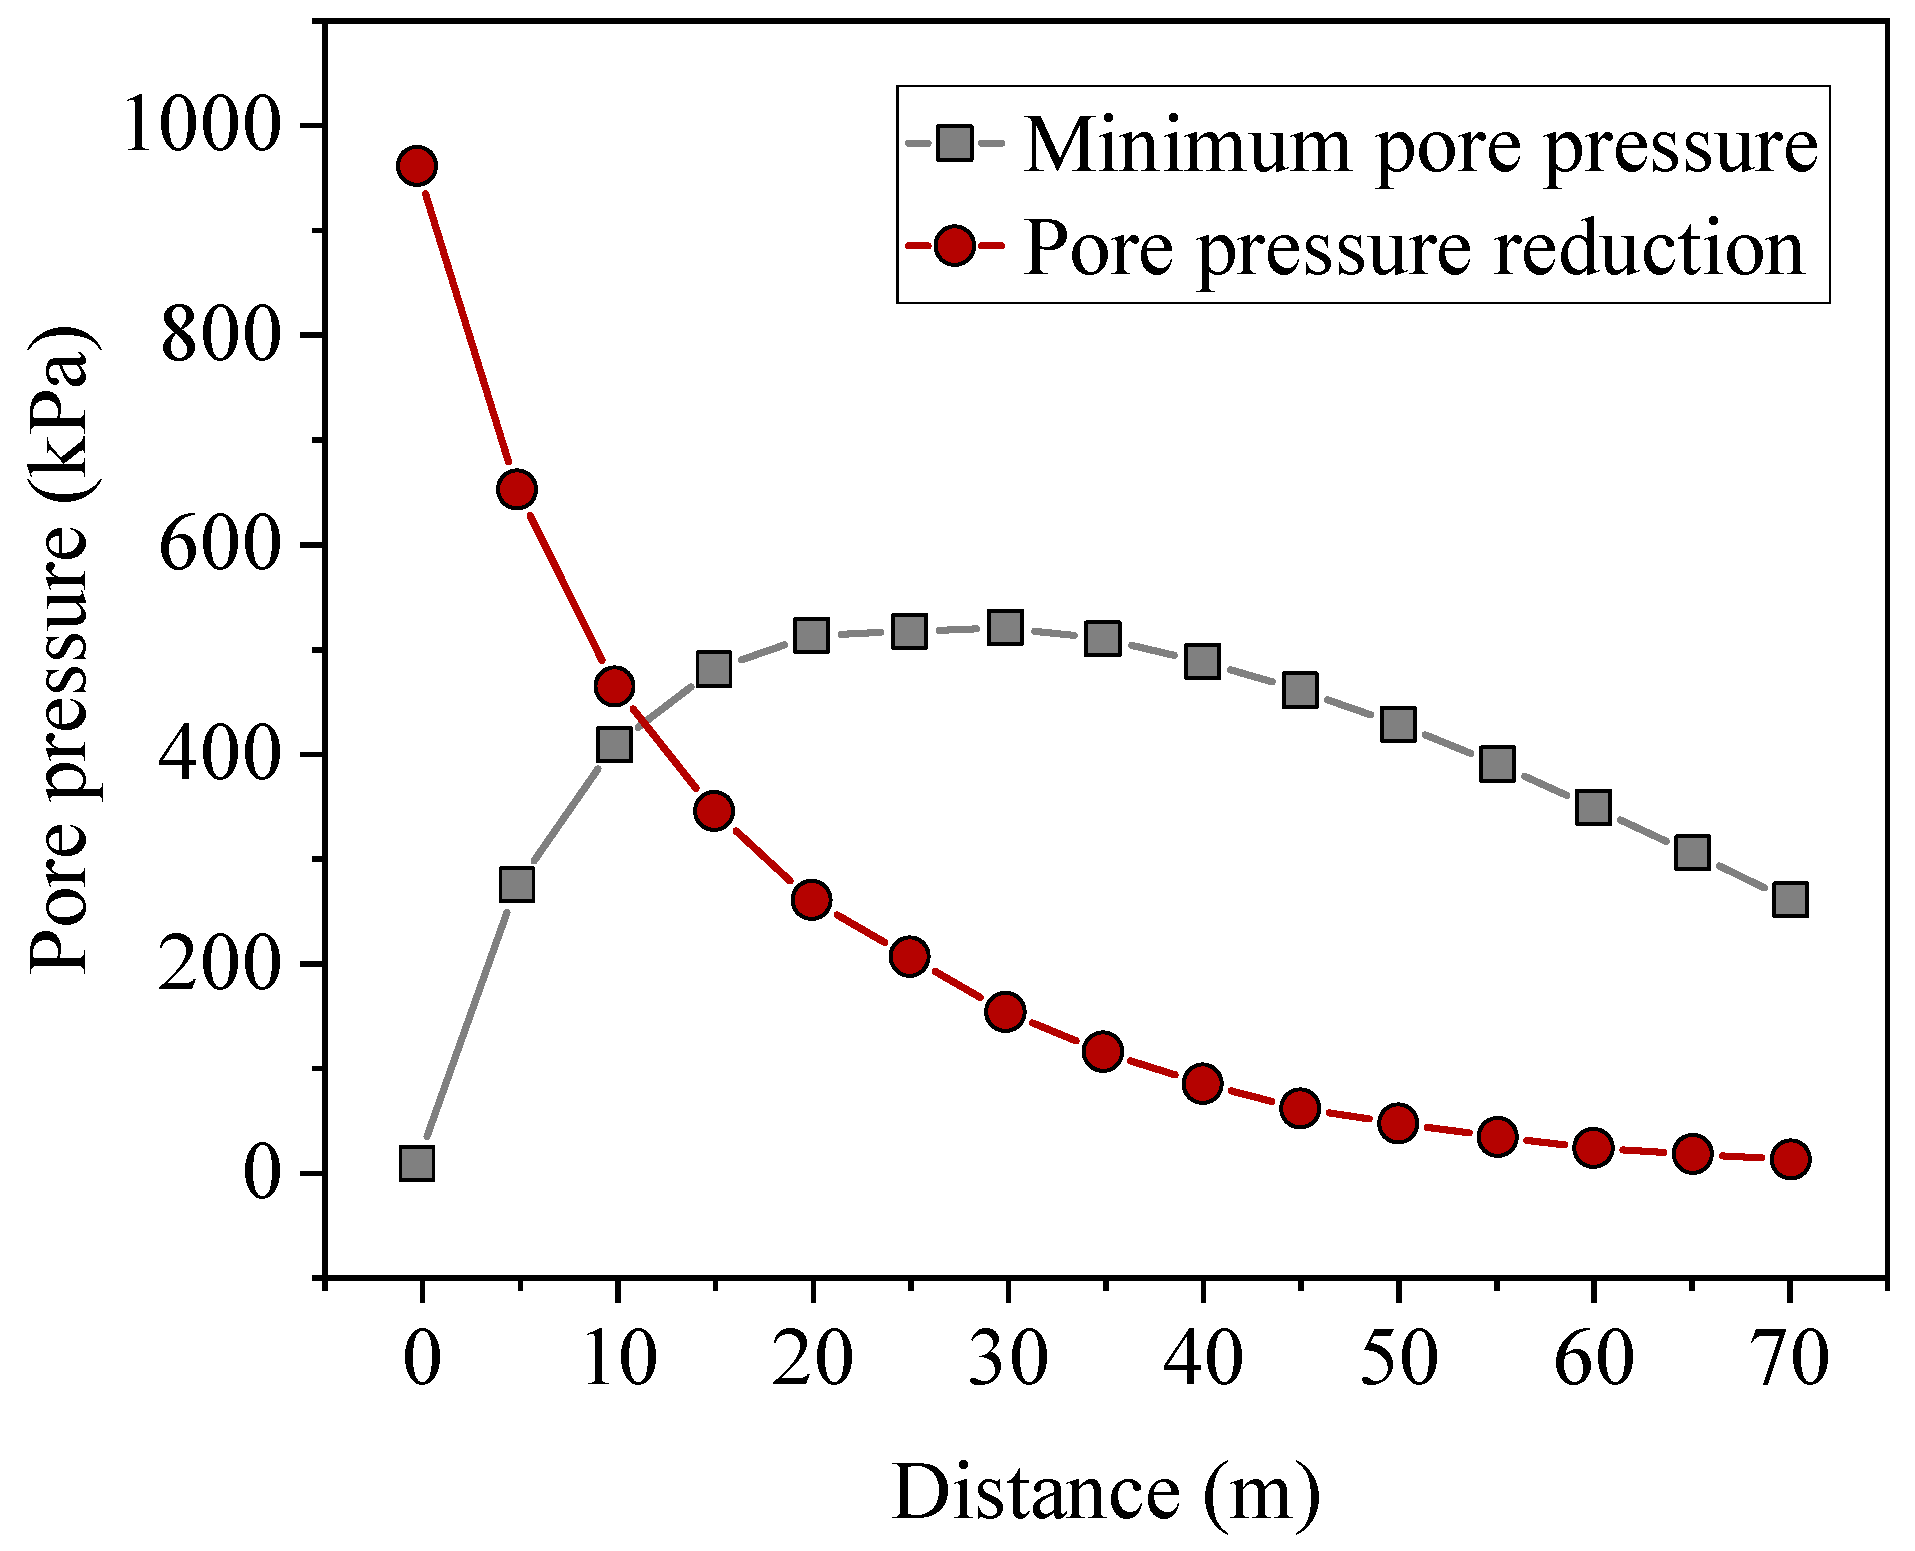
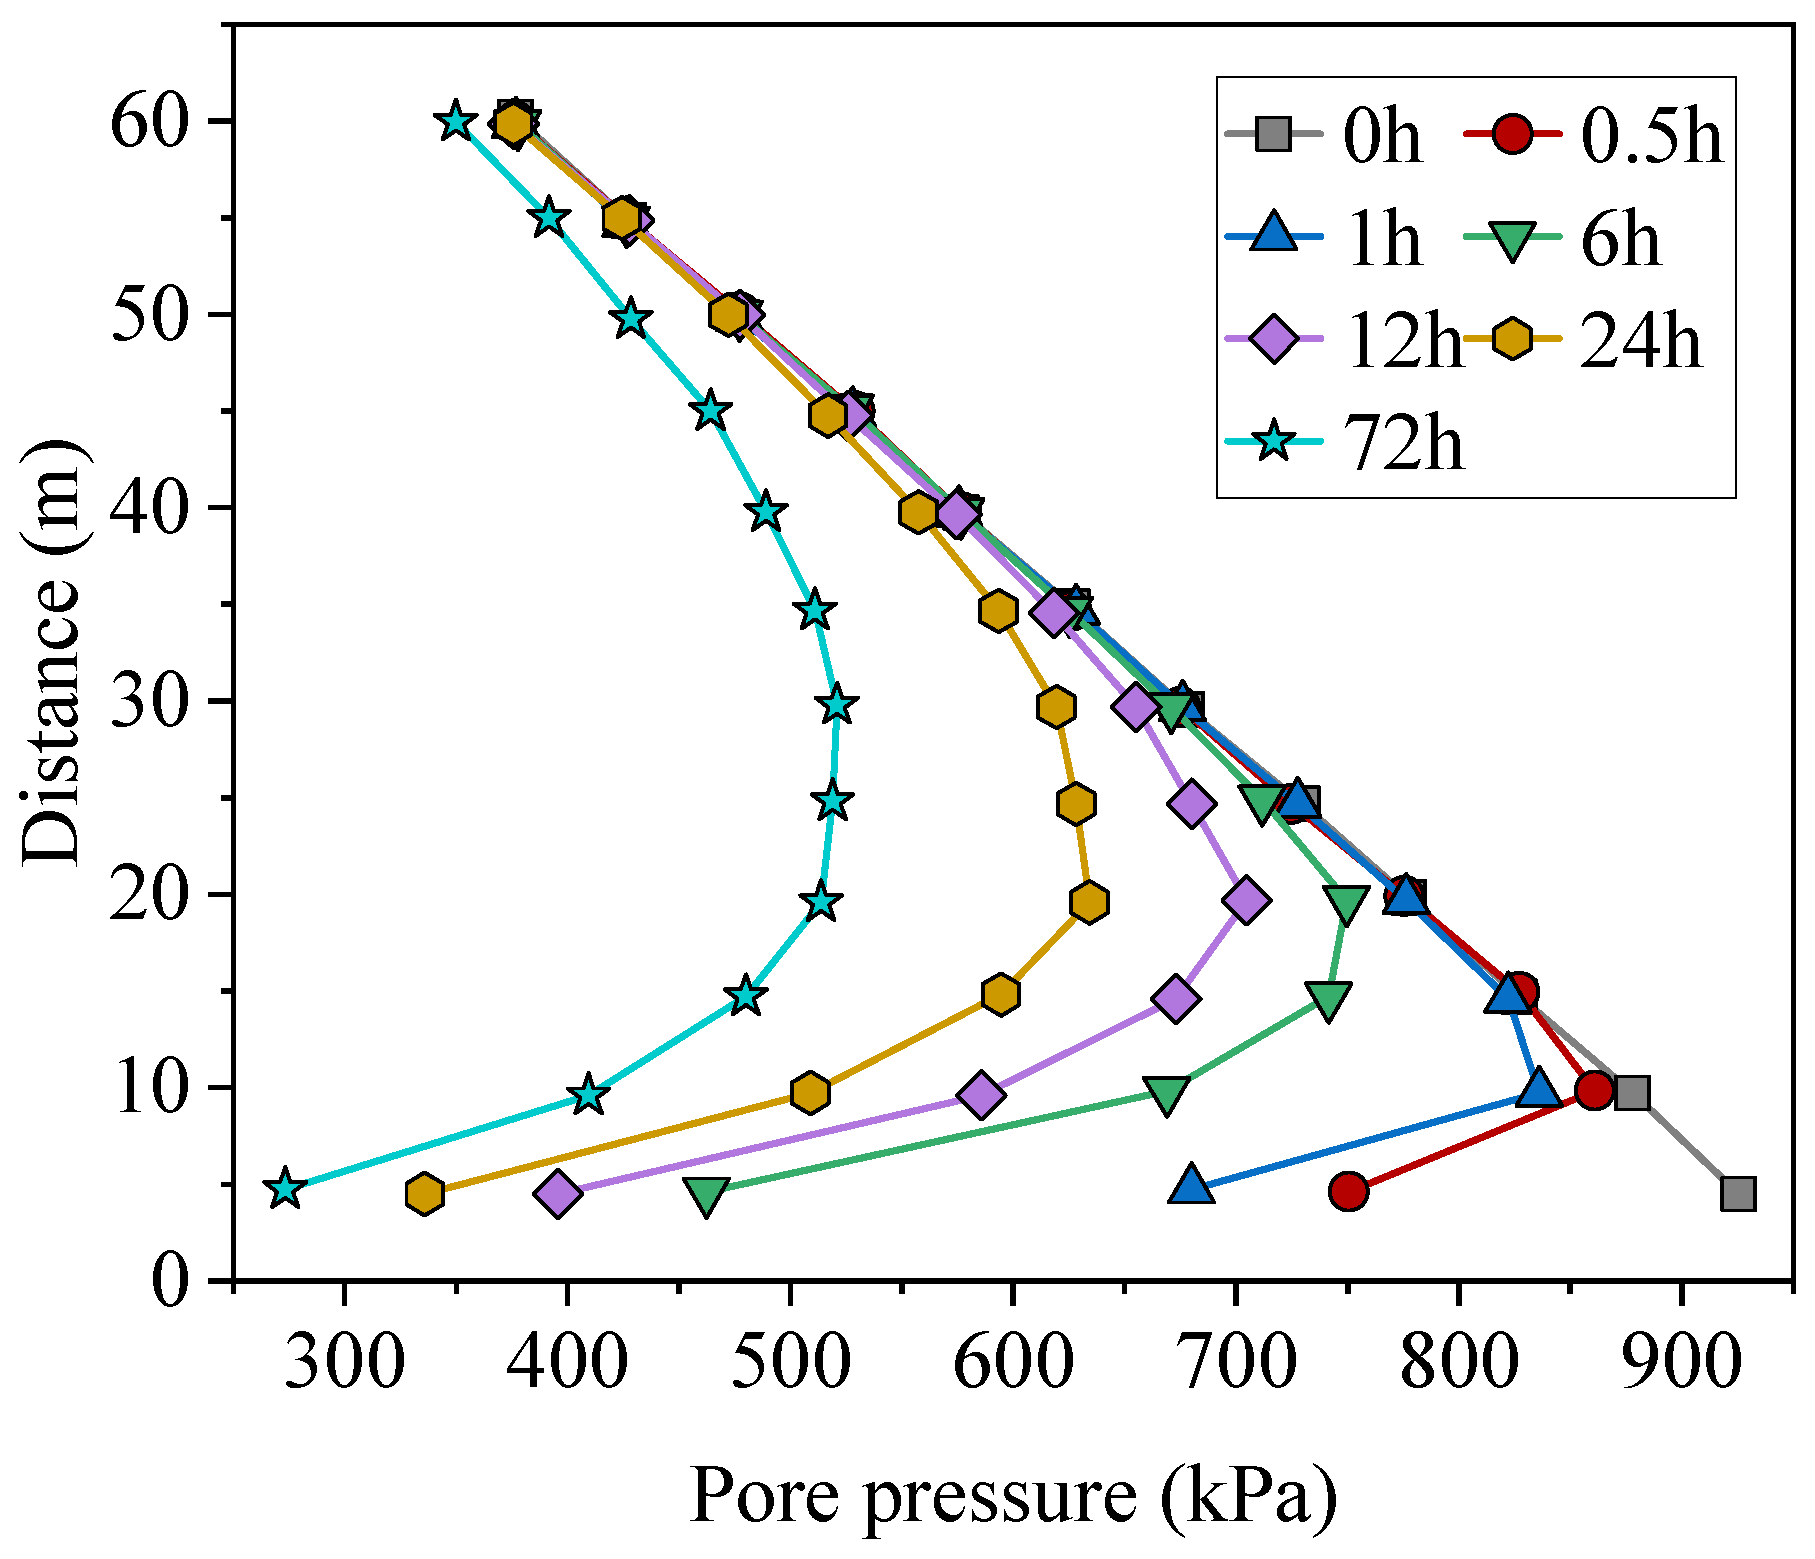
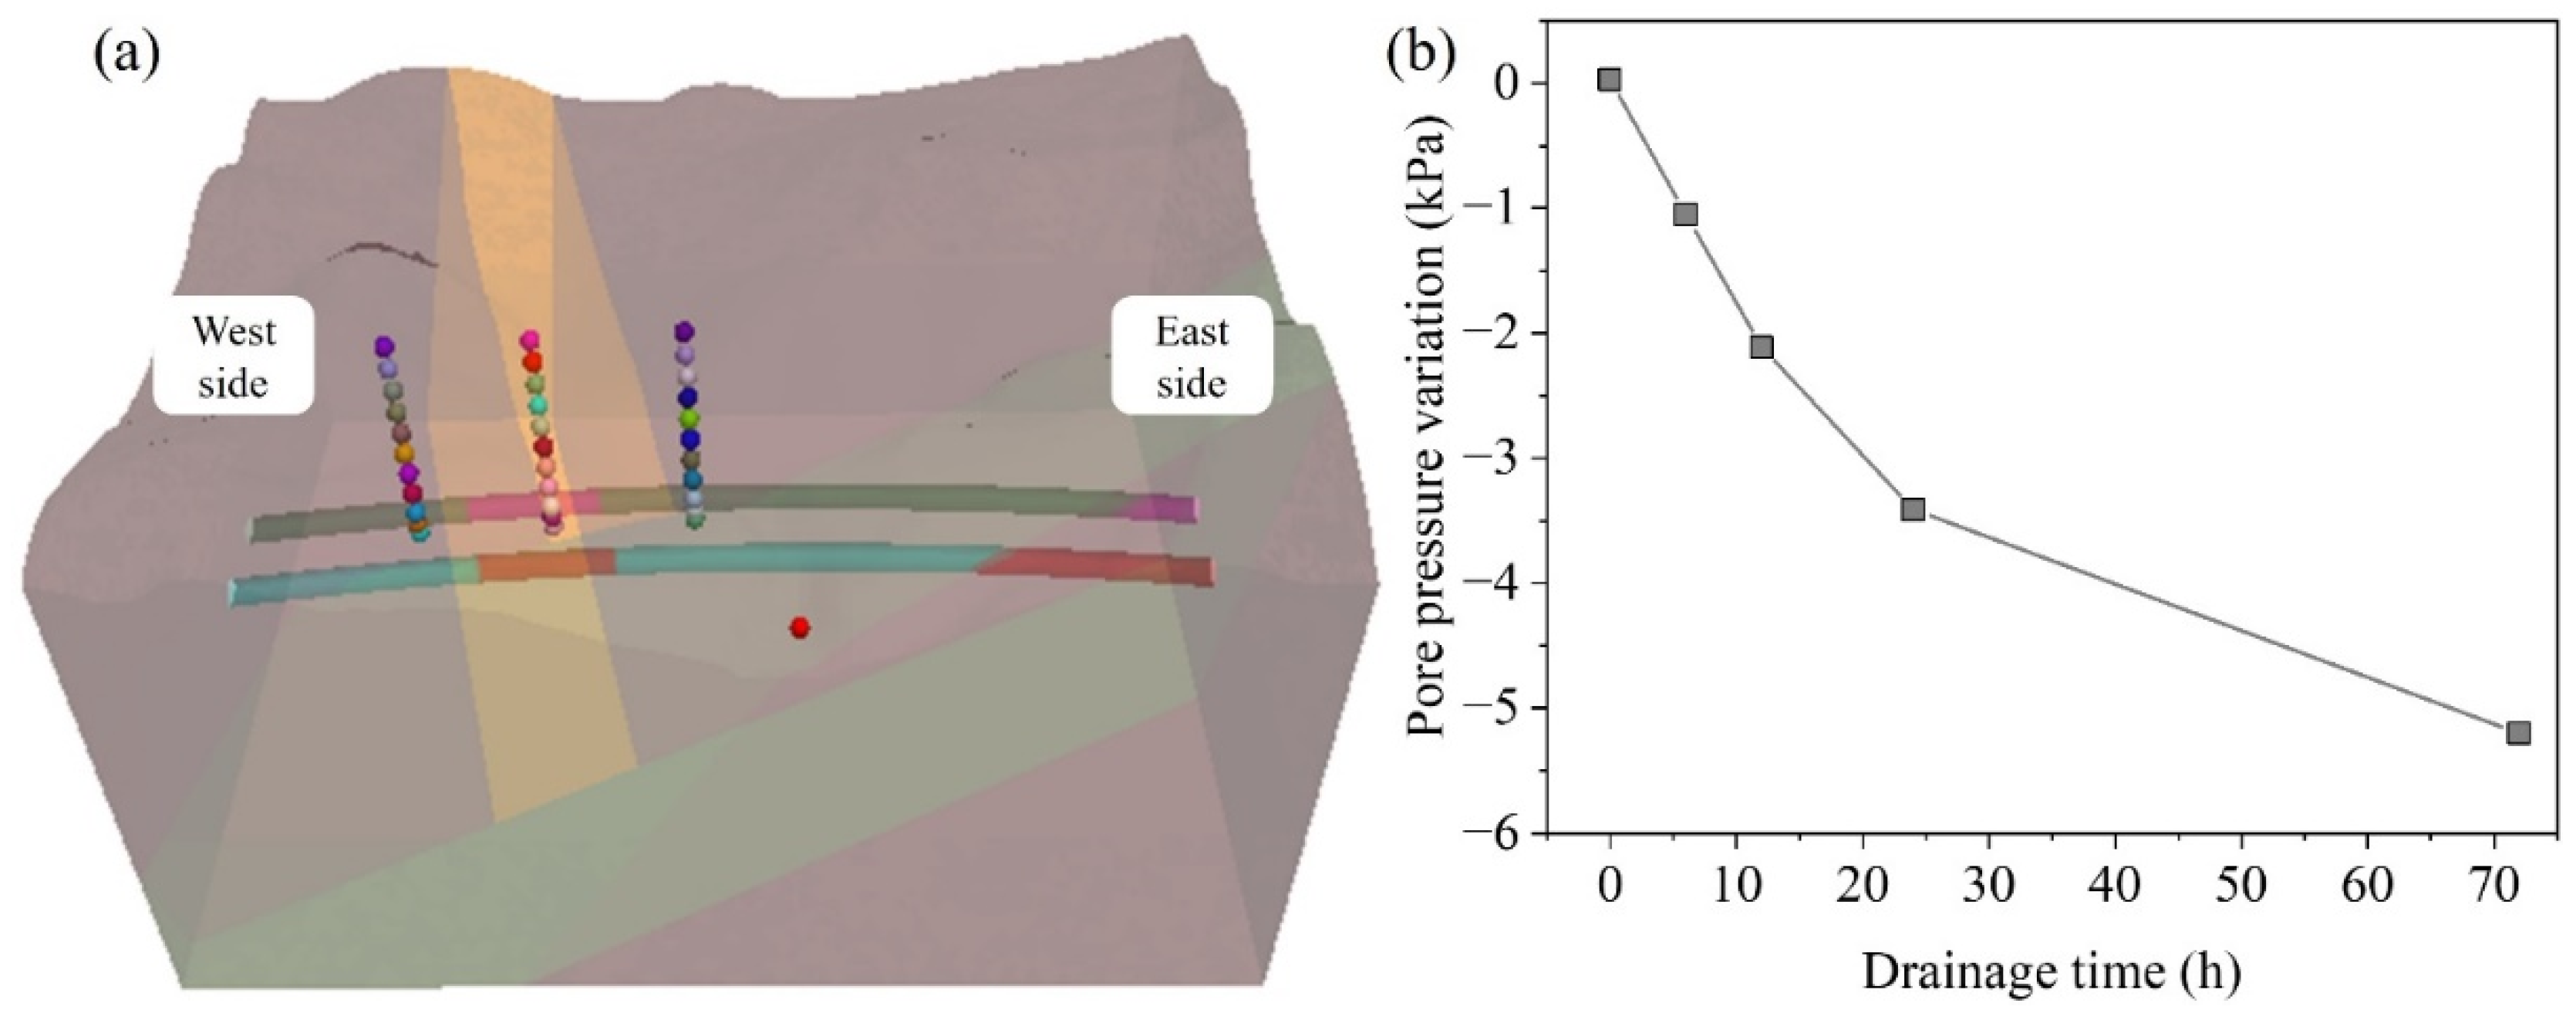
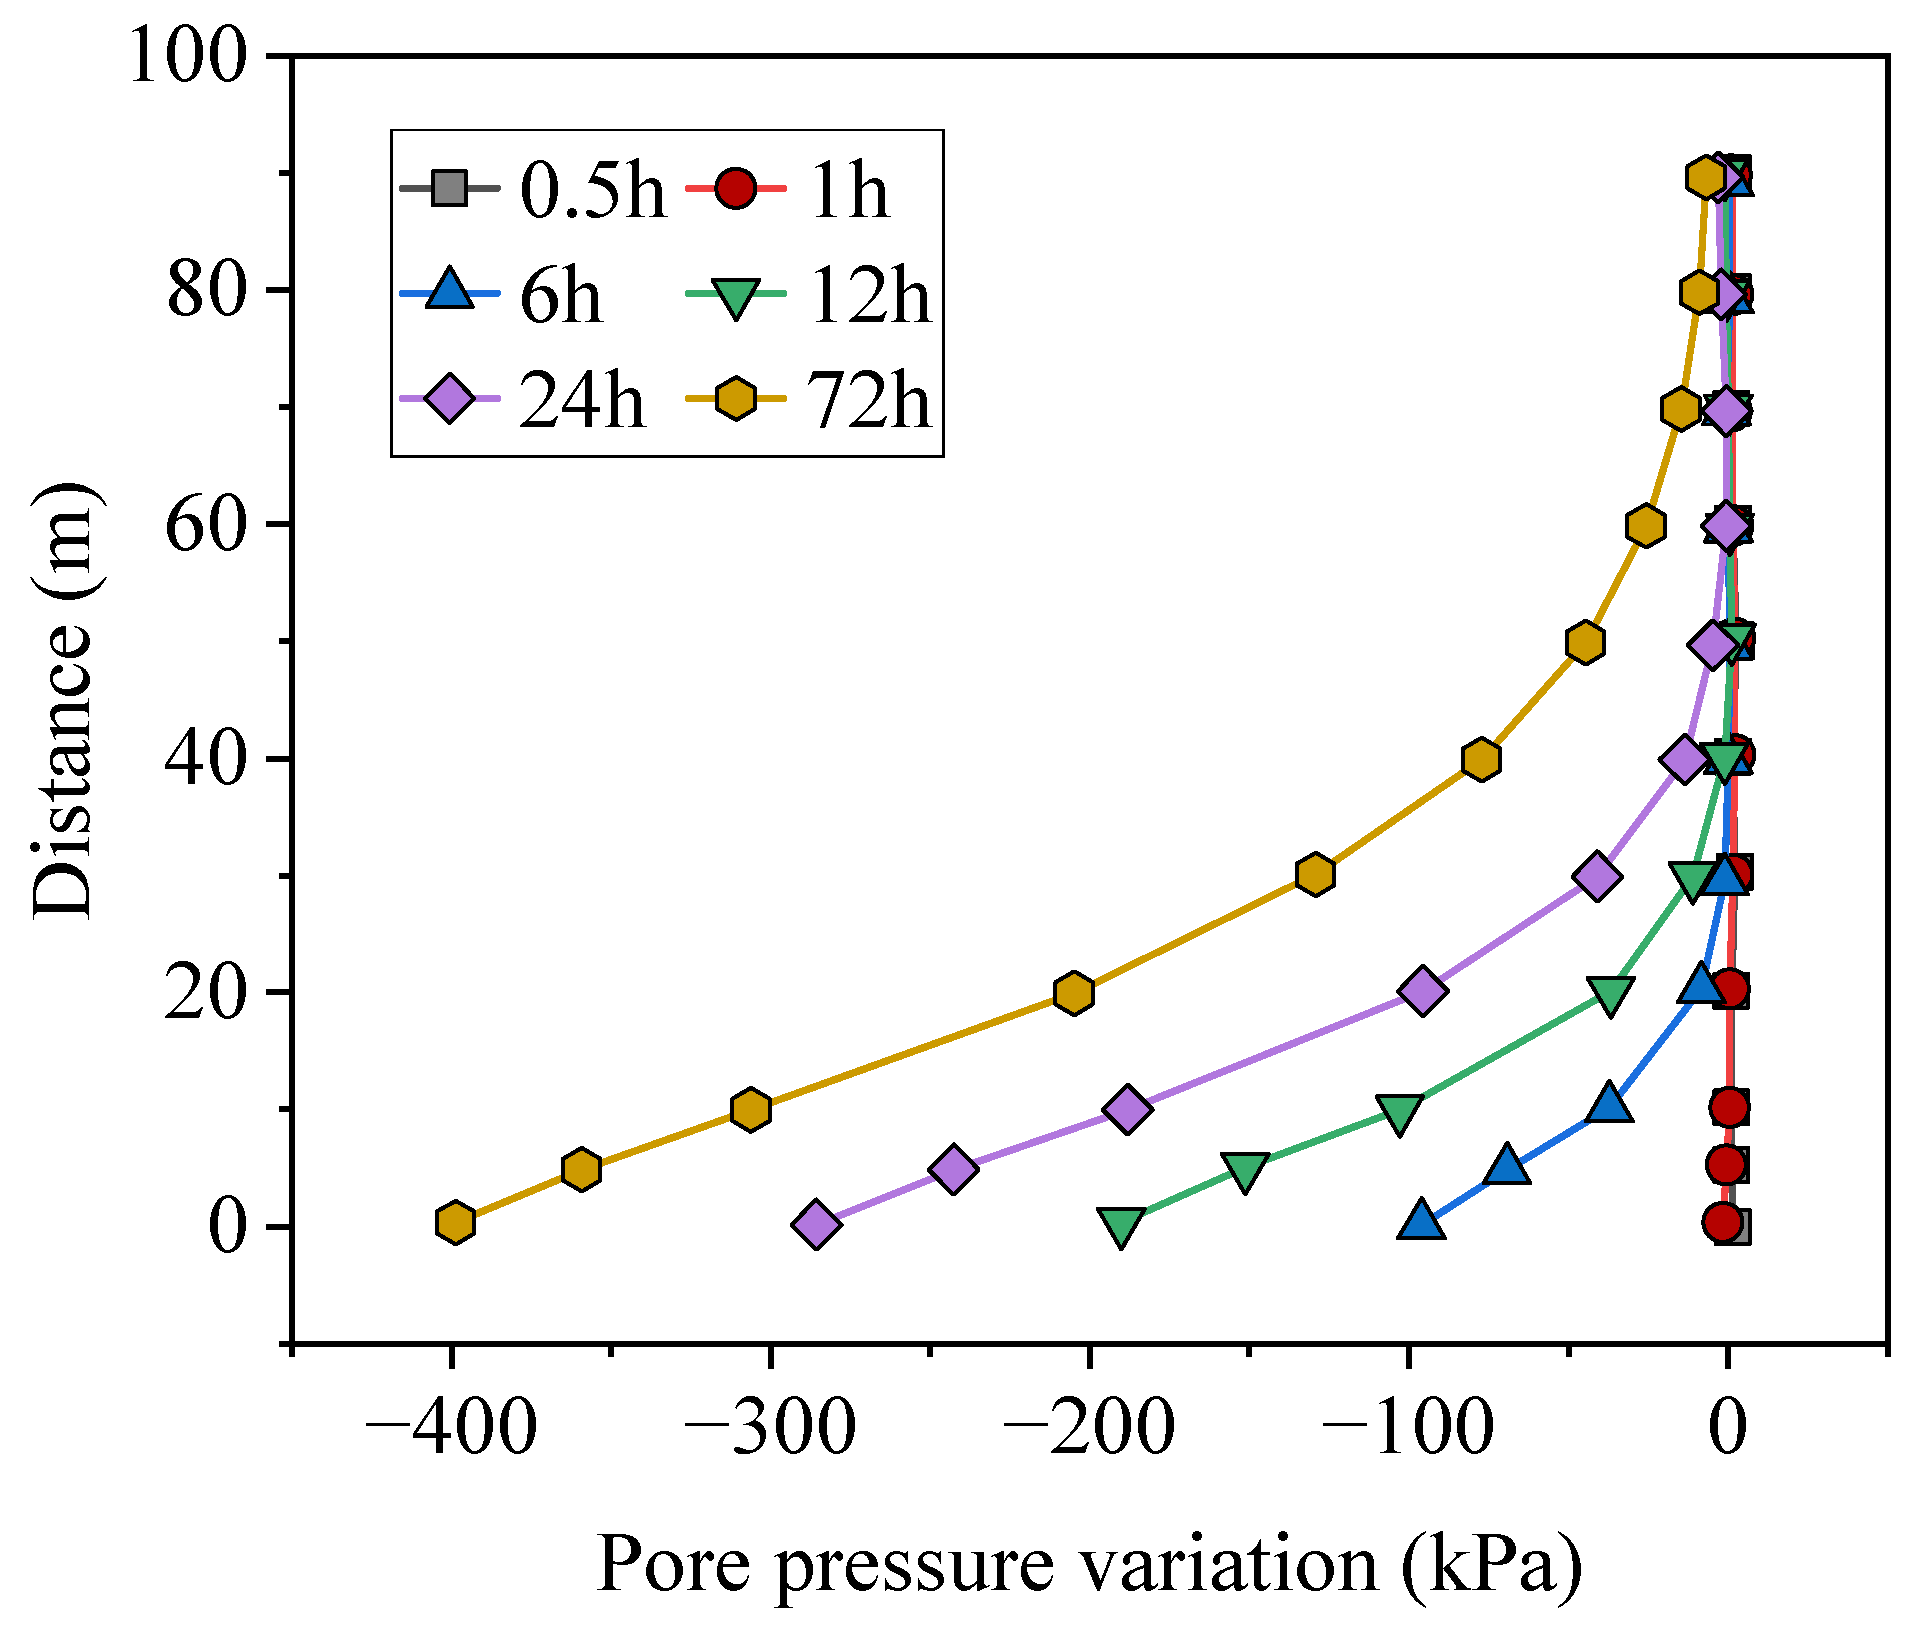
3.2. Pore Pressure Variation in the Surrounding Rock Due to Tunnel Excavation and Drainage

Since the tunnel excavation drain has the greatest influence on the filtration field of the stratum above the tunnel, the change of pore pressure with time at the tunnel vault was investigated, as shown in Figure 10. The results show that the section drainage at the fault after excavation caused a decrease in the pore water pressure at the tunnel vault. The pore pressure increased continuously with the increase of drainage time. The pore pressure at the tunnel vault decreased to 36.3, 32.3, 20.8, 17.6, 15, and 12.13 kPa at drainage durations of 0.5, 1, 6, 12, 24, and 72 h. The pore pressure at the tunnel vault was significantly smaller than that of the rock medium in the same depth space, as shown in Figure 10a. The pore pressure decreased rapidly by 939.7 kPa at 0.5 h after the start of drainage. The rate of pore pressure decrease then decreased gradually until it reached 963.87 kPa at 72 h, as shown in Figure 10b. In addition, since the tunnel vault is located at the drainage boundary, the pore pressure will suddenly decrease and remain close to zero water pressure during the excavation of the drainage trench.
When considering the area further away from the tunnel excavation boundary, the change rule of pore pressure with drainage time changes. The study area was set at 5 m above the arch, and the changes in the distribution of pore pressure at the location of the tunnel arch caused by cross-section drainage at the fault after tunnel excavation are shown in Figure 11. With the loss of water in the surrounding rock, the pore water pressure in the rock mass around the tunnel keeps decreasing, and the range of drainage influence keeps increasing with the duration of drainage. The pore pressure at the most unfavorable location near the palm face decreases continuously with drainage time, and the range of pore pressure changes gradually becomes larger. The pore pressure decreases and the influence range gradually expands, which indicates that the surrounding rock can easily be destabilized under the action of groundwater filtration as the drainage process gradually proceeds. Therefore, in tunnel excavation, faults should be grouted in good time to reduce water movement; reinforcement and other measures to improve the stability of the surrounding rock should be carried out, in addition to blocking of fissures and pores in the surrounding rock to prevent the occurrence of filtration.
The changes in pore pressure at 0, 10, 25, 40, 55, and 70 m above the tunnel vault after 3 days of drainage are shown in Figure 12. The results show that the pore pressure in the same depth space has the same size, and the maximum point of pore pressure change during excavation and drainage is the most unfavorable position in the same depth space. Therefore, in the study of spatial variation, the distribution characteristics of the smallest pore pressure should be focused on. When the distance from the tunnel vault is less than 10 m, the smallest pore pressure above the vault appears at two separate points above the left and right tunnel sections; as the distance from the vault gradually increases, the smallest pore pressure above the vault becomes a single point centered above the left and right tunnels. In addition, as the distance from the tunnel vault gradually increases, the disturbance range of the filtration field around the surrounding rock caused by tunnel excavation gradually increases, the range of pore pressure reduction gradually increases along the direction of the fault, and the amount of pore pressure change gradually decreases.
The minimum pore pressure and change in pore pressure at different depths in the tunnel vault after 3 days of drainage are shown in Figure 13. As the distance from the tunnel vault increases, the minimum pore pressure increases and then decreases, and reaches a maximum value of 521.78 kPa at 30 m. When the distance from the vault exceeds 55 m, the rate of change of the minimum pore pressure is 8.632 kPa/m, which is close to the change of the initial pore pressure at 10 kPa/m, which indicates that the effect of excavation on the change of the pore pressure outside the measured range is negligible. This indicates that the effect of excavation outside this range on the change of pore pressure can be neglected.
The magnitude of hole pressure in different planes corresponding to different drainage durations from the vault is shown in Figure 14. It can be seen that beyond 15 m from the vault, the pore pressure of 0.5 h and 1 h drainage is basically the same as the initial pore pressure, which indicates that within 1 h, the pore pressure caused by excavation affects the medium over a range of 15 m; and after draining for 6 h, the pore pressure caused by excavation affects a range of 30 m; after draining for 12 h, the range of influence is 40 m; after draining for 24 h, the range of influence is 55 m, and after draining for 72 h, the range of influence is more than 60 m, which affects the pore pressure change of the whole formation.
The monitoring points were arranged as shown in Figure 15a. Three monitoring sections were defined at the tunnel excavation surface, at the fault, and at the non-fault on both sides. The monitoring position was located in the middle of the two tunnels, and 11 monitoring points were defined along the depth of the stratum in each section. The arrangement of the monitoring point is 0, 5, 10, 20, 30, 40, 50, 60, 70, 80, and 90 m above the vault. The monitoring points for borehole pressure were located at the bottom of the reservoir to analyze the influence of the excavation on borehole pressure at the bottom of the reservoir. Monitoring points were set at the bottom of the reservoir to analyze the impact of tunnel face excavation at the fault on the pore pressure at the bottom of Tianzhuhu Reservoir. The pore pressure at the bottom of the Tianzhuhu Reservoir under working condition 4 is shown in Figure 15b. The pore pressure at the bottom of the lake decreased gradually with increased drainage duration, and the rate of pore pressure reduction decreased gradually with increased drainage duration. When the drainage duration was 72 h, the pore pressure reduction reached about 5.2 kPa.
The variation of pore pressure with time at the monitoring point at the tunnel vault between the two tunnels is shown in Figure 16a. The results show that the pore pressure reduction in the fault zone is larger than that in the non-faulted rock mass. The pore pressure at the monitoring point decreases rapidly with increasing drainage time, and the pore pressure reduction of the fault zone is much larger than that of the rock medium on both sides of the fault zone, which is because the surrounding rock of the fault zone is more fragmented and has better water permeability than the rest of the medium. The pore pressure of the surrounding rock on both sides of the fault changed by only 50 kPa after draining for 3 days, which indicates that the surrounding rock at the non-fault is less permeable, and only a small amount of groundwater passes through during the draining process. The pore pressure of the surrounding rock changes little in 1h of drainage, then increases gradually with increasing drainage time.
The variation of pore pressure at different distances from the vault in the fault zone with varying drainage time of the tunnel is shown in Figure 16b. The results show that as the drainage time increases, the affected range of pore pressure gradually expands to the deeper part of the surrounding rock, and when the drainage time is 3 days, the range of pore pressure change is within 50 kPa beyond 50 m from the top of the arch. The pore pressure produces a large change along with the excavation process from the top of the arch to the range of 50 m from the top of the arch.
The variation of pore pressure in the fault zone with varying height from the vault under different drainage times is shown in Figure 17. The degree of pore pressure reduction in the fault zone is more obvious. When the drainage time is less than 1 h, the pore pressure is almost unchanged; when the drainage time is 6 h, the pore pressure of the rock medium less than 30 m from the tunnel vault gradually decreases; when the drainage time is 24 h, the pore pressure of the rock medium less than 50 m from the tunnel vault gradually decreases, so with increasing drainage time, the influence range of the peripheral rock pore pressure becomes wider, and the amount of change of pore pressure at the same elevation increases.

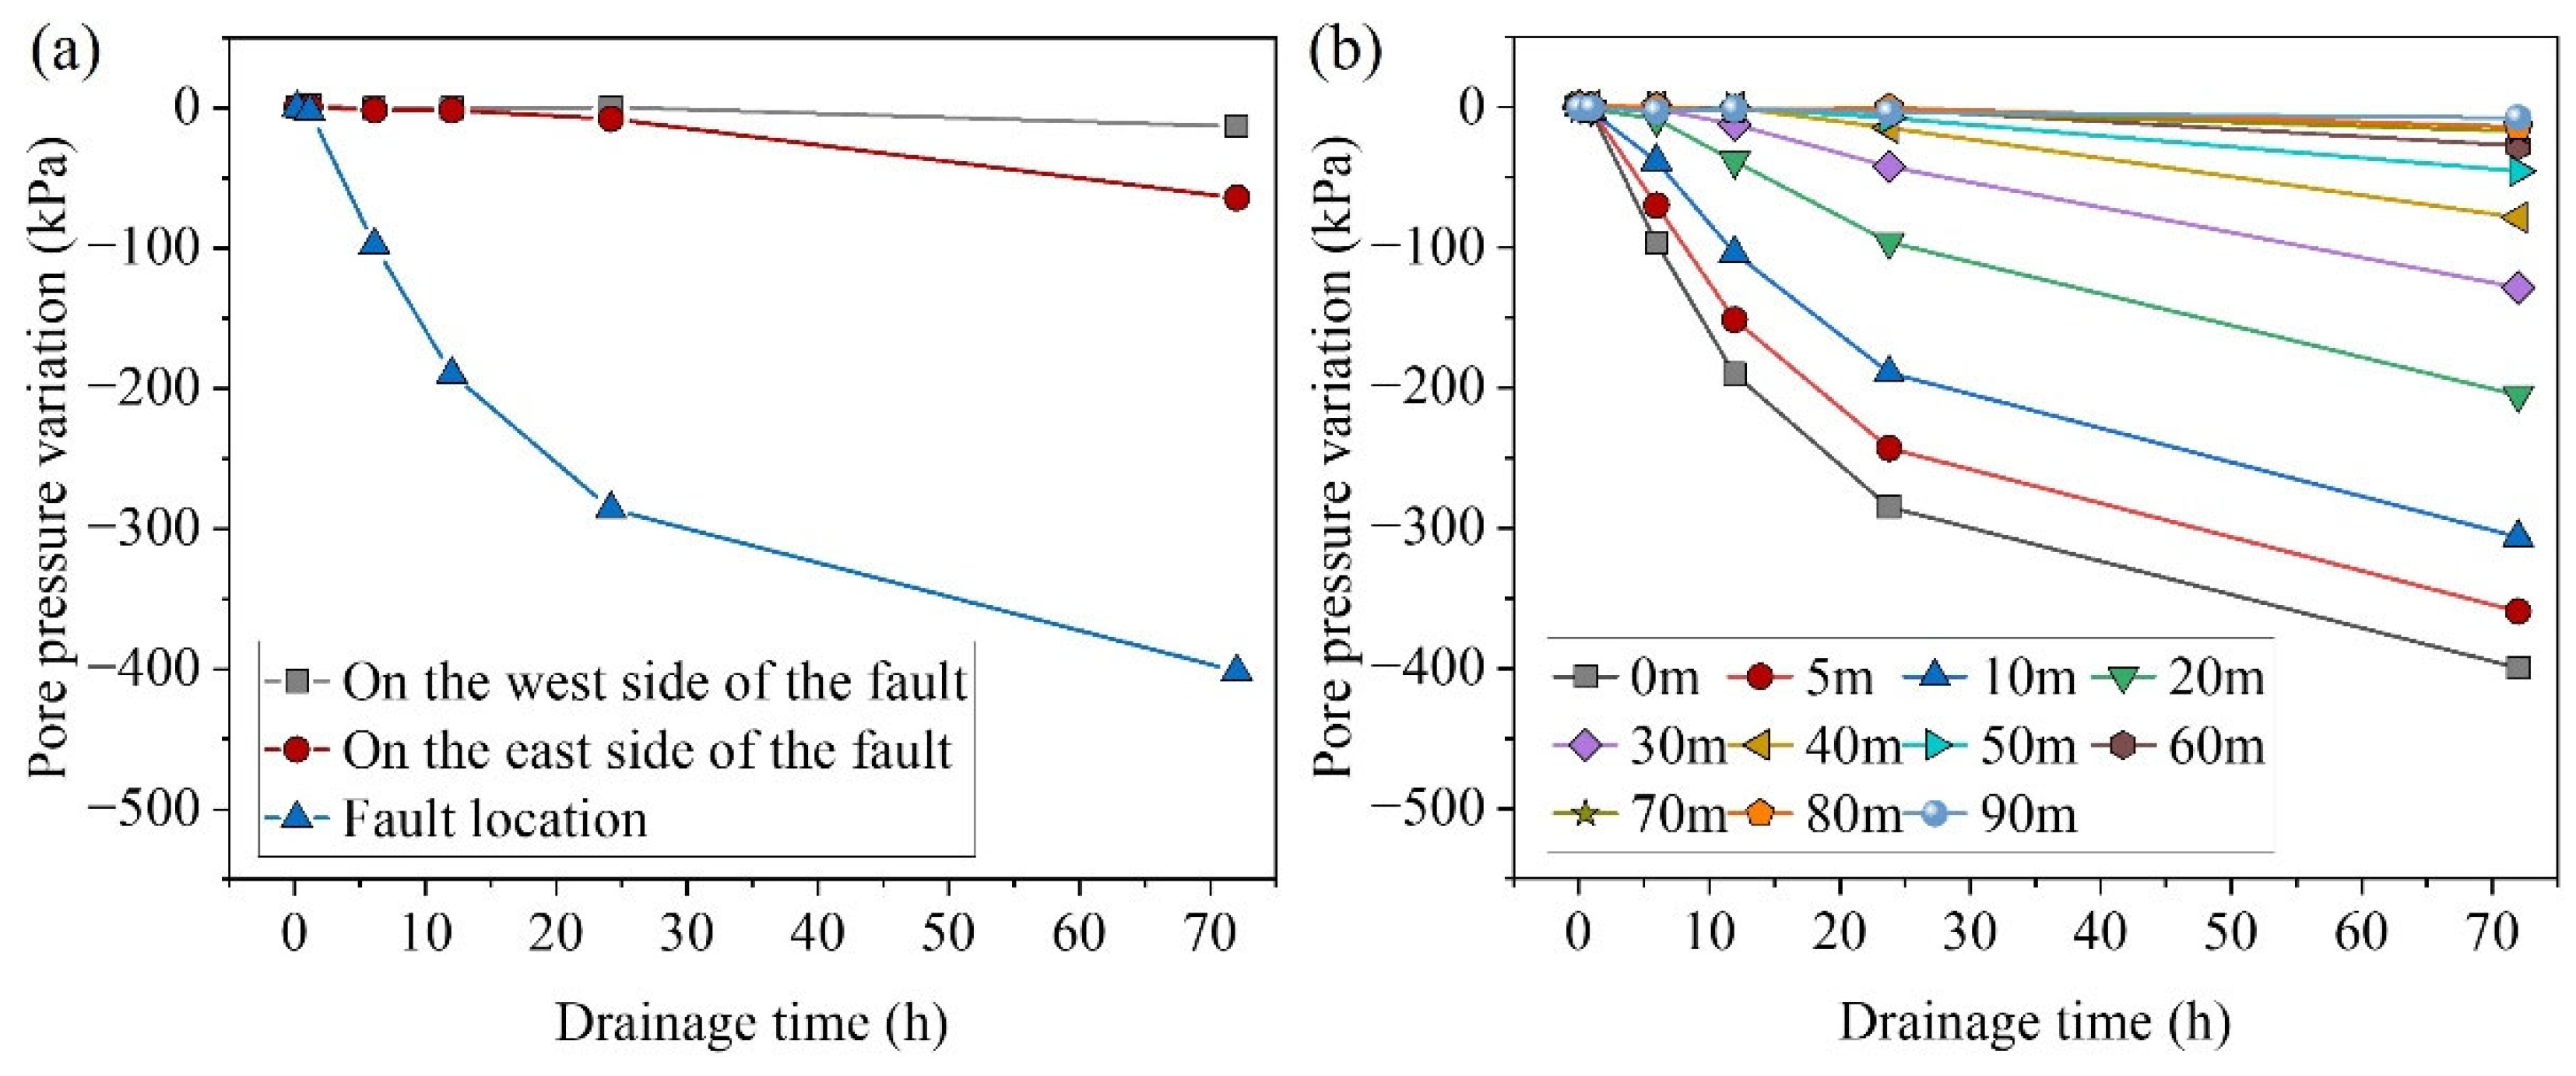
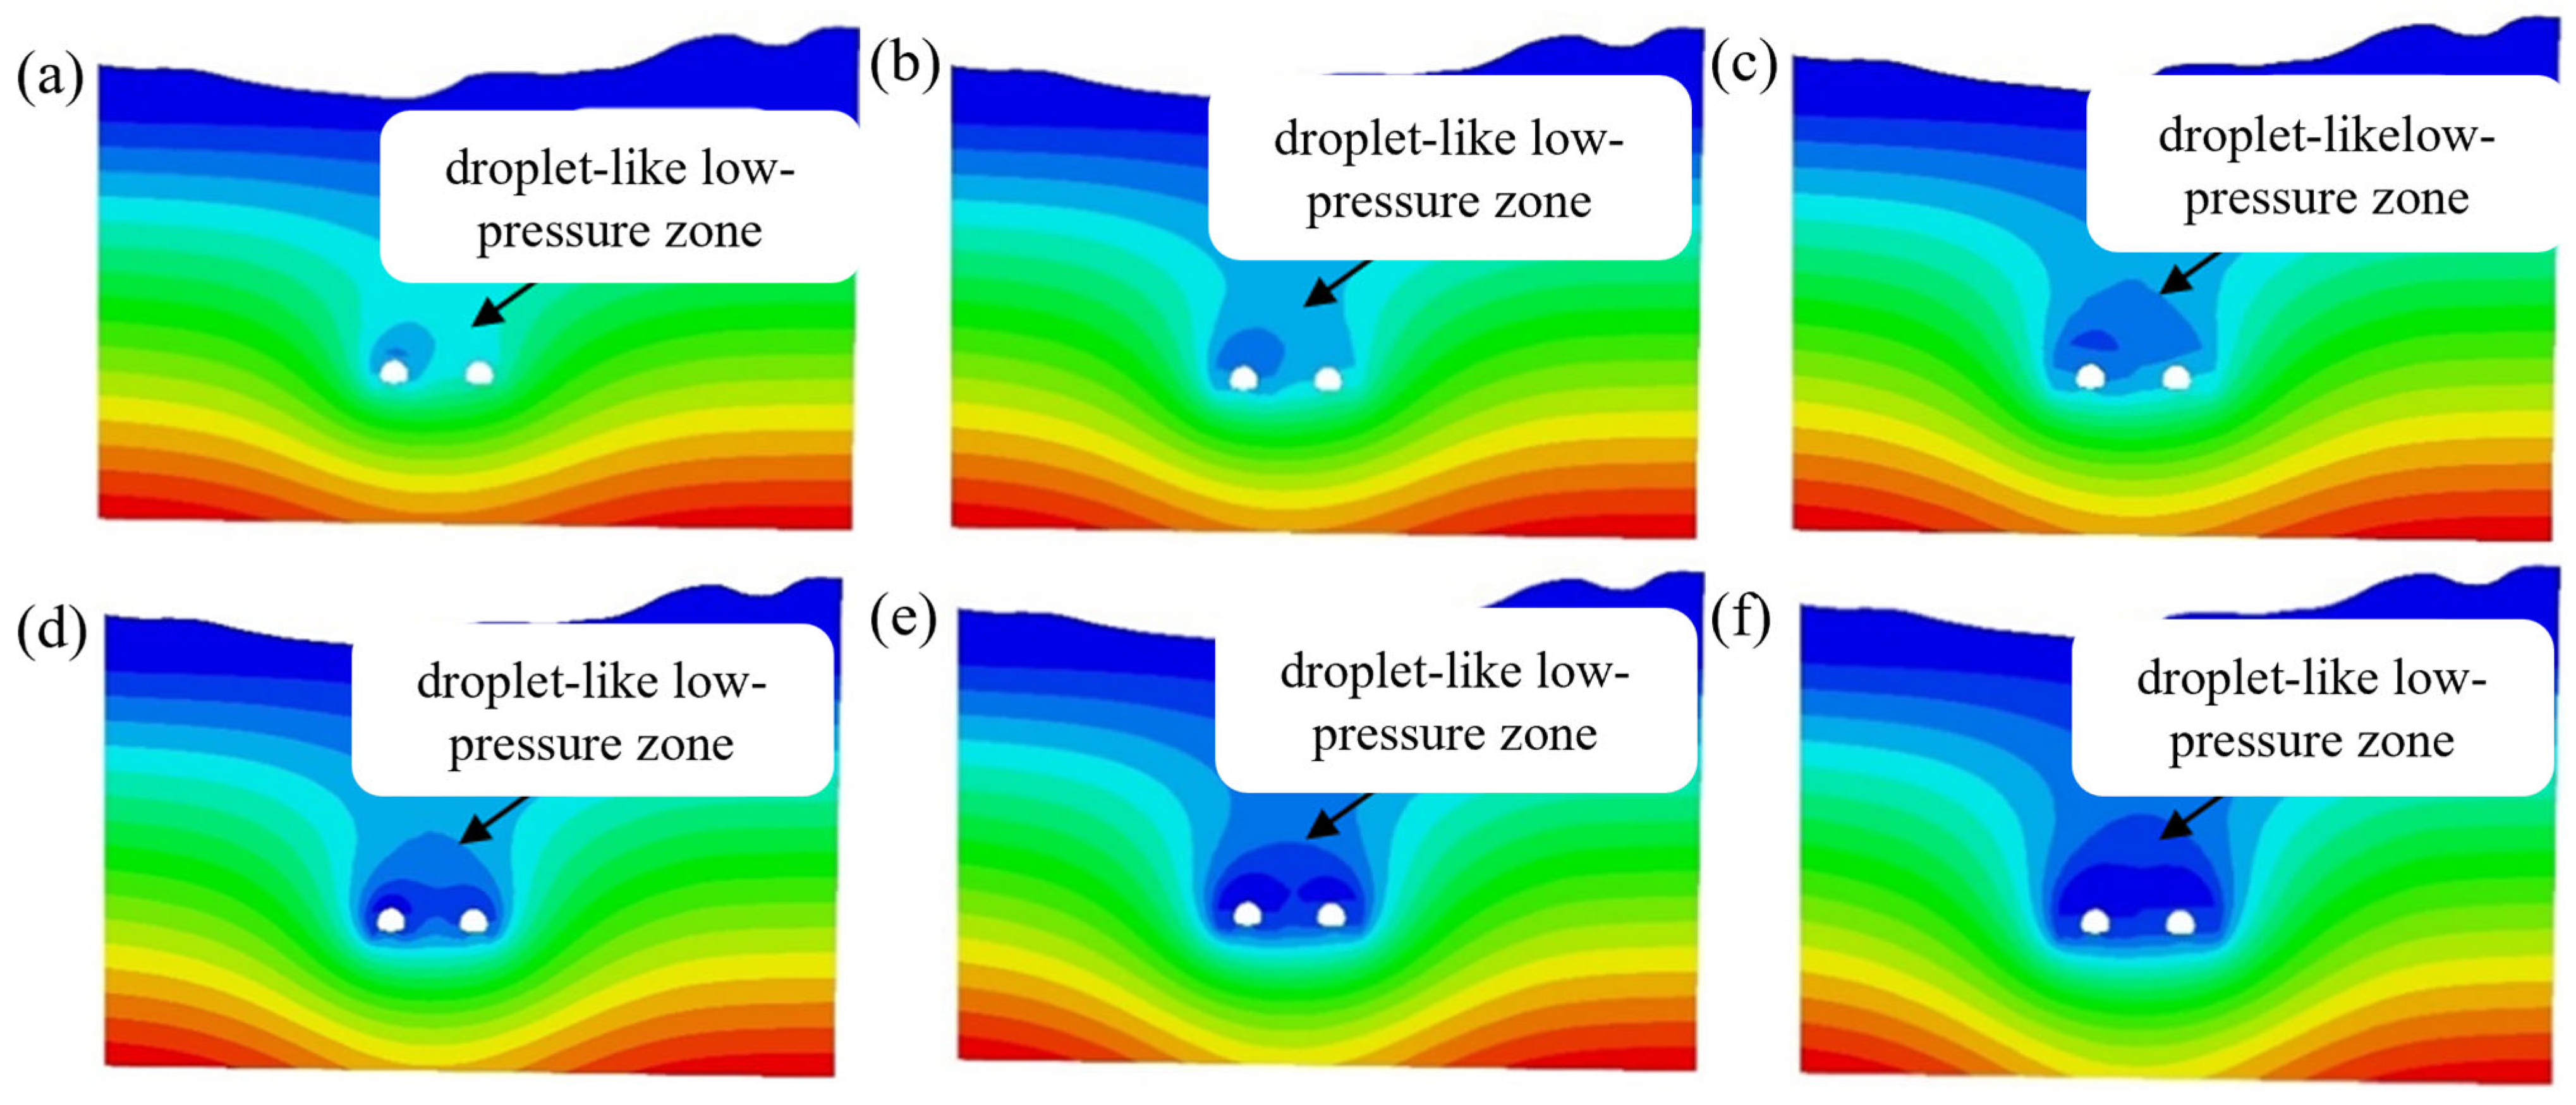
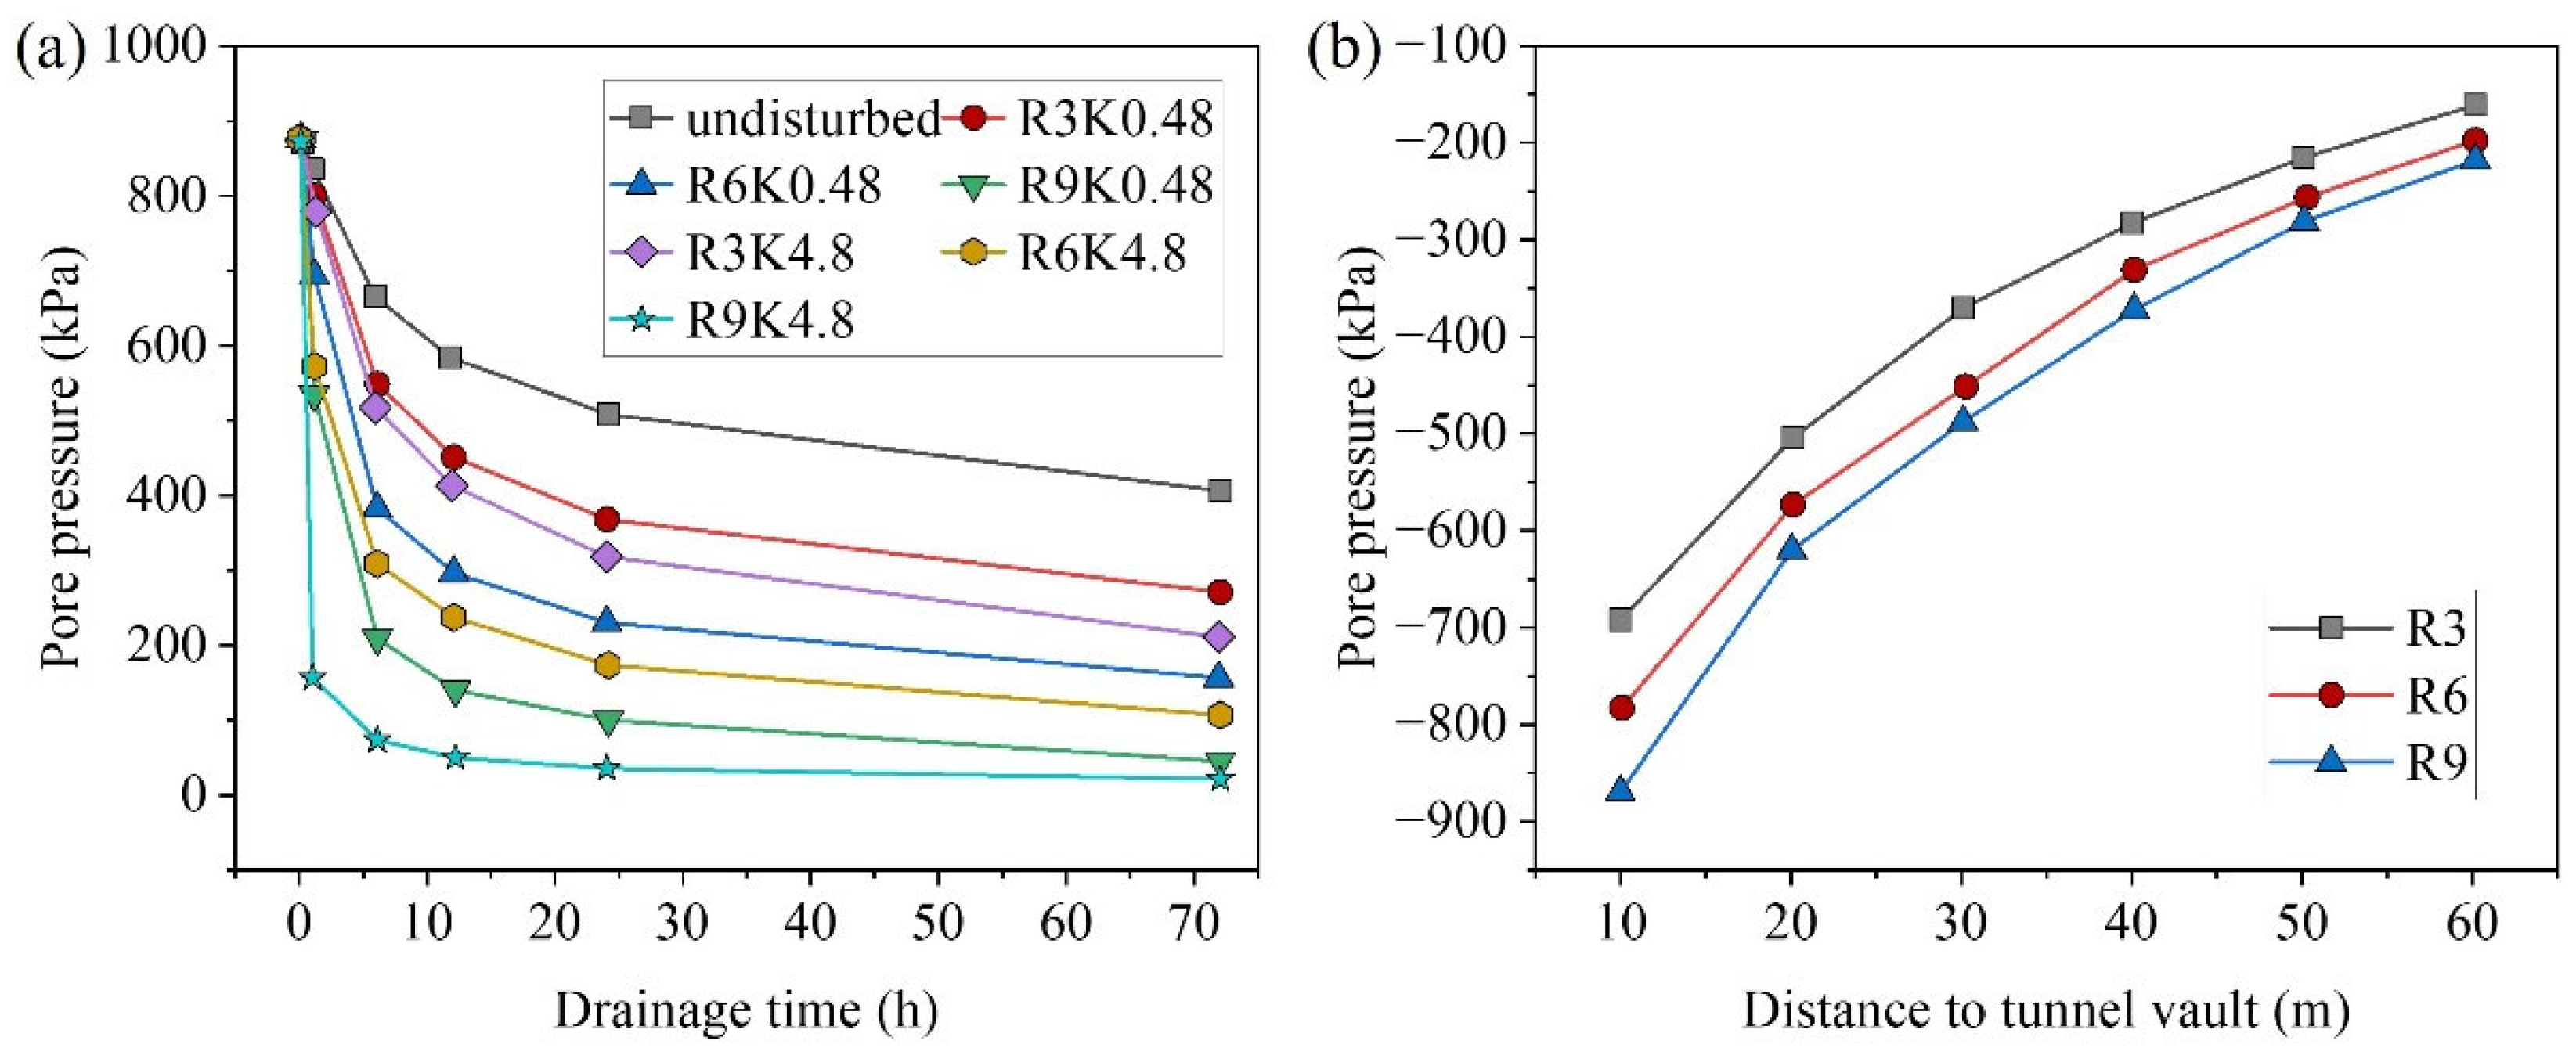
3.3. Pore Pressure Analysis Considering Excavation Disturbance

When blasting excavation is carried out, the microcracks or pore structure within the rock mass is altered. The rock mass experiences damage, which affects the lining deformation and the filtration field around the tunnel. Therefore, based on the study of the coupled problem of filtration (unsteady) with the displacement field of the soil or rock medium, the effect of excavation rock disturbance is considered and different disturbance ranges are set. The net width of the tunnel is 10.25 m, the net height is 8.7 m, and the radius is 5.55 m. The disturbed range is set to be 3 m, 6 m, and 9 m, and the permeability coefficient of the surrounding rock is set to be 0.48 and 4.8, respectively, for different analyses, and the specific working conditions are shown in Table 7.
Figure 18 shows the cloud diagram of pore pressure distribution under different fault permeability coefficients for 7 days of drainage. It can be seen that under the three working conditions of R3K4.8, R6K4.8 and R9K4.8, an obvious low-pressure zone appeared on the upper side of the vaults of the twin tunnels, and the pore pressures of the surrounding rock at the central axis of the two tunnels and about 10 m above the vaults decreased significantly. Under the three working conditions of R3K0.48, R6K0.48, and R9K0.48, as the permeability coefficient of the surrounding rock decreases, the influence range of the pore pressure is much smaller and the construction process is relatively safe.
The pore pressure at 10 m above the vault is shown in Figure 19a. The pore pressure decreases gradually with increasing drainage duration; in the initial stage of drainage, the pore pressure decreases faster, and then the pore pressure gradually stabilizes in the region. In the first hour of drainage, the pore pressure in R9K4.8 decreased the fastest, with a decrease of 719.39 kPa in 1 h. In addition, the pore pressure in R9K0.48 decreased the fastest in the first 6 h of drainage, with a decrease of 111 kPa/h, and then gradually slowed down until it stabilized. The larger the disturbance range, the more obvious the reduction of pore pressure in the surrounding rock 10 m above the tunnel vault. When the permeability coefficient of the surrounding rock is enlarged to 10 times and 100 times the original value, the pore pressure there is reduced to 5% and 2.6% of the original value, respectively, after draining for 3 d. Therefore, in the actual tunnel excavation process, more attention should be paid to the impact of tunnel excavation-induced disturbance on the permeability of the surrounding rock, and if necessary, grouting should be performed in good time to reduce the permeability coefficient of the surrounding rock.
The effect of the range of disturbance on the range of pore pressure change is shown in Figure 19b. The pore pressure decreases with increasing distance between the measurement point and the tunnel vault. For the same depth plane, the pore pressure difference values are almost the same for the 3 m disturbance range as for the 6 m disturbance range. Similarly, the pore pressure difference between the 6 m disturbance range and the 9 m disturbance range is almost the same. It can be seen that the range of loosening disturbance generated by tunnel blasting excavation is related to the degree of reduction of the surrounding rock pore pressure.

4. Conclusions

Based on actual terrain and geomorphology, engineering geological conditions, and the dimensions and positions of the tunnel, faults, and reservoir, this study develops a three-dimensional numerical model accurately reflecting the geological environment. Considering groundwater influences, a fluid–solid coupled analysis was performed to evaluate deformation, stress distributions, and pore pressure variations within the surrounding rock during tunnel excavation. The following key findings were obtained:
(1)
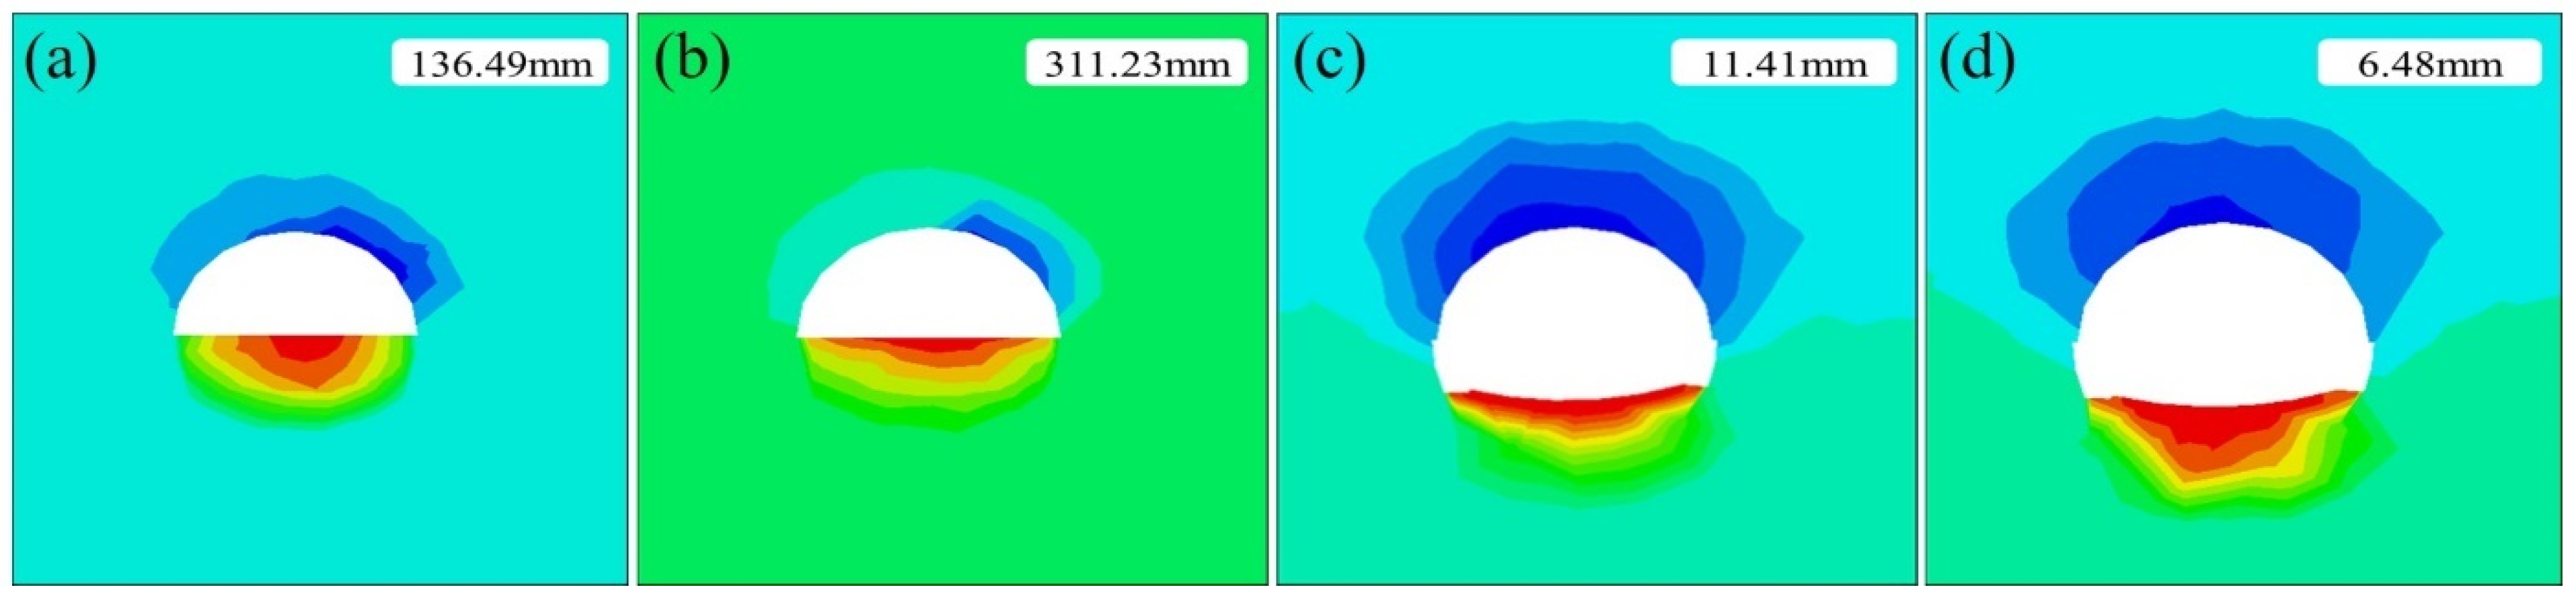
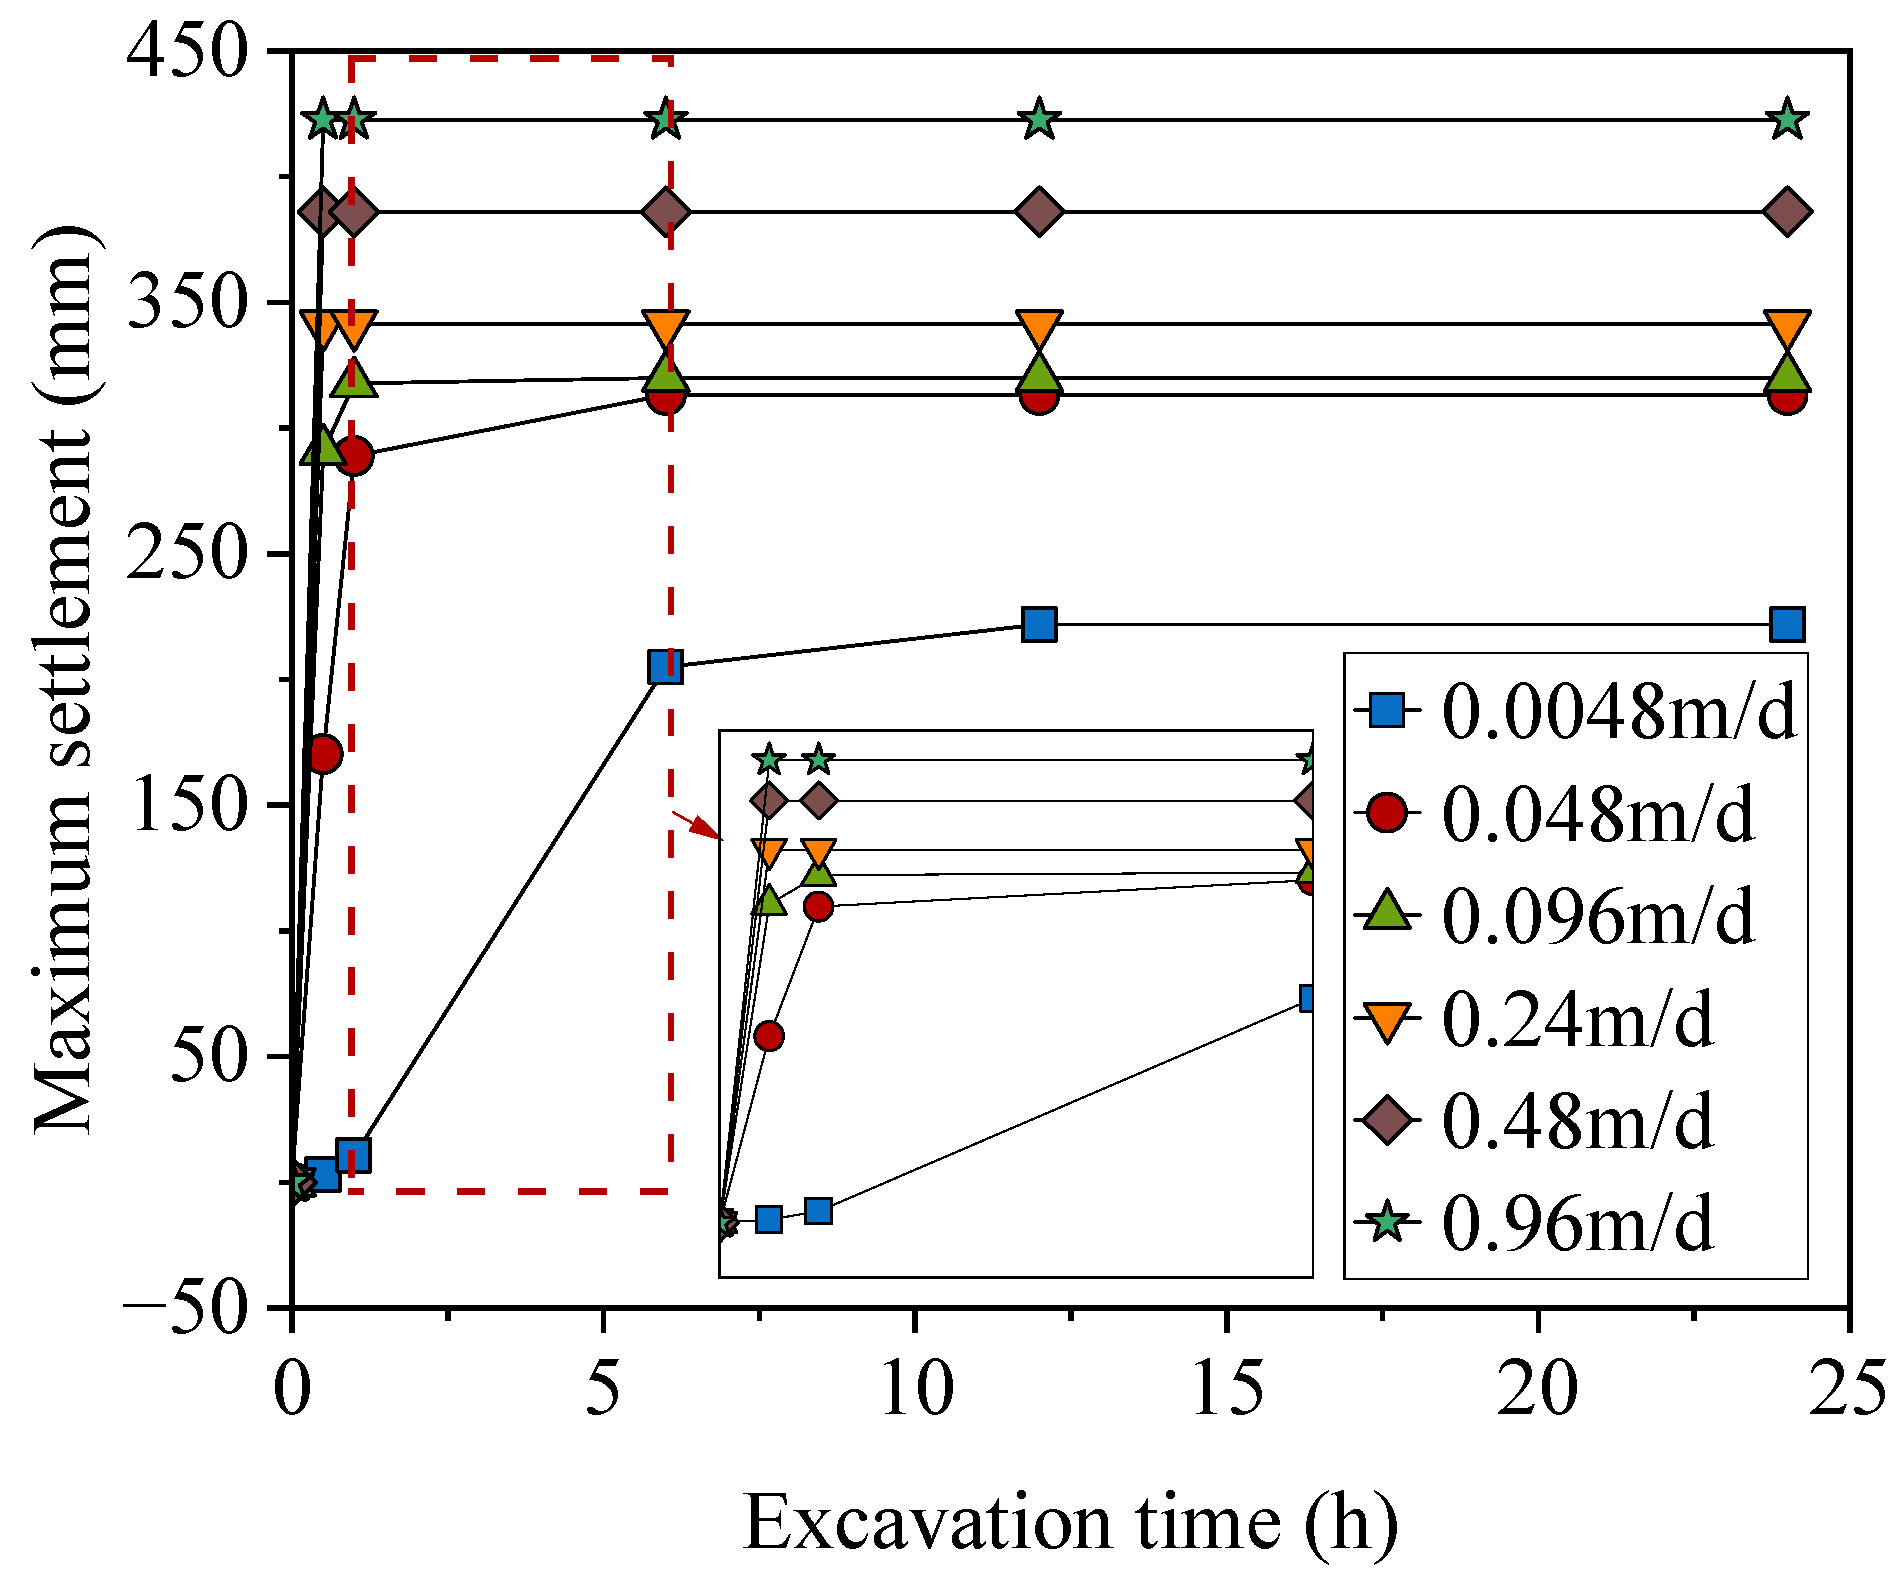
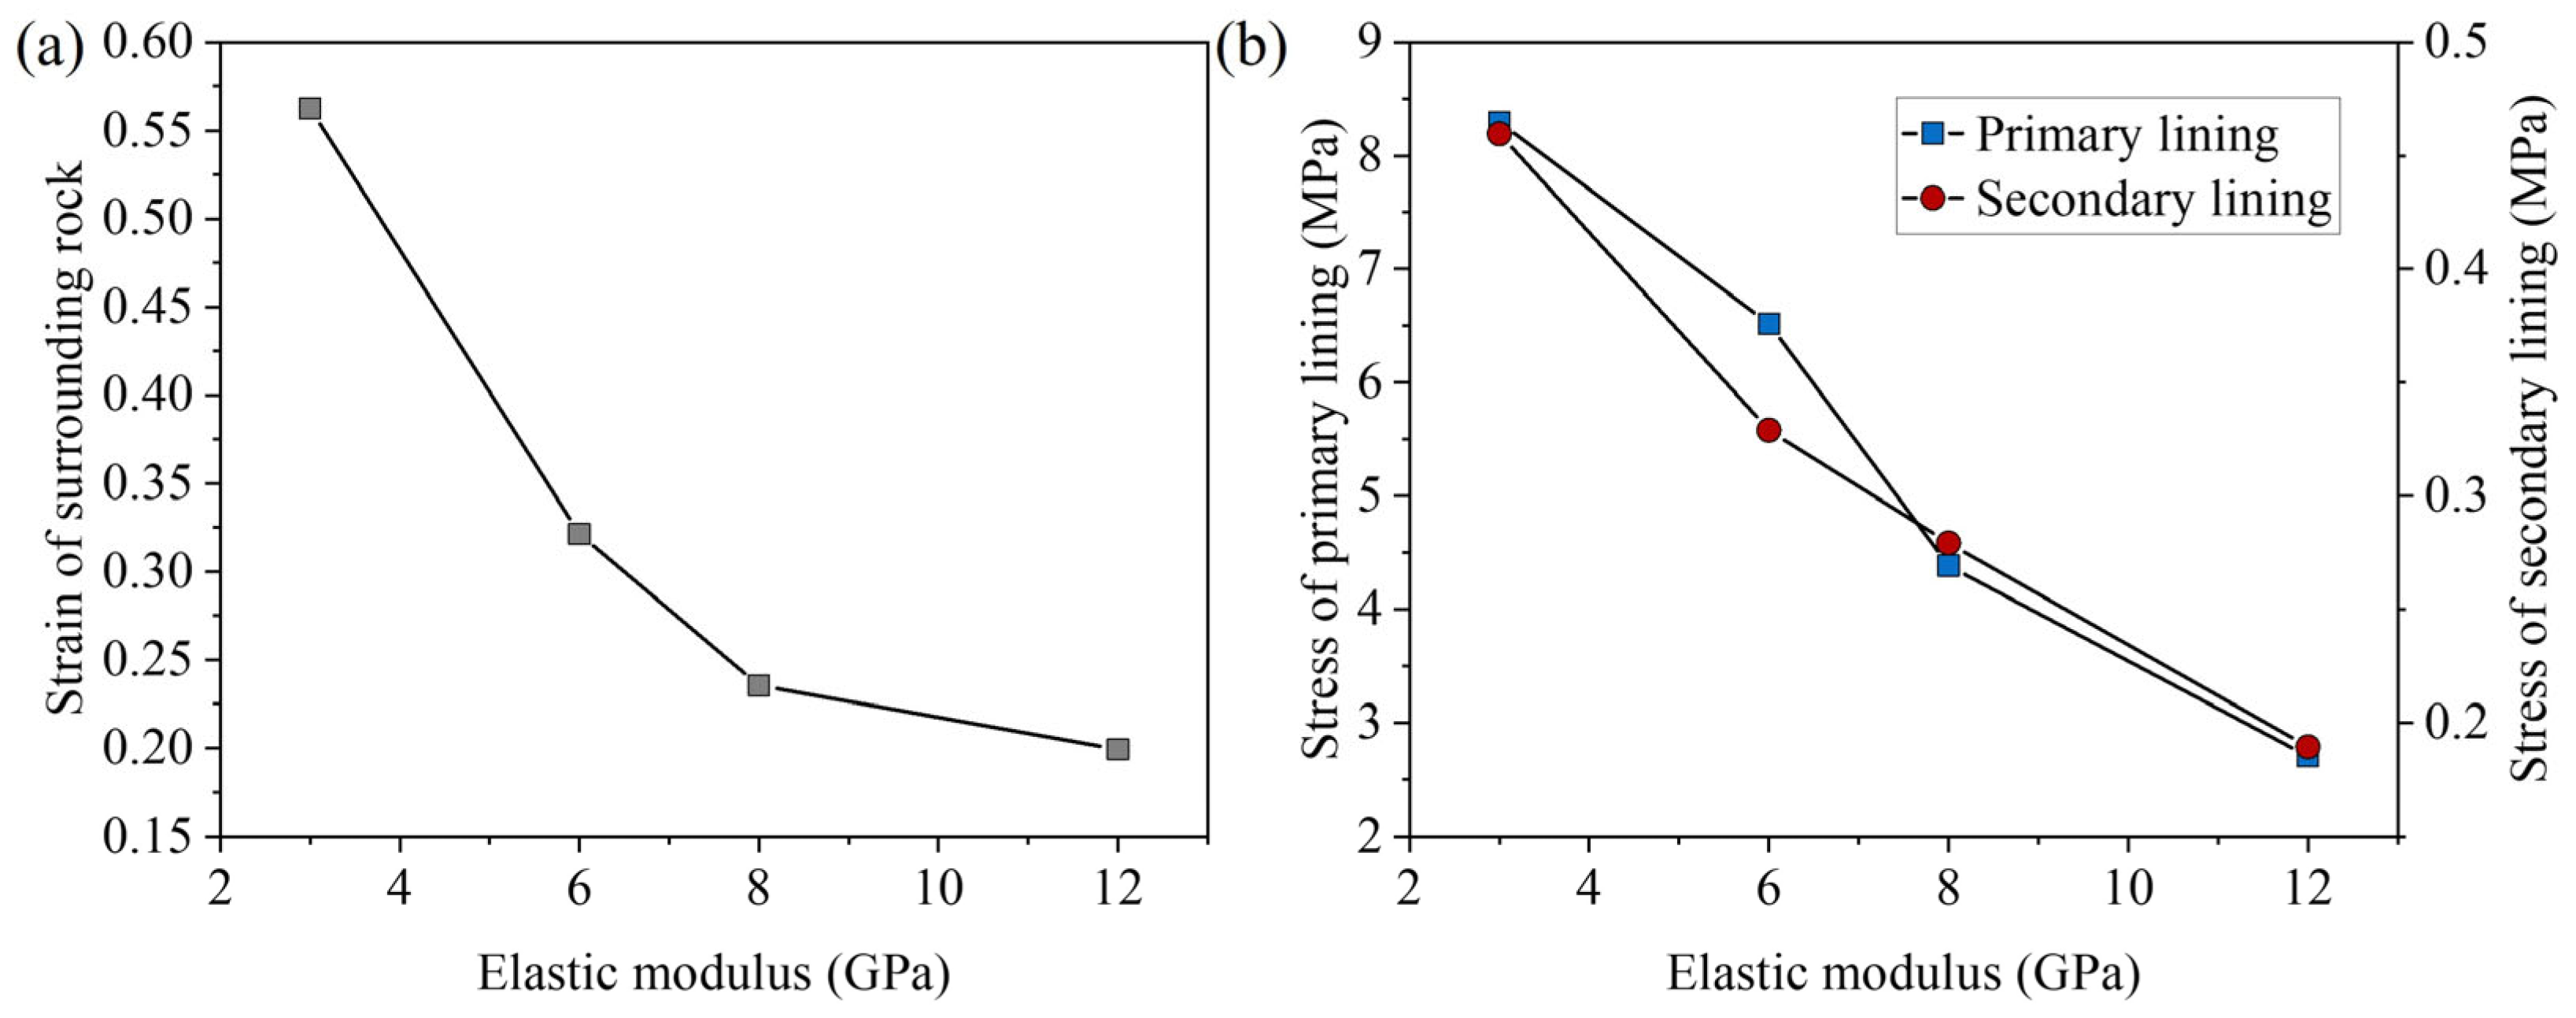
Excavating tunnels in geological conditions with abundant groundwater increases the likelihood of accidents. A decrease in the elastic modulus of the surrounding rock and an increase in the permeability coefficient will raise the pressure on the tunnel lining and heighten the risk of sudden, severe deformation of the surrounding rock, thereby increasing the likelihood of collapse.
(2)
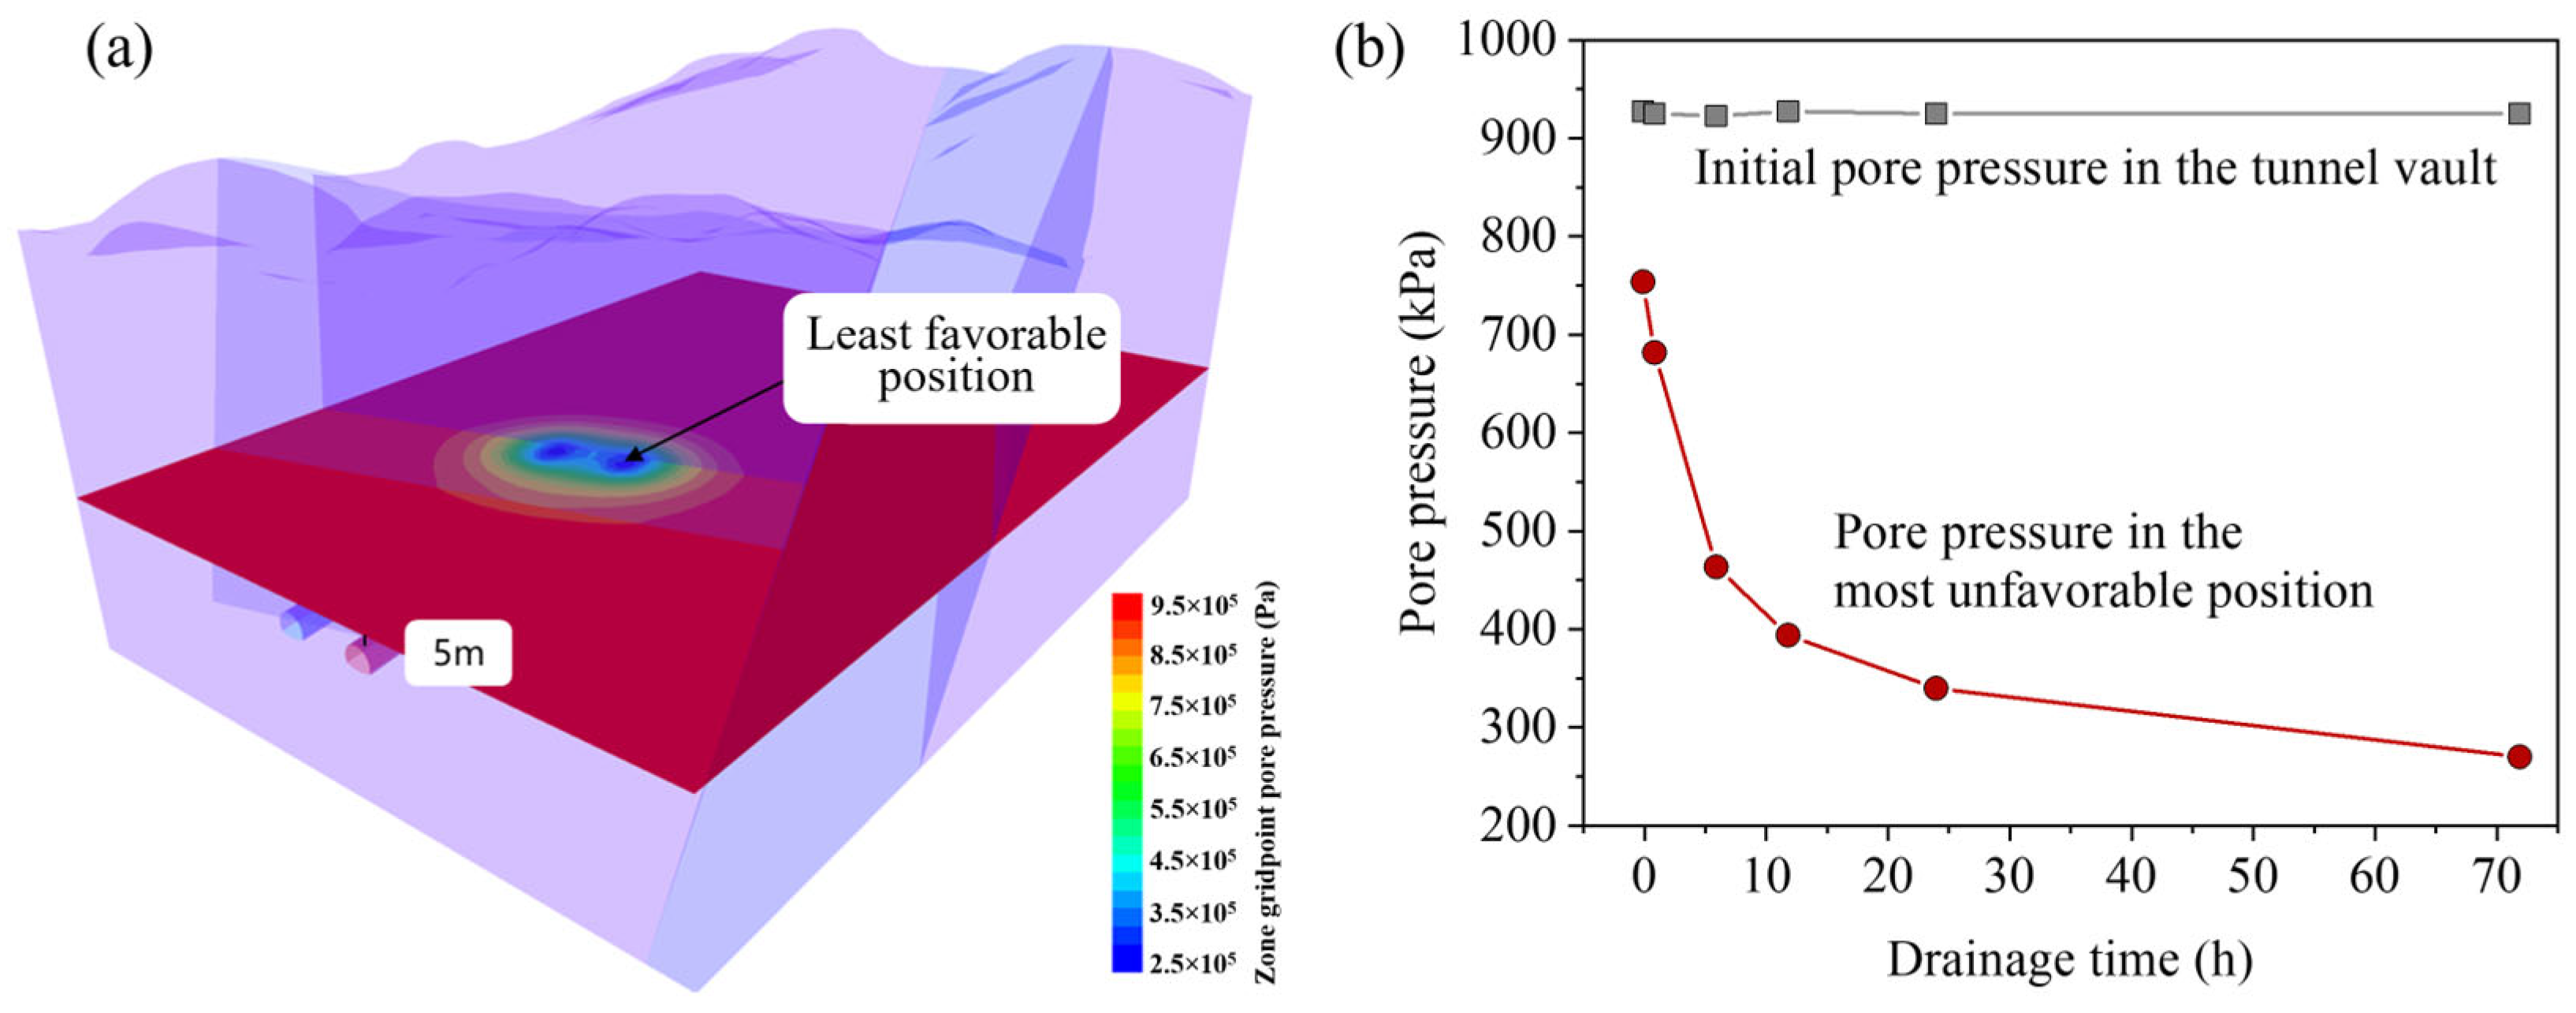
The influence of pore pressure increases with longer drainage durations. As tunnel excavation progresses, the pore pressure at the bottom of the Tianzhuhu reservoir gradually decreases. Continuous monitoring of the water level and bottom pore pressure in the Tianzhuhu reservoir is recommended during excavation to prevent fracture penetration caused by blasting and excavation, thereby ensuring the safe operation of the reservoir and construction safety.
(3)
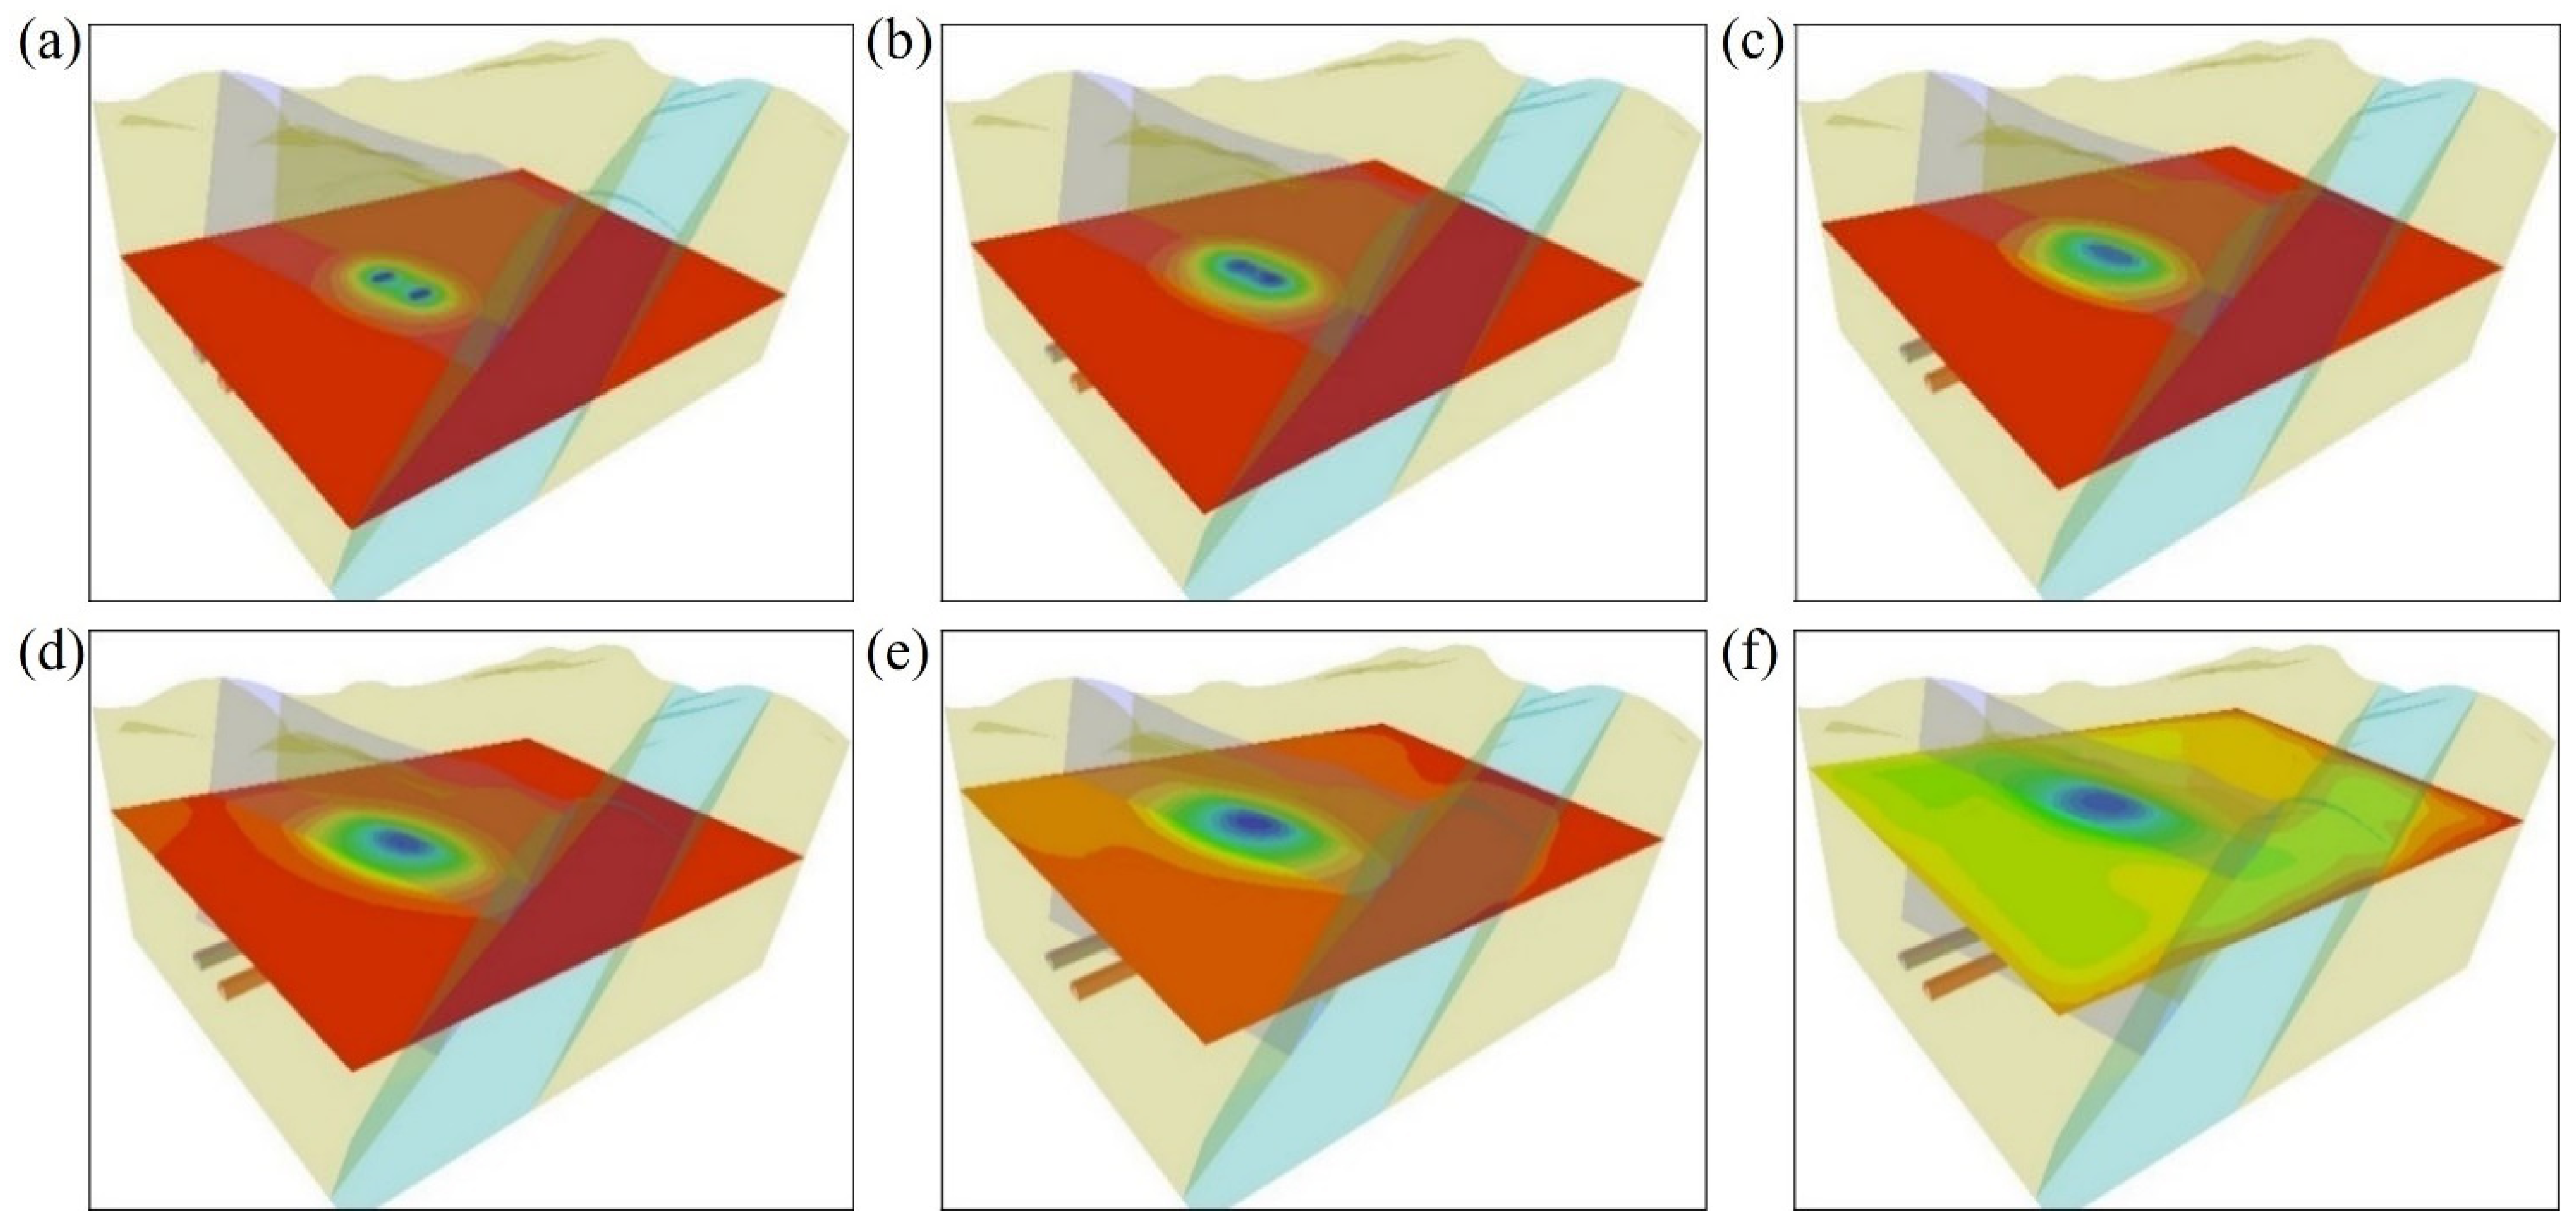
Excavation-induced disturbances significantly affect the permeability of the surrounding rock, notably altering the distribution of pore pressure. During excavation, it is crucial to closely monitor the impact of these disturbances on rock permeability and, if necessary, promptly implement grouting measures to reduce permeability and enhance stability.
This study provides a predictive model and method to prevent construction accidents during tunnel excavation. The study results are beneficial for preventing potential safety accidents during tunnel excavation and guide safe construction.

Author Contributions

Conceptualization, G.Z.; Methodology, Z.Y. (Zihao Yu) and Z.Y. (Zhou Ya); Software, S.W. and Z.Y. (Zhou Ya); Validation, G.Z. and Z.Y. (Zhou Ya); Formal analysis, Z.Y. (Zihao Yu); Investigation, S.W. and Z.Y. (Zihao Yu); Resources, G.Z.; Writing—original draft, S.W. and Z.Y. (Zhou Ya); Writing—review & editing, S.W. and G.Z.; Visualization, Z.Y. (Zihao Yu) and Z.Y. (Zhou Ya); Supervision, G.Z.; Funding acquisition, S.W. All authors have read and agreed to the published version of the manuscript.

Funding

This research received no external funding.

Data Availability Statement

The original contributions presented in this study are included in the article. Further inquiries can be directed to the corresponding author.

Conflicts of Interest

Author Shaodan Wang was employed by the company Xiamen Road and Bridge Baicheng Construction Investment Co., Ltd. Author Zhou Ya was employed by the company China State Construction Engineering Corporation Ltd. The remaining authors declare that the research was conducted in the absence of any commercial or financial relationships that could be construed as a potential conflict of interest.

References

  1. Wang, X.; Zhao, Y. Comment on construction of railway tunnels in China by statistical data. Mod. Tunn. Technol. 2006, 43, 7–17, 22. [Google Scholar]
  2. Zhao, Y.; Li, P. A Statistical analysis of China’s traffic tunnel development data. Engineering 2018, 4, 3–5. [Google Scholar] [CrossRef]
  3. Jiang, S. Quality and technical countermeasures in highway tunnel engineering. Mod. Tunn. Technol. 2017, 54, 1–12. [Google Scholar]
  4. Yu, T.; Ying, K.; Wang, J.; Yao, Z.; Fang, Y. Stability evaluation of the sequential excavation method of large-section double-arch tunnel in fly ash accumulation stratum through physical model. Tunn. Undergr. Space Technol. 2025, 158, 106391. [Google Scholar] [CrossRef]
  5. Yang, W.; Boldini, D.; Zhang, D. Practical implementation of Bi-Elliptical displacement-controlled method in analysing shallow and large tunnel excavation impact. Tunn. Undergr. Space Technol. 2025, 158, 106266. [Google Scholar] [CrossRef]
  6. Meng, F.; Qiao, S. Study on the deformation of existing tunnel under the combined effect of pit excavation and dewatering based on the Kerr foundation model. Tunn. Undergr. Space Technol. 2025, 158, 106382. [Google Scholar] [CrossRef]
  7. Zhao, Y.; Feng, S.; Zhang, X.; Zheng, Q.; Cao, B. Fully coupled hydromechanical study of tunnel excavation considering leachate leakage from a high water-level landfill. Comput. Geotech. 2024, 175, 106696. [Google Scholar] [CrossRef]
  8. Guo, S. Numerical Simulation and Analysis of Excavation Disturbance for a Super-Large Diameter Shield Tunnel Crossing Yangtze River in Wuhu; Hefei University of Technology: Hefei, China, 2022. [Google Scholar]
  9. Geng, Y. Study on Mechanism of Hydraulic Coupling Failure and Water Inrush Disaster Under TBM Excavation Disturbance; Shandong University: Jinan, China, 2021. [Google Scholar]
  10. Li, L. Study on Construction Technology of Duanjiawu Tunnel Passing Through Xinyantang Reservoir; Chongqing Jiaotong University: Chongqing, China, 2020. [Google Scholar]
  11. Terzaghi, K. Theoretical Soil Mechanics (Translated by Xu Zhiying); Geological Publishing House: Beijing, China, 1996. [Google Scholar]
  12. Biot, M. The general three-dimensional consolidation theory. J. Appl. Phys. 1941, 12, 155–164. [Google Scholar] [CrossRef]
  13. Witherspoon, P.A.; Tsang, Y.W.; Long, J.C.; Noorishad, J. New approaches to problems of fluid flow in fractured-rock masses. In Proceedings of the ARMA US Rock Mechanics/Geomechanics Symposium, Cambridge, MA, USA, 29 June–2 July 1981. [Google Scholar]
  14. Zhuo, J.; Zhang, Q. Interface Element Method for Mechanics Problems of Discontinuous Media; Science Press: Beijing, China, 2000. [Google Scholar]
  15. Huyakorn, P.; Lester, B.; Faust, C. Finite element techniques for modeling groundwater flow in fractured aquifers. Water Resour. Res. 1983, 19, 1019–1035. [Google Scholar] [CrossRef]
  16. Yang, T. Study on Infiltrate Character and Coupling Analysis of Seepage and Stress in Rock Failure Process; Northeastern University: Shengyang, China, 2001. [Google Scholar]
  17. Li, S.; Wu, D. Effect of confining pressure, pore pressure and specimen dimension on permeability of Yinzhuang sandstone. Int. J. Rock Mech. Min. Sci. 1997, 34, 435–441. [Google Scholar] [CrossRef]
  18. Tang, C.A.; Yang, W.T.; Fu, Y.F.; Xu, X.H. A new approach to numerical method of modelling geological processes and rock engineering problems—Continuum to discontinuum and linearity to nonlinearity. Eng. Geol. 1998, 49, 207–214. [Google Scholar] [CrossRef]
  19. Yang, T.; Tham, L.; Tang, C. Influence of heterogeneity of mechanical properties on hydraulic fracturing in permeable rocks. Rock Mech. Rock Eng. 2004, 37, 251–275. [Google Scholar] [CrossRef]
  20. Yang, T.; Liu, J.; Tang, C. A coupled flow-stress-damage model for groundwater outbursts from an underlying aquifer into mining excavations. Int. J. Rock Mech. Min. Sci. 2007, 44, 87–97. [Google Scholar] [CrossRef]
  21. Yang, T.; Zhu, W.; Yu, Q.; Liu, H. The role of pore pressure during hydraulic fracturing and implications for groundwater outbursts in mining and tunneling. Hydrogeol. J. 2011, 19, 995–1008. [Google Scholar] [CrossRef]
  22. Kong, F. Research on reinforcing technology for surrounding rock undercrossing the reservoir of Xiuning tunnel along the Guangdong-Kunming railway. Urban Geol. 2017, 12, 35–39. [Google Scholar]
  23. Peng, W.; Su, M.; Gao, K. Design and research on lining structure of Dayao Mountains No.1 Tunnel undercrossing reservoir. Highway 2017, 62, 243–247. [Google Scholar]
  24. Hou, W.; Wu, Y.; He, L. The analysis of effects of reservoir under the high water head upon tunnel seepage flow based on GEO-SLOPE. J. Xi’an Univ. Technol. 2006, 02, 171–174. [Google Scholar]
  25. Yang, F.-R.; Lee, C.-H.; Kung, W.-J.; Yeh, H.-F. The impact of tunneling construction on the hydrogeological environment of “Tseng-Wen Reservoir Transbasin Diversion Project” in Taiwan. Eng. Geol. 2009, 103, 39–58. [Google Scholar] [CrossRef]
  26. Mao, R.; Liu, S.; Ma, F.; Li, Z.; Zhang, X. The numerical simulation analysis of ground settlement of around tunnel under ground-water seepage. In Proceedings of the Conference on Environmental Science and Information Application Technology, Wuhan, China, 17–18 July 2010. [Google Scholar]
  27. Zhang, C.; Shang, Y.; Li, W. Limit analysis of face stability of special-shaped shield tunnels considering solid-fluid coupling effect. China J. Highw. Transp. 2023, 36, 345–357. [Google Scholar]
  28. Jin, X.; Li, X.; Zhang, Y. Seepage stress coupling analysis of river crossing tunnel excavating. Hydrogeol. Eng. Geol. 2010, 37, 62–67. [Google Scholar]
  29. Yu, Z.; Zhang, G.; Cui, H.; Wang, Z.; Cao, Z. A cross season antifreeze system utilizing tunnel lining GHEs and solar energy: Performance and effect mechanism at various environment parameters. Renew. Energy 2025, 242, 122428. [Google Scholar] [CrossRef]
  30. Yu, Z.; Zhang, G.; Li, C.; Cao, Z. Numerical investigation on work performance of the anti-freezing drainage system of tunnel utilizing TPCT. Appl. Therm. Eng. 2024, 253, 123849. [Google Scholar] [CrossRef]
  31. Wei, T.; Wang, C.; Zhao, Y.; Bi, J.; Zhang, Y. A new semi–Analytical method for elastic–strain softening circular tunnel with hydraulic–mechanical coupling. Eng. Geol. 2025, 344, 107826. [Google Scholar] [CrossRef]
  32. Xiao, F.; Chen, X.; Zhu, Y.; Xie, P.; Salimzadeh, S.; Zhang, Q.-B. Multi-LoD BIM integrated design framework for pressurised tunnel: Hydro-mechanical coupling simulation and sustainability assessment. Tunn. Undergr. Space Technol. 2025, 158, 106404. [Google Scholar] [CrossRef]
  33. Zaheri, M.; Ranjbarnia, M. An analytical–numerical method for the hydraulic–mechanical coupling analysis of time-dependent behavior of pressurized tunnels: Impact of an excavation damaged zone. Comput. Geotech. 2024, 170, 106299. [Google Scholar] [CrossRef]
  34. Yang, M.; Zhao, X. Single pile analysis method in layered soil. J. Tongji Univ. (Nat. Sci.) 1992, 04, 421–428. [Google Scholar]
  35. GB 50911; Code for Monitoring Measurement of Urban Rail Transit Engineering. China Architecture and Building Press: Beijing, China, 2013. (In Chinese)
Figure 1. Contour map around the tunnel.
Buildings 15 01693 g001
Figure 2. Schematic diagram of SURFER modelling: (a) gridded topographic surface map; (b) topographic surface map; (c) 3D numerical modelling surface module; (d) 3D numerical modelling body module.
Buildings 15 01693 g002
Figure 3. The process of numerical modelling: (a) fault location; (b) Tianzhuhu Reservoir location; (c) 3D dimensions of the calculated model; (d) mesh of the model.
Buildings 15 01693 g003
Figure 4. Grid validation results: (a) initial ground stress distribution of the model; (b) initial pore pressure distribution of the model.
Buildings 15 01693 g004
Figure 5. Deformation of the surrounding rock and distribution of plastic zones caused by tunnel excavation.
Buildings 15 01693 g005
Figure 6. Settlement of surrounding rock at different sections behind the tunnel face in Working condition 3: (a) 0 m; (b) 2 m; (c) 4 m; (d) 6 m.
Buildings 15 01693 g006
Figure 7. Variation of maximum settlement of tunnel displacement at 2 m from the tunnel face.
Buildings 15 01693 g007
Figure 8. Variation of (a) maximum strain of the surrounding rock and (b) maximum stress of the tunnel lining with the elasticity modulus of the surrounding rock.
Buildings 15 01693 g008
Figure 9. Variation of (a) maximum strain of the surrounding rock and (b) maximum stress of the tunnel lining with the permeability coefficient of the surrounding rock.
Buildings 15 01693 g009
Figure 10. Pore pressure and its distribution at the tunnel vault: (a) distribution of pore pressure at the tunnel arch crown after 3 days of drainage; (b) pore pressure variation at the tunnel arch crown with drainage time.
Buildings 15 01693 g010
Figure 11. Pore pressure and its distribution at the tunnel vault: (a) distribution of pore pressure in the area 5m above the tunnel arch crown after 3 days of drainage; (b) pore pressure variation in the area 5m above the tunnel arch crown with drainage time.
Buildings 15 01693 g011
Figure 12. Minimum pore pressure distribution at different depths after 3 days of drainage: (a) 0 m; (b) 10 m; (c) 25 m; (d) 40 m; (e) 55 m (f) 70 m.
Buildings 15 01693 g012
Figure 13. Minimum pore pressure and change in pore pressure at different depths in the tunnel vault after 3 days of drainage.
Buildings 15 01693 g013
Figure 14. Pore pressures in the plane at different depths from the vault for different drainage durations.
Buildings 15 01693 g014
Figure 15. Pore pressure monitoring in reservoir areas: (a) arrangement of water pressure monitoring points; (b) variation of lake bottom pore pressure with tunnel drainage time.
Buildings 15 01693 g015
Figure 16. Variation of pore pressure with tunnel drainage time: (a) at the vault within the fault; (b) at different depths within the fault.
Buildings 15 01693 g016
Figure 17. Pore pressure variations within faults at different depths.
Buildings 15 01693 g017
Figure 18. Cloud map of droplet-like low-pressure zones in fault pore pressure at 7 days of drainage: (a) R3K0.48; (b) R6K0.48; (c) R9K0.48; (d) R3K4.8; (e) R6K4.8; (f) R9K4.8.
Buildings 15 01693 g018
Figure 19. (a) Pore pressure at 10 m above the vault; (b) effect of the range of disturbance on the range of pore pressure change.
Buildings 15 01693 g019
Table 1. Comparison of simulated and tested values.
ParameterUnitValue
Theoretical valuem3/d0.72
Test value (not considering silt)m3/d0.88
Test value (considering silt)m3/d0.69
Table 2. Physical and mechanical parameters of the formation.
TypeElastic Modulus
(MPa)
Poisson’s Ratio Volumetric Weight (kN/m3)Internal Friction Angle
(°)
Cohesion
(kPa)
Slope residual deposits of silty clay, gravels120.33182020
6-1 Fully weathered granite240.32191130
6-2 Strongly weathered granite1200.3119.51218
6-3 Clastic and strongly weathered granite1800.3020.52670
Fault zone80000.262233380
6-4 Medium weathered granite12,0000.222437450
Table 3. Calculation parameters for seepage in geological formations.
TypePermeability Coefficient
(m/d)
Porosity
(%)
Saturation
(%)
Slope residual deposits of silty clay, gravels0.0025550
6-1 Fully weathered granite0.0655560
6-2 Strongly weathered granite0.0650100
6-3 Clastic and strongly weathered granite0.05550100
Fault zone0.04840100
6-4 Medium weathered granite0.01325100
Table 4. Mechanical parameter table for tunnel lining.
TypeElastic Modulus
(MPa)
Poisson’s Ratio Heaviness
(kN/m3)
Primary lining200.224
Secondary lining300.225
Grouting area150.2524
Table 5. Design of working conditions under different surrounding rock conditions.
Working ConditionFractured Surrounding RockNon-Fractured Surrounding Rock
Group 1Elastic modulus (MPa)34
Poisson’s ratio 0.300.26
Group 2Elastic modulus (MPa)68
Poisson’s ratio 0.280.24
Group 3Elastic modulus (MPa)812
Poisson’s ratio 0.260.22
Group 4Elastic modulus (MPa)1216
Poisson’s ratio 0.240.20
Table 6. Settlement of surrounding rock at the tunnel vault under different modulus of elasticity of surrounding rock (mm).
Excavation Time3 GPa
(Working Condition 1)
6 GPa
(Working Condition 2)
9 GPa
(Working Condition 3)
12 GPa
(Working Condition 4)
0.5 h646415170.62.5
1 h78546829010.8
6 h816470314.825
12 h816470314.826
24 h816470314.826
Table 7. Calculation conditions considering excavation disturbance.
Working Condition IDDisturbance Range (m)Surrounding Rock Permeability Coefficient (m/d)
Fault LocationNon-Fault Location
R3K0.4830.480.13
R6K0.4860.480.13
R9K0.4890.480.13
R3K4.834.81.3
R6K4.864.81.3
R9K4.894.81.3
Disclaimer/Publisher’s Note: The statements, opinions and data contained in all publications are solely those of the individual author(s) and contributor(s) and not of MDPI and/or the editor(s). MDPI and/or the editor(s) disclaim responsibility for any injury to people or property resulting from any ideas, methods, instructions or products referred to in the content.

