Article

Experimental and Numerical Study on Reinforced Concrete Columns Strengthened with Lightweight Alkali-Activated Slag Concrete and X-Type Encased Steel

1
College of Civil Engineering and Architecture, Harbin University of Science and Technology, Harbin 150080, China
2
Lab of the Smart Prevention and Mitigation of Civil Engineering Disasters of the Ministry of Industry and Information Technology, Harbin Institute of Technology, Harbin 150090, China
*
Author to whom correspondence should be addressed.
Buildings 2025, 15(10), 1692; https://doi.org/10.3390/buildings15101692
Submission received: 12 April 2025 / Revised: 11 May 2025 / Accepted: 15 May 2025 / Published: 16 May 2025
(This article belongs to the Section Building Structures)

Abstract

As a key load-bearing component in building structures, the effective strengthening of reinforced concrete (RC) columns is critical to enhancing their structural reliability and service life. To tackle the issue of excessive self-weight from the increasing section strengthening method and further optimize the seismic performance of encased steel strengthening, this paper presents a novel composite strengthening method for RC columns, which is characterized by using Lightweight Alkali-Activated Slag Concrete (LAASC) as the strengthening layer and an X-type encased steel structure. By conducting axial compression tests on six columns and utilizing in-depth research on small eccentric compression and hysteresis performance through numerical simulation, the specific effects of different strengthening materials and encased steel forms on the mechanical properties of the columns are systematically explored. Experimental results indicate that compared to ordinary concrete strengthening layers, LAASC can reduce the self-weight of the strengthening layer by 25%, boost the bearing capacity of the strengthened components by 37%, and enhance the vertical deformation capacity by 100%. Numerical simulation also confirms that X-type encased steel composite strengthening can effectively control bending deformation under small eccentric compression, reducing lateral deflection by 30–35% compared to un-strengthened columns. Under horizontal reciprocating loading, the cumulative energy dissipation of X-type encased steel composite-strengthened columns is 15–30% higher than that of traditional steel encased composite-strengthened columns, reflecting the diagonal bracing effect of the X-type batten plates.

1. Introduction

In the context of accelerated urbanization and growing demands for living environments, the retrofitting and renovation of old buildings has become crucial for urban renewal and architectural sustainability. China has a huge stock of existing buildings, and over time, materials gradually age and the structural bearing capacity gradually decreases. Therefore, it is necessary to restore and improve the safety of buildings and extend their service life by repairing structural damage, enhancing the load-bearing capacity and stability of the main load-bearing components, and thereby restoring and improving building safety.
As key structural components, RC columns need effective reinforcement to enhance building safety. Current RC column strengthening methods include the increased cross-section method, the encased steel method, the paste carbon fiber method, and the composite strengthening method [1]. The increased cross-section method, though widely used, has a long construction time and greatly increases component self-weight, potentially causing foundation settlement. The encased steel method is simple to construct but requires bonding treatment. The paste carbon fiber method is lightweight but has limited lateral performance improvement [2]. The composite strengthening method combines the strengths of multiple methods and offers excellent reinforcement results.
Priestley [3] found that the stiffness and bearing capacity of RC columns can be significantly improved by using the method of adding elliptical steel tubes. Alhoubi [4] studied the use of Fabric-Reinforced Cementitious Matrix (FRCM) systems in repairing pre-damaged RC square columns. Test results showed that confining the pre-damaged columns with FRCM systems resulted in a 7% to 42% enhancement in their load-carrying capacity and a 47% to 272% improvement in their ductility. Qi [5] conducted axial compression tests on three L-shaped, partially encased, steel–concrete composite stub columns. The test results indicated that the axial compression capacity could be effectively enhanced with an increase in material strength. Wu [6] analyzed RC columns strengthened with self-compacting concrete and encased angle steel, finding that composite strengthening effectively overcame single-method limitations and boosted material utilization, with angle steel size significantly impacting the load-bearing capacity. Sun [7] studied the mechanical properties of self-compacting concrete composite-strengthened columns with encased angle steel under axial compression. The results showed that composite strengthening surpassed encased angle steel in its load-bearing, deformation, and energy-dissipation capacities. However, batten plate spacings over 150 mm reduced these capacities, so batten spacing should be kept within 150 mm.
Research by Chinese and foreign scholars shows that combining encased steel with increased cross-section composite strengthening can enhance RC columns’ axial compressive capacity and ductility. However, ordinary concrete strengthening layers have the characteristics of high self-weight and poor toughness, and the traditional encased steel form fails to give full play to the hysteretic property of steel. Consequently, this study was based on the existing alkali-activated slag cementitious material preparation method [8] through the addition of silica fume, fly ash, hollow glass microspheres, quartz sand, and polypropylene fibers to create an LAASC. The advantages and disadvantages of RC columns strengthened with LAASC and X-type encased steel were analyzed using axial compression tests and numerical simulations.

2. Axial Compression Test of Composite-Strengthened Column

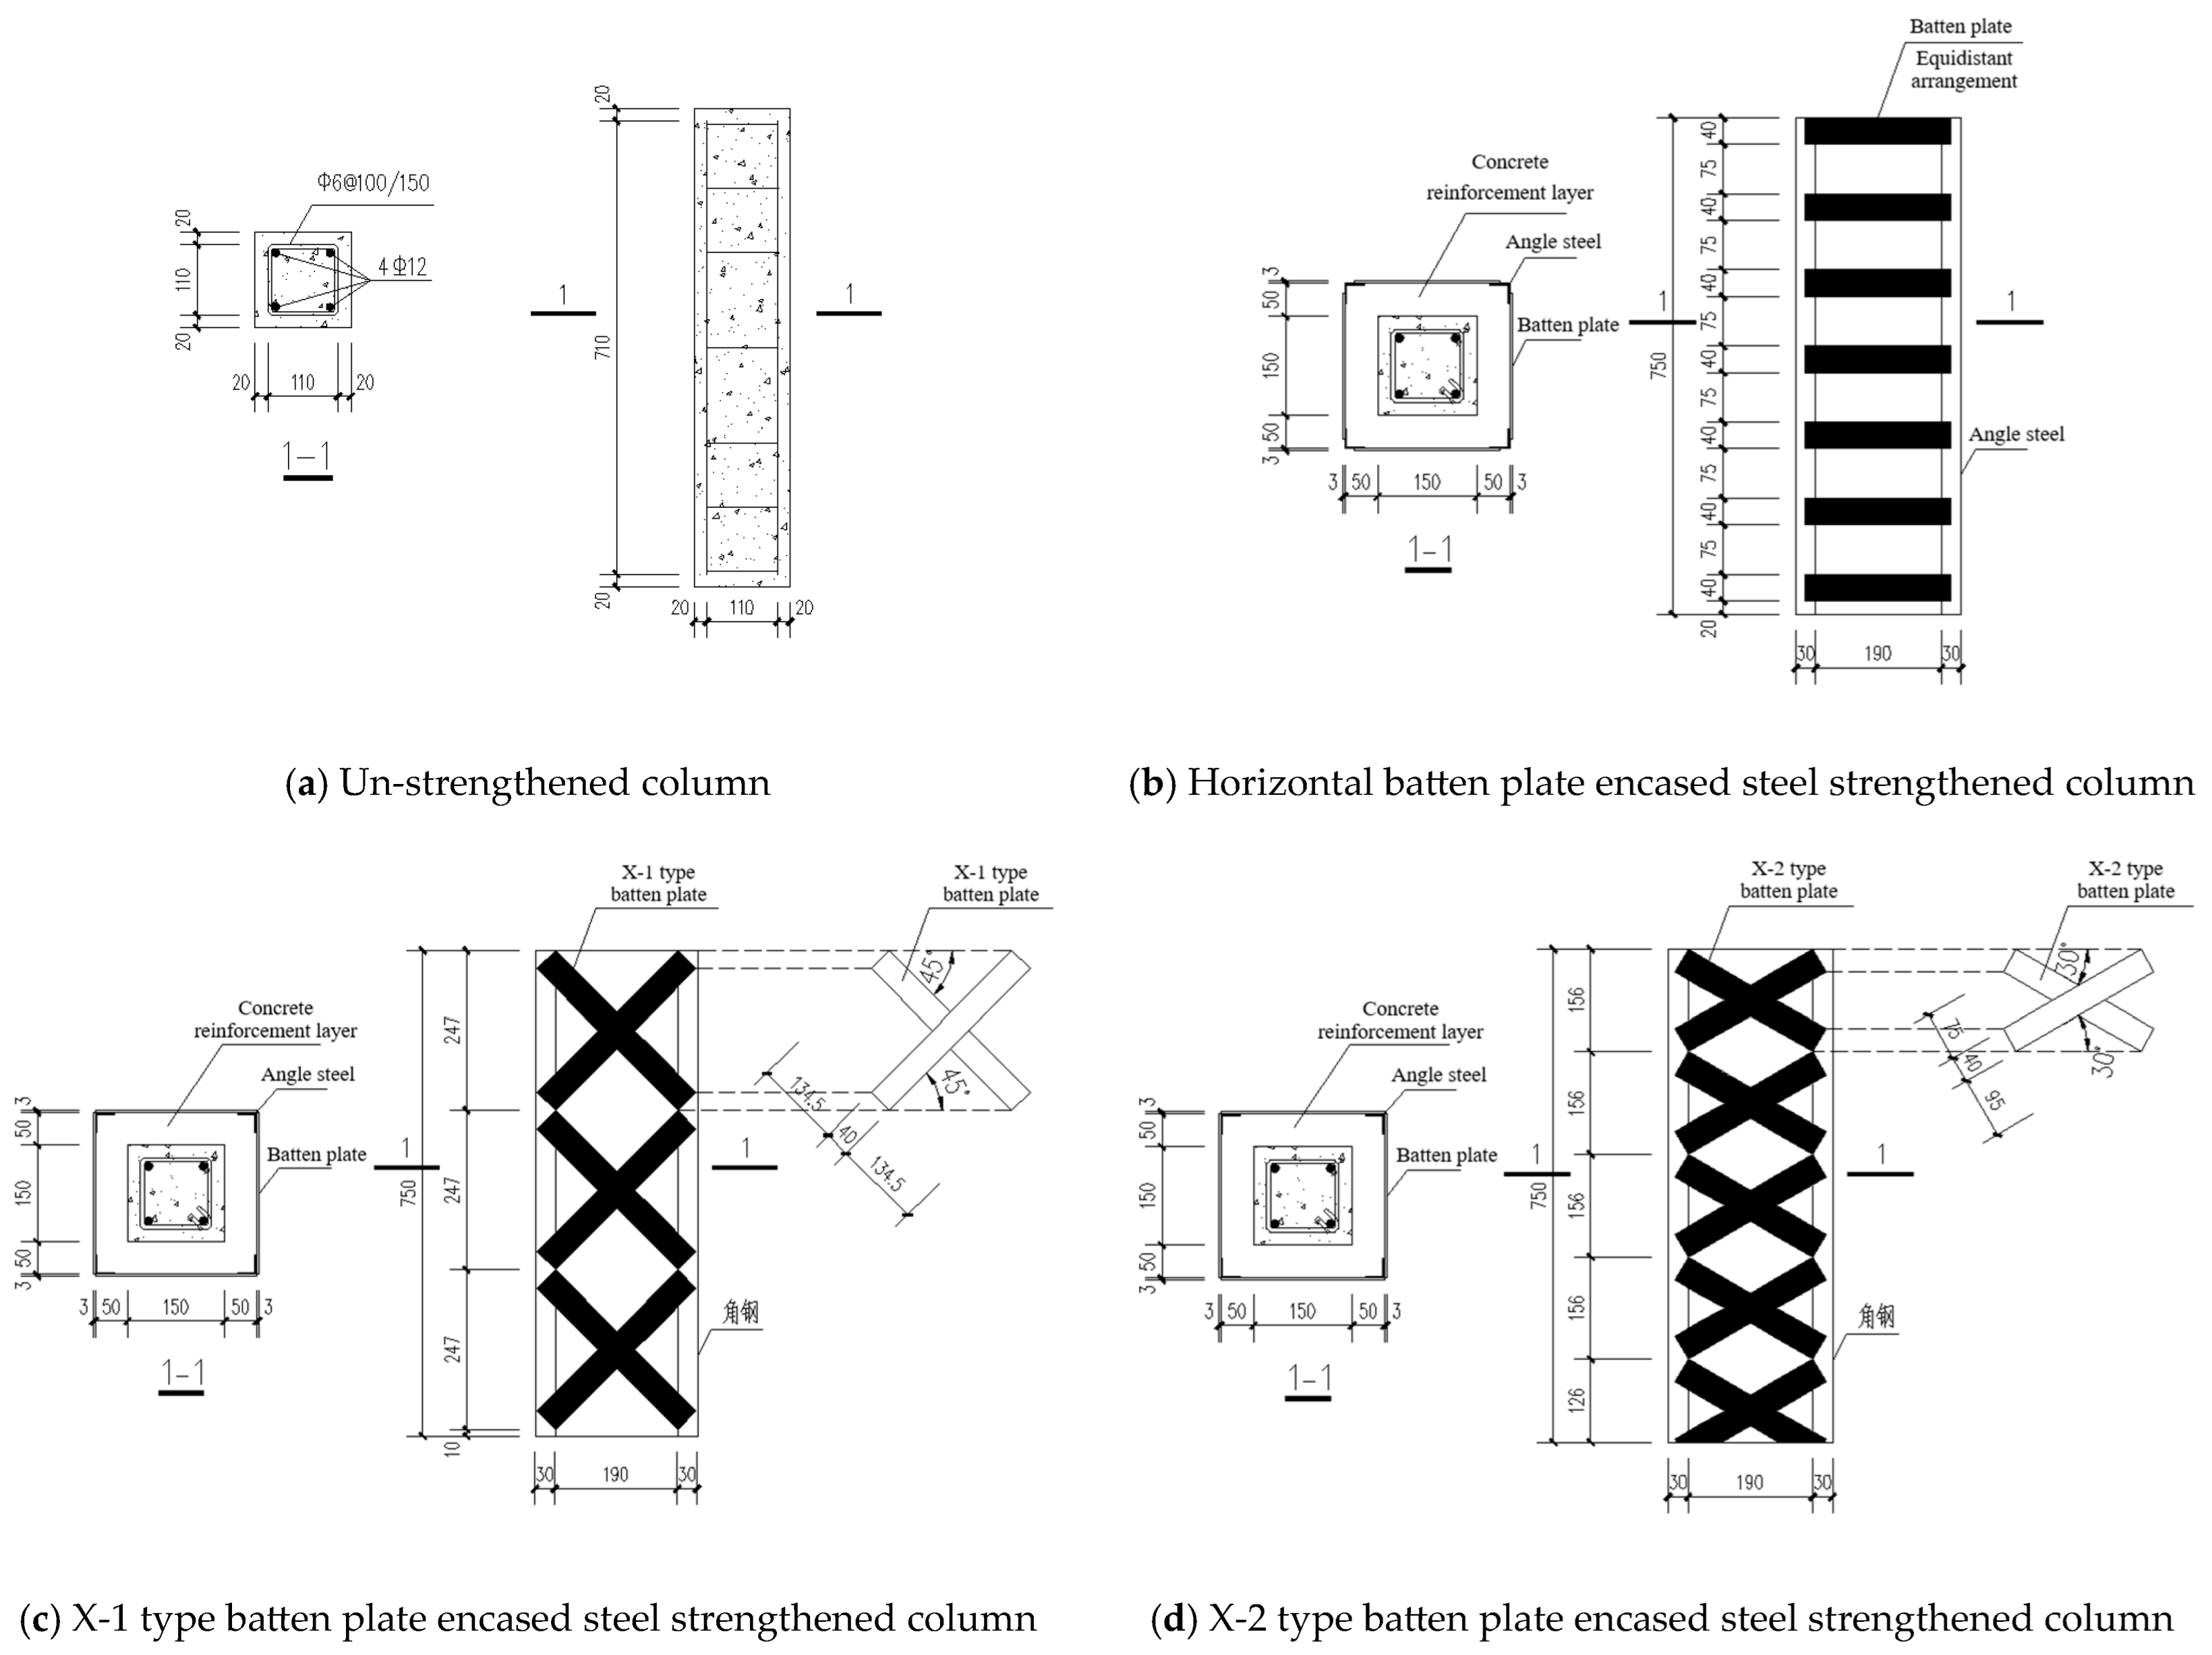
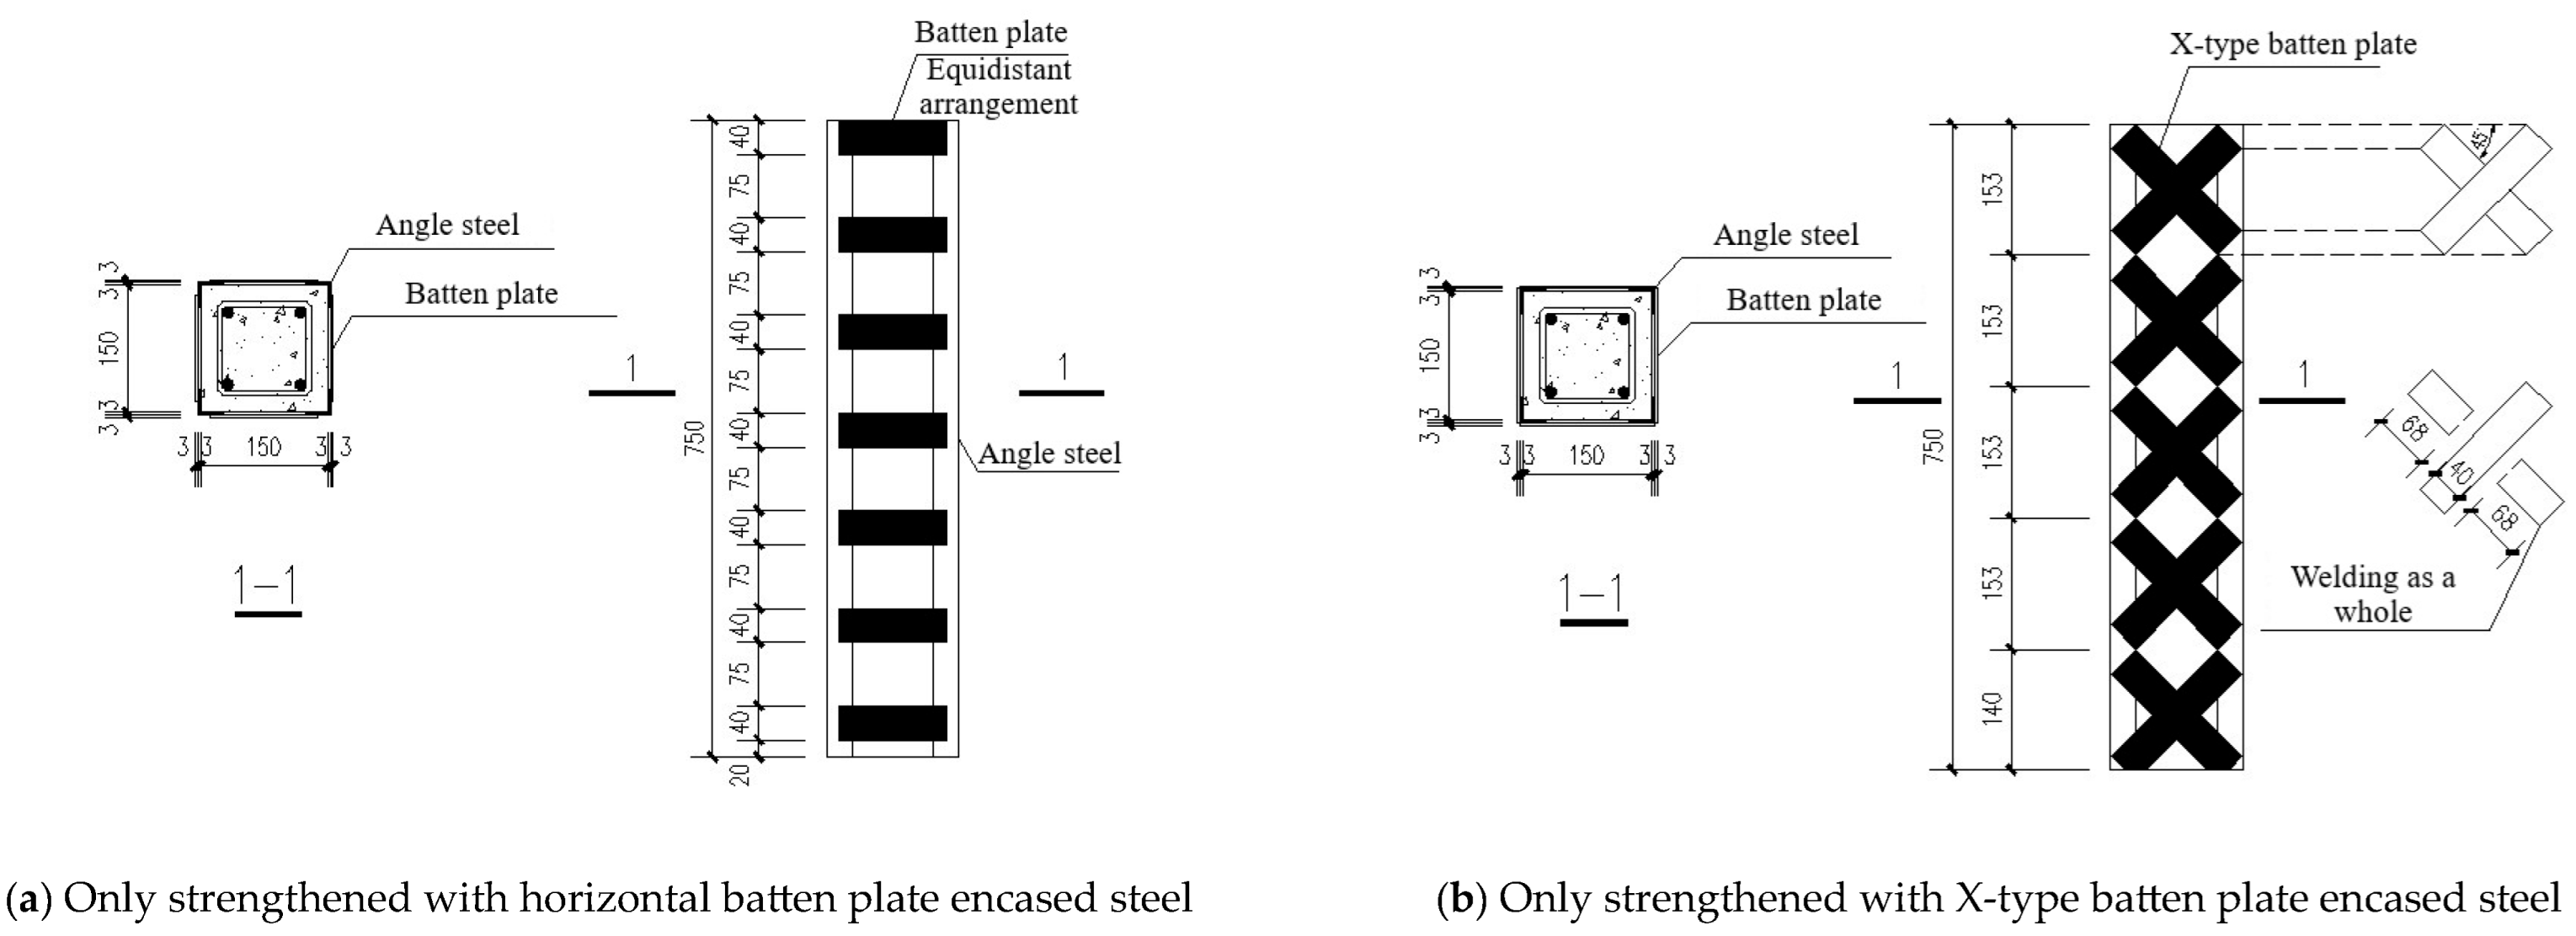
2.1. Design of Columns

A total of six columns were designed for the axial compression test. Among them, one un-strengthened reinforced concrete column (A0) was used as the comparison column. The A-series columns (A1 to A3) were composite-strengthened columns with different strengthening layer materials, while the B-series columns (B1 and B2) were composite-strengthened columns with various forms of encased steel. The reason for choosing Basic Magnesium Sulfate Cement Concrete (BMSCC) and LAASC for comparison is that both are green, low-carbon, lightweight concrete materials that can be promoted and used in RC column strengthening. The thickness of the strengthening layer for each strengthened column was determined in accordance with the “Code for Design of Concrete Structure Strengthening” (GB 50367-2013) [9]. The parameters of each column are presented in Table 1.
The modeling dimensions and reinforcement details for each column are presented in Figure 1. The ratio of the net height of the un-strengthened column to the section height is 5. This design choice ensures that instability does not become the primary factor in column damage. Additionally, it prevents the column from becoming an ultra-short column after being strengthened, which could lead to end effects.
To better align with the existing safety conditions of old buildings in rural towns, the un-strengthened columns were designed without considering seismic design requirements. Both the angle steel and the batten plate were welded together to form a steel plate framework that could be considered a single unit. Additionally, the welded, encased steel frame needed to undergo weld seam inspection to prevent inadequate welding.

2.2. Column Fabrication and Material Testing

Prior to pouring the strengthening layer, an encased steel is pre-placed within the formwork of the strengthened column in this study. This approach eliminates the need for wet-encased steel structural adhesives and addresses their durability concerns [6]. It also ensures the close combination and collaborative work between the encased steel and the strengthening layer, as depicted in Figure 2. After concreting, the encased steel of the strengthened column is painted to prevent rusting and corrosion.
During the encased steel production process, a set of standard specimens for each type of steel should be reserved to conduct material testing. The mechanical properties of each steel are detailed in Table 2.
The concrete grade of the un-strengthened columns is C30, and the encased steel of all strengthened columns is rolled and processed from Q235B steel plates. The values of the BMSCC mix proportion refer to reference [10], and the dosages of the BMSCC and LAASC mix proportions are shown in Table 3 and Table 4.
Prior to the experiment, material property tests are conducted on the cubic standard test specimens of the strengthening layer material. The compressive strength and density of the strengthening layer for each column are presented in Table 5.
The axial compression experiment employs a graded loading method. A preload of 10 kN is applied before formal loading to ensure full contact and to verify the proper functioning of the strain gauges. Subsequently, loading is applied incrementally until the predicted bearing capacity (F) reaches 80%, using a 0.2 F increment for each step; beyond 80%, a 0.1 F increment is used for each step. The holding time after each loading increment should not be less than 5–10 min, and the duration for each loading increment should be consistent. Once the ultimate bearing capacity is exceeded, loading is controlled by displacement at a rate of 0.05 mm/s until the bearing capacity decreases to 85% of the peak load or excessive deformation occurs, at which point loading is terminated. Figure 3 illustrates the axial compression loading process of the column.

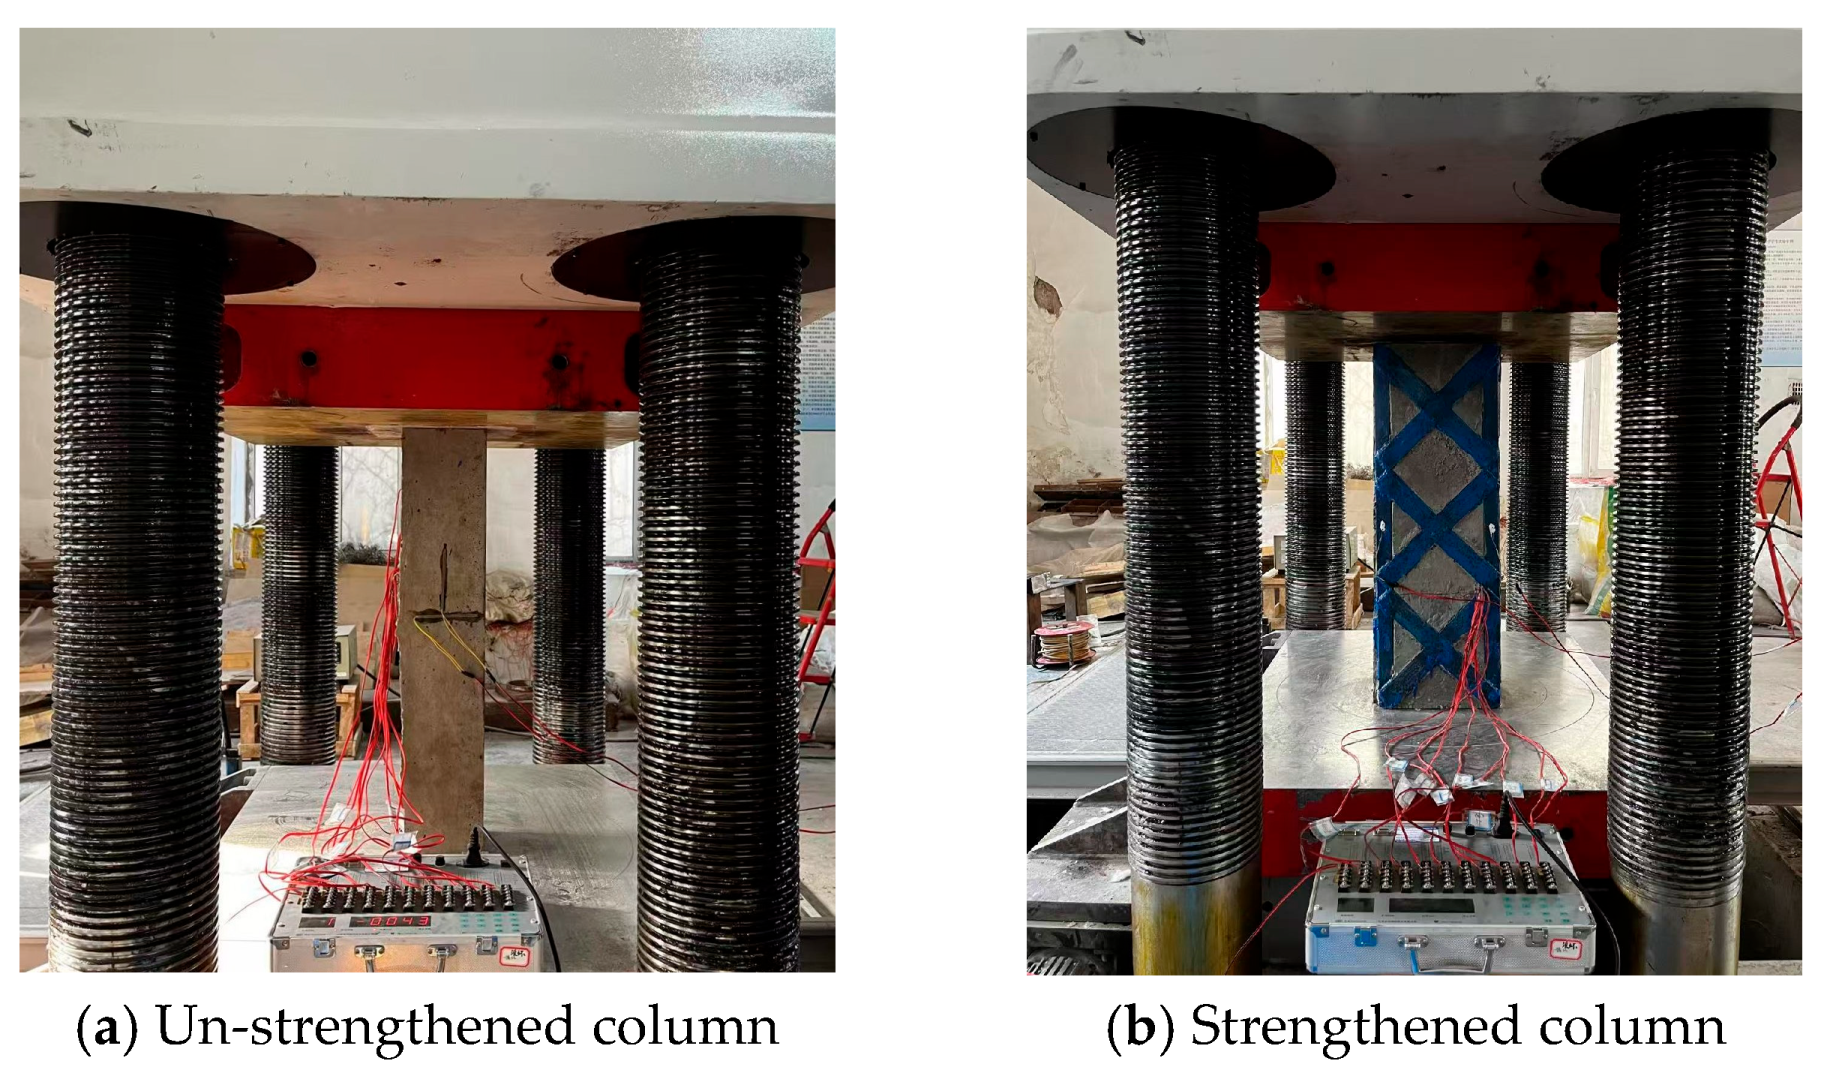
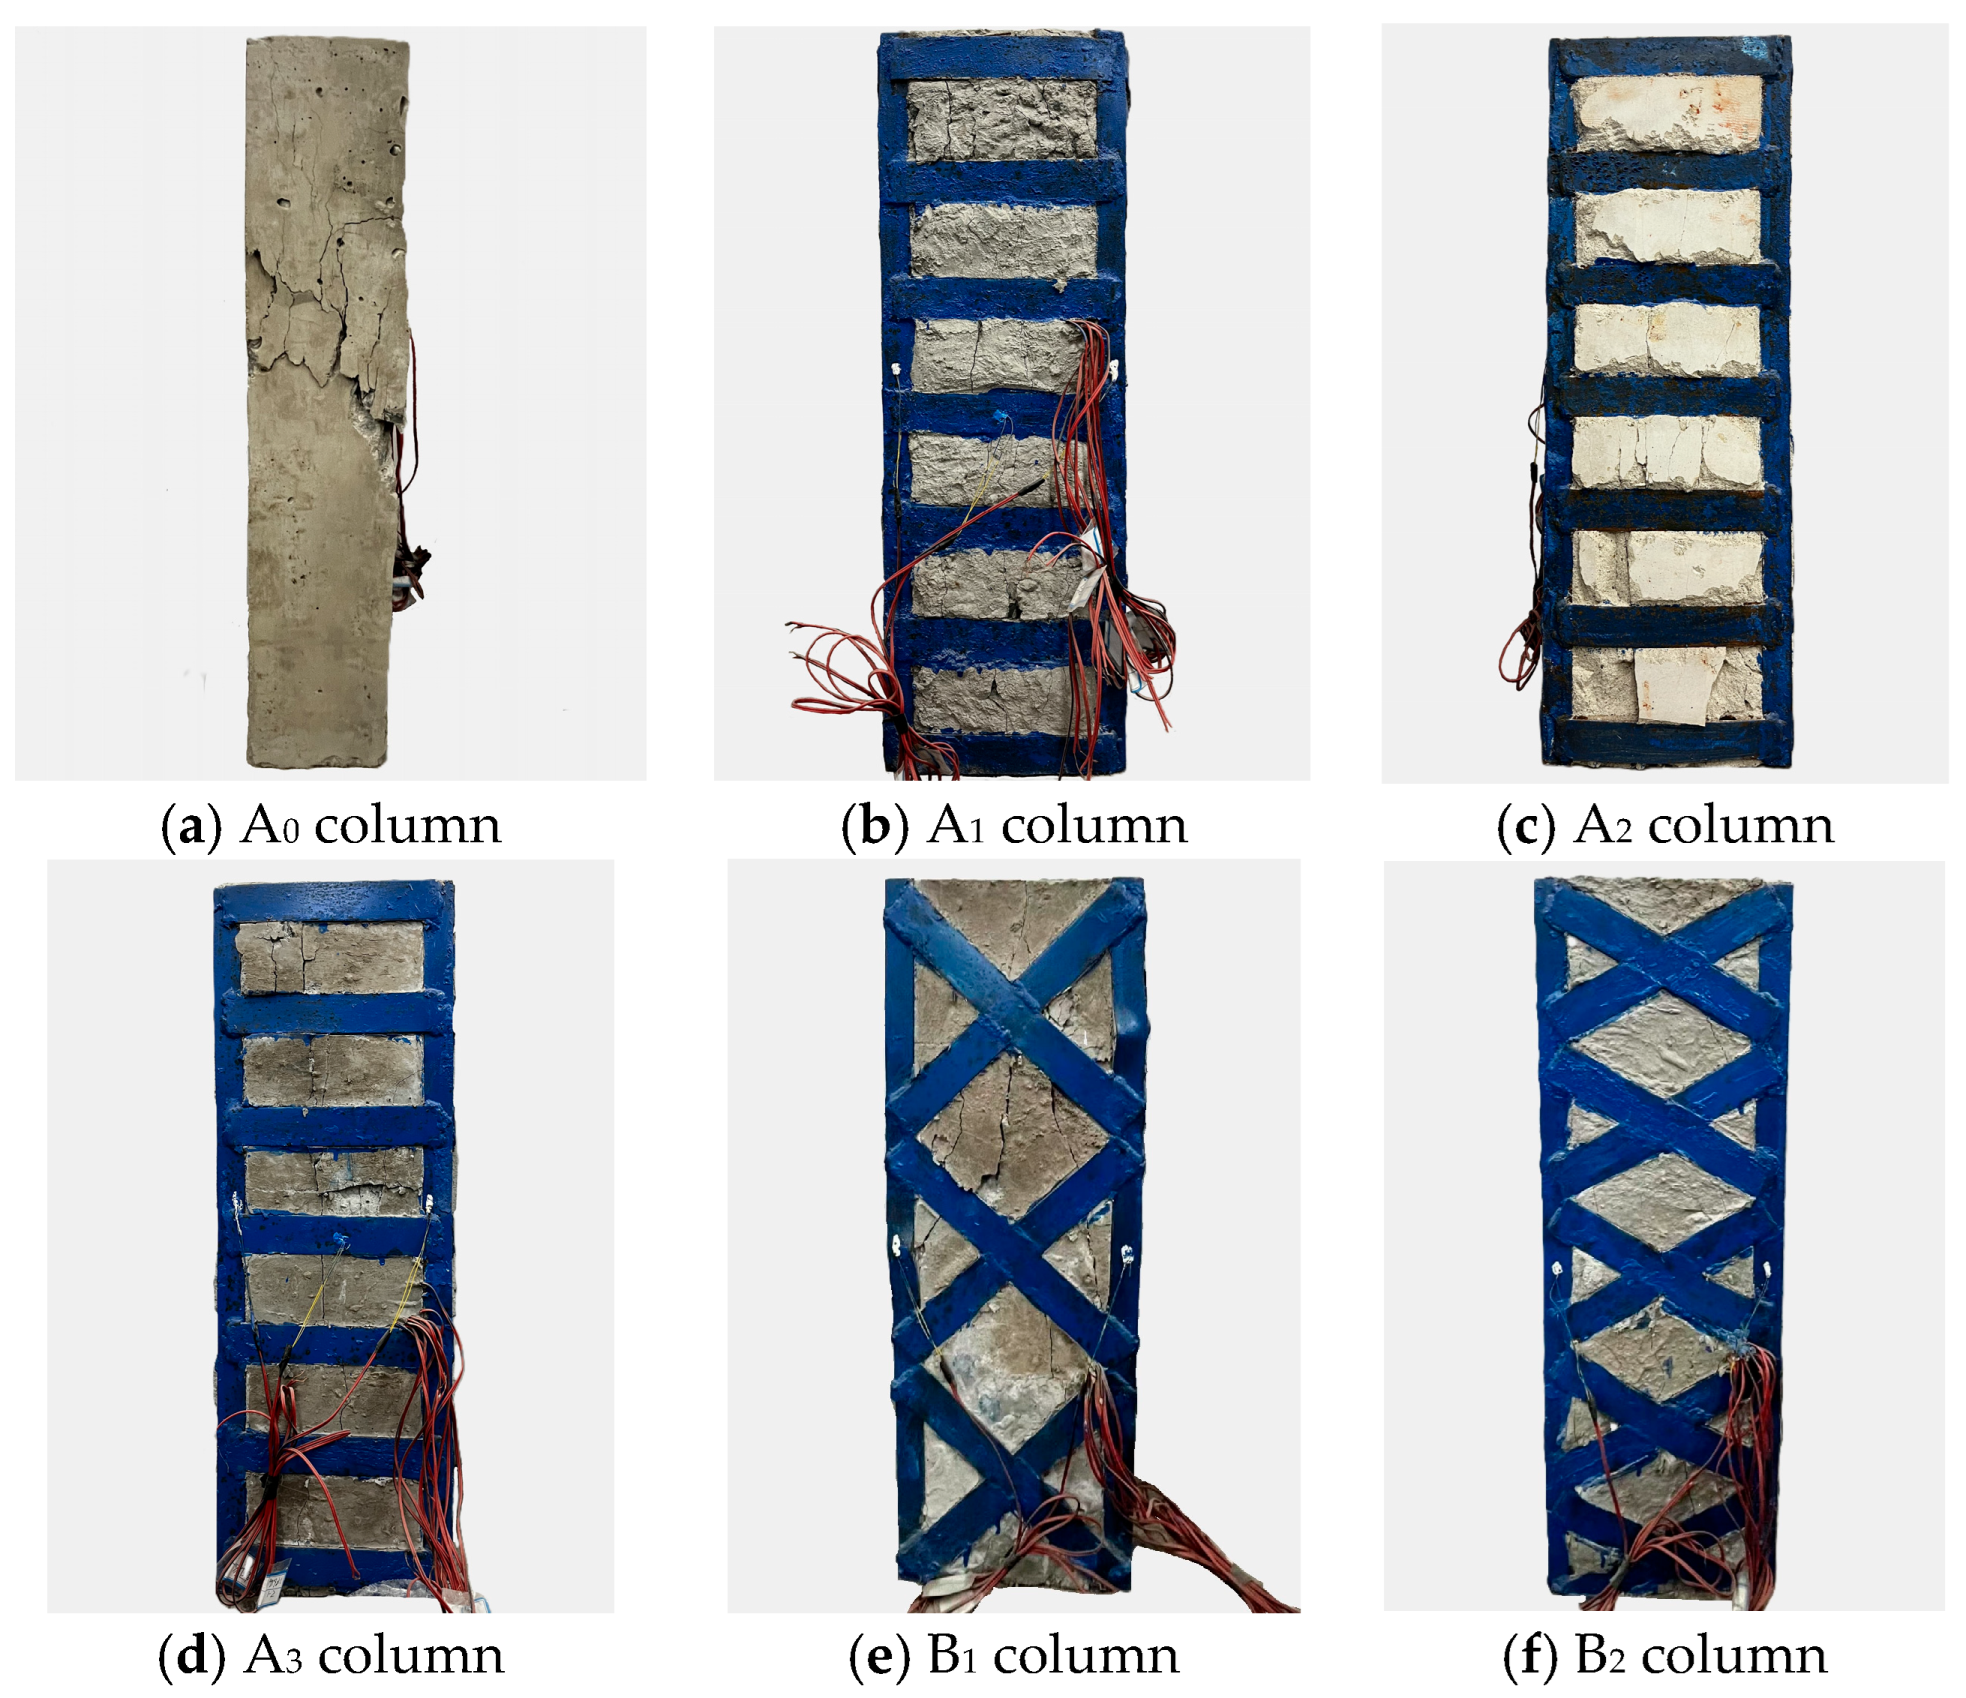
2.3. Experimental Phenomena and Analysis

The encased-steel-strengthened columns exhibit typical characteristics and their failure process in axial compression tests is as follows: In the early loading stages, no significant abnormalities appear on the column surface. However, when the load reaches 70% to 80% of the peak load, significant bulging deformation begins to occur in the middle of the angle steel of the strengthened column, and the exposed concrete part develops vertical cracks, or even spalls. The failure mode of the column is shown in Figure 4.
When the un-strengthened column A0 is loaded to 400 kN, it emits a cracking sound, and fine cracks begin to emerge in the central region of the column, accompanied by concrete spalling at the corners. As the load approaches the peak value of approximately 550 kN, the longitudinal cracks in the central area widen significantly and propagate outward, resulting in a sudden drop in the column’s bearing capacity. Upon the termination of the experiment, it is observed that the column has sustained severe damage.
When the strengthened columns A1, A2, and A3 are loaded to 1200 kN, 1600 kN, and 1800 kN, respectively, continuous peeling sounds of the encased steel and concrete strengthening layer are emitted from the columns. As the load further increases to the peak loads of 1685 kN, 2000 kN, and 2312.5 kN, the columns produce continuous brittle sounds. Expansion deformation occurs in the middle of the columns. Significant cracks appear in the middle concrete sections of columns A1 and A2, extending from the middle towards both ends. Although the crack width of the A3 column is relatively small, fiber exposure is significantly visible at the crack locations.
When the strengthened columns B1 and B2 are loaded to 1687.5 kN and 1800 kN, respectively, continuous brittle sounds occur, and the outer steel and strengthening layer concrete begin to separate. The middle of the B1 column’s angle steel exhibits pronounced buckling deformation. The B2 column’s angle steel displays relatively minor bulging deformation. This difference is attributed to the batten plate spacing on B1 being approximately twice that of other strengthened columns, resulting in weaker lateral deformation constraints. Ultimately, columns B1 and B2 reach peak loads of 2325 kN and 2350 kN, respectively.

2.4. Comparison of Axial Compression Load–Strain Curves

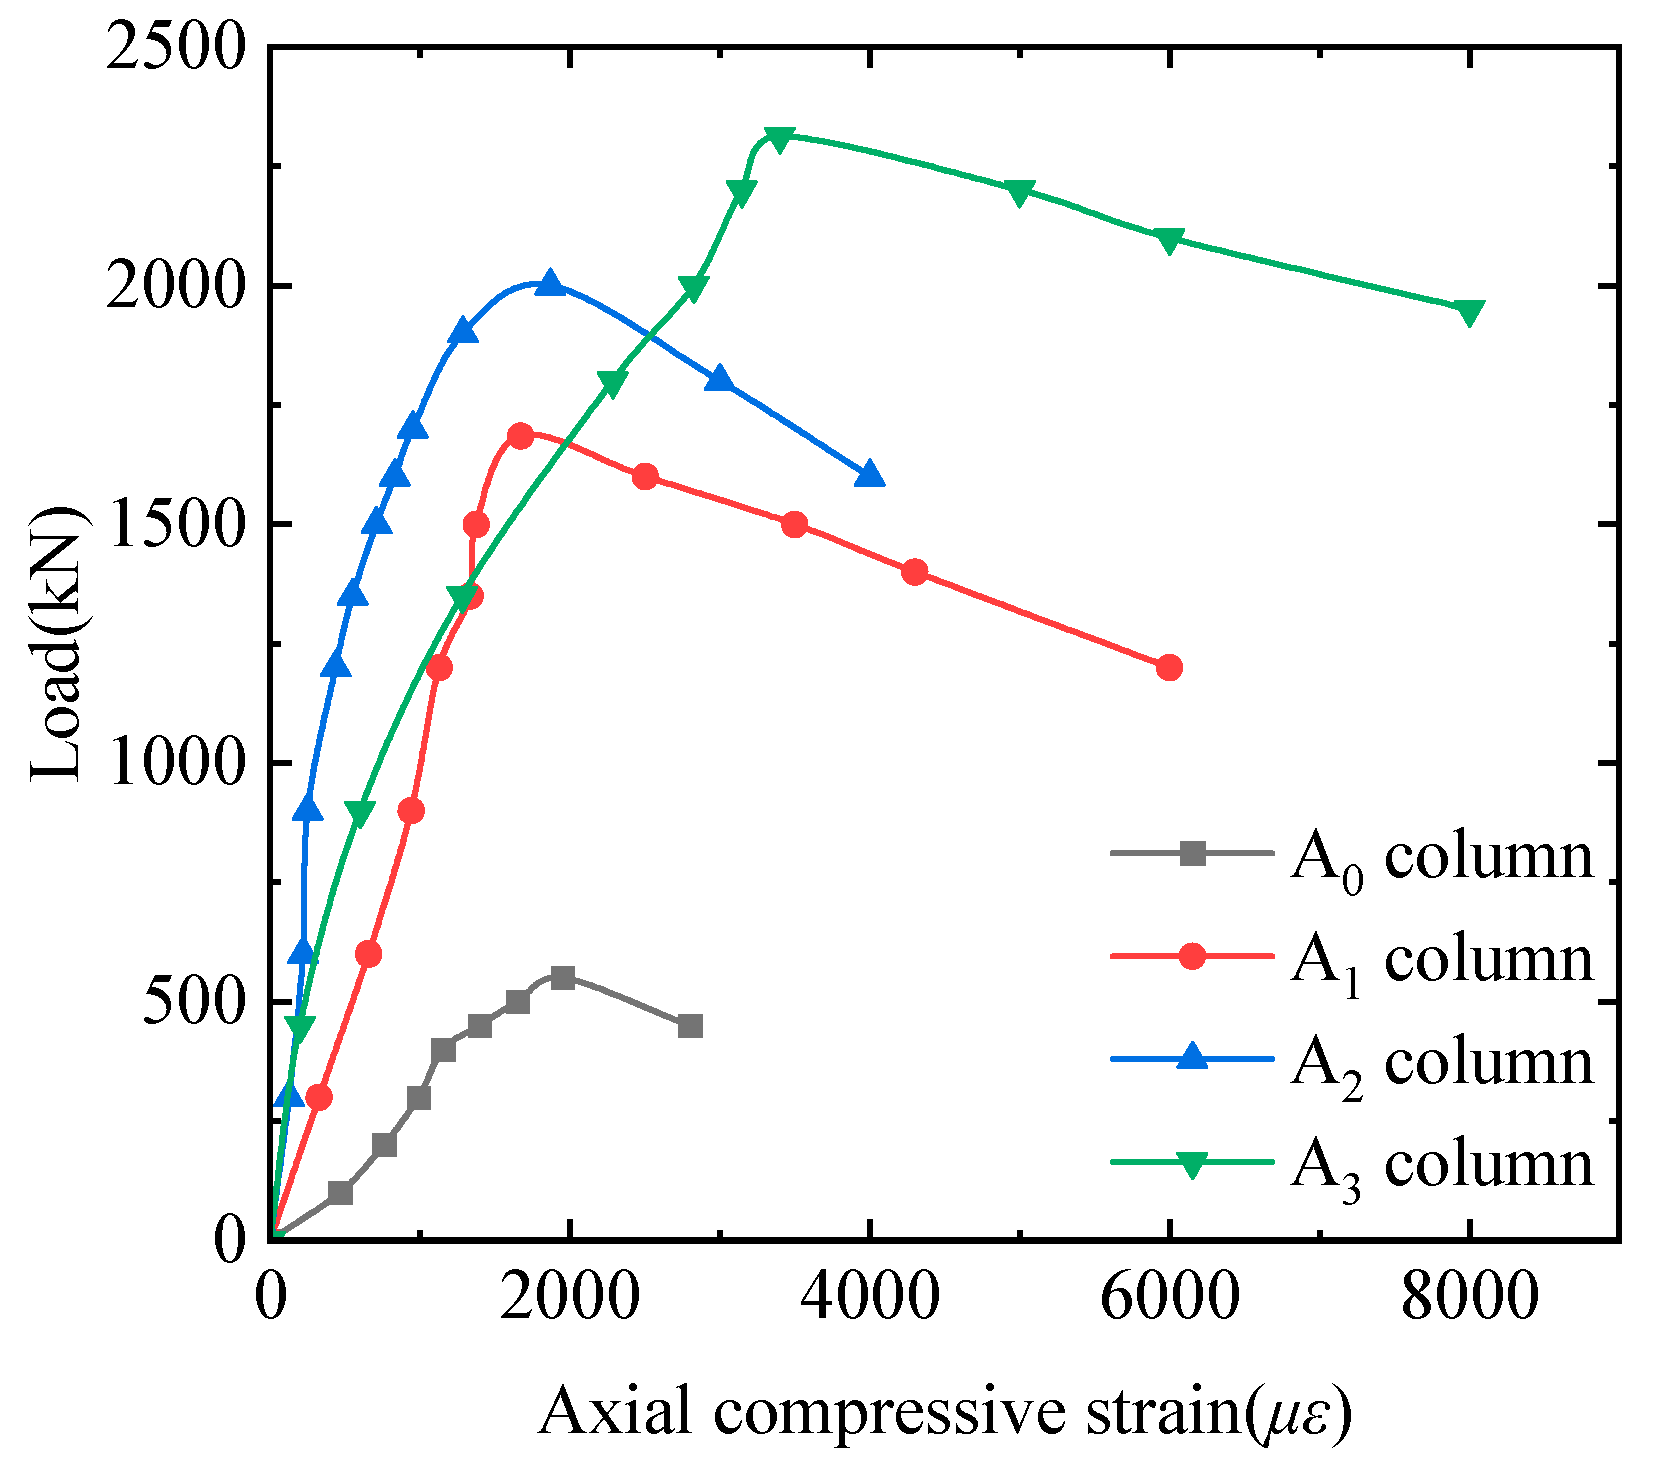
2.4.1. Comparison of Axial Compressive Load–Strain Curves for Different Strengthening Layers

The axial compressive load–strain curves of columns with different strengthening layers are shown in Figure 5. The A0 column has the lowest overall stiffness due to there being no strengthening. This is evident in its load–strain curve, which has the smallest initial slope and corresponds to the lowest ultimate axial compressive bearing capacity. The A2 column shows unexpectedly high overall stiffness and peak bearing capacity. This may stem from BMSCC’s superior bonding to encased steel, surpassing other materials. The A3 column has the highest ultimate bearing capacity and better deformation capacity. Overall, compared to the A0 column, the ultimate bearing capacities of the A1, A2, and A3 columns increase by 3.1 times, 3.6 times, and 4.2 times, respectively.

2.4.2. Comparison of Axial Compressive Load–Strain Curves for Different Forms of Encased Steel

The axial compressive load–strain curves for columns with different forms of encased steel are shown in Figure 6. As is evident, the peak bearing capacities of columns A3, B1, and B2 are comparable, differing by less than 2%. This suggests that by increasing the column cross-section from 150 mm × 150 mm to 250 mm × 250 mm, the form of encased steel has less effect on the ultimate bearing capacity of the strengthened column, with the strengthening layer’s strength becoming the primary influencing factor. In the elastic stage, the load–strain curves of the strengthened columns are virtually identical. However, upon entering the plastic stage, column B1’s load rapidly increases, accompanied by significant column midsection expansion and bulging. With further loading, significant buckling deformation occurs in the midsection angle steel. This behavior is attributed to the larger spacing between B1’s X-type batten plates. Compared to columns A3 and B2, column B1 exhibits weaker lateral constraints on the strengthening layer and internal original column, leading to inferior deformation capacity.

2.4.3. Derivation of Axial Compressive Bearing Capacity Formula for Composite Strengthened Columns with Encased Steel

This section is based on the simplified formula for the axial compressive bearing capacity of strengthened concrete columns with encased angle steel derived by Lu [11]. First, the formula is optimized using the simulated value of RC columns strengthened with encased steel only as the benchmark, according to the size of the un-strengthened column in this paper. Then, further derivation is conducted based on Chinese strengthening standards to obtain the axial compressive bearing capacity formulas for traditional horizontal batten plate- and X-type-batten-plate-encased-steel-composite-strengthened columns. Finally, the calculated results are compared and analyzed with the experimental results.
The bearing capacity formula derived by Lu is as follows:
N g = ϕ φ j ( f cc A c + C j f j A j + f y A s )
f cc = f c ( 1 + α jl β jl )
α jl = 0.37 ( 1 + 1 β jl )
β jl = ρ j f j f c
ρ j = ρ j 1 + ρ j 2 3
In the formula, f c is the axial compressive strength of concrete; f j is the yield strength of angle steel under uniaxial tension; f y is the yield strength of steel bars under uniaxial tension; A c is the cross-sectional area of concrete; A s is the cross-sectional area of longitudinal reinforcement; A j is the cross-sectional area of angle steel; β jl is the hoop indicator; f cc is the constrained full-section compressive strength of concrete; ρ j 1 is the volumetric steel content of the batten plate reflects the spacing between panels; ρ j 2 is the volumetric steel content of angle steel; ρ j is the volume matching ratio of the hoop; α jl is the hoop coefficient; C j is the utilization coefficient for the strength of the angle steel is usually taken as 0.69; ϕ is used to consider the coefficient that affects the constraint effect due to the different side lengths of angle steel, 1.1~1.2 is taken based on the different widths of angle steel; and φ j is the longitudinal stability coefficient of angle-steel-strengthened columns, and it is recommended to directly refer to the standard value, usually taking 1.0.
Simulating the axial compression of the concrete column in Figure 7 with only the encased-steel-strengthened columns, it is discovered that the calculated value derived from Formula (1) is 25% higher, regardless of the type of encased steel used. The reasons for this discrepancy are twofold. When Lu derived the formula, the measured strength of C30 concrete in his experiment was 20% to 25% higher than the standard value. Second, factors such as the insufficient compaction of structural adhesives and deformations resulting from the welding of encased steel were not accounted for in the calculation. Consequently, to enhance the accuracy of Formula (1), this study introduces an additional coefficient that accounts for the collaborative working relationship between the strengthening layer and the columns.
The optimized formula for the axial compressive bearing capacity of the encased steel strengthened columns is as follows:
N g = η ϕ φ j ( f cc A c + C j f j A j + f y A s )
In the formula, η is the collaborative working coefficient between the encased steel and the columns, taken as 0.75.
From the experiment in Section 2.4.2, it is evident that the concrete strength constrained by an encased steel skeleton is influenced by the spacing and angle of X-type batten plates. Consequently, by modifying Equation (3), the simplified formula for the axial compressive bearing capacity of X-type encased-steel-strengthened columns can be derived as follows:
N g = ϕ φ j ( α f cc A c + C j f j A j + f y A s )
In the formula, α is the influence coefficient of X-type encased steel, which is related to the spacing and angle of X-type batten plates.
When the spacing between X-type batten plates is the same as that of horizontal batten plates: when the angle between the X-type batten plate is 30°~45°, take 1.05; when the angle of the X-type batten plate is greater than 45°, take 1.00.
When the spacing is two times greater: when the angle between the X-type batten plate is 30°~45°, take 0.95; when the angle of the X-type batten plate is greater than 45°, take 0.90.
When the spacing is three times greater: (1) when the angle of the X-type batten plate is 30°~45°, take 0.90; (2) when the angle of the X-type batten plate is greater than 45°, take 0.85.
Finally, based on the formula for the axial compressive strength of new and old concrete composite sections using the enlarged section strengthening method in the “Code for Design of Concrete Structure Strengthening” (GB 50367-2013) [9], the calculation method of f cc is improved. The axial compressive bearing capacity formulas for traditional encased-steel-composite-strengthened columns and X-type encased-steel-composite-strengthened columns can be obtained as shown in Equations (6) and (7), respectively.
N g = ϕ φ j ( f cc A c + C j f j A j + f y A s )
N g = ϕ φ j ( α f cc A c + C j f j A j + f y A s )
f cc = f c ( 1 + α jl β jl )
f c = 0.5 ( f c + φ f c 1 )
In the formula, f c is the compressive strength of the combined section of new and old concrete. For φ , take 0.75~0.9. When the strength difference between new and old concrete does not exceed two times, take 0.9; when the strength difference exceeds two times, take 0.75. A c is the cross-sectional area of concrete, and f c 1 is the axial compressive strength of new concrete layer.
The axial compressive bearing capacity of ordinary reinforced concrete columns can be calculated in accordance with the “Design Standards for Concrete Structures” (GB/T 50010-2010) [12]. The test results and calculated values from the formula are presented in Table 6.
According to Table 5, the calculated values of the formula are basically consistent with the experimental values, and all calculated values are smaller than the experimental ones. Except for the A2 column, the errors are maintained within 5%. The simulated values being slightly larger than the experimental values can be attributed to the finite element model’s idealized state, which leads to simulation values being relatively large. For the A2 column, the higher experimental values are mainly due to the excellent bonding performance between the BMSCC and encased steel that exceeds expectations.
In summary, the simplified formula for the bearing capacity of encased-steel-composite-strengthened columns derived in this section can be reasonably and effectively applied in engineering practice, offering a dependable theoretical basis for related structural designs.

3. Numerical Simulation of X-Type Encased Steel Composite Reinforced Column

This section employs ABAQUS 2020 finite element analysis software to simulate and analyze the axial compressive mechanical properties of six test columns. The simulation results are compared and verified against experimental data. Additionally, finite element simulations are utilized to investigate the behavior of each test column under small eccentric compression and hysteresis performance, further exploring the stress mechanisms and mechanical behavior under different working conditions.

3.1. Model Building

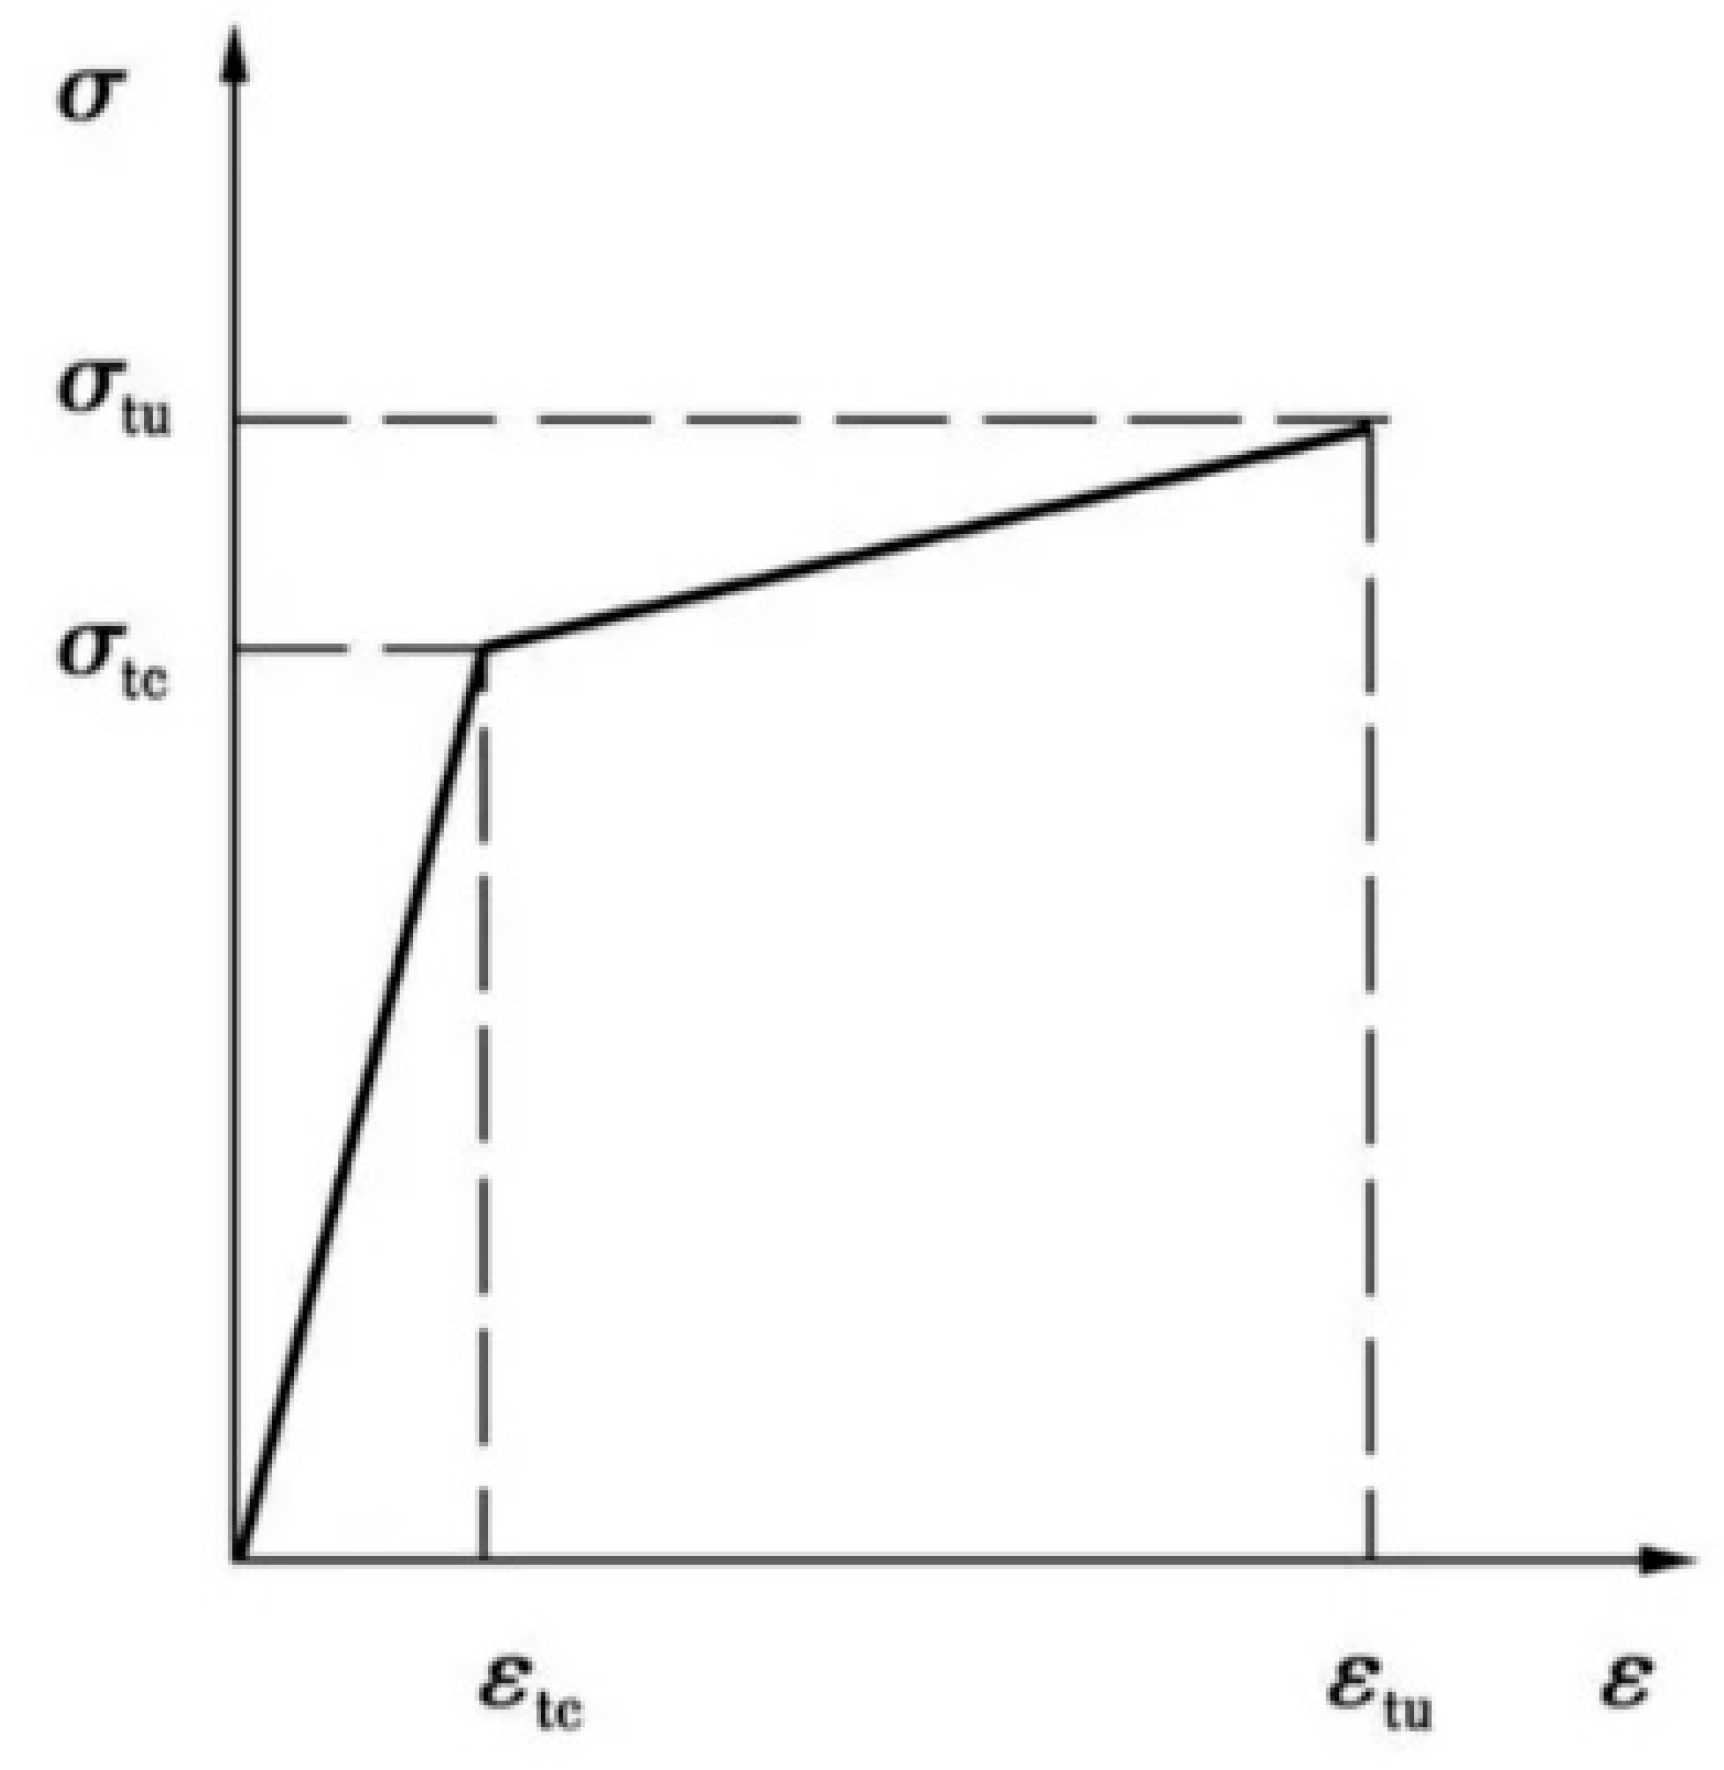
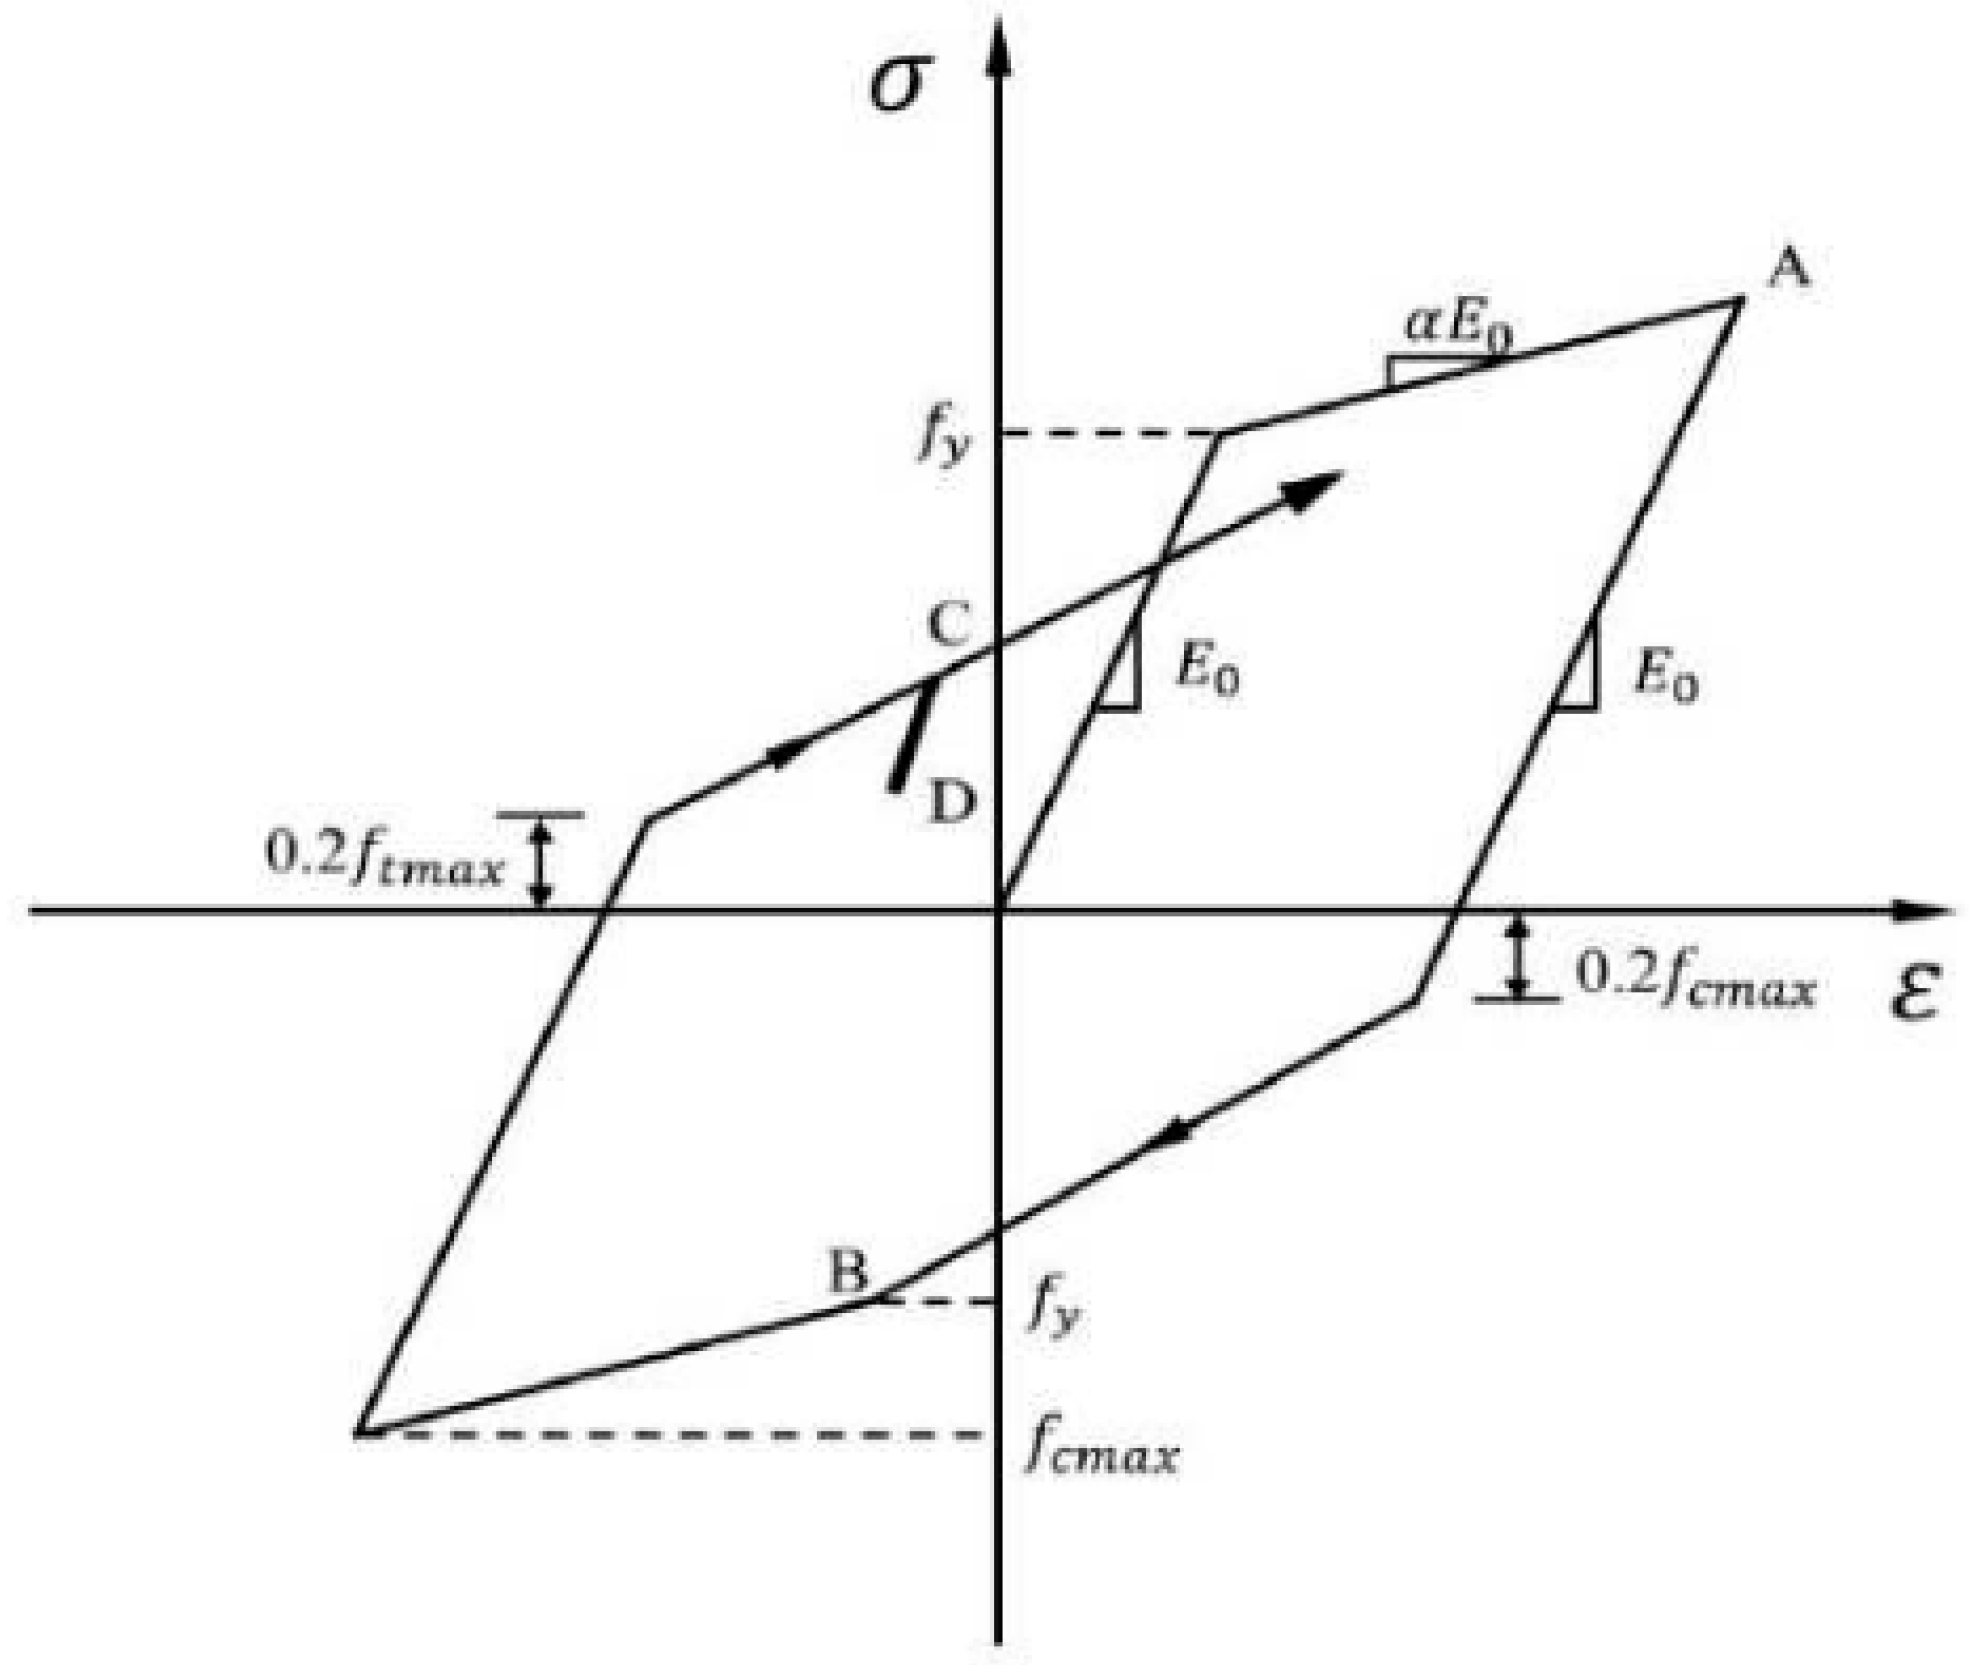
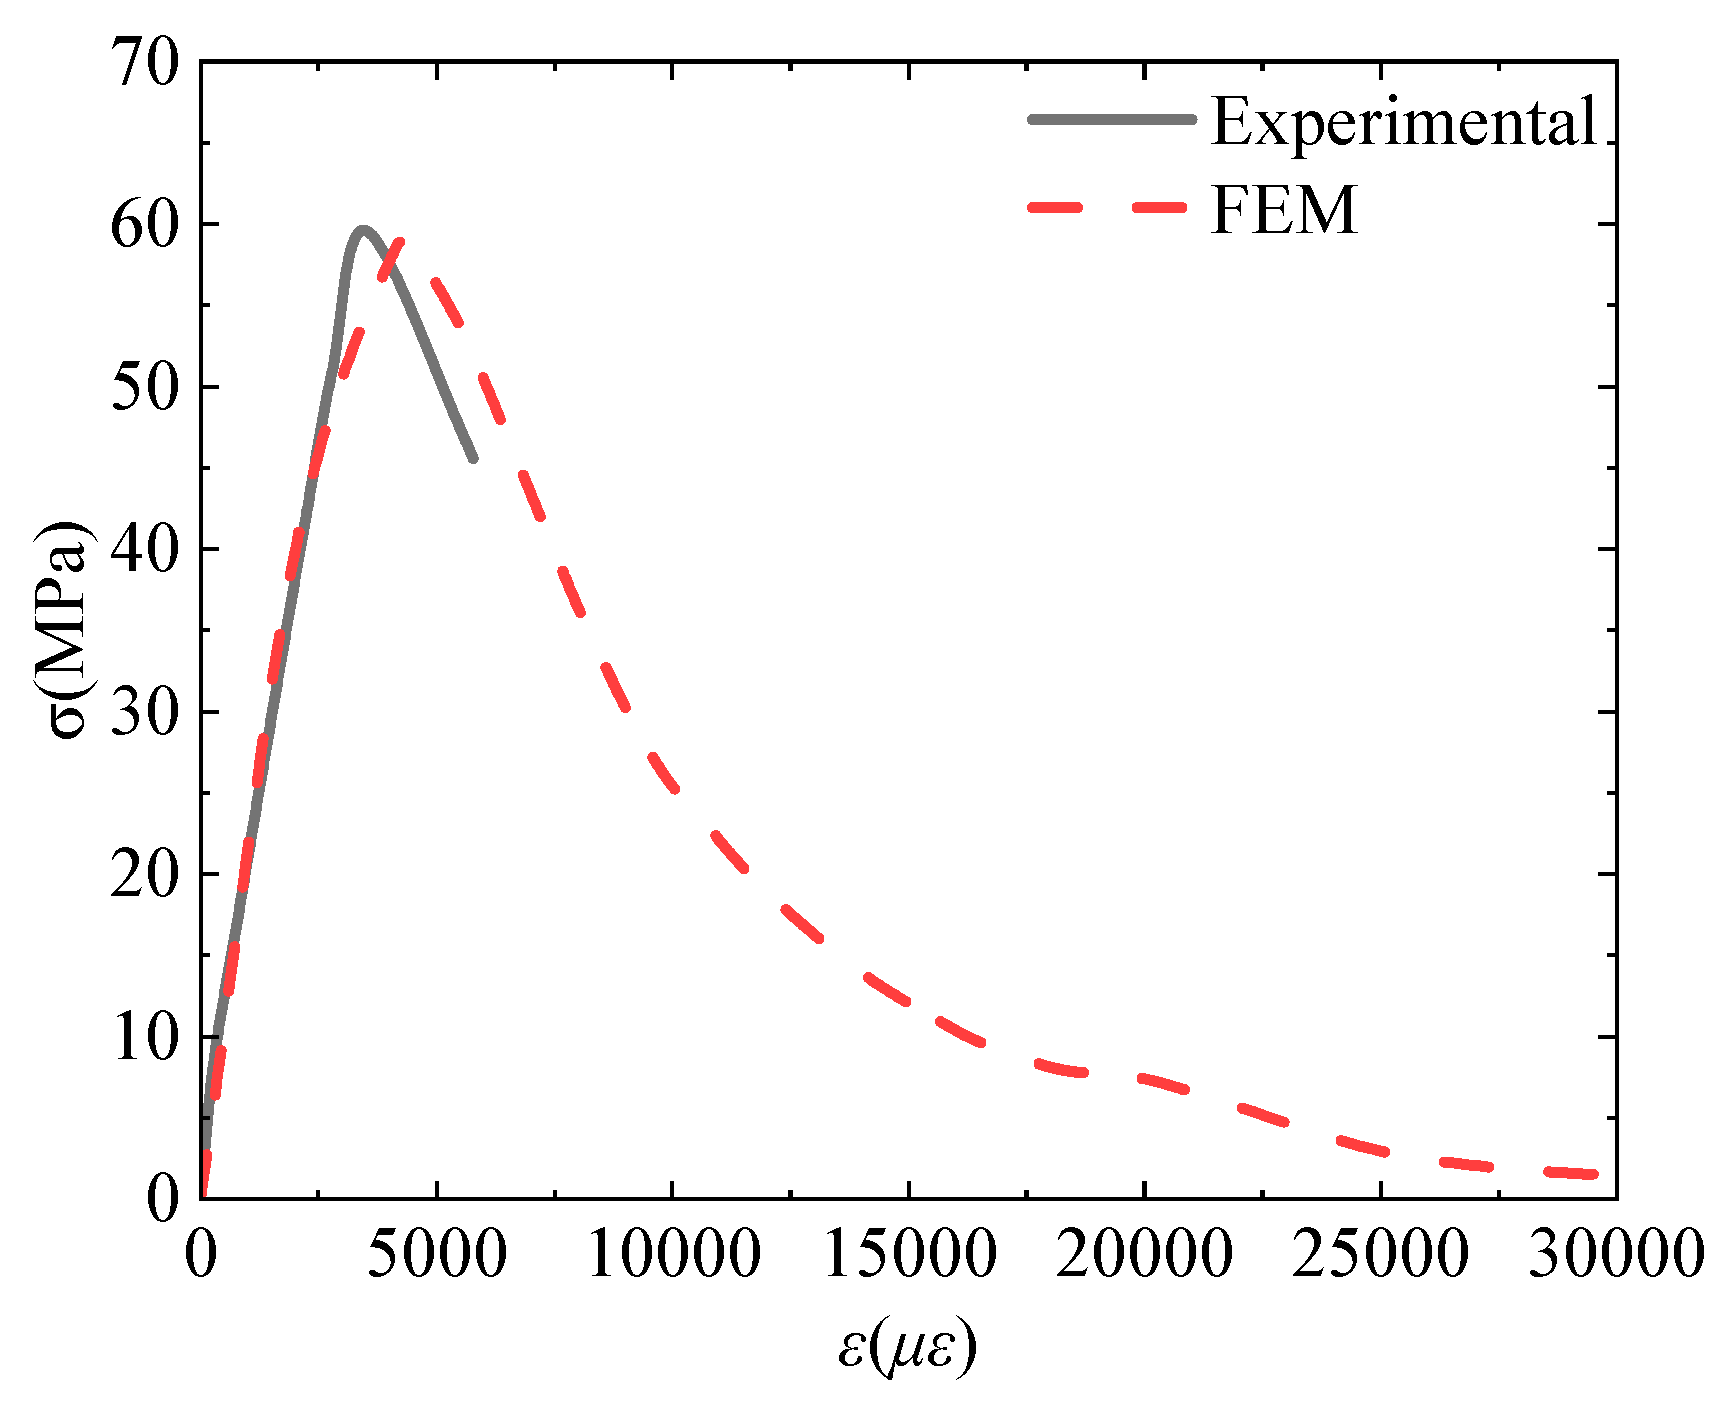
3.1.1. Material Constitutive Model

The constitutive relationship of the encased steel adopts an ideal elastic–plastic bilinear model, where the stress–strain relationship post-yield is simplified as an oblique straight segment. The slope k is 0.01 times the original elastic modulus [13,14], as shown in Figure 8.
However, the bilinear constitutive model cannot capture the dynamic hardening of steel bars or the bond–slip effect with concrete under cyclic loading during subsequent hysteresis simulations. Therefore, the steel bar constitutive model in the PQ Fiber subroutine is utilized. The USteel02 model, a dynamic hardening uniaxial constitutive model based on the Clough model (see Figure 9), incorporates stiffness degradation and can simulate the combined degradation effects from steel bar–concrete bond–slip and concrete cover spalling [15,16].
The damaged plasticity model is used for concrete materials, and the BMSCC constitutive model is based on reference [10]. Per reference [17], the stress–strain curve of ordinary alkali-activated slag concrete aligns with that of same-intensity ordinary concrete. Considering polypropylene fiber addition, LAASC uses an optimized fiber-reinforced concrete constitutive model [18].
The LAASC constitutive data are substituted into ABAQUS, and the resulting stress–strain curve is compared with the measured curve. Figure 10 presents a comparison of the stress–strain curves for LAASC standard prisms.
As shown in Figure 10, the simulated stress–strain curve exhibits excellent consistency with the experimentally measured curve. This indicates that the constitutive model is suitable for simulating LAASC materials in ABAQUS.

3.1.2. Unit Type, Interaction, and Boundary Conditions

In the finite element model, concrete, reinforcement, and the concrete strengthening layer utilize C3D8R solid elements. The longitudinal and transverse bars within the column’s steel cage are modeled with T3D2 line elements and embedded in the concrete via embedded technology. Coulomb friction is applied between the strengthening layer and the core column and between the encased steel and the strengthening layer, with friction coefficients of 0.8 and 0.6, respectively [19,20]. To prevent stress concentration or uneven loading during axial compression, rigid pads are installed at the column’s top and bottom.
This article employs the displacement loading method for both axial compression and small eccentric compression simulations. For the hysteretic performance simulation, two analysis steps are defined: first, axial pressure is applied along the column axis to simulate the axial compression ratio; second, a horizontal displacement load is applied perpendicular to the column axis [21].

3.2. Simulation Results and Analysis of Axial Compression

3.2.1. Typical Damage Modes of Columns

This article uses the simulated failure modes of columns A0 and B1 as typical examples for comparative analysis with the experimental results. The simulated damage modes are shown in Figure 11. In the numerical simulations, both the un-strengthened and strengthened columns exhibit bulging failures, consistent with the experimental damage locations. Additionally, the separation phenomenon between the encased steel and concrete strengthening layers and the middle of the angle steel shows bulging deformation. Overall, the damage modes from the numerical simulations and experiments are quite similar.

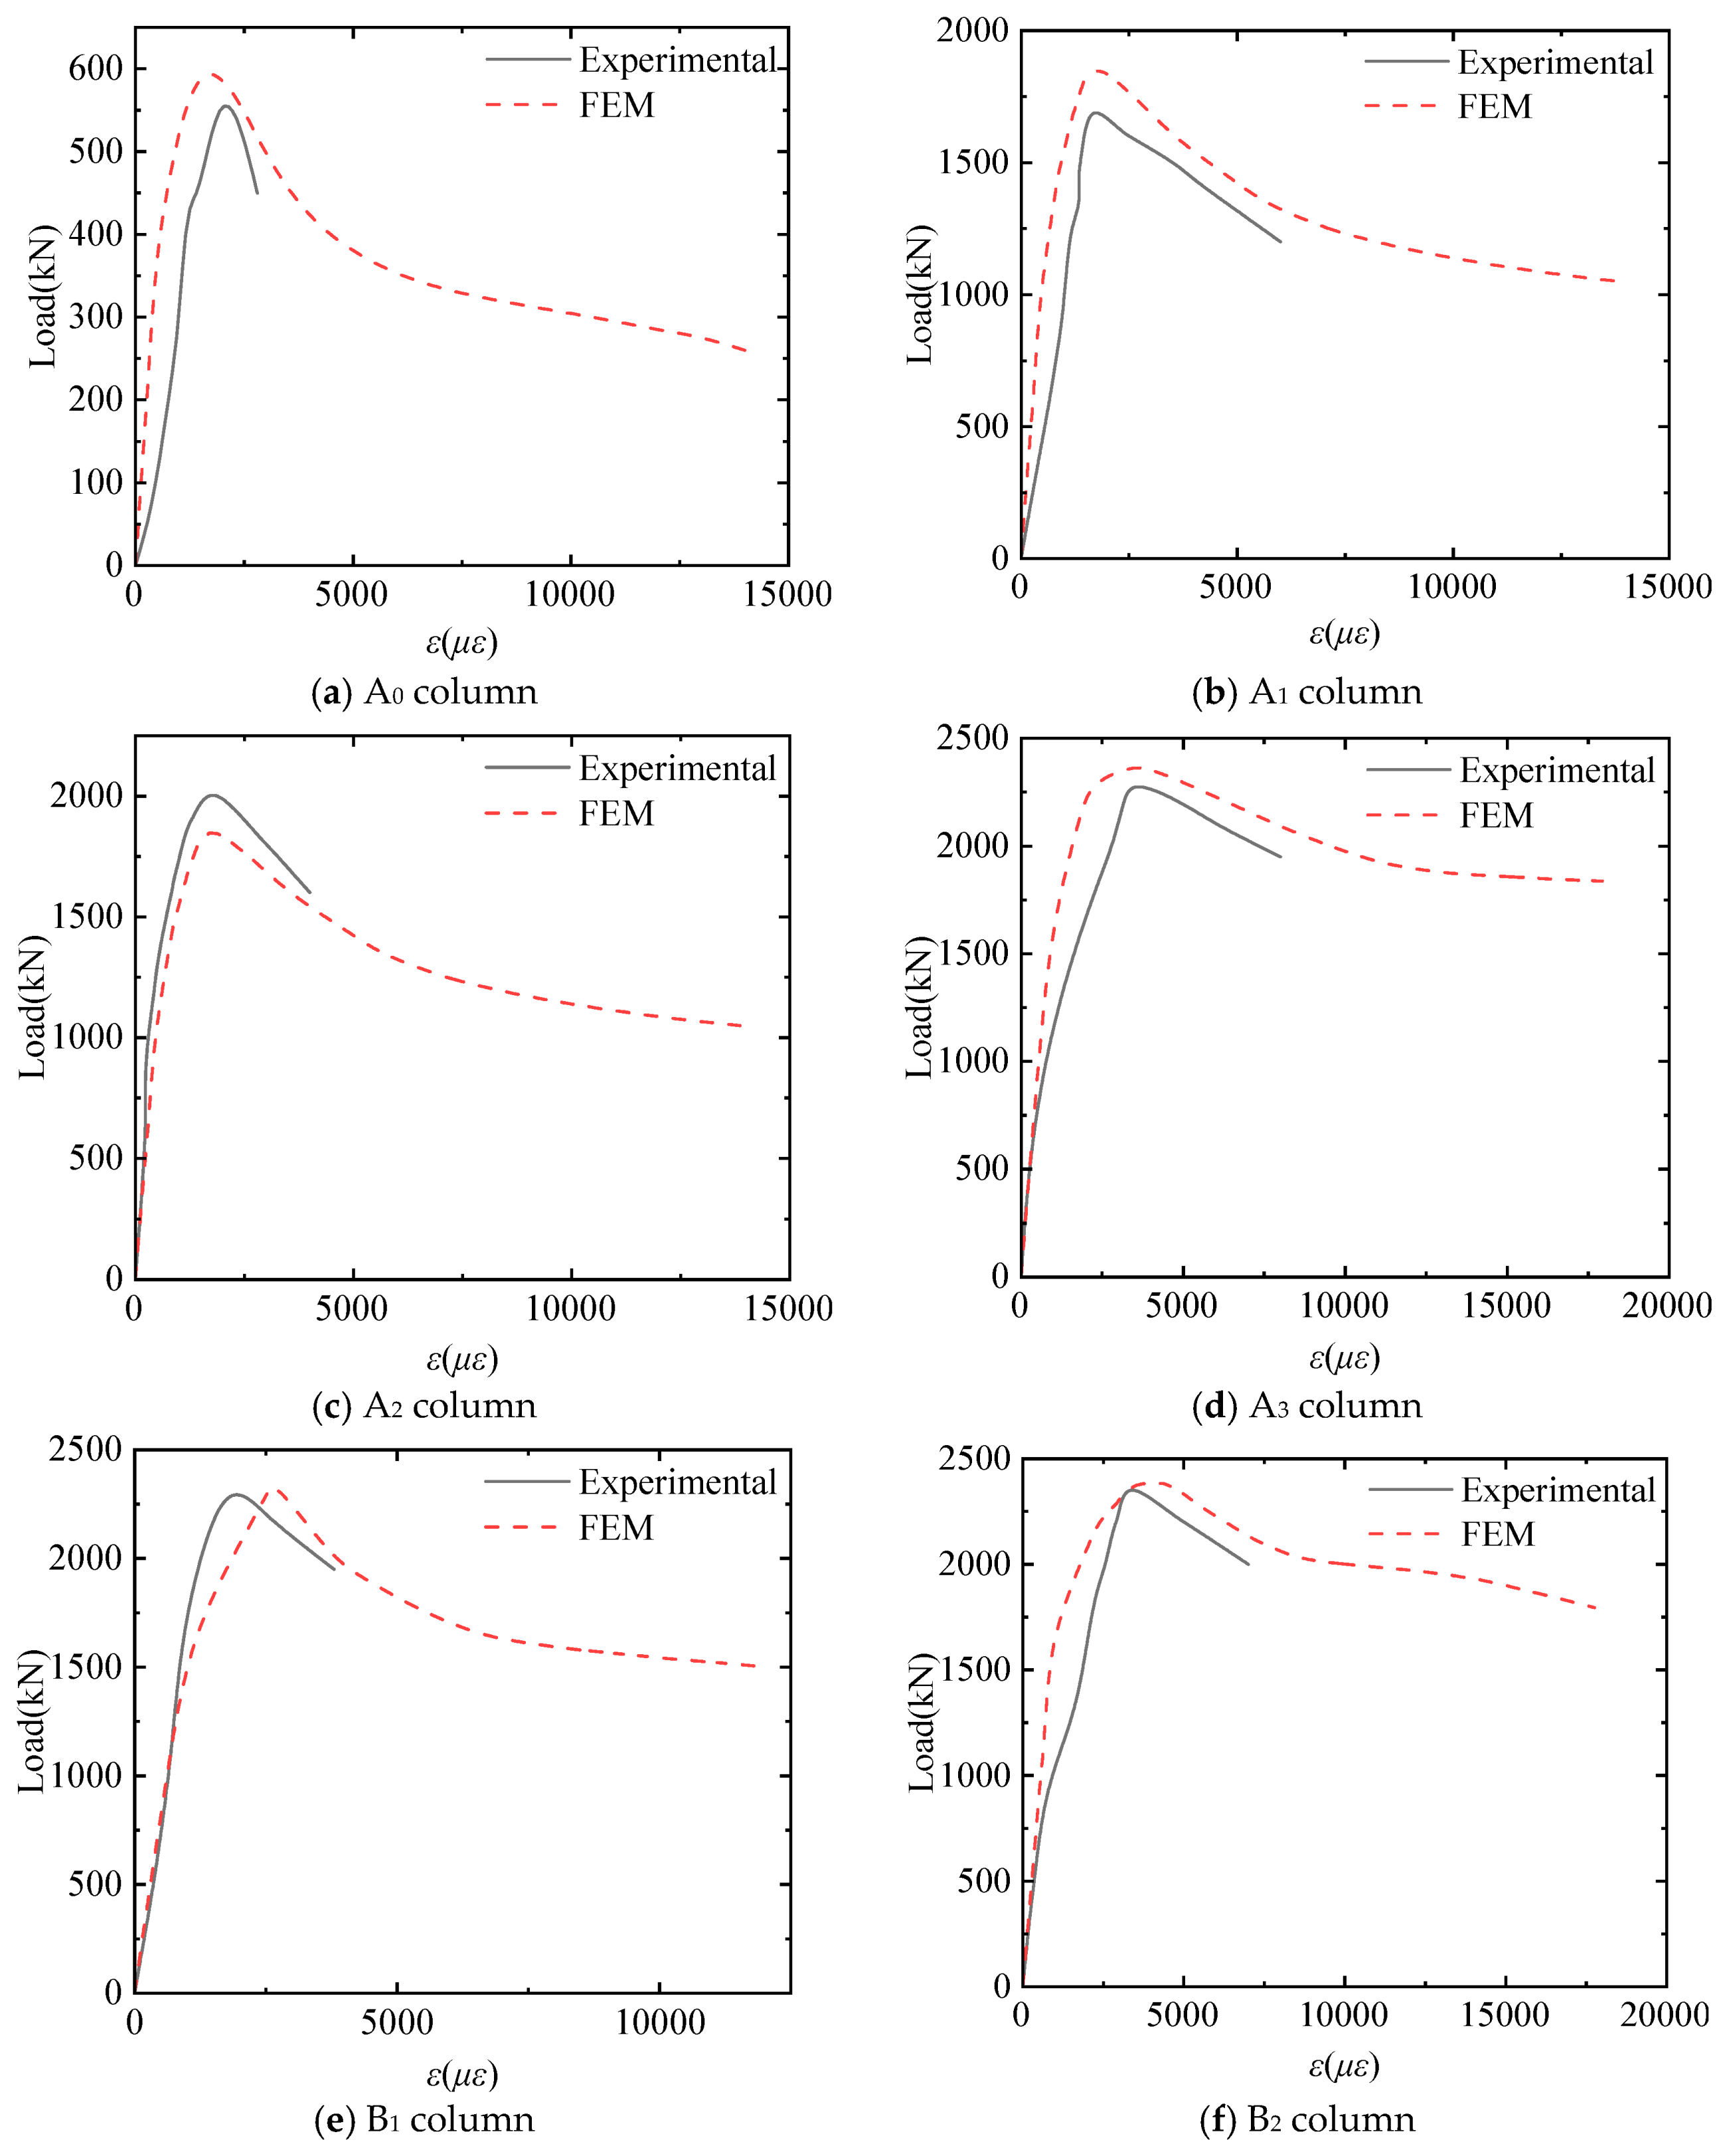
3.2.2. Comparative Analysis of Axial Compressive Load Strain Curves

Figure 12 compares the simulated and tested axial compressive load–strain curves of each column. The load–strain curves from the experiments and finite element simulations agree well, but minor discrepancies exist.
In numerical simulations, the ascending segment of the load–strain curve typically has a larger slope. This is because simulations assume materials and structures are ideal, which can overestimate the structure’s overall stiffness and bearing capacity. In experiments, despite concrete damage and spalling, the encased steel’s restraint and aggregate interlocking effect enable the structure to retain some post-damage bearing capacity, so the curve has a certain descending section.
The stiffness difference between the simulated and test curves for columns A1, A2, A3, B1, and B2 is only 5% to 10%, which is within a reasonable range. The A0 column may have an uneven distribution of coarse aggregates due to its relatively small cross-sectional size, and the protective layer may crack or peel off during the test, resulting in a rapid decrease in effective stiffness during the elastic–plastic deformation stage. Therefore, the stiffness of the test curve is relatively small. The test curve and simulation curve of the A3 column are basically consistent in the early stage, but the stiffness decreases slightly in the middle stage, mainly due to residual stress in the welding production of the encased steel skeleton. Eventually, as the loading increases, the stiffness decreases slightly compared to the simulation in the later stage.

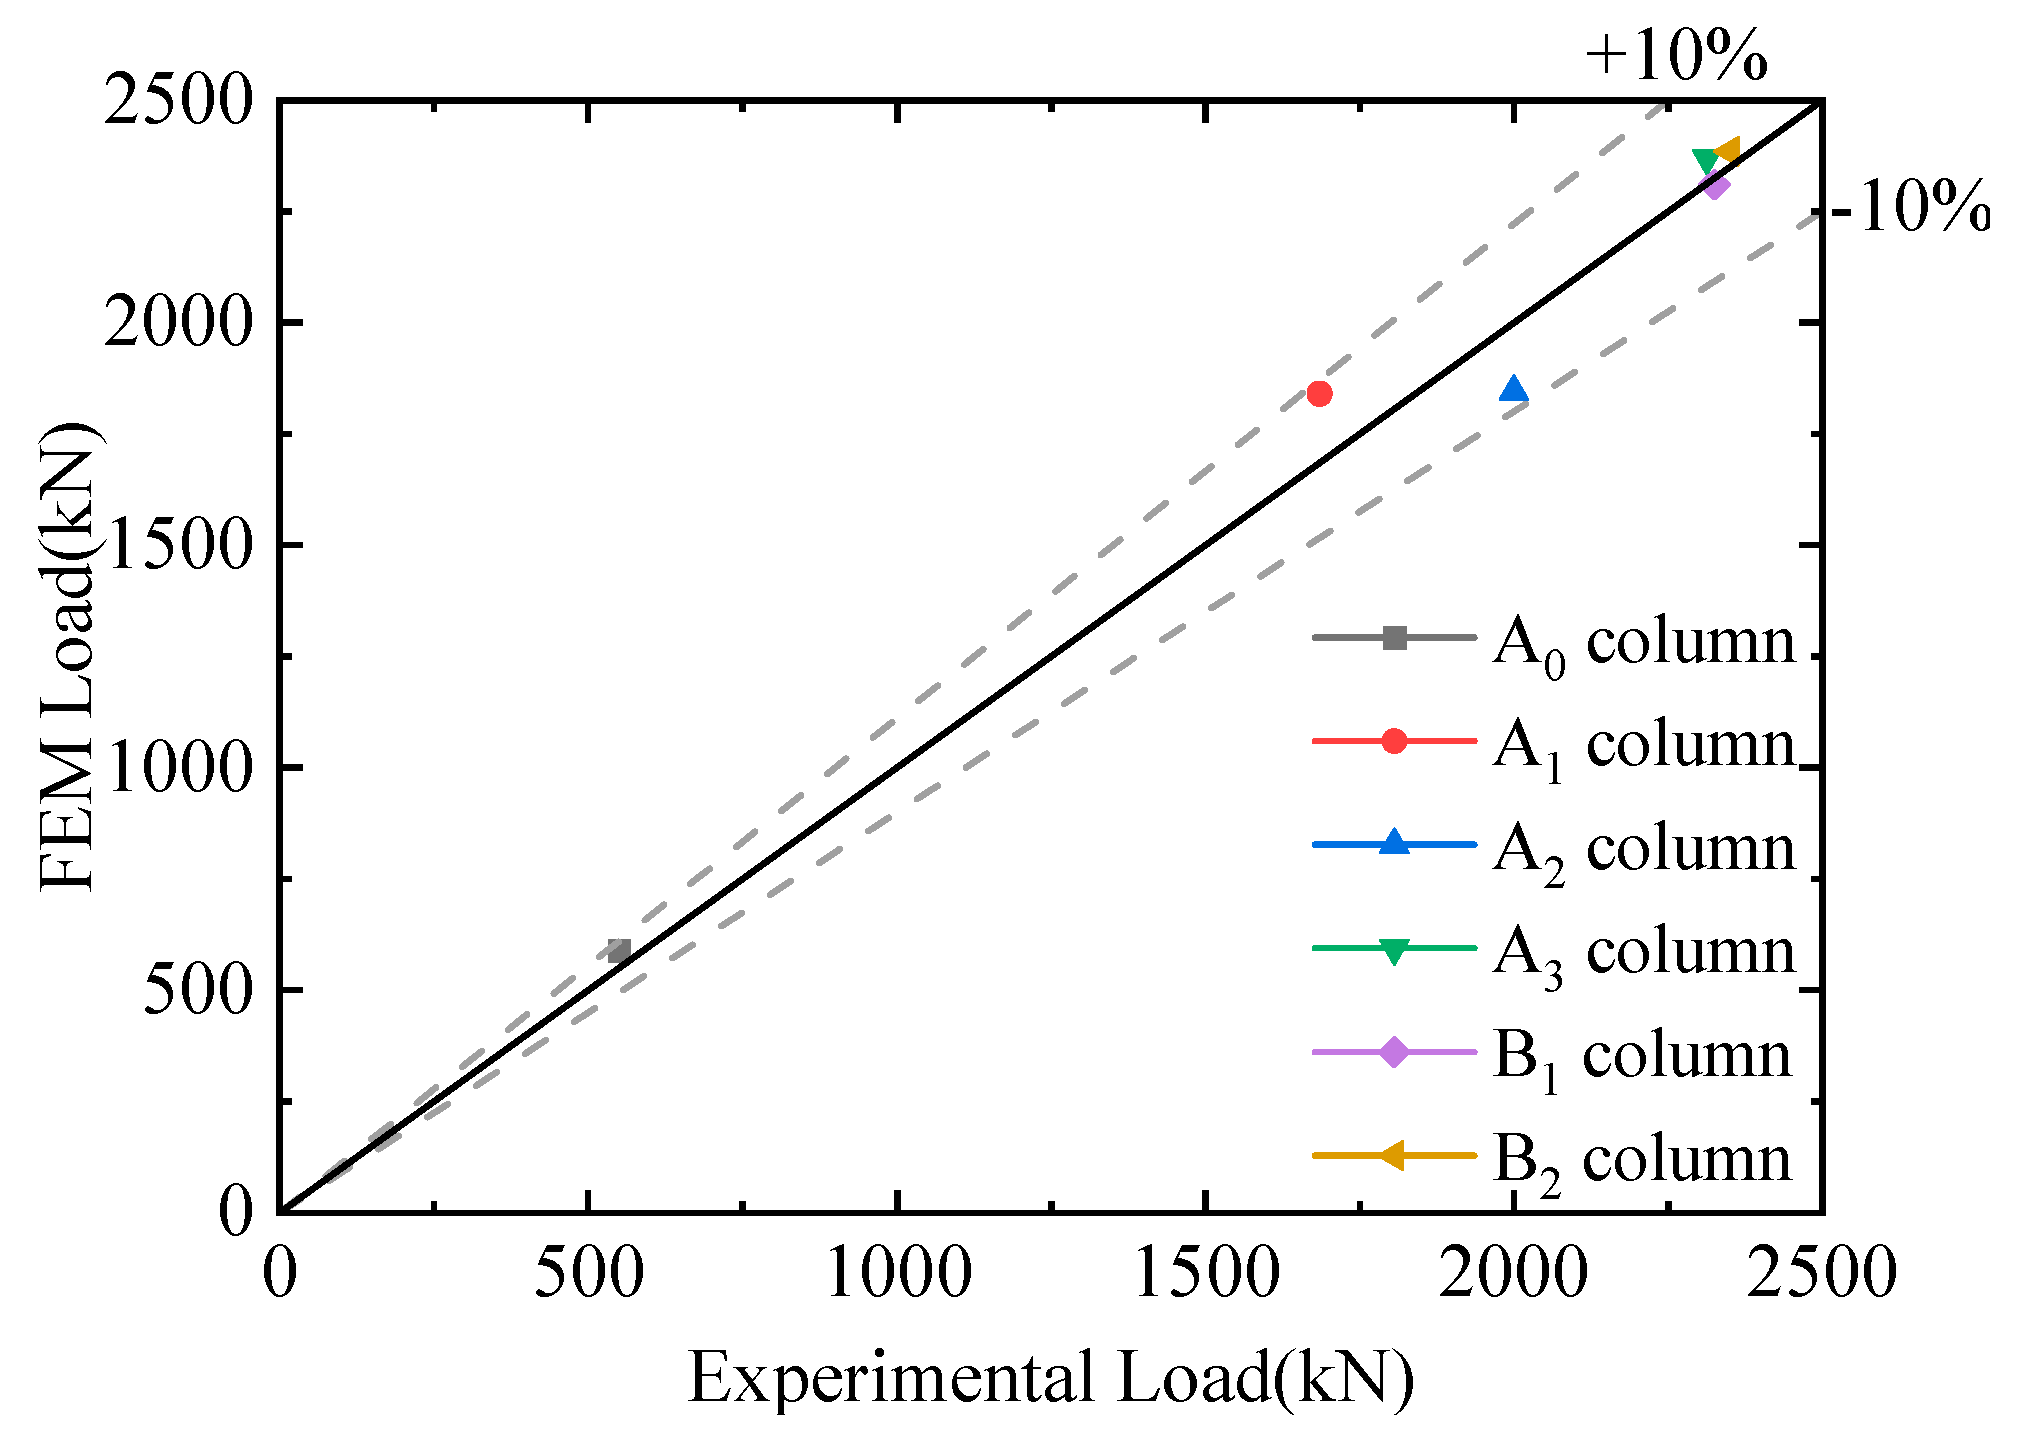
3.2.3. Error Analysis of Axial Compressive Bearing Capacity

The error between the experimental and simulated values of the column’s axial compressive bearing capacity is shown in Figure 13. As depicted, the error for all columns is within 10%, indicating good agreement between the simulation and the experimental results. Notably, the error for columns strengthened with LAASC is relatively small, at approximately 2%.

3.3. Simulation Results and Analysis of Small Eccentric Compression

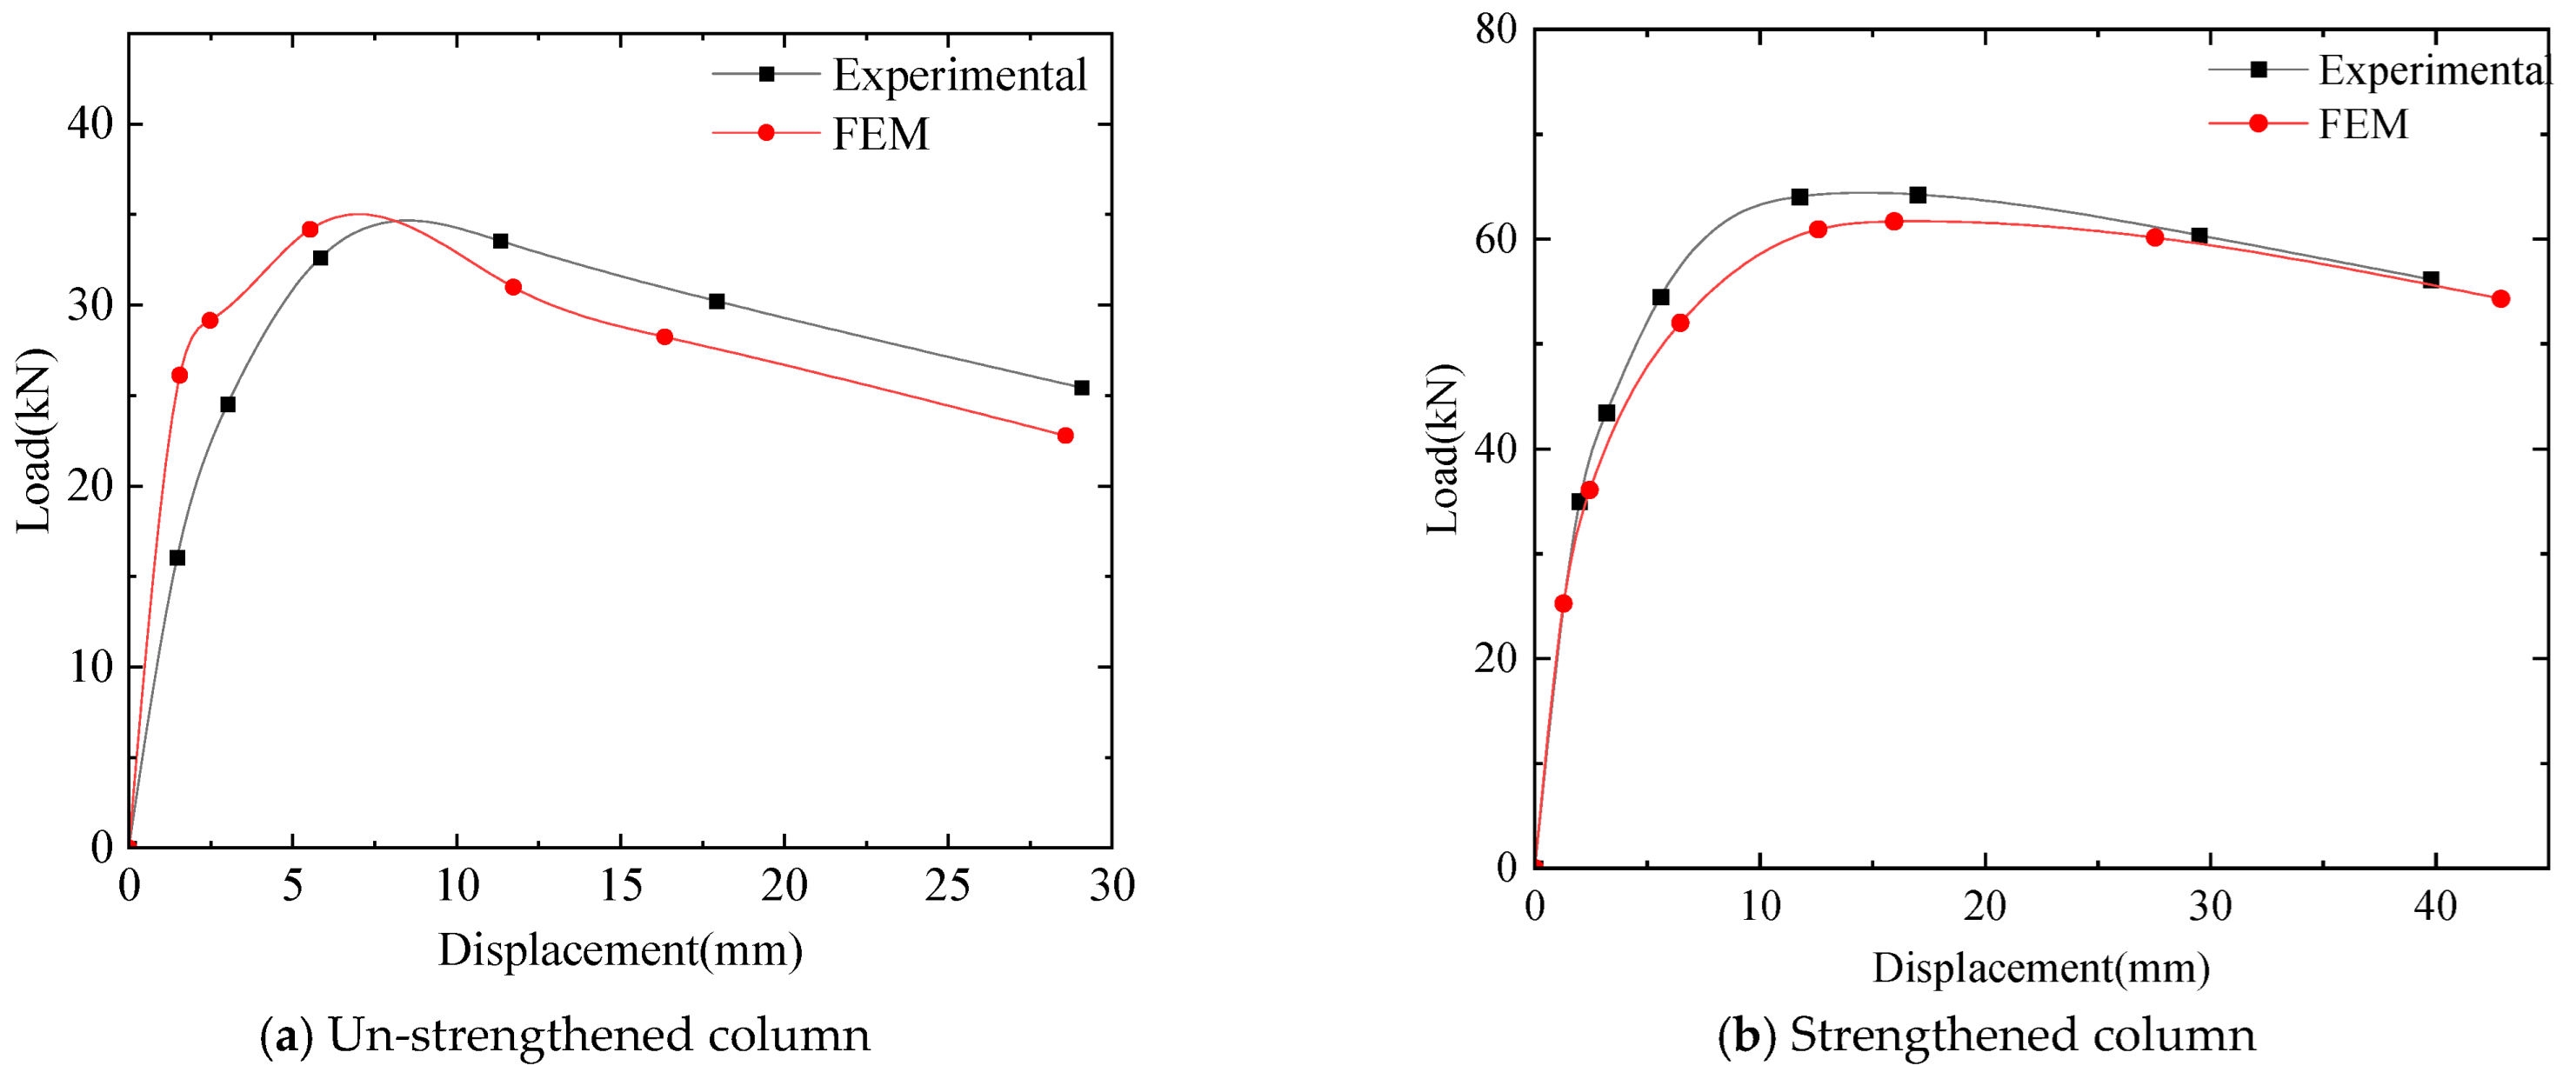
3.3.1. Validation of Small Eccentric Compression Model

To verify the accuracy of modeling and loading methods for small eccentric compression, this study cross-validated the modeling and loading methods against the column tests reported in reference [8]. Table 7 presents a comparison between the experimental results from the literature and the simulation results.
As indicated in Table 7, the differences between the simulated results and the experimental data for ultimate bearing capacity and lateral deflection at complete failure are all within 5%. This demonstrates that the modeling and loading methods employed in this study are highly accurate.

3.3.2. Typical Damage Modes of Strengthened Columns

In this section, the simulated damage modes of columns A0, A3, and B1 are analyzed and compared. These damage modes are illustrated in Figure 13. Under small eccentric compression, varying degrees of bending deformation occur in the columns. The un-strengthened columns exhibit the largest deformation amplitudes, and the concrete in the compression zone of all columns suffers severe damage.
As shown in Figure 14, under small eccentric compression, the strengthened columns exhibit separation between the encased steel and concrete strengthening layer in the compression zone. Additionally, the encased steel shows bulging deformation, resembling that caused by axial compression failure.

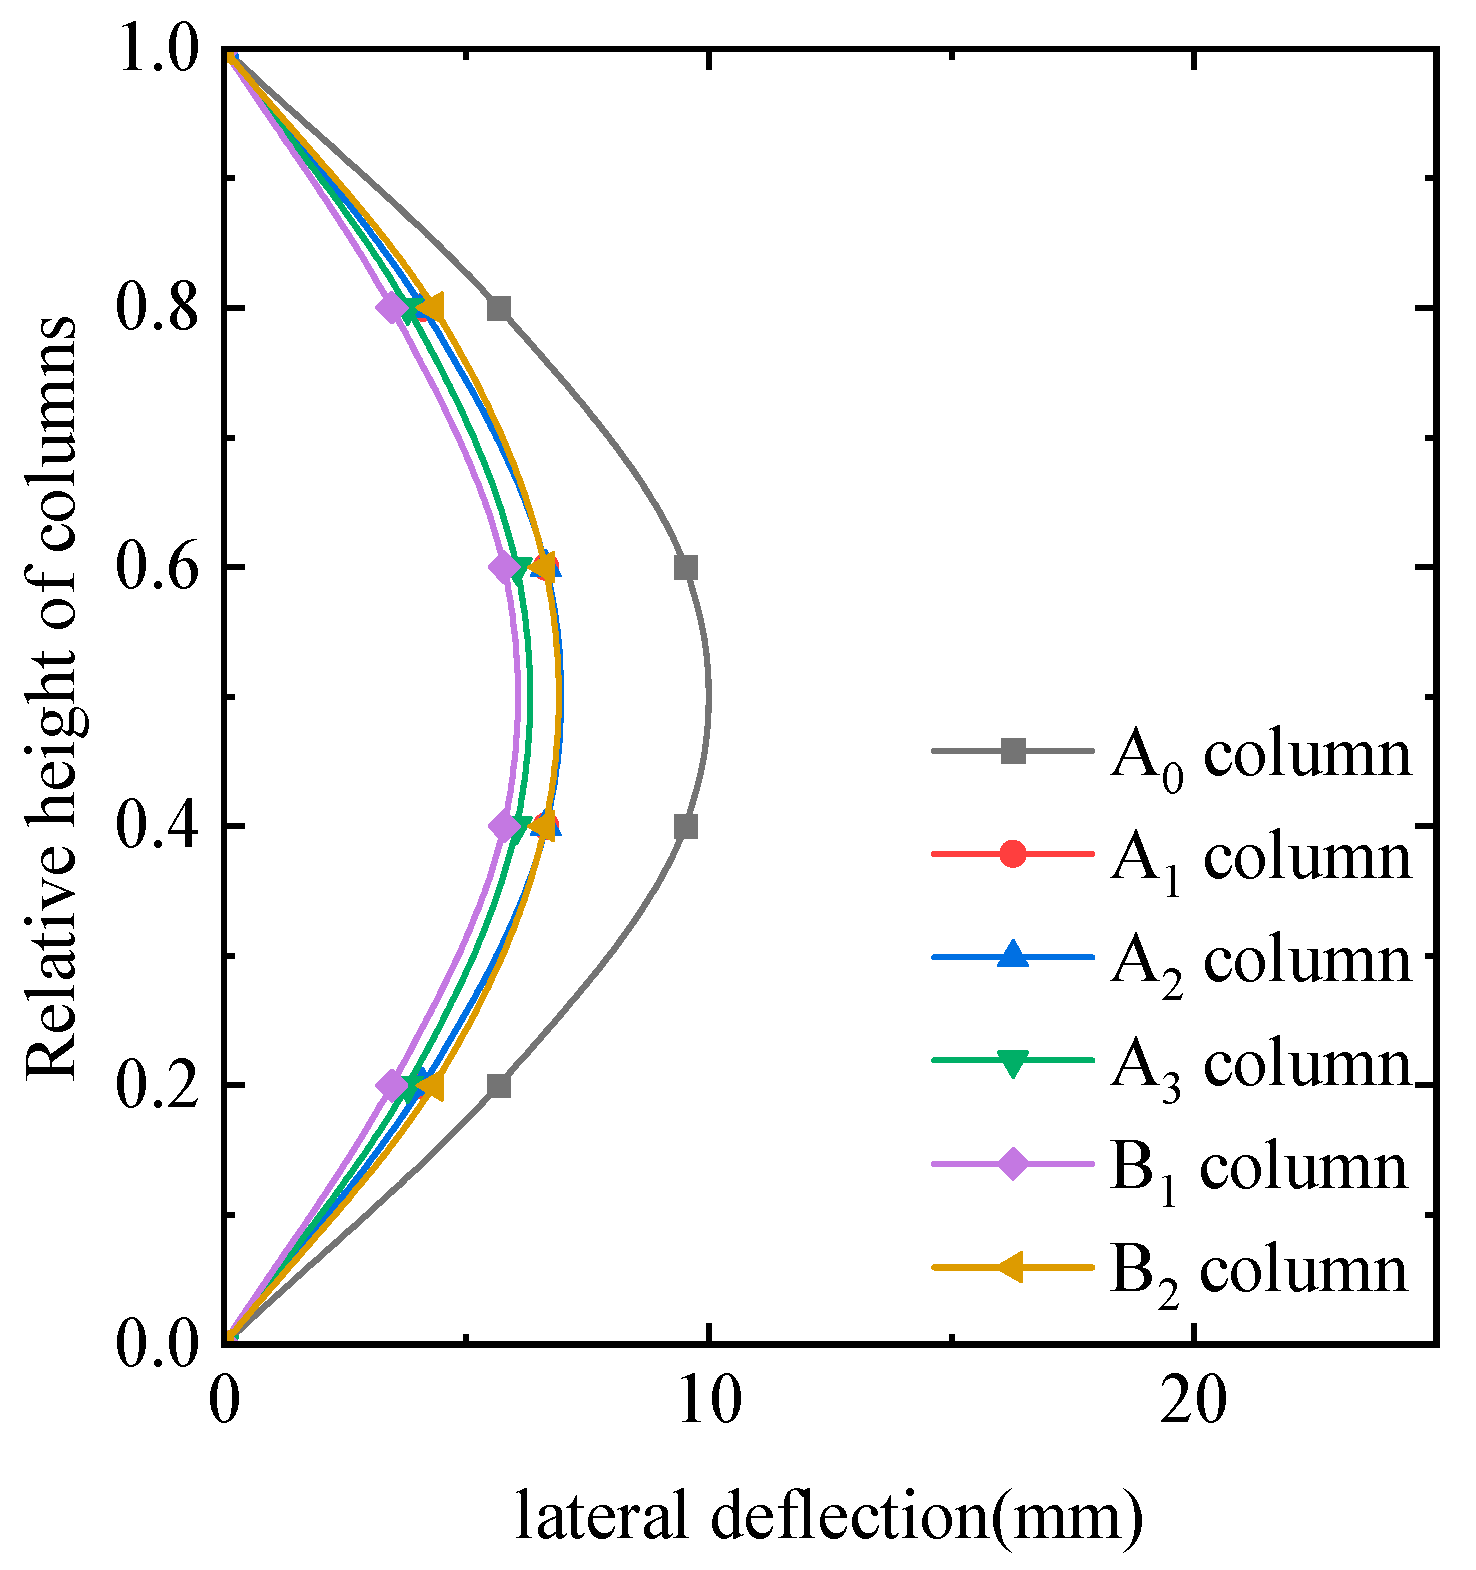
3.3.3. Comparison of Lateral Deflection Distribution Curves Along the Height of Column

Figure 15 shows the lateral deflection distribution curves of each column along the specimen height. The un-strengthened column exhibits the largest lateral deflection and most significant deformation. Column B1 has the smallest lateral deflection at only 60% of the un-strengthened column’s deflection. Despite having a smaller batten plate spacing than B1, column B2 shows a larger lateral deflection, indicating that the X-type batten plate’s diagonal angle affects the column’s diagonal bracing effect under eccentric compression.

3.3.4. Comparative Analysis of Ultimate Bearing Capacity

Table 8 compares the ultimate bearing capacities of each column under small eccentric compression. The un-strengthened column’s bearing capacity decreased by approximately 45% compared to axial compression. In contrast, the A3, B1, and B2 columns only experienced a 22% to 24% decrease, while the A1 and A2 columns saw a 28% to 32% reduction. As shown in Figure 15, the X-type batten plate configuration effectively enhances the column’s bearing capacity and structural stability. Moreover, LAASC demonstrates superior residual bearing capacity compared to ordinary concrete, making it suitable for further research on the seismic energy dissipation of strengthened columns.

3.4. Simulation Results and Analysis of Hysteresis Performance

3.4.1. Validation of Horizontal Reciprocating Loading Model

The axial compression simulation in Section 3.2.2 has verified the accuracy of each strengthening layer’s constitutive model. To further confirm the accuracy of the loading methods and interactions, this section conducted simulation verification on RC columns before and after the encased steel strengthening in reference [5]. Figure 15 shows the skeleton curve comparison.
As shown in Figure 16, the simulated data aligns well with the experimental results, with an error margin below 5%.

3.4.2. Skeleton Curve

After the horizontal reciprocating loading simulation, the skeleton curves of each column are presented in Figure 17. It is evident that the descending segment of the encased-steel-strengthened column is smoother, with less degradation in lateral force resistance [22]. As displacement increases, the strengthening layer progressively fails, causing the encased steel to begin peeling off, which results in a gradual reduction in the load.
From the skeleton curves of the A0 column, it is clear that the curves exhibit a stepped decrease. This is attributed to the small cross-sectional area of the un-strengthened column. The expansion of a single main crack can significantly reduce the effective bearing area proportion. For instance, a crack width of 0.5 mm in a 150 mm wide section has a much greater relative impact than in a 300 mm wide section, leading to a sudden load drop. The minor fluctuations in subsequent bearing capacity primarily depend on the plastic deformation of the longitudinal reinforcement to dissipate energy.

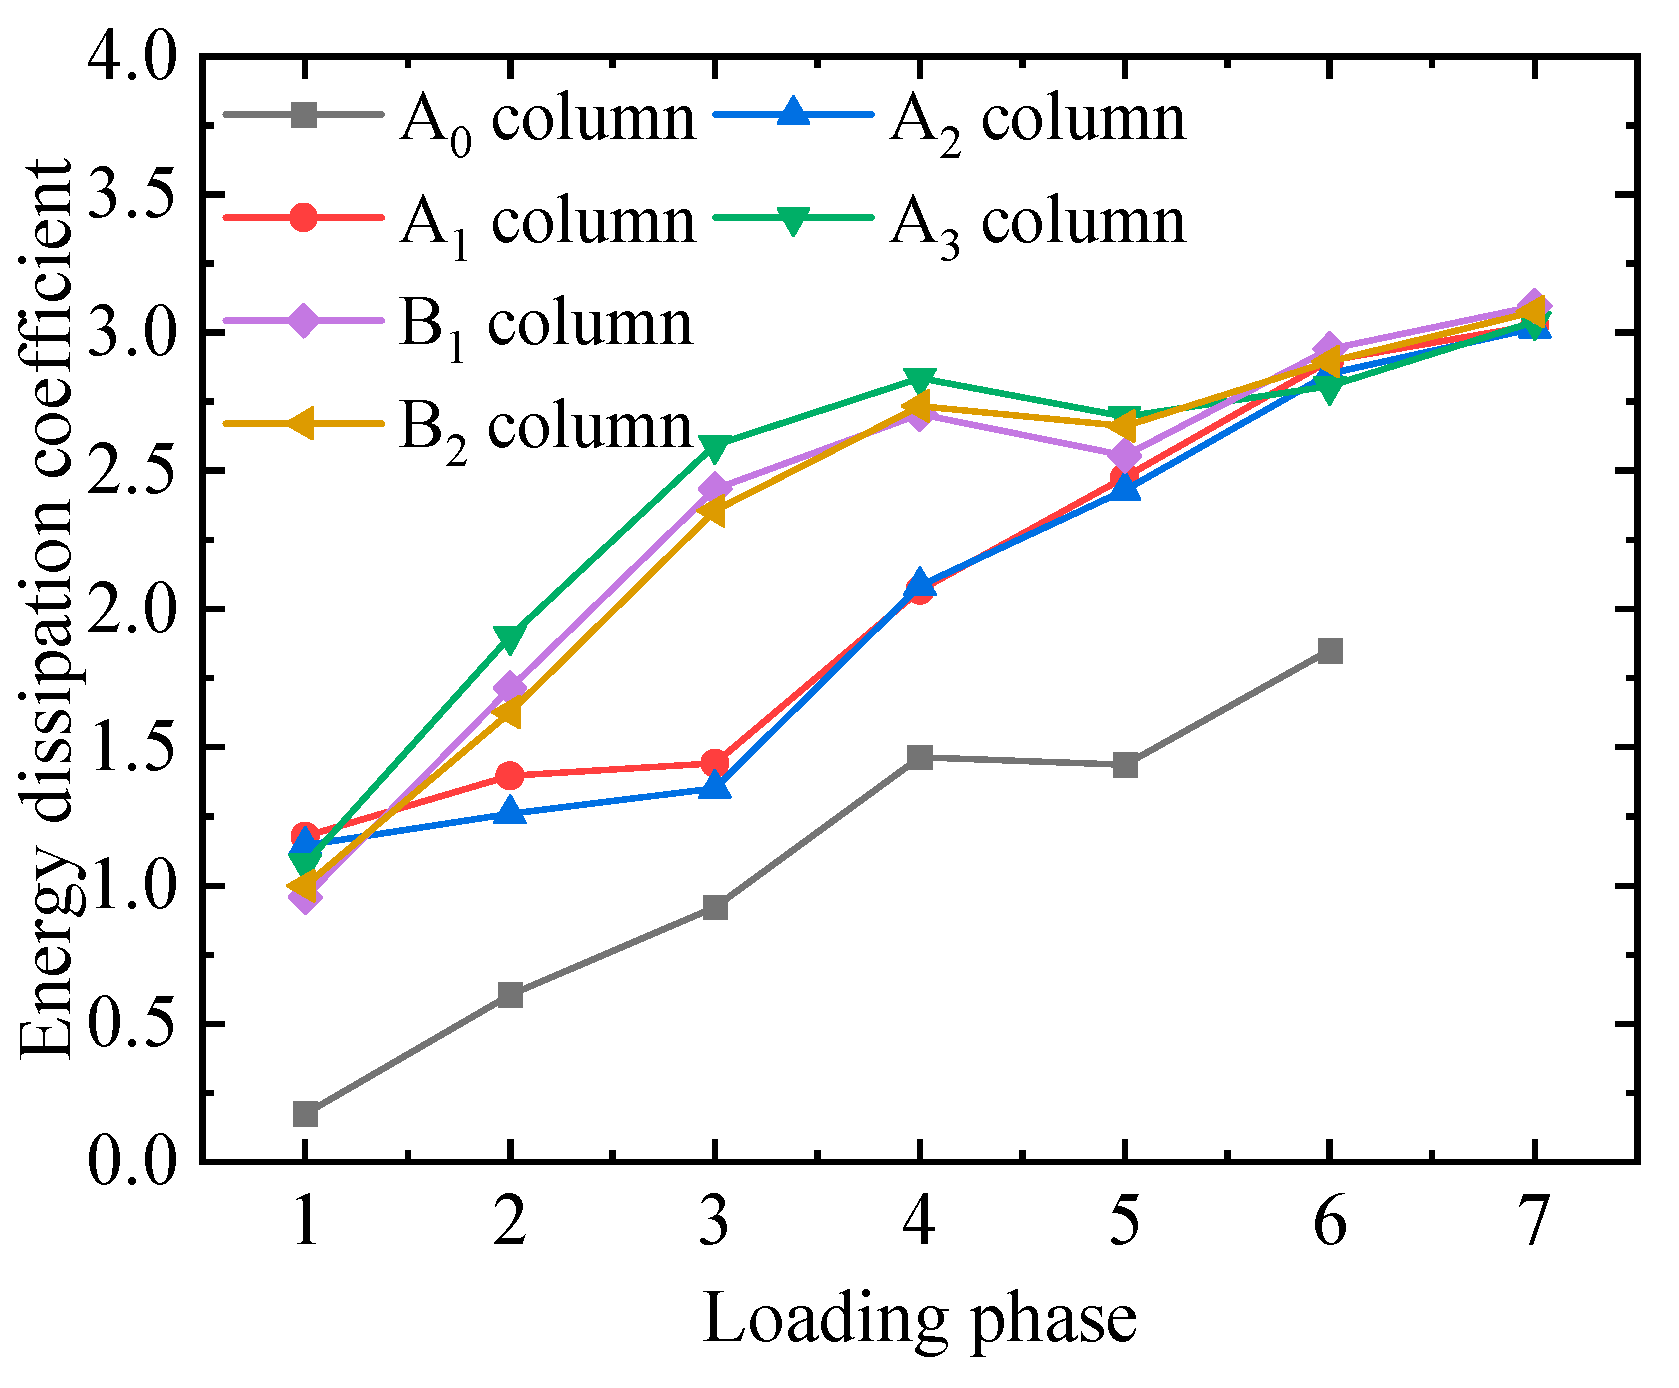
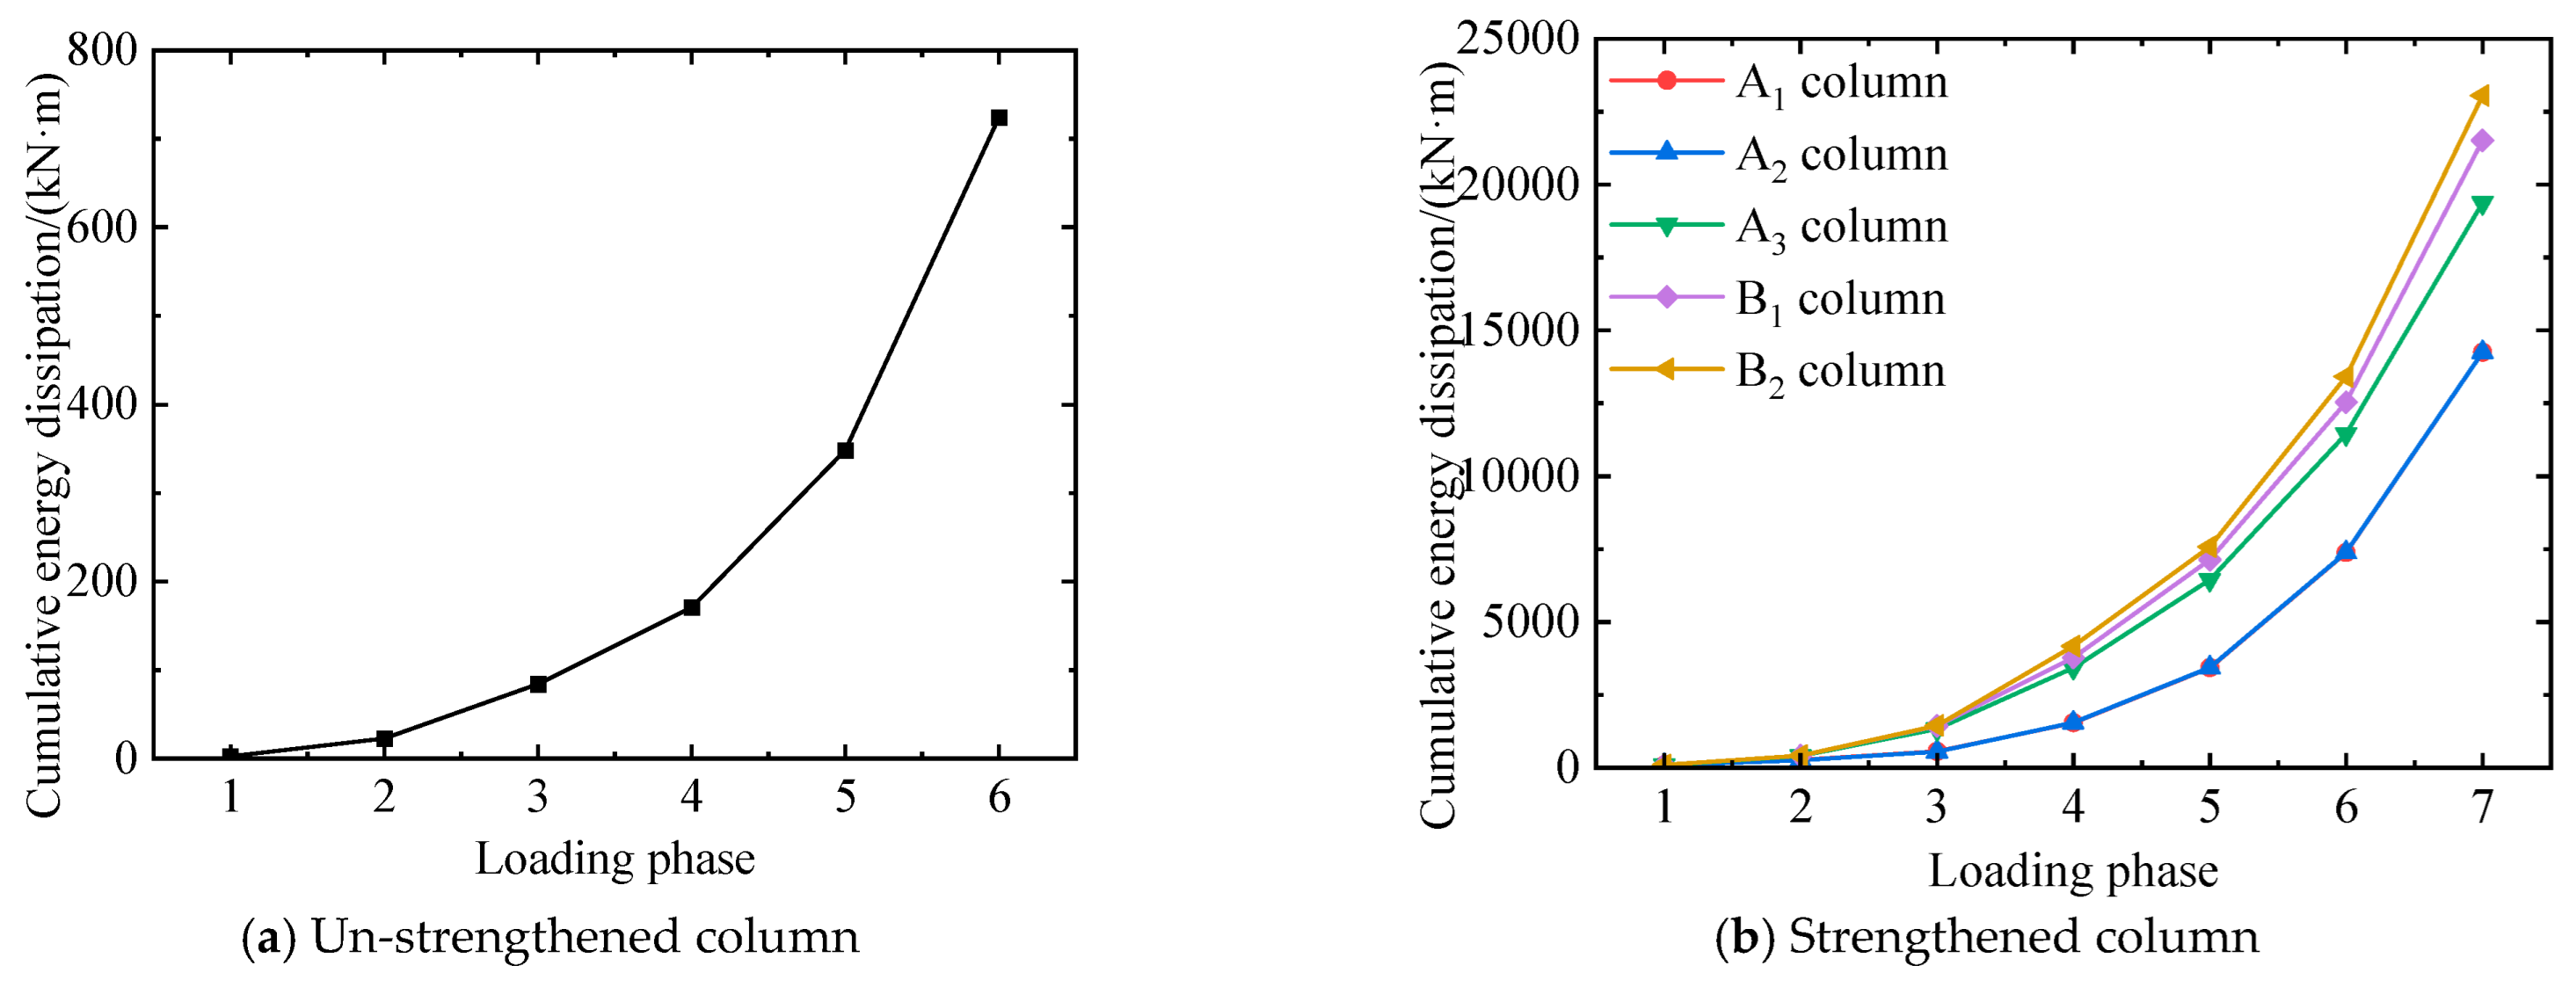
3.4.3. Energy Dissipation Coefficient and Cumulative Energy Dissipation

There are usually two methods for evaluating the energy consumption of hysteresis performance tests: the energy dissipation coefficient for assessing energy efficiency and the cumulative energy dissipation based on total energy dissipation. The cumulative energy dissipation is high, but the energy dissipation coefficient may not be large, and vice versa [23,24]. Consequently, this study conducts a comprehensive evaluation of these two indicators. Figure 18 compares the energy dissipation coefficients. When the un-strengthened column undergoes second-level displacement loading, its energy dissipation coefficient increases rapidly. This indicates the onset of plastic energy dissipation, where concrete failure, steel bar slip, and hardening collectively offset the energy from reciprocating loading.
The energy dissipation coefficient of columns strengthened with LAASC increases rapidly, mainly attributed to LAASC’s good ductility. In contrast, other strengthened columns, with brittle strengthening materials, exhibit a slow increase in the energy dissipation coefficient. However, in the later stages, energy dissipation can also be enhanced through structural plastic deformation.
Figure 19 shows the cumulative energy consumption of each column. The total energy consumption of columns B1 and B2 is similar and is approximately 15% to 30% higher than that of column A3, indicating that the advantages of the X-type batten plate structure are significant.

4. Conclusions

This article proposes a new type of composite-strengthened column form that combines a lightweight strengthening layer with X-type encased steel to reduce the self-weight of the strengthened building and enhance its seismic strengthening capability. By conducting axial compression tests and extended numerical simulations on six columns, the following conclusions are drawn:
(1)
The LAASC lightweight strengthening material proposed in this study has a density of only 1850 kg/m3, representing a 25% weight reduction compared to conventional concrete. Under the same encased steel form, columns using the LAASC strengthening layer achieve an axial compressive bearing capacity of 2312.5 kN, which is 37% higher than that of columns with ordinary concrete strengthening layers. Notably, even if the LAASC strengthening layer shows cracking damage, there will be no significant fragments falling off, and it demonstrates superior ductility.
(2)
The improved simplified formula for the axial compressive bearing capacity of the proposed encased-steel composite-strengthened columns in this study achieves error control within 5% between the calculated and experimental values, demonstrating effective applicability to engineering practice. In addition, the X-type encased steel strengthening method and its formula are not only applicable to square section columns but also to rectangular section columns.
(3)
When performing axial compression simulation analysis of strengthened columns using ABAQUS finite element software, the difference between the simulated values and experimental values of columns A1 and A2 is the largest but still remains within 10%. Among them, column B1 shows the smallest error of only 0.5%. Furthermore, simulation results under small eccentric compression indicate that the new-type composite-strengthened columns can effectively control flexural deformation when resisting small eccentric loading, reducing lateral deflection by 30% to 35%, and their bearing capacity only decreases by 22% to 24% compared to axial compression.
(4)
Under horizontal reciprocating loading, column A3, featuring the LAASC strengthening layer, demonstrates a substantial increase in cumulative energy dissipation, with a 35.7% improvement compared to columns A1 and A2. This highlights that LAASC surpasses traditional concrete in energy dissipation during deformation. Notably, despite column B1 having a batten plate spacing double that of column A3, the diagonal bracing effect of its X-type batten plate is pronounced, making for a 13.1% increase in total energy dissipation relative to column A3.
(5)
Although the proposed X-type encased steel strengthening form has better lateral performance than the traditional encased steel strengthening form, its complex details make it difficult to apply in practical engineering. Meanwhile, higher precision is also required during the manufacturing process.

Author Contributions

Conceptualization, J.Z. and X.H.; Methodology, J.Z. and X.H.; Software, Z.W.; Validation, Z.W. and Y.L. (Yuankai Li); Data curation, Z.W.; Writing—original draft preparation, Z.W.; Writing—review and editing, Y.L. (Yuankai Li) and Y.L. (Yiqi Lu); Visualization, Z.W.; supervision, X.H.; Project administration, J.Z.; Funding acquisition, Y.L. (Yiqi Lu). All authors have read and agreed to the published version of the manuscript.

Funding

This research was funded by the National General Project of Innovation and Entrepreneurship Training Program of Harbin University of Science and Technology (202310214108S).

Data Availability Statement

Data are contained within the article.

Conflicts of Interest

The authors declare no conflicts of interest.

References

  1. Wan, M.; Han, J. Strengthen of Concrete Structures; China Architecture & Building Press: Beijing, China, 1995; pp. 88–135. [Google Scholar]
  2. Rochette, P.; Labossiere, P. Axial Testing of Rectangular Column Models Confined with Composites. J. Compos. Constr. 2000, 4, 129–136. [Google Scholar] [CrossRef]
  3. Priestley, M.J.N.; Seible, F. Design of Seismic Retrofit Measures for Concrete and Masonry Structures. Constr. Build. Mater. 1995, 9, 365–377. [Google Scholar] [CrossRef]
  4. Alhoubi, Y.; El Refai, A.; Abed, F.; El-Maaddawy, T.; Tello, N. Strengthening Pre-Damaged RC Square Columns with Fabric-Reinforced Cementitious Matrix (FRCM): Experimental Investigation. Compos. Struct. 2022, 294, 115784. [Google Scholar] [CrossRef]
  5. Qi, Y.; Zhu, H.; Xu, Y.; Xiao, Z.; Jin, Z. Axial Compression Performance of L-Shaped Partially Encased Steel-Concrete Composite Stub Columns. Buildings 2024, 14, 3001. [Google Scholar] [CrossRef]
  6. Wu, H.; Yang, H.; Hu, Q.; Luo, Z.; Wang, T. Bearing Capacity of RC Columns Strengthened with Self-Compacting Concrete Filled with Steel. Concrete 2019, 12, 181–185. (In Chinese) [Google Scholar]
  7. Sun, Y.; Wang, T.; Yang, W. Calculation of Axial Compressive Bearing Capacity and Mechanical Properties of Composite Reinforced Concrete Columns. Earthq. Res. Eng. Retrofit. 2022, 44, 127–135. (In Chinese) [Google Scholar]
  8. Feng, S.; Zhu, J.; Wang, R.; Qu, Z.; Song, L.; Wang, H. The Influence of CaO and MgO on the Mechanical Properties of Alkali-Activated Blast Furnace Slag Powder. Materials 2022, 15, 6128. [Google Scholar] [CrossRef] [PubMed]
  9. GB 50367-2013; Code for Design of Concrete Structure Strengthening. Ministry of Housing and Urban-Rural Development: Beijing, China, 2013.
  10. Wang, X.; Cheng, C.; Wang, S.; Wang, W. Study on the Flexural Behavior of the Concrete Filled Square Steel Tube Beam with the Basic Magnesium Sulfate Cement-Based Composite Shell System. Constr. Build. Mater. 2024, 424, 135968. [Google Scholar] [CrossRef]
  11. Lu, Y.; Shi, J.; Huang, Y. Bearing Capacity Calculation Method for Axially Compressed RC Columns Strengthened with Angle Steel. Chin. J. Appl. Mech. 2008, 25, 719–723+743. (In Chinese) [Google Scholar]
  12. GB/T 50010-2010; Design Standards for Concrete Structures. Ministry of Housing and Urban-Rural Development: Beijing, China, 2010.
  13. Zhao, D. Experimental Study and Numerical Simulation on Damage Behavior of Concrete Short Columns Strengthened with HDC Under Small Eccentric Compression; Xi’an University of Science and Technology: Xi’an, China, 2022. (In Chinese) [Google Scholar]
  14. Guo, J.; Sun, L.; Zhao, H.; Hu, X. Seismic Behavior of Composite Beam to Concrete-Filled Cold-Formed High-Strength Square Steel Tubular Column Joints with Different Connection Forms. Buildings 2025, 15, 622. [Google Scholar] [CrossRef]
  15. Hu, Q.; Jia, S.; Kuang, Z.; Wu, H.; Zhang, J.; Yang, H. Experimental Research on Seismic Performance of Concrete Column Jointly Reinforced with Self-Compacting Concrete and Angle Steel. Build. Struct. 2021, 51, 92–103. (In Chinese) [Google Scholar]
  16. Kurosawa, R.; Sakata, H.; Qu, Z.; Suyama, T. Precast Prestressed Concrete Frames for Seismically Retrofitting Existing RC Frames. Eng. Struct. 2019, 184, 345–354. [Google Scholar] [CrossRef]
  17. Thomas, R.J.; Peethamparan, S. Alkali-Activated Concrete: Engineering Properties and Stress-Strain Behavior. Constr. Build. Mater. 2015, 93, 49–56. [Google Scholar] [CrossRef]
  18. Cao, Y. Numerical Analysis of Seismic Behavior of Polypropylene Fiber Concrete Beam-Column Joints; Xinjiang University: Urumqi, China, 2020. (In Chinese) [Google Scholar]
  19. Yang, X.; Dong, Y.; Liu, X.; Qiu, T.; Zhou, J. Seismic Behavior of Concrete Beam-Column Joints Reinforced with Steel-Jacketed Grouting. Buildings 2024, 14, 3239. [Google Scholar] [CrossRef]
  20. Tao, Z.; Wang, Z.-B.; Yu, Q. Finite Element Modelling of Concrete-Filled Steel Stub Columns under Axial Compression. J. Constr. Steel Res. 2013, 89, 121–131. [Google Scholar] [CrossRef]
  21. Yang, K.; Lu, T.; Li, J.; Lou, H. Experimental Research on the Seismic Ductility Performance of Wavy Web PEC Beams. Buildings 2024, 14, 3101. [Google Scholar] [CrossRef]
  22. Dou, L.; Huang, Z.; Liu, Y.; Wang, Y.; Zhao, L. Experimental Investigation on the Seismic Performance of Novel Prefabricated Composite RC Shear Walls with Concrete-Filled Steel Tube Frame. Buildings 2024, 14, 2673. [Google Scholar] [CrossRef]
  23. Liu, J.; Yu, W.; Fang, Y.; Pan, Z.; Cao, G. Finite Element Analysis on the Seismic Performance of Concrete-Filled Steel Tube Columns with a Multiple-Chamber Round-Ended Cross-Section. Buildings 2024, 14, 1154. [Google Scholar] [CrossRef]
  24. Xu, Q.; Liu, Y.; Wang, J. Seismic Performance of Cross-Shaped Partially Encased Steel-Concrete Composite Columns: Experimental and Numerical Investigations. Buildings 2024, 14, 1932. [Google Scholar] [CrossRef]
Figure 1. Dimensioning and reinforcement drawings for column modeling.
Buildings 15 01692 g001
Figure 2. Strengthened column pouring diagram.
Buildings 15 01692 g002
Figure 3. The axial compression loading process of the column.
Buildings 15 01692 g003
Figure 4. Damage patterns of columns.
Buildings 15 01692 g004
Figure 5. Axial compressive load–strain curves of columns with different strengthening layers.
Buildings 15 01692 g005
Figure 6. Axial compression load–strain curves of columns with different forms of encased steel.
Buildings 15 01692 g006
Figure 7. RC columns strengthened with encased steel only.
Buildings 15 01692 g007
Figure 8. Bilinear model for steel.
Buildings 15 01692 g008
Figure 9. Clough constitutive model.
Buildings 15 01692 g009
Figure 10. Comparison of stress–strain curves for LAASC standard prisms.
Buildings 15 01692 g010
Figure 11. Damage mode diagram of B1 column.
Buildings 15 01692 g011
Figure 12. Comparison of axial load–strain curves.
Buildings 15 01692 g012
Figure 13. Error of axial compressive load capacity test value and simulated value.
Buildings 15 01692 g013
Figure 14. Small eccentric compression damage mode of columns.
Buildings 15 01692 g014
Figure 15. Comparison of lateral deflection distribution curves along the height of column.
Buildings 15 01692 g015
Figure 16. Comparison of skeleton curves.
Buildings 15 01692 g016
Figure 17. Skeleton curve.
Buildings 15 01692 g017
Figure 18. Energy dissipation coefficient.
Buildings 15 01692 g018
Figure 19. Cumulative energy dissipation.
Buildings 15 01692 g019
Table 1. Parametrization of columns.
Column NumberSection Size/mm2Angle Steel Size/mmThickness of Batten Plate/mmForms of Steel CladdingConcrete Strengthening Layer
A0150 × 150\\\\
A1250 × 250∟30 ×30 × 33Horizontal batten plateC40
A2250 × 250∟30 ×30 × 33Horizontal batten plateBMSCC
A3250 × 250∟30 ×30 × 33Horizontal batten plateLAASC
B1250 × 250∟30 ×30 × 33X-1 type batten plateLAASC
B2250 × 250∟30 ×30 × 33X-2 type batten plateLAASC
Table 2. Steel mechanical properties (MPa).
ComponentfyfuEs
Longitudinal reinforcement376551196,000
Hoop reinforcement254377196,000
Encased steel248373196,000
fy refers to the yield strength of steel; fu refers to the ultimate tensile strength of steel; ES refers to the elastic modulus of steel.
Table 3. BMSCC mixing ratio (kg/m3).
MgOCitric AcidMagnesium Sulfate HeptahydrateRiver SandWater
596.76.0331.31492.0360.0
Table 4. LAASC mixing ratio (kg/m3).
Slag PowderSilica FumeFly AshHollow Glass MicrospheresWater GlassNaOHQuartz SandWater
746.7106.7213.480.0198.749.3533.3330.7
LAASC is blended with polypropylene fibers at a volume fraction of 0.1%.
Table 5. Mechanical property test of strengthening layer.
Column Numberfcu1/MPafcu2/MPaρ/(kg/m3)
A031.5//
A131.540.52500
A231.541.51960
A331.581.81850
B131.581.81850
B231.581.81850
fcu1 refers to the compressive strength of the original column concrete cube, fcu2 refers to the compressive strength of the strengthening layer material cube, and ρ is the strengthening layer material density.
Table 6. Comparison of axial compression bearing capacity experimental and calculation results.
Column TypeNexp/kNNfem/kNNexp/NfemNg/kNNexp/Ng
A0 column550.0590.00.93543.41.01
Only strengthened with horizontal batten plate encased steel/762.0/741.31.03
Only strengthened with X-type batten plate encased steel/786.0/792.90.99
A1 column1685.01845.70.921645.51.02
A2 column2000.01845.71.081804.41.09
A3 column2312.52370.50.982216.31.04
B1 column2325.02331.60.992235.91.04
B2 column2350.02382.90.992283.31.03
Nexp is the experimental value; Nfem is the finite element simulation value; Ng is the calculated value of the formula. If there are no experimental values, the simulated values will be used as the reference.
Table 7. Validation of small eccentric compression model.
CategoryEccentricity Distance to Column Width RatioUltimate Bearing
Capacity/kN
Lateral Deflection During Complete Destruction/mm
Experimental1/557612.3
FEM1/556611.6
Table 8. Comparison of ultimate bearing capacity under small eccentric compression.
Column NumberUltimate Bearing Capacity/kNIncrease Times
A0330.3\
A11322.44.0
A21350.84.1
A31772.35.4
B11762.55.3
B21807.55.5
Disclaimer/Publisher’s Note: The statements, opinions and data contained in all publications are solely those of the individual author(s) and contributor(s) and not of MDPI and/or the editor(s). MDPI and/or the editor(s) disclaim responsibility for any injury to people or property resulting from any ideas, methods, instructions or products referred to in the content.

