
Simplified Design Procedure for RC Ribbed Slabs in Fire Based on Experimental and Numerical Thermal Analysis


Abstract
1. Introduction
2. Methods
2.1. Experimental Research
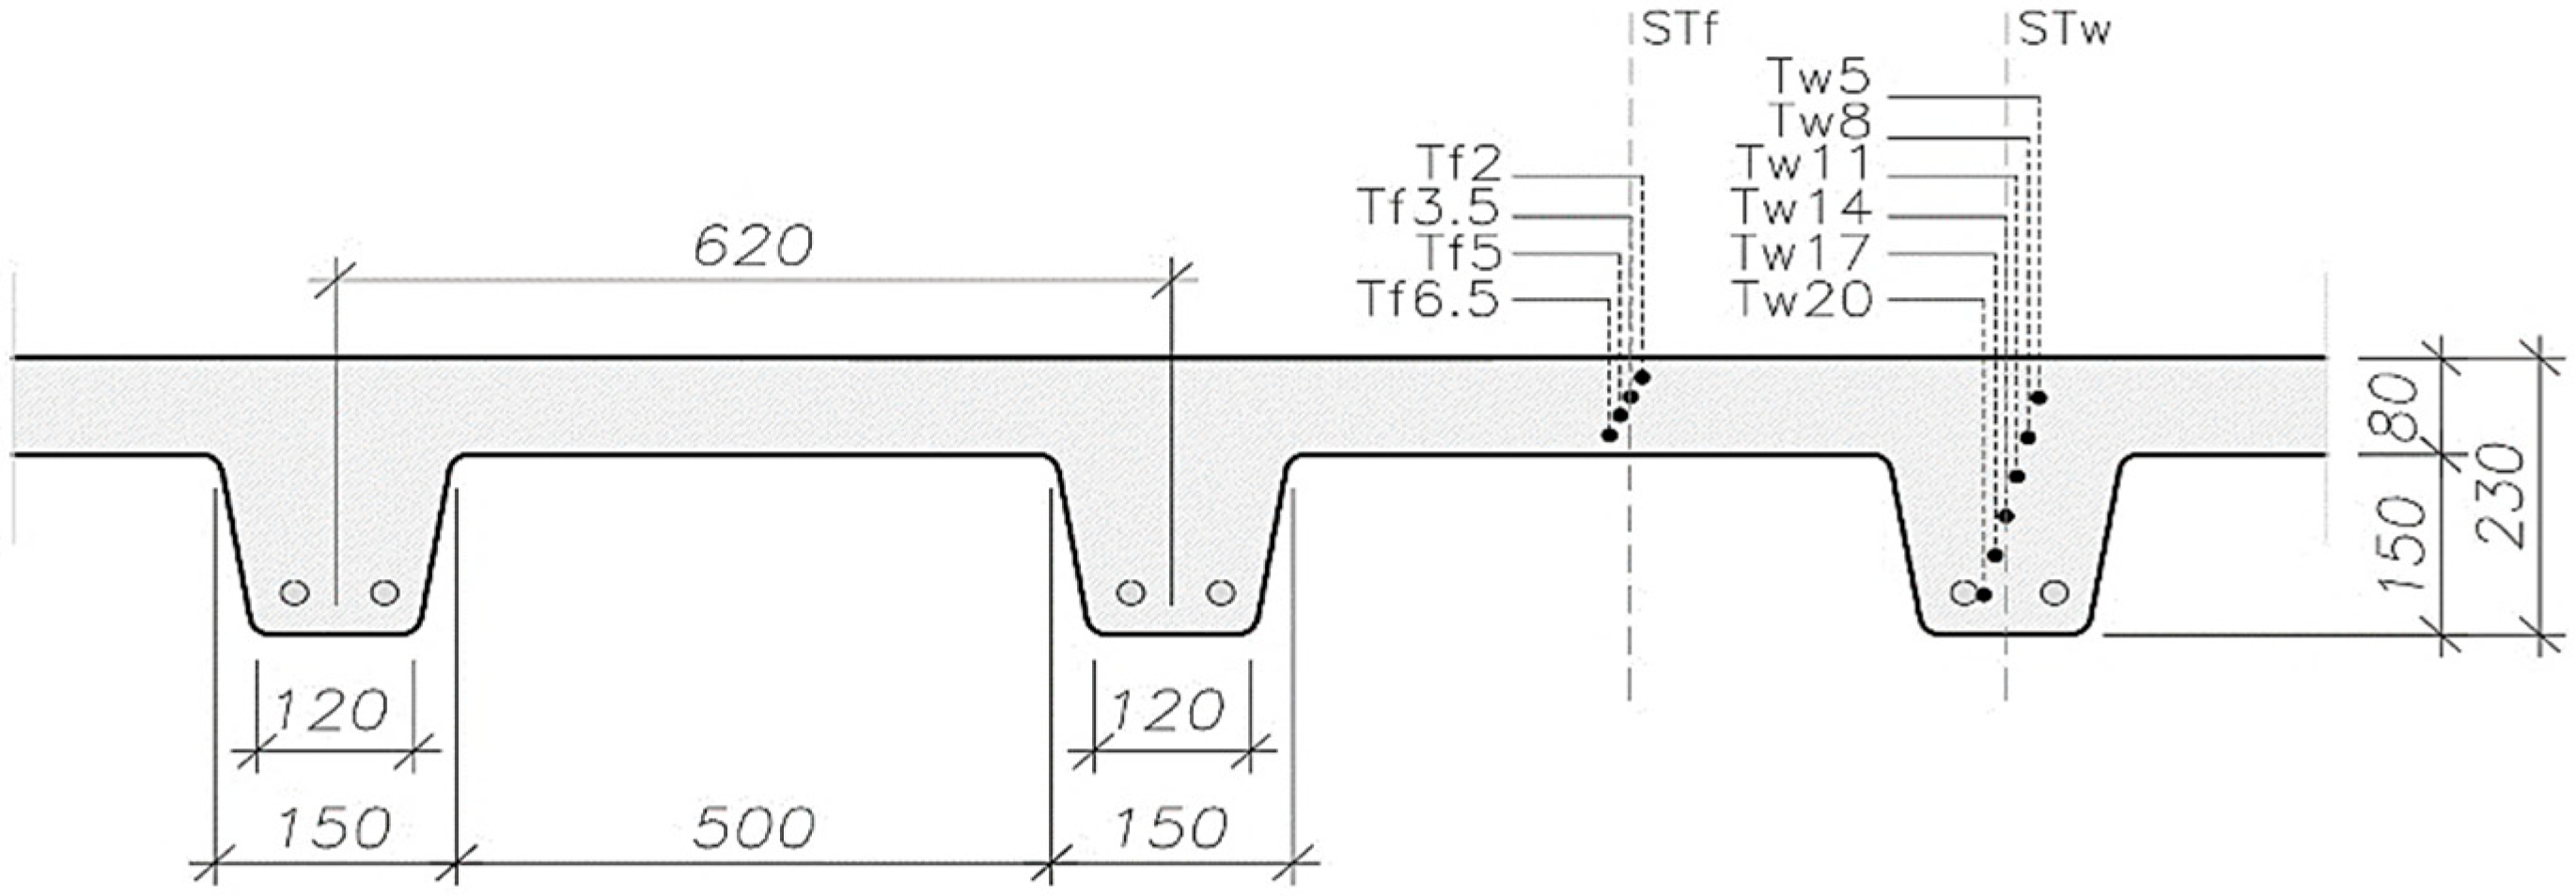
2.1.1. Specimens
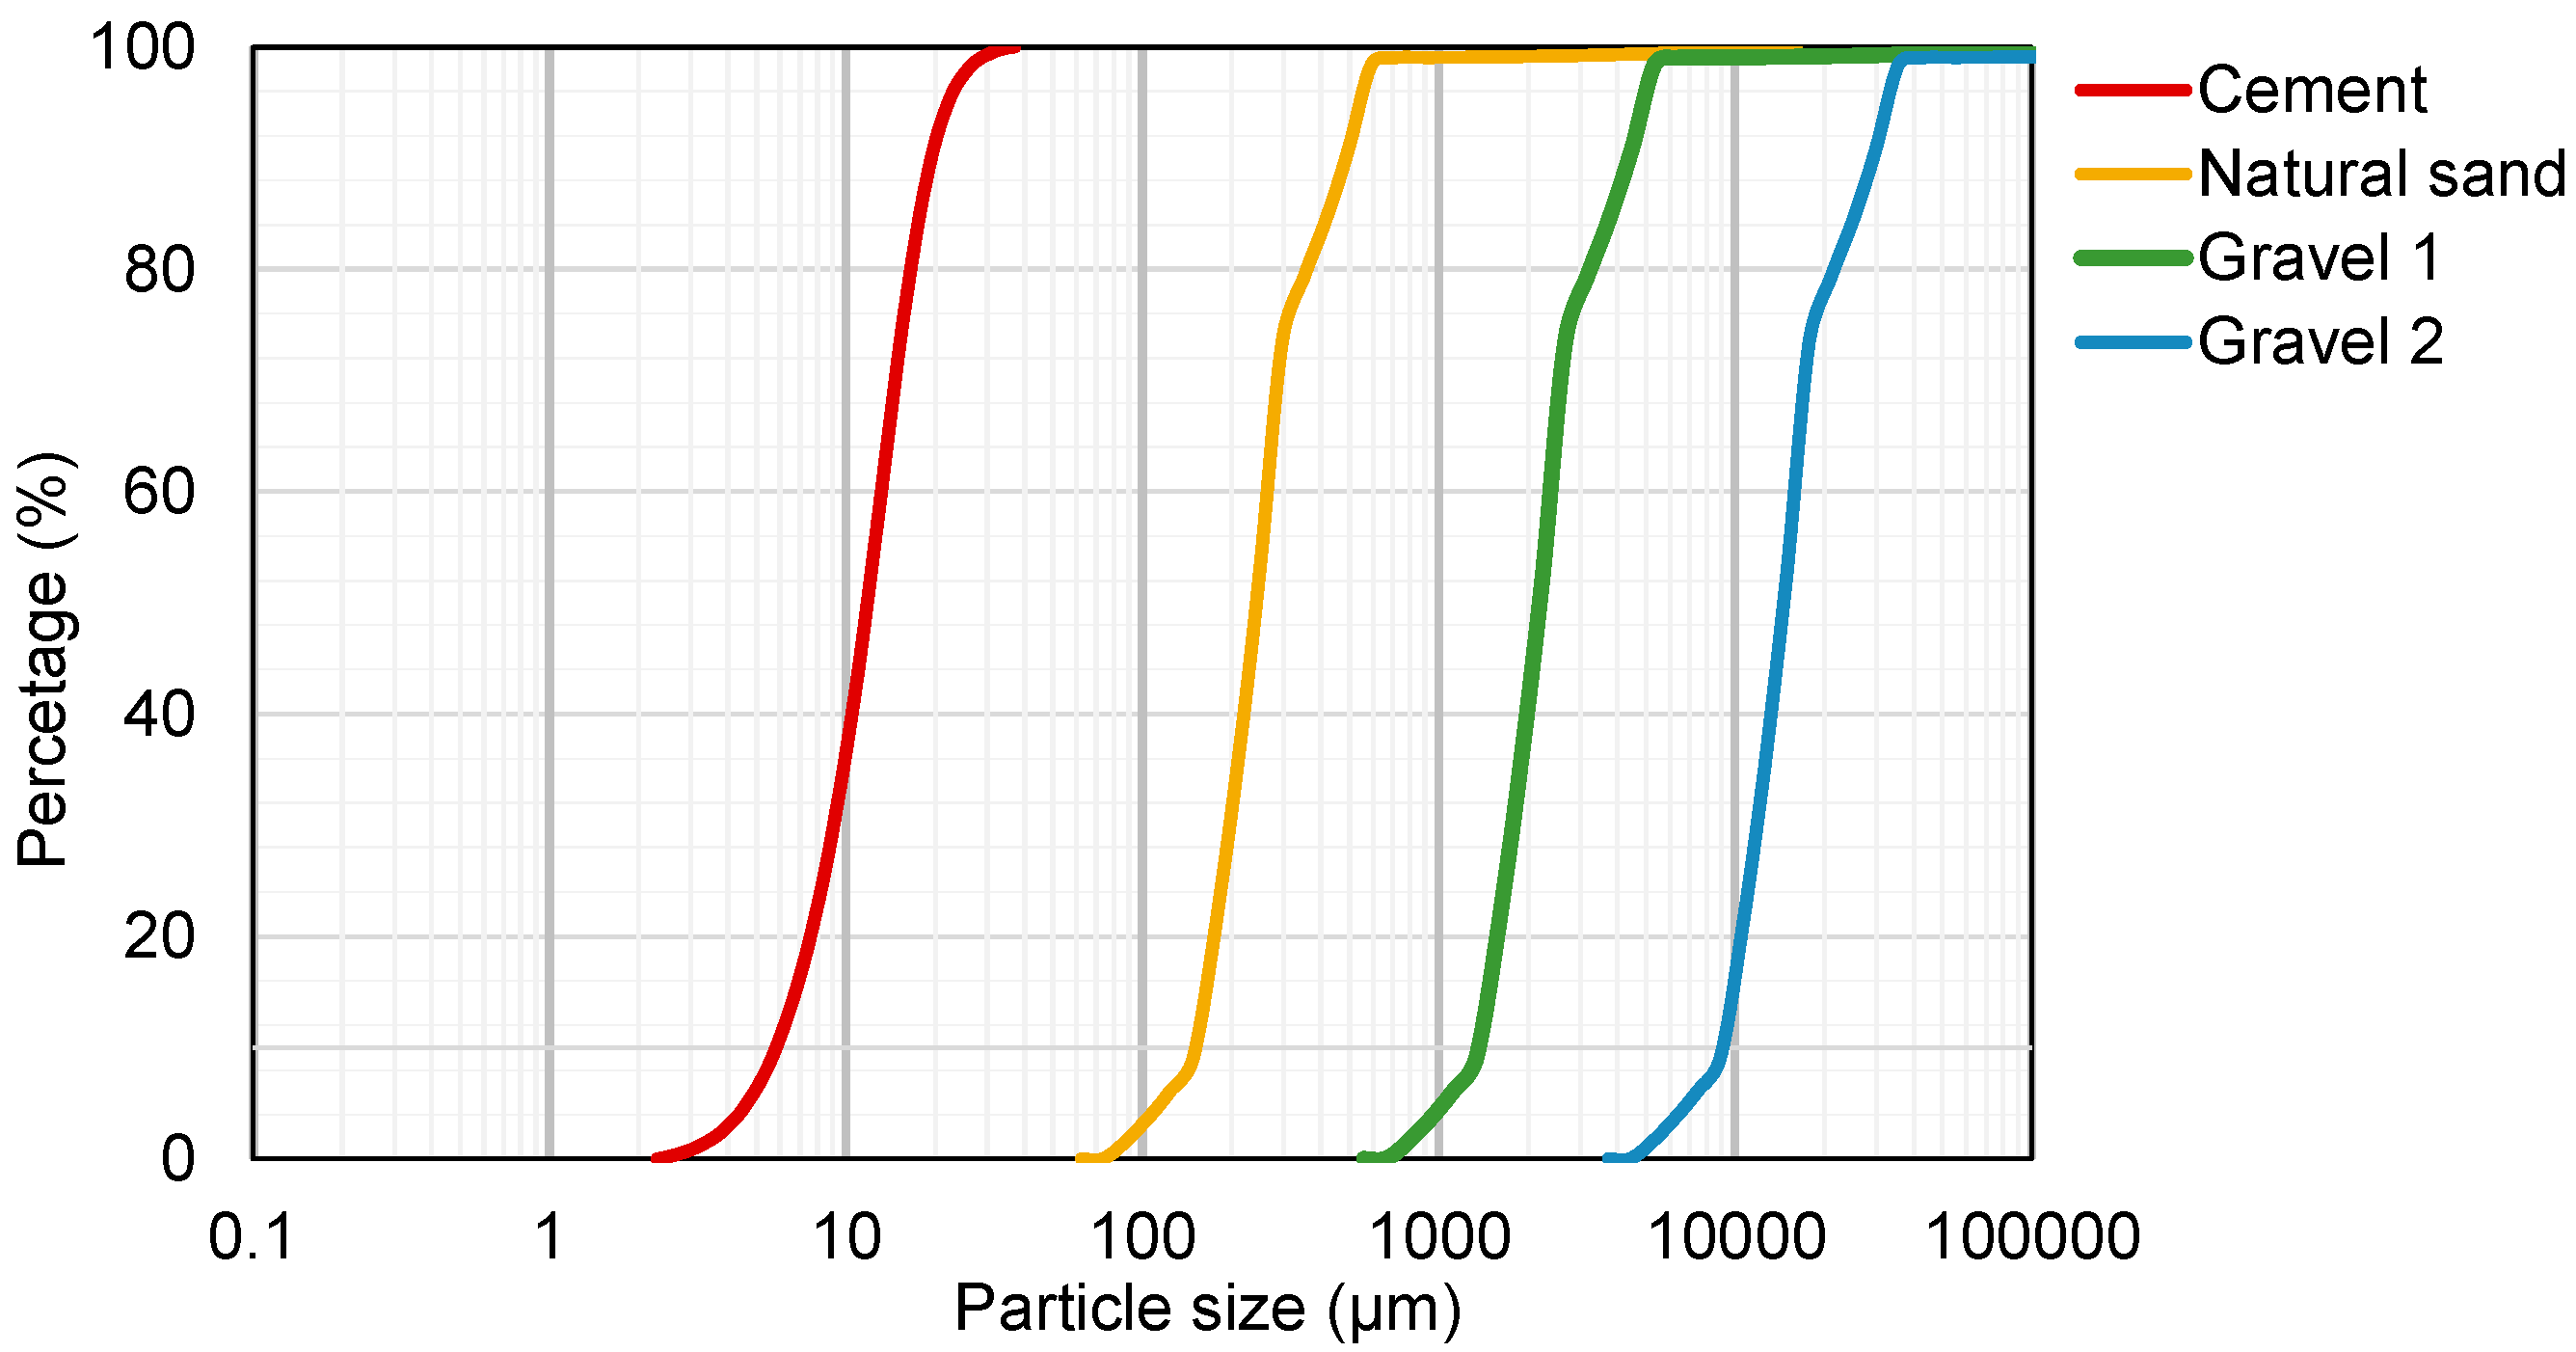
2.1.2. Materials
2.1.3. Instrumentation
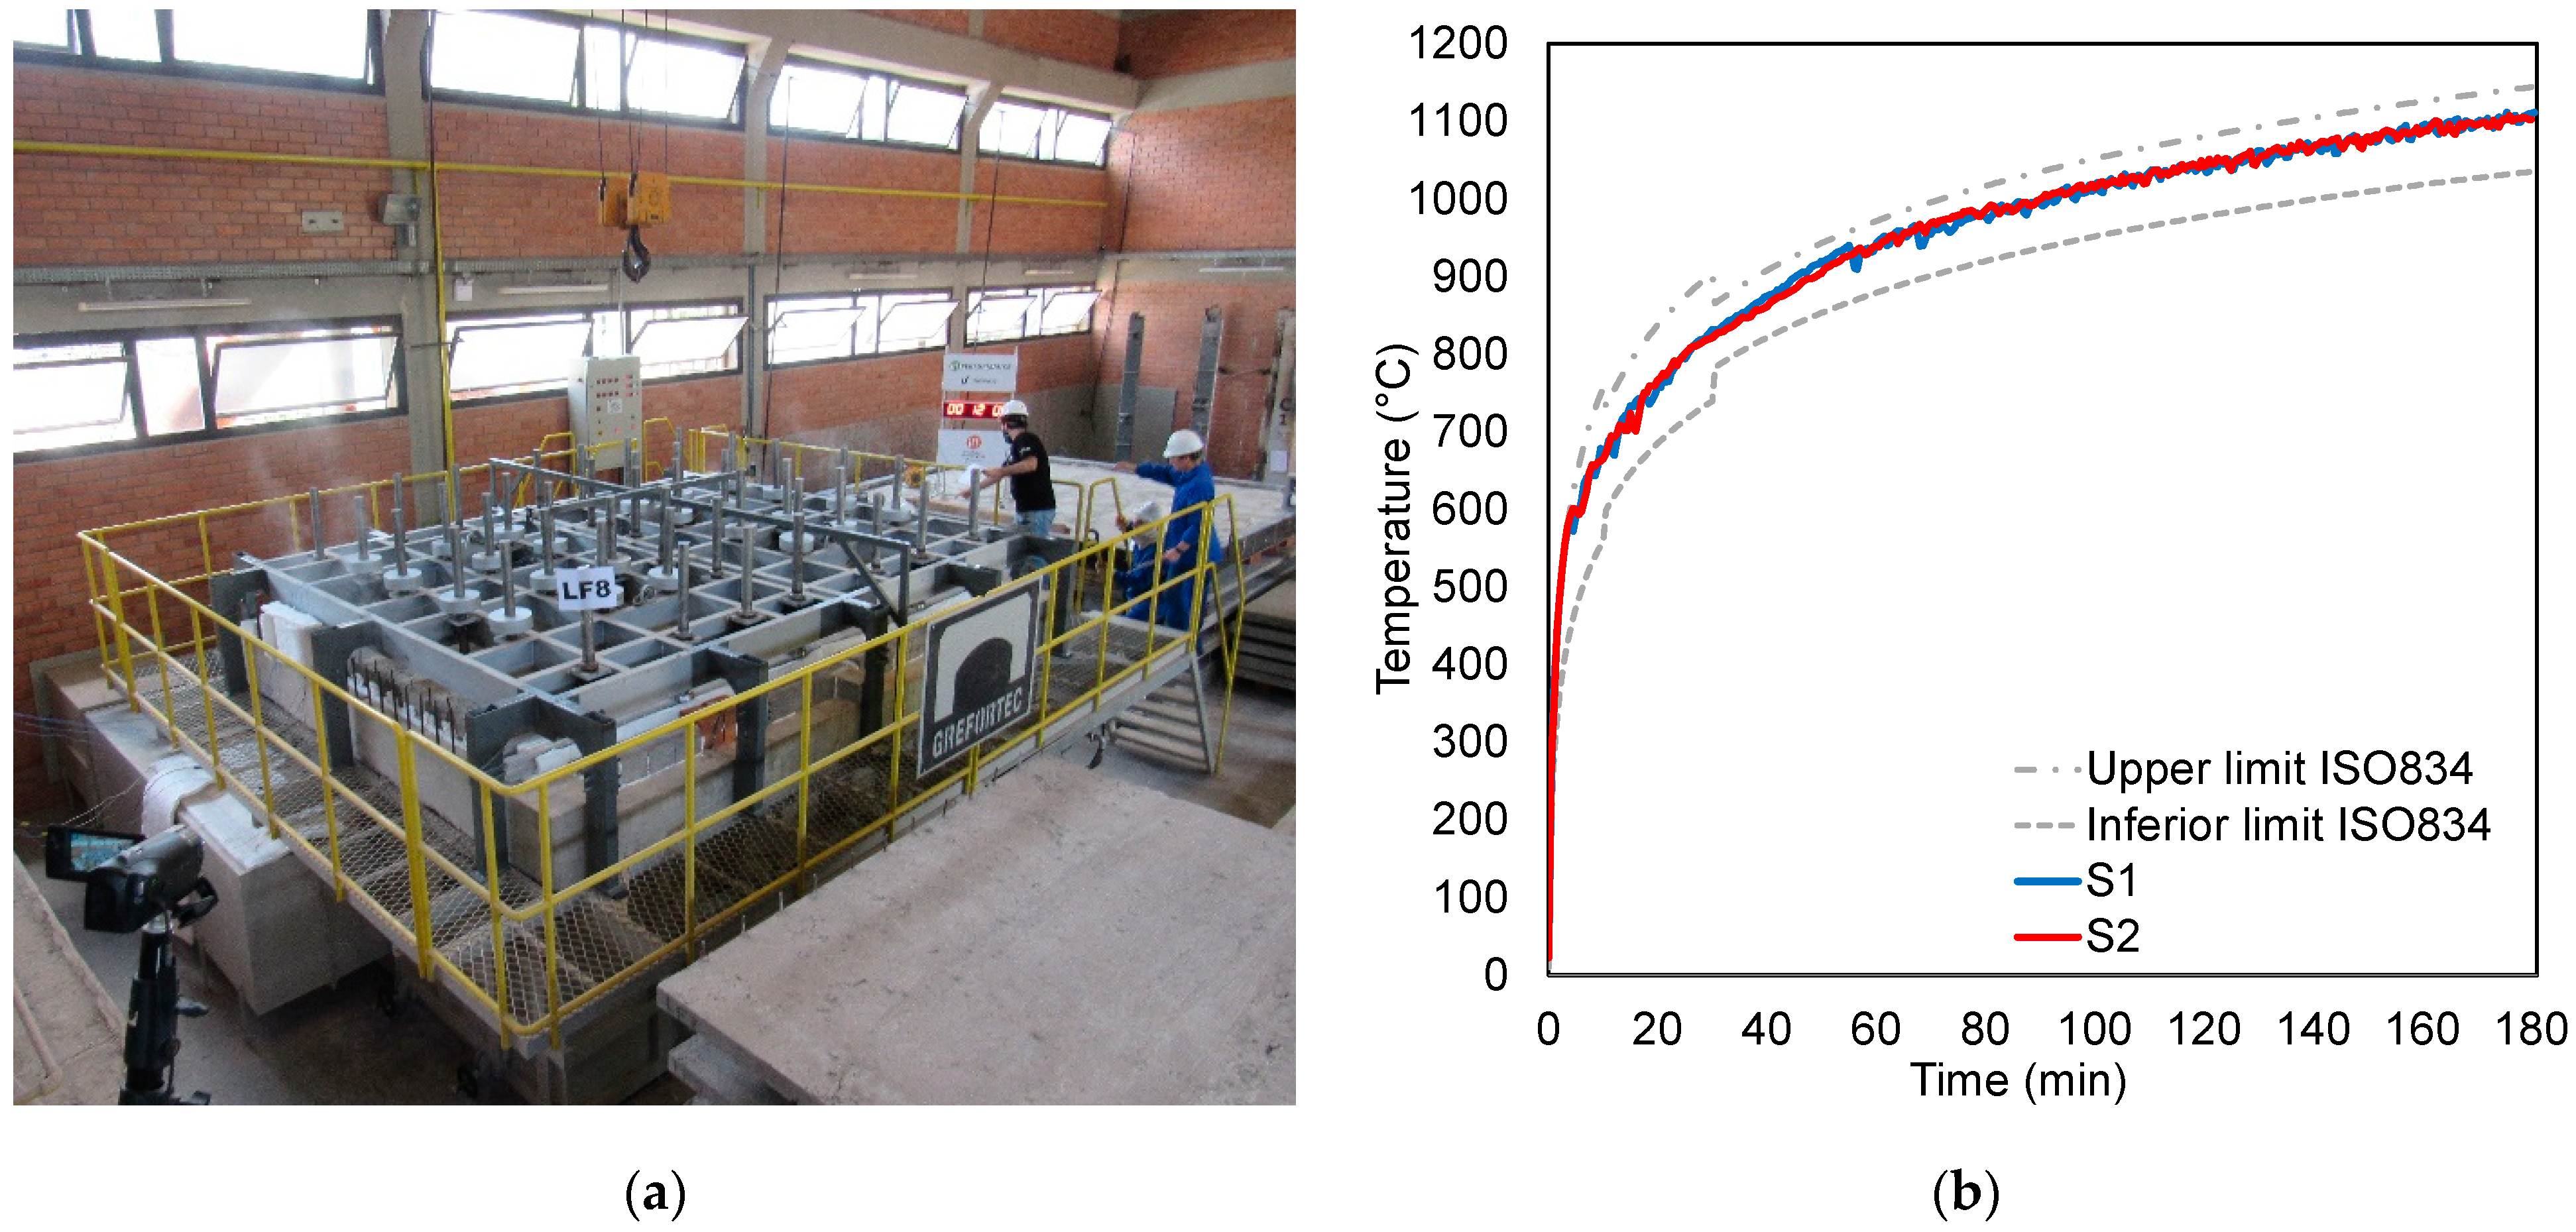
2.1.4. Furnace Temperature
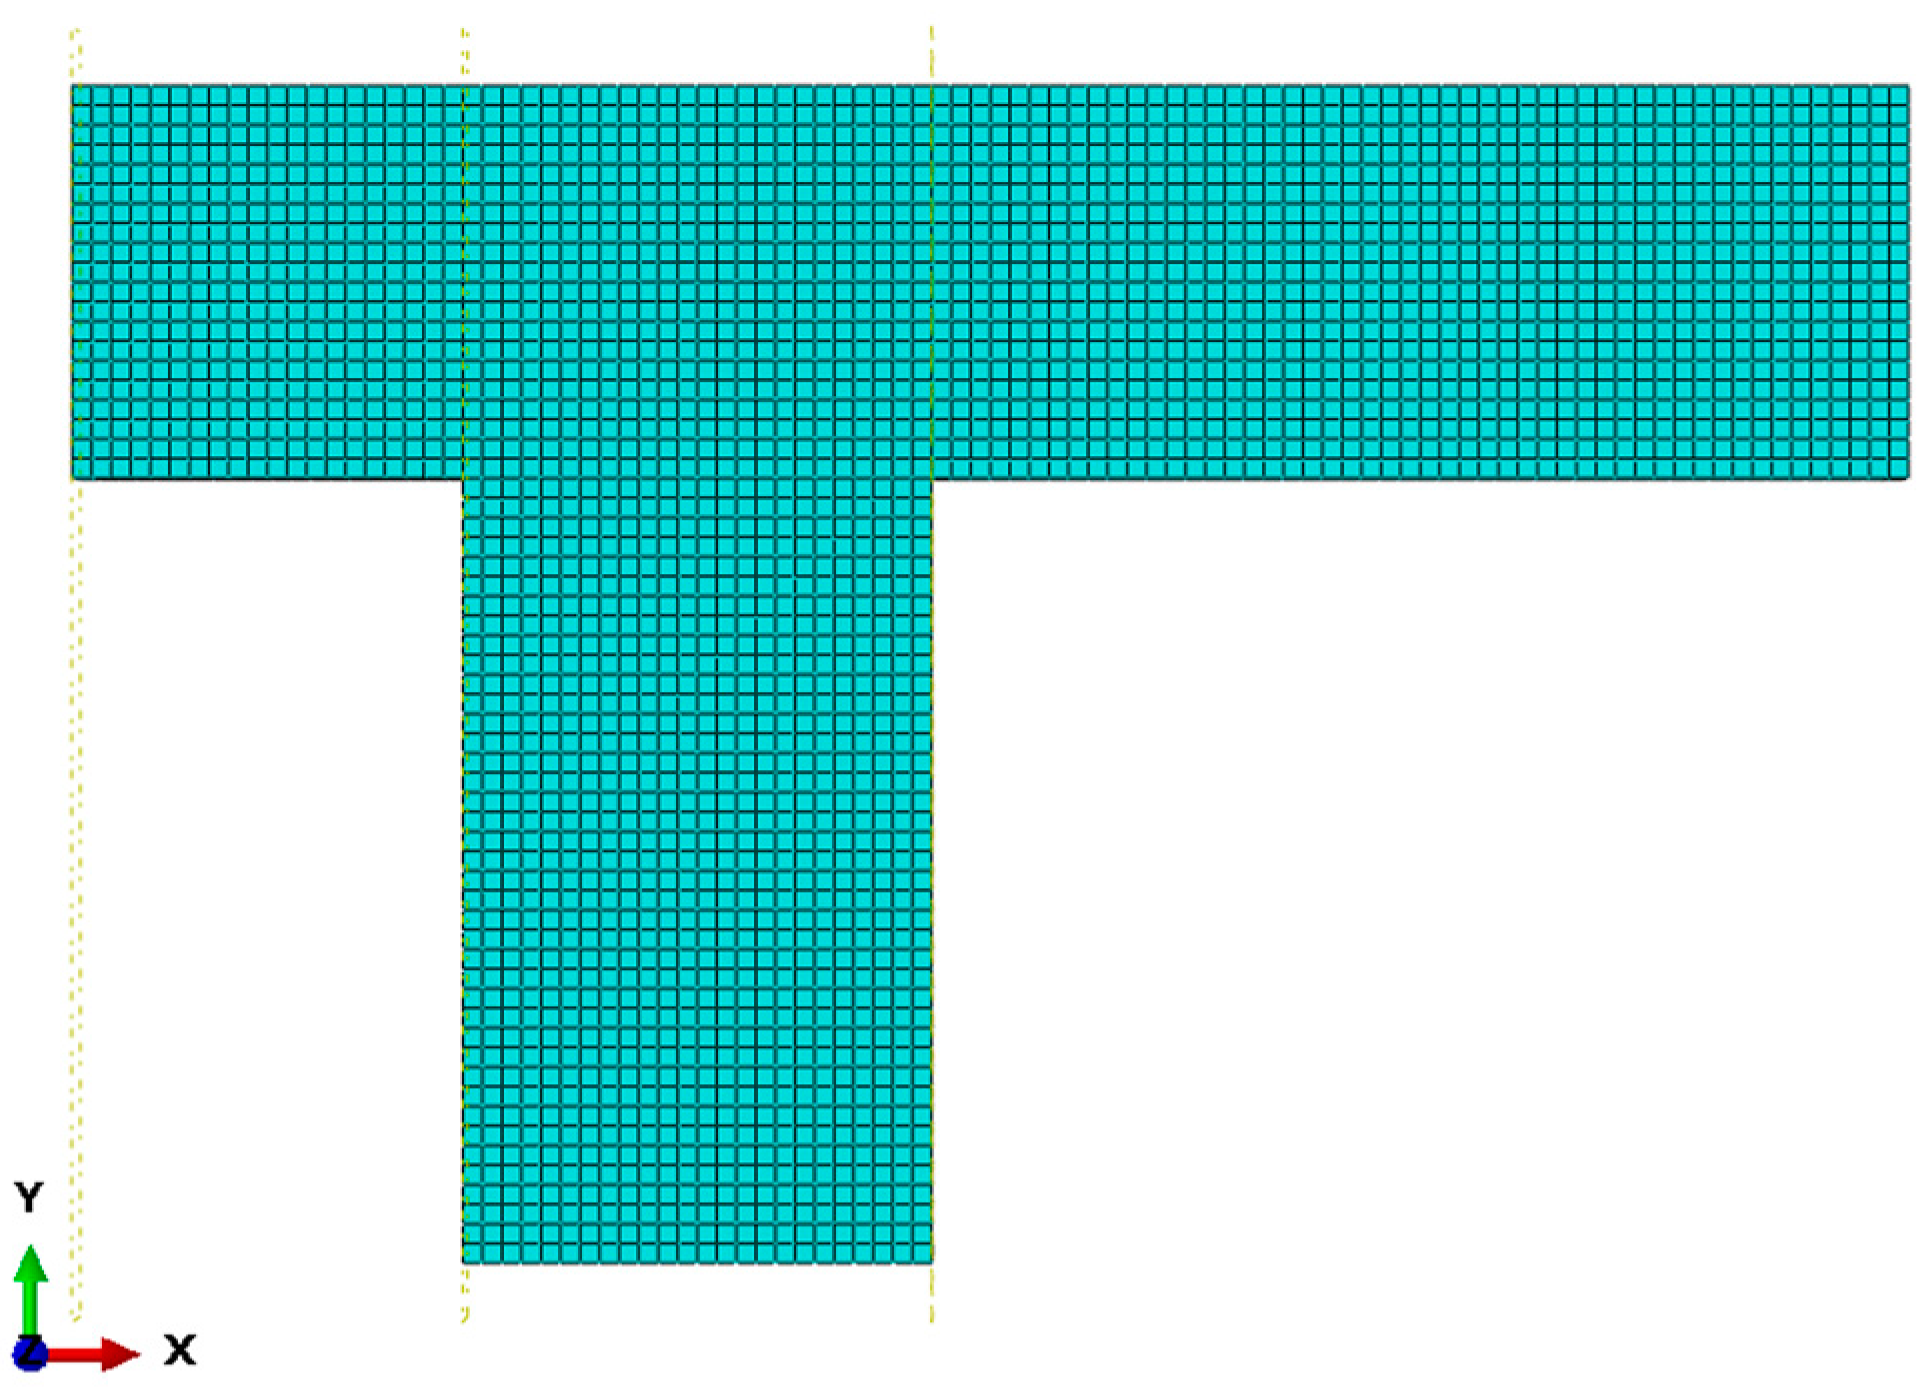
2.2. Numerical Research
Calibration, Validation, and Extrapolations
2.3. Checking the Current Tables in EN 1992-1.2
3. Results
3.1. Numerical Model Validation
3.2. Parametric Investigation
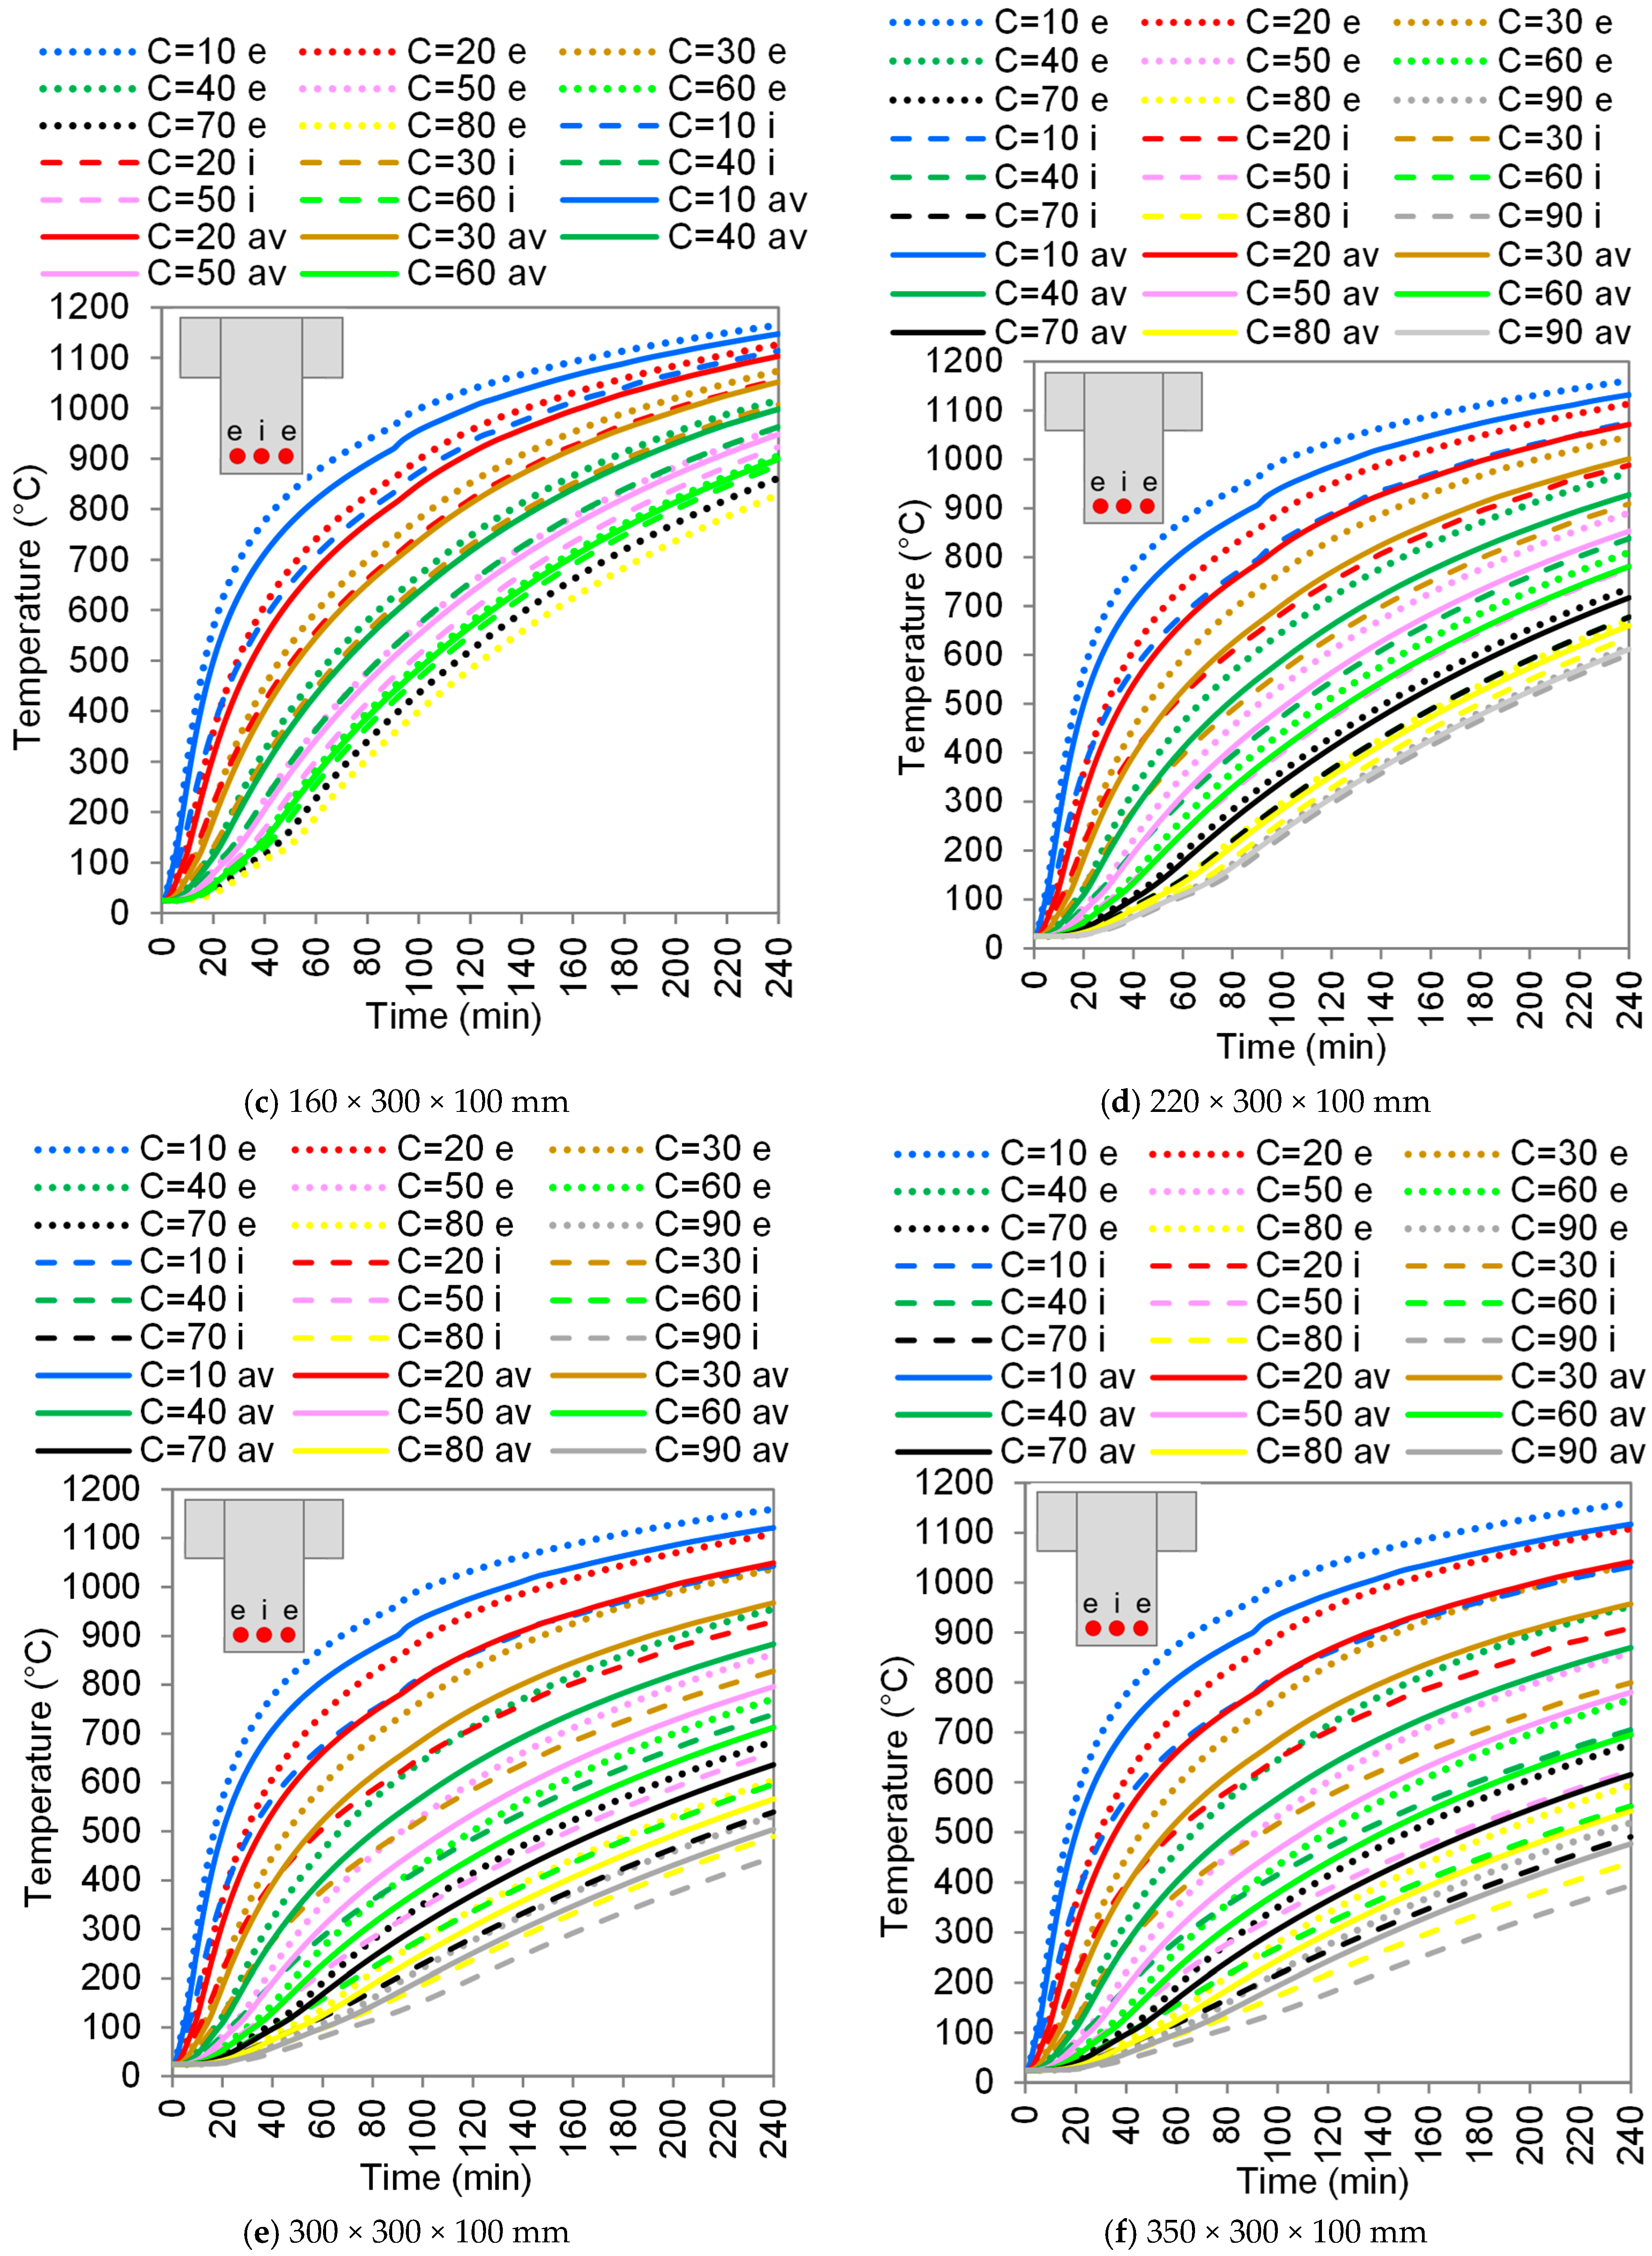
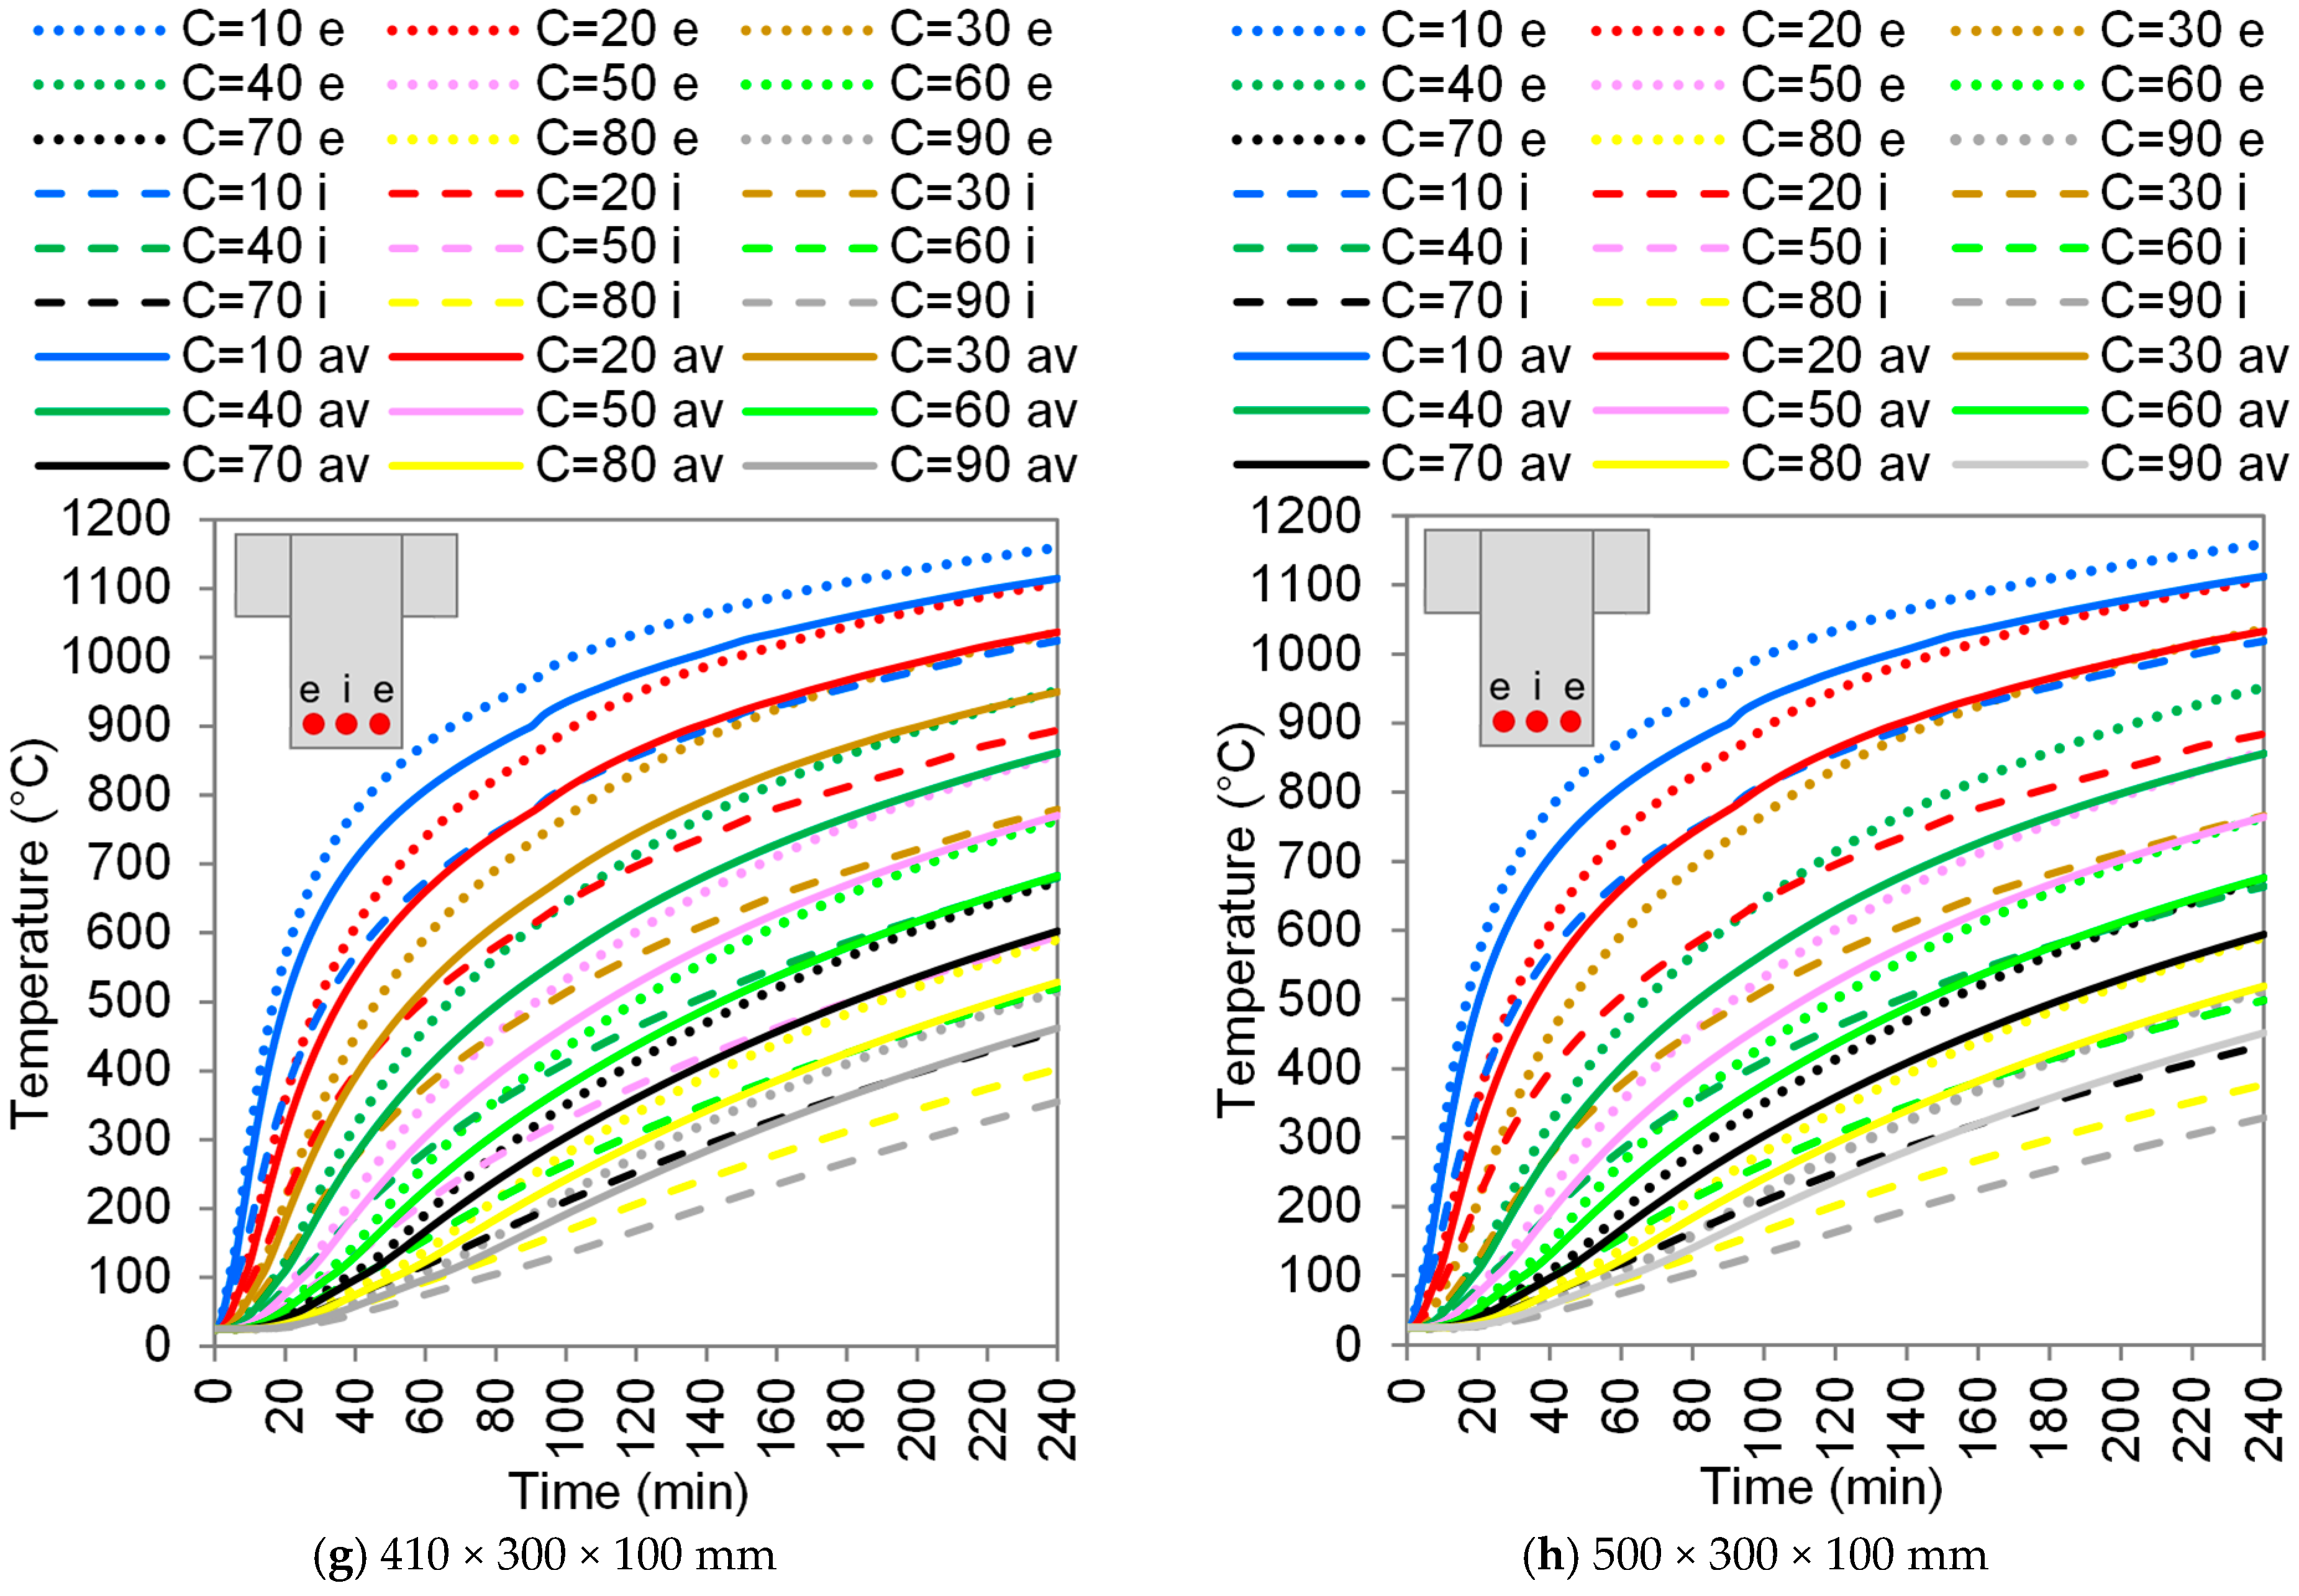
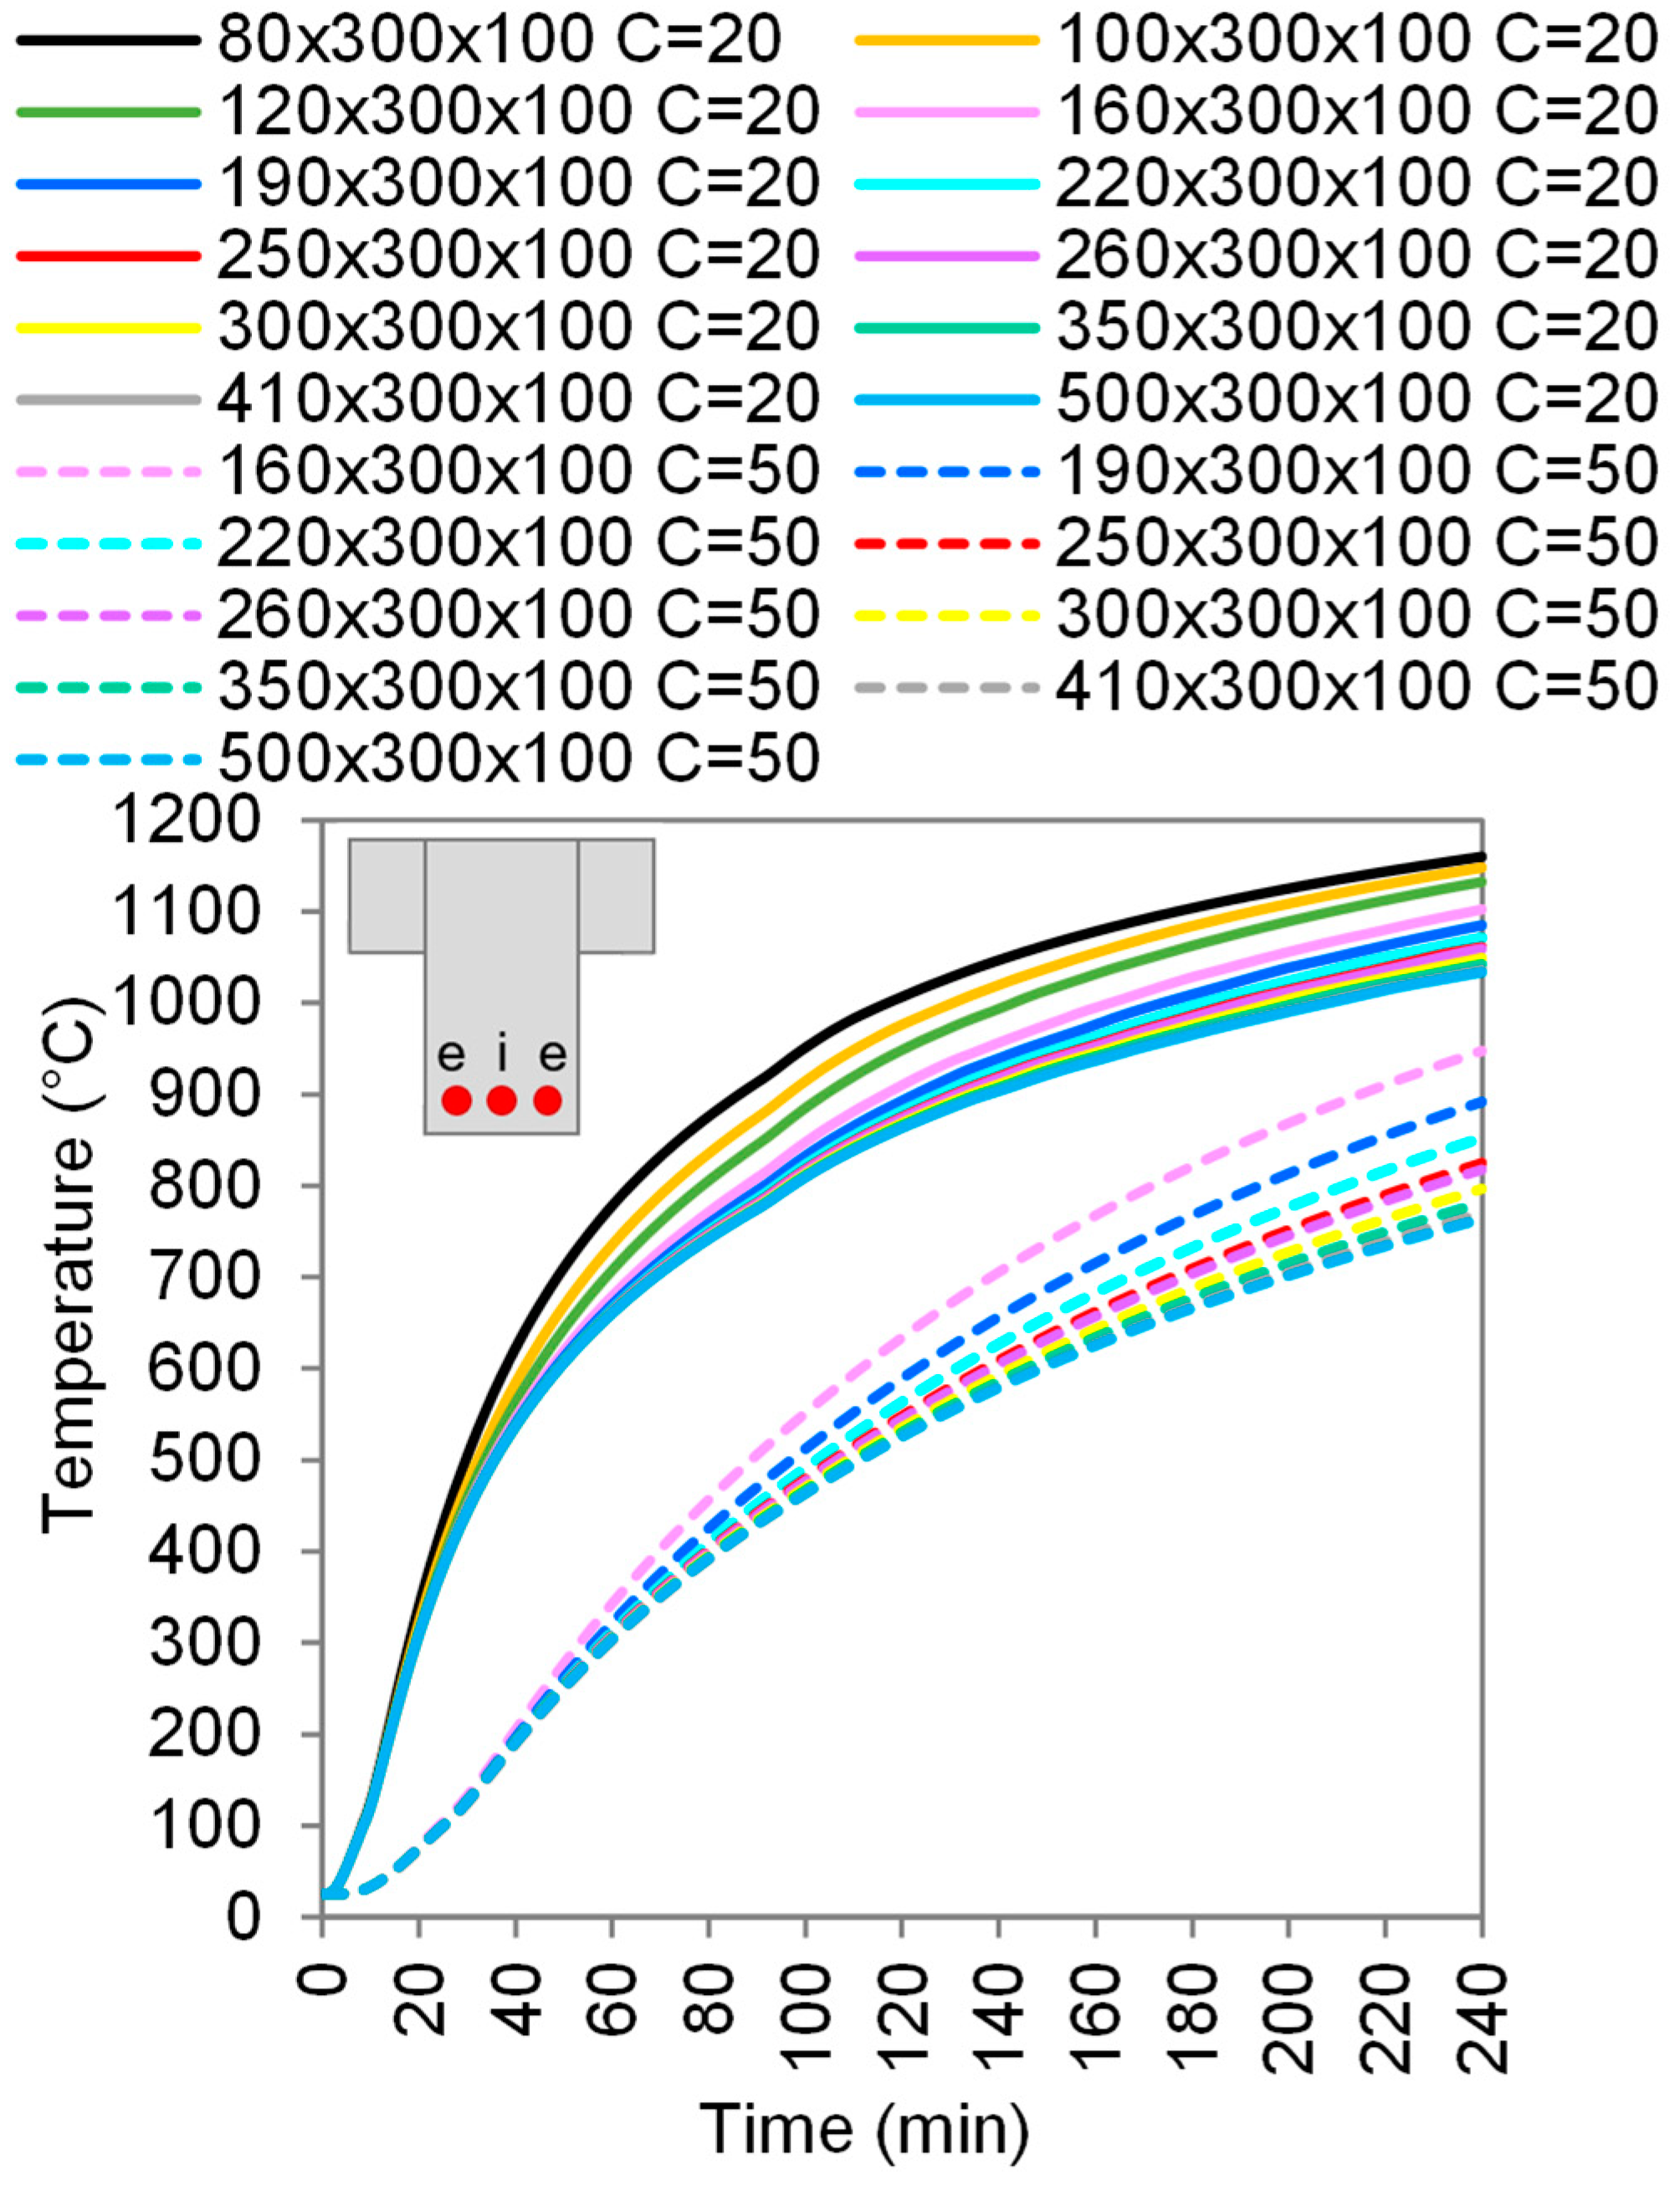
3.2.1. The Influence of Slab Ribs
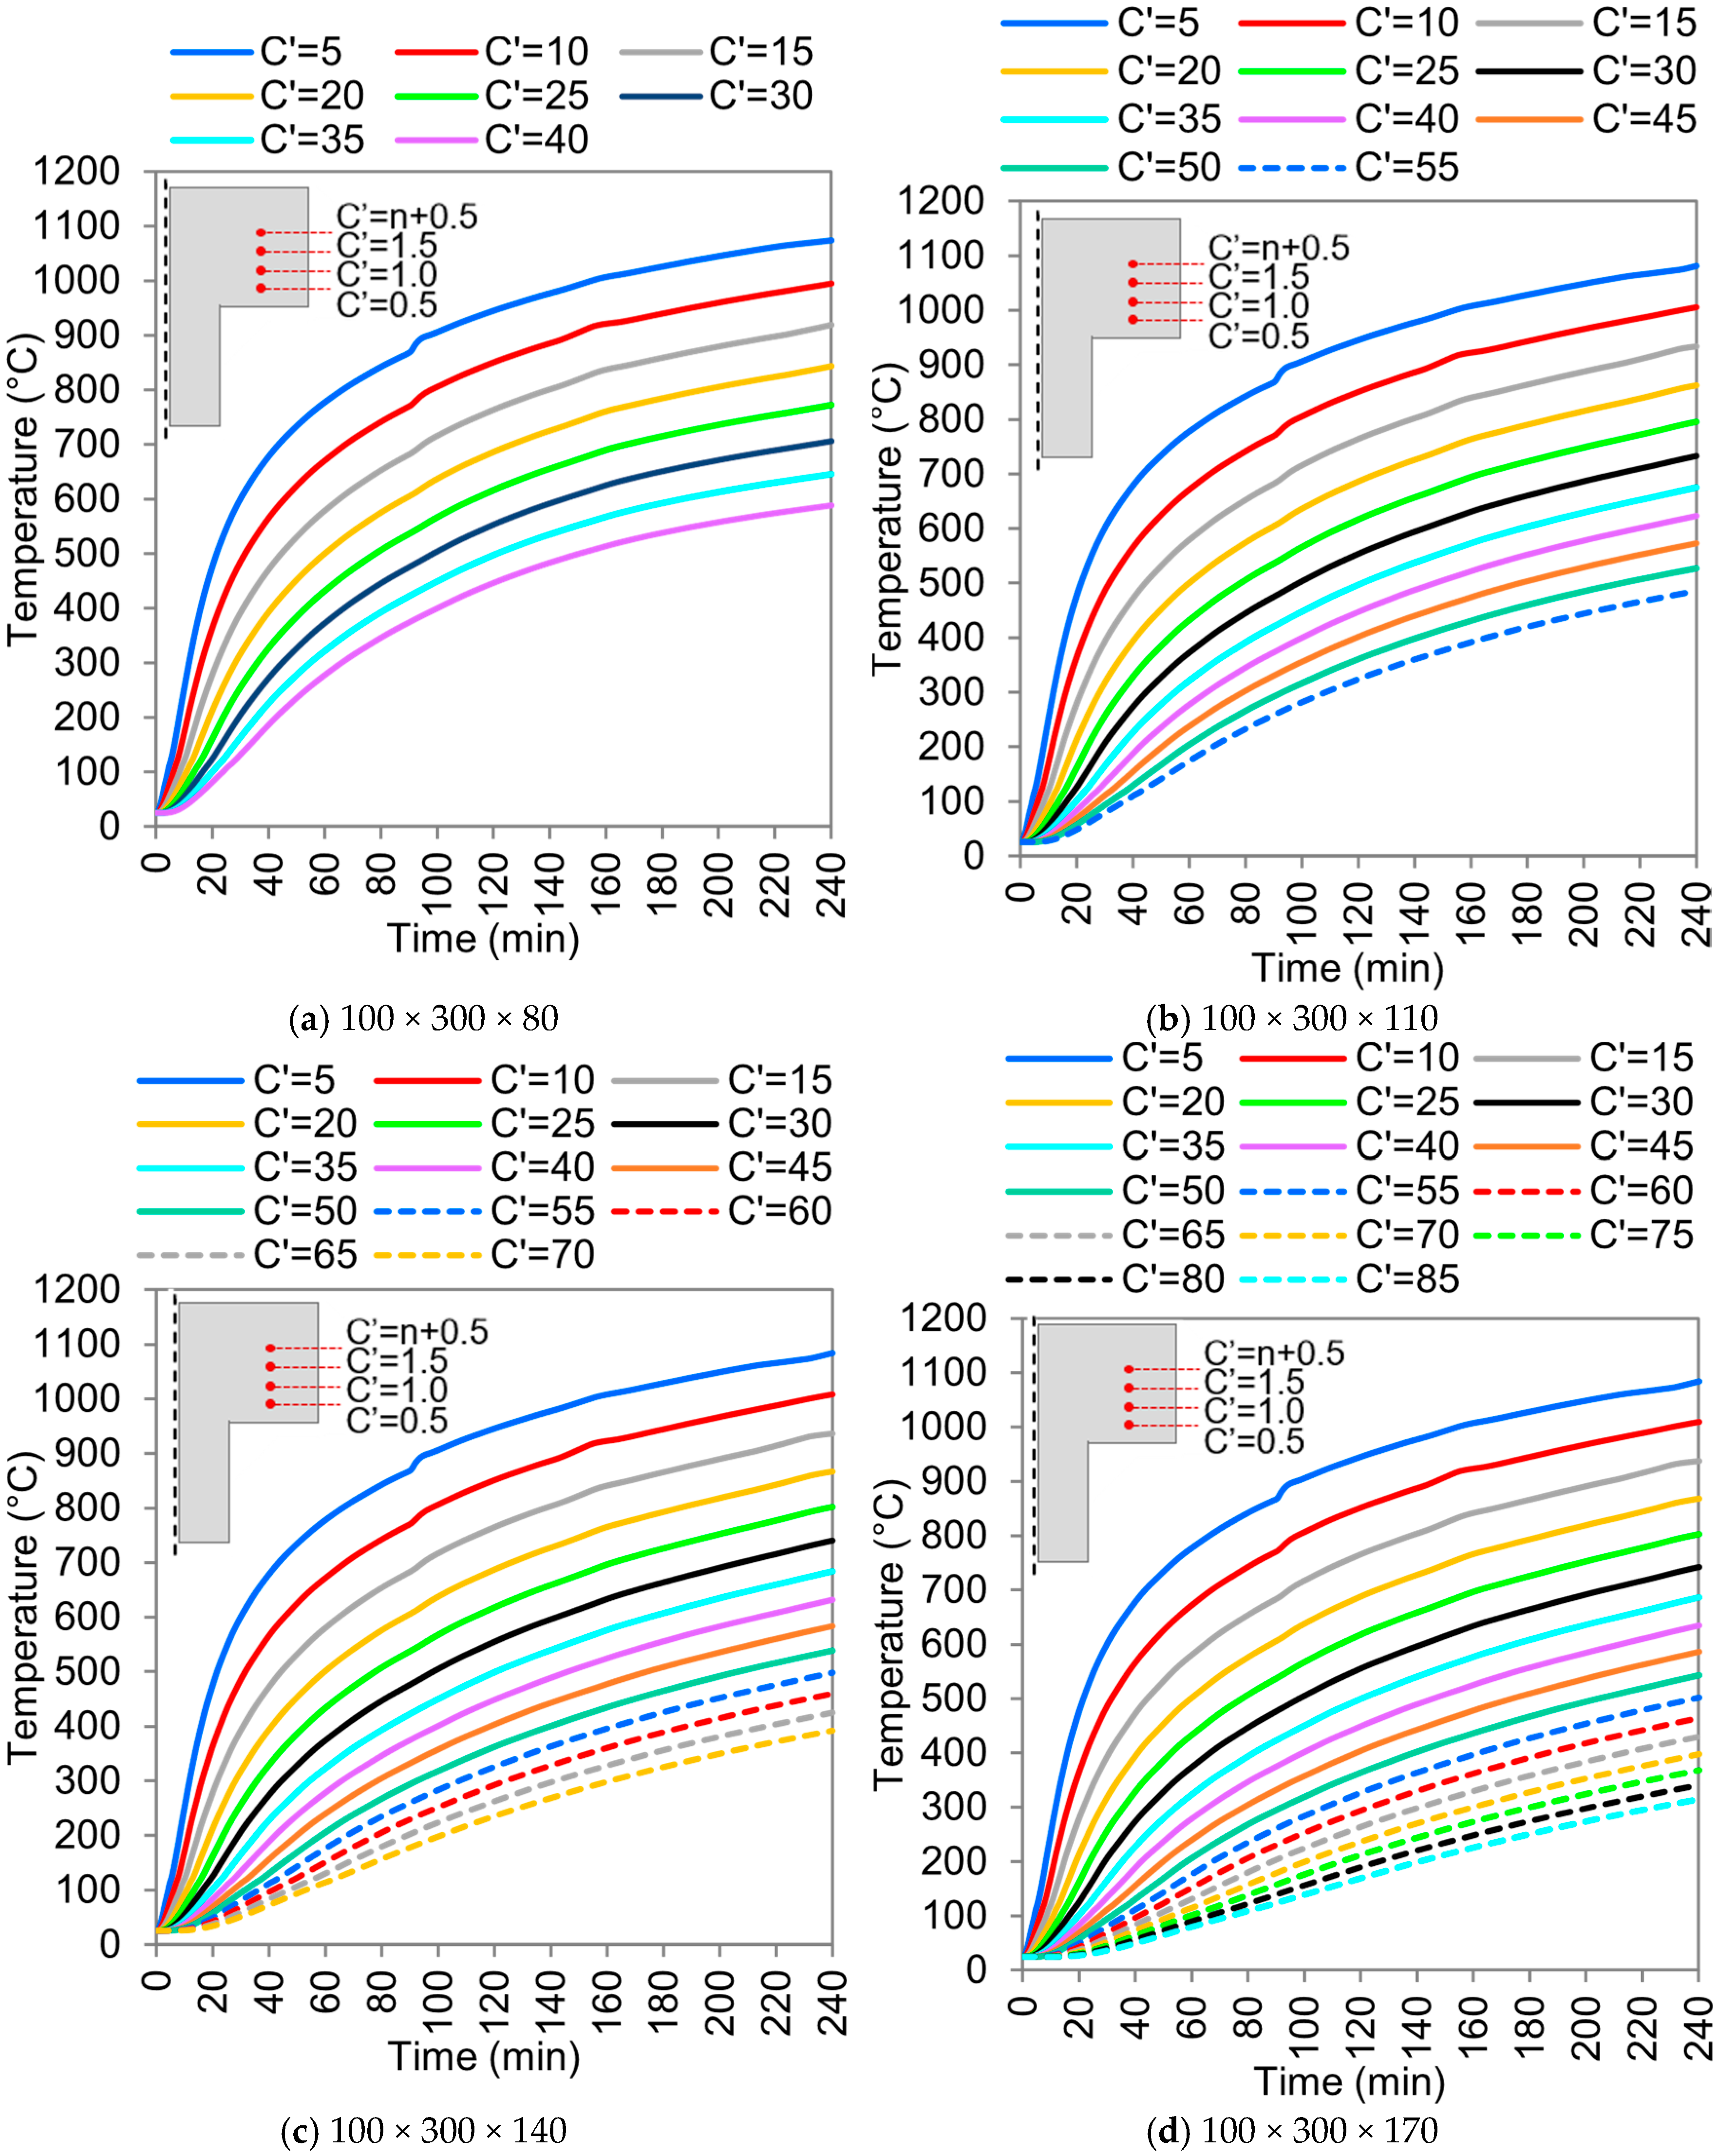
3.2.2. The Influence of the Slab Flange
3.2.3. Thermal Insulation Results
3.3. EN 1992-1.2 Validation
3.4. Proposed Update of Tables
4. Conclusions
- The reinforcement at the rib corners is most affected by the fire. The installation of a third rebar in the central position (between the corner rebars) proved to be an interesting solution to mitigate the loss of mechanical strength in the slab. The temperature of the intermediate rebar can be up to 70% lower than the corner rebar;
- The thickness of the concrete cover has proven to be a key parameter for improving the fire resistance of ribbed slabs, as this variable has the greatest influence on the temperature of the reinforcement, which decreases by 300 °C when the concrete cover is increased by 30 mm, for example;
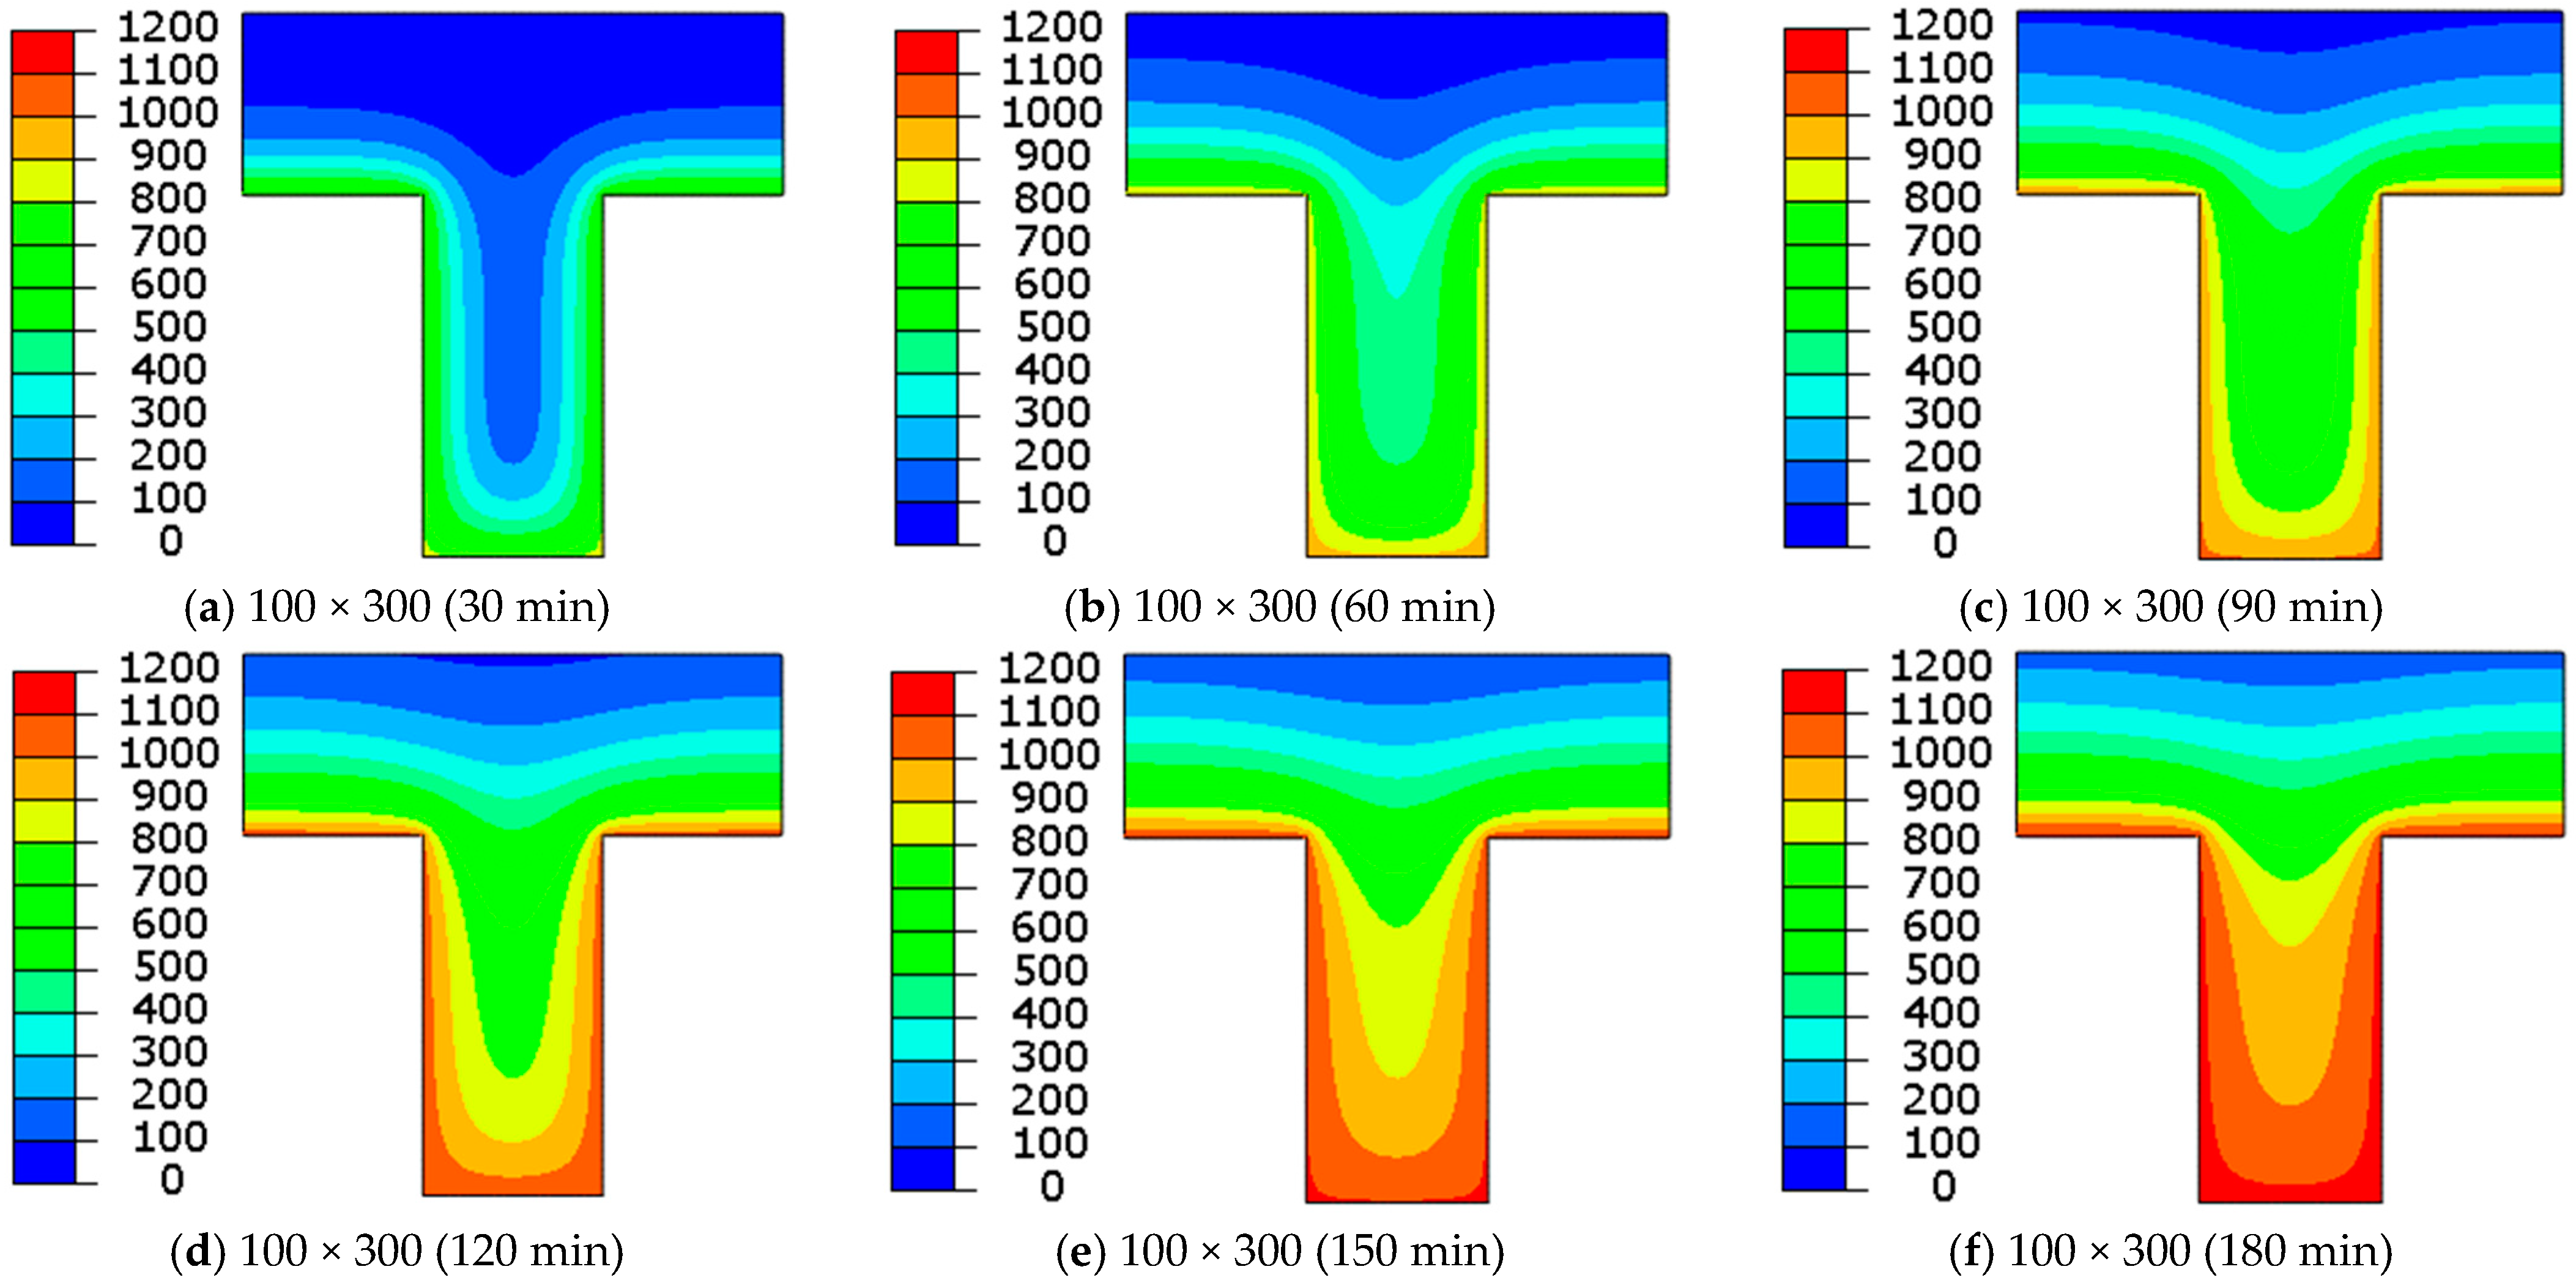
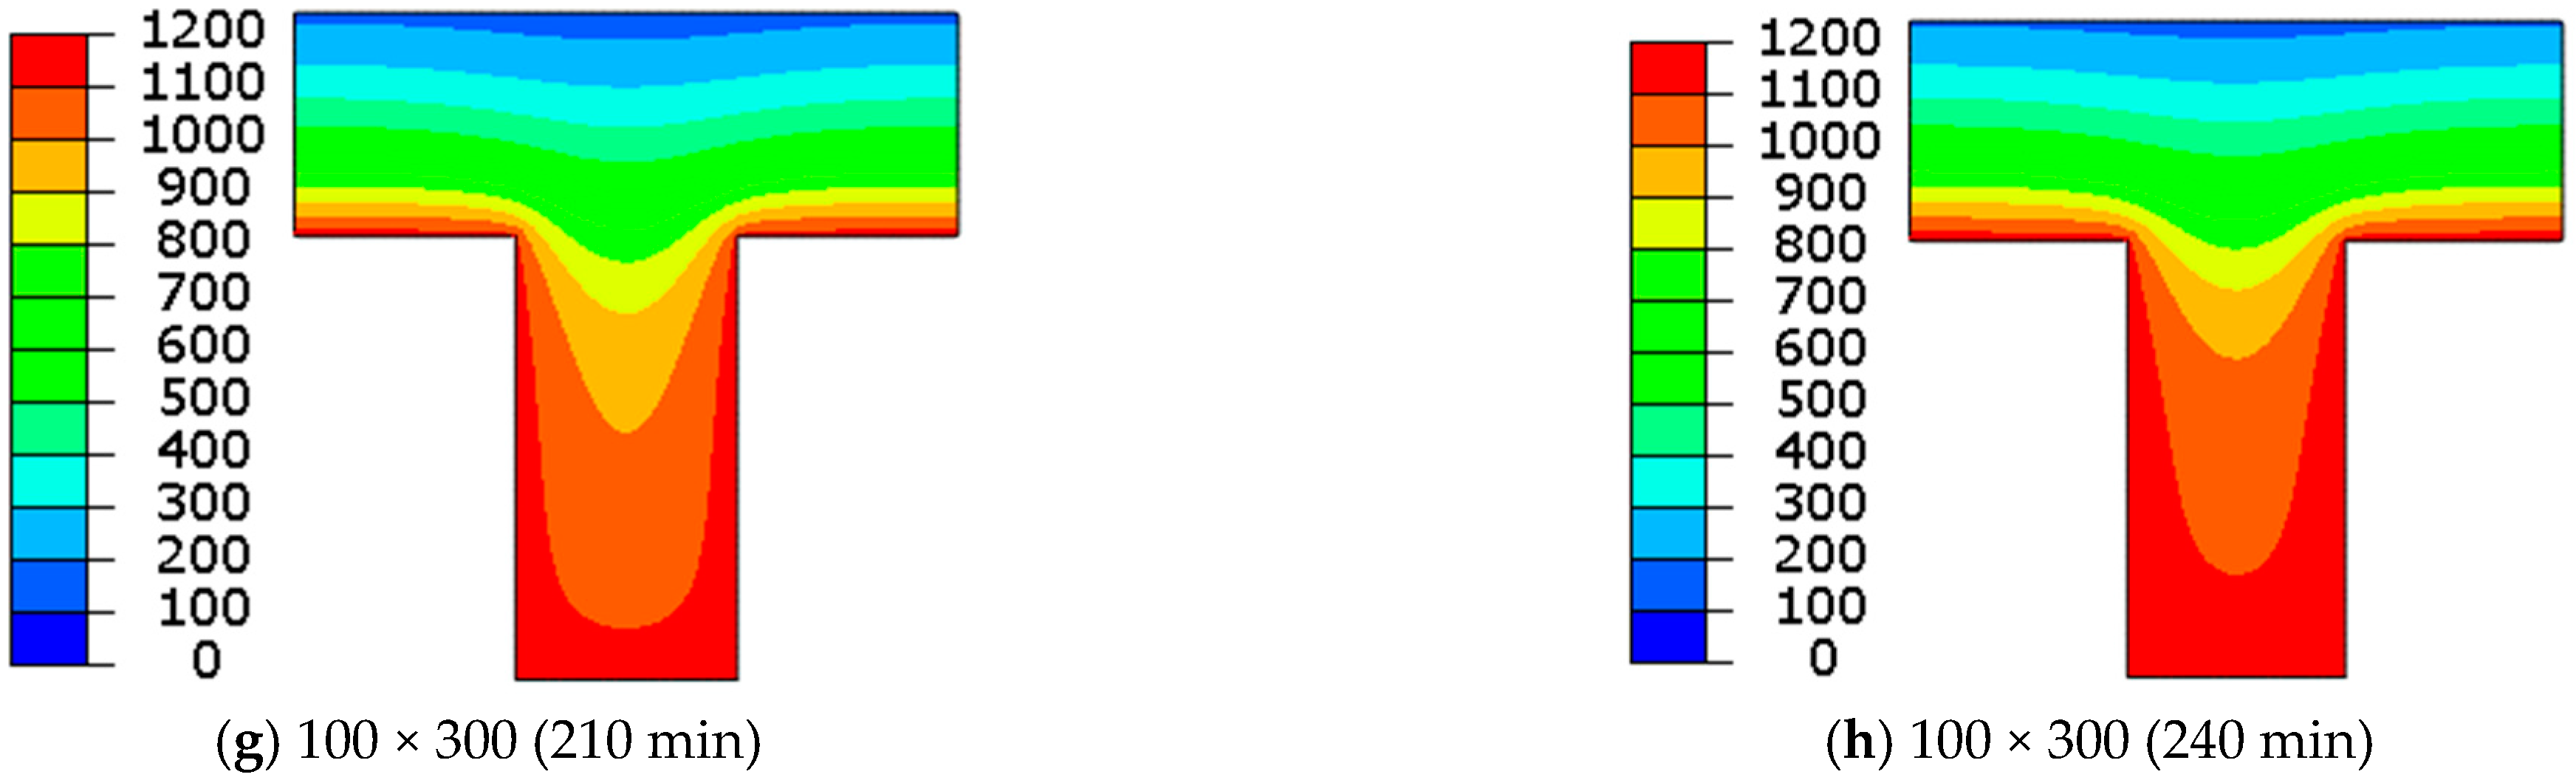
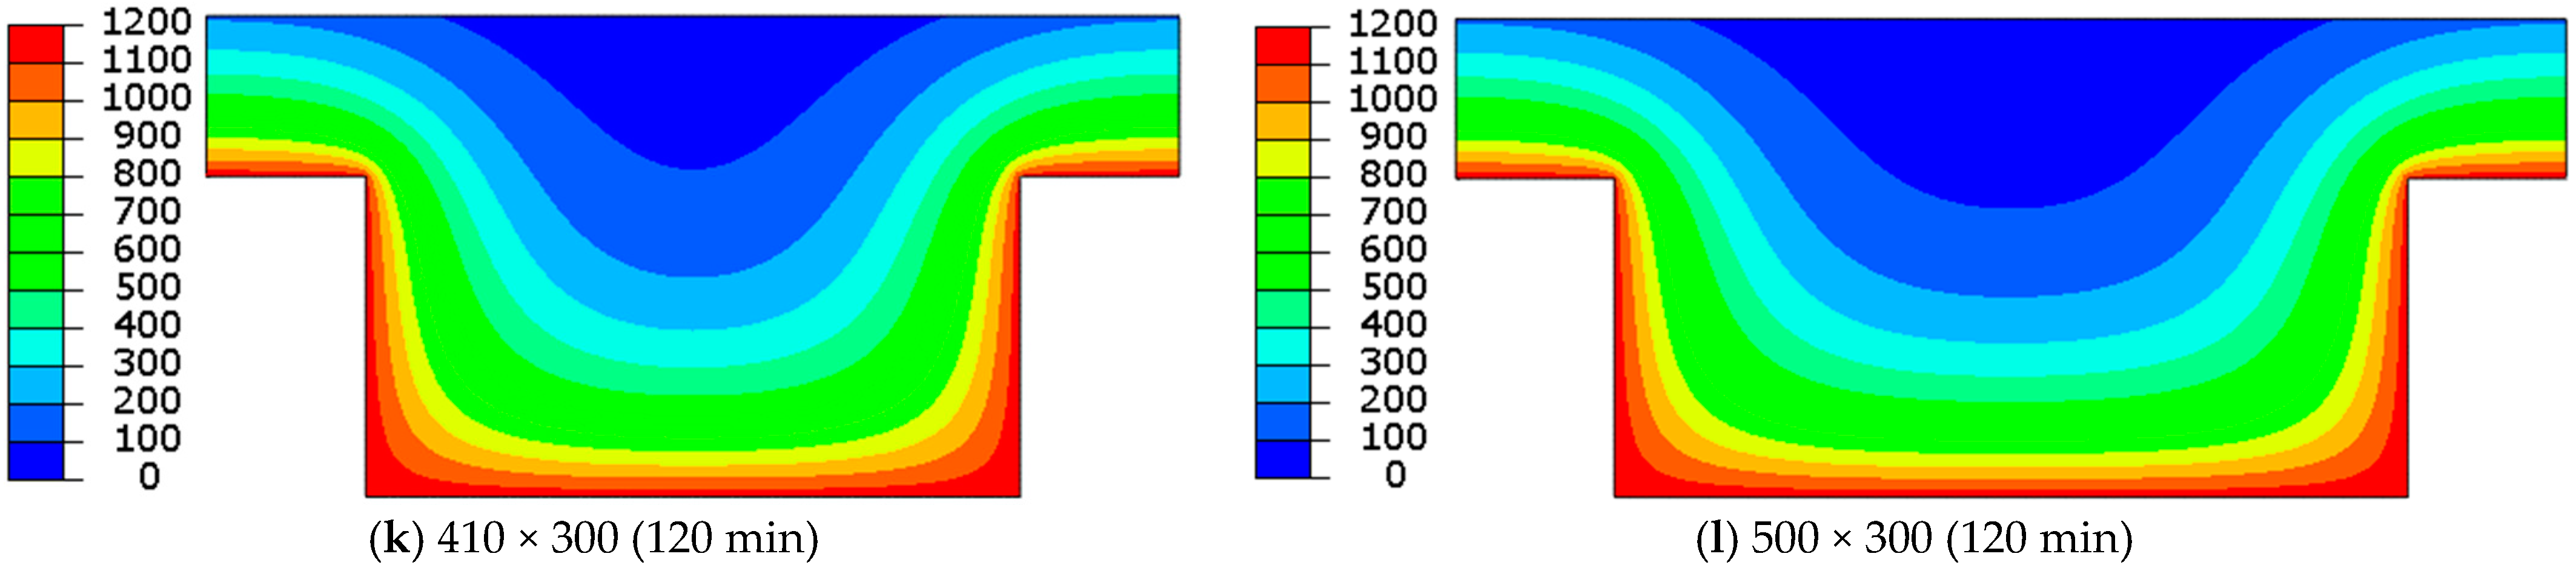
- When thin ribs are exposed to high temperatures for an extended period of time (ISO 834), their average temperature may rise to 1000 °C. This explains the limitations of the rib narrowness typically adopted by standards;
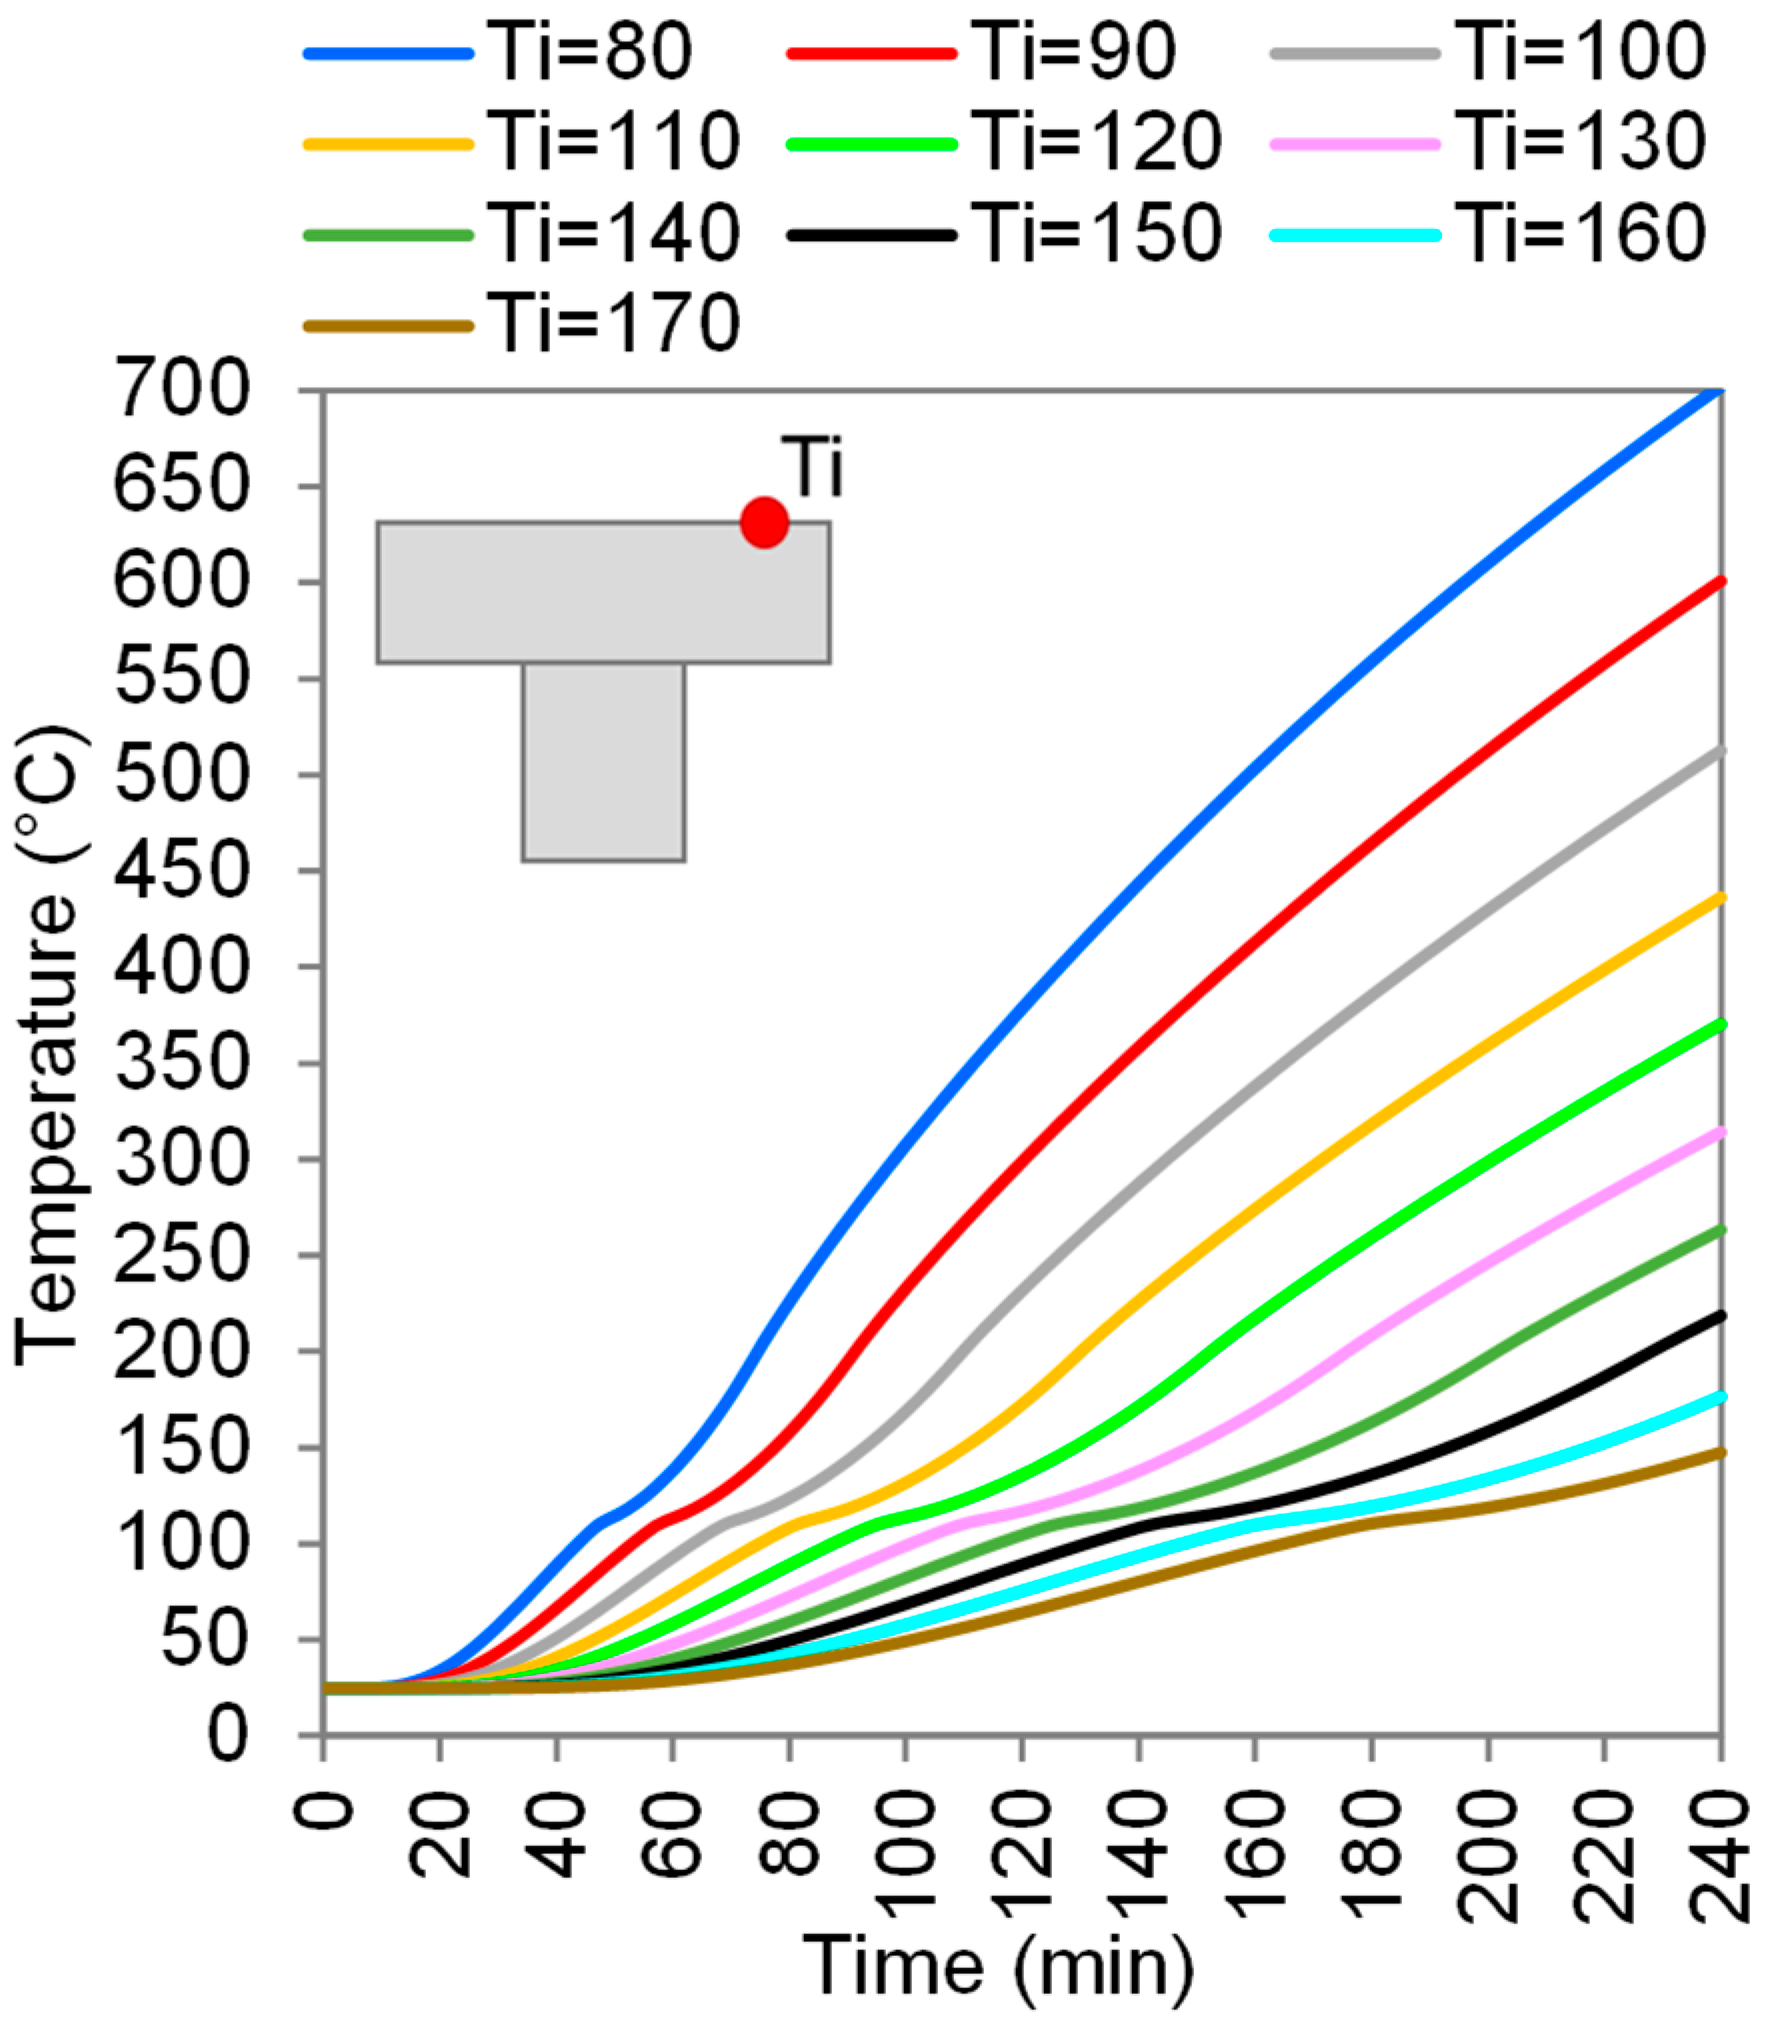
- The flange thickness was the key parameter concerning the thermal insulation capacity of the slab. The fire resistance rate can be improved to 170 min when the flange thickness improves to 90 mm;
- The tabulated values proposed in the standard for simply supported slabs were found to be unsafe with respect to some of the thermal simulations carried out. As a result, an increase in the concrete cover thickness proposed in EN 1992-1.2 of 15 mm is proposed;
- A similar outcome can also be derived for the thickness of the flange, where, in some cases, this study shows that the thickness of the concrete cover should be increased by 10 to 15 mm. However, in some cases, the flange thickness proposed by EN 1992-1.2 can be reduced by 15 mm;
- The suggested tabulated method is an alternative to the one suggested by EN 1992-1.2;
- The new tabular method also expands the rib width and flange thickness options suggested by EN 1992-1.2, as well as the FRR, providing engineers with new geometry combinations for the fire design of these slabs;
- As a suggestion for future research, the proposed tabulated procedures should be reviewed by other authors; e.g., considering variations in the concrete mix to understand the extent of variation in the proposed results with respect to concrete composition.
Author Contributions
Funding
Data Availability Statement
Conflicts of Interest
Appendix A. Comparison Between Experimental and Numerical Results

| Concrete Point | ISO 834 Time (min) | |||||
|---|---|---|---|---|---|---|
| 0 | 30 | 60 | 90 | 120 | ||
| Tw50 | Exp (°C) | 25.0 | 46.3 | 93.4 | 101.0 | 108.3 |
| Num (°C) | 25.0 | 43.2 | 86.7 | 108.0 | 128.7 | |
| Δ (%) | 0.0 | 6.7 | 7.2 | 6.4 | 15.8 | |
| Tw80 | Exp (°C) | 25.0 | 82.0 | 100.7 | 128.4 | 202.6 |
| Num (°C) | 25.0 | 60.0 | 105.2 | 123.3 | 223.9 | |
| Δ (%) | 0.0 | 26.8 | 4.3 | 3.9 | 9.5 | |
| Tw110 | Exp (°C) | 25.0 | 99.4 | 114.3 | 213.0 | 335.8 |
| Num (°C) | 25.0 | 78.1 | 114.9 | 233.7 | 409.3 | |
| Δ (%) | 0.0 | 21.4 | 0.5 | 8.8 | 17.9 | |
| Tw140 | Exp (°C) | 25.0 | 100.3 | 153.4 | 301.8 | 448.7 |
| Num (°C) | 25.0 | 85.0 | 119.3 | 326.0 | 507.7 | |
| Δ (%) | 0.0 | 15.3 | 22.2 | 7.4 | 11.6 | |
| Tw170 | Exp (°C) | 25.0 | 99.9 | 264.8 | 438.0 | 583.2 |
| Num (°C) | 25.0 | 93.9 | 260.0 | 432.3 | 607.2 | |
| Δ (%) | 0.0 | 6.0 | 1.8 | 1.3 | 3.9 | |
| Tw200 | Exp (°C) | 25.0 | 99.8 | 389.5 | 587.4 | 722.8 |
| Num (°C) | 25.0 | 127.0 | 405.3 | 619.5 | 769.1 | |
| Δ (%) | 0.0 | 21.4 | 3.8 | 5.1 | 6.0 | |
| Tf20 | Exp (°C) | 25.0 | 95.5 | 136.6 | 212.8 | 287.6 |
| Num (°C) | 25.0 | 69.8 | 153.1 | 237.8 | 296.3 | |
| Δ (%) | 0.0 | 26.9 | 10.7 | 10.5 | 2.9 | |
| Tf35 | Exp (°C) | 25.0 | 121.1 | 198.9 | 311.0 | 403.5 |
| Num (°C) | 25.0 | 115.9 | 241.3 | 340.8 | 409.7 | |
| Δ (%) | 0.0 | 4.3 | 17.6 | 8.7 | 1.5 | |
| Tf50 | Exp (°C) | 25.0 | 183.5 | 336.3 | 463.4 | 564.7 |
| Num (°C) | 25.0 | 216.7 | 375.2 | 485.2 | 561.8 | |
| Δ (%) | 0.0 | 15.3 | 10.3 | 4.5 | 0.5 | |
| Tf65 | Exp (°C) | 25.0 | 304.5 | 503.4 | 653.8 | 770.9 |
| Num (°C) | 25.0 | 334.8 | 580.2 | 690.8 | 770.0 | |
| Δ (%) | 0.0 | 9.1 | 13.2 | 5.3 | 1.1 | |
Appendix B. Comparison Between Reinforcement Temperatures
| 60 min Exposure Curve ISO 834 | ||||||||||
|---|---|---|---|---|---|---|---|---|---|---|
| Slab | Rebar | Thickness C (mm) | ||||||||
| 10 | 20 | 30 | 40 | 50 | 60 | 70 | 80 | 90 | ||
| 80 × 300 × 100 | e (°C) | 893.3 | 796.6 | 707.3 | - | - | - | - | - | - |
| i (°C) | 829.7 | 750.9 | - | - | - | - | - | - | - | |
| Δ (%) | 7.6 | 6.1 | - | - | - | - | - | - | - | |
| 100 × 300 × 100 | e (°C) | 883.4 | 766.6 | 649.2 | 557.7 | 503.0 | - | - | - | - |
| i (°C) | 786.0 | 680.1 | 601.6 | - | - | - | - | - | - | |
| Δ (%) | 12.4 | 12.7 | 7.9 | - | - | - | - | - | - | |
| 120 × 300 × 100 | e (°C) | 879.0 | 752.0 | 619.3 | 507.5 | 426.8 | 379.6 | - | - | - |
| i (°C) | 752.9 | 627.2 | 533.9 | 465.4 | - | - | - | - | - | |
| Δ (%) | 16.7 | 19.9 | 16.0 | 9.0 | - | - | - | - | - | |
| 160 × 300 × 100 | e (°C) | 876.2 | 742.7 | 599.1 | 470.9 | 366.8 | 287.1 | 229.7 | 193.6 | - |
| i (°C) | 710.5 | 560.5 | 449.0 | 366.2 | 304.3 | 257.5 | - | - | - | |
| Δ (%) | 23.4 | 32.5 | 33.4 | 28.6 | 20.5 | 11.5 | - | - | - | |
| 190 × 300 × 100 | e (°C) | 875.8 | 741.5 | 596.3 | 465.4 | 356.9 | 270.3 | 202.3 | 151.9 | 125.2 |
| i (°C) | 693.6 | 534.0 | 415.3 | 326.5 | 259.3 | 207.5 | 167.3 | - | - | |
| Δ (%) | 26.3 | 38.9 | 43.6 | 42.5 | 37.7 | 30.3 | 20.9 | - | - | |
| 220 × 300 × 100 | e (°C) | 875.1 | 740.3 | 594.7 | 463.1 | 353.5 | 265.2 | 194.6 | 142.1 | 113.8 |
| i (°C) | 683.5 | 518.8 | 396.0 | 304.0 | 234.2 | 180.5 | 141.9 | 118.7 | 106.4 | |
| Δ (%) | 28.0 | 42.7 | 50.1 | 52.4 | 50.9 | 46.9 | 37.1 | 19.7 | 6.9 | |
| 250 × 300 × 100 | e (°C) | 875.1 | 740.3 | 594.7 | 462.9 | 353.0 | 264.3 | 192.9 | 139.6 | 110.1 |
| i (°C) | 678.9 | 511.5 | 386.7 | 293.0 | 221.9 | 167.7 | 130.2 | 108.3 | 93.2 | |
| Δ (%) | 28.9 | 44.7 | 53.8 | 57.9 | 59.1 | 57.6 | 48.1 | 28.9 | 18.1 | |
| 260 × 300 × 100 | e (°C) | 874.9 | 740.0 | 594.3 | 462.5 | 352.7 | 263.9 | 192.4 | 139.0 | 109.4 |
| i (°C) | 677.7 | 509.7 | 384.5 | 290.5 | 219.1 | 168.9 | 127.7 | 105.6 | 89.9 | |
| Δ (%) | 29.1 | 45.2 | 56.6 | 59.2 | 60.1 | 56.2 | 50.7 | 31.6 | 21.7 | |
| 300 × 300 × 100 | e (°C) | 874.9 | 740.0 | 594.3 | 462.5 | 352.7 | 263.8 | 192.2 | 138.6 | 108.6 |
| i (°C) | 675.6 | 506.4 | 380.2 | 285.4 | 213.3 | 158.8 | 121.7 | 98.7 | 81.3 | |
| Δ (%) | 29.5 | 46.1 | 56.3 | 62.0 | 65.3 | 66.1 | 57.9 | 40.4 | 33.6 | |
| 350 × 300 × 100 | e (°C) | 874.9 | 740.0 | 594.3 | 462.5 | 352.7 | 263.8 | 192.2 | 138.6 | 108.4 |
| i (°C) | 674.8 | 505.1 | 378.5 | 283.3 | 210.9 | 156.1 | 118.8 | 95.1 | 76.9 | |
| Δ (%) | 29.6 | 46.5 | 53.4 | 63.3 | 30.1 | 69.0 | 61.8 | 45.8 | 41.0 | |
| 410 × 300 × 100 | e (°C) | 874.9 | 740.0 | 594.3 | 462.6 | 352.7 | 263.8 | 192.2 | 138.6 | 108.5 |
| i (°C) | 674.6 | 504.7 | 378.0 | 282.6 | 210.2 | 155.3 | 117.8 | 93.8 | 75.4 | |
| Δ (%) | 29.7 | 46.7 | 57.2 | 63.7 | 67.8 | 69.9 | 63.1 | 47.8 | 43.9 | |
| 500 × 300 × 100 | e (°C) | 874.9 | 740.1 | 594.4 | 462.6 | 352.7 | 263.9 | 192.2 | 138.6 | 108.5 |
| i (°C) | 674.6 | 504.7 | 377.9 | 282.6 | 210.0 | 155.2 | 117.7 | 93.6 | 75.0 | |
| Δ (%) | 29.7 | 46.7 | 57.3 | 63.7 | 69.7 | 70.0 | 63.3 | 48.1 | 44.7 | |
Appendix C. Thermal Insulation Critical Temperature
| Slab Case | Time to 140 °C |
|---|---|
| Ti = 80 | 60.5 min |
| Ti = 90 | 73.7 min |
| Ti = 100 | 88.7 min |
| Ti = 110 | 105.3 min |
| Ti = 120 | 122.2 min |
| Ti = 130 | 142.0 min |
| Ti = 140 | 162.0 min |
| Ti = 150 | 183.7 min |
| Ti = 160 | 207.0 min |
| Ti = 170 | 232.0 min |
References
- Huang, W.; Ma, X.; Luo, B.; Li, Z.; Sun, Y. Experimental Study on Flexural Behaviour of Lightweight Multi-Ribbed Composite Slabs. Adv. Civ. Eng. 2019, 2019, 1093074. [Google Scholar] [CrossRef]
- Yardim, Y.; Waleed, A.M.T.; Jaafar, M.S.; Laseima, S. AAC-concrete light weight precast composite floor slab. Constr. Build. Mater. 2013, 40, 405–410. [Google Scholar] [CrossRef]
- Ma, J.; He, Y.; Zhao, Z.-L.; Xie, Y.M. Topology optimization of ribbed slabs and shells. Eng. Struct. 2023, 277, 115454. [Google Scholar] [CrossRef]
- Malviya, S.; Tiwari, V.K. Behaviour of flat slab, waffle slab, ribbed & secondary beam in a multistorey building under seismic response: A review. Int. J. Res. Appl. Sci. Eng. Technol. 2020, 8, 986–992. [Google Scholar]
- Huber, T.; Burger, J.; Mata-Falcón, J.; Kaufmann, W. Structural design and testing of material optimized ribbed RC slabs with 3D printed formwork. Struct. Concr. 2023, 24, 1932–1955. [Google Scholar] [CrossRef]
- Moyeda, A.; Fish, J. Multiscale analysis of solid, waffle, ribbed and hollowcore reinforced concrete slabs. Comput. Methods Appl. Mech. Eng. 2019, 348, 139–156. [Google Scholar] [CrossRef]
- Zheng, C.; Xiong, F.; Liu, Y.; Yu, M. Study on the flexural behavior of precast concrete multi-ribbed sandwich slabs under different boundary conditions. Eng. Struct. 2023, 291, 116342. [Google Scholar] [CrossRef]
- Favarato, L.F.; Gomes, A.V.S.; Candido, D.C.d.M.; Ferrareto, J.A.; Vianna, J.d.C.; Calenzani, A.F.G. On the composite behavior of a rebar truss ribbed slab with incorporated shuttering made of lipped channel section. J. Build. Eng. 2022, 55, 104663. [Google Scholar] [CrossRef]
- Burger, J.; Huber, T.; Lloret-Fritschi, E.; Mata-Falcón, J.; Gramazio, F.; Kohler, M. Design and fabrication of optimised ribbed concrete floor slabs using large scale 3D printed formwork. Autom. Constr. 2022, 144, 104599. [Google Scholar] [CrossRef]
- Tan, C.; Zhang, Y.; Zhao, H.; Zhang, B.; Du, T. Study on Shear-Lag Effect of Steel–UHPC Ribbed Slab Composite Structures Using Bar Simulation Method. Buildings 2022, 12, 1884. [Google Scholar] [CrossRef]
- Martín-Sanz, H.; Herraiz, B.; Brühwiler, E.; Chatzi, E. Shear-bending failure modeling of concrete ribbed slabs strengthened with UHPFRC. Eng. Struct. 2020, 222, 110846. [Google Scholar] [CrossRef]
- Rossi, P.; Arca, A.; Parant, E.; Fakhri, P. Bending and compressive behaviours of a new cement composite. Cem. Concr. Res. 2005, 35, 27–33. [Google Scholar] [CrossRef]
- Xiao, J.-L.; Zhou, M.; Nie, J.-G.; Yang, T.-Y.; Fan, J.-S. Flexural behavior of steel-UHPC composite slabs with perfobond rib shear connectors. Eng. Struct. 2021, 245, 112912. [Google Scholar] [CrossRef]
- Liu, J.; Hu, H.; Li, J.; Chen, Y.F.; Zhang, L. Flexural behavior of prestressed concrete composite slab with precast inverted T-shaped ribbed panels. Eng. Struct. 2020, 215, 110687. [Google Scholar] [CrossRef]
- Fodzi, N.H.M.; Hashim, M.H.M. Structural Effect of Using Steel Fiber Reinforcement on the Punching Shear of Self-Compacting Fiber Reinforced Concrete (SCFRC) Ribbed Slabs. Mater. Sci. Forum 2019, 972, 99–104. [Google Scholar] [CrossRef]
- Abdulhussein, S.S.; Alfeehan, A.A. Utilization of Iron Lathe Waste and Post-Tensioned Steel Reinforcement in Lightweight Concrete Ribbed Slabs. In Proceedings of the 2020 2nd Al-Noor International Conference for Science and Technology (NICST), Baku, Azerbaijan, 28–30 August 2020; pp. 44–50. [Google Scholar] [CrossRef]
- Buka-Vaivade, K.; Sliseris, J.; Serdjuks, D.; Sahmenko, G.; Pakrastins, L. Numerical Comparison of HPFRC and HPC Ribbed Slabs. IOP Conf. Ser. Mater. Sci. Eng. 2019, 660, 12054. [Google Scholar] [CrossRef]
- Mastali, M.; Valente, I.B.; Barros, J.A.O. Development of innovative hybrid sandwich panel slabs: Advanced numerical simulations and parametric studies. Compos. Struct. 2016, 152, 362–381. [Google Scholar] [CrossRef]
- Ruggieri, S.; Porco, F.; Uva, G. A numerical procedure for modeling the floor deformability in seismic analysis of existing RC buildings. J. Build. Eng. 2018, 19, 273–284. [Google Scholar] [CrossRef]
- He, Z.; Lin, P. Research on fatigue performance and optimal design of steel-UHPC composite slab. Structures 2022, 43, 682–695. [Google Scholar] [CrossRef]
- Jin, L.; Zhao, X.; Zhang, R.; Du, X. Evaluation of impact response of thermal-damaged FRP-RC slabs: Effects of FRP bar type and concrete cover thickness. J. Build. Eng. 2023, 75, 107079. [Google Scholar] [CrossRef]
- Bilotta, A.; Compagnone, A.; Esposito, L.; Nigro, E. Structural behaviour of FRP reinforced concrete slabs in fire. Eng. Struct. 2020, 221, 111058. [Google Scholar] [CrossRef]
- Wiesner, F.; Bartlett, A.; Mohaine, S.; Robert, F.; McNamee, R.; Mindeguia, J.-C.; Bisby, L. Structural Capacity of One-Way Spanning Large-Scale Cross-Laminated Timber Slabs in Standard and Natural Fires. Fire Technol. 2021, 57, 291–311. [Google Scholar] [CrossRef]
- Xu, Q.; Chen, L.; Li, X.; Han, C.; Wang, Y.C.; Zhang, Y. Comparative experimental study of fire resistance of two-way restrained and unrestrained precast concrete composite slabs. Fire Saf. J. 2020, 118, 103225. [Google Scholar] [CrossRef]
- Azevedo, A.S.; Firmo, J.P.; Correia, J.R.; Chastre, C.; Biscaia, H.; Franco, N. Fire behaviour of CFRP-strengthened RC slabs using different techniques—EBR, NSM and CREatE. Compos. B Eng. 2022, 230, 109471. [Google Scholar] [CrossRef]
- Zhang, R.; Zhao, X.; Jin, L.; Du, X. Effect of elevated temperature on the low-velocity impact performances of GFRP reinforced concrete slabs. Constr. Build. Mater. 2023, 395, 132285. [Google Scholar] [CrossRef]
- Hajiloo, H.; Green, M.F.; Noël, M.; Bénichou, N.; Sultan, M. GFRP-Reinforced Concrete Slabs: Fire Resistance and Design Efficiency. J. Compos. Constr. 2019, 23, 04019009. [Google Scholar] [CrossRef]
- del Coz-Díaz, J.J.; Martínez-Martínez, J.E.; Alonso-Martínez, M.; Rabanal, F.P.Á. Comparative study of LightWeight and Normal Concrete composite slabs behaviour under fire conditions. Eng. Struct. 2020, 207, 110196. [Google Scholar] [CrossRef]
- Heo, I.; Darkhanbat, K.; Han, S.-J.; Choi, S.-H.; Jeong, H.; Kim, K.S. Experimental and Numerical Investigations on Fire-Resistance Performance of Precast Concrete Hollow-Core Slabs. Appl. Sci. 2021, 11, 11500. [Google Scholar] [CrossRef]
- Sui, Z.-A.; Dong, K.; Jiang, J.; Yang, S.; Hu, K. Flexural Behavior of Fire-Damaged Prefabricated RC Hollow Slabs Strengthened with CFRP versus TRM. Materials 2020, 13, 2556. [Google Scholar] [CrossRef]
- Bolina, F.L.; Rodrigues, J.P.C. Finite element analysis criteria for composite steel decking concrete slabs subjected to fire. Fire Saf. J. 2023, 139, 103818. [Google Scholar] [CrossRef]
- Flecknoe-Brown, K.W.; van Hees, P. Geometrical and environmental effect on fire behaviour of polyurethane foam slabs. Fire Mater. 2023, 47, 892–909. [Google Scholar] [CrossRef]
- FIB Bulletin 38. In Fire Design of Concrete Structures—Materials, Structures and Modelling—State of Art Report; Fédération Internationale du Béton: Lausanne, Switzerland, 2007.
- Qiao, R.; Guo, Y.; Zhou, H.; Xi, H. Explosive Spalling Mechanism and Modeling of Concrete Lining Exposed to Fire. Materials 2022, 15, 3131. [Google Scholar] [CrossRef] [PubMed]
- Khoury, G.A. Effect of fire on concrete and concrete structures. Prog. Struct. Eng. Mater. 2000, 2, 429–447. [Google Scholar] [CrossRef]
- Tenchev, R.; Purnell, P. An application of a damage constitutive model to concrete at high temperature and prediction of spalling. Int. J. Solids Struct. 2005, 42, 6550–6565. [Google Scholar] [CrossRef]
- EN 1992-1.2; Eurocode 2: Design of Concrete Structures—Part 1-2: General Rules—Structural Fire Design. European Committee for Standardization: Brussels, Belgium, 2004.
- DIN 4102; Fire Behaviour of Building Materials and Building Components—Part 4: Synopsis and Application of Classified Building Materials, Components and Special Components. Deutsches Institut für Normung: Berlin, Germany, 2016.
- ISO 834; Fire-Resistance Tests—Elements of Building Construction—Part 1: General Requirements. International Organization for Standardization: Geneva, Switzerland, 1999.
- Qin, D.; Gao, P.; Aslam, F.; Sufian, M.; Alabduljabbar, H. A comprehensive review on fire damage assessment of reinforced concrete structures. Case Stud. Constr. Mater. 2022, 16, e00843. [Google Scholar] [CrossRef]
- EN 1992-1.1; Eurocode 1: Actions on Structures—Part 1-1: General Actions—Densities, Self-Weight, Imposed Loads for Buildings. European Standard. European Committee for Standardization: Brussels, Belgium, 2004.
- Bolina, F.L.; Schallenberger, M.; Carvalho, H. Experimental and numerical evaluation of RC ribbed slabs in fire conditions. Structures 2023, 51, 747–759. [Google Scholar] [CrossRef]
- ASTM C 150; Standard Specification for Portland Cement. American Society for Testing and Materials: West Conshohocken, PA, USA, 2007.
- ASTM C39; Standard Test Method for Compressive Strength of Cylindrical Concrete Specimens. American Society for Testing and Materials: West Conshohocken, PA, USA, 2022.
- BS 476-20; Fire Tests on Building Materials and Structures—Part 20. Method of Test for Determination of the Fire Resistance of Elements of Construction (General Principles). British Standard: London, UK, 1987.
- ASTM E119; Standard Test Methods for Fire Tests of Building Construction and Materials. American Society for Testing and Materials: West Conshohocken, PA, USA, 2020.
- BS EN 1363-1; Fire Resistance Tests General Requirements. European Standards: Geneva, Switzerland, 2020.
- Abaqus. Abaqus Analysis User’s Guide. 2016. Available online: https://www.3ds.com/products/simulia/abaqus (accessed on 1 May 2025).
- Wang, Y.; Jiang, Y.; Huang, Z.; Li, L.; Huang, Y.; Zhang, Y.; Zhang, G.; Zhang, X.; Duan, Y. Post-fire behaviour of continuous reinforced concrete slabs under different fire conditions. Eng. Struct. 2021, 226, 111342. [Google Scholar] [CrossRef]
- Zhao, H.; Zhao, J.; Wang, R.; Zhang, W.; Liu, F.; Wu, S. Thermal behavior of composite slabs with closed profiled steel decking and recycled aggregate concrete in fire. Fire Saf. J. 2022, 132, 103637. [Google Scholar] [CrossRef]
- Das, A.; Bošnjak, J.; Sharma, A. Post-fire bond behaviour of reinforcement in concrete considering different bonded lengths and position of rebars. Eng. Struct. 2023, 296, 116908. [Google Scholar] [CrossRef]
- Bolina, F.L.; Gil, A.M.; Fernandes, B.; Hennemann, G.G.; Gonçalves, J.; Tutikian, B.F. Influence of design durability on concrete columns fire performance. J. Mater. Res. Technol. 2020, 9, 4968–4977. [Google Scholar] [CrossRef]
- Manica, G.C.; Bolina, F.L.; Tutikian, B.F.; Oliveira, M.; Moreira, M.A. Influence of curing time on the fire performance of solid reinforced concrete plates. J. Mater. Res. Technol. 2020, 9, 2506–2512. [Google Scholar] [CrossRef]
- Bolina, F.L.; Rodrigues, J.P.C. Numerical study and proposal of new design equations for steel decking concrete slabs subjected to fire. Eng. Struct. 2022, 253, 113828. [Google Scholar] [CrossRef]


| Material | Mixing Ratio (kg/m3) | Mixing Ratio |
|---|---|---|
| Cement | 440 | 1.00 |
| Gravel 1 | 400 | 0.91 |
| Gravel 2 | 320 | 0.73 |
| Industrialized Sand | 320 | 0.73 |
| Natural Sand | 960 | 2.18 |
| Water | 200 ± 20 | 0.45 ± 0.05 |
| Slab Nomenclature | Cross-Section Dimensions (mm) | |||
|---|---|---|---|---|
| C | ||||
| study of the geometry of the ribs | ||||
| 80 × 300 × 100 | 80 | 300 | 100 | 10 to 40 |
| 100 × 300 × 100 | 100 | 300 | 100 | 10 to 50 |
| 120 × 300 × 100 | 120 | 300 | 100 | 10 to 60 |
| 160 × 300 × 100 | 160 | 300 | 100 | 10 to 80 |
| 190 × 300 × 100 | 190 | 300 | 100 | 10 to 90 |
| 220 × 300 × 100 | 220 | 300 | 100 | 10 to 90 |
| 250 × 300 × 100 | 250 | 300 | 100 | 10 to 90 |
| 260 × 300 × 100 | 260 | 300 | 100 | 10 to 90 |
| 300 × 300 × 100 | 300 | 300 | 100 | 10 to 90 |
| 350 × 300 × 100 | 350 | 300 | 100 | 10 to 90 |
| 410 × 300 × 100 | 410 | 300 | 100 | 10 to 90 |
| 500 × 300 × 100 | 500 | 300 | 100 | 10 to 90 |
| study of the geometry of the flange | ||||
| 100 × 300 × 80 | 100 | 300 | 80 | 5 to 40 |
| 100 × 300 × 90 | 100 | 300 | 90 | 5 to 45 |
| 100 × 300 × 100 | 100 | 300 | 100 | 5 to 50 |
| 100 × 300 × 110 | 100 | 300 | 110 | 5 to 55 |
| 100 × 300 × 120 | 100 | 300 | 120 | 5 to 60 |
| 100 × 300 × 130 | 100 | 300 | 130 | 5 to 65 |
| 100 × 300 × 140 | 100 | 300 | 140 | 5 to 70 |
| 100 × 300 × 150 | 100 | 300 | 150 | 5 to 75 |
| 100 × 300 × 160 | 100 | 300 | 160 | 5 to 80 |
| 100 × 300 × 170 | 100 | 300 | 170 | 5 to 85 |
| 100 × 300 × 175 | 100 | 300 | 175 | 5 to 85 |
| FRR (min) | Reference | Alternative #1 | Alternative #2 | Alternative #3 |
|---|---|---|---|---|
| 30 | EN 1992-1.2 [37] | X | X | |
| X | X | |||
| Research data | X | X | ||
| 60 | EN 1992-1.2 | |||
| Research data | ||||
| 90 | EN 1992-1.2 | |||
| Research data | ||||
| 120 | EN 1992-1.2 | |||
| Research data | ||||
| 180 | EN 1992-1.2 | |||
| Research data | ||||
| 240 | EN 1992-1.2 | |||
| Research data |
| FRR min | Flange h/a mm/mm | |
|---|---|---|
| EN 1992 | Research data | |
| 30 | 80/10 | 80/10 |
| 60 | 80/10 | 80/20 |
| 90 | 100/15 | 100/30 |
| 120 | 120/20 | 110/35 |
| 180 | 150/30 | 140/45 |
| 240 | 170/40 | 160/55 |
| FRR | (mm) | ||||||||||
|---|---|---|---|---|---|---|---|---|---|---|---|
| 80 | 100 | 120 | 160 | 190 | 220 | 250 | 300 | 350 | 410 | 500 | |
| C (mm) | |||||||||||
| 30 | 25 | 25 | 20 | 20 | 20 | 20 | 20 | 20 | 20 | 20 | 20 |
| 60 | - | 50 | 40 | 40 | 40 | 40 | 40 | 40 | 40 | 40 | 40 |
| 90 | - | - | - | 55 | 50 | 50 | 50 | 50 | 50 | 50 | 50 |
| 120 | - | - | - | 75 | 65 | 65 | 60 | 60 | 60 | 60 | 60 |
| 150 | - | - | - | - | 80 | 75 | 70 | 70 | 70 | 70 | 70 |
| 180 | - | - | - | - | - | 85 | 80 | 80 | 80 | 80 | 80 |
| 210 | - | - | - | - | - | 95 | 90 | 85 | 85 | 85 | 85 |
| 240 | - | - | - | - | - | - | 105 | 95 | 95 | 95 | 95 |
| FRR | (mm) | ||||||||||
|---|---|---|---|---|---|---|---|---|---|---|---|
| 80 | 100 | 120 | 160 | 190 | 220 | 250 | 300 | 350 | 410 | 500 | |
| C (mm) | |||||||||||
| 30 | 20 | 20 | 15 | 15 | 15 | 15 | 15 | 15 | 15 | 15 | 15 |
| 60 | - | - | 40 | 35 | 35 | 35 | 35 | 35 | 35 | 35 | 35 |
| 90 | - | - | - | 50 | 45 | 45 | 45 | 45 | 45 | 45 | 45 |
| 120 | - | - | - | - | 60 | 55 | 55 | 55 | 55 | 55 | 55 |
| 150 | - | - | - | - | - | 70 | 65 | 65 | 65 | 65 | 65 |
| 180 | - | - | - | - | - | 85 | 80 | 75 | 75 | 75 | 75 |
| 210 | - | - | - | - | - | - | 90 | 85 | 80 | 80 | 80 |
| 240 | - | - | - | - | - | - | 100 | 90 | 85 | 85 | 85 |
| Ribbed Slab | FRR (min) | |||||||
|---|---|---|---|---|---|---|---|---|
| 30 | 60 | 90 | 120 | 150 | 180 | 210 | 240 | |
| h (mm) | 80 | 80 | 100 | 110 | 130 | 140 | 150 | 160 |
| C′ (mm) | 10 | 20 | 30 | 35 | 40 | 45 | 50 | 55 |
Disclaimer/Publisher’s Note: The statements, opinions and data contained in all publications are solely those of the individual author(s) and contributor(s) and not of MDPI and/or the editor(s). MDPI and/or the editor(s) disclaim responsibility for any injury to people or property resulting from any ideas, methods, instructions or products referred to in the content. |
© 2025 by the authors. Licensee MDPI, Basel, Switzerland. This article is an open access article distributed under the terms and conditions of the Creative Commons Attribution (CC BY) license (https://creativecommons.org/licenses/by/4.0/).
Share and Cite
Bolina, F.L.; Henn, A.S.; Dal Lago, B. Simplified Design Procedure for RC Ribbed Slabs in Fire Based on Experimental and Numerical Thermal Analysis. Buildings 2025, 15, 1631. https://doi.org/10.3390/buildings15101631
Bolina FL, Henn AS, Dal Lago B. Simplified Design Procedure for RC Ribbed Slabs in Fire Based on Experimental and Numerical Thermal Analysis. Buildings. 2025; 15(10):1631. https://doi.org/10.3390/buildings15101631
Chicago/Turabian StyleBolina, Fabrício Longhi, Arthur S. Henn, and Bruno Dal Lago. 2025. "Simplified Design Procedure for RC Ribbed Slabs in Fire Based on Experimental and Numerical Thermal Analysis" Buildings 15, no. 10: 1631. https://doi.org/10.3390/buildings15101631
APA StyleBolina, F. L., Henn, A. S., & Dal Lago, B. (2025). Simplified Design Procedure for RC Ribbed Slabs in Fire Based on Experimental and Numerical Thermal Analysis. Buildings, 15(10), 1631. https://doi.org/10.3390/buildings15101631