Article

Performance Analysis of Control Valves for Supply–Demand Balance Regulation in Heating Stations

School of Energy and Environment Engineering, Hebei University of Technology, Tianjin 300401, China
*
Author to whom correspondence should be addressed.
Buildings 2025, 15(10), 1624; https://doi.org/10.3390/buildings15101624
Submission received: 8 April 2025 / Revised: 7 May 2025 / Accepted: 9 May 2025 / Published: 11 May 2025
(This article belongs to the Special Issue Optimization Control and Energy Conservation in Smart Heating Systems)

Abstract

With the high penetration of renewable energy, the imbalance between heat supply and demand is becoming increasingly severe. Installing additional heat storage bypass pipelines in the heating network can significantly enhance the heat storage capacity of the system, and regulating the supply and demand balance of heat stations can achieve a stable heat supply for users. This paper proposes a heat storage bypass configuration scheme and a dual-valve-coordinated control system. Based on the control valves’ ideal and operational flow characteristics, this paper delves into the minimum and maximum control impedance mechanisms in control valves, analyzing their impact on operational performance. Aiming at the fluctuation in the water supply temperature in the secondary pipe network (dead zone of 1%), the influence of control valve parameters on the dynamic response was systematically analyzed. The optimal parameter-matching scheme of the bypass control valve and the heat exchange control valve was finally determined through an optimization analysis. We verified its correctness based on the measured engineering data. This study improves the stability and operational efficiency of the supply and demand balance and decoupling control of the heating heat exchange unit, thereby establishing a critical technical foundation for advancing the high-efficiency integration of renewable energy sources within urban energy systems.

1. Introduction

Under the “Dual Carbon” goals, the global energy system is transitioning from a traditional system highly reliant on fossil fuels to a regional integrated energy system incorporating renewable energy sources [1]. Integrating renewable energy into heating systems is crucial for achieving cleaner, more efficient, and more innovative heating systems. However, using renewable energy for heating faces both technological and economic challenges. The most prominent issue is its dependence on climatic, seasonal, and diurnal factors, which lead to instability and uncontrollability. This makes it challenging to align with the fluctuating heating demand, resulting in heat source variability that negatively impacts the stability and efficiency of the heating system [2,3,4].
Utilizing the thermal inertia of heating networks for heat storage is a significant approach to addressing the challenges. However, most studies on heat storage in heating networks have not involved modifications to the network itself; instead, they rely on the existing structure to achieve heat storage [5]. This approach is more passive, and the process of attaining a supply–demand balance is relatively complex. Currently, more scholars are focusing their research on bypass heat storage technology. For instance, Wang et al. proposed a district heating network (DHN) topology reconfiguration method that involves configuring a bypass branch on the primary side of the heating substation to maximize heat storage benefits. This innovative approach enhances the system’s ability to store and utilize heat more effectively [6]. It provides a practical solution for optimizing the integration of renewable energy sources and improving heating systems’ overall efficiency and flexibility. Such advancements highlight the growing importance of bypass heat storage technology in addressing the challenges of modern energy systems [7]. Tang et al. demonstrated the feasibility of bypassing heat storage through numerical simulations, showing that this approach does not significantly increase heat loss in the heating system. Their findings underscore the practical potential of bypass heat storage as an efficient and effective method for enhancing thermal energy management without compromising system performance. This further validates the technology’s role in optimizing heating systems, particularly in integrating renewable energy and improving operational flexibility [8].
However, regulating a specific heating substation inevitably impacts the operation of other substations within the system, affecting overall network conditions [9,10,11]. It is crucial to implement supply–demand balance regulation and decoupling control at heating substations to enhance the initiative and flexibility of heat storage in heating networks. This approach allows for more the precise and independent management of individual substations, minimizing interference across the network while optimizing overall system performance. By adopting such strategies, the heating system can better adapt to fluctuations in renewable energy supply and heating demand, ensuring stability and efficiency [12]. At present, more scholars have paid attention to the balance between supply and demand in heat stations. Knudsen et al. proposed a heat storage–heat release synergistic control strategy based on MPC. In the verification at a certain heat station in Denmark, the pressure fluctuation in the heat network was reduced to ±3%, and the response time was shortened to 15 s [13]. Ld et al. developed the DDPG algorithm to achieve the flow-temperature decoupling control of multi-zone heat exchange stations, increasing the decoupling degree R from 0.75 to 0.93 in a certain project in Germany [14]. X et al. developed a lightweight MPC algorithm (delay <50 ms), which, in combination with a digital twin platform, increased the dynamic response speed of the heat exchange station by 40%. Most studies mainly start with the control methods and control approaches to improve the stability of the operation of heat exchange stations [15]. However, the regulation and control of the heat station cannot be done without the control valve. This paper starts with the control valve’s control performance to improve the heat station’s stability.
This paper proposes a bypass heat storage scheme based on the current research status of a dual-valve-coordinated control system. This scheme includes a bypass pipeline and a bypass control valve in the primary network. On one hand, the high-temperature heat medium is recirculated through the bypass, raising the average temperature of the heat medium. On the other hand, by controlling the bypass flow rate and the pressure difference across the heating substation, it becomes possible to achieve a supply–demand balance and decoupling control at the substation level [16]. Due to the time delay in heat transfer within the heat exchanger, conventional closed-loop feedback control cannot directly account for the system’s dynamic response, making it difficult to adapt to the heat medium’s transmission delay. In contrast, feedforward control can proactively anticipate changes in the heat source, reducing overshoot and oscillations during the regulation process [17,18,19,20]. This approach significantly enhances the precision and stability of heating substation control, offering a more effective solution for managing the complexities of heat transfer delays and improving the overall system performance.
Based on the above-mentioned current situation, this paper focuses on improving the stability and operational efficiency of the supply–demand balance and decoupling control in the heating substation by adjusting the characteristic parameters of the control valves. By analyzing the influence of different control valve parameters on the working process of the control valve, the most suitable type and parameters for the heat storage bypass system are expected to be found. The main contents of this paper’s research are as follows:
  • This study takes the ideal flow characteristics and working flow characteristics of the control valve as the theoretical starting point, systematically analyses the dual-constraint mechanism of the minimum control impedance and maximum control impedance of the control valve on the response characteristics and control accuracy of the control valve and further explores the action laws of the two key parameters on the comprehensive performance of the control valve.
  • According to the fluctuation conditions of the secondary network water supply temperature and the bypass flow rate when the dead zone is 1% under different setting situations of control valve parameters, the optimal parameter configurations of the bypass control valve and the heat exchange control valve are obtained.

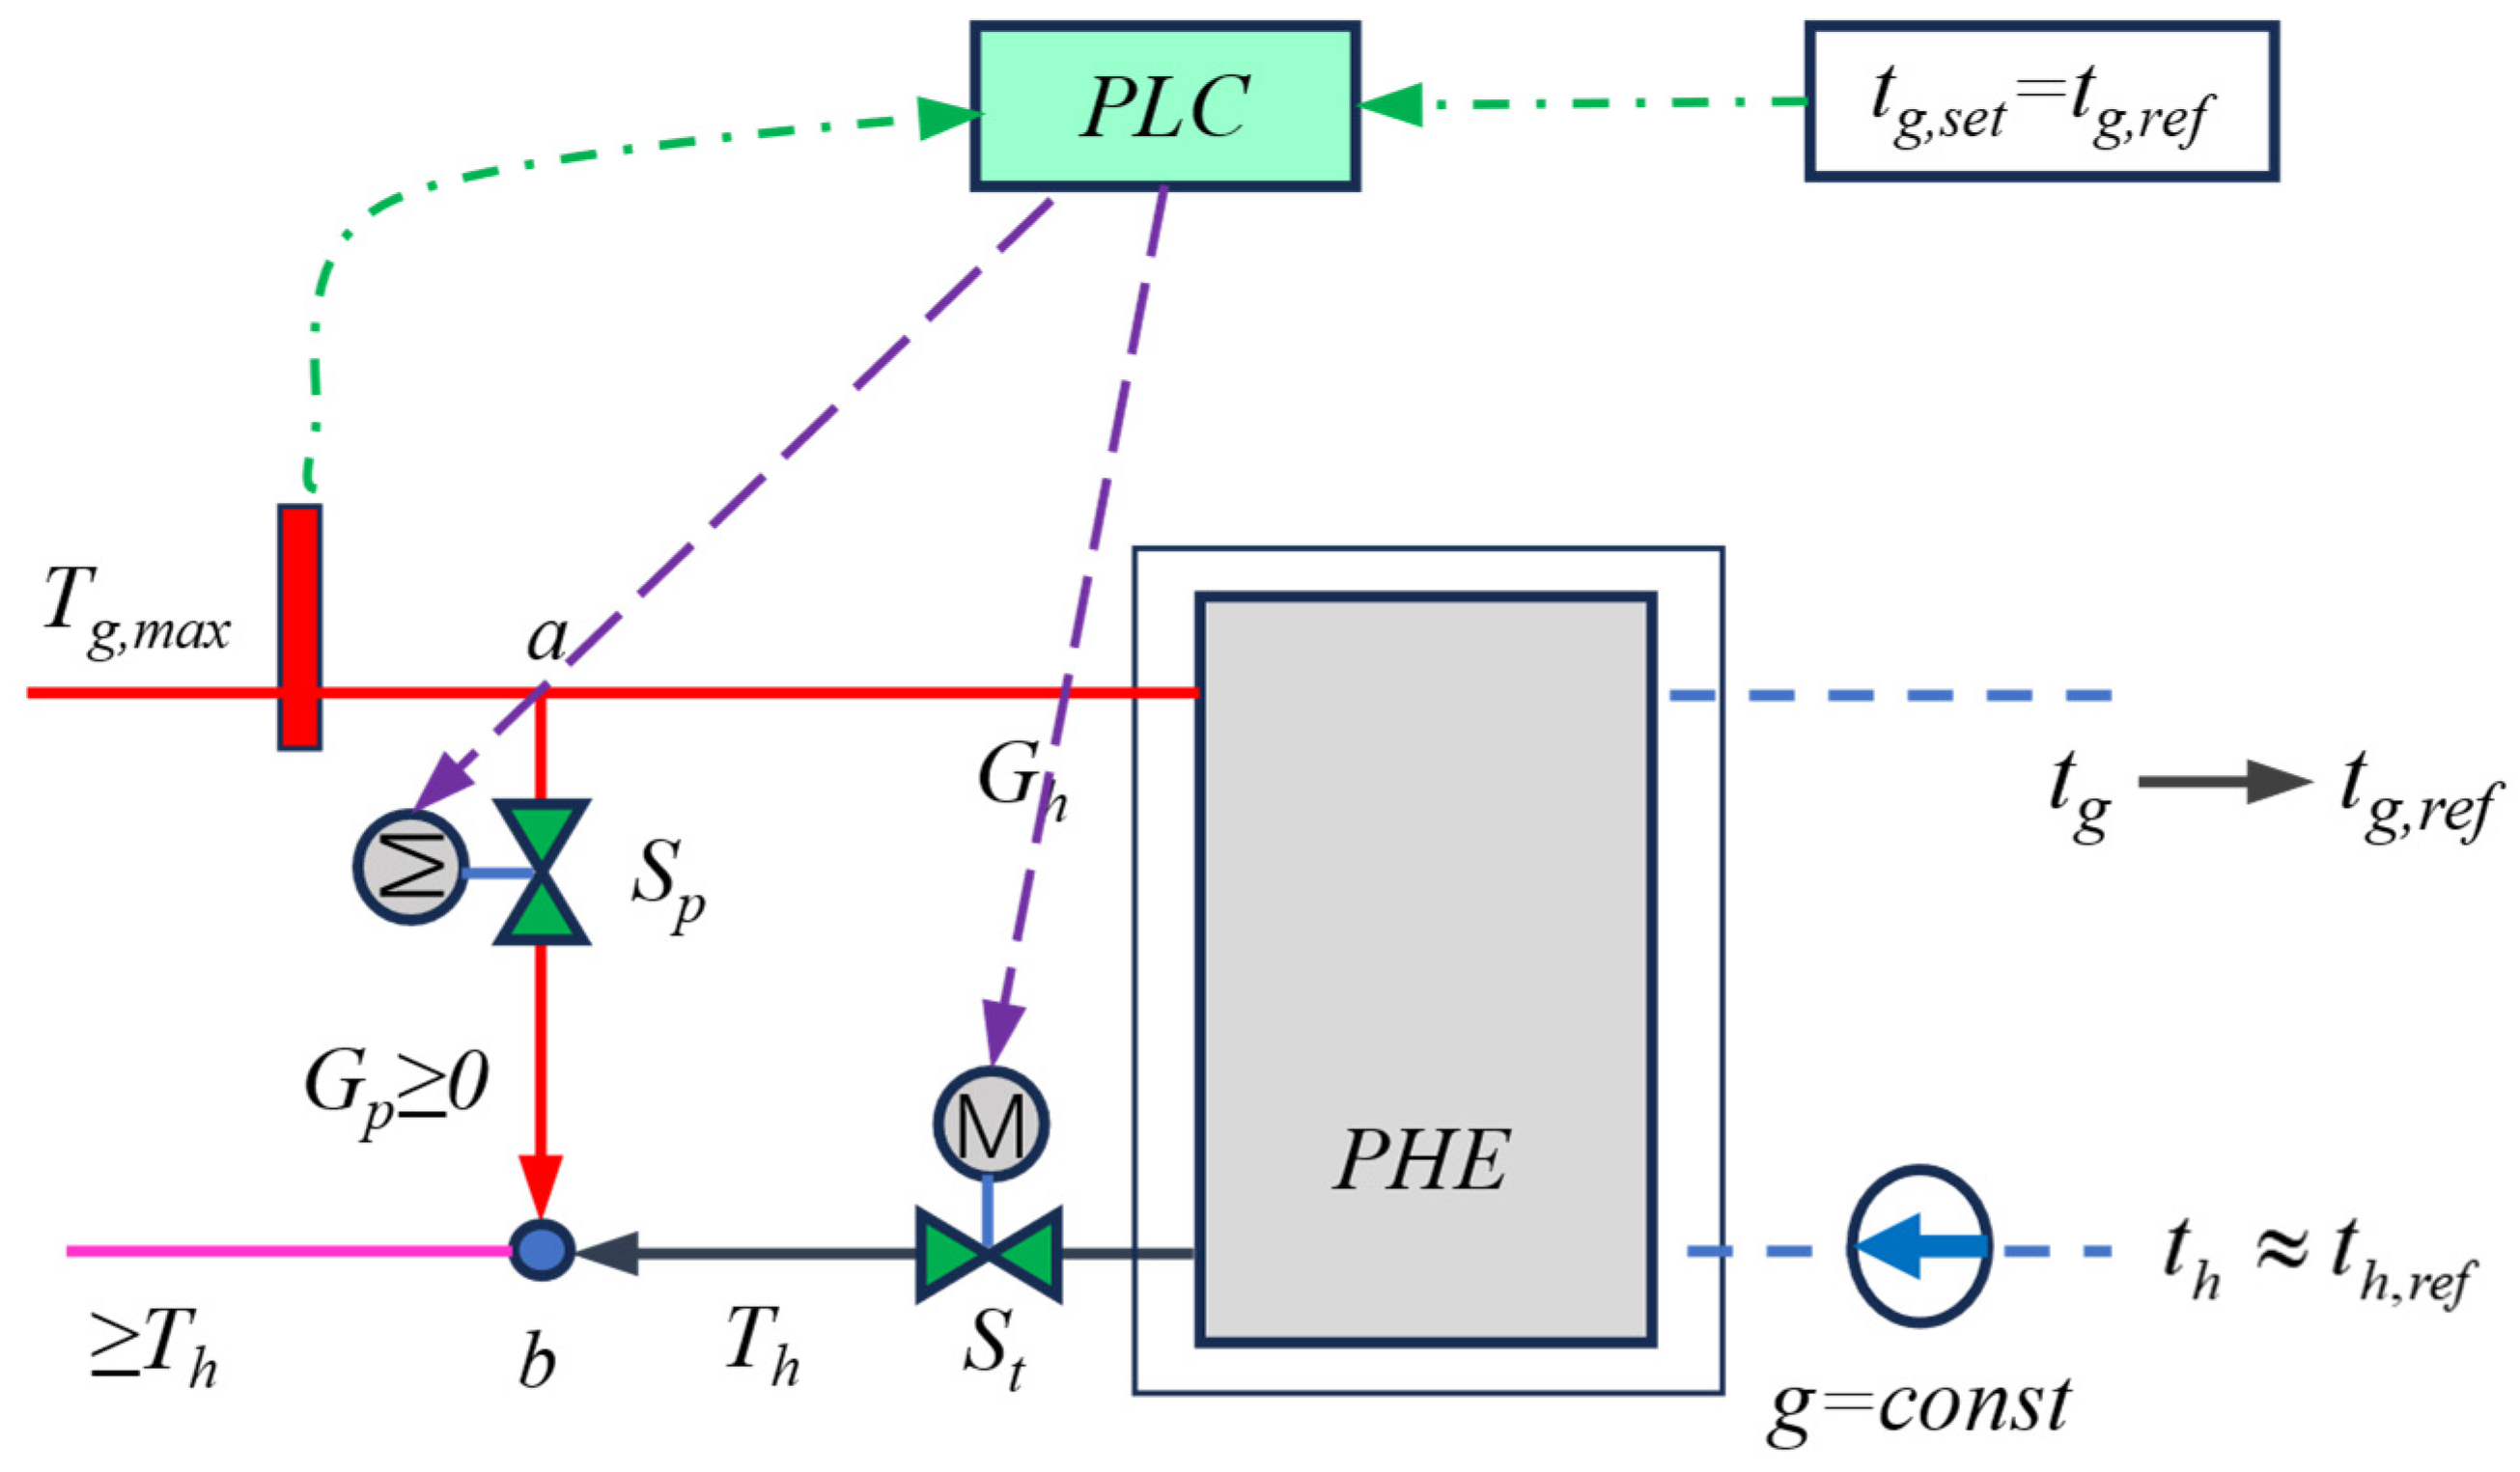
2. Thermal Storage Bypass Configuration Scheme

The thermal storage bypass configuration scheme proposed in this paper is illustrated in Figure 1. The core equipment involved in this scheme mainly includes the following: a heat exchanger, a bypass control valve, a heat exchange control valve, and a PLC controller.
During actual heating operations, when the heating demand dynamically changes, or the heat source experiences unstable fluctuations under complex working conditions, the controller collects real-time signals fed back by the primary network supply water temperature. The controller relies on its built-in algorithm to calculate the received temperature signals. Based on the calculation results, it outputs corresponding opening degree command signals to the bypass and heat exchange control valves. By adjusting the opening degrees of these two valves, the bypass flow and the heat exchange flow are regulated. In this way, the flow state of the heat medium within the heating network can be effectively controlled, ensuring that the heating power of the heat exchange station remains constant and the pressure difference between points a and b in the heating network is stabilized. From a macro-operational perspective of the heating system, this series of control operations achieves a precise balance between the heating supply and the demand, as well as decoupled and optimized system control.

3. Supply–Demand Balance Regulation and Decoupling Control in Heat Stations

3.1. Calculation of Control Valve Flow Rate

During the dynamic heat storage process in the primary network, as the supply water temperature of the primary network increases, the heat exchange flow rate on the primary side of the heat exchange station is reduced, and the bypass flow rate is increased to ensure that the supply water temperature of the secondary network remains stable at the set value. This achieves a balance between the supply and the demand at the heat exchange station. Based on the energy conservation equation, a mathematical relationship is established between the supply and return water temperatures of the primary network, the heat exchange flow ratio, and the bypass flow ratio:
c p T g , r e f T h , r e f = c p β t G T g T h G B L M T D r e f = β t G B L M T D
where cp is the specific heat capacity at constant pressure, J/(kg·°C); Tg,ref is the reference supply water temperature of the primary network, °C; Th,ref is the reference return water temperature of the primary network, °C; Tg is the theoretical water supply temperature of the primary network, °C; Th is the theoretical return water temperature of the primary network, °C; G is the circulation flow rate of the primary network in the heat station, t/h; tg,ref is the reference supply water temperature of the secondary network, °C; K is the relative heat transfer coefficient of the heat station, W / m 2 K ; LMTDref is the reference logarithmic mean temperature difference of heat exchanger; LMTD is the logarithmic mean temperature difference of heat exchanger; βt is the heat exchange flow ratio; and B is the empirical coefficient (constant value B = 0.3). The heat transfer coefficient, K, of the PHE is proportional to the power of B of the heat exchange flow rate on its secondary side.
In Equation (1),
L M T D r e f = T g , r e f t g , r e f T h , r e f t h , r e f l n T g , r e f t g , r e f l n T h , r e f t h , r e f L M T D = T g t g , r e f T h t h , r e f l n T g t g , r e f l n T h t h , r e f

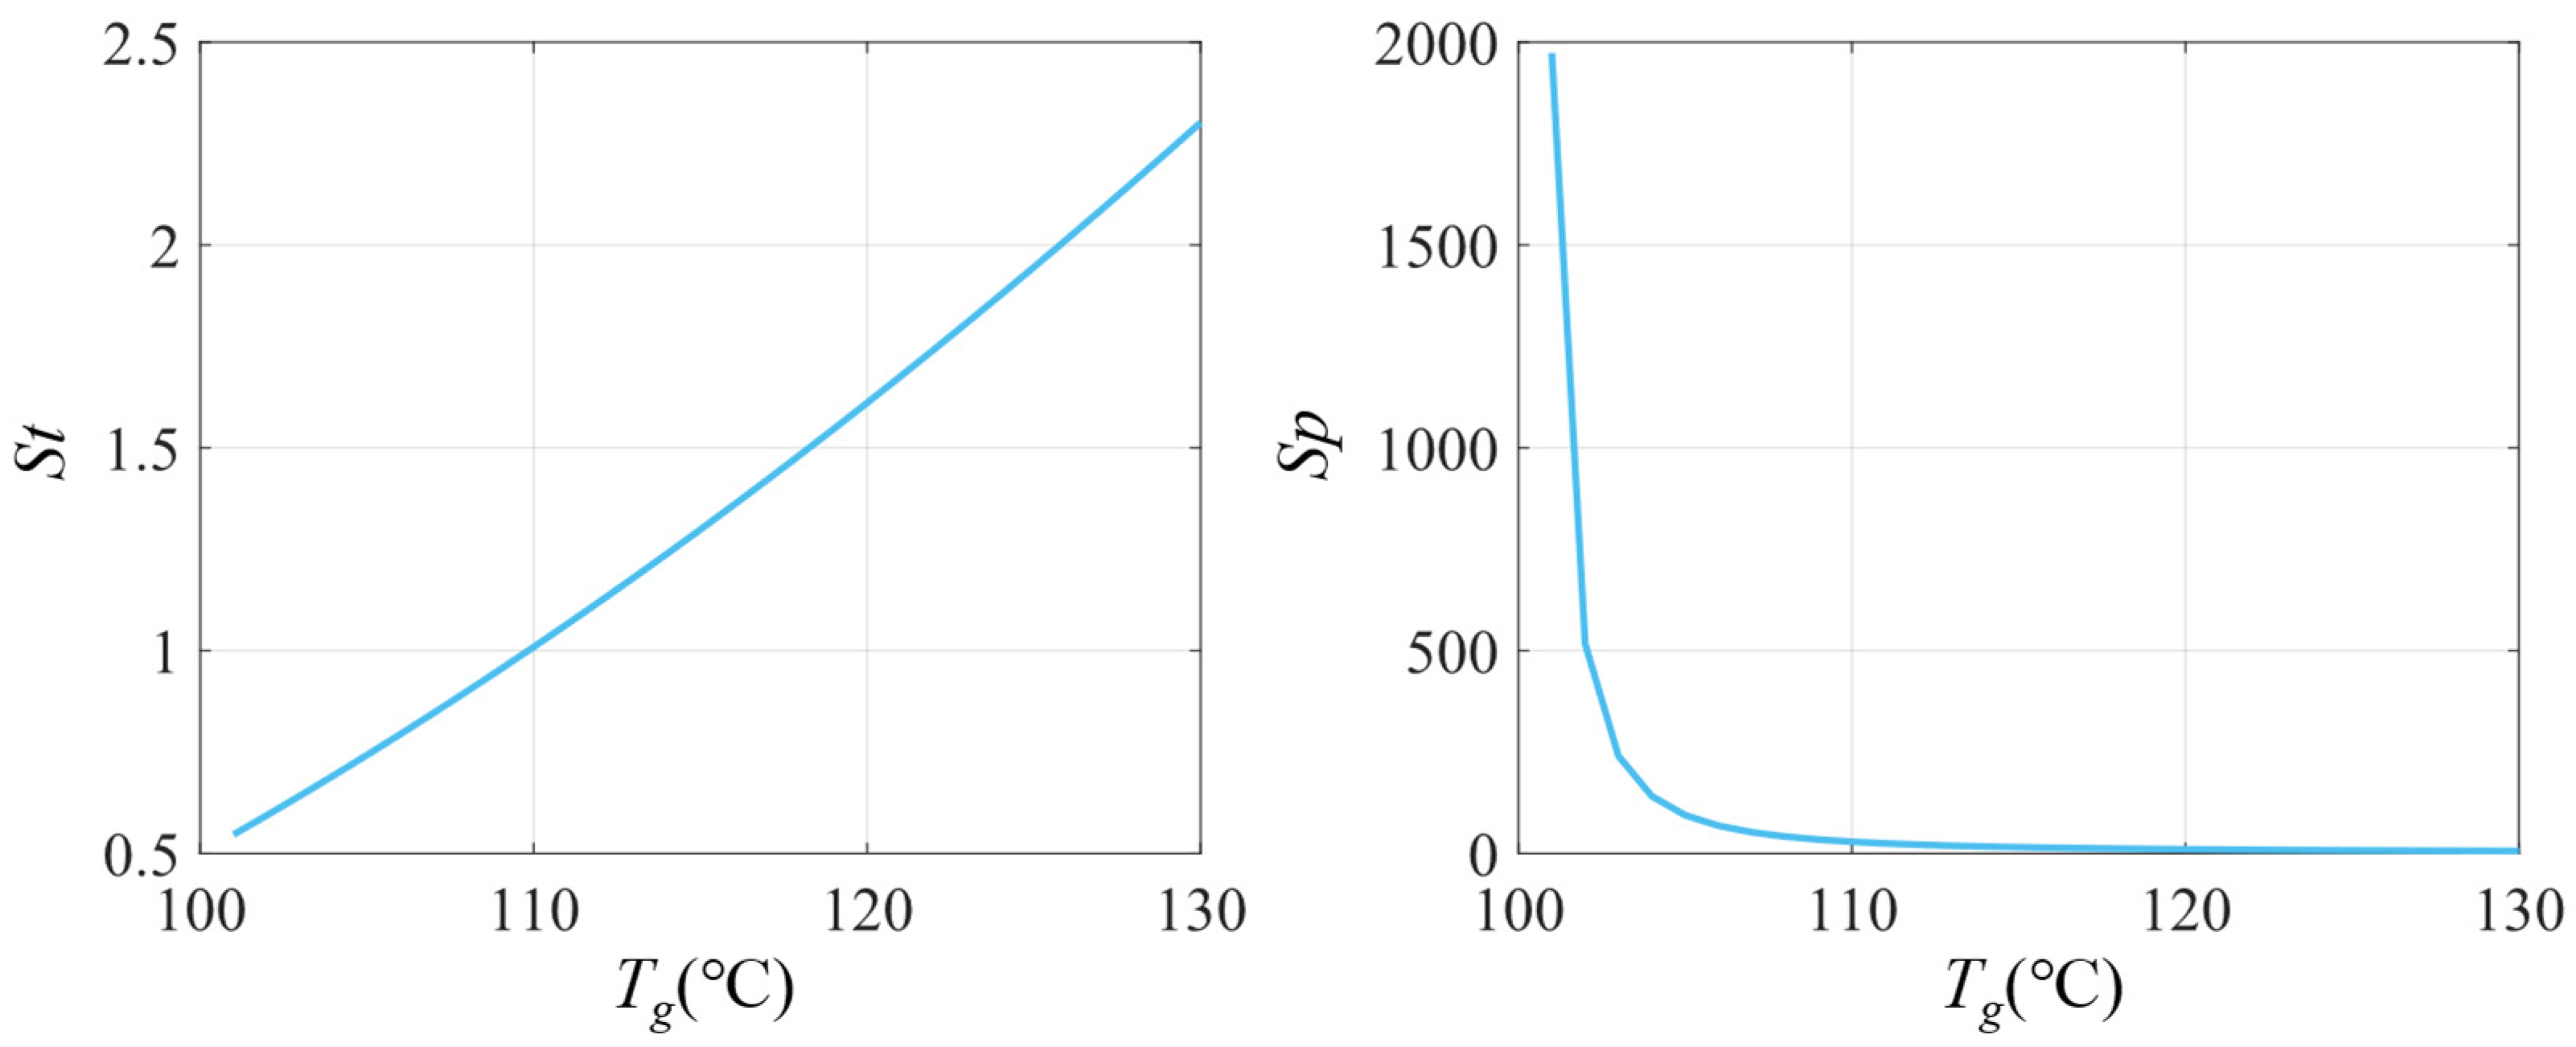
3.2. Calculation of Control Valve Impedance

The mathematical relationship between the relative flow rate of the control valve and the impedance of the control valve is as follows:
S h + S t 0.5 + S p 0.5 = S h , r e f + S t , r e f 0.5 β t β p = β t 1 β t = S p S h + S t 0.5
where Sh is the equivalent impedance of the PHE in the primary network. In this study, the equivalent impedance is a fixed value of 0.5; St is the impedance of the heat exchange control valve; St,ref is the impedance of the heat exchange control valve under the reference condition; Sp is the impedance of the bypass control valve; βt is the theoretical heat exchange flow ratio; and βp is the theoretical bypass flow ratio.

3.3. The Calculation of the Theoretical Opening of the Heat Exchange Control Valve

As shown in Figure 1, the heat exchange control valve is connected in series with the heat exchanger. Therefore, the theoretical opening degree of the control valve should take into account the valve authority, and the calculation formula is as follows:
K D t =              S v R 2 β 2 + S v 1 1 Z 2 1 R 1 Z 1 ,     Z 1 1 2 l o g R S v β 2 + S v 1 + 1 ,     Z = 1
where β is the relative flow rate of the control valve; KDt is the theoretical opening of the control valve; R is the rangeability of the control valve; Sv is the valve authority of the control valve; Z is the control valve type parameters; and the corresponding Z values for the common quick-opening, linear, parabolic, and equal percentage control valves are −1, 0, 0.5, and 1, respectively.
In Equation (4),
R = S t , m i n S t , m a x S v = S t , m i n S t , m i n + S h
where St,max is the maximum control impedance of the control valve; and St,min is the minimum control impedance of the control valve.

3.4. The Calculation of the Theoretical Opening of the Bypass Control Valve

The theoretical opening degree calculation formula for common types of bypass control valves is as follows:
K D p = S p , m i n S p 2 1 z R Z 1 1 R 1 z 1 ,     Z 1              1 l o g R S p S p , m i n ,     Z = 1
where KDp is the theoretical opening of the bypass control valve; Sp,min is the minimum control impedance of the bypass control valve; and Sp is the bypass control valve impedance.

4. Regulation Accuracy of Control Valve

4.1. Control Valve Dead Zone

Due to the inherent mechanical limitations of control valves, achieving the precise control of the valve opening to any arbitrary degree of accuracy is difficult. Instead, a specific “dead zone”, also known as the non-adjustable region, exists. This means that when the supply water temperature of the primary network changes, the control valve receives an opening degree command from the control system, where the command can take any real value within the range [0, 1]. However, due to the inherent mechanical limitations of the control valve’s structure, its opening degree cannot precisely follow the command value. Instead, it exhibits random fluctuations around the command value, with the fluctuation range defined as the dead zone. Influenced by the dead zone, even without any operational intervention on the control valve, the actual opening degree of the valve can spontaneously fluctuate within the bounds of the dead zone due to the combined effects of various complex factors.

4.2. The Calculation of the Theoretical Opening of the Bypass Control Valve

The ultimate purpose of the heat exchange control valve is not to regulate the flow rate, but to maintain the stability of the secondary side supply water temperature by adjusting the heat exchange flow rate, thereby achieving the constant heat exchange power of the heat exchanger. Thus, the range of fluctuation in the secondary network’s supply water temperature should be considered as the precision index for assessing the performance of the heat exchange control valve.
When the supply water temperature of the primary network changes, the control system sends an opening degree command to the heat exchange control valve based on the primary network supply water temperature. This opening degree is the theoretical value calculated in Section 3.3. Due to the objective existence of the dead zone, the actual opening degree of the control valve may vary within the following range:
K D t s 2 K D t K D t + s 2
where KDt′ is the actual opening degree of the heat exchange control valve, %; and s is the dead zone of the control valve. In this paper, the dead zone is set to 1%.
The solution of the following nonlinear system of equations yields the actual secondary network water supply temperature.
c p G T g , r e f T h , r e f = c p β t G T g T h G B L M T D r e f = β t G B L M T D
where Tg is the actual supply water temperature of the primary network, °C; tg is actual supply water temperature of the secondary network, °C; LMTD is the actual logarithmic mean temperature difference of the heat exchanger; and β t is the exact heat exchange flow ratio.
In Equation (8),
L M T D r e f = T g , r e f t g , r e f T h , r e f t h , r e f l n T g , r e f t g , r e f l n T h , r e f t h , r e f L M T D = T g t g T h t h , r e f l n T g t g l n T h t h , r e f
where tg is the maximum deviation of the secondary network water supply temperature, °C.
The maximum deviation of the secondary network supply water temperature is as follows:
Δ t g , m a x = t g t g m a x

4.3. Accuracy of Bypass Control Valve

The bypass control valve is instrumental in regulating the bypass flow to achieve an equilibrium between the supply and the demand at the heat exchange station. However, due to the inherent presence of a dead zone, the precise control of the bypass flow cannot be achieved. Therefore, the fluctuation magnitude of the bypass flow should be used as the precision indicator of the bypass control valve’s performance.
When the primary network supply water temperature changes, the control system sends an opening degree command to the heat exchange control valve based on the primary network supply water temperature. This command corresponds to the theoretical opening degree of the control valve calculated in Section 3.4. However, due to the inherent presence of a dead zone, the actual opening degree of the control valve may vary within the following range:
K D p s 2 K D p K D p + s 2
where KDp′ is the actual opening degree of the bypass control valve, %; and s is the dead zone of the control valve. In this paper, the dead zone is set to 1%.
The calculation formula for the actual bypass flow ratio of the control valve is as follows:
β p = 1 R R 1 Z 1 K D p + 1 1 1 Z ,     Z 1                                              R K D p 1 ,     Z = 1
The maximum fluctuation in the bypass flow is as follows:
Δ β p , m a x = β p β p m a x
where Δ β p , m a x is the maximum deviation of the bypass flow, %.

4.4. Research Process

Based on the temperature variation of the primary network supply water caused by heat storage/release that is reported on the official website, this study employed a combined approach of experimental testing and a theoretical analysis. The influence of the laws of control valve types and their parameter variations on the valve opening degree was systematically analyzed. Then, the dead zone theory was introduced to investigate the influence of control valve types and parameters on the control valve’s precision. Finally, the most suitable control valve type and parameters for the bypass thermal storage scenario were optimized through a comprehensive comparison. The research flowchart of this study is shown in Figure 2.

5. Case Analysis

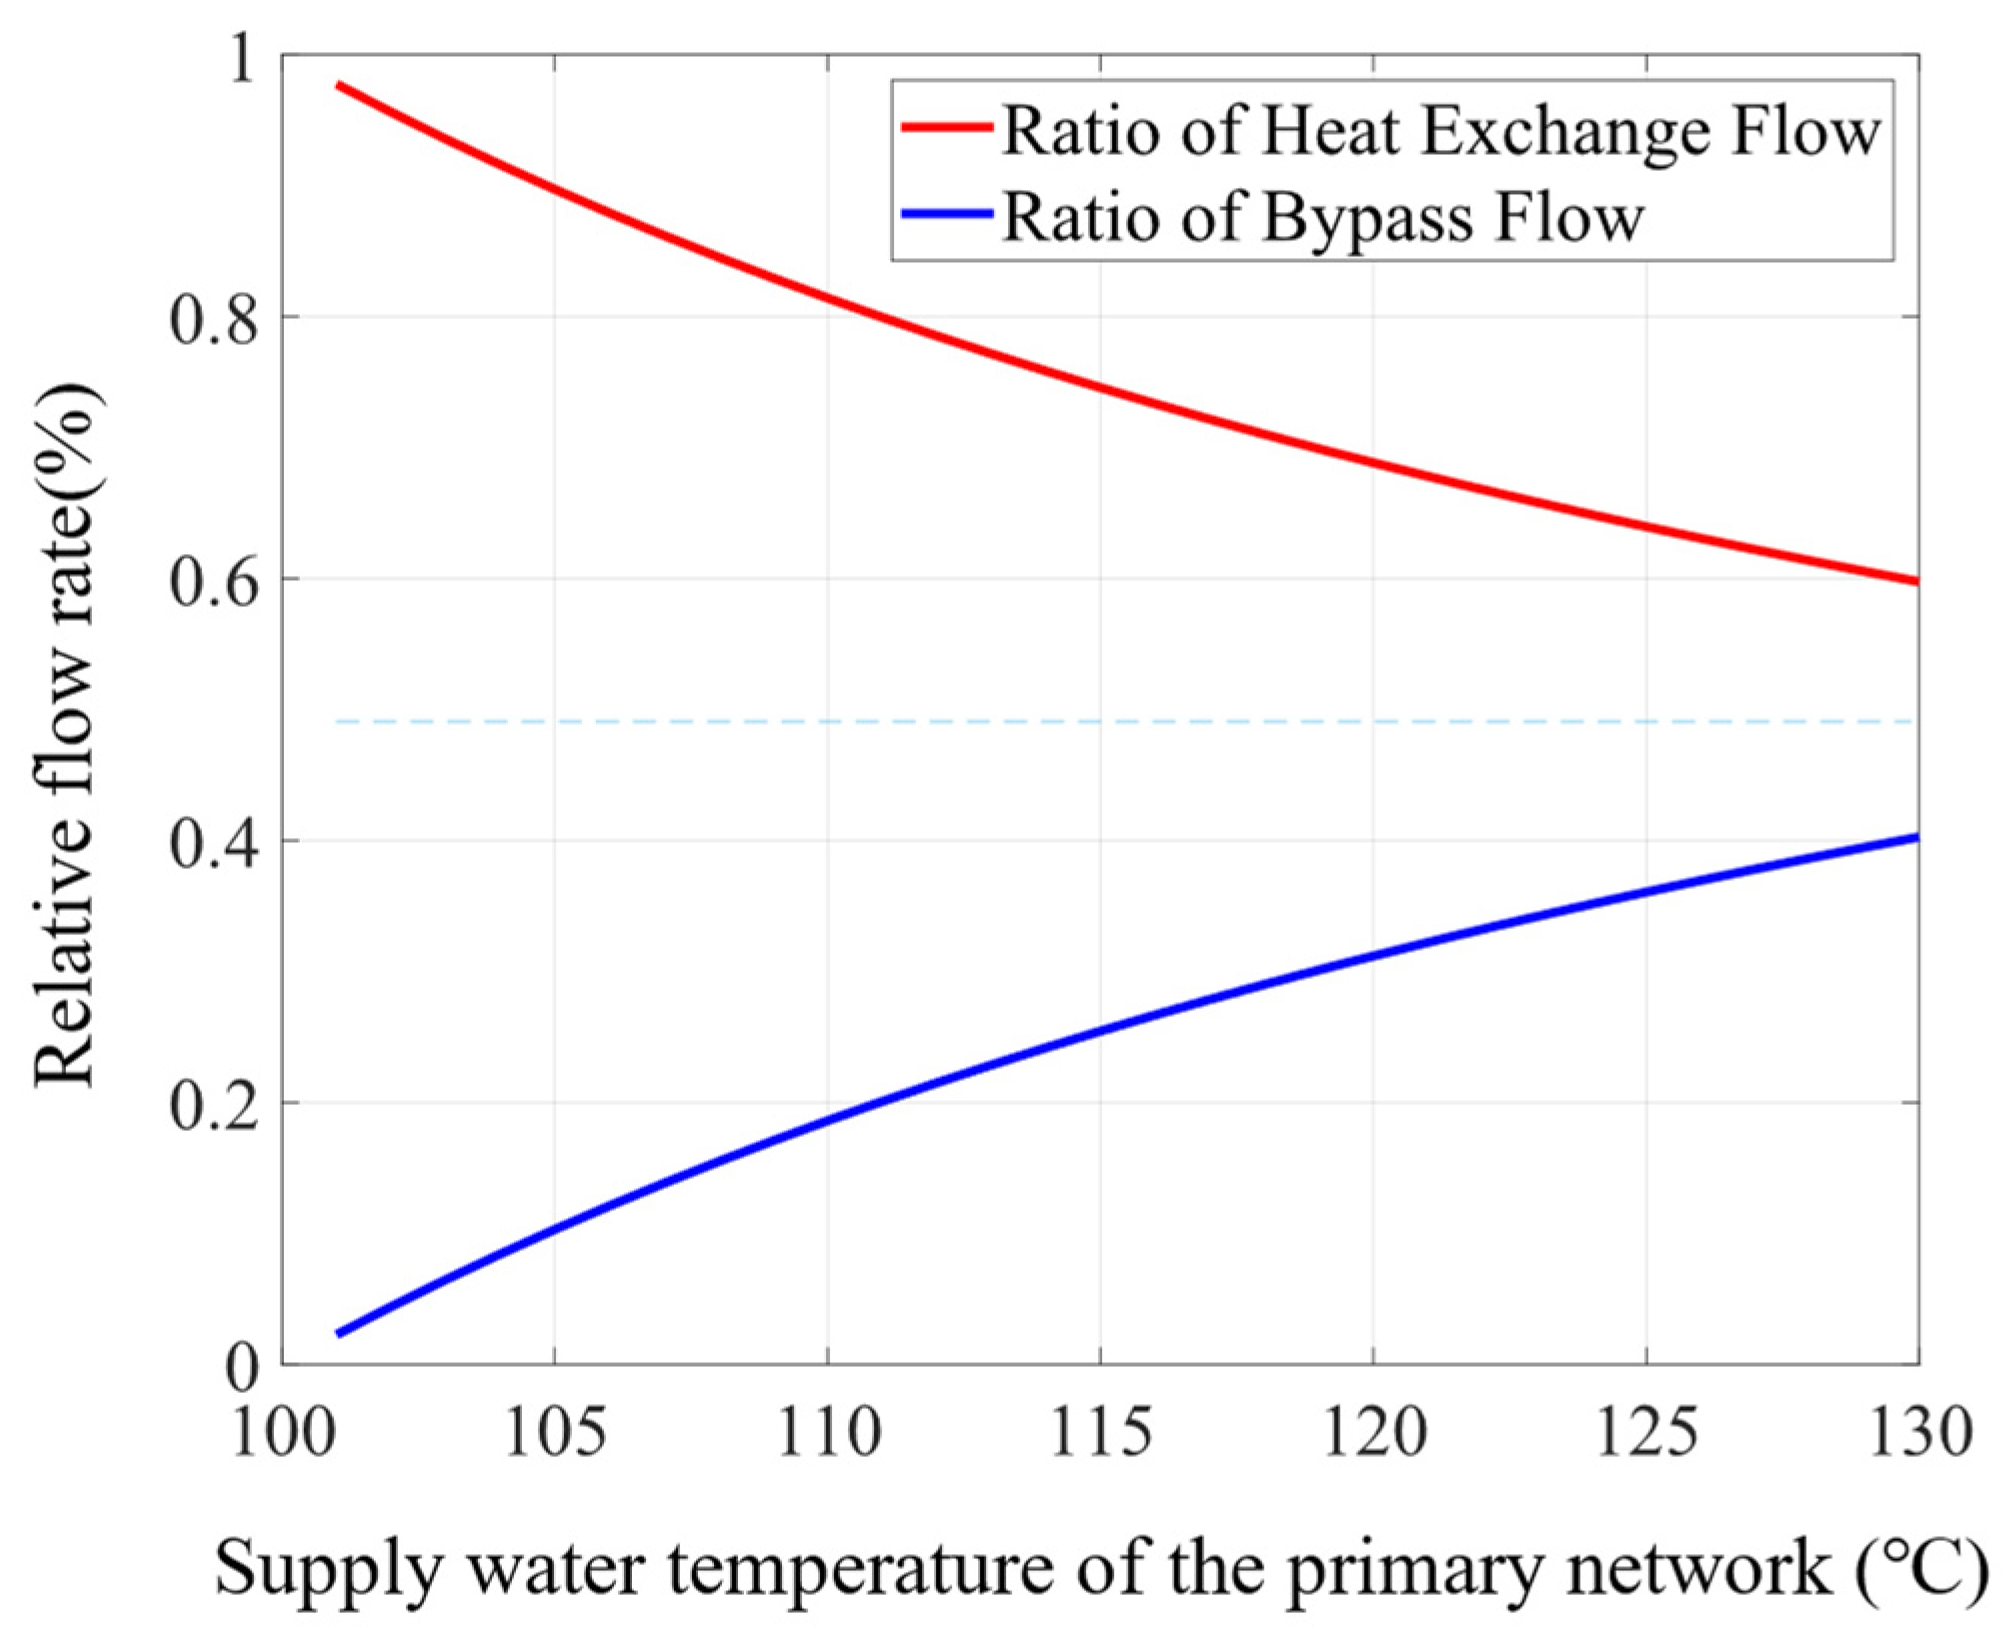
5.1. Calculation of Supply–Demand Balance Regulation in Heat Stations

This paper makes the following assumptions: (1) The heat loss during the heat medium transportation process is neglected. (2) The pipeline resistance is ignored. (3) The circulating pump operates at a fixed frequency, the equivalent resistance between points A and B remains constant, and the primary network circulating flow rate is constant.
According to Equation (1), the changes in the primary network heat exchange flow rate and the bypass flow rate can be calculated under the constant heating power of the heat exchange station when the primary network supply water temperature increases from 101 °C to 130 °C. The calculation results are shown in Figure 3.
When the primary network supply water temperature changes, the changes in the impedance of the primary side heat exchange control valve and the bypass control valve can be determined by substituting the calculation results from Equation (1) into Equation (2).
To ensure the stable heat transfer power of the heat exchange station, the impedance distribution is shown in Figure 4. When the primary network supply water temperature increases from 101 °C to 130 °C, the heat exchange control valve impedance increases from 0.5466 to 2.3019. In contrast, the impedance of the bypass control valve gradually decreases from 1973.67 to 6.16. The impedance control range of the control valves should be greater than the theoretical impedance variation range. Specifically, the minimum control impedance of the heat exchange control valve should be less than 0.5466, and its maximum control impedance should be greater than 2.3019. Similarly, the minimum control impedance of the bypass control valve should be less than 6.16, and its maximum control impedance should be greater than 1973.67.

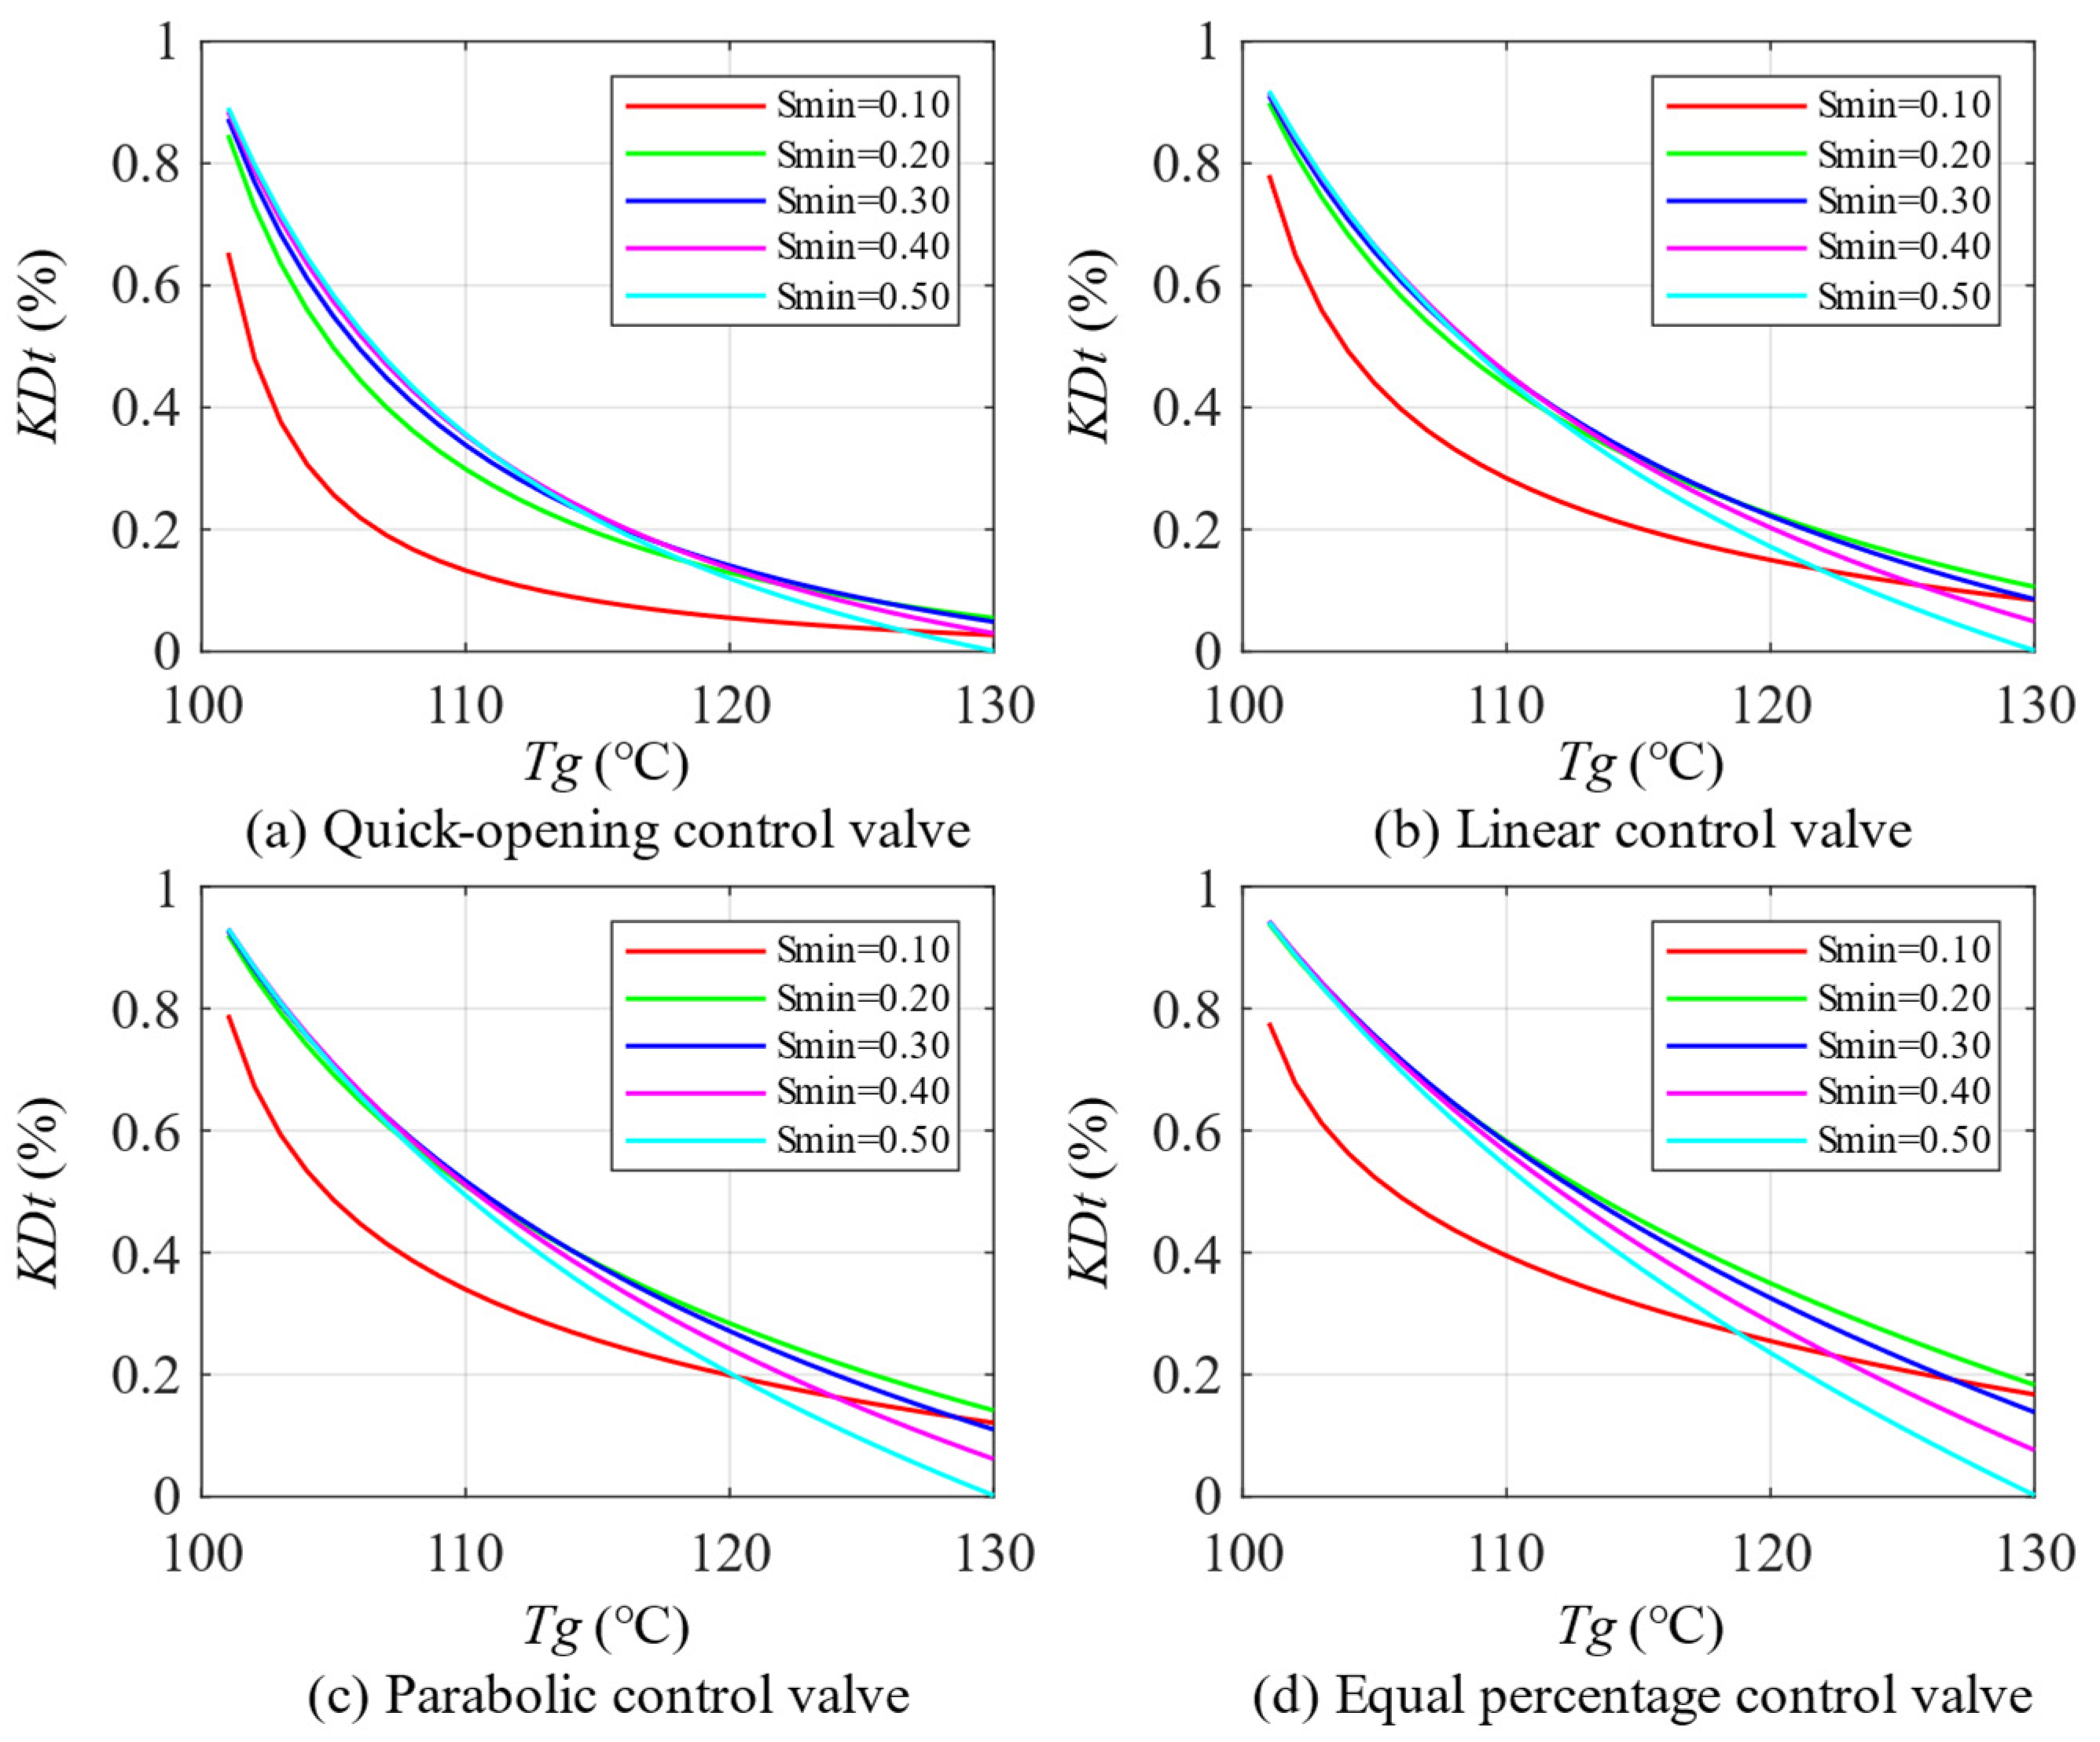
5.2. Working Process and Precision Analysis of Heat Exchange Control Valves

As shown in Figure 1, the heat exchange control valve is connected in series with the heat exchanger, which means the pressure difference across the control valve cannot be maintained at a constant. Therefore, the value of authority must be considered during the research process. Based on Equation (10), the relationship between the heat exchange flow ratio and the primary network supply water temperature can be derived by combining the relationship between the opening degree of different control valves and the primary network supply water temperature. The parameter overview of the control valve in the case is shown in the following Table 1:

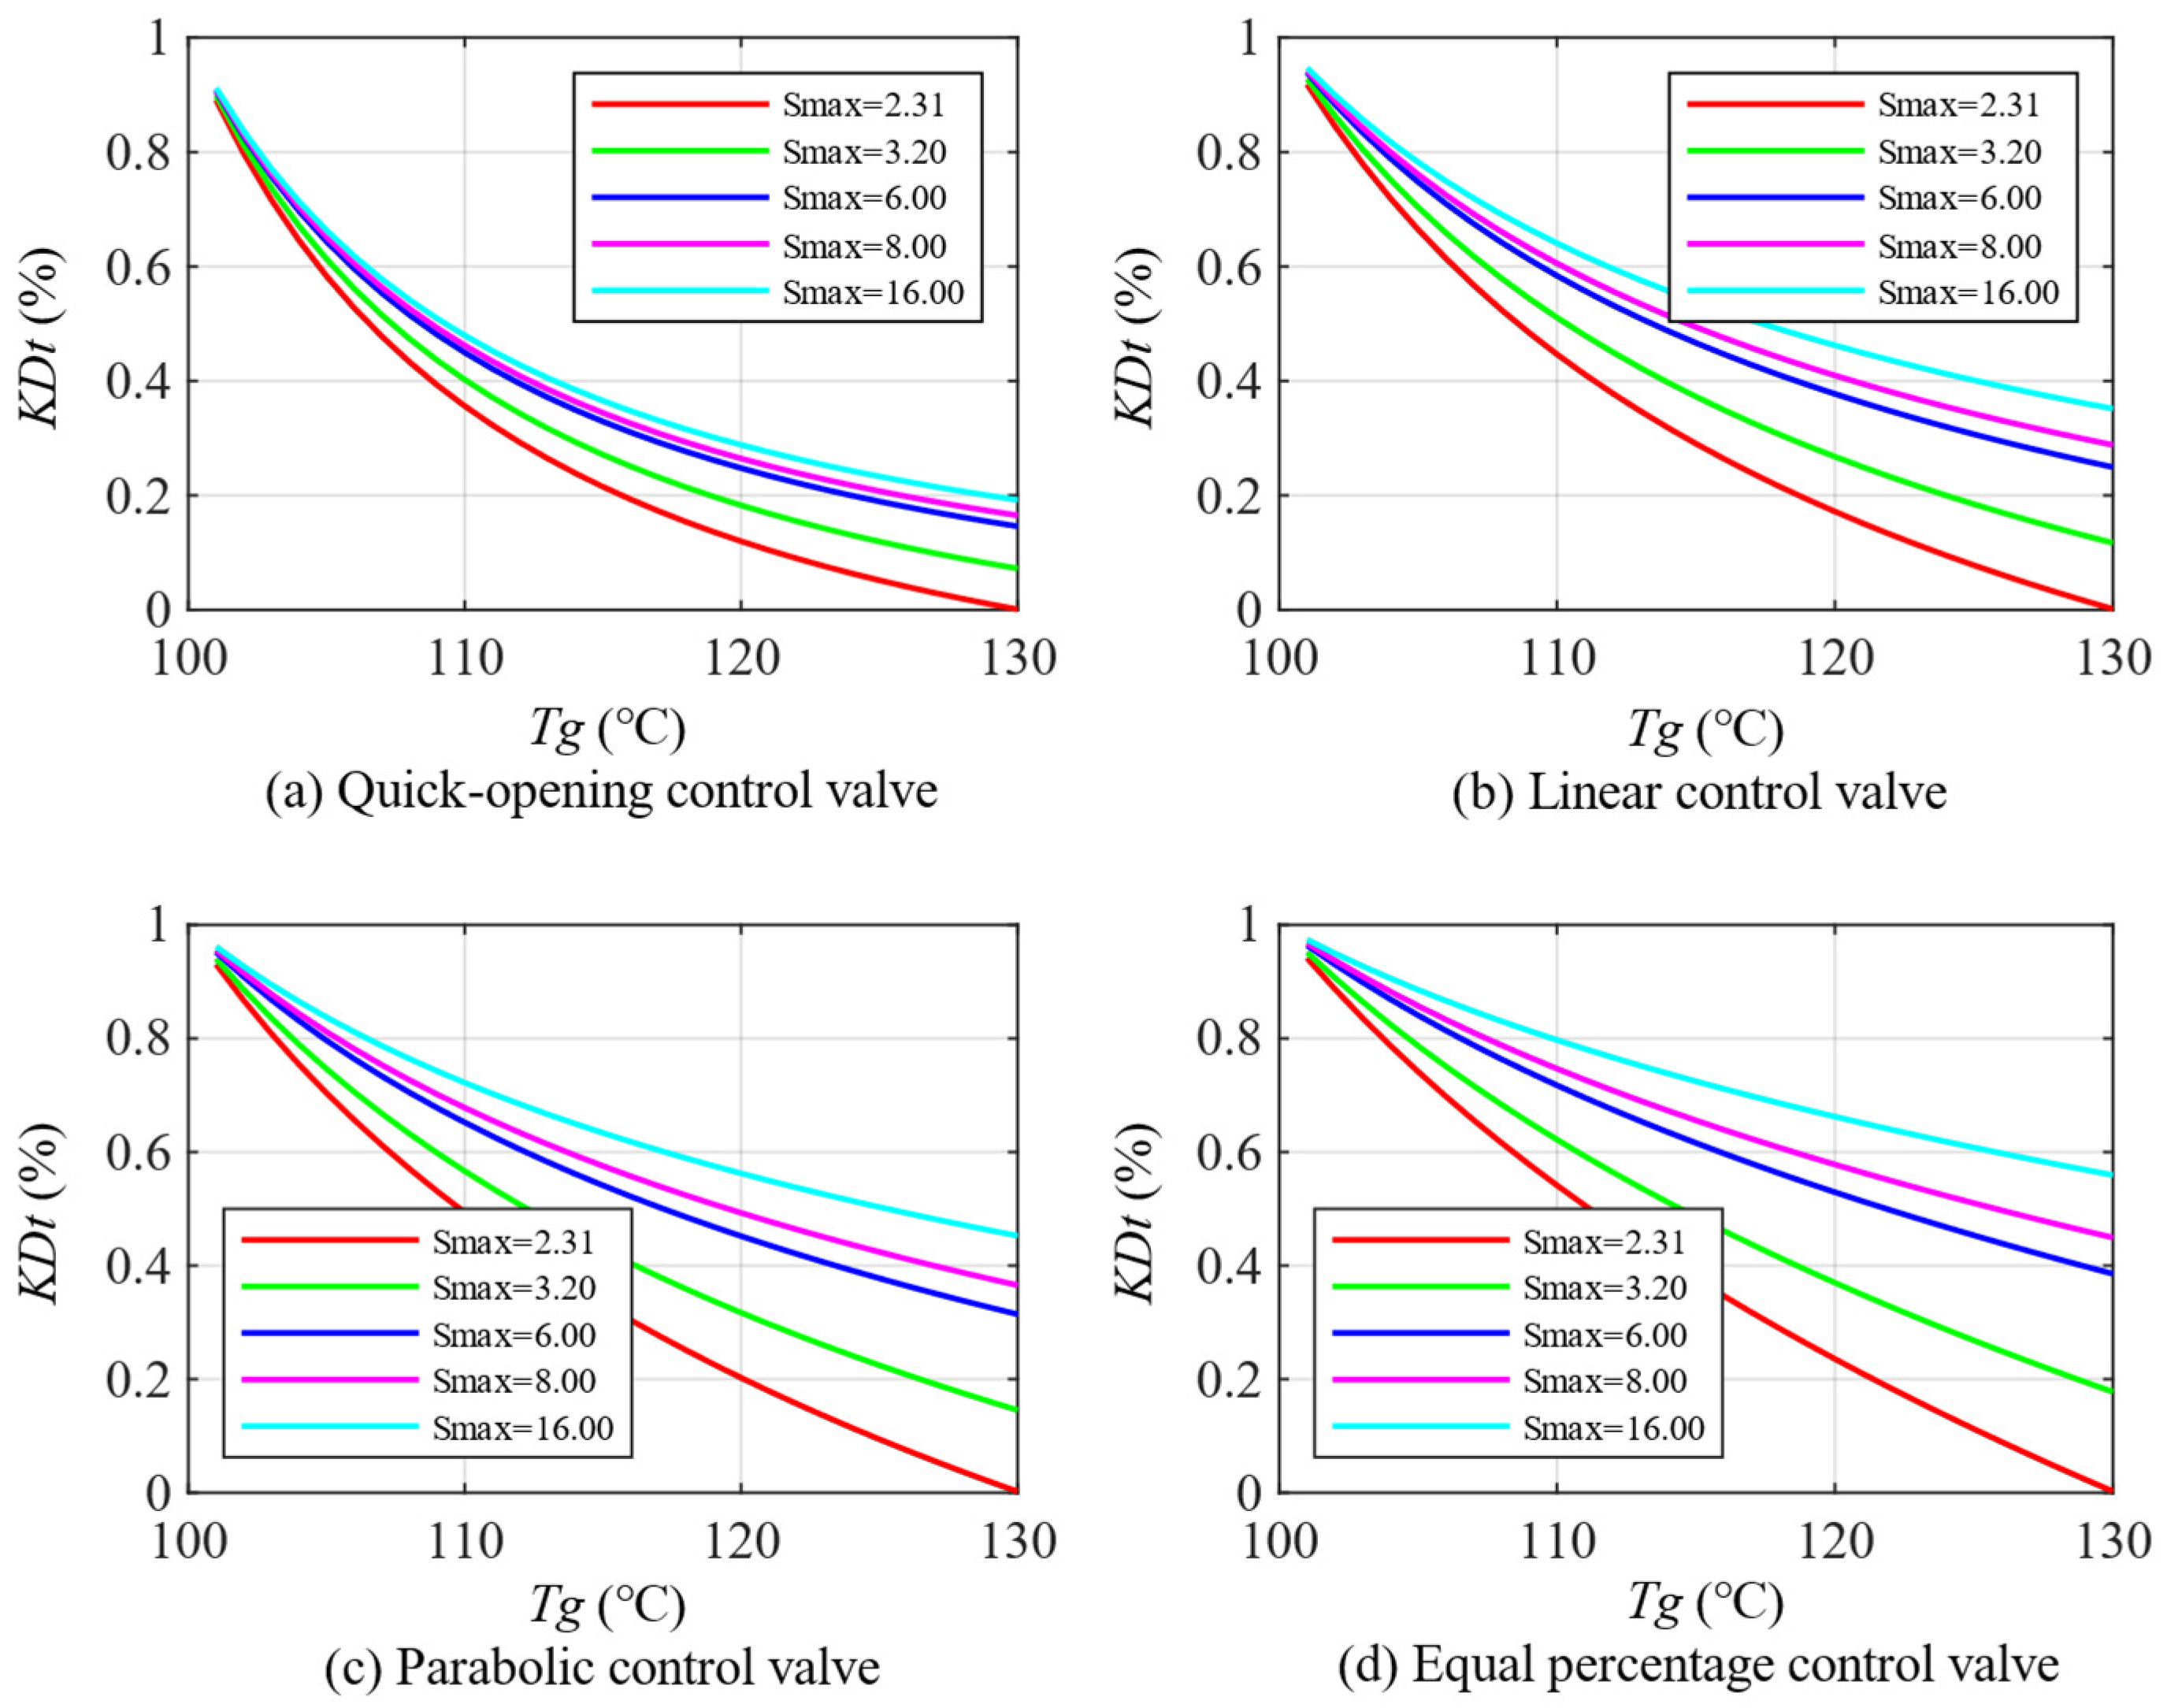
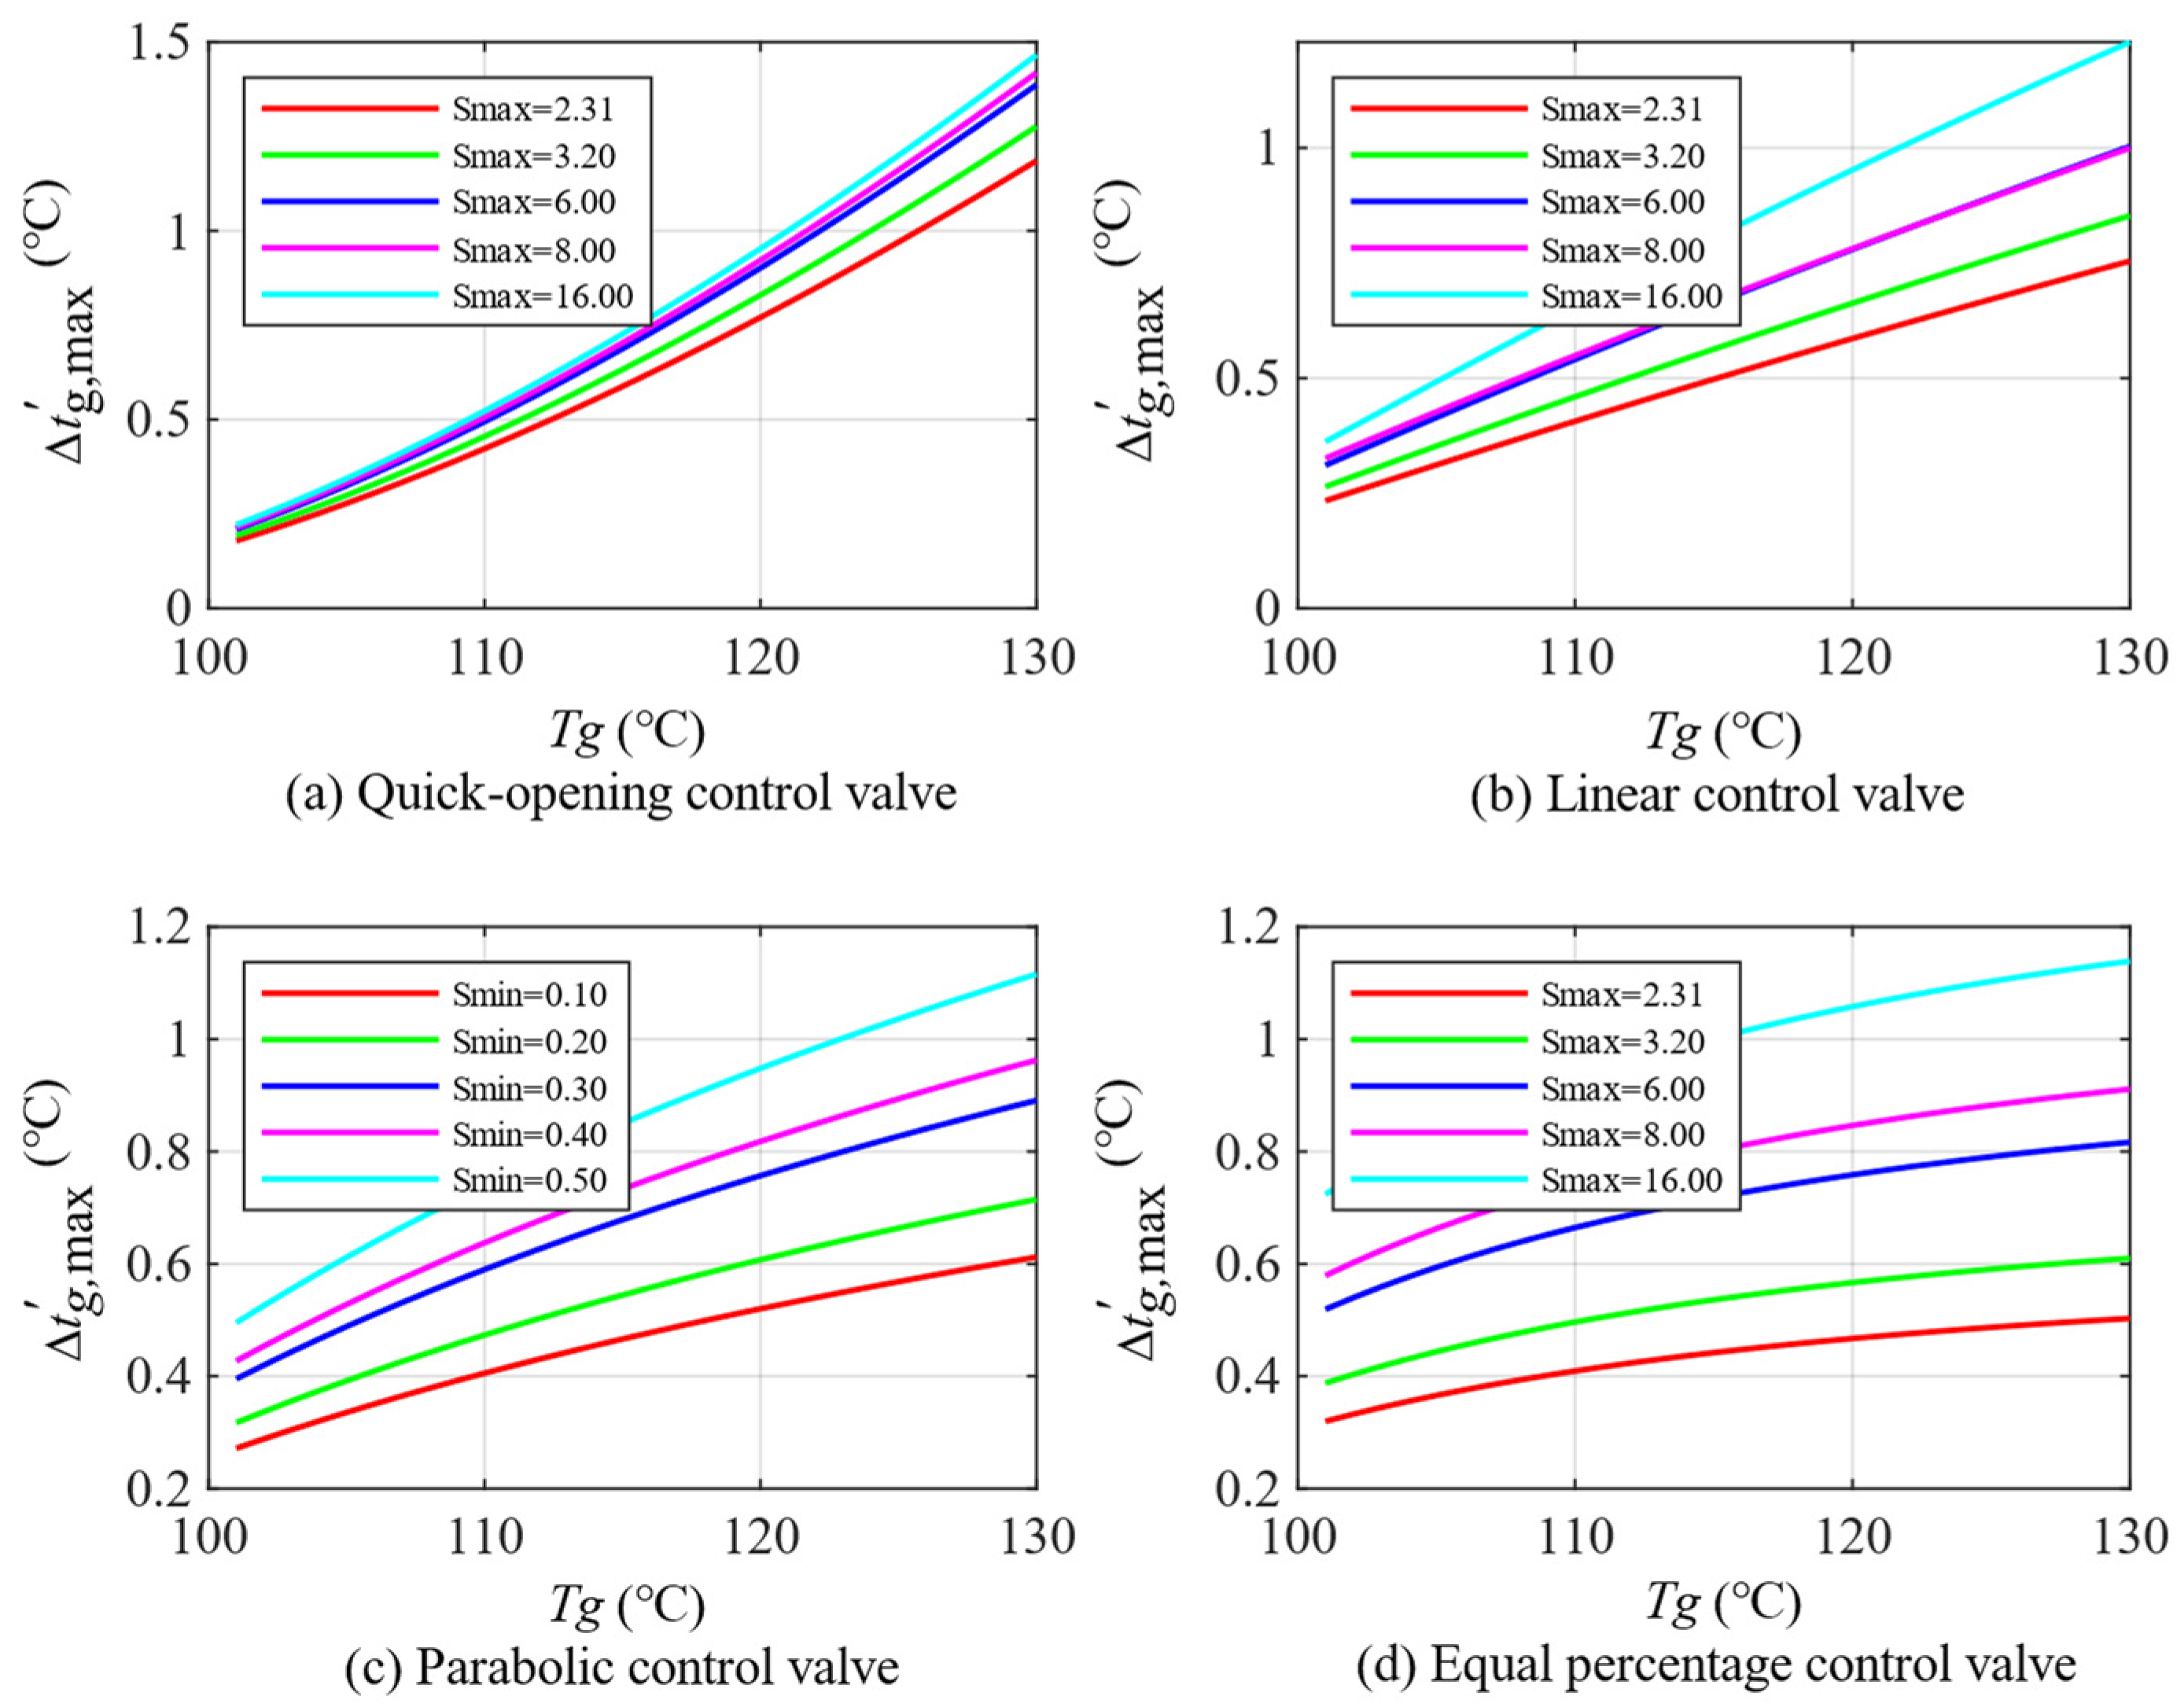
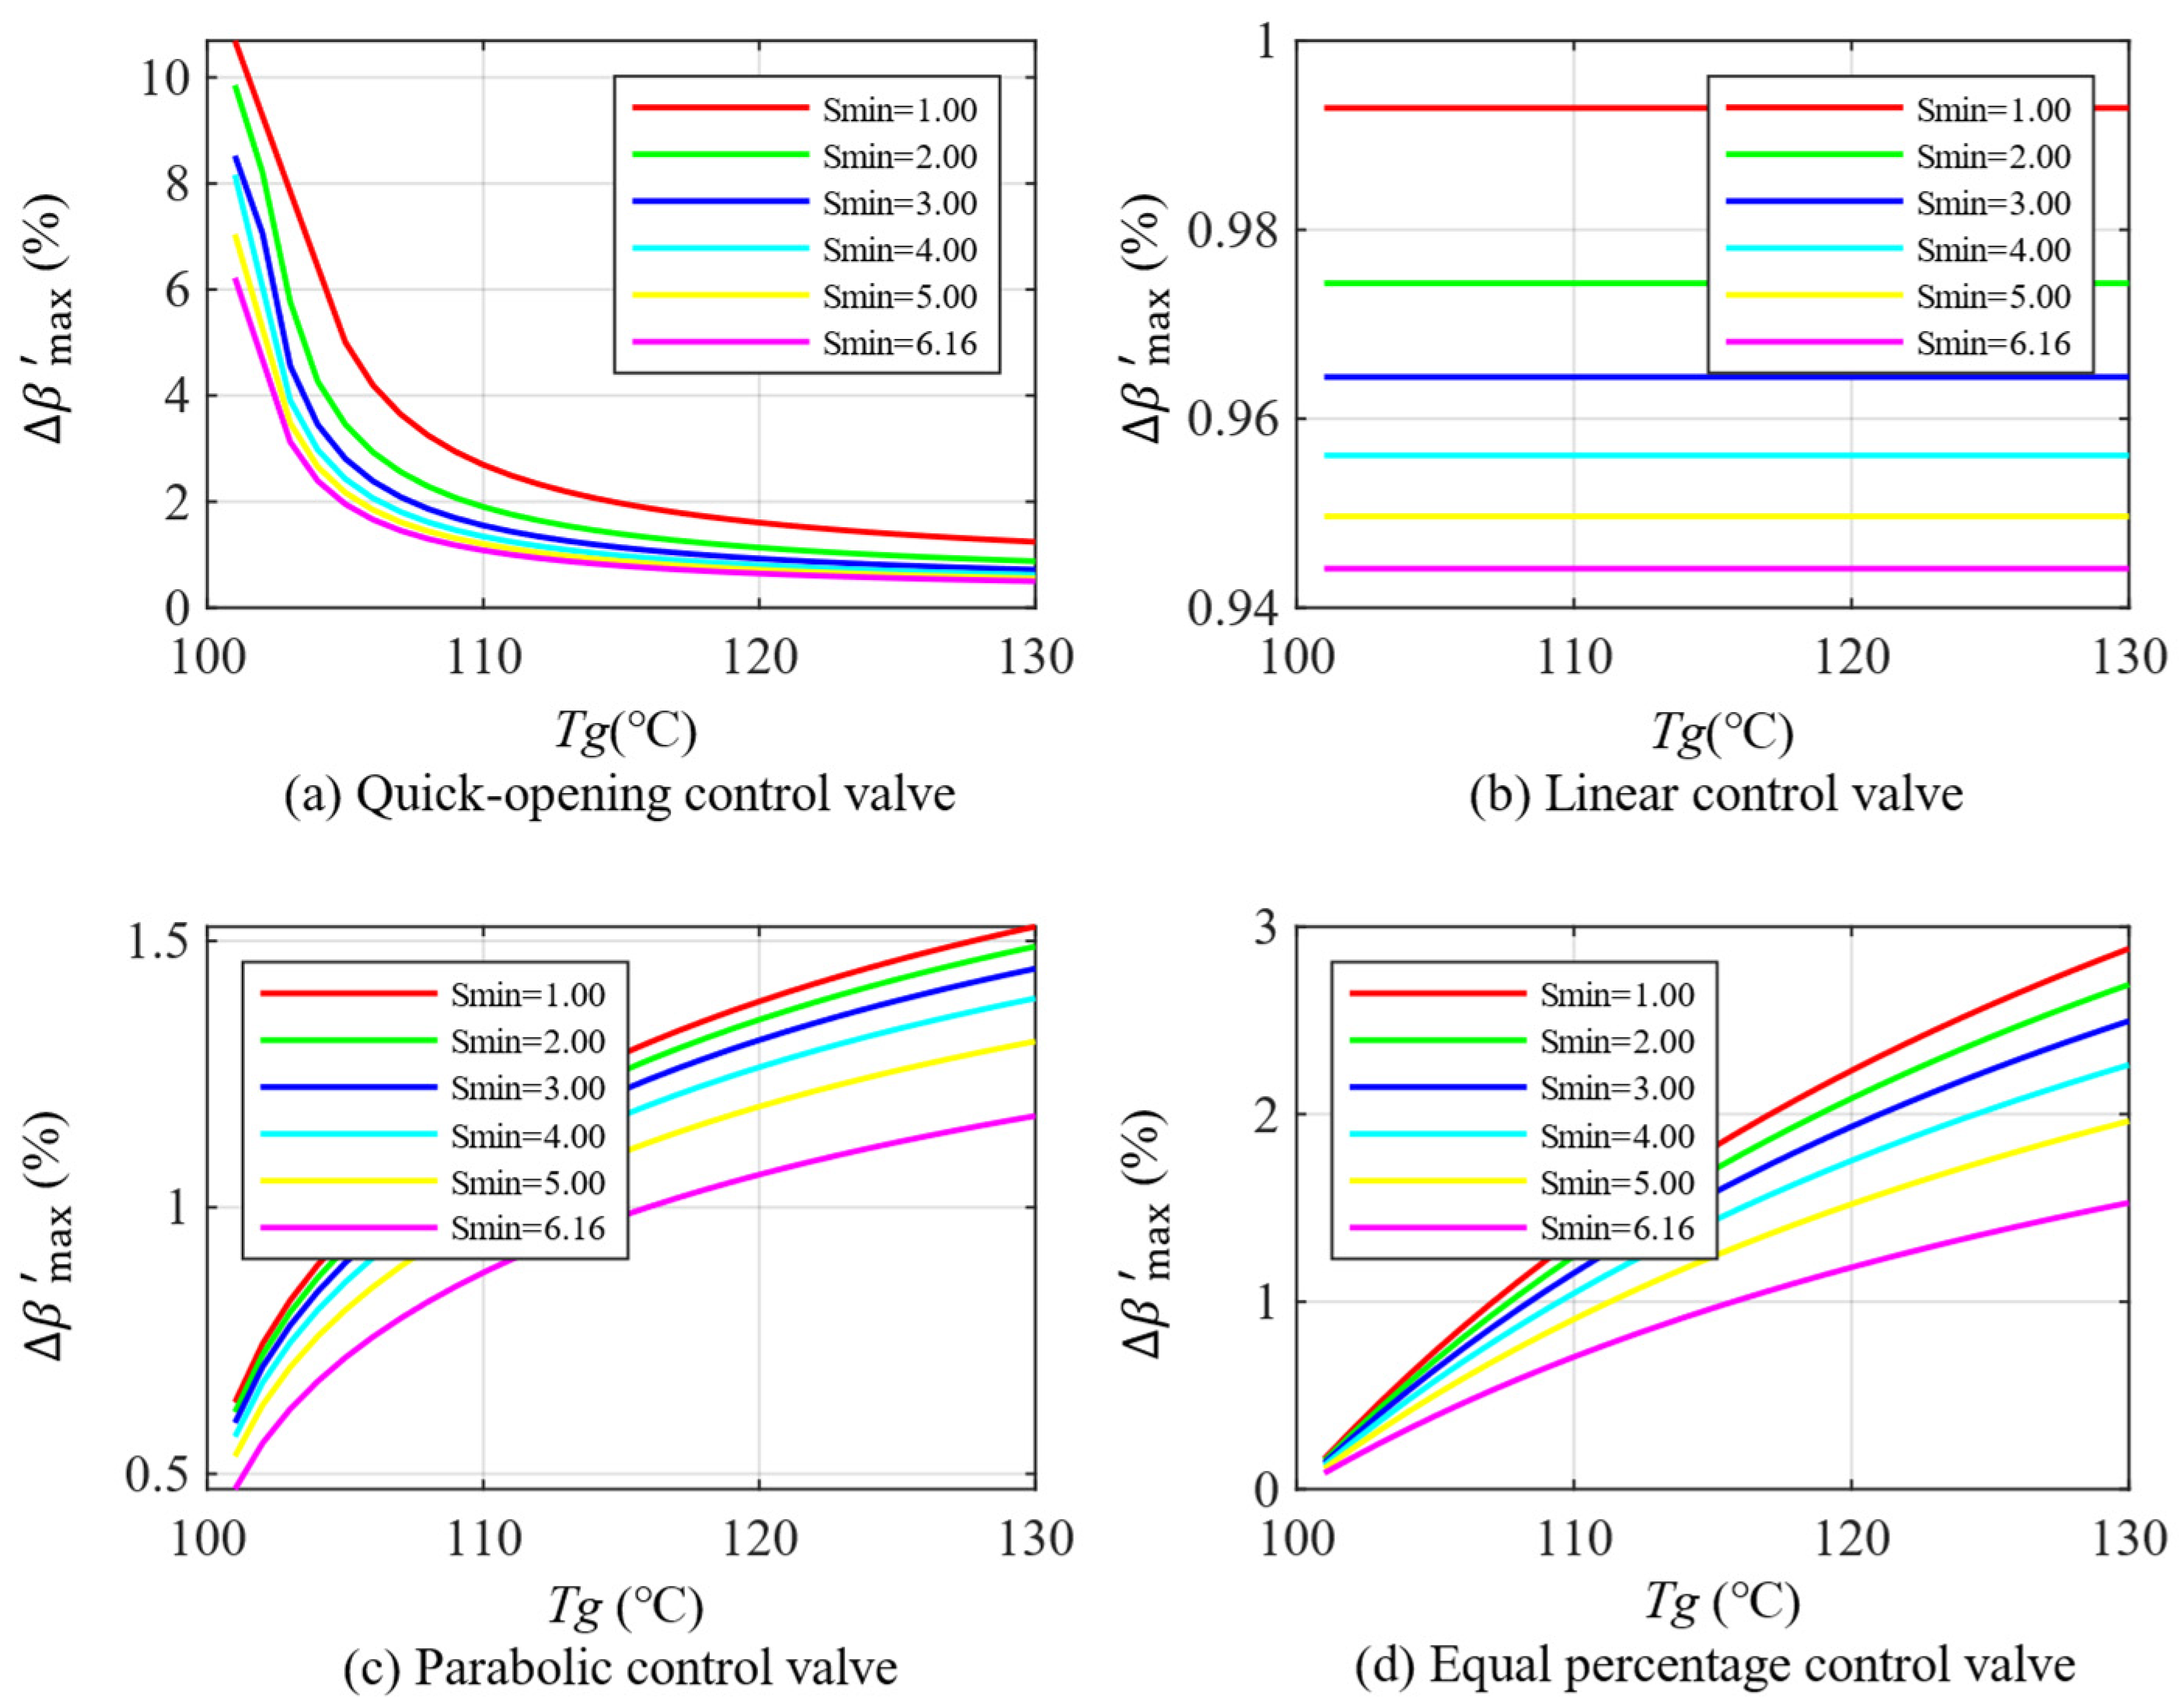
5.2.1. Impact of Minimum Control Impedance

Set the maximum control impedance to 2.31 and analyze the operating characteristics of the control valve when the minimum control impedance takes different values. Figure 5 shows the calculation results.
As shown in Figure 5, when the minimum control impedance is more significant than 0.2, the influence of the minimum control impedance on the working characteristics of different control valves exhibits similar patterns. Taking the equal percentage control valve in Figure 5d as an example, when the minimum control impedance is more significant than 0.2, the minimum opening degree gradually decreases from 0.19 to 0.02 as the primary network supply temperature increases, and the range of the opening degree variation during the entire working process expands. However, when the minimum control impedance is less than 0.2, the working characteristic curve shows severe distortion, the range of opening degree variation significantly narrows, and the rate of change in the control valve’s opening degree becomes unstable. Therefore, the minimum opening degree of the control valve during operation can be adjusted by modifying the minimum control impedance. However, the minimum control impedance should not be too small to avoid adverse effects on the control valve’s working characteristics and ensure its regular operation and performance.
In accordance with the dead zone theory, an analysis is conducted on the deviations in water temperature within the secondary network supply. This analysis serves to facilitate the identification of the optimal parameters.
As shown in Figure 6, under the specific condition where the minimum control impedance of the four types of control valves is set to 0.5, the secondary network supply water temperature exhibits the smallest average fluctuation amplitude. From this, it can be concluded that when the minimum control impedance is set to 0.5, the secondary network supply water temperature fluctuates minimally and remains stable, indicating that the corresponding control valve demonstrates optimal control performance. Additionally, it is observed that when the minimum control impedance is at a lower level, the average fluctuation amplitude of the secondary network supply water temperature is more significant, which validates the earlier conclusion that the valve authority should not be set too small.
Additionally, if the primary network supply water temperature varies only within the range of 100–104 °C, the smaller the minimum control impedance, the smaller the average fluctuation amplitude of the secondary network supply water temperature. Conversely, if the primary network supply water temperature varies within the range of 104–130 °C, the larger the minimum control impedance, the smaller the average fluctuation amplitude of the secondary network supply water temperature. In practical engineering applications, the actual working range of the primary network supply water temperature must also be considered.

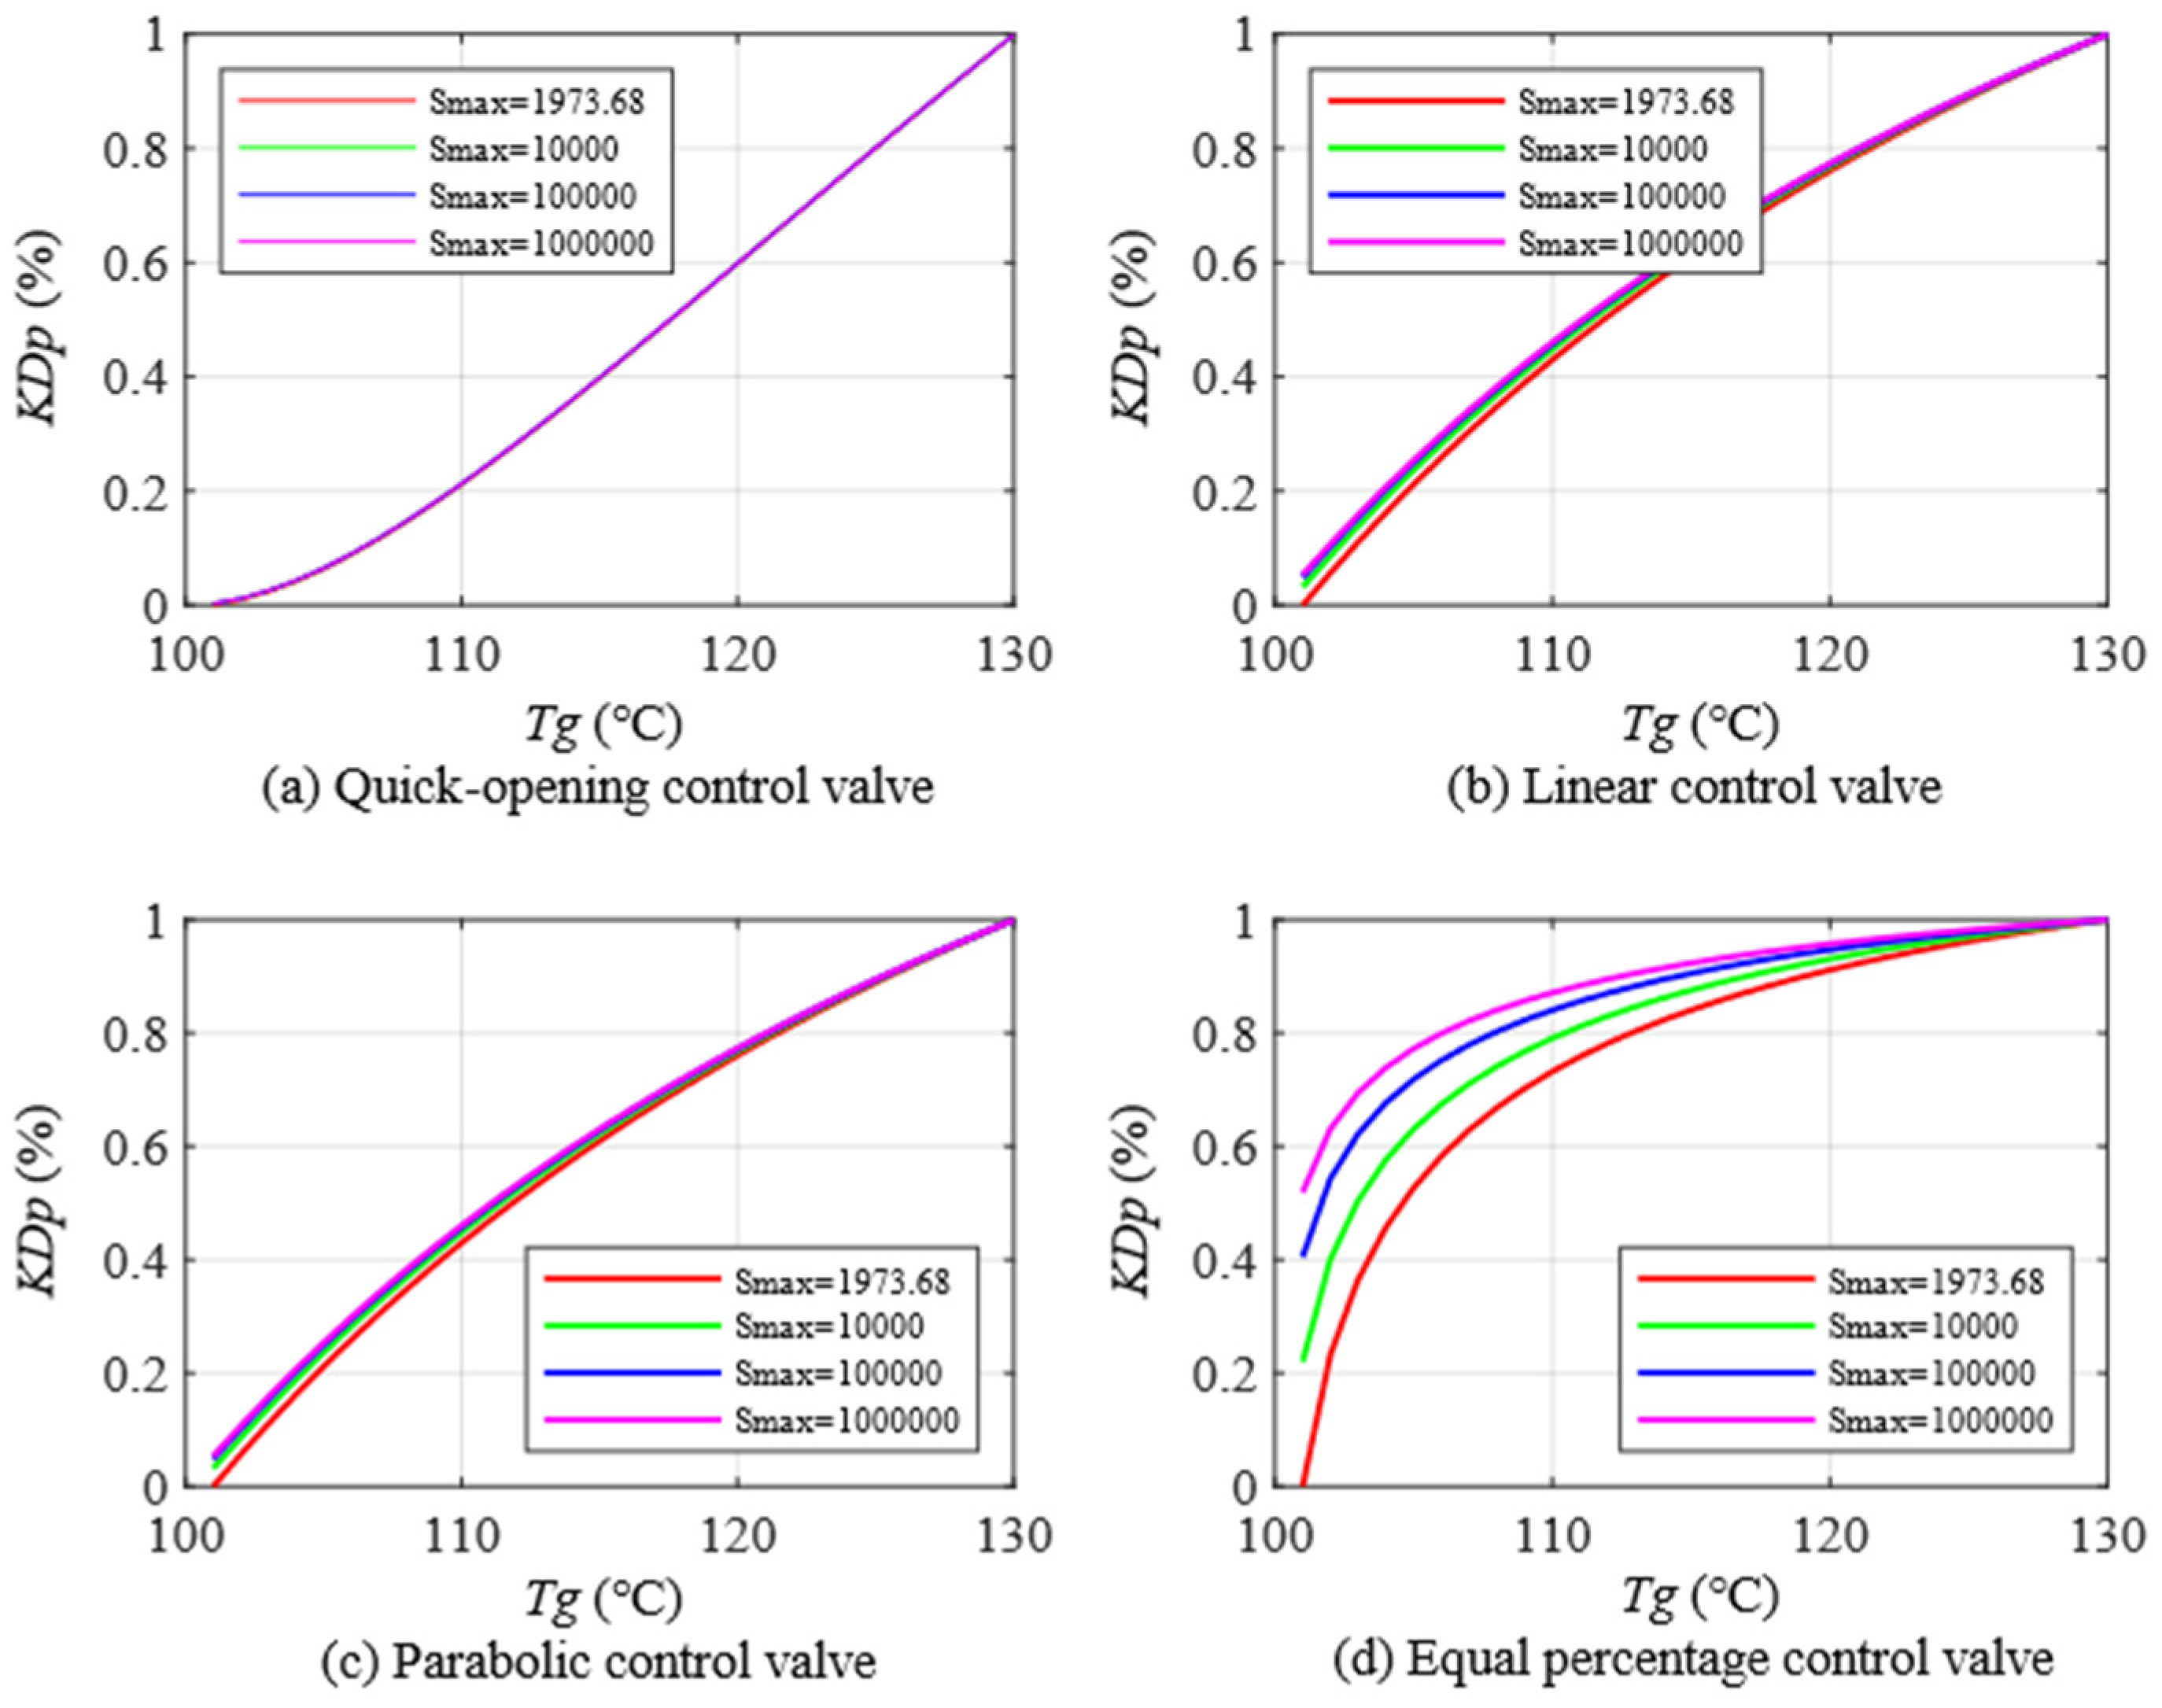
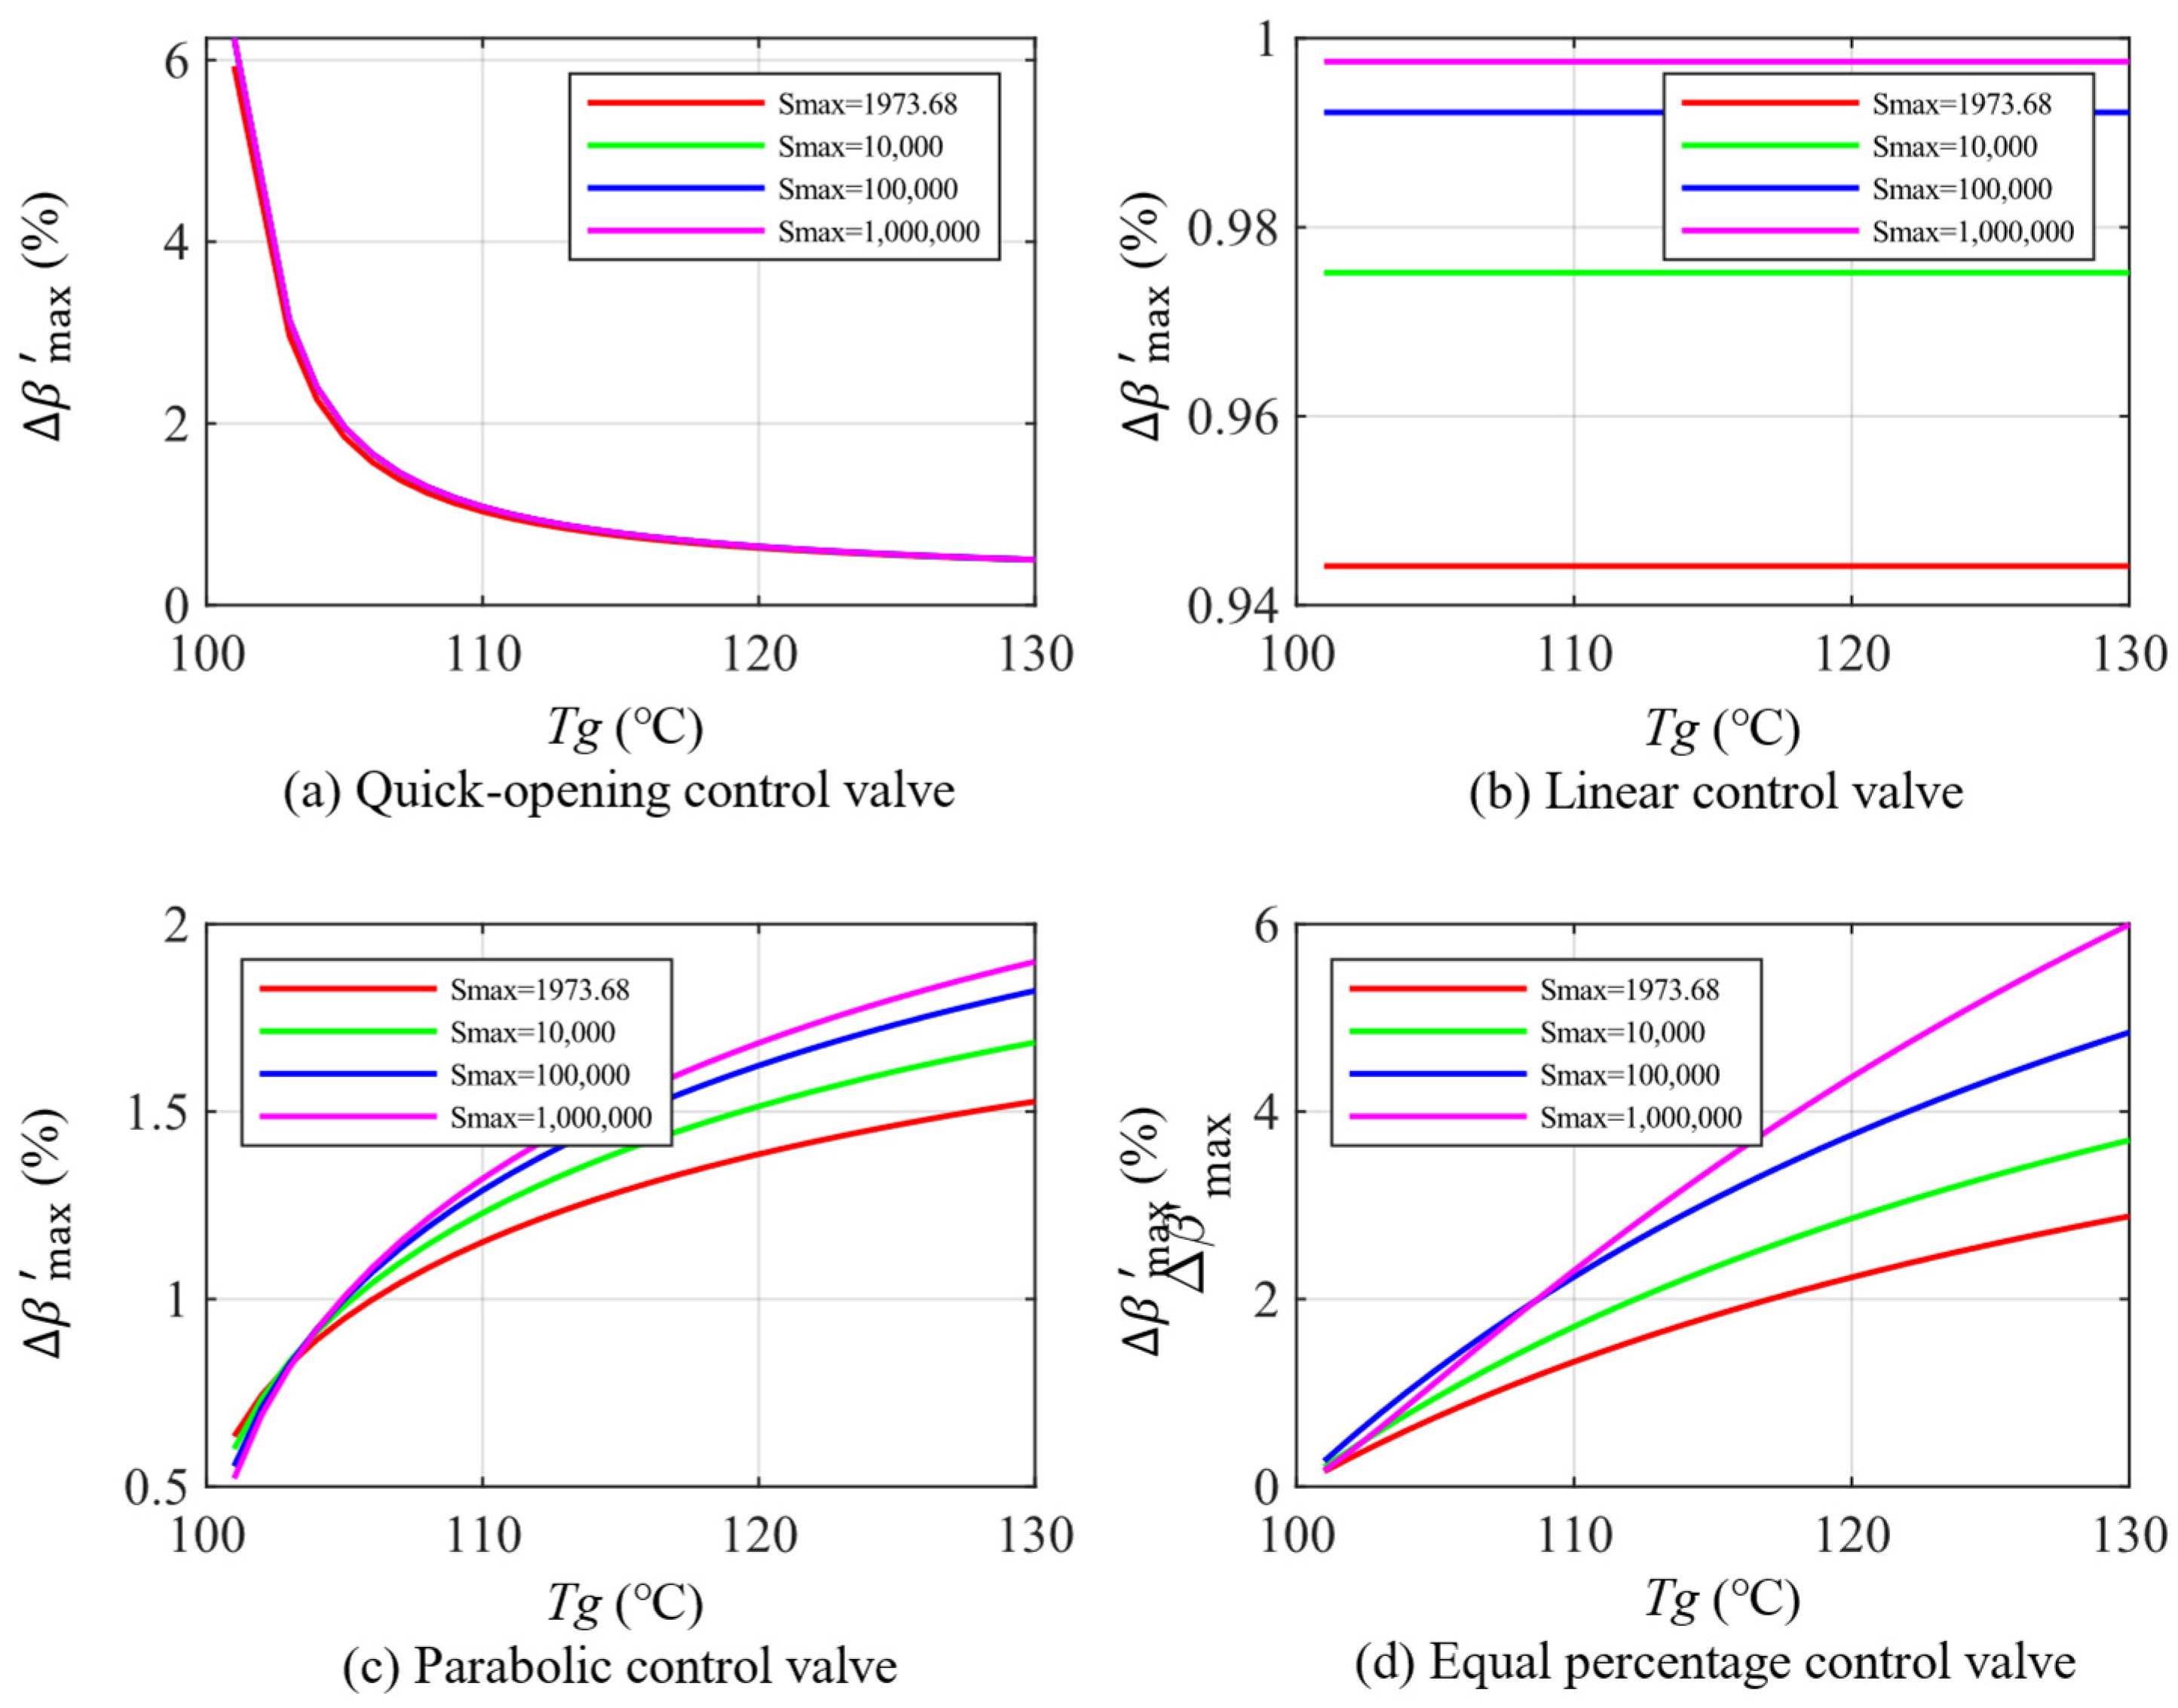
5.2.2. Impact of Maximum Control Impedance

Set the minimum control impedance to 0.5 and analyze the control valve’s operating characteristics when the maximum control impedance takes different values.
As shown in Figure 7, the influence of the maximum control impedance on the working characteristics of different control valves exhibits similar patterns. Taking the equal percentage control valve in Figure 7d as an example, as the maximum control impedance gradually increases, the control valve’s maximum opening degree remains unchanged at around 0.95. In contrast, the minimum opening degree significantly decreases from 0.56 to 0.01. Therefore, the working range of the control valve’s opening degree can be adjusted by modifying the maximum control impedance.
Due to the influence of the dead zone, the possible variations in the secondary side supply water temperature caused by changes in the primary network supply water temperature are illustrated in Figure 8.
As shown in Figure 8, as the maximum control impedance of the control valve increases, the secondary network’s supply water temperature fluctuation gradually increases. In the specific case where the maximum control impedance of the four types of control valves is set to 2.31, the secondary network supply water temperature exhibits the smallest average fluctuation amplitude. From this, it can be concluded that when the maximum control impedance is set to 2.31, the secondary network supply water temperature fluctuates minimally and remains stable, indicating that the corresponding control valve demonstrates the optimal control performance.

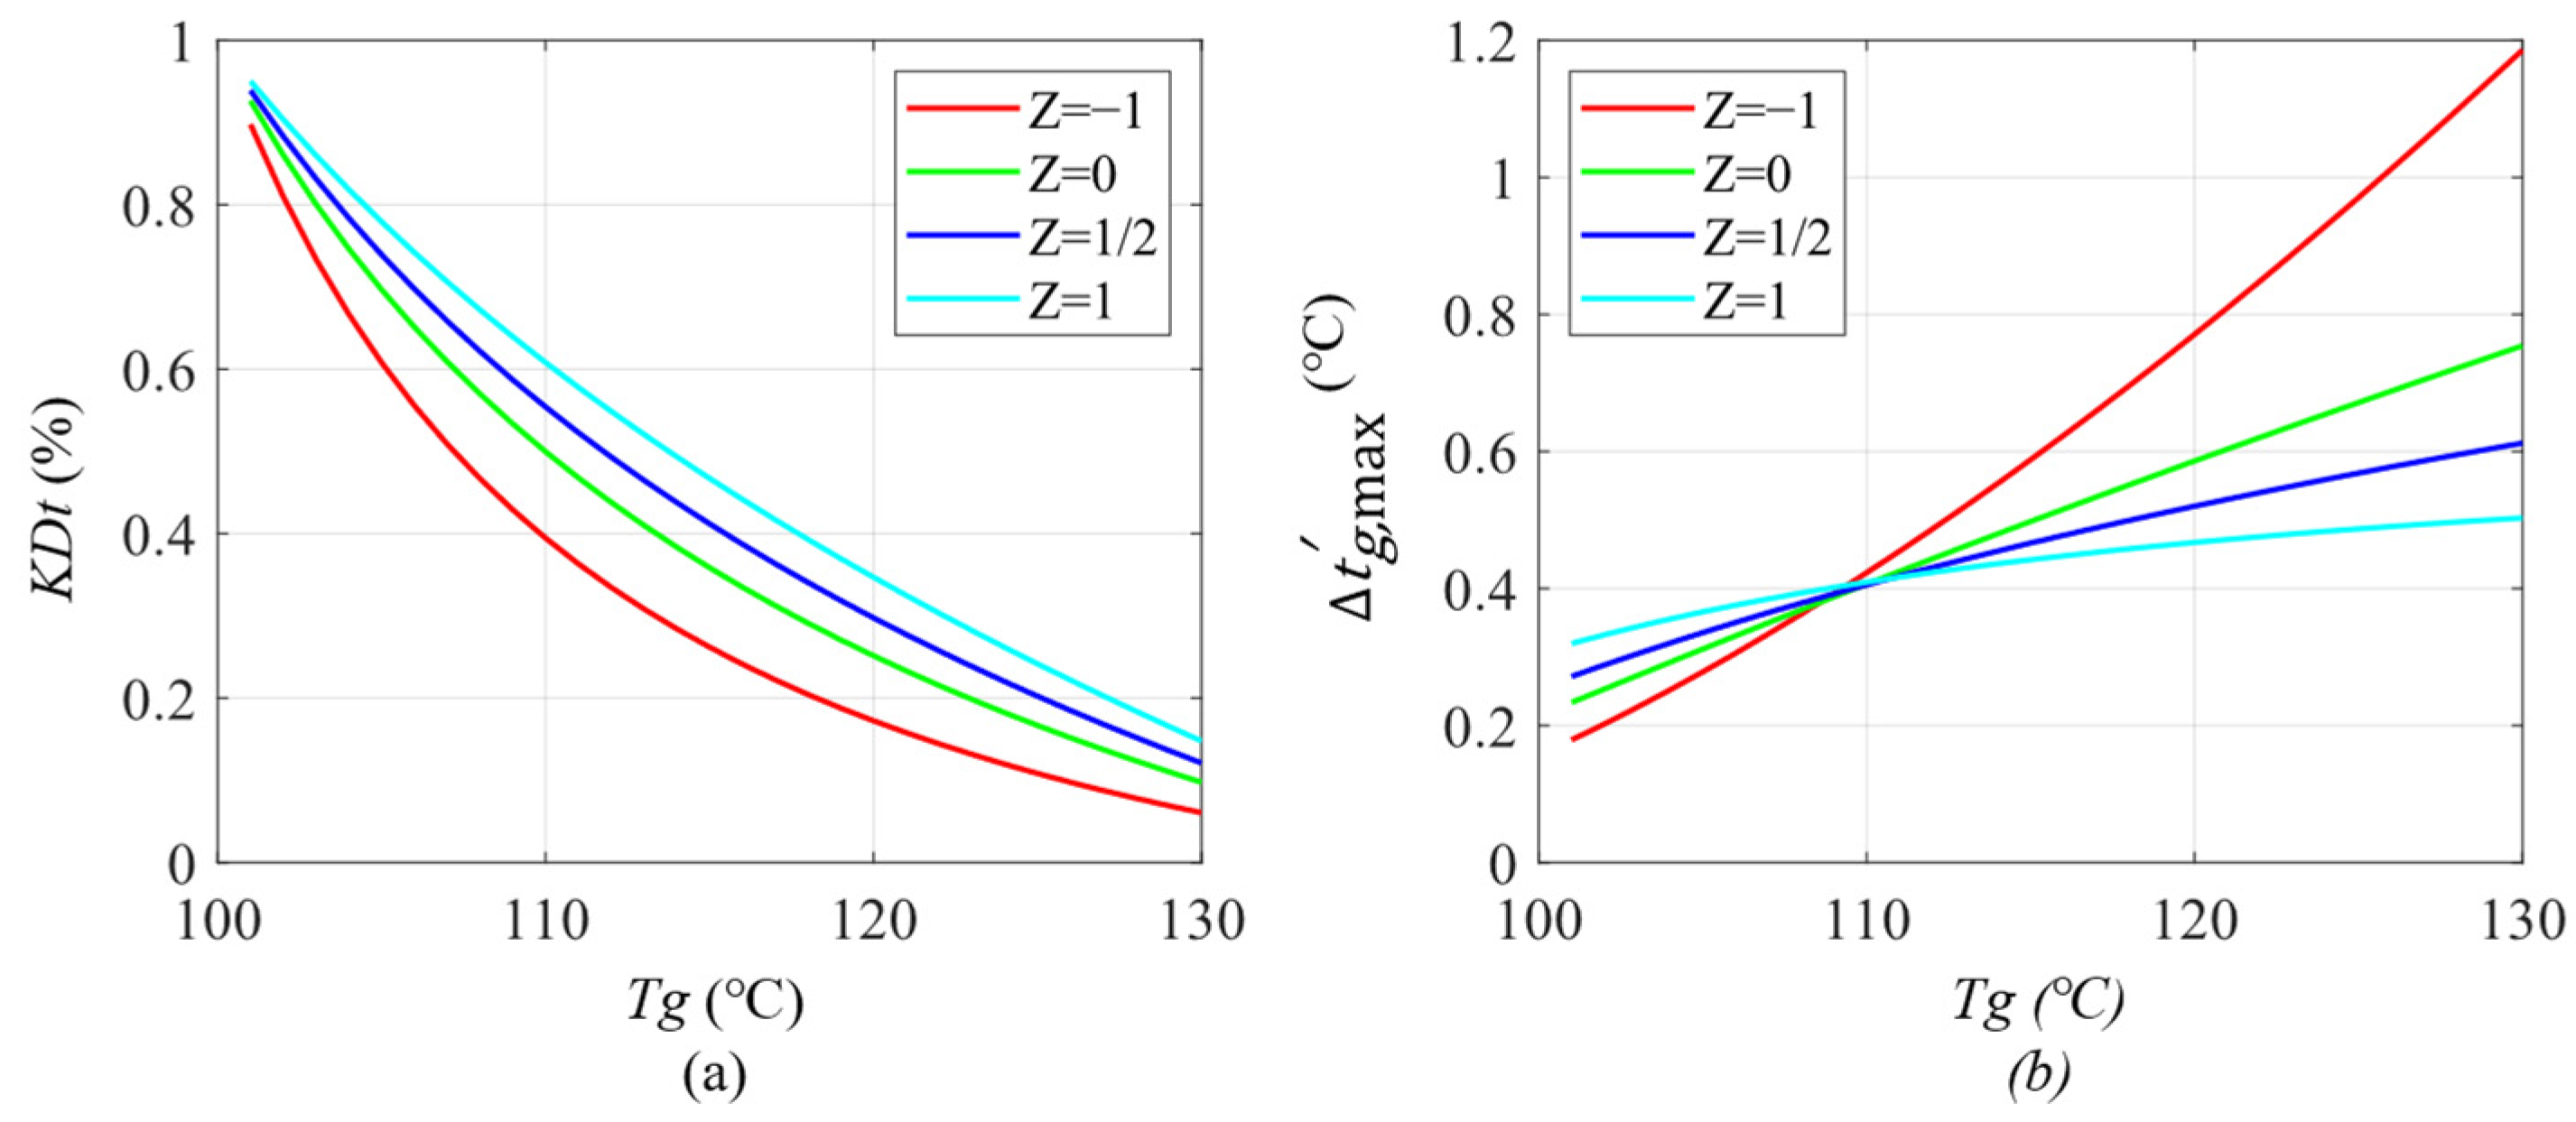
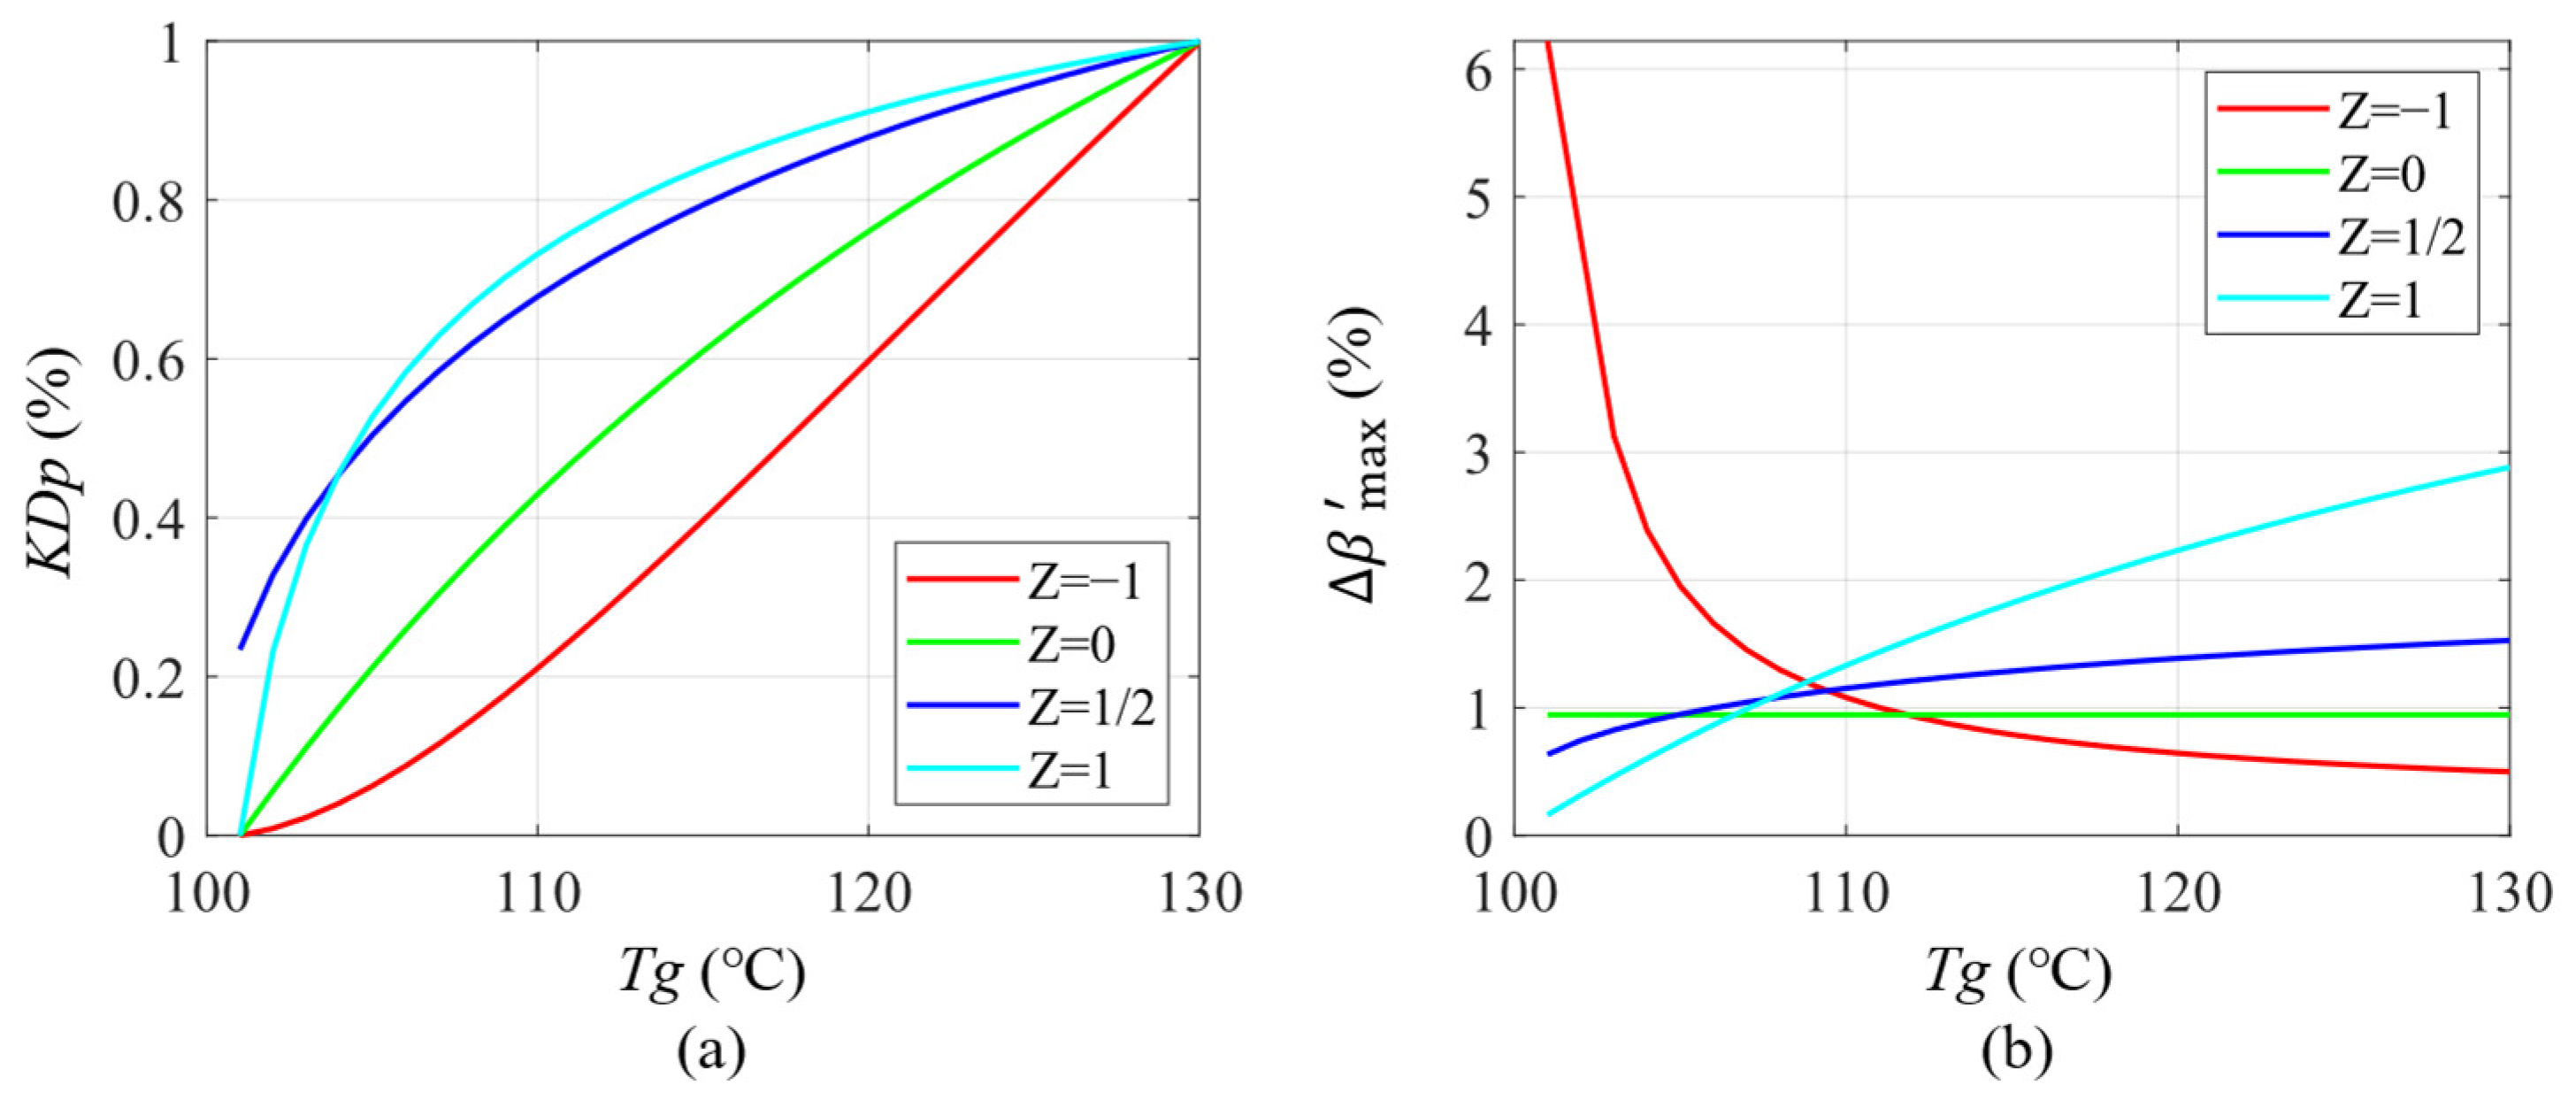
5.2.3. Comparison of Optimal Parameters of Different Control Valves

Based on the above analysis, the optimal parameter configuration for the four types of control valves is determined as follows: the minimum control impedance is 0.5, and the maximum control impedance is 2.31. A comprehensive comparison of the four types of control valves is presented in Figure 9:
As shown in Figure 9a, it can be observed that the variation range of the opening degree during the entire working process of the four types of control valves is not significantly different, with the maximum opening degree being around 0.9 and the minimum opening degree being around 0.01. According to Figure 9b, the equal percentage control valve (Z = 1) exhibits the smallest fluctuation amplitude in the secondary network supply water temperature, with a maximum fluctuation of 0.8 °C and a minimum fluctuation of 0.6 °C throughout the working process, indicating relatively stable performance. It can be seen from Table 2 that the equal percentage type control valve (Z = 1) has a lower average fluctuation. From this, it can be concluded that among the four control valves, the equal percentage control valve demonstrates significantly superior control performance compared to the others, enabling more precise and effective control to maintain a constant secondary network supply water temperature.
Additionally, suppose the primary network supply water temperature varies only within the range of 100–110 °C. In that case, the quick-opening control valve demonstrates significantly superior control performance compared to the other control valves. Conversely, if the primary network supply water temperature varies within the 110–130 °C range, the equal percentage control valve shows significantly better control performance than the other types. Therefore, in practical engineering applications, the actual working range of the primary network supply water temperature must also be considered.

5.3. Working Process and Precision Analysis of Bypass Control Valve

Unlike the heat exchange control valve, the bypass control valve is installed in the bypass pipe. By neglecting the pipeline impedance, the pressure difference across the control valve remains constant, and its flow characteristic is thus the ideal flow characteristic. Based on Equation (6), and by combining the relationship between the bypass control valve impedance and the primary network supply water temperature, the mathematical relationship between the opening degree of different control valves and the primary network supply water temperature can be derived. The parameter overview of the control valve in the case is shown in the following Table 3:

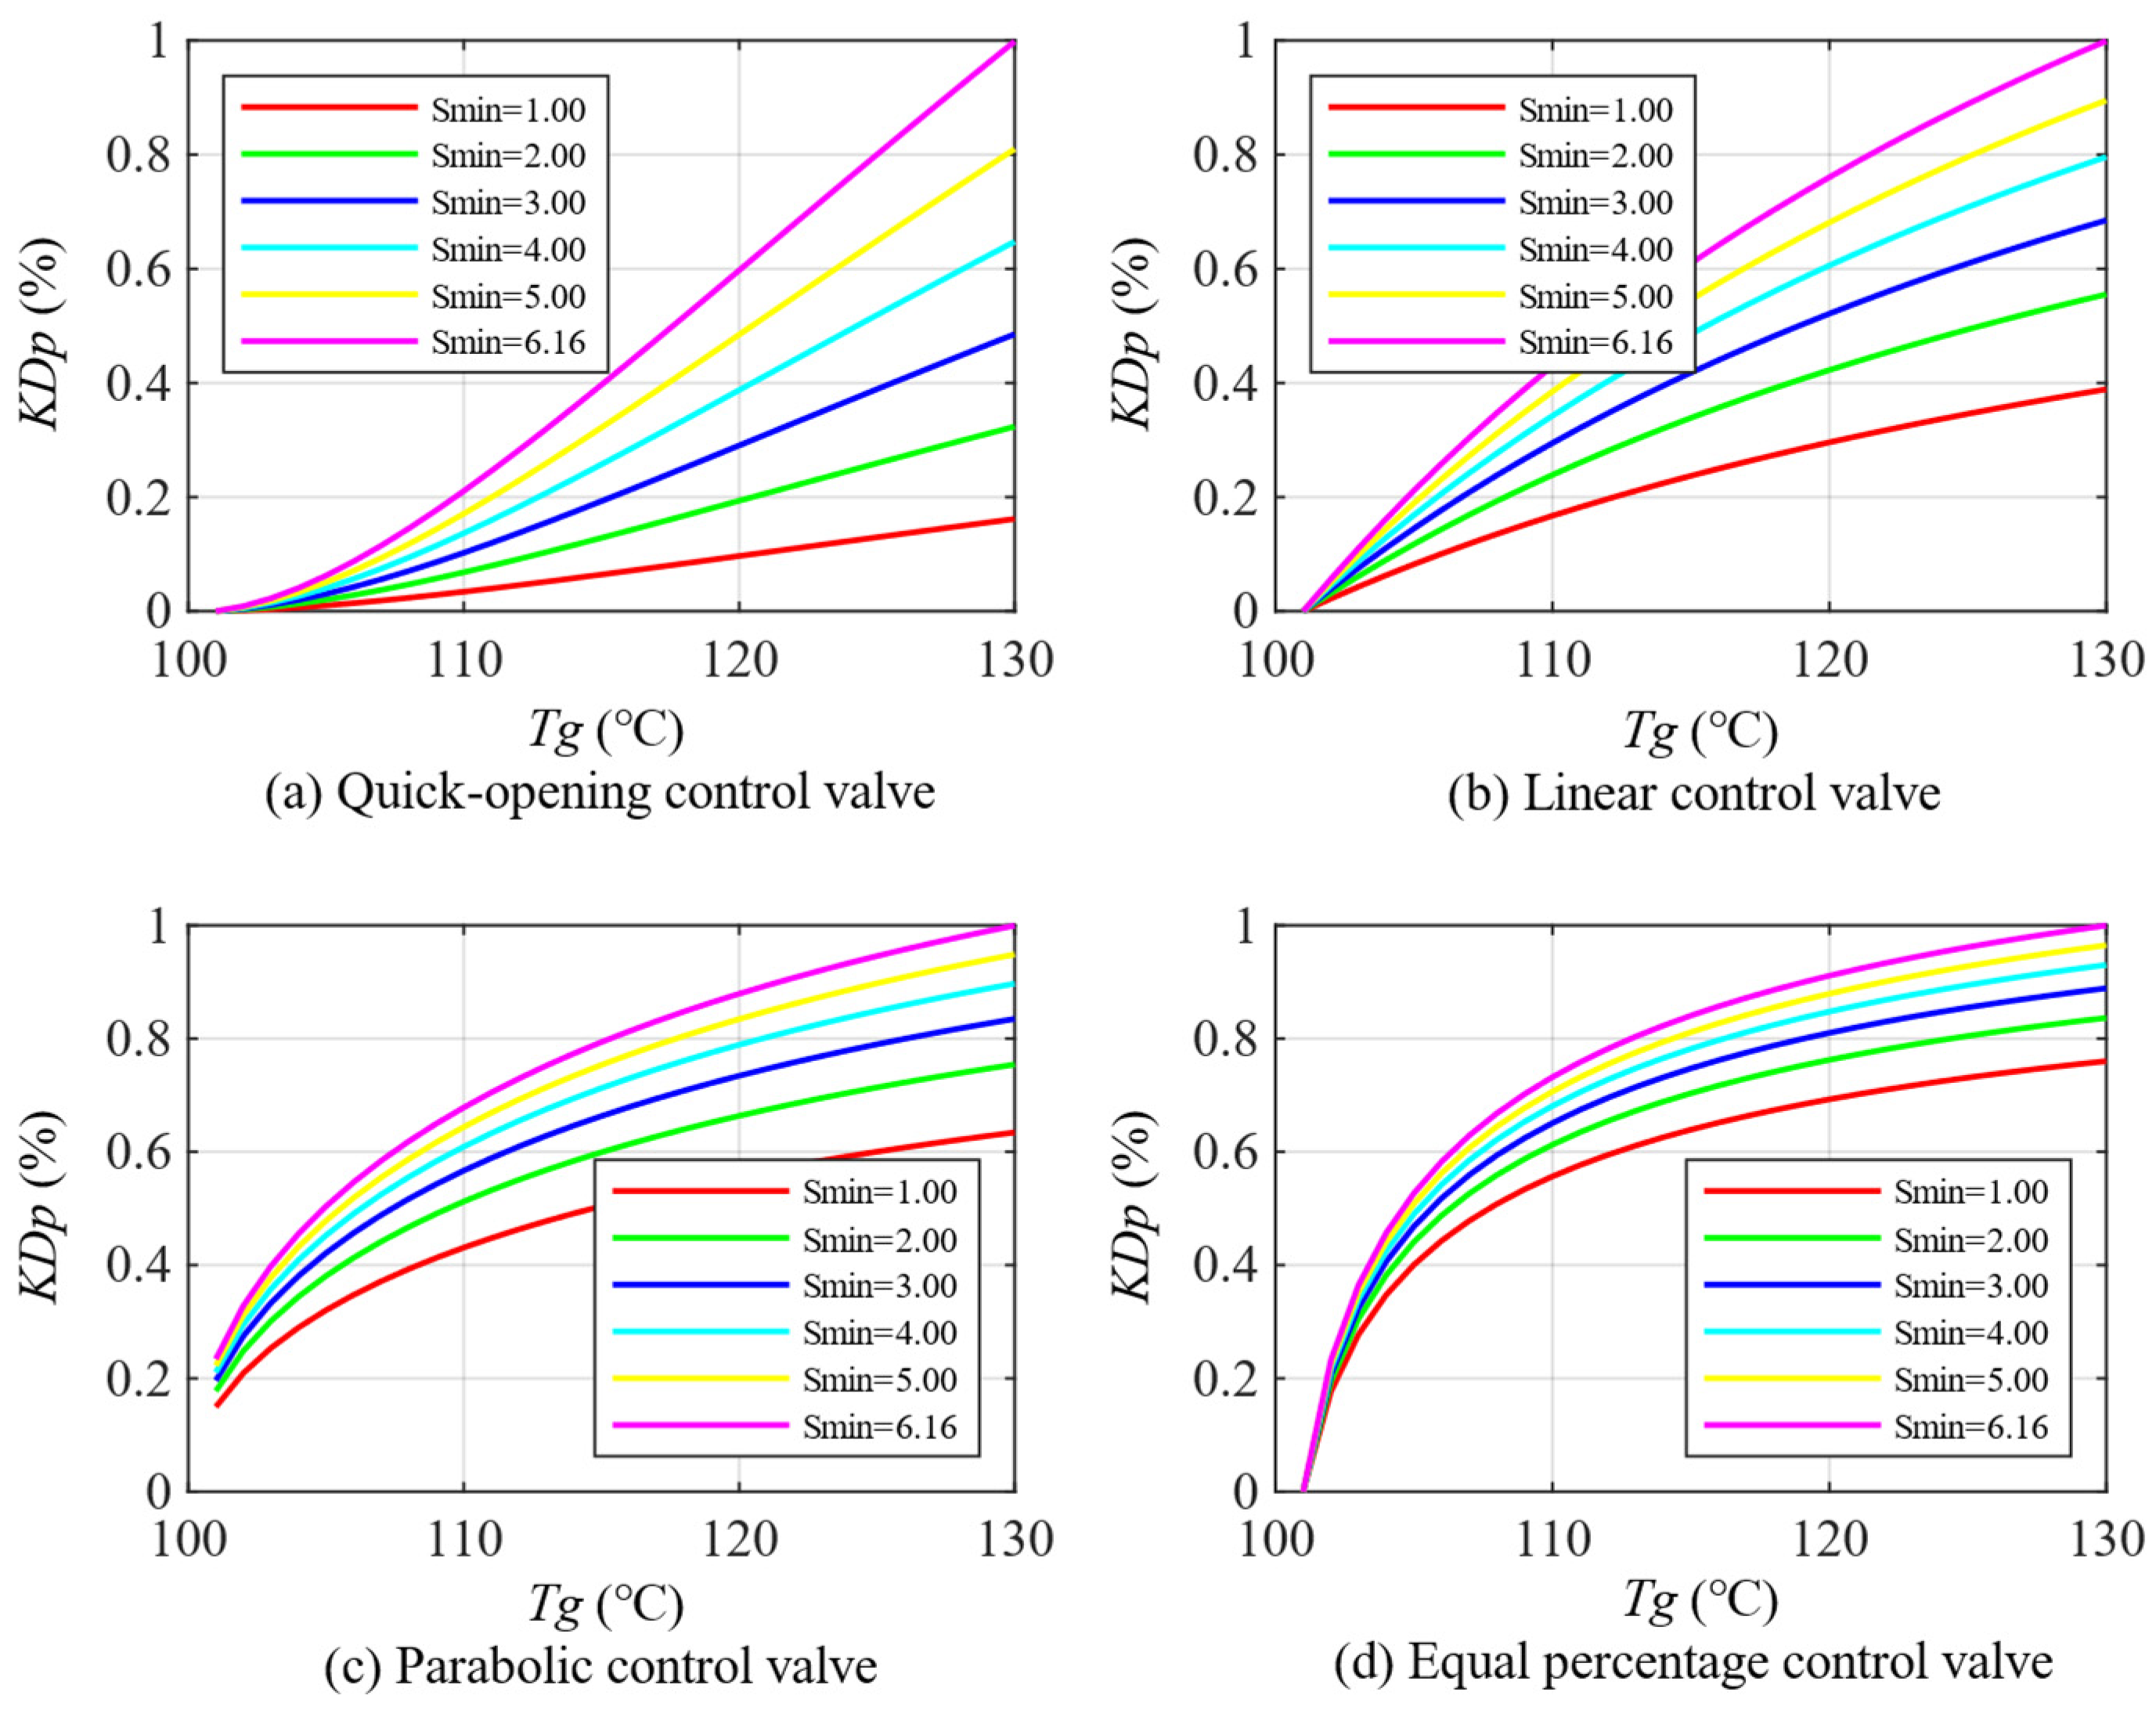
5.3.1. Impact of Minimum Control Impedance

Set the maximum control impedance to 1973.68 and analyze the working characteristics of the control valve when the minimum control impedance takes on different values.
As shown in Figure 10, the influence of the minimum control impedance on the working characteristics of different control valves follows a similar pattern. Take the equal percentage control valve in Figure 10d as an example: as the minimum control impedance increases, the minimum opening degree of the control valve remains essentially unchanged at around 0.01, while the maximum opening degree increases from 0.76 to 0.99, resulting in an expanded range of opening degree variation throughout the working process. Therefore, the range of the opening degree variation of the control valve can be adjusted by modifying the minimum control impedance.
Based on the dead zone theory, the flow deviation of the bypass control valve is analyzed, which can further help identify the optimal parameters.
As shown in Figure 11, as the minimum control impedance of the control valve increases, the flow fluctuation gradually decreases. When the minimum control impedance is 6.16, the average bypass flow fluctuation in the four types of control valves is minimized. From this, it can be concluded that when the minimum control impedance of the bypass control valve is set to 6.16 and the flow fluctuation is minimized and remains stable, indicating that the corresponding control valve demonstrates optimal control performance.

5.3.2. Impact of Maximum Control Impedance

Set the minimum control impedance to 6.16 and analyze the operating characteristics of the control valve when the maximum control impedance takes different values. Figure 12 shows the calculation results:
As shown in Figure 12, changes in the maximum control impedance significantly impact on the working characteristics of the equal percentage control valve. As the maximum control impedance increases, the minimum opening of the control valve increases significantly (from 0 to 0.52), while the maximum opening changes little, and the working range of the control valve’s opening narrows significantly.
Based on the dead zone theory, the flow deviation of the bypass control valve is analyzed, which can further help identify the optimal parameters. Figure 13 illustrates the potential deviations in the control valve’s flow.
As shown in Figure 13, when the maximum control impedance of the four types of control valves is set to 1973.68, the average fluctuation amplitude reaches its minimum. During operation, the equal percentage control valve experiences a maximum flow fluctuation of 2.93% and a minimum flow fluctuation of 0.2% in the bypass pipeline. From this, it can be concluded that when the value of the minimum control impedance is set to 1973.68, the flow fluctuation is minimal and stable.

5.3.3. Comparison of Optimal Parameters of Different Control Valves

According to the above analysis, the optimal parameter configuration of the control valve is as follows: the minimum control impedance is 6.16, and the maximum control impedance is 1973.68. Figure 14 shows the calculation results:
As shown in Figure 14a, the four types of control valves’ opening variation ranges are insignificant throughout their working process, all being within the range of zero to one. As shown in Figure 14b, the bypass flow of the linear control valve has the smallest fluctuation amplitude. According to Table 4, the average fluctuations of the quick-opening control valve and the linear control valve are similar. However, the former fluctuates more when operating under low temperature conditions and lacks higher stability compared to the latter. From this, we can conclude that the linear control valve performs significantly better control over the four types of control valves than the others. It can control the bypass flow more precisely and effectively.
In addition, when considering that the water supply temperature of the primary network only varies between 100 and 110 °C, among the four types of control valves, the equal percentage control valve demonstrates significantly better control performance than the others. When the primary network’s water supply temperature only varies between 110 °C and 130 °C, among the four types of control valves, the quick-opening control valve significantly outperforms the others in control performance. Therefore, specific engineering projects must consider the actual operating range of the primary network’s water supply temperature.

6. Optimization Verification Based on the Real Heating Network

6.1. Basic Situation of the Heating System

This centralized heating system is located in Zhangjiakou City, China. The heating period in Zhangjiakou City is 141 days (from 1 November to 31 March of the following year). The climate modification method calculates the design heat load, with the basic parameters being the temperature condition of −13.6 °C. The heating radius is approximately 11.4 km, the total heating area is about 11.5 million square meters, and the total design heat load reaches 350 MW. The heating system comprises one heat source (extraction condensing thermoelectric unit) and 51 heat stations. All the heat stations have reconstructed their pipeline network topology, and bypass branches have been added based on the original pipeline network structure.

6.2. Methods

During the heating period of 2024–2025, our team selected 16 heat stations with similar working conditions in the Zhangjiakou flexible heat network project. The team configured different control valve types with configuration schemes. The configuration scheme is shown in the following Table 5:
Based on the measured data of each heat station, observe the stability of the secondary network’s supply temperature when the primary network’s supply water temperature varies between 70 and 100 degrees Celsius. If the average deviation between the secondary network’s supply water temperature and the secondary network’s set supply water temperature is too large, the valve configuration is unreasonable; otherwise, the configuration is reasonable.

6.3. Engineering Data Analysis

The average temperature deviations of the secondary water supply from each heating station are shown in the following Table 6:
The above figure shows that Heat Station No. 14’s average temperature deviation is the smallest, only 2.5 °C. This heat exchange control valve adopts the equal percentage type control valve, and the bypass control valve adopts the linear type of control valve.
To gain a more intuitive understanding of the optimal control valve configuration of the heat station, the current heat stations are No. 13, 14, 15, and 16. Taking heat stations 2, 6, 10, and 14 as examples, the control valve configurations of each heat station are compared, as shown in the following Table 7:
As shown in Figure 15a, when the bypass control valve is selected as a linear control valve, the temperature fluctuation in the secondary network supply is relatively low. As shown in Figure 15b, when the heat exchange control valve selects the equal percentage type control valve, the temperature fluctuation in the secondary network supply is relatively low. The above observational data can visually verify the correctness of this paper’s conclusion.

7. Conclusions

This paper evaluates the regulatory performance of various control valves under specific operating conditions, concentrating on the minimum and maximum control impedance, and draws the following conclusions:
(1)
The influence of the maximum and minimum control impedance of the valve.
Under the condition that the control impedance range of the control valve exceeds its variation range, a larger minimum control impedance and a smaller maximum control impedance of the valve will result in better control performance and more stable supply–demand balance regulation in the heat exchange station. Specifically, it is manifested as more stable changes in relation to valve opening and a more stable heat exchange in the heat exchangers, which is beneficial to reducing overloading and oscillation phenomena in the regulation and the imbalance between the supply and the demand in the heat exchange stations. However, the minimum control impedance should not be too small, meaning the valve authority should not be excessively low. Insufficient authority can lead to severe distortion of the valve’s operating characteristics, significantly degrading its regulation quality.
(2)
Selection of valve types.
The heat exchange control valve was selected as an equal percentage type valve through a comparative analysis. The secondary circuit supply water temperature fluctuated between 0.51 °C and 0.83 °C, demonstrating minimal and stable variation while achieving optimal control performance. A linear characteristic valve was selected for the bypass control valve. The bypass flow fluctuation was limited to merely 1%, showing the smallest and most stable variation, enabling the control valve to deliver its optimal regulation performance. Moreover, when comparing multiple experiments in actual engineering, when the heat-exchange-regulating valve and the bypass-regulating valve were selected as the equal percentage type and linear control valve, the supply and demand balance of the heat station was the most stable. In specific engineering projects, the actual operating range of the primary network supply water temperature must also be considered. Taking the heat exchange control valve as an example, a quick-opening control valve demonstrates superior control performance when the supply water temperature ranges from 100 to 110 °C in the low-temperature zone. An equal percentage control valve demonstrates superior control performance when the supply water temperature ranges from 110 to 130 °C in the high-temperature zone.
(3)
Practical significance and prospects.
The research results provide a theoretical basis and technical guidance for the optimal control of intelligent heating in the district heating system and directly contribute to improving energy utilization efficiency and the quality of heating services. Further research should expand the application verification under different operating conditions and explore multi-valve collaborative optimization strategies to address complex heating demands. This will promote the sustainable development of district heating technology.

Author Contributions

Writing—original draft, conceptualization, data curation, visualization, P.Z.; conceptualization, data curation, visualization, J.Y.; supervision, writing—review and editing, software, funding acquisition, J.W. All authors have read and agreed to the published version of the manuscript.

Funding

This research has been made possible through funding from the National Natural Science Foundation of China (No. 52208104) and the Hebei Natural Science Foundation (No. E2024202065).

Data Availability Statement

The original contributions presented in this study are included in the article. Further inquiries can be directed to the corresponding author.

Acknowledgments

We would like to thank the Hebei Gongda Keya Group Co., Ltd., for providing the necessary data and field study platform. Jinda Wang would like to thank the support from the Initial Research Funding of the Hebei University of Technology.

Conflicts of Interest

The authors declare no conflicts of interest.

Abbreviations and Nomenclatures

The following abbreviations and nomenclatures are used in this manuscript:
symbolsignificance represented
BTSbypass thermal storage
LMTDlogarithmic mean temperature difference
Tg,refreference supply water temperature of the primary network, K
Th,refreference return water temperature of the primary temperature, K
tg,refreference supply water temperature of the secondary network, K
th,refreference return water temperature of secondary network, K
cpconstant-pressure specific heat of heat medium, J/(kg · K)
Zcharacteristic curve exponent
βproportion of bypass control valve cost in the total cost of bypass branch
Tg,Thdesign supply and return water temperatures of the primary network, K
Svvalve authority
tg,thdesign supply and return water temperatures of the secondary network, K
Bempirical parameters to characterize the convective heat transfer intensity of radiators
Shequivalent impedance of plate heat exchange in the secondary network, Pa·s2/m6
symbolsignificance represented
PHEplate heat exchange
PLCProgrammable Logic Controller
Spimpedance distribution of the secondary side bypass regulation valves of the heat substation, Pa·s2/m6
LMTDrefreference LMTD of PHE, K
LMTD*LMTD of PHE after throttling regulation, K
KDtrelative opening of heat exchange control valve
KDprelative opening of bypass control valve
tgsecondary side supply temperature corresponding to the actual valve opening
Rrangeability
Sp,minminimum impedance of bypass regulation on the secondary side of the heat substation, Pa·s2/m6
Sp,maxmaximum impedance of bypass regulation on the secondary side of the heat substation, Pa·s2/m6
St,minminimum impedance of heat-exchange regulation on the secondary side of the heat substation, Pa·s2/m6
St,maxmaximum impedance of heat-exchange regulation on the secondary side of the heat substation, Pa·s2/m6
Stimpedance of the secondary side heat exchange regulation of the heat substation, Pa·s2/m6

References

  1. Ma, G.; Liu, M.; Wang, Z.; Zhao, Y.; Wang, C.; Yan, J. Energy saving and flexibility analysis of combined heat and power systems integrating heat-power decoupling technologies in renewable energy accommodation. Energy Convers. Manag. 2024, 310, 118487. [Google Scholar] [CrossRef]
  2. Pokhrel, S.; Amiri, L.; Poncet, S.; Sasmito, A.P.; Ghoreishi-Madiseh, S.A. Renewable heating solutions for buildings; a techno-economic comparative study of sewage heat recovery and Solar Borehole Thermal Energy Storage System. Energy Build. 2022, 259, 111892. [Google Scholar] [CrossRef]
  3. Nuytten, T.; Claessens, B.; Paredis, K.; Van Bael, J.; Six, D. Flexibility of a combined heat and power system with thermal energy storage for district heating. Appl. Energy 2013, 104, 583–591. [Google Scholar] [CrossRef]
  4. Mitterrutzner, B.; Callegher, C.Z.; Fraboni, R.; Wilczynski, E.; Pezzutto, S. Review of heating and cooling technologies for buildings: A techno-economic case study of eleven European countries. Energy 2023, 284, 129252. [Google Scholar] [CrossRef]
  5. Leśko, M.; Bujalski, W. Modeling of district heating networks for the purpose of operational optimization with thermal energy storage. Arch. Thermodyn. 2017, 38, 139–163. [Google Scholar] [CrossRef]
  6. Guo, Y.; Wang, S.; Wang, J.; Zhang, T.; Ma, Z.; Jiang, S. Key district heating technologies for building energy flexibility: A review. Renew. Sustain. Energy Rev. 2023, 189, 114017. [Google Scholar] [CrossRef]
  7. Wang, J.; Pan, B.; Rong, L.; Sun, C.; Qi, C. Topology reconstruction of the district heating network for maximizing comprehensive benefits of thermal storage. Energy 2024, 313, 134065. [Google Scholar] [CrossRef]
  8. Kuosa, M.; Kiviranta, P.; Sarvelainen, H.; Tuliniemi, E.; Korpela, T.; Tallinen, K.; Koponen, H.-K. Optimisation of district heating production by utilising the storage capacity of a district heating network on the basis of weather forecasts. Results Eng. 2022, 13, 100318. [Google Scholar] [CrossRef]
  9. Hao, J.; Zheng, P.; Li, Y.; Zhang, Z.; Zhang, J.; Yang, J.; Yue, Y.; Li, X. Study on the operational feasibility domain of combined heat and power generation system based on compressed carbon dioxide energy storage. Energy 2023, 291, 130122. [Google Scholar] [CrossRef]
  10. Zhang, Y.; Johansson, P.; Kalagasidis, A.S. Applicability of thermal energy storage in future low-temperature district heating systems—Case study using multi-scenario analysis. Energy Convers. Manag. 2021, 244, 114518. [Google Scholar] [CrossRef]
  11. Hassan, M.A.; Serra, S.; Sochard, S.; Viot, H.; Marias, F.; Reneaume, J.-M. Optimal scheduling of energy storage in district heating networks using nonlinear programming. Energy Convers. Manag. 2023, 295, 117652. [Google Scholar] [CrossRef]
  12. Yang, Z.; Zhou, Y.; Zhang, J.; Lin, X.; Du-Ikonen, L.; Zhong, W.; Zhang, H.; Huang, L.; Liu, B.; Xia, G. Bi-level optimal configuration of renewable electricity based heating in substations of district heating systems. J. Build. Eng. 2024, 95, 110285. [Google Scholar] [CrossRef]
  13. Knudsen, B.R.; Rohde, D.; Kauko, H. Thermal energy storage sizing for industrial waste-heat utilization in district heating: A model predictive control approach. Energy 2021, 234, 121200. [Google Scholar] [CrossRef]
  14. Yu, L.; Sun, Y.; Xu, Z.; Shen, C.; Yue, D.; Jiang, T.; Guan, X. Multi-agent deep reinforcement learning for hvac control in commercial buildings. IEEE Trans. Smart Grid 2020, 12, 407–419. [Google Scholar] [CrossRef]
  15. Zheng, X.; Shi, Z.; Wang, Y.; Zhang, H.; Tang, Z. Digital twin modeling for district heating network based on hydraulic resistance identification and heat load prediction. Energy 2023, 288, 129726. [Google Scholar] [CrossRef]
  16. Wang, J.; Zhou, Z.; Zhao, J.; Zheng, J.; Guan, Z. Optimizing for clean-heating improvements in a district energy system with high penetration of wind power. Energy 2019, 175, 1085–1099. [Google Scholar] [CrossRef]
  17. Zhang, Z.; Fedorovich, K.S. Optimal operation of multi-integrated energy system based on multi-level Nash multi-stage robust. Appl. Energy 2024, 358, 122557. [Google Scholar] [CrossRef]
  18. Zotică, C.; Pérez-Piñeiro, D.; Skogestad, S. Supervisory control design for balancing supply and demand in a district heating system with thermal energy storage. Comput. Chem. Eng. 2021, 149, 107306. [Google Scholar] [CrossRef]
  19. Xu, X.; Wang, Y.; Fang, L.; Wang, Z.; Li, Y. Numerical study on cavity-vortex evolution in cavitation flow in nuclear control valves with different openings and structural parameters. Ann. Nucl. Energy 2024, 211, 110880. [Google Scholar] [CrossRef]
  20. Bünning, F.; Warrington, J.; Heer, P.; Smith, R.S.; Lygeros, J. Robust MPC with data-driven demand forecasting for frequency regulation with heat pumps. Control. Eng. Pract. 2022, 122, 105101. [Google Scholar] [CrossRef]
Figure 1. Schematic diagram of thermal storage bypass configuration scheme.
Buildings 15 01624 g001
Figure 2. Flowchart of characteristic analysis of control valves.
Buildings 15 01624 g002
Figure 3. A diagram of the relative flow rate variation with the supply water temperature of the primary network.
Buildings 15 01624 g003
Figure 4. A diagram of the impedance with the supply water temperature of the primary network.
Buildings 15 01624 g004
Figure 5. Diagrams of valves opening with the supply water temperature of the primary network.
Buildings 15 01624 g005
Figure 6. Diagrams of the temperature fluctuations of the secondary network water supply with the supply water temperature of the primary network.
Buildings 15 01624 g006
Figure 7. Diagrams of valves opening with the supply water temperature of the primary network.
Buildings 15 01624 g007
Figure 8. Diagrams of the temperature fluctuations of the secondary network water supply with the supply water temperature of the primary network.
Buildings 15 01624 g008
Figure 9. (a) A diagram of the valve opening with the supply water temperature of the primary network. (b) A diagram of the temperature fluctuation in the secondary network water supply with the supply water temperature of the primary network.
Buildings 15 01624 g009
Figure 10. Diagrams of valves opening with the supply water temperature of the primary network.
Buildings 15 01624 g010
Figure 11. Diagrams of the maximum fluctuation in the bypass flow with the supply water temperature of the primary network.
Buildings 15 01624 g011
Figure 12. Diagrams of valves opening with the supply water temperature of the primary network.
Buildings 15 01624 g012
Figure 13. Diagrams of the maximum fluctuations of the bypass flow with the supply water temperature of the primary network.
Buildings 15 01624 g013
Figure 14. (a) A diagram of the valve opening with the supply water temperature of the primary network. (b) A diagram of the maximum fluctuation in the bypass flow with the supply water temperature of the primary network.
Buildings 15 01624 g014
Figure 15. (a) Comparison of Heating Stations No. 13, 14, 15, and 16. (b) Comparison of Heating Stations No. 2, 6, 10, and 14.
Buildings 15 01624 g015
Table 1. Parameter summary of heat-exchange-regulating valves.
Impedance RangeMinimum Controllable Impedance RangeMaximum Controllable Impedance Range
0.55~2.310~0.552.31~+∞
Table 2. The water supply temperature of the secondary pipeline network fluctuates.
Types of Control ValvesWater Supply Temperature of the Primary Network (°C)Average Value
105110115120125130
Quick-opening0.27820.42300.58790.77080.97041.18570.7027
Linear control0.31160.40640.49780.58610.67130.75410.5379
Parabolic control0.33560.40540.46630.52010.56830.61210.4846
Equal percentage0.36590.40930.44200.46720.48700.50290.4457
Table 3. Parameter summary of Bypass Control Valve.
Impedance RangeMinimum Controllable Impedance RangeMaximum Controllable Impedance Range
66.16~1973.680~6.161973.68~+∞
Table 4. The heat exchange flow fluctuates.
Types of Control ValvesWater Supply Temperature of the Primary Network (°C)Average Value
105110115120125130
Quick opening1.95271.08000.78950.64420.55700.49880.92
Linear control0.94410.94410.94410.94410.94410.94410.94
Parabolic control0.94861.15221.28691.38641.46411.52681.29
Equal percentage0.73691.33151.82142.23212.58152.88261.93
Table 5. Valve configuration of heat exchange stations.
GroupHeat StationHeat Exchange Control ValveBypass Control ValveGroupHeat StationHeat Exchange Control ValveBypass Control Valve
1Lixiang1Quick-openingQuick-opening9XimaoParabolicQuick-opening
2Lixang2Quick-openingLinear10ZhanghengParabolicLinear
3NingxinQuick-openingParabolic11TetaoParabolicParabolic
4FuyuanQuick-openingEqual percentage12GongyeParabolicEqual percentage
5TianxiuLinearQuick-opening13ZhonghangEqual percentageQuick-opening
6JingyangLinearLinear14GuangmingEqual percentageLinear
7YijingLinearParabolic15FeicuiEqual percentageParabolic
8FuguiLinearEqual percentage16QiantunEqual percentageEqual percentage
Table 6. The average temperature deviation in the water supply from the secondary network.
Heat station12345678
Average value4.03.84.03.93.23.13.33.3
Heat station910111213141516
Average value2.92.73.03.13.12.52.72.9
Table 7. Valve configuration of heat exchange stations.
GroupHeat StationHeat Exchange Control ValveBypass Control ValveGroupHeat StationHeat Exchange Control ValveBypass Control Valve
2Lixang2Quick-openingLinear13ZhonghangEqual percentageQuick-opening
6JingyangLinearLinear14GuangmingEqual percentageLinear
10ZhanghengParabolicLinear15FeicuiEqual percentageParabolic
10ZhanghengParabolicLinear16QiantunEqual percentageEqual percentage
Disclaimer/Publisher’s Note: The statements, opinions and data contained in all publications are solely those of the individual author(s) and contributor(s) and not of MDPI and/or the editor(s). MDPI and/or the editor(s) disclaim responsibility for any injury to people or property resulting from any ideas, methods, instructions or products referred to in the content.

