Article

Rapid Seismic Damage Assessment in Densely Built Wooden Residential Areas Using 3D Point Cloud Measurement

1
Department of Architecture, Tokyo City University, Tokyo 158-8557, Japan
2
Graduate School of Integrative Science and Engineering, Tokyo City University, Tokyo 158-8557, Japan
3
Department of Informatics, Yasuda Women’s University, Hiroshima 731-0153, Japan
*
Author to whom correspondence should be addressed.
Buildings 2025, 15(10), 1623; https://doi.org/10.3390/buildings15101623
Submission received: 31 March 2025 / Revised: 6 May 2025 / Accepted: 9 May 2025 / Published: 11 May 2025
(This article belongs to the Section Building Structures)

Abstract

:
Rapid post-earthquake assessments of residential buildings are essential for preventing secondary disasters but typically require substantial human resources, with challenges related to accuracy and inspector safety. In wooden residential buildings, residual deformation can cause significant internal damage despite minor external indications. Thus, accurate evaluation of secondary components such as exterior walls and window frames is crucial. Although recent studies on digital assessment technologies focus mainly on reinforced concrete structures, limited research addresses wooden structures, especially considering residual deformation. This study proposes a rapid emergency risk assessment method utilizing 3D point cloud measurements obtained by a 3D scanning camera for densely built wooden residential areas. Its practicality was verified through three aspects. First, a comparison with conventional methods showed that the measurement accuracy of the proposed method is sufficient for practical use, with errors significantly lower than the inclination thresholds used in emergency risk assessments (e.g., 1/60 rad ≈ 1°). Second, in detection experiments using a deformed window frame model, the average error between the applied inclination and the measured values was less than 3%, demonstrating that deformation, dislodgement, and inclination of secondary components can be reliably detected from point cloud data. Third, field validation conducted in a commercial district confirmed that multiple buildings can be simultaneously measured and that individual buildings and their secondary components can be efficiently extracted and identified. Thus, this method demonstrates practical applicability and significantly improves the speed and efficiency of emergency assessments in densely built wooden residential areas.

1. Introduction

In earthquake-prone regions, systems to evaluate building safety after earthquakes have been developed to ensure human safety. Examples include the ATC-20 system in the USA [1], California’s SAP [2], New Zealand’s RBA [3], and Italy’s AeDES [4], which initially relied on visual assessments to enhance rapidity. Criteria within these systems, such as brick masonry evaluation in RBA and stone masonry in AeDES [5,6], reflect regional structural characteristics. In contrast, in Japan, where wooden houses account for most of the housing stock, assessment methods have been developed considering the unique structural characteristics of wooden buildings.
In Japan, earthquake damage assessments for residential buildings include Emergency Risk Assessment to prevent secondary disasters, Damage Classification Assessment to determine the permanent usability of affected buildings, and damage certification for issuing disaster victim certificates [7]. Emergency Risk Assessment, aimed at preventing secondary hazards from aftershocks, particularly emphasizes rapidity. This assessment is conducted by certified emergency risk inspectors, with approximately 100,000 qualified inspectors registered as of March 2024 [8]. Typically, two inspectors assess each building using visual observation and direct measurement. However, in the chaotic aftermath of an earthquake, securing many inspectors becomes necessary, and completing assessments for all affected houses can take a significant amount of time. Furthermore, since inspectors must physically approach buildings in densely built residential areas to conduct direct measurements, there is a risk of secondary disasters due to aftershocks. As a result, multiple challenges have been identified, including the need to ensure rapidity, safety, and assessment accuracy, as well as the appropriate allocation of assessment resources.
According to Japan’s housing stock statistics and building construction start statistics, wooden structures constitute most of Japan’s housing stock, accounting for approximately 83% of existing homes as of 2023 [9] and about 83% of newly built homes in 2024 [10]. Based on this prevalence, this study focused on wooden structures. Older, densely populated residential areas in the Tokyo metropolitan area predominantly consist of wooden houses, many of which use ceramic siding as an exterior material. During earthquakes, wooden structures may experience a unique phenomenon known as “swinging back”, where substantial internal damage can occur despite minimal visible residual deformation due to structural resilience. Therefore, it is difficult to assess the extent of damage based on external appearance, as external damage may initially appear minor. In contrast, significant structural damage may accumulate internally, potentially leading to collapse hours after the earthquake. Secondary components, such as window frames and siding, typically show more noticeable damage, such as the detachment of siding and misalignment between walls and window frames.
Consequently, emergency risk assessments for wooden homes utilize the damage observed in secondary components to infer the maximum inter-story drift, even when visible tilt is minimal [11]. Recently proposed methods to enhance rapidity and accuracy in emergency assessments include image analysis-based evaluation methods [12], artificial intelligence-driven image diagnostic systems [13], and machine learning models predicting damage from seismic acceleration data [14]. The image analysis-based method [12] evaluates building tilt by extracting and analyzing straight lines from captured images. The artificial intelligence-driven diagnostic system [13] targets external wall cracks, utilizing historical disaster images to train the system. Machine learning-based approaches [14] predict building damage by learning the relationship between seismic acceleration data and deformation angles and estimating damage severity from observed seismic accelerations. However, most of these studies primarily address reinforced concrete structures, with limited consideration of wooden structures’ unique characteristics, such as “swinging back” and secondary component damage. Therefore, this study investigates 3D scanning cameras incorporating damage evaluation of secondary components and considering residual deformation to improve the rapidity and efficiency of emergency risk assessments in densely built wooden residential areas, such as the Tokyo metropolitan region. This study assumes that secondary components such as window frames undergo in-plane deformation similar to the main structural frame but are minimally affected by the “swinging back” phenomenon. Therefore, the tilt criteria used in Japan’s emergency risk assessments—1/60 rad for caution and 1/20 rad for danger—are adopted as the reference indicators for deformation evaluation.
3D scanning cameras capture images and three-dimensional point cloud data, enabling accurate measurement of distances and dimensions. This approach allows for preliminary visual inspections through flyover previews and numerical evaluation of damaged buildings’ tilt using digital processing algorithms, as illustrated in Figure 1. Since the primary task at assessment sites involves capturing images, data processing can be safely conducted remotely, enhancing safety and efficiency compared to conventional visual inspections and direct measurements. A comparison of current methods and the proposed photogrammetry-based approach is illustrated in Figure 2 to demonstrate theoretical improvements in safety, efficiency, and rapidity.

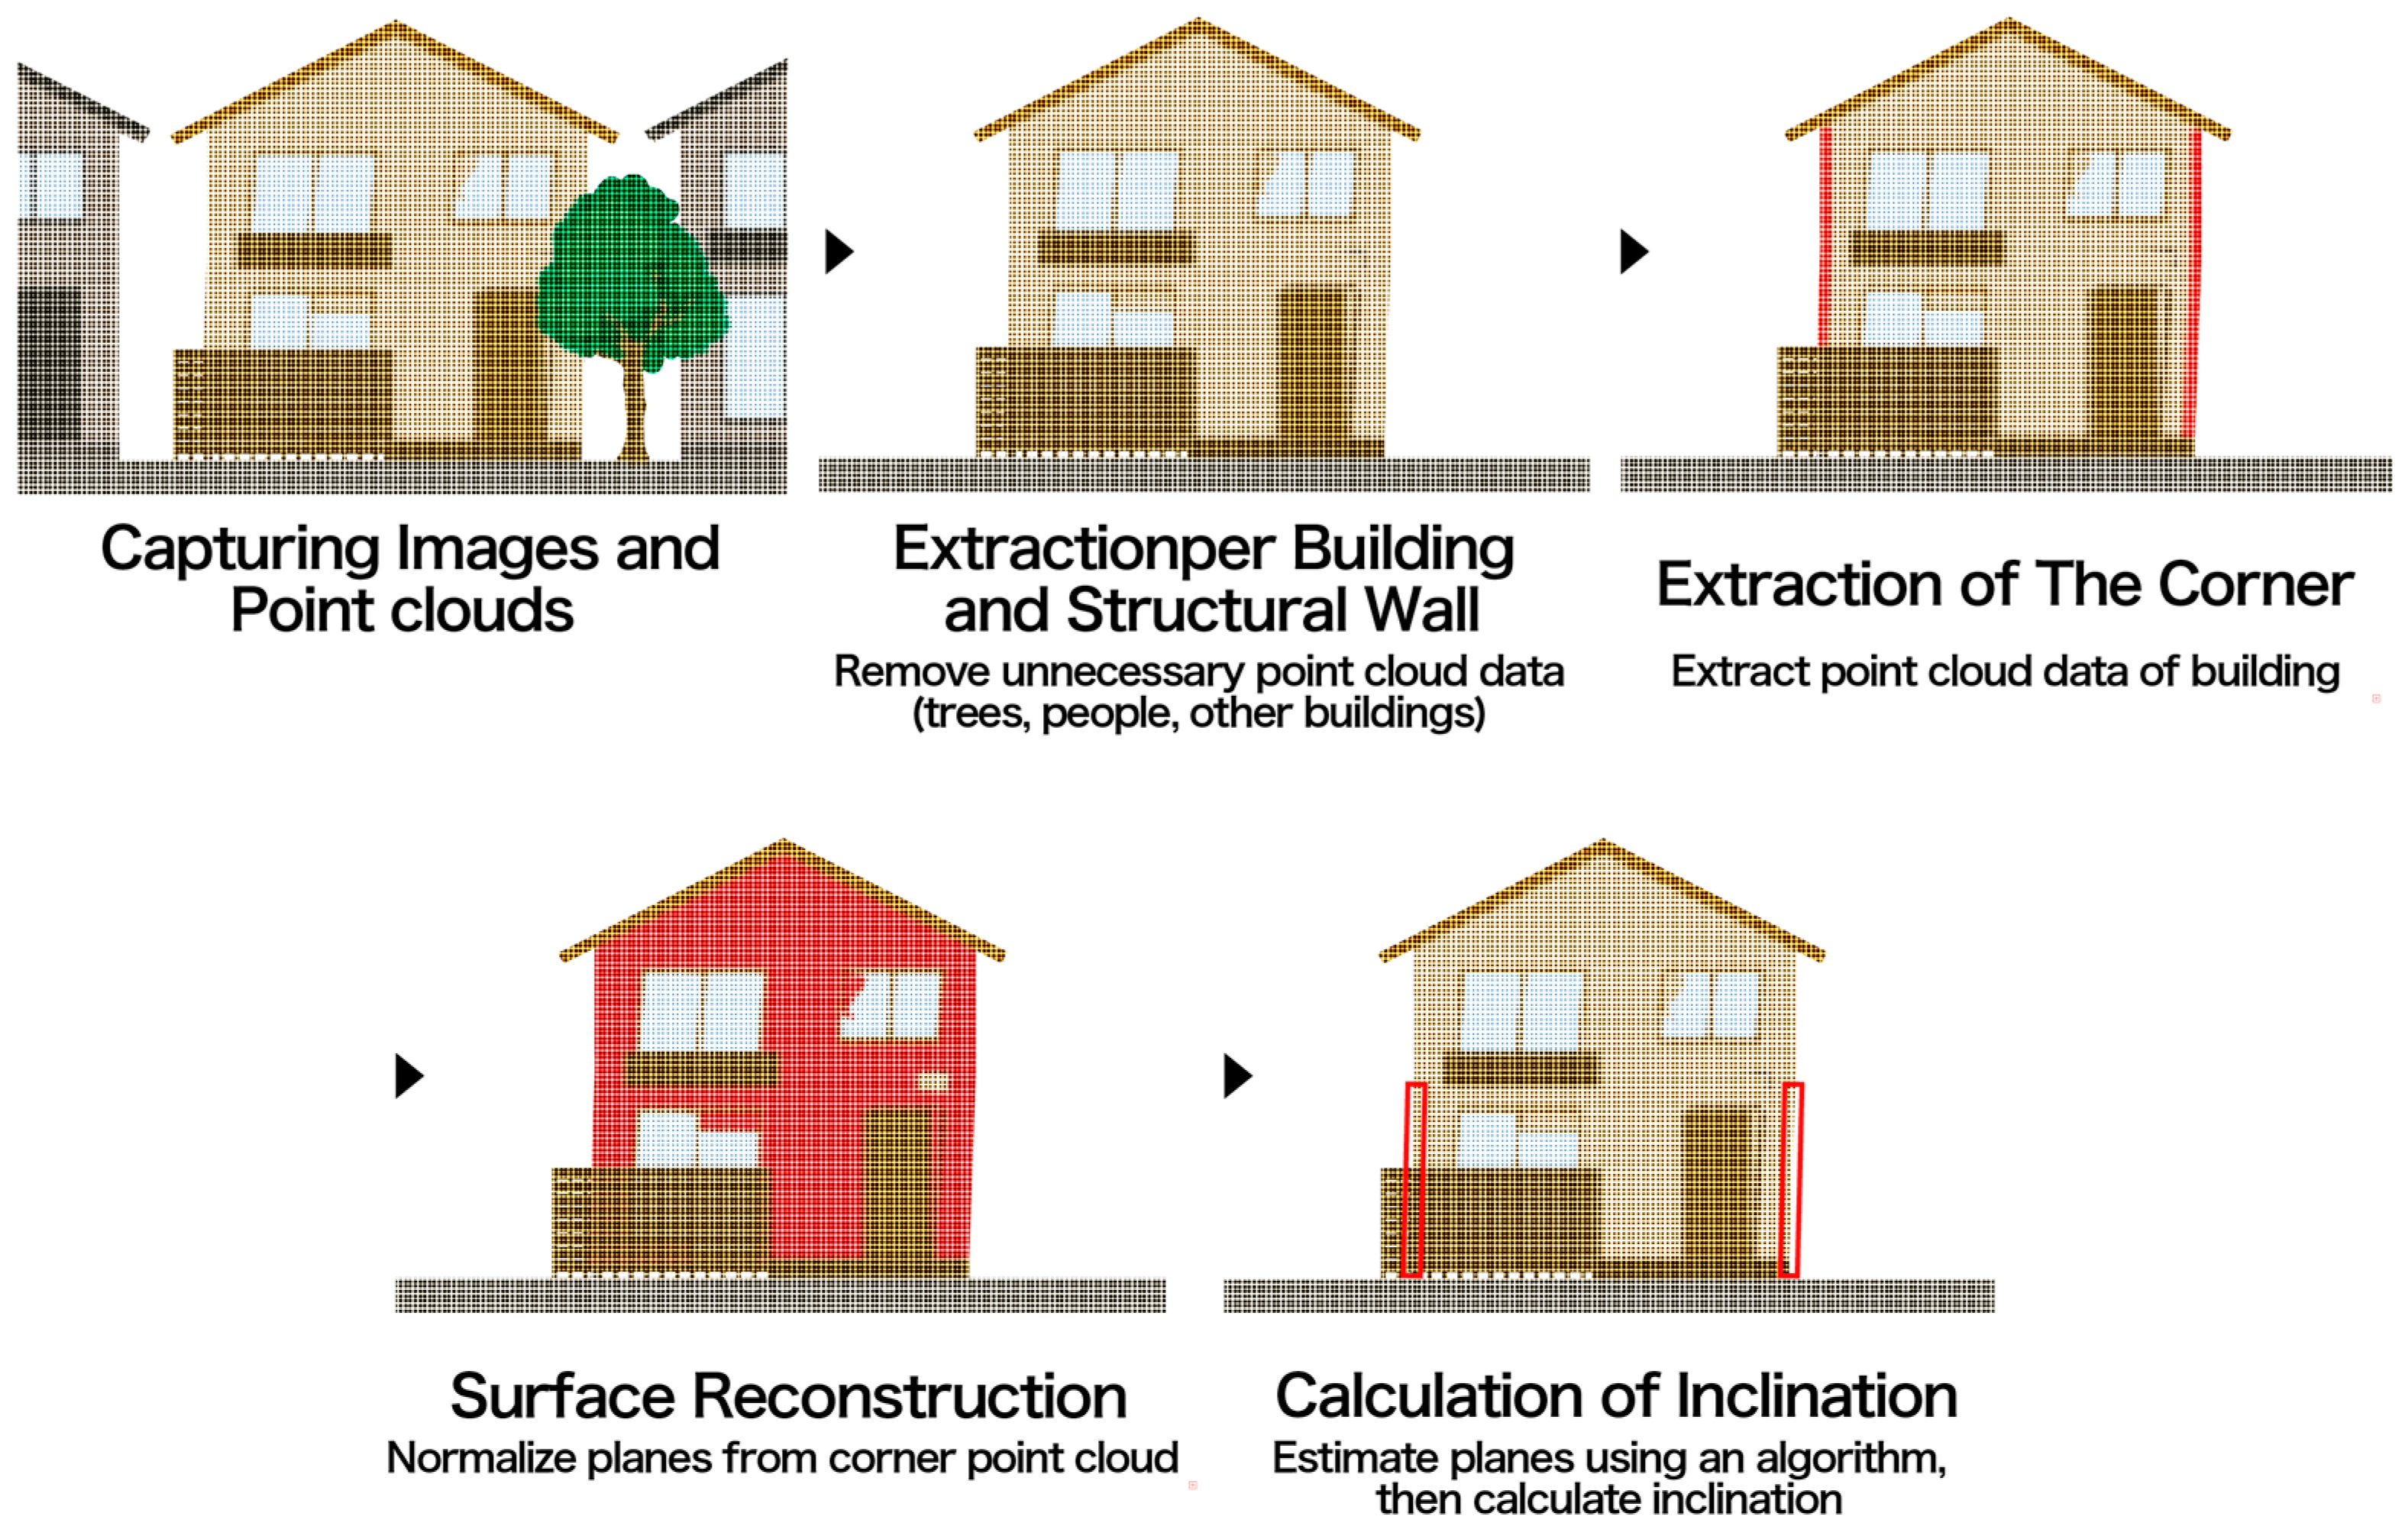
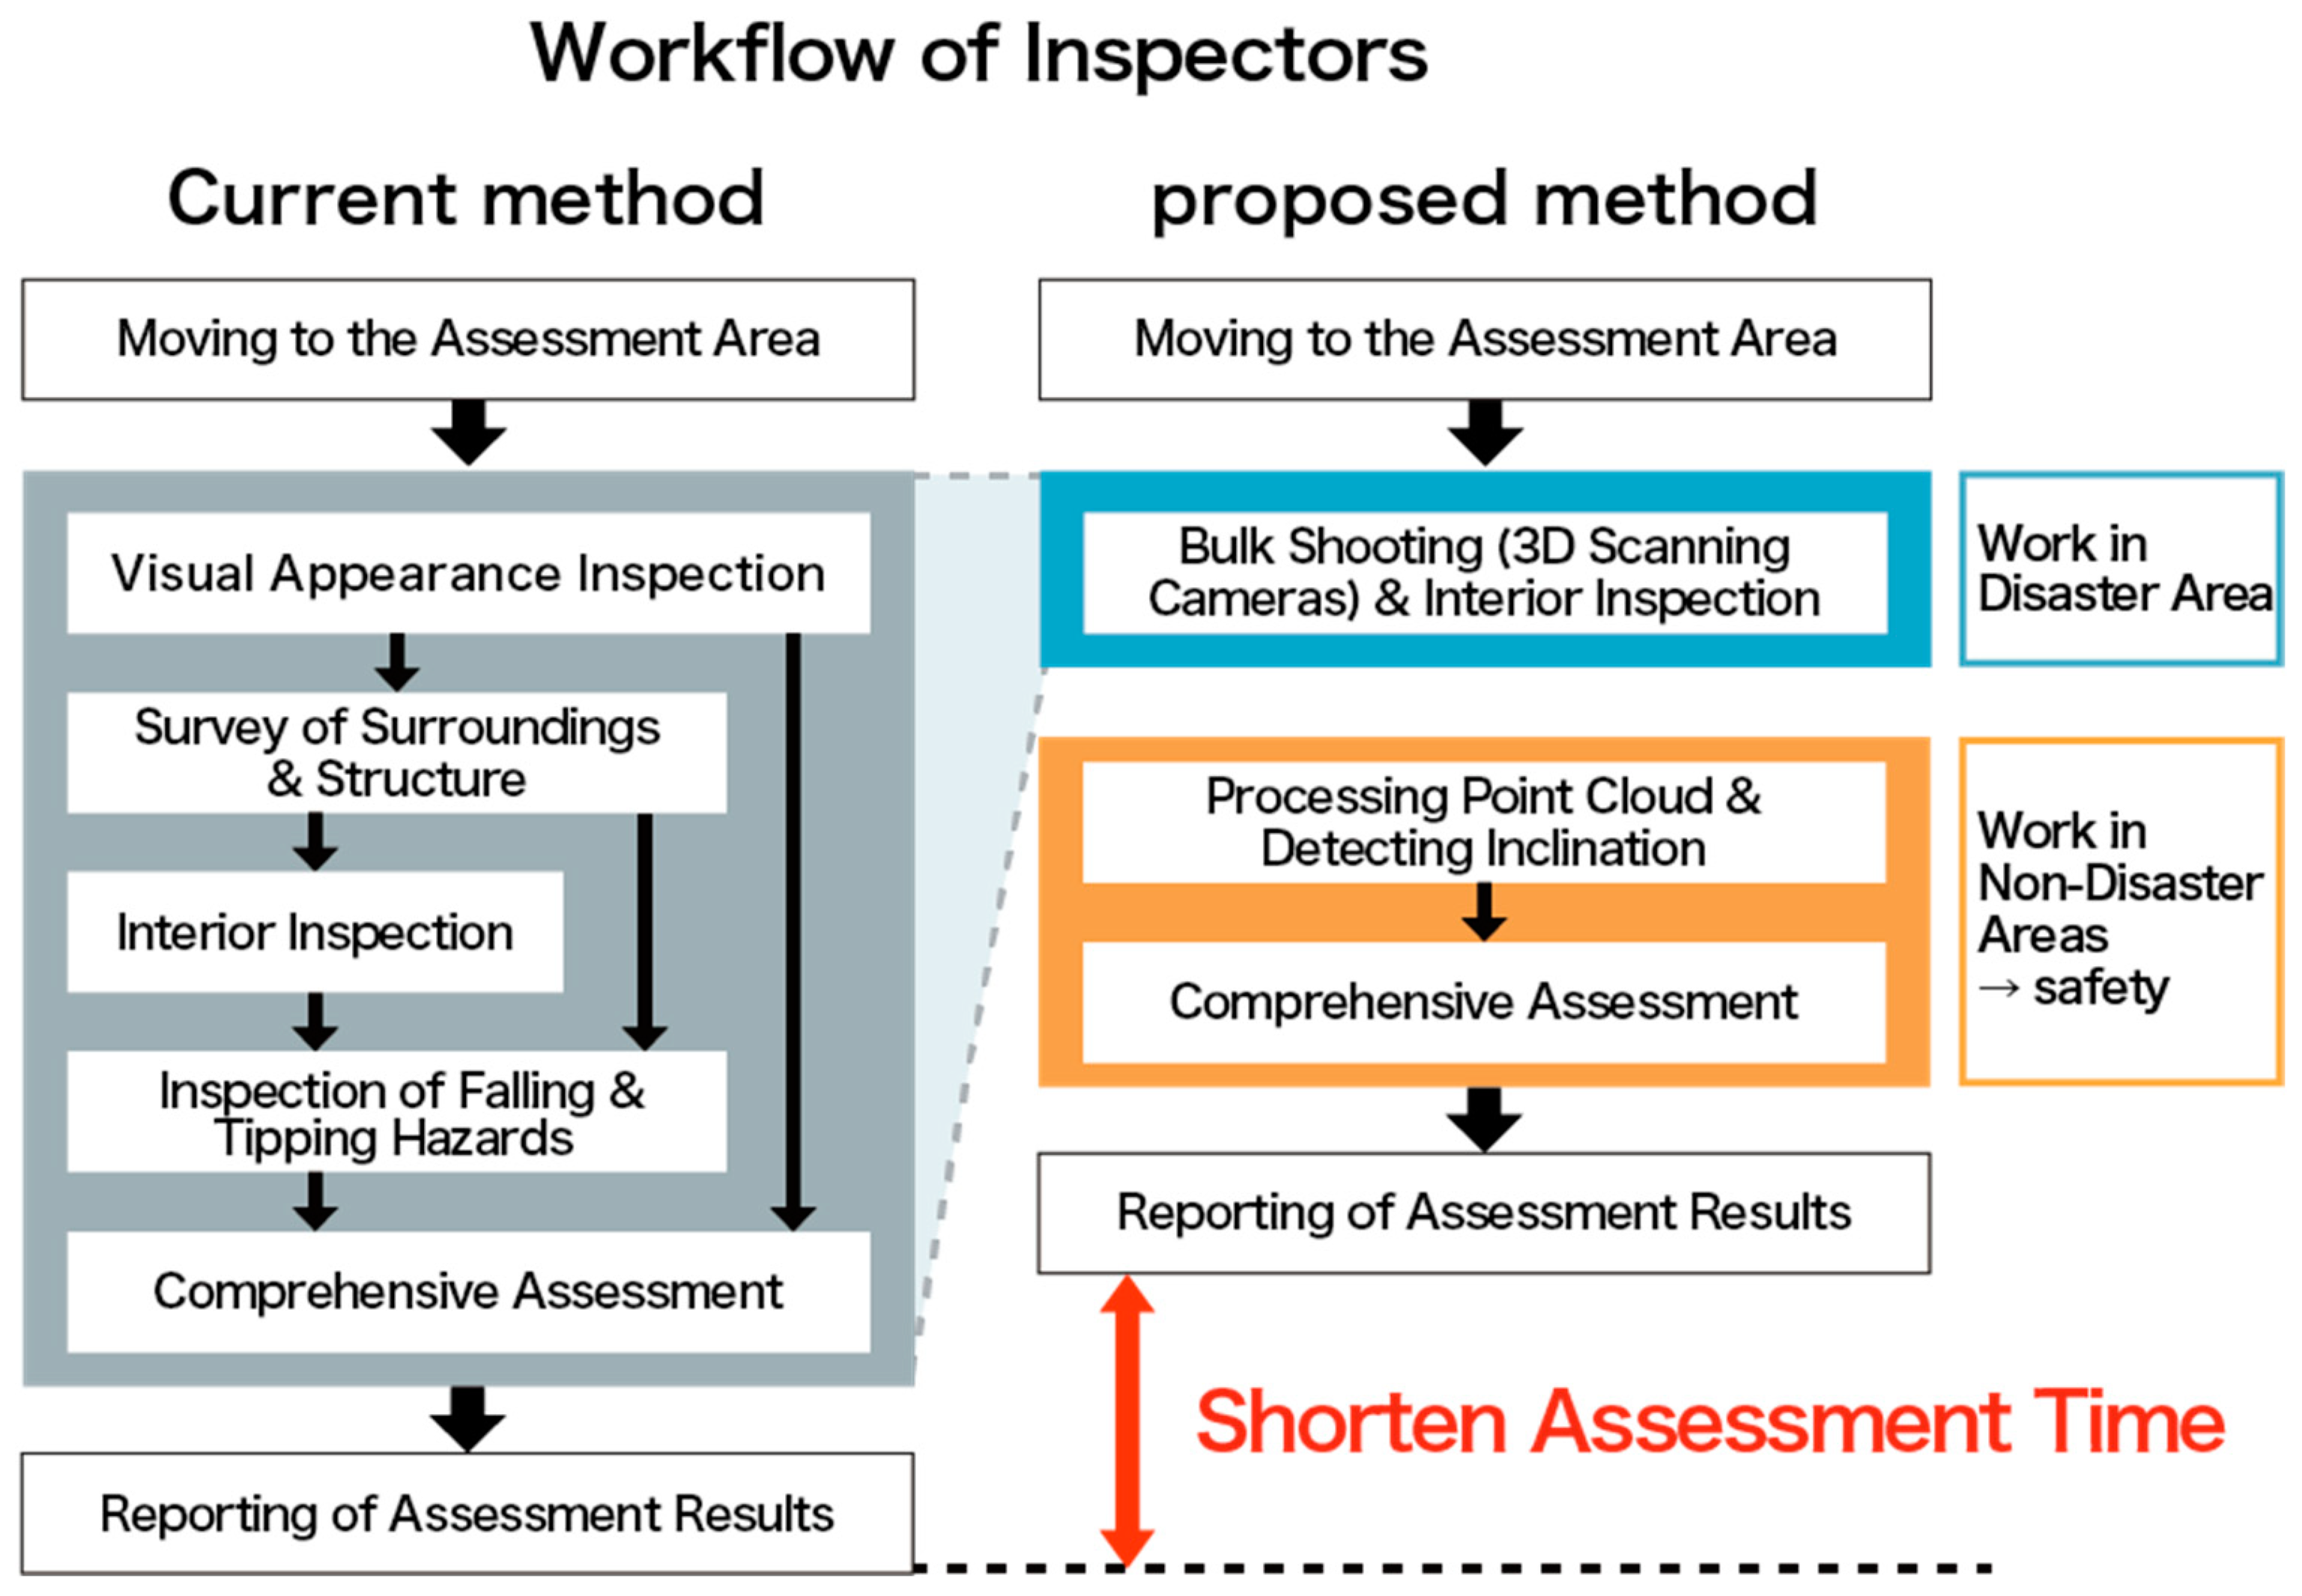
2. Equipment and Methodology

2.1. Research Flow

This study evaluated secondary component damage, compared 3D scanning camera accuracy, and acquired simultaneous data from multiple buildings to confirm the proposed method’s practical applicability for densely built wooden residential areas. Figure 3 shows the research flow used in this study.

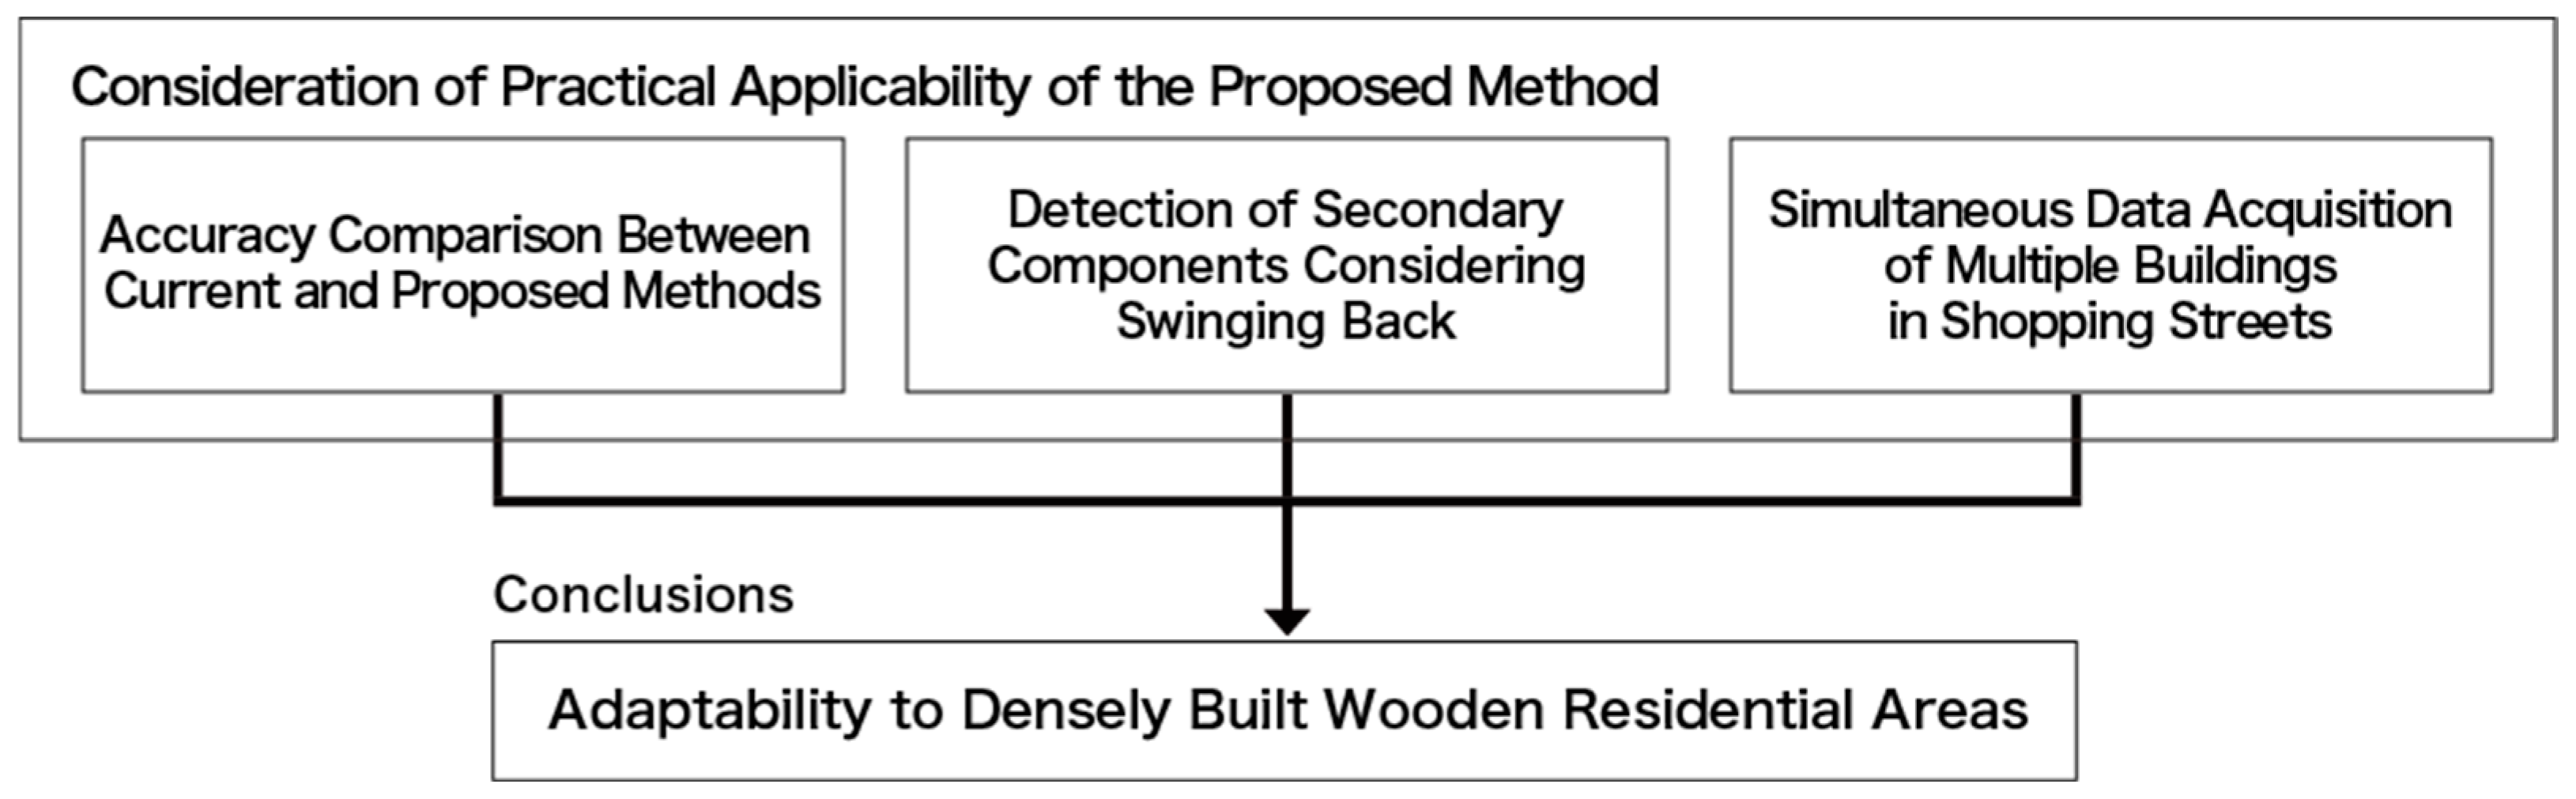
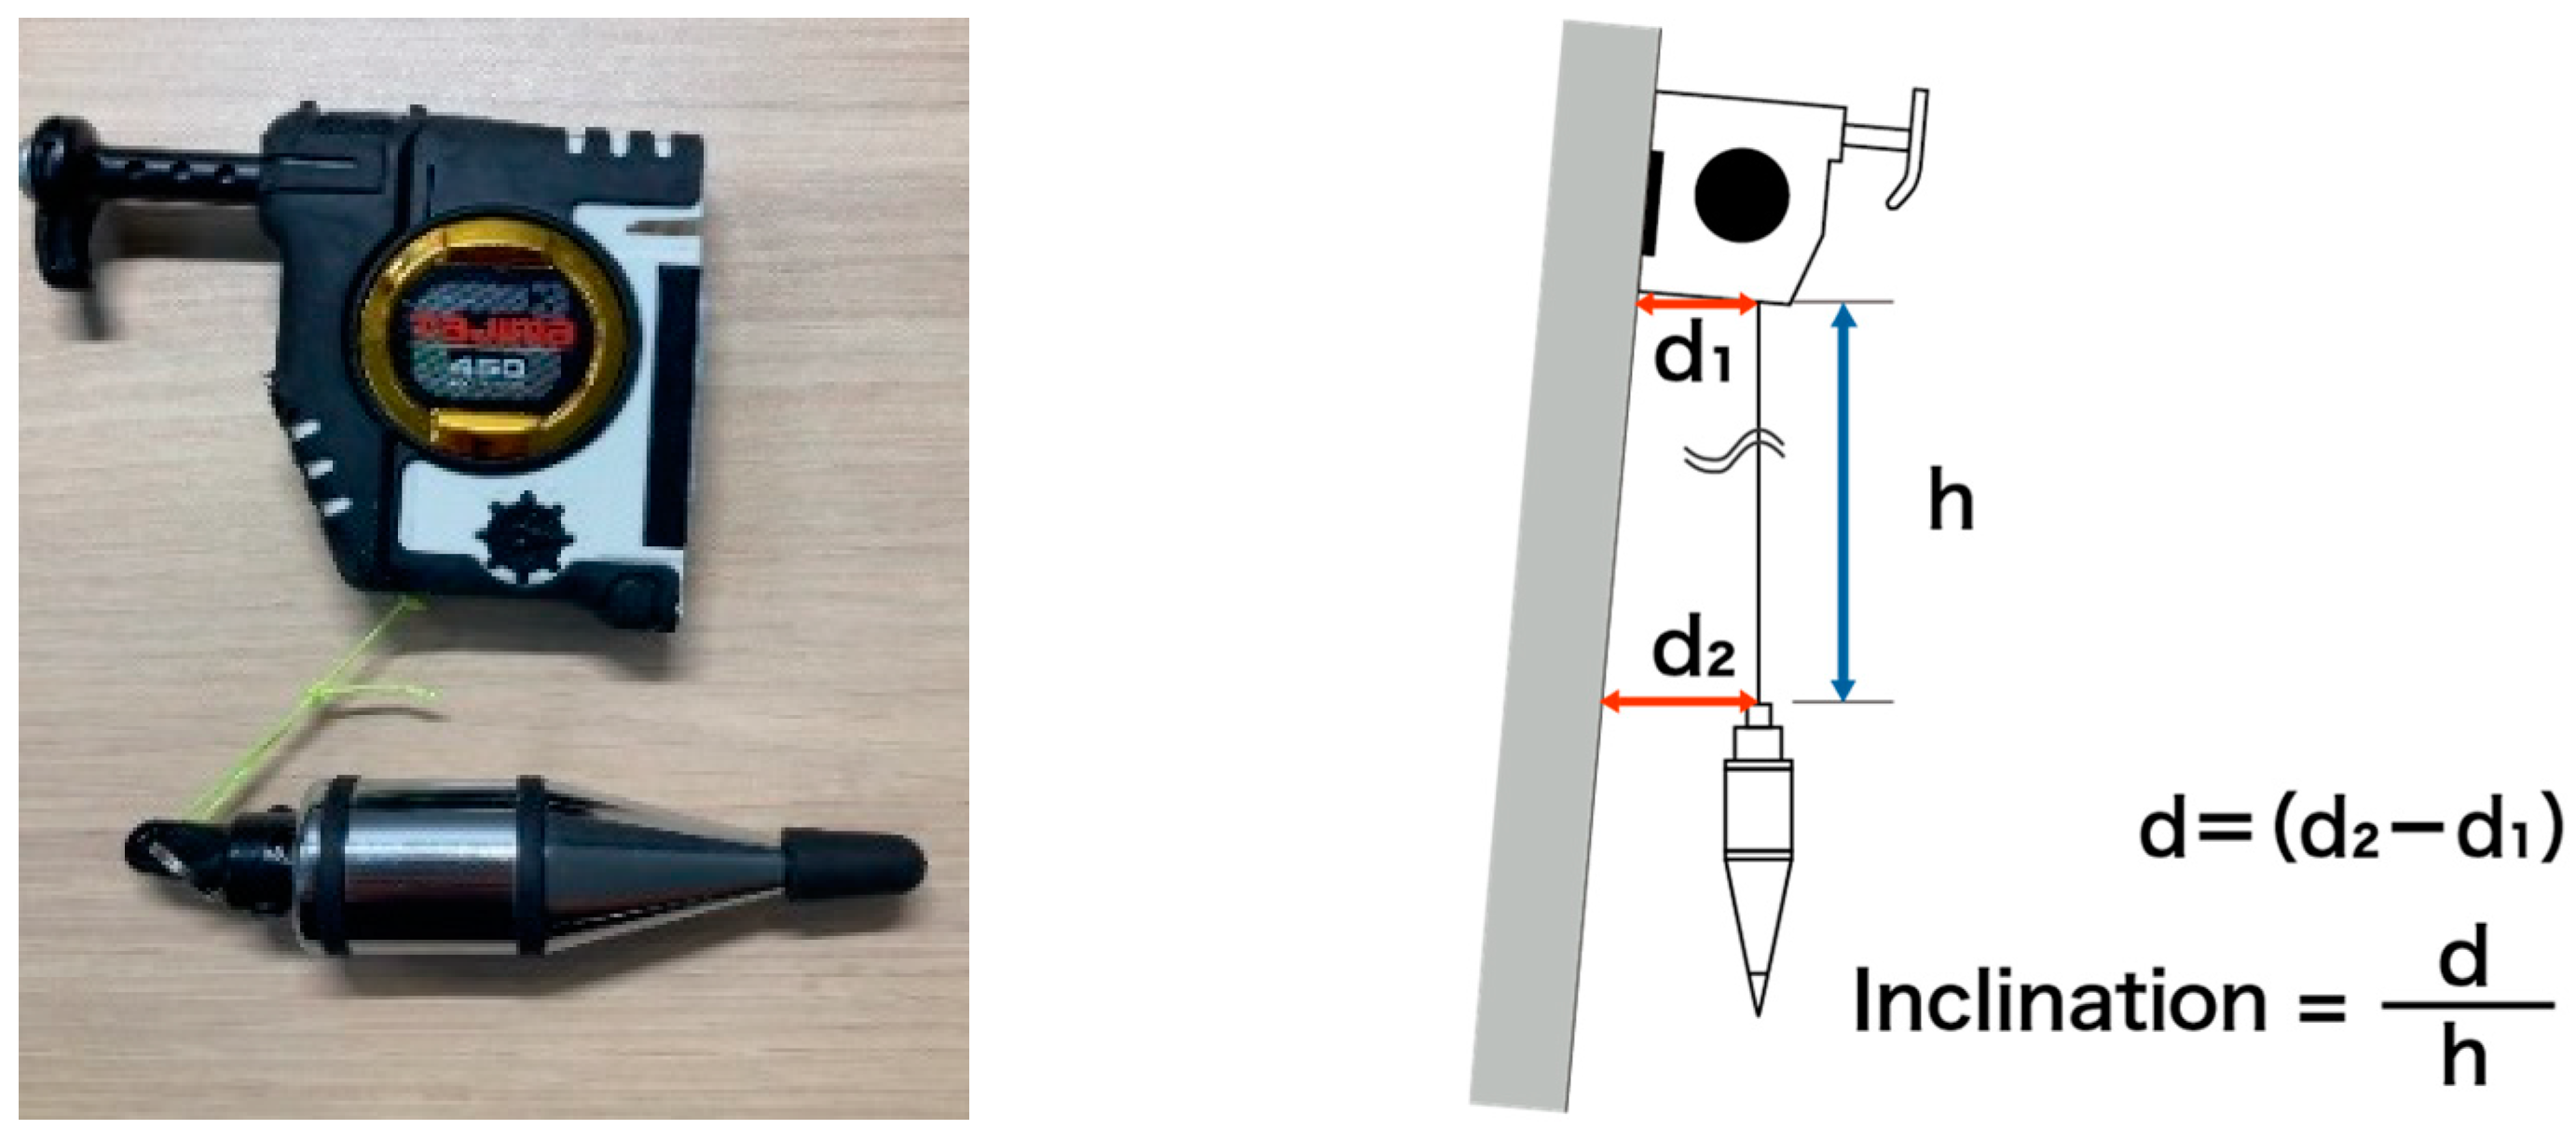
2.2. Accuracy Comparison Between Current and Proposed Methods

We conducted validation tests to verify whether the accuracy of tilt measurements obtained from the 3D scanning camera used in this study meets the requirements for emergency risk assessment. A comparison with current methods (plumb bob method) is conducted. Precisely, for the building listed in Figure 4 [15], wall inclinations are measured using both methods, confirming whether values obtained by photogrammetry fall within the variation range of the current process. This study assumed that the type of exterior cladding or surface finishing directly affects the accuracy of point cloud acquisition and the success of tilt detection. Therefore, in addition to standard residential buildings, a diverse set of structures with various surface finishes and materials was selected, including a storage building with uneven surfaces, a brick-faced building (apartment), a tearoom with exposed wooden elements (tea houses), and a gazebo with a known tilt. The plumb bob method involves direct measurements taken from two directions at each corner, as illustrated in Figure 5. Additionally, values obtained from a digital angle meter serve as reference values. The specifications of the 3D scanning camera used in this study are shown in Table 1. The Matterport Pro2 (hereafter referred to as P2) and Matterport Pro3 (P3) by Matterport Inc., as well as the LixelKity K1 (K1) by Xgrids Inc., were used in this study. Although the specifications, point cloud acquisition methods, and internal data processing vary among these cameras, they all provide coordinate and color information within the acquired point cloud data. Furthermore, this study assumed that the captured data would be reviewed during actual assessments. Therefore, cameras capable of providing flyover-style previews of the scanned data were selected. However, the proposed method can be applied to any camera that can generate point cloud data.

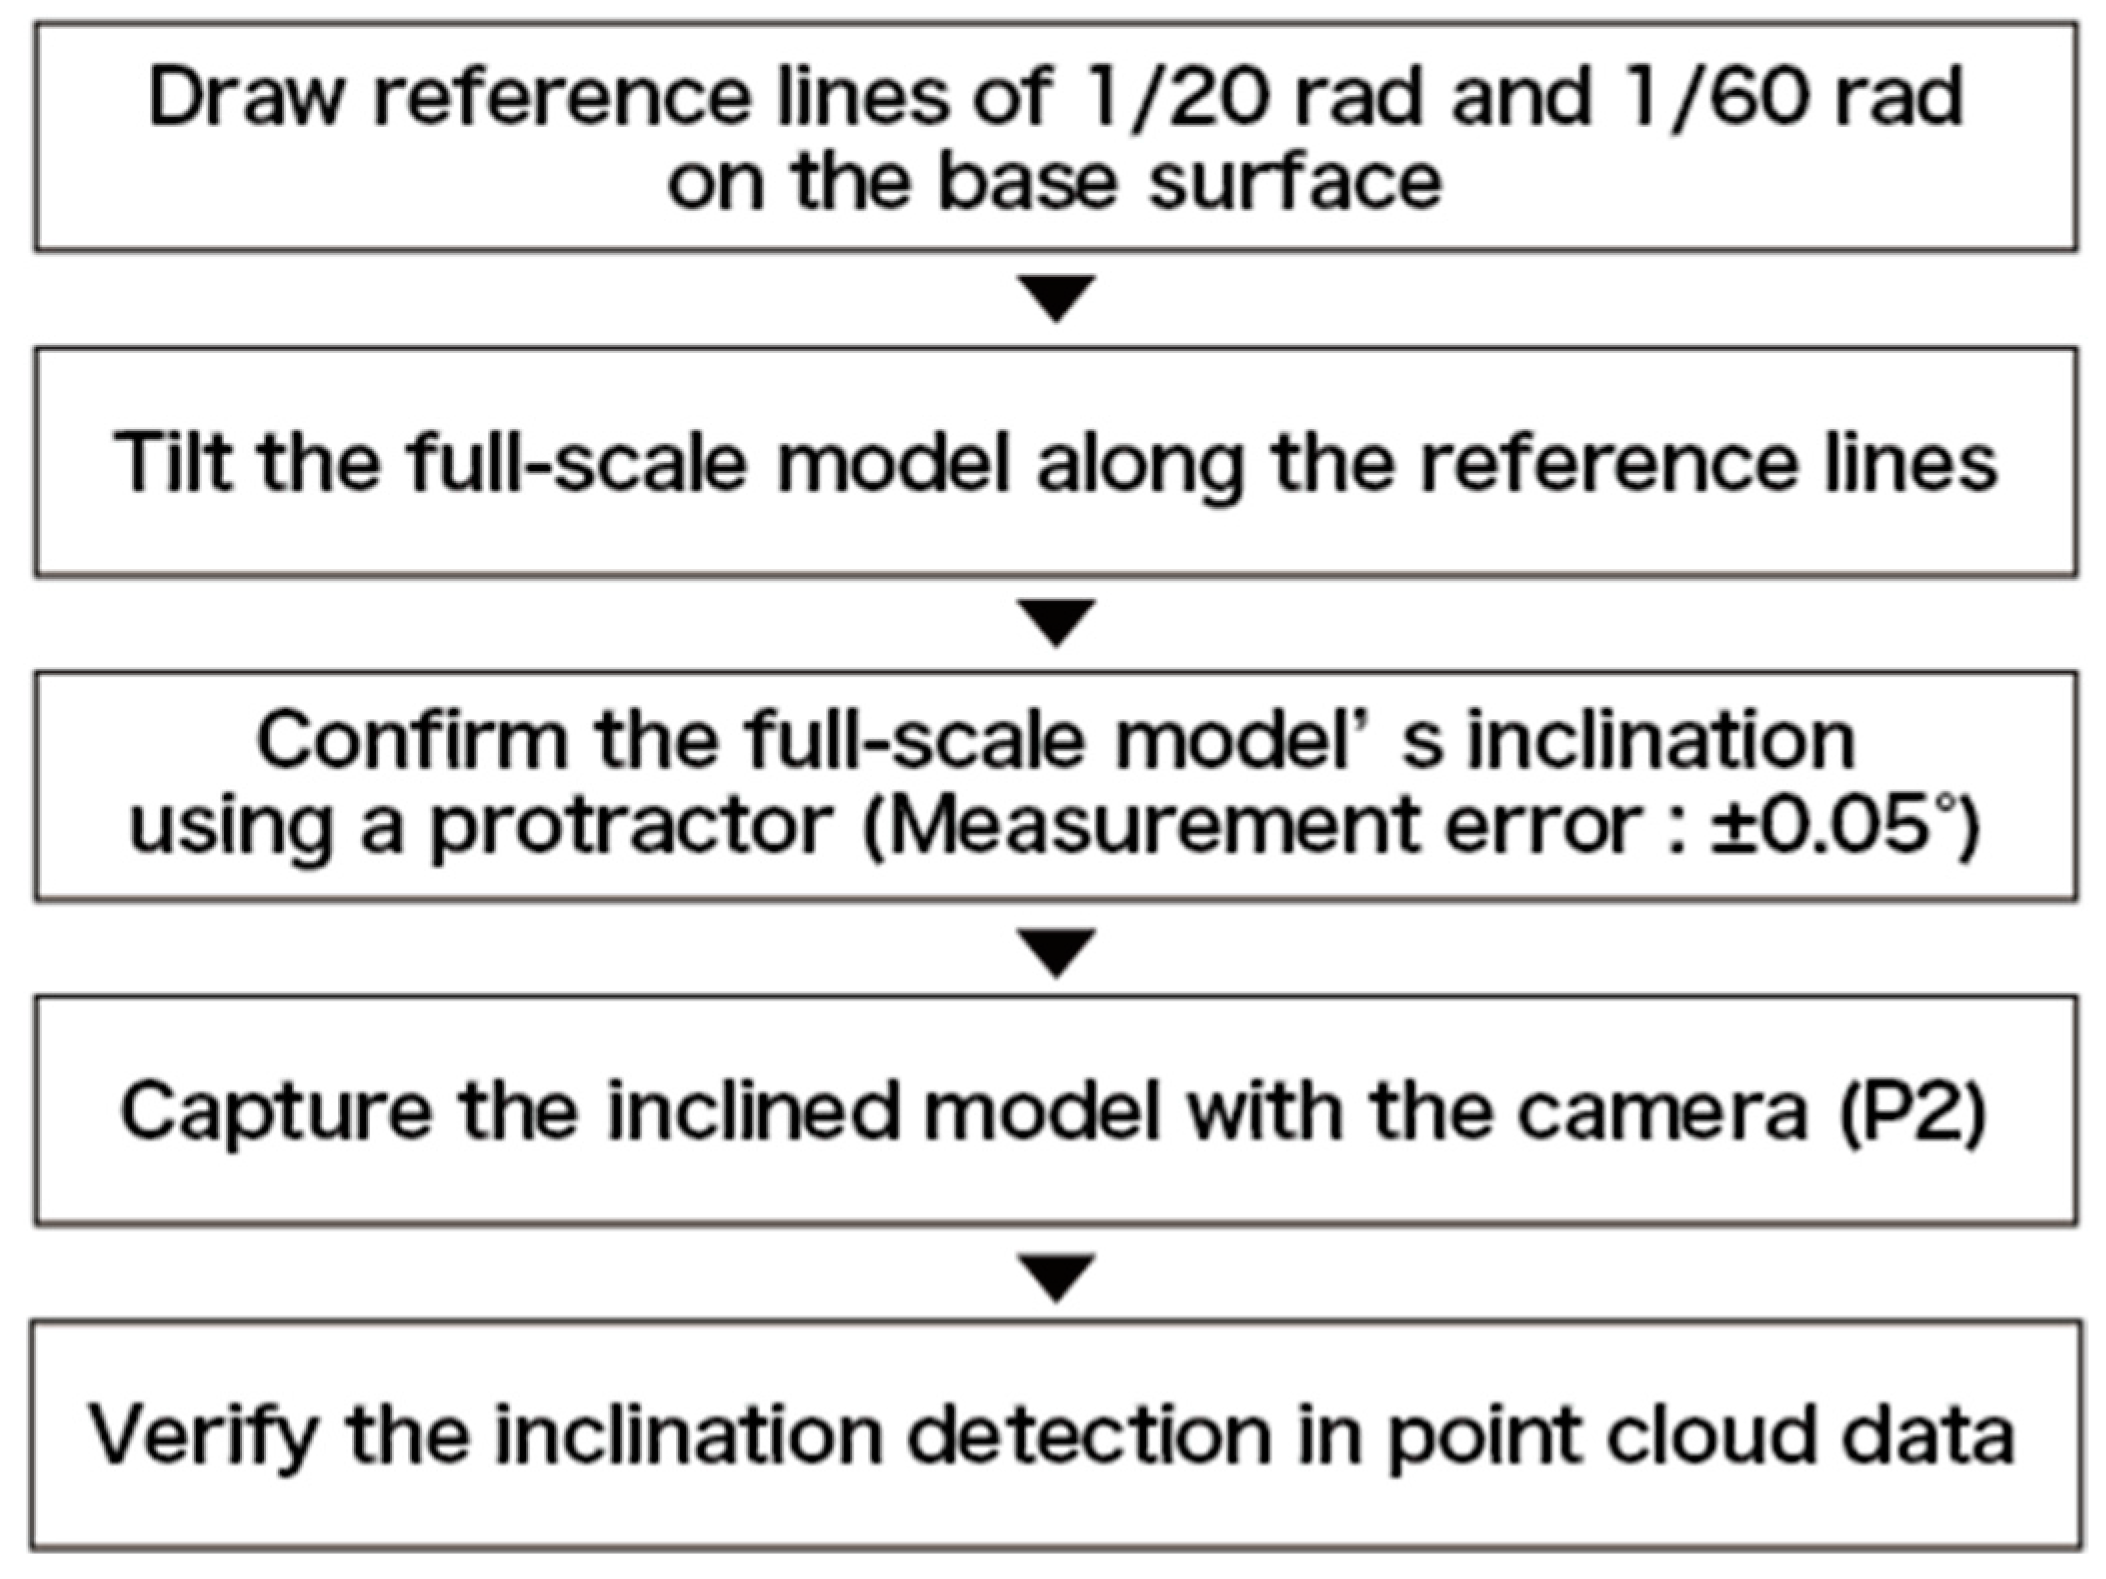
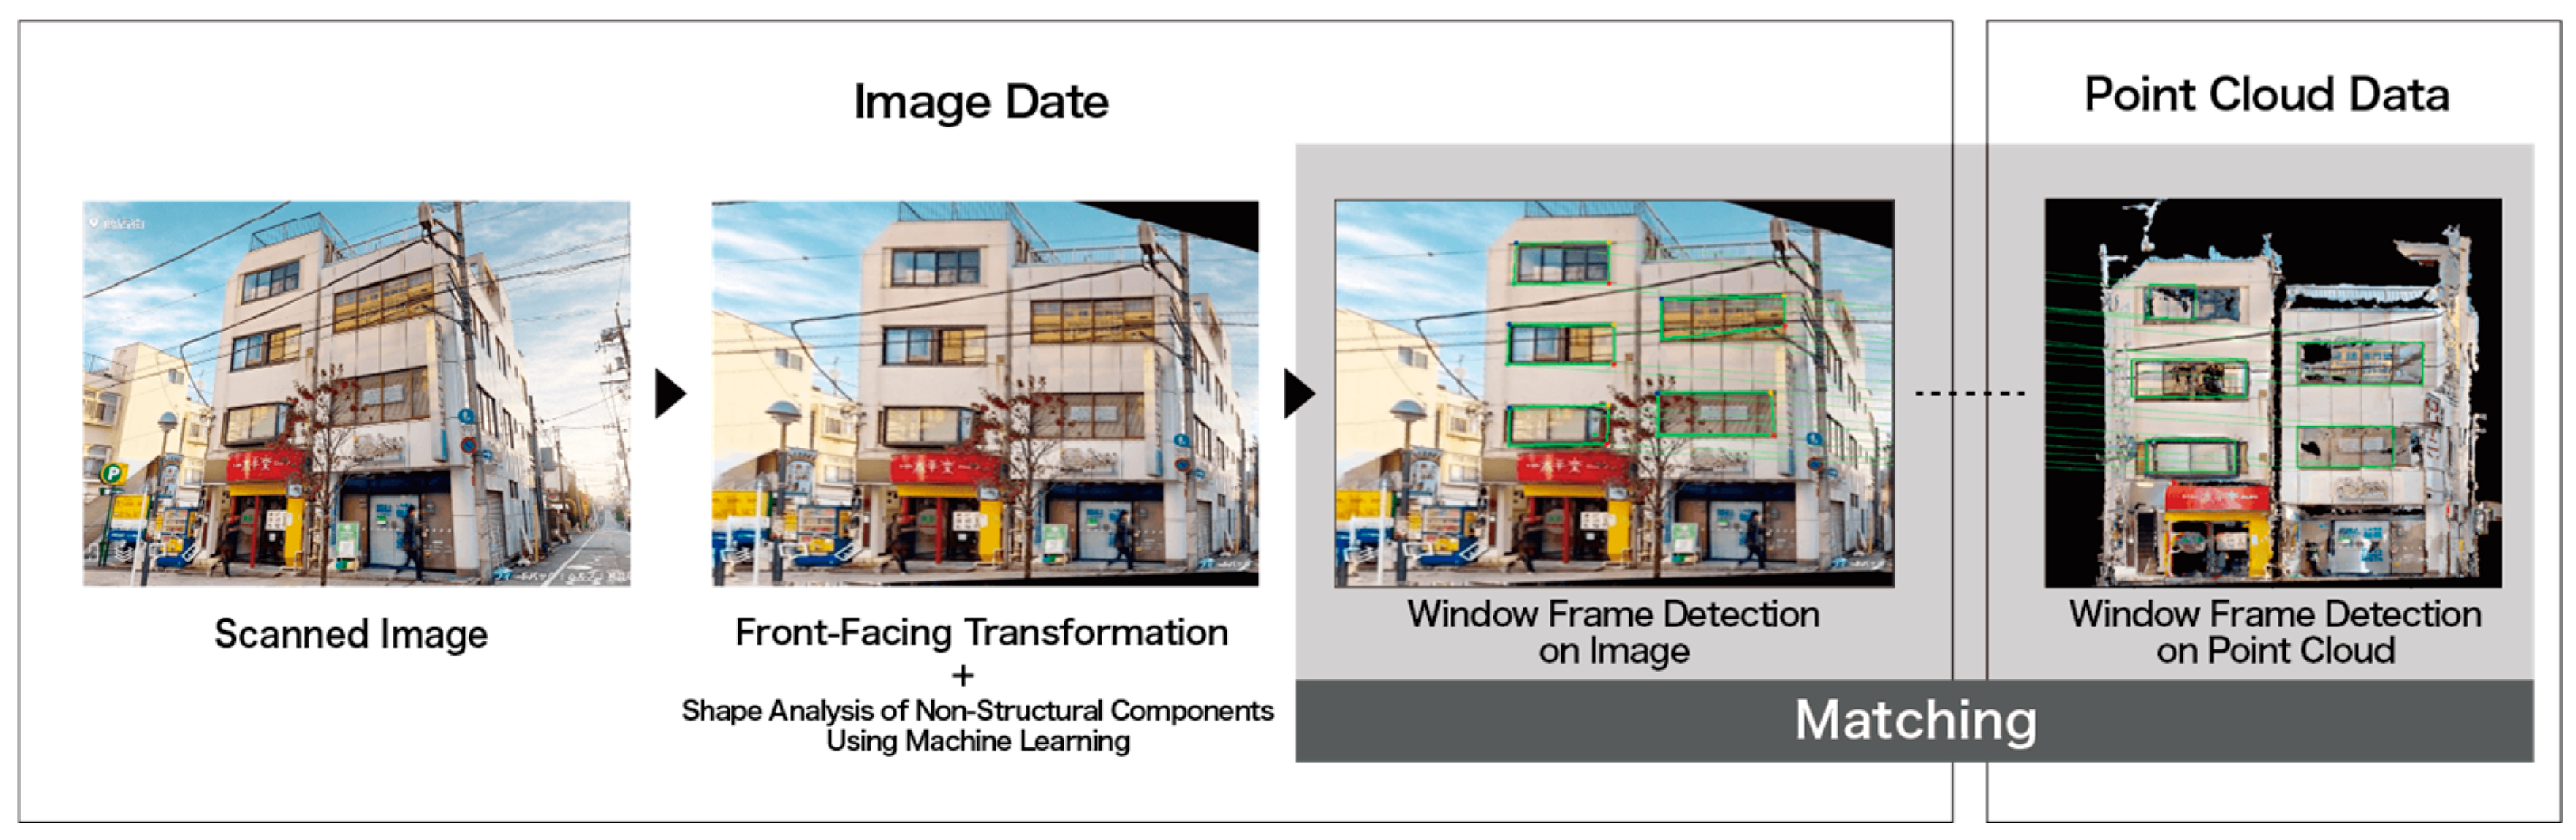
2.3. Detection of Secondary Components Considering Swinging Back

Considering the influence of “swinging back” and the deformation of secondary components in wooden houses, full-scale window frame models (hereafter referred to as actual-size models) were created. These models were subjected to in-plane tilting to verify whether the tilt could be detected using a 3D scanning camera. Actual-size models were constructed from wood based on standard Japanese window dimensions [16], measuring 1690 mm (width) × 1830 mm (height) for full-height windows and 780 mm × 970 mm for high-positioned windows. As illustrated in Figure 6, the deformation angle during tilting is defined as θ. Due to their minimal influence, construction errors related to window dimensions [17] are considered negligible. The investigation procedure is presented in Figure 7.
Furthermore, to supplement potential limitations in deformation patterns of actual-size models, several 3D models depicting structural deformation and detachment of secondary components were created, as shown in Figure 8. Based on the standard three-shaku module commonly used in wooden houses, these models were designed as typical two-story structures. Secondary components, such as window frames, were assumed to undergo in-plane deformation similar to the structure during an earthquake while being less affected by the swinging-back phenomenon. This study hypothesized that these components may exhibit detachment or displacement in the out-of-plane direction and primarily follow the structural elements’ movement in the in-plane direction. Accordingly, deformations were introduced into the models, with in-plane inclinations of the window frames ranging from 0° (initial state) up to the inclination thresholds defined in the Japanese Emergency Risk Assessment Guidelines (1/60 rad for caution and up to 1/20 rad for danger levels).
The deformation angles applied to each model were based on the Emergency Risk Assessment standard criteria [11] of 1/60 rad (approximately 0.954°) and 1/20 rad (approximately 2.864°), and these values were used as reference angles.

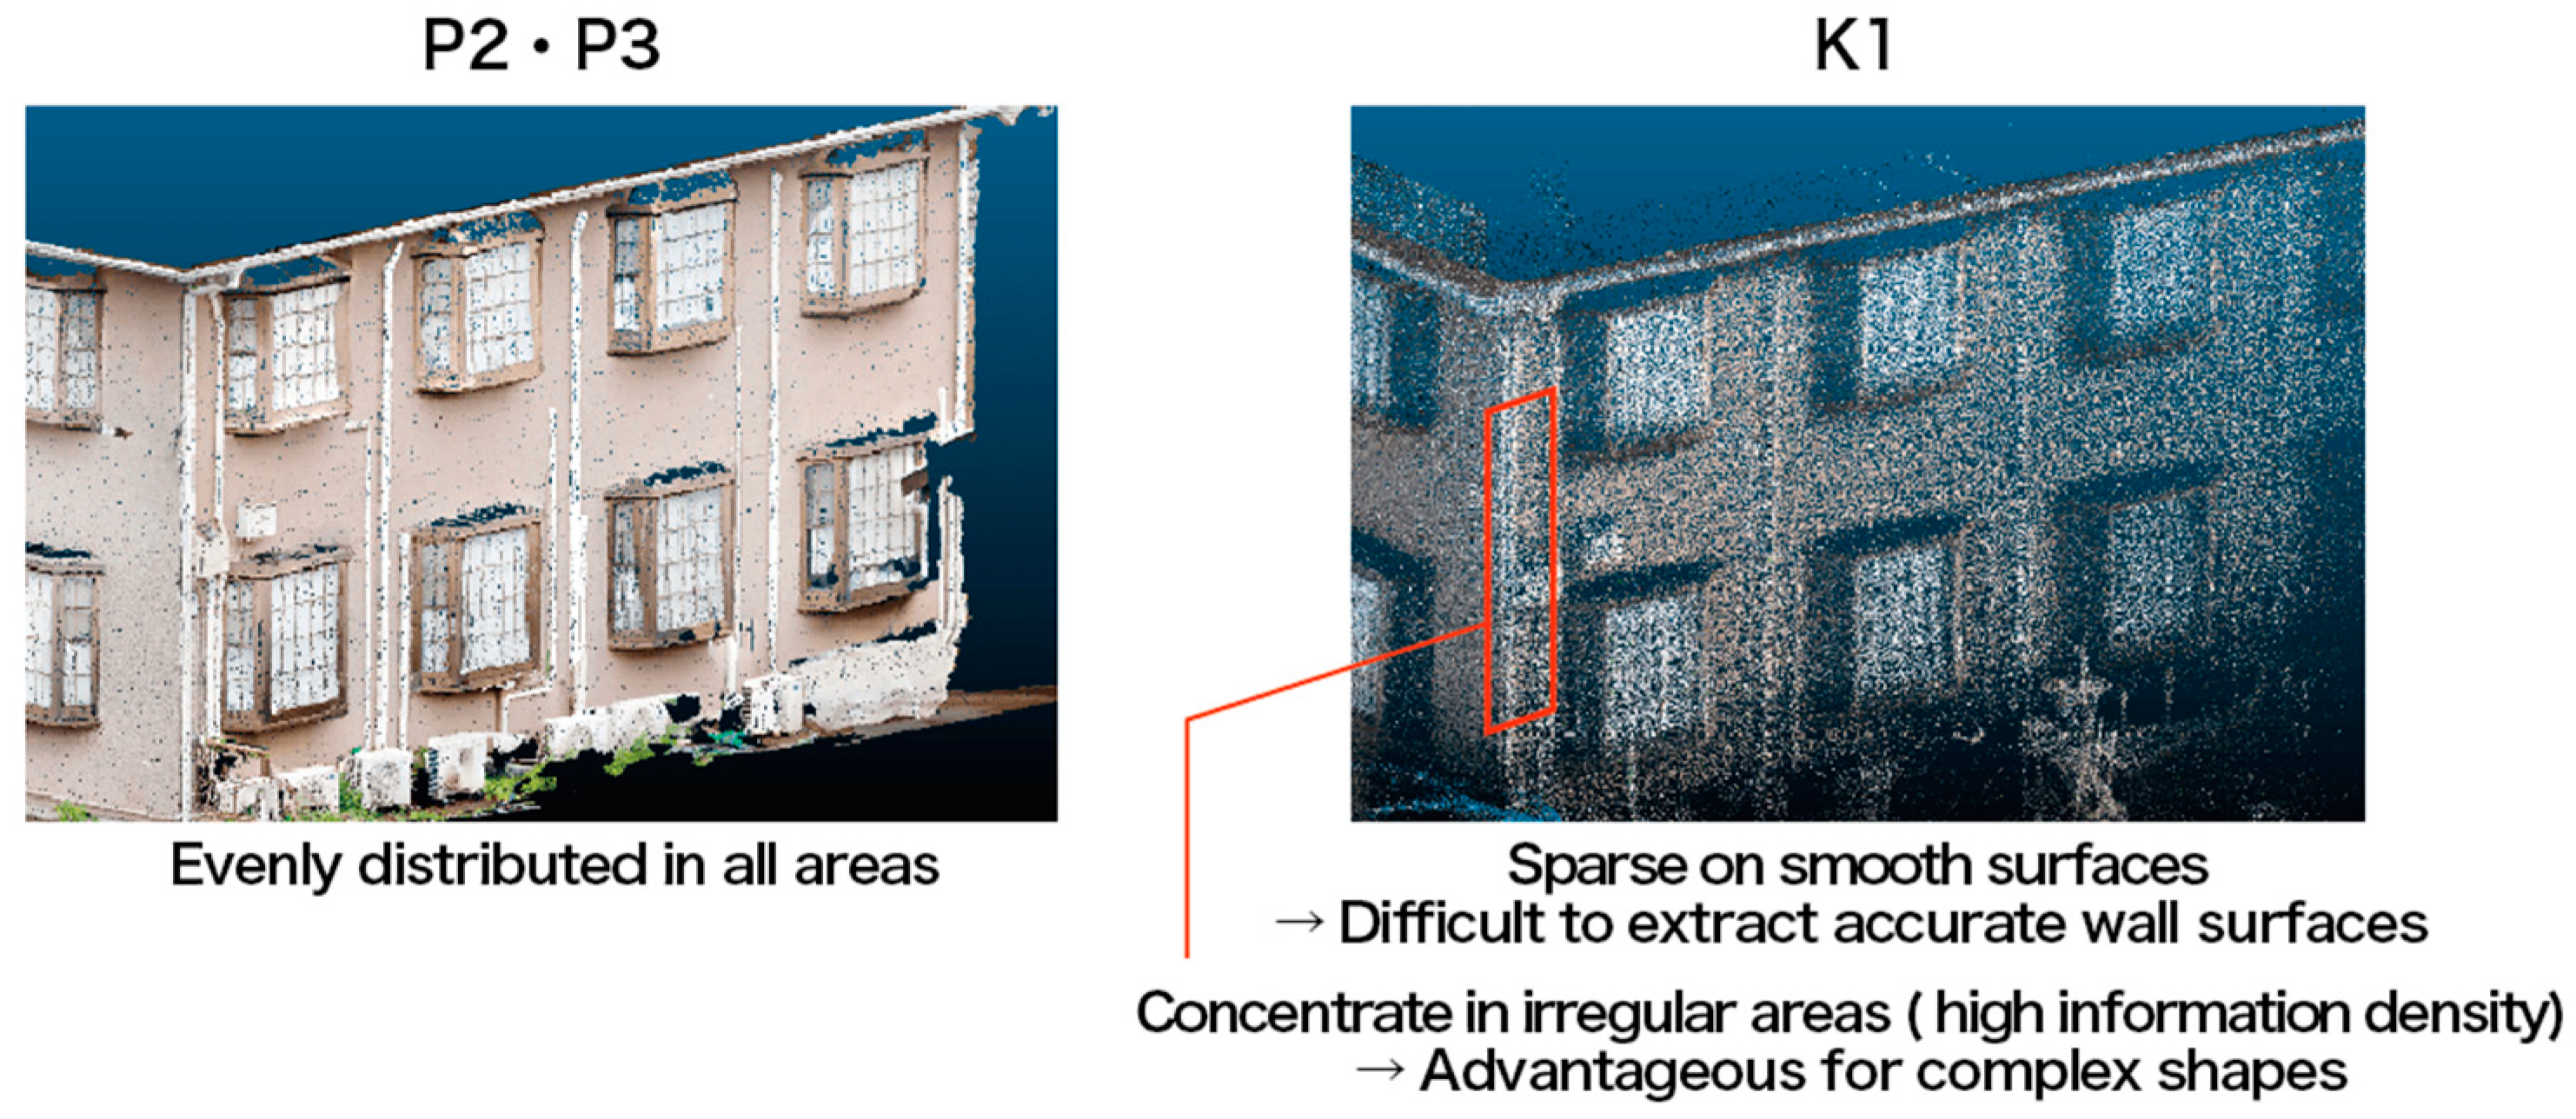
2.4. Simultaneous Data Acquisition of Multiple Buildings in Shopping Streets

The efficiency and applicability of the proposed method in densely built residential areas were assessed by examining a shopping street, which is used as a substitute environment for such areas. Since assessments are performed on an individual housing basis, it is crucial to recognize and extract each building separately as a distinct assessment target. Therefore, multiple adjacent commercial buildings were captured simultaneously, and it was verified whether the obtained point cloud data could be segmented into individual buildings. For this segmentation process, the RANSAC (Random Sample Consensus) algorithm [18] and the DBSCAN (Density-Based Spatial Clustering with Noise) clustering method were applied. RANSAC is a robust technique that randomly selects point sets from noisy data to generate provisional planar models, iteratively identifying the model that includes the most significant number of inliers, thereby enabling the extraction of geometric shapes and structural planes resistant to noise. In this study, RANSAC was applied to remove unnecessary floor surfaces and extract wall surfaces for each building. DBSCAN is a clustering method based on the density of point clouds, classifying closely packed points into the same cluster while excluding sparsely distributed points as noise. This allows efficient separation of point clouds belonging to adjacent buildings and enables the accurate extraction of each as an independent assessment target [15].
Furthermore, to verify whether the wall surfaces and secondary components necessary for assessment could be obtained from the combined point cloud data. The test utilized 3D scanning cameras, specifically the P3 and K1 models.
With the P3 camera, scan points were set at several-meter intervals, and scans were conducted at each point. For the K1 camera, scans were continuously performed at walking speed. The feasibility of capturing necessary data for emergency risk assessments from these scans was evaluated.

3. Results and Discussion

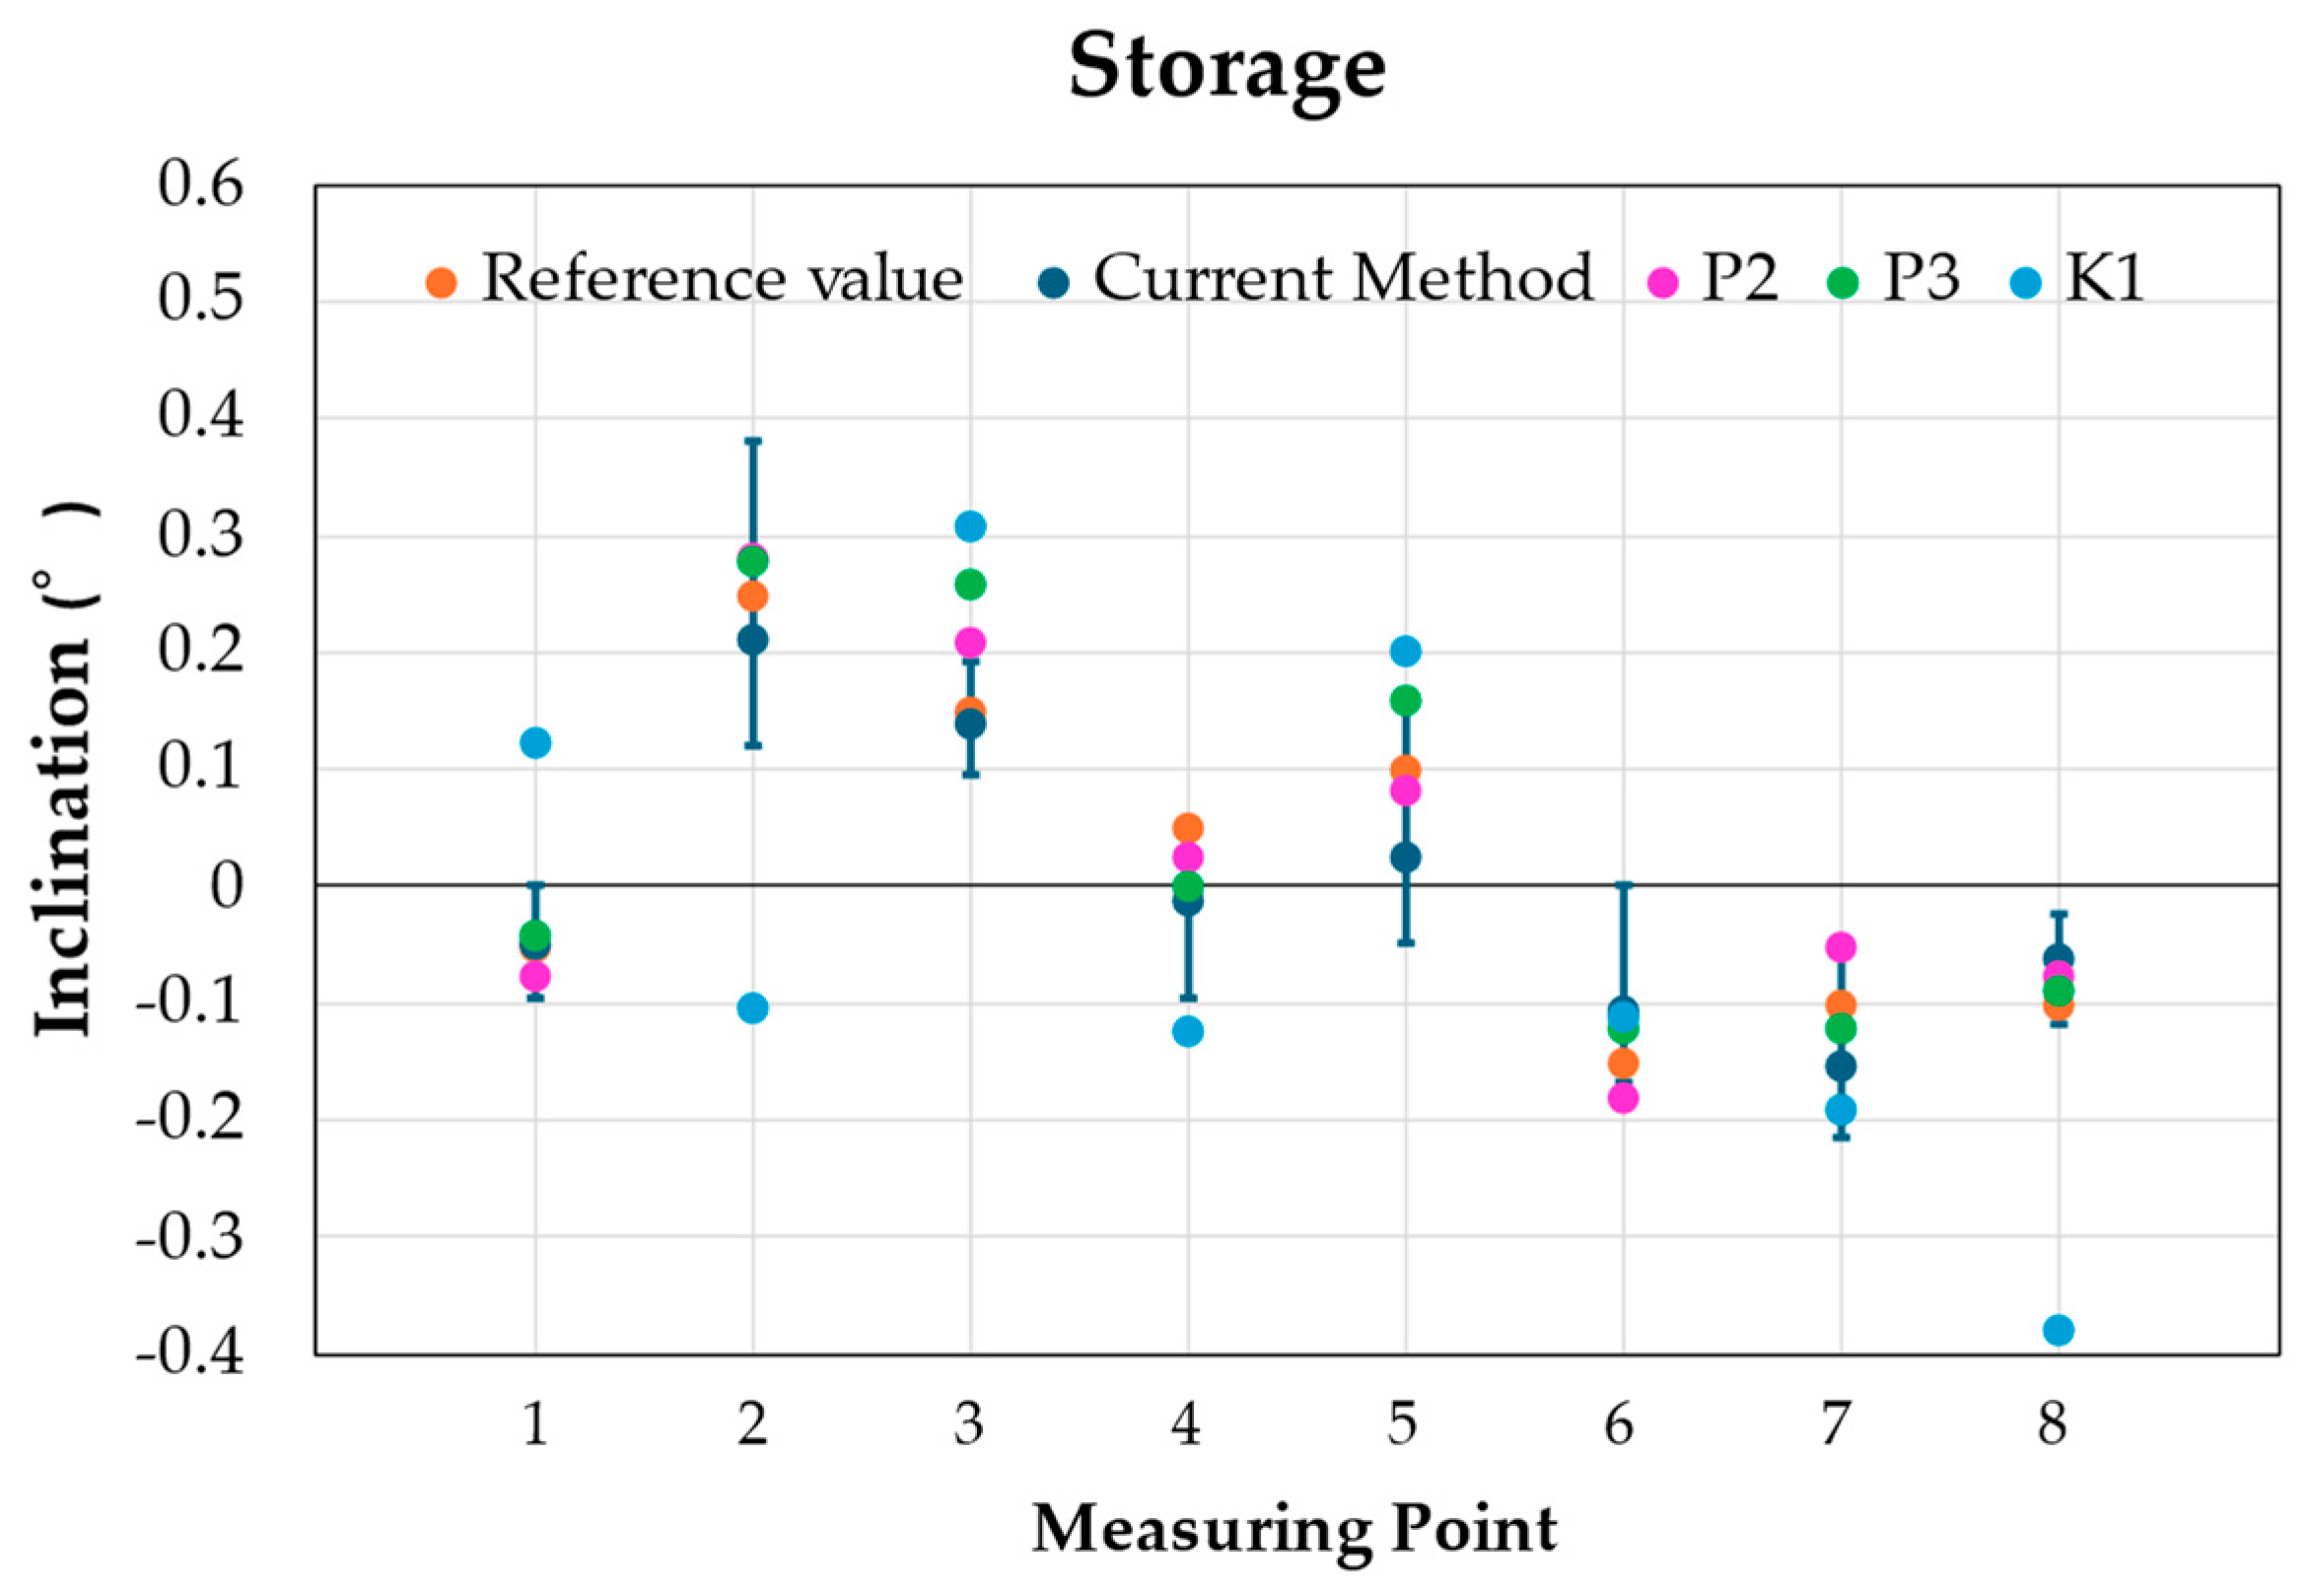
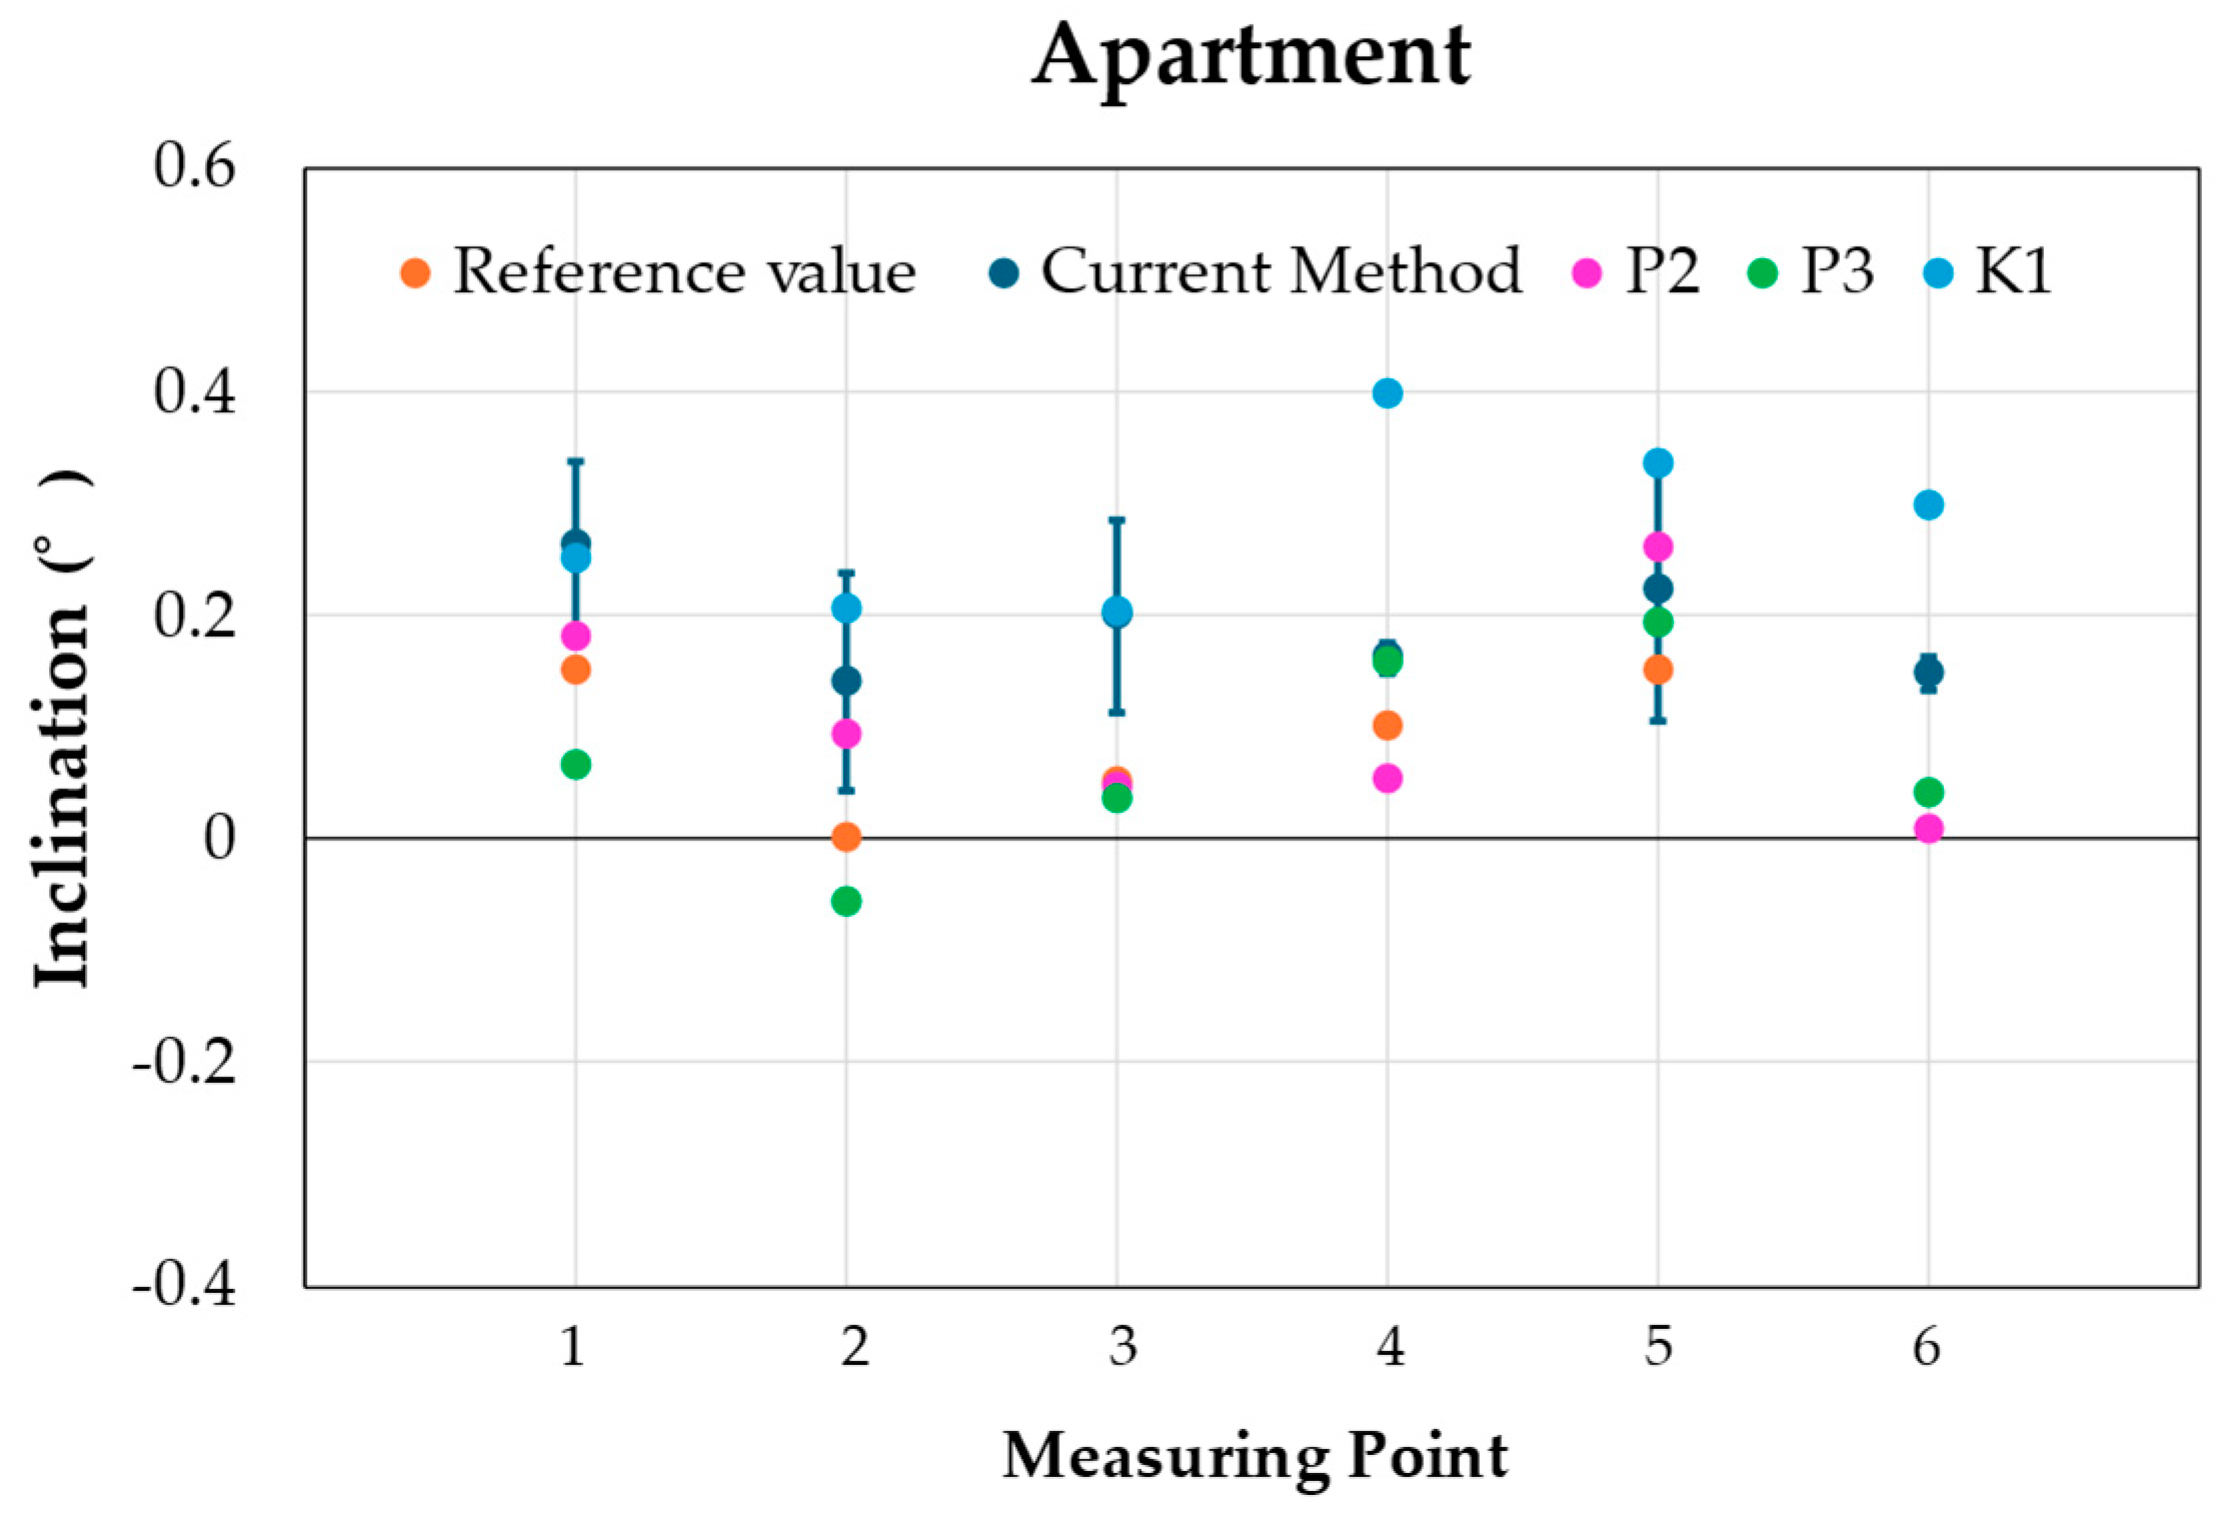
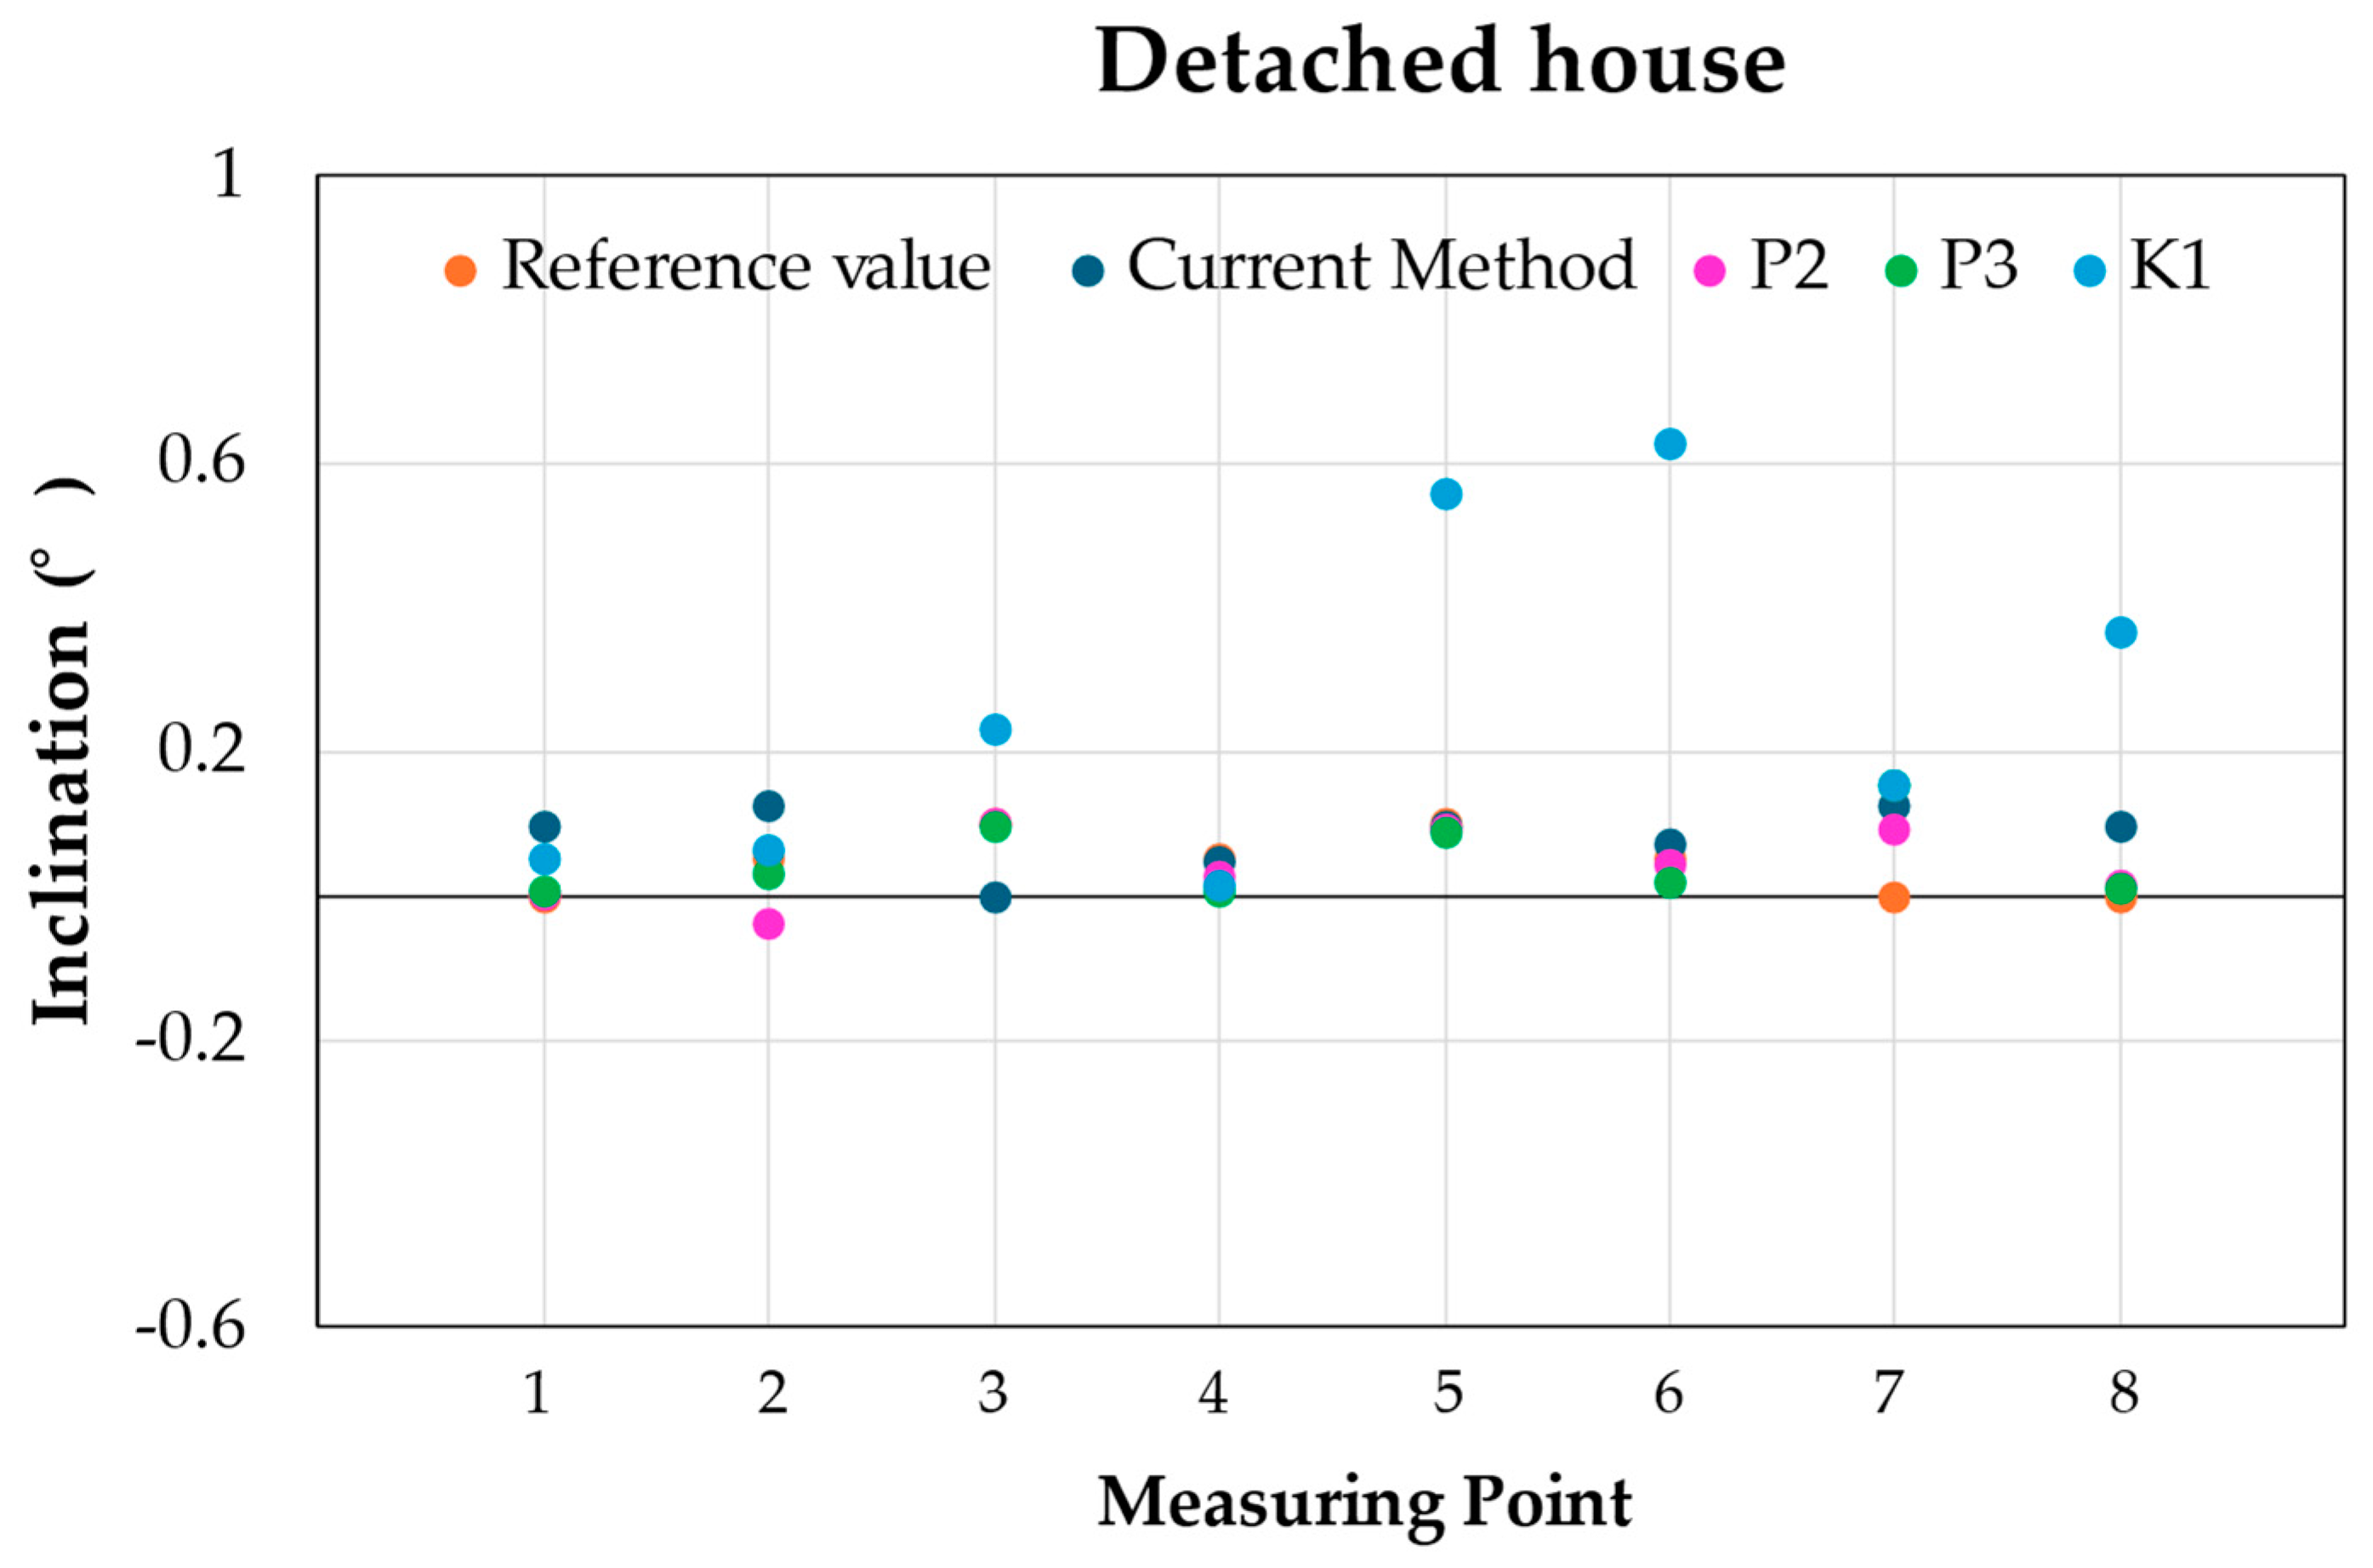
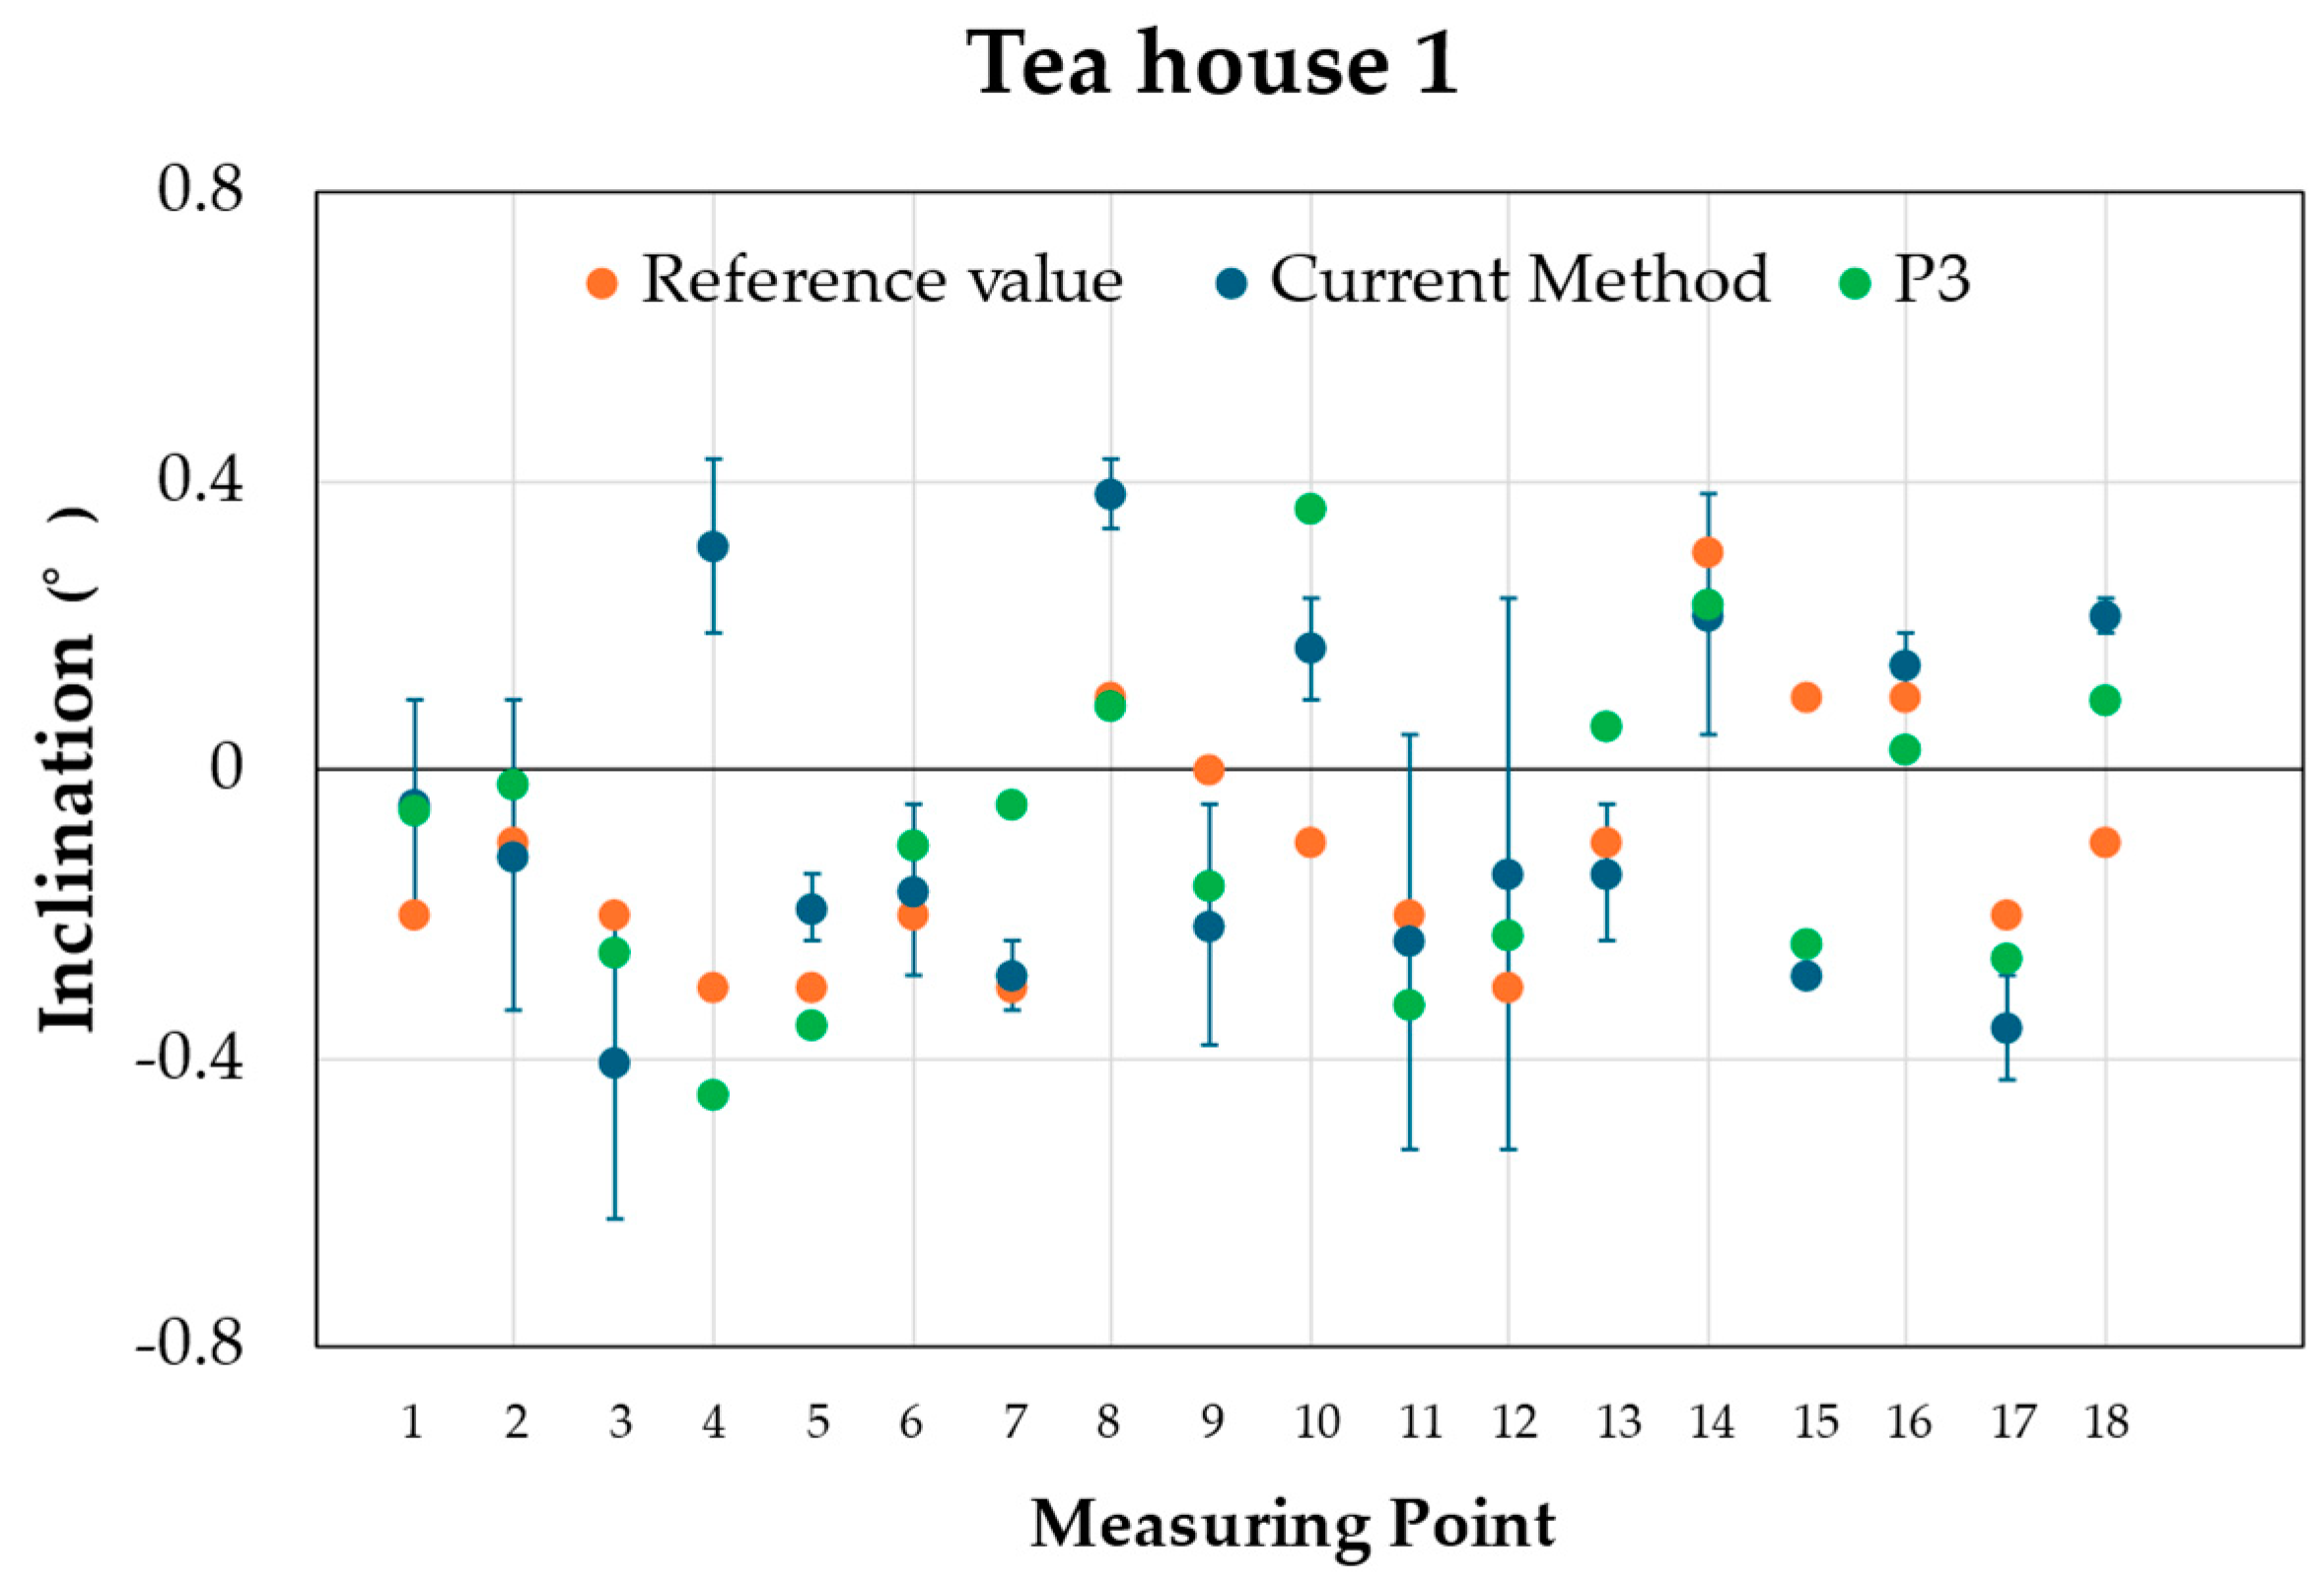
3.1. Accuracy Comparison Between Current and Proposed Methods

This chapter will discuss the comparison results between the plumb bob measurements of each building and the proposed method in this study. The results from photogrammetry were compared against the variation range obtained from multiple plumb bob measurements as a baseline. Table 2 and Figure 9 show the storage results compared with plumb bob and cameras P2, P3, and K1. Table 3 and Figure 10 show the apartment results compared with plumb bob and cameras P2, P3, and K1. Table 4 and Figure 11 show the measurement results of the detached house. Table 5 and Figure 12 show the measurement results of “tea house 1” compared with plumb bob and Camera P3. Table 6 and Figure 13 show the “tea house 2 “measurement results compared with plumb bob and camera P3. Table 7 and Figure 14 show the gazebo results compared with plumb bob and camera P3. Measurement results obtained by plumb bob and cameras were compared with reference values measured using a digital angle meter.
P2 and P3 showed measurement values that were generally consistent with those obtained using a plumb line and fell within the range of variation. As shown in Table 7 and Figure 14, specific measurement points on the gazebo significantly differed from those of other structures. This discrepancy is believed to be due to the measurement points on wooden columns and walls, which had uneven surfaces. While there were some cases where the photogrammetric values fell outside the variation range of the conventional method, all values remained well below the emergency risk assessment criteria (e.g., 1/60 rad ≈ 0.9545°), indicating that the measurement errors were within practically acceptable limits. For instance, in the case of the storage building, the maximum error in the proposed method was approximately ±0.3°, which is considerably smaller than the threshold values, such as 1/60 rad or 1/20 rad. Therefore, it is considered that these errors have limited impact on the final judgment. These results confirm that the proposed method has a practical level of accuracy. The measurement values for K1 showed more significant variation compared to the reference values and those of P1 and P2, within a range smaller than 1/60 radians. As illustrated in Figure 15, this is likely because the point cloud processing of the K1 camera is adjusted according to the amount of surface detail, such as irregularities, which resulted in lower point cloud density in vast, smooth areas with minimal surface irregularities. On the other hand, K1 exhibited a higher point cloud density on highly uneven surfaces, suggesting that it is advantageous for capturing complex geometries.
Based on the above, it was confirmed that the proposed method is influenced by camera performance but has sufficient measurement accuracy.

3.2. Detection of Secondary Members Considering Rebound

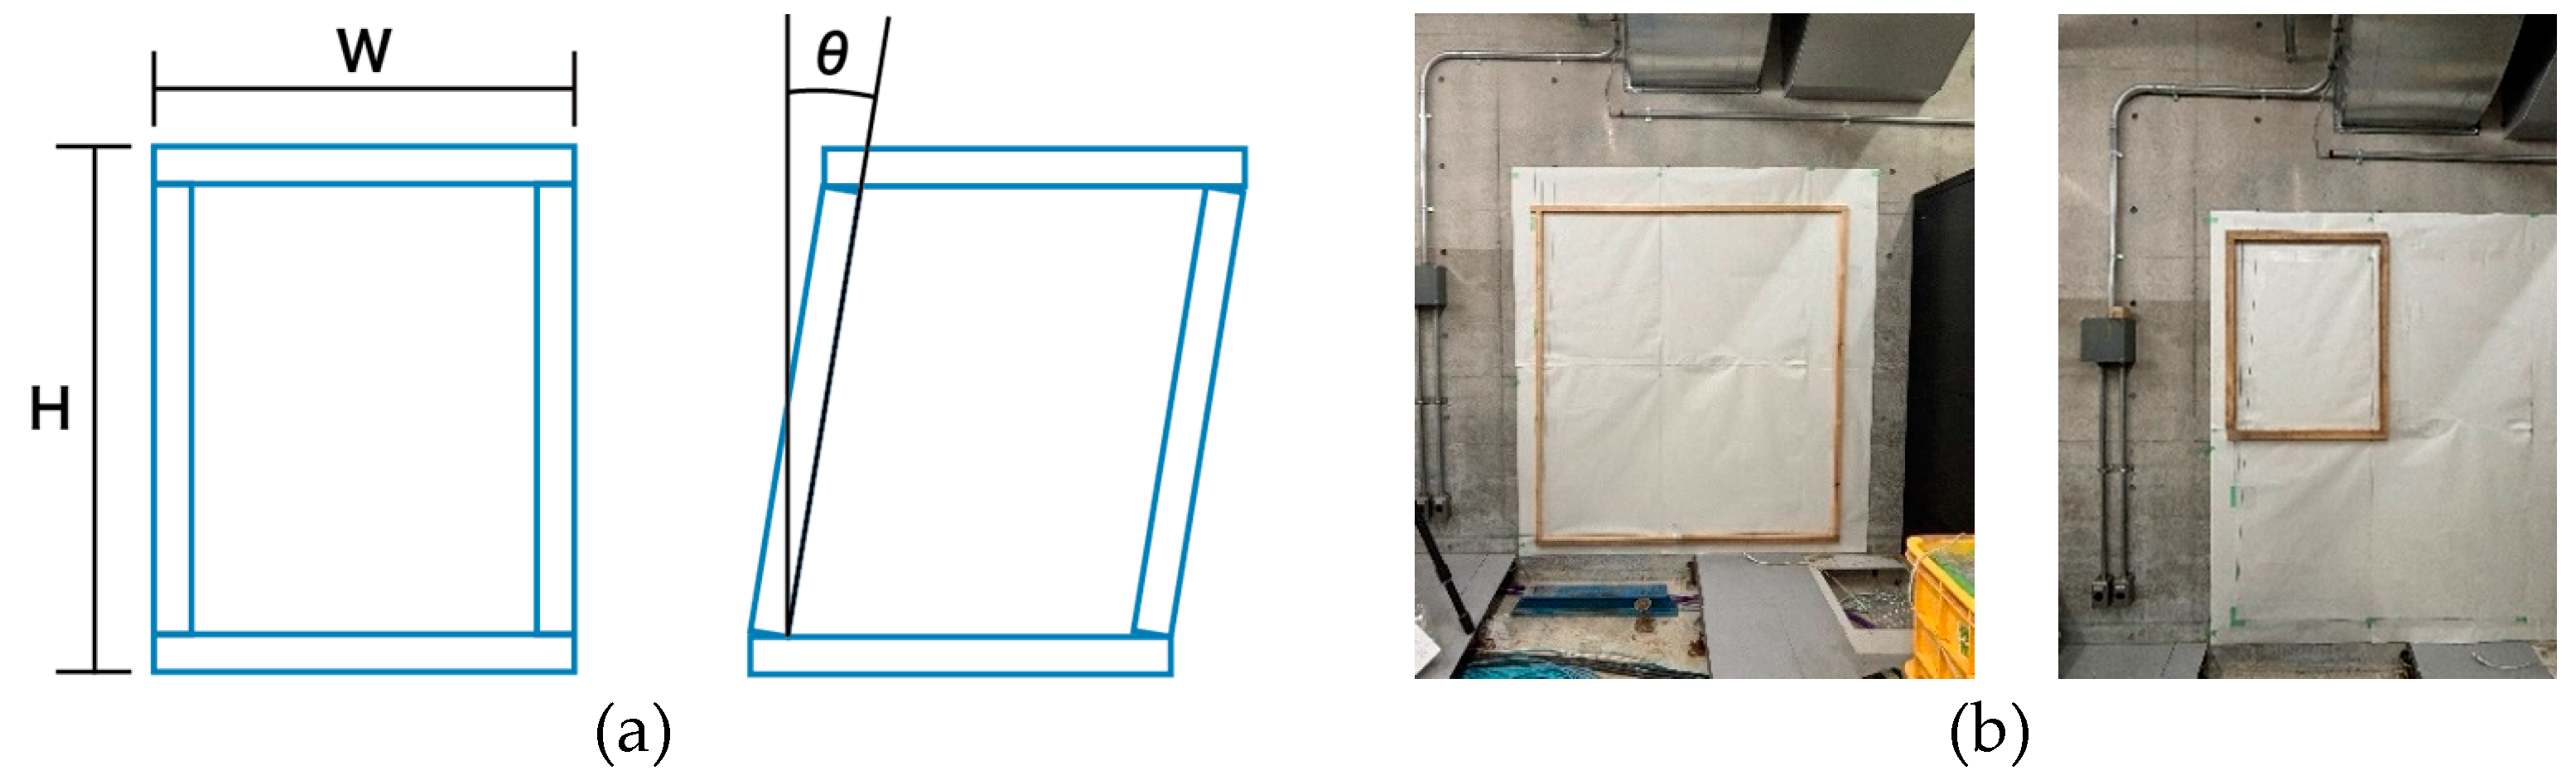
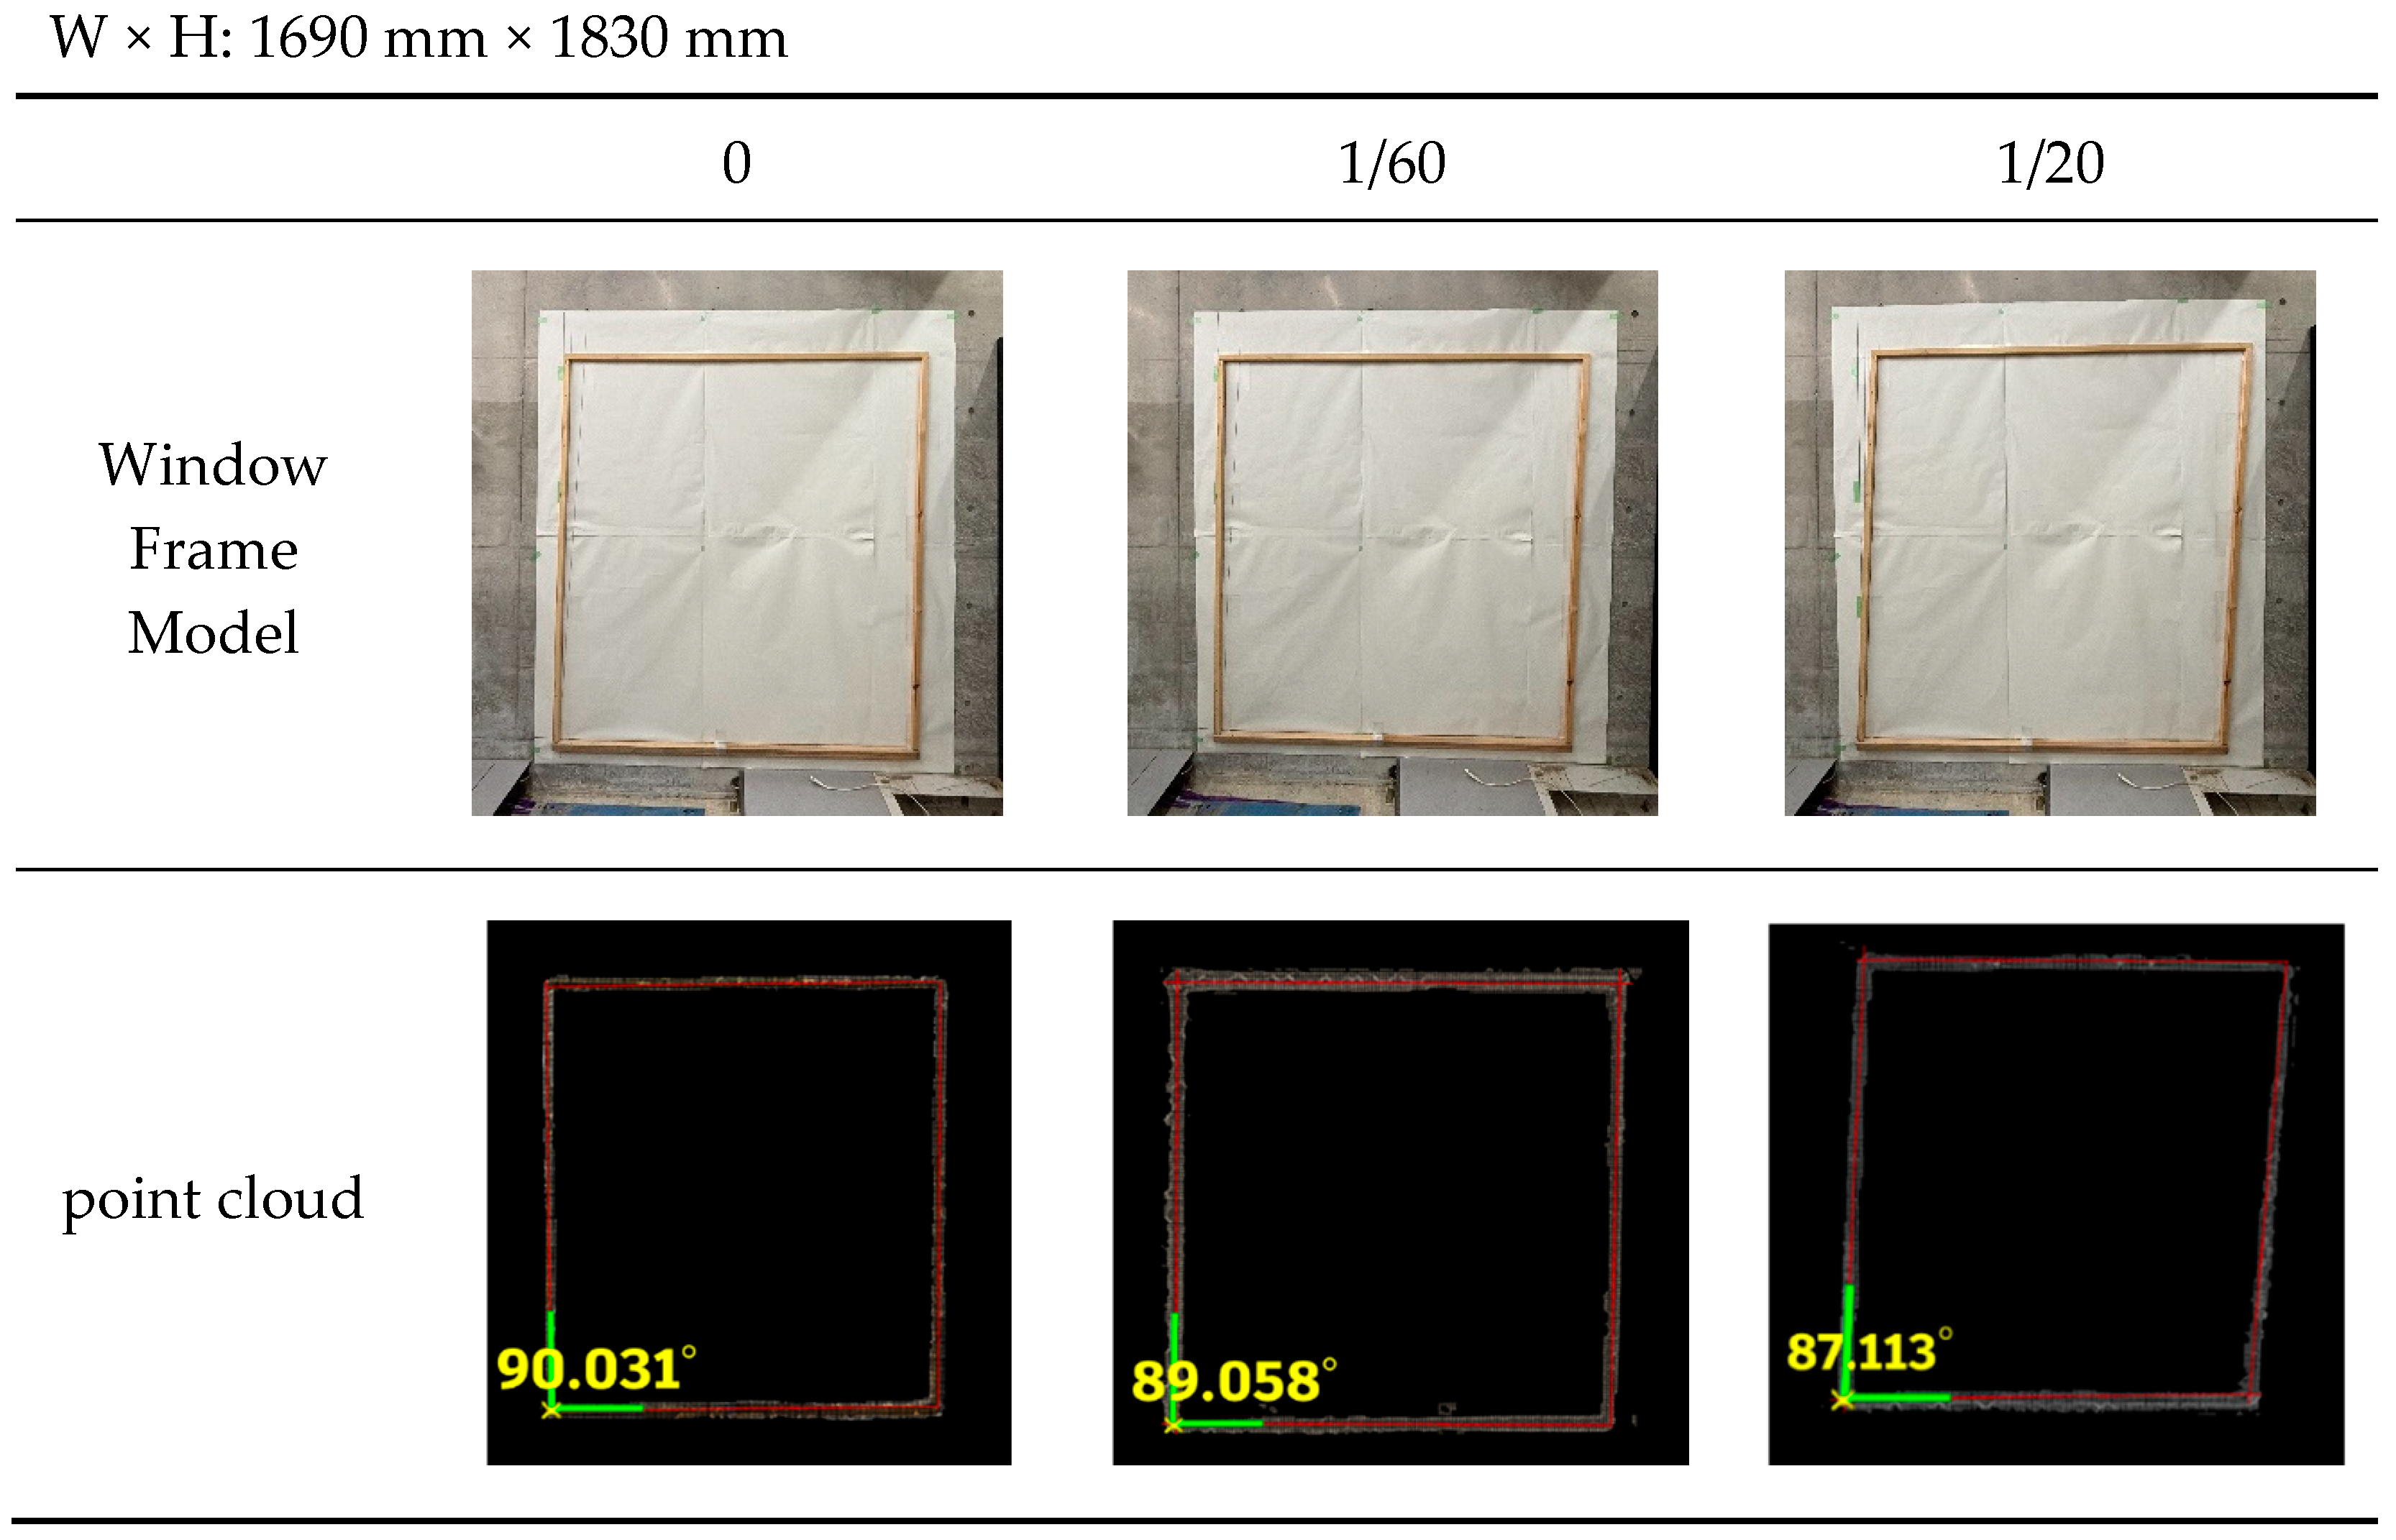
3.2.1. Full-Scale Window Frame Model

Figure 16 and Figure 17 show each model pattern and its measurement results. Table 8 presents the average error rate between the measurement results and the reference values.
The in-plane deformation of the sash section was accurately captured, confirming that model extraction is feasible. Additionally, the error rate was less than 3%, which is sufficiently small. Even when considering the measurement error of the protractor, it was demonstrated that tilt detection can be performed with adequate precision. Furthermore, as a secondary outcome, it was found that even slight out-of-plane tilts of the model can be numerically detected.

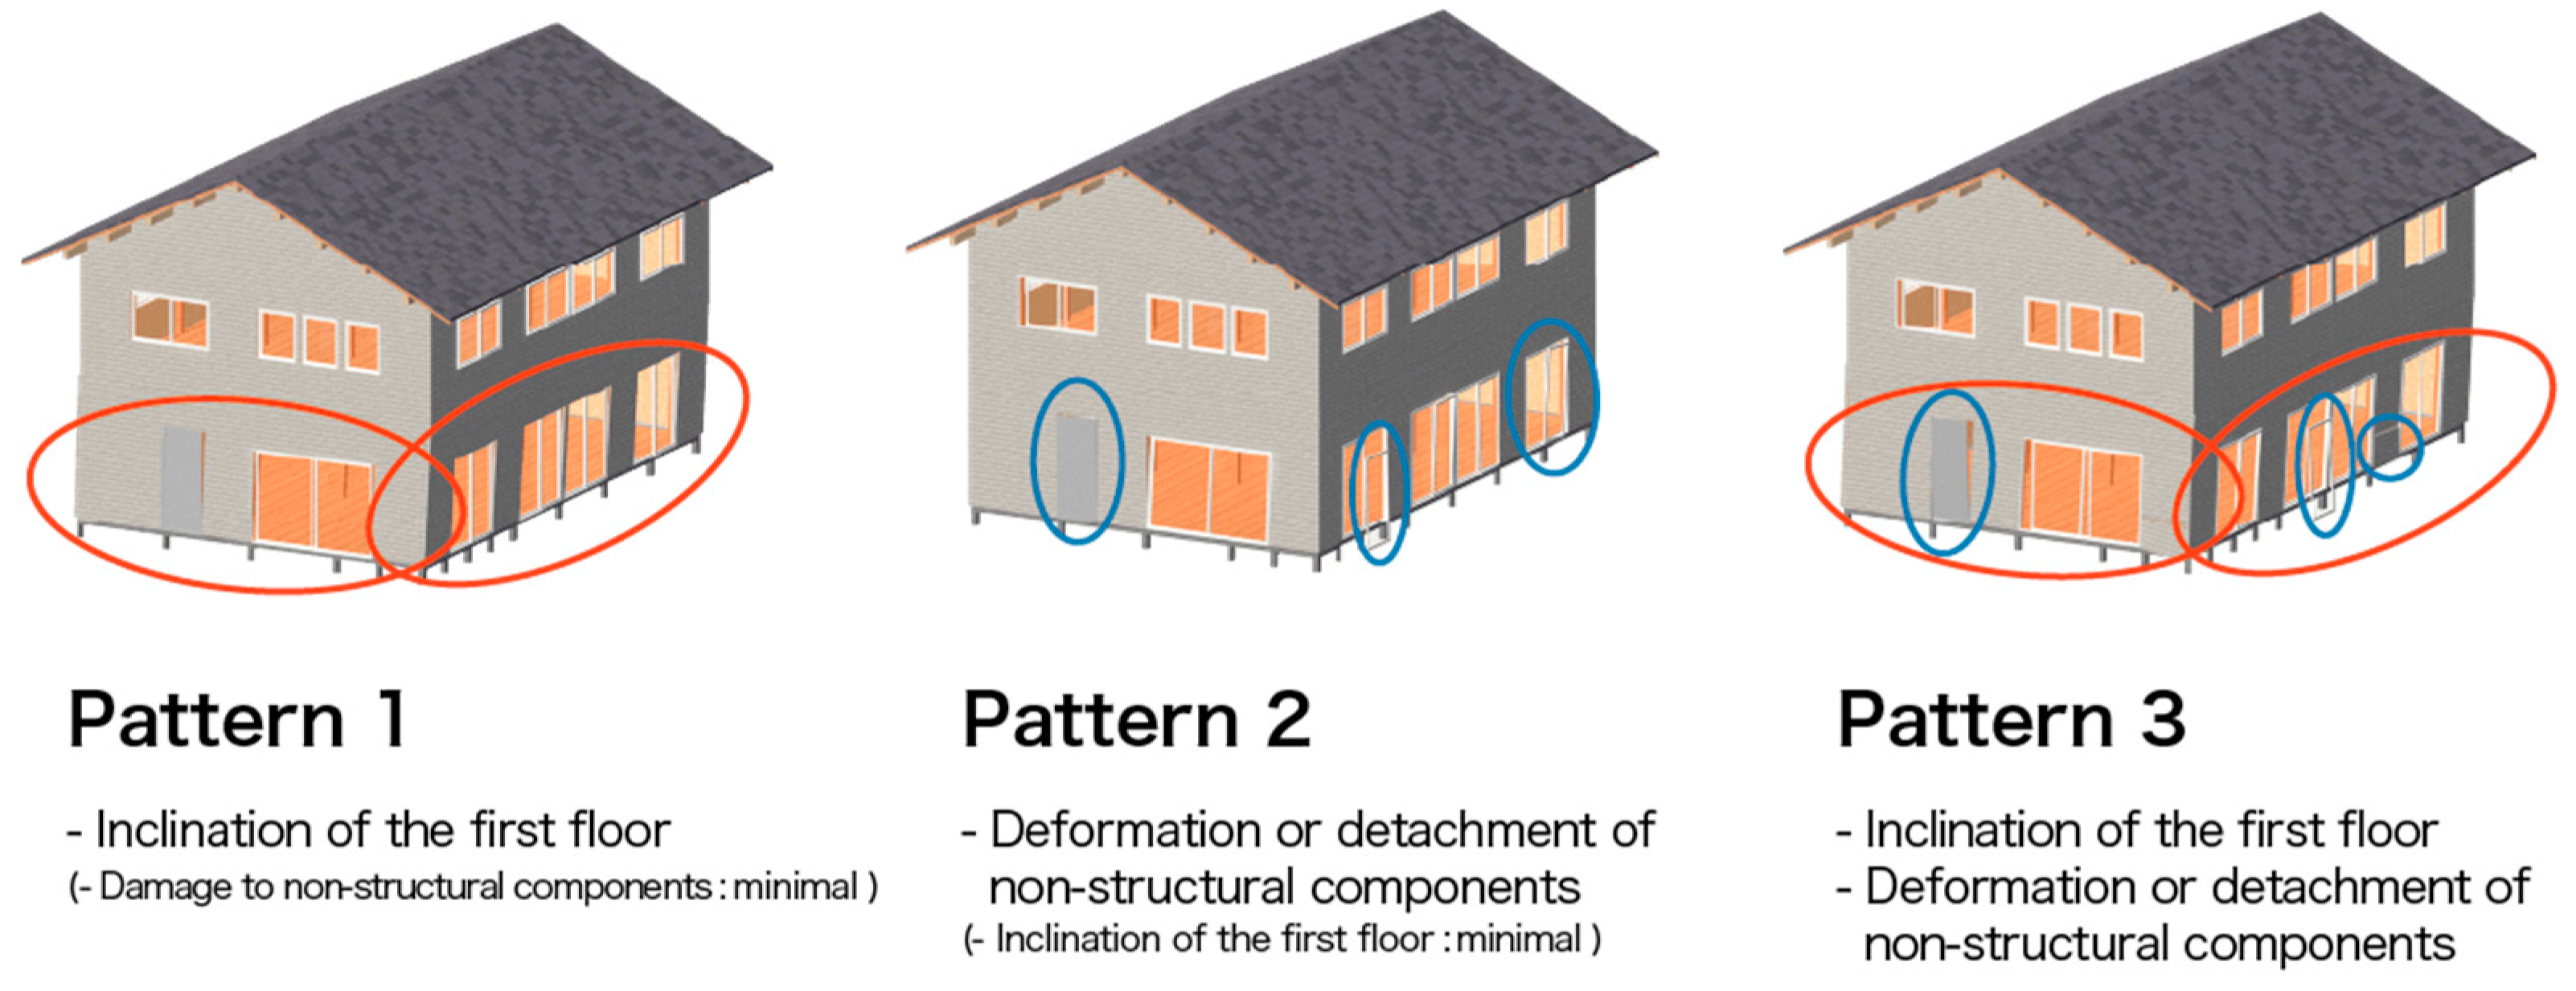
3.2.2. Three-Dimensional Model

The verification results for the 3D model are shown in Figure 18.
The degree of wall inclination was visualized using a gradient display, where blue represents areas with no inclination, and regions with inclination gradually shift to red, illustrating the tilt variation across the surface. Appropriate data acquisition and extraction methods confirmed that the tilt and detachment of the model and various deformation patterns, such as bending and cracking, can be detected. Based on the results of both models, it was confirmed that deformations in both the structural frame and secondary members can be accurately detected in the point cloud data, allowing for an assessment that considers rebound effects.

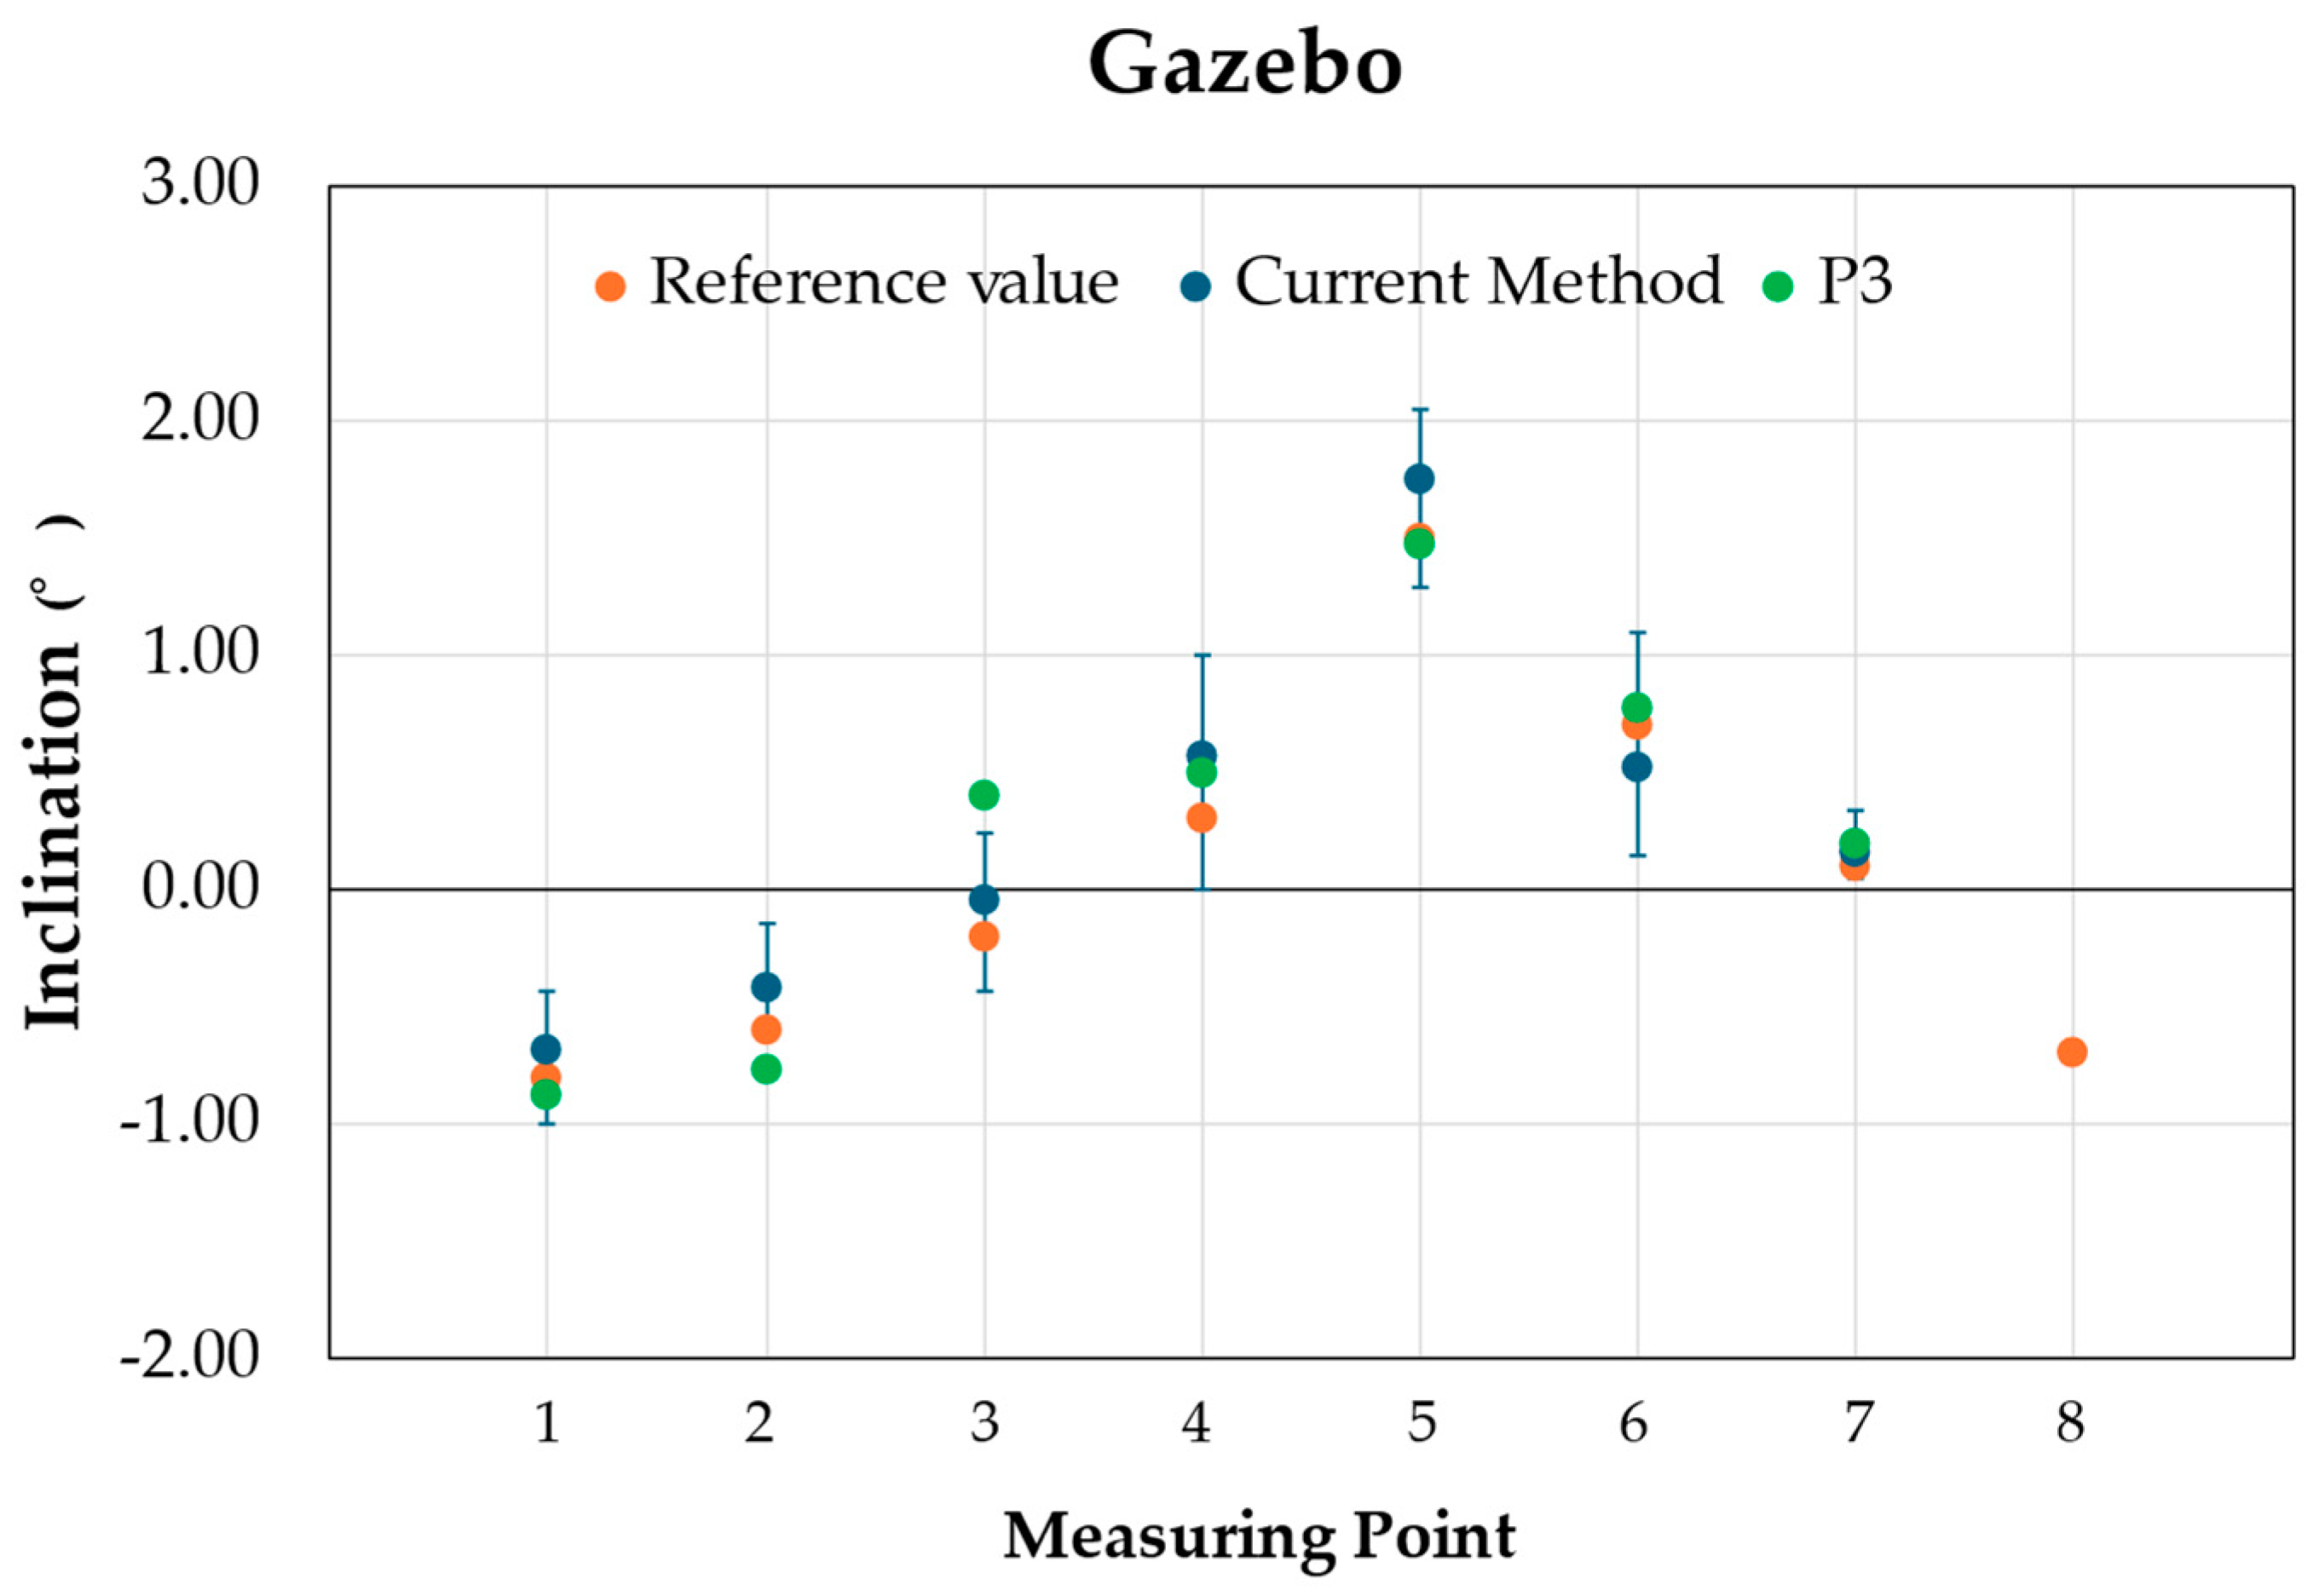
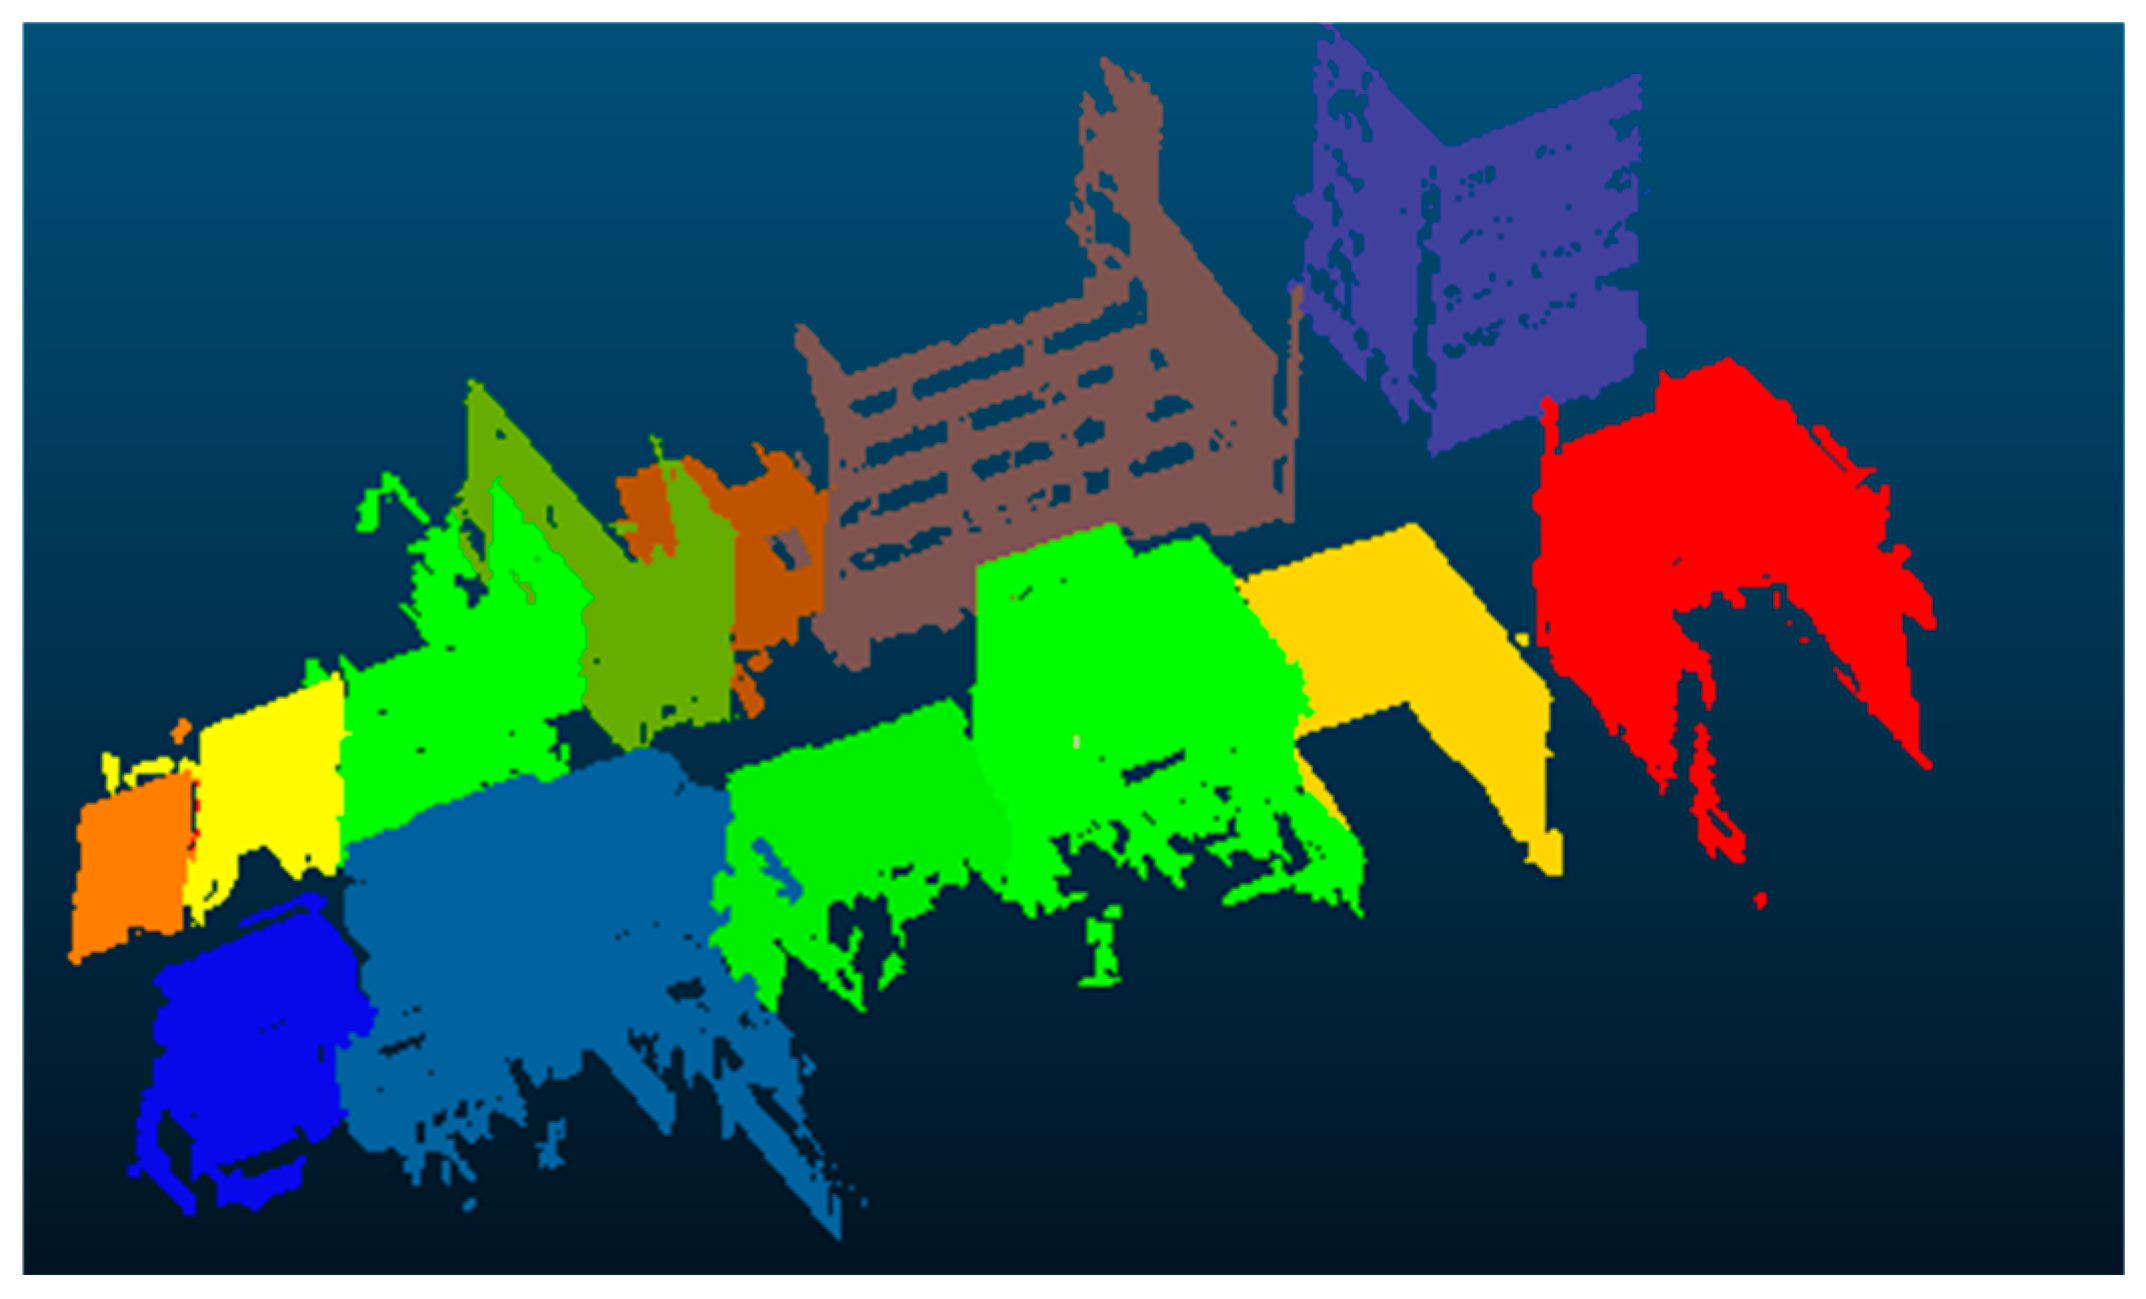
3.3. Bulk Imaging of Multiple Buildings in a Shopping District

The measurement results for P3 and K1 are shown in Figure 19 and Figure 20, respectively.
Applying algorithms RANSAC (Random Sample Consensus) and DBSCAN (Density-Based Spatial Clustering with Noise) facilitated the extraction of individual building facades even during bulk imaging conducted from a distance. RANSAC effectively identifies and segments planar surfaces, enhancing the accuracy of facade extraction, while clustering algorithms spatially close points and improving the separation of structures. Additionally, as shown in Figure 21, machine learning techniques were employed to analyze the position and shape of secondary members. By matching point cloud-derived images with captured images, accurate identification of secondary members for each building was achieved.
With the P3 and K1 cameras, building shapes and secondary members could be successfully captured and analyzed through bulk imaging from remote positions.

4. Conclusions

Rapid evaluation is essential in post-disaster emergency safety assessments due to the direct implications for human lives. Qualified inspectors, such as first-class architects, perform visual inspections and simple measurements to evaluate building safety. However, securing sufficient inspectors in densely populated residential areas remains challenging, making rapid assessments difficult. This issue is particularly pronounced in wooden houses, prevalent in Japan, notably in densely populated metropolitan areas. Wooden houses exhibit a unique phenomenon known as “swinging back”, where substantial deformation may result in minimal residual tilt, causing damage to appear superficially minor. In such cases, secondary members such as window frames and exterior siding materials, less influenced by rebound effects, show apparent deformation and thus become critical targets for deformation detection. Recent studies have explored image analysis and AI-driven methods to enhance the speed and accuracy of emergency safety assessments. However, most research has focused on reinforced concrete (RC) structures, and limited attention has been paid to the specific characteristics of wooden houses.
In this study, we examined a method utilizing photogrammetry with 3D scanning cameras to enhance the efficiency and speed of emergency safety assessments for wooden houses. Three-dimensional scanning cameras capture an image and three-dimensional point cloud data, providing a numerical evaluation of building dimensions and inclination. This approach enables on-site data capture while safely processing data, improving inspector safety and operational efficiency. The practical applicability evaluation confirmed that photogrammetric accuracy was sufficient despite differences resulting from camera performance. It was also demonstrated that judgments considering rebound effects could be effectively made by capturing the point cloud data of secondary members. Additionally, it was verified that the necessary point cloud data could be efficiently acquired through bulk imaging. Consequently, the proposed 3D scanning camera-based damage assessment method is practical even in densely populated wooden housing areas, significantly contributing to faster and more efficient emergency safety assessments.
Commercial district surveys confirmed that obstructions such as street trees and fences occasionally impeded complete data acquisition. However, it is considered that the necessary information for evaluation can be sufficiently secured through data supplementation using machine learning techniques applied to wall surfaces and secondary components. As future considerations, environmental conditions such as scanning distance and weather effects should be examined for their impact on point cloud density and data stability. On the other hand, further improvements in safety and efficiency are expected through the utilization of drones and advancements in scanning technology. Additionally, numerically analyzed damage data may serve as a valuable resource for future earthquake damage predictions and urban planning.
In conclusion, the photogrammetry-based emergency safety assessment method proposed in this study offers practical and significant benefits, enhancing rapidity, efficiency, and safety while facilitating valuable data utilization.

Author Contributions

I.N.; methodology, investigation, data curation, and writing—original draft preparation. I.K.; investigation and visualization. S.S.; writing—review and editing, and project administration. Y.B.; writing—review, editing, and supervision. All authors have read and agreed to the published version of the manuscript.

Funding

This research was funded by the Obayashi Foundation, Grant 2023-Kenkyu-26-126.

Data Availability Statement

The original contributions presented in this study are included in the article. Further inquiries can be directed to the corresponding author.

Conflicts of Interest

The funders had no role in the study’s design, data collection, analysis, interpretation, manuscript writing, or decision to publish the results. The authors declare no conflict of interest.

References

  1. Applied Technology Council. Procedures for Post-Earthquake Safety Evaluation of Buildings & Addendum; Applied Technology Council: Redwood, CA, USA, 1989. [Google Scholar]
  2. Cal OES. Post Disaster Safety Assessment Program (SAP) Evaluator Student Manual, 18th ed.; Cal OES: CA, USA, 2023. [Google Scholar]
  3. Building Performance, Rapid Building Assessment System. Available online: https://www.building.govt.nz/managing-buildings/managing-buildings-in-an-emergency/rapid-building-assessment-system (accessed on 20 March 2025).
  4. Manual for the Compilation of the 1st Level Form for Damage Detection, Emergency Intervention and Usability for Ordinary Buildings in the Post-Seismic Emergency. Available online: https://web.archive.org/web/20090828100822/http://gndt.ingv.it/Pubblicazioni/Bernardini/Man_Aedes/Manuale/ManualeIndice.html (accessed on 20 March 2025).
  5. Hīkina, W. Rapid Post-Disaster Field Guide: Building Usability Assessment; Ministry of Business, Innovation and Employment: Wellington, New Zealand, 2014; p. 74. [Google Scholar]
  6. Department of Civil Protection, Civile. Manual for the Compilation of the First Level Form for Damage Detection, Emergency Response and Usability for Ordinary Buildings in Post-Seismic Emergencies (AeDES); Department of Civil Protection: Rome, Italy, 2014; pp. 28–48. [Google Scholar]
  7. Cabinet Office. Guidelines for the Implementation System of Housing Damage Certification Operations Related to Disasters. Available online: https://www.bousai.go.jp/taisaku/pdf/saigai_tebiki_full.pdf (accessed on 20 December 2024).
  8. Japan Building Disaster Prevention Association, National Council for Post-Disaster Building Safety Evaluation. Available online: https://www.kenchiku-bosai.or.jp/assoc/oq-index/ (accessed on 26 May 2024).
  9. Ministry of Internal Affairs and Communications. Statistics Dashboard. Available online: https://dashboard.e-stat.go.jp/dataSearch (accessed on 26 May 2024).
  10. Ministry of Land, Infrastructure, Transport and Tourism. Building Construction Starts Statistics Report (FY 2022): Number of Buildings, Total Floor Area, and Estimated Construction Costs by Structure and Use. Available online: https://www.e-stat.go.jp/stat-search/files?stat_infid=000040247003 (accessed on 25 April 2025).
  11. Post-Earthquake Building Safety Evaluation Criteria and Emergency Safety Assessment Manual for Wooden Buildings, 1st ed.; General Incorporated Association Japan Architectural Disaster Prevention Association National Disaster-Damaged Buildings Emergency Risk Assessment Council: Tokyo, Japan, 1998; pp. 24–25.
  12. Kono, T.; Yamada, K.; Honma, S. A Method for Post-earthquake Rapid Safety Assessment of Buildings Based on Image Analysis. In Research Reports of the Chugoku Branch of the Architectural Institute of Japan; Architectural Institute of Japan: Tokyo, Japan, 2022; Volume 45, pp. 219–222. [Google Scholar]
  13. Chida, H.; Takahashi, N.; Yamada, T. Application of a Deep Learning-Based Image Diagnosis System for Damage Investigation of the 2021 Fukushima Offshore Earthquake and Fundamental Study for Practical Use; The Architectural Institute of Japan, Series B: Tokyo, Japan, 2022; Volume 68, pp. 1–8. [Google Scholar]
  14. Okada, T.; Miyazu, Y. Seismic Damage Assessment of Wooden Houses Using CNN with Response Acceleration Records; Information (Computing) Symposium, The Architectural Institute of Japan: Tokyo, Japan, 2021; Volume 44, pp. 335–338. [Google Scholar]
  15. Kuniyoshi, I.; Sato, S.; Nagaike, I.; Bao, U. Building Damage Visualization Through Three-Dimensional Reconstruction. IEEE Access 2025, 13, 68410–68421. [Google Scholar] [CrossRef]
  16. Japan Sash Association. Standard Specifications and Dimensional Standards for Residential Sashes and Entrance Products 504. Available online: https://www.jsma.or.jp/Portals/0/images/useful/houreikijun/kikakusunpo(20210426).pdf (accessed on 20 September 2024).
  17. JIS A 4706:2021; Windows. Japanese Standards Association: Tokyo, Japan, 2021; p. 7.
  18. Li, L.; Yang, F.; Zhu, H. An Improved RANSAC for 3D Point Cloud Plane Segmentation Based on Normal Distribution Transformation Cells. Remote Sens. 2017, 9, 433. [Google Scholar] [CrossRef]
  19. Kuniyoshi, I.; Nagaike, I.; Sato, S.; Bao, Y. Building Damage Visualization Through Three-Dimensional Reconstruction and Window Detection. Sensors 2025, 25, 2979. [Google Scholar] [CrossRef]
Figure 1. Showing the data processing method for inclination calculation.
Buildings 15 01623 g001
Figure 2. Comparison of inspector’s workflow of current methods and proposed methods.
Buildings 15 01623 g002
Figure 3. Flow of the proposed method.
Buildings 15 01623 g003
Figure 4. The list of the buildings investigated.
Buildings 15 01623 g004
Figure 5. The measurement method uses a plumb bob.
Buildings 15 01623 g005
Figure 6. (a) Definition of Window Frame Dimensions and Inclination Angle θ; (b) Window frame model.
Buildings 15 01623 g006
Figure 7. Investigation procedure using a full-scale model.
Buildings 15 01623 g007
Figure 8. Three-dimensional model of detached houses with localized deformation and member detachment.
Buildings 15 01623 g008
Figure 9. Comparison of inclination measurement results at each location of the storage.
Buildings 15 01623 g009
Figure 10. Comparison of inclination measurement results at each location of apartment.
Buildings 15 01623 g010
Figure 11. Comparison of inclination measurement results at each location of detached house.
Buildings 15 01623 g011
Figure 12. Comparison of inclination measurement results at each location of tea house 1.
Buildings 15 01623 g012
Figure 13. Comparison of inclination measurement results at each location of tea house 2.
Buildings 15 01623 g013
Figure 14. Comparison of inclination measurement results at each location of gazebo.
Buildings 15 01623 g014
Figure 15. Differences in Point Cloud Acquisition and Processing Methods Using Cameras.
Buildings 15 01623 g015
Figure 16. Measurement results of window frame model (W × H: 780 mm × 970 mm).
Buildings 15 01623 g016
Figure 17. Measurement results of window frame model (W × H: 1690 mm × 1830 mm). [19].
Buildings 15 01623 g017
Figure 18. Verification results of 3D model. [19].
Buildings 15 01623 g018
Figure 19. Measurement results of Shopping Street bulk Photography using P3.
Buildings 15 01623 g019
Figure 20. Measurement results: Shopping Street bulk Photography using K1.
Buildings 15 01623 g020
Figure 21. Measurement results: Detection of secondary members [19].
Buildings 15 01623 g021
Table 1. The list of cameras used.
Camera NameMatterport Pro2 (P2)Matterport Pro3 (P3)LixelKity K1 (K1)
Camera bodyBuildings 15 01623 i001Buildings 15 01623 i002Buildings 15 01623 i003
Point Cloud
Acquisition Method
InfraredLiDARLiDAR
Point Cloud DensityUniformUniformDepends on
Information Density
Effective Range100 m100 m40 m
OthersUsing Tripod
Approx. 30 sec/scan
Using Tripod
Approx. 20 sec/scan
Handheld Scanner
Table 2. Storage measurement results.
Measuring PointCurrent Method (°)Proposed Method (°)Reference Value (°)
1st2nd3rd4th5th6th 7th 8th9th10thAverageStandard
Deviation
P2P3K1
1−0.05−0.07−0.02−0.10−0.02−0.100.00−0.050.00−0.07−0.050.03−0.08−0.040.12−0.05
20.140.380.220.240.220.260.170.120.190.190.210.070.280.28−0.100.25
30.100.140.170.120.170.140.190.100.170.120.140.030.210.260.310.15
4−0.050.00−0.02−0.070.02−0.020.02−0.100.050.05−0.010.050.030.00−0.120.05
5−0.050.070.17−0.020.020.020.02−0.050.12−0.050.030.070.080.160.200.1
6−0.10−0.100.00−0.12−0.07−0.17−0.12−0.12−0.17−0.10−0.100.05−0.18−0.12−0.11−0.15
7−0.12−0.19−0.12−0.14−0.17−0.17−0.05−0.22−0.17−0.19−0.150.05−0.05−0.12−0.19−0.1
8−0.07−0.02−0.05−0.05−0.02−0.12−0.07−0.02−0.07−0.10−0.060.03−0.08−0.09−0.38−0.1
Table 3. Apartment measuring results.
Measuring PointCurrent Method (°)Proposed Method (°)Reference Value (°)
1st2ndAverageStandard
Deviation
P2P3K1
10.340.190.260.080.180.070.250.15
20.040.240.140.100.09−0.060.210
30.110.290.200.090.050.040.200.05
40.180.150.160.010.050.160.400.1
50.340.110.220.120.260.190.340.15
60.160.130.150.010.010.040.300.05
Table 4. Detached house measurement results.
Measuring
Point
Current Method (°)Proposed Method (°)Reference
Value (°)
1stP2P3K1
10.0950.0030.0050.0510.0
20.124−0.0370.03240.06530.05
300.0990.09520.2340.1
40.0480.0270.00840.01450.05
50.0950.09480.08970.5610.1
60.0720.0430.0210.6290.05
70.1240.0930.1560.1530.0
80.0950.0170.00980.3650.0
Table 5. Tea house 1 measurement results.
Measuring
Point
Current Method (°)Proposed Method (°)Reference
Value (°)
1st2ndAverageStandard
Deviation
P3
122120.190.10−0.050.14−0.06−0.2
2−0.330.10−0.120.21−0.02−0.1
3−0.62−0.19−0.410.21−0.26−0.2
40.430.190.310.12−0.450.3
5−0.14−0.24−0.190.05−0.36−0.3
6−0.05−0.29−0.170.12−0.11−0.2
7−0.33−0.24−0.290.05−0.05−0.3
80.330.430.380.050.090.1
9−0.38−0.05−0.210.17−0.160
100.100.240.170.070.36−0.1
110.05−0.53−0.240.29−0.33−0.2
120.24−0.53−0.140.38−0.23−0.3
13−0.05−0.24−0.140.100.06−0.1
140.380.050.210.170.230.3
15−0.29-−0.290.00−0.240.1
160.190.100.140.050.030.1
17−0.43−0.29−0.360.07−0.26−0.2
180.240.190.210.020.10−0.1
Table 6. Tea house 2 measurement results.
Measuring
Point
Current Method (°)Proposed Method (°)Reference
Value (°)
1st2ndAverageStandard
Deviation
P3
1−0.430.00−0.210.21-−0.3
2−0.570.00−0.290.29−0.29−0.2
3−0.140.240.050.190.100.1
4−0.290.05−0.120.17−0.120.1
50.19−0.190.000.190.110.1
60.100.380.240.14−0.16−0.1
70.100.000.050.05−0.010.2
8−0.24−0.24−0.240.000.090.1
90.050.380.210.170.2580.2
10−0.29−0.33−0.310.02-0.2
Table 7. Gazebo measurement results.
Measuring
Point
Current Method (°)Proposed Method (°)Reference
Value (°)
1st2nd3rdAverageStandard
Deviation
P3
1−0.43−0.62−1.00−0.680.24−0.88−0.80
2−0.53−0.57−0.14−0.410.19−0.77−0.60
3−0.430.240.05−0.050.280.40−0.20
40.000.721.000.570.420.490.30
51.292.051.911.750.331.471.50
60.141.100.330.530.410.770.70
70.050.100.330.160.130.200.10
8------−0.70
Table 8. Measurement results and average error rate.
780 × 970 mm1690 × 1830 mm
Specified Tilt (°)1/60 rad
= 0.95°
1/20 rad
= 2.85°
1/60 rad
= 0.95°
1/20 rad
= 2.85°
First (Left) (°)0.000.9502.950.030.9422.89
First (Right) (°)0.050.9482.970.080.9442.80
Second (Left) (°)0.030.9592.800.010.9702.79
Second (Right) (°)0.050.9712.780.020.9652.78
Depth
Inclination (°)
0.050.070.090.010.090.07
Average Error Rate (%)0.4420.9572.8750.340.9552.815
Disclaimer/Publisher’s Note: The statements, opinions and data contained in all publications are solely those of the individual author(s) and contributor(s) and not of MDPI and/or the editor(s). MDPI and/or the editor(s) disclaim responsibility for any injury to people or property resulting from any ideas, methods, instructions or products referred to in the content.

