
Comparison of Energy Demand for Heating and CO2 Emissions in Urban and Rural Areas, the Case of Hajdú-Bihar County, Hungary

Abstract
1. Introduction
1.1. Energy-Saving Efforts in the Building Sector
1.2. CO2 Emissions in the Building Sector
1.3. Urban vs. Rural Buildings
1.4. Research Goal
2. Methodology
3. Features of Building Stock
4. Results and Discussion
4.1. Rural Single-Family Houses
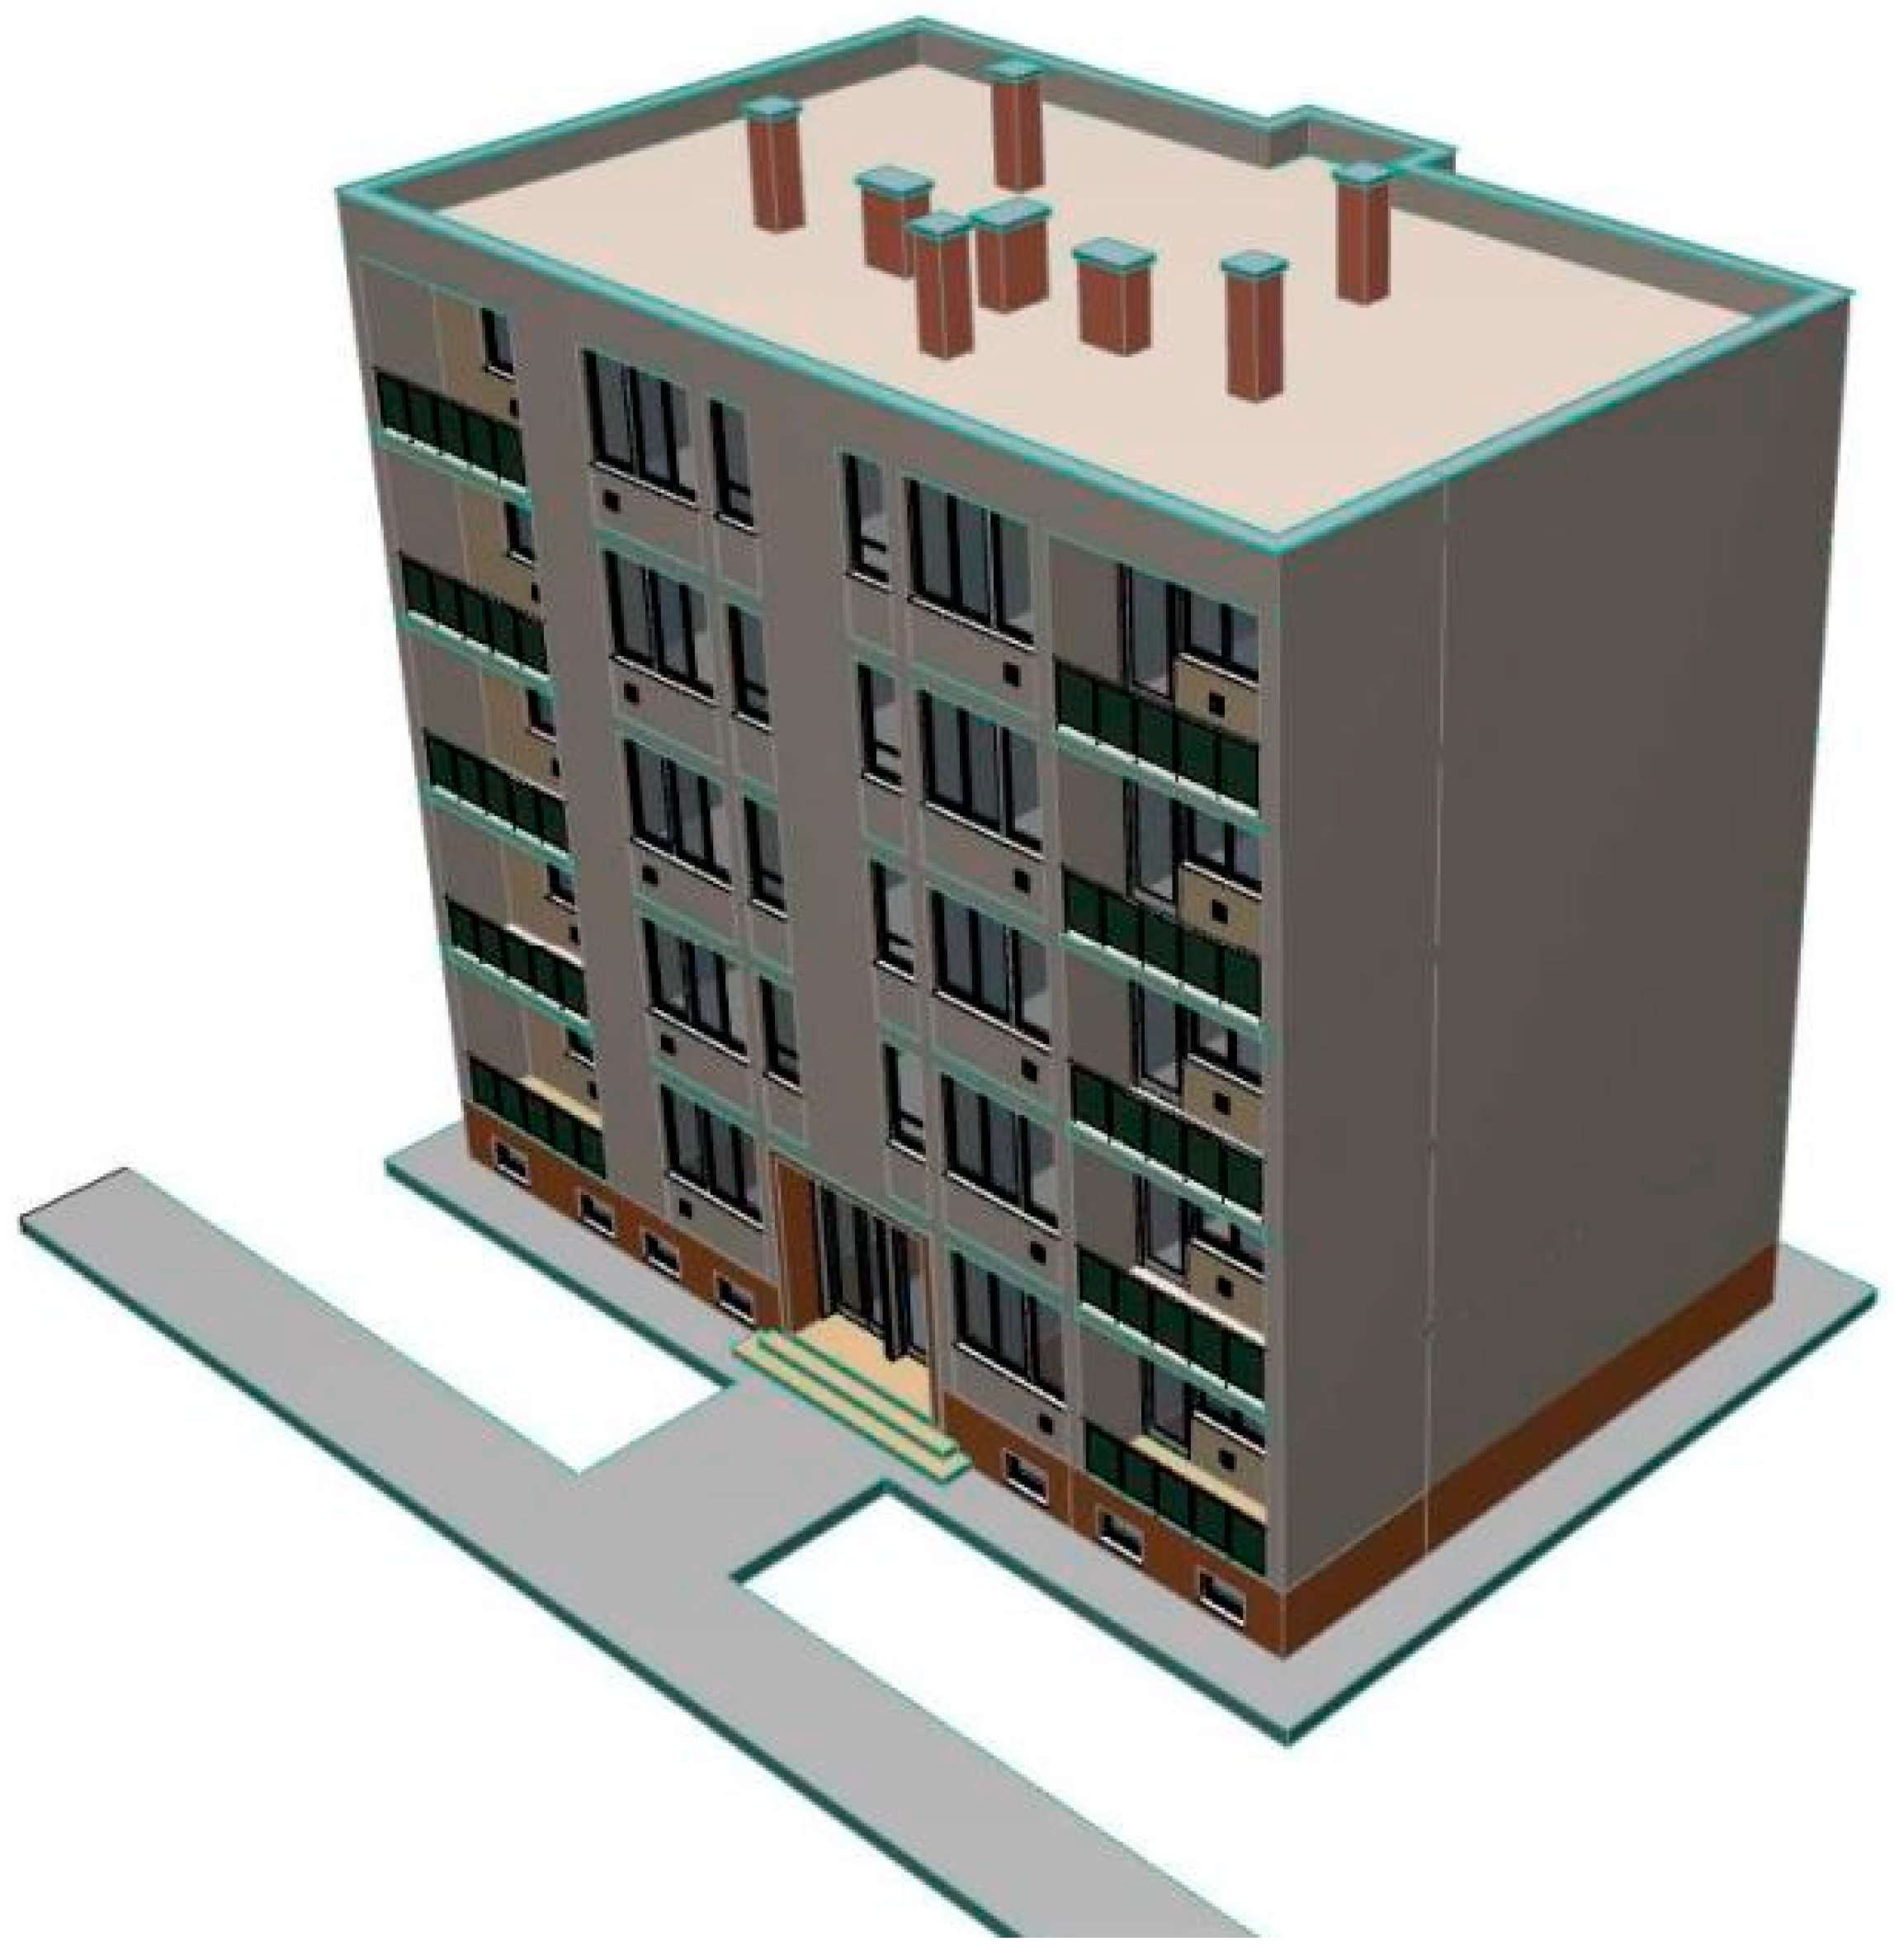
4.2. Masonry-Structured Multifamily Buildings
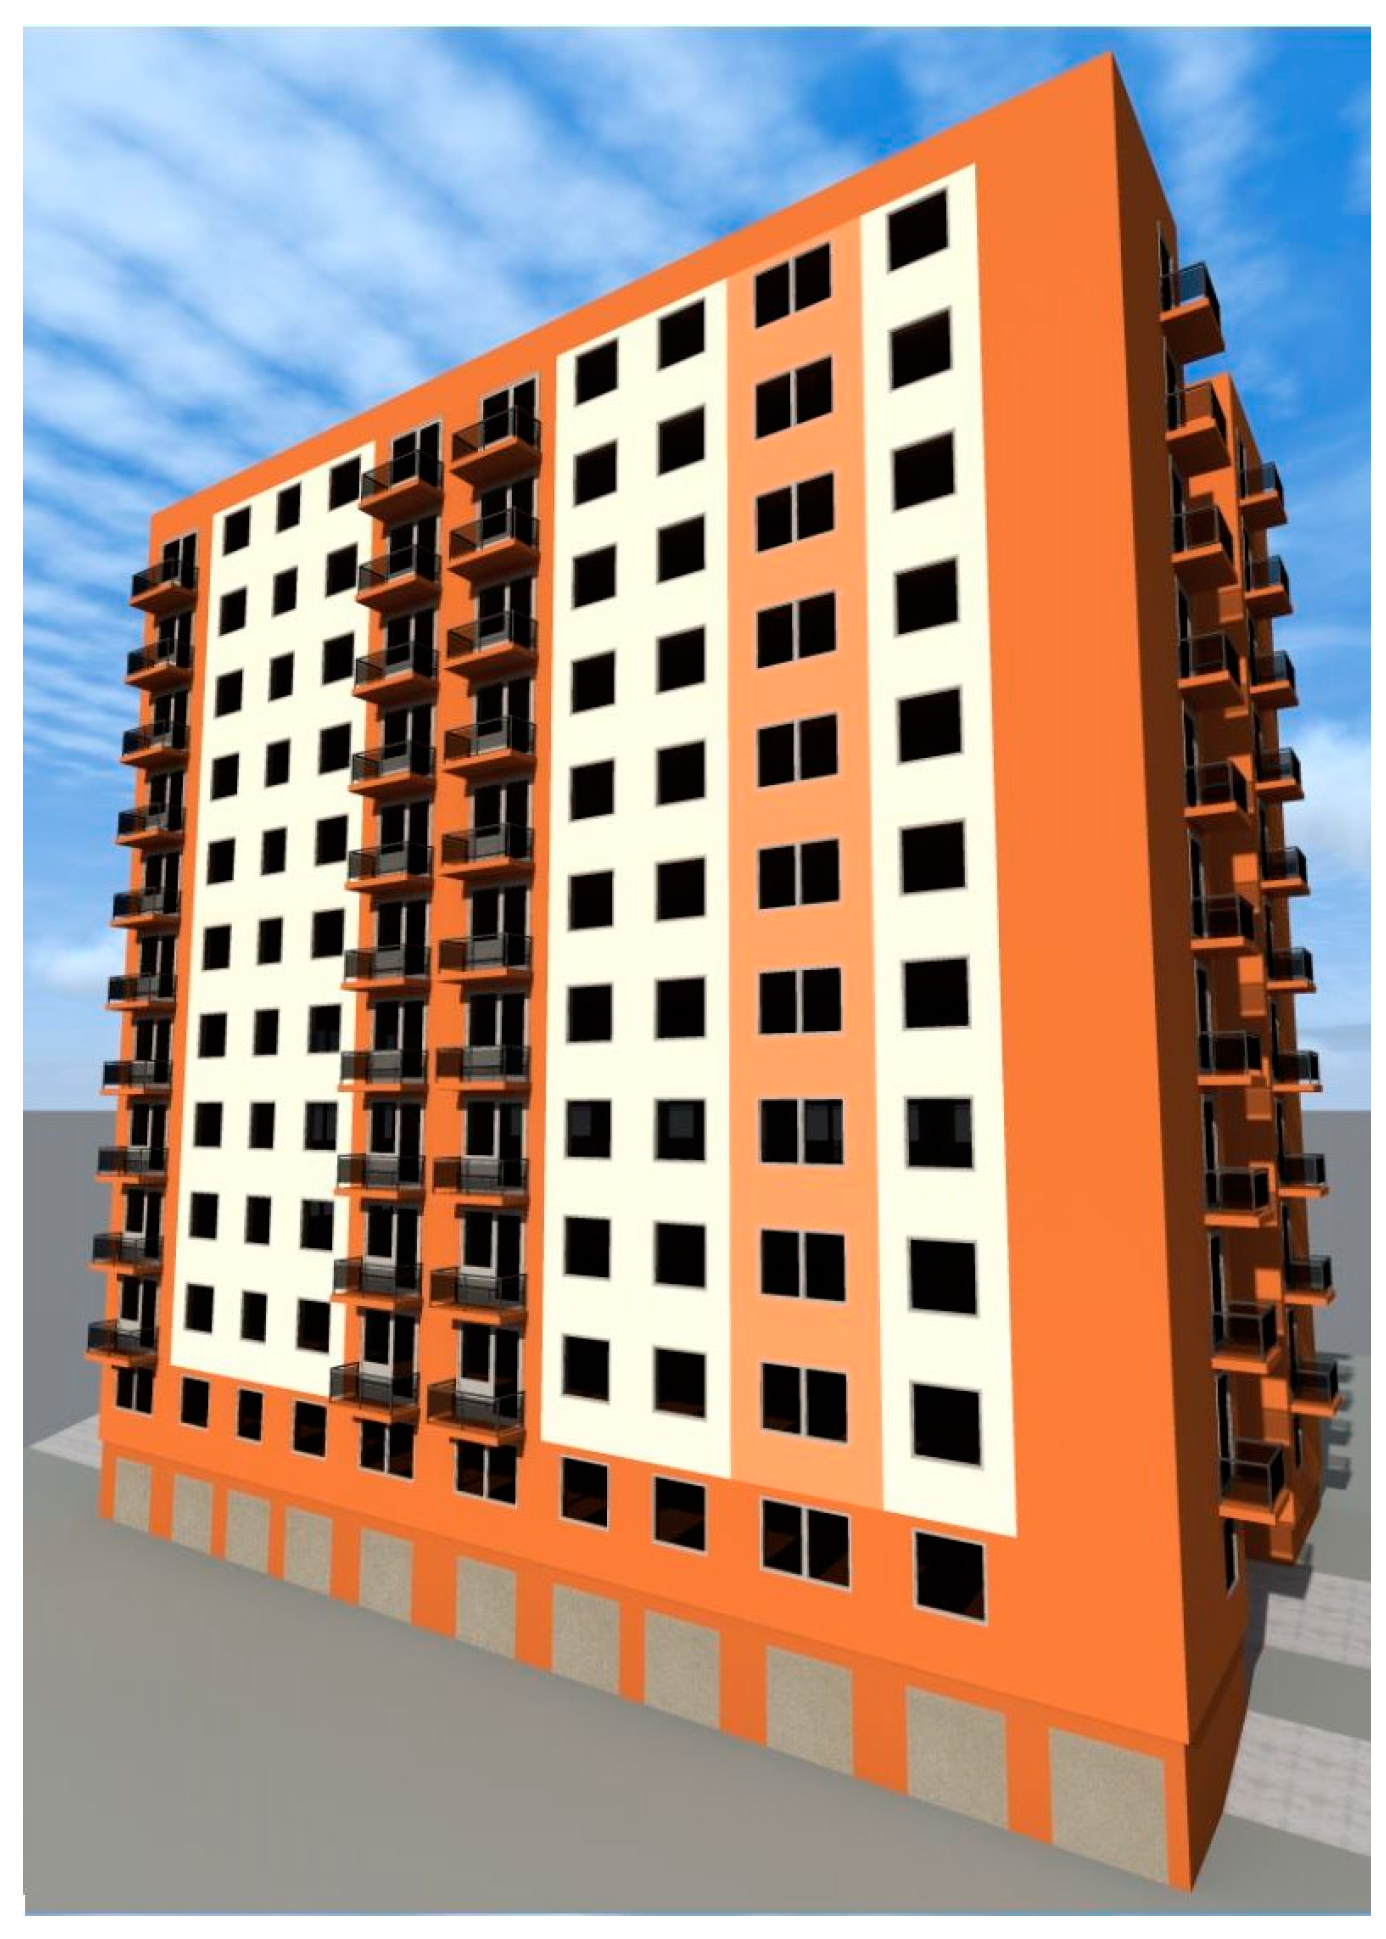
4.3. Panel Buildings
4.4. Comparison of Urban–Rural Single-Family Houses
4.5. Comparison of Urban Single-Family Houses and Masonry-Structured Multifamily Buildings
4.6. Comparison of Rural Single-Family Houses and Masonry-Structured Multifamily Buildings
4.7. Good Examples of Refurbishments
4.7.1. Single-Family Houses
4.7.2. Masonry-Structured Multifamily Buildings
4.7.3. Panel Buildings
5. Conclusions
- In this study, based on the energy assessment of 605 single-family houses and flats in multifamily buildings, a heat demand and CO2 emission survey in urban and rural residential buildings in Hajdú-Bihar County (Hungary) was conducted. Analysing the obtained results statistically, the following conclusions can be drawn:
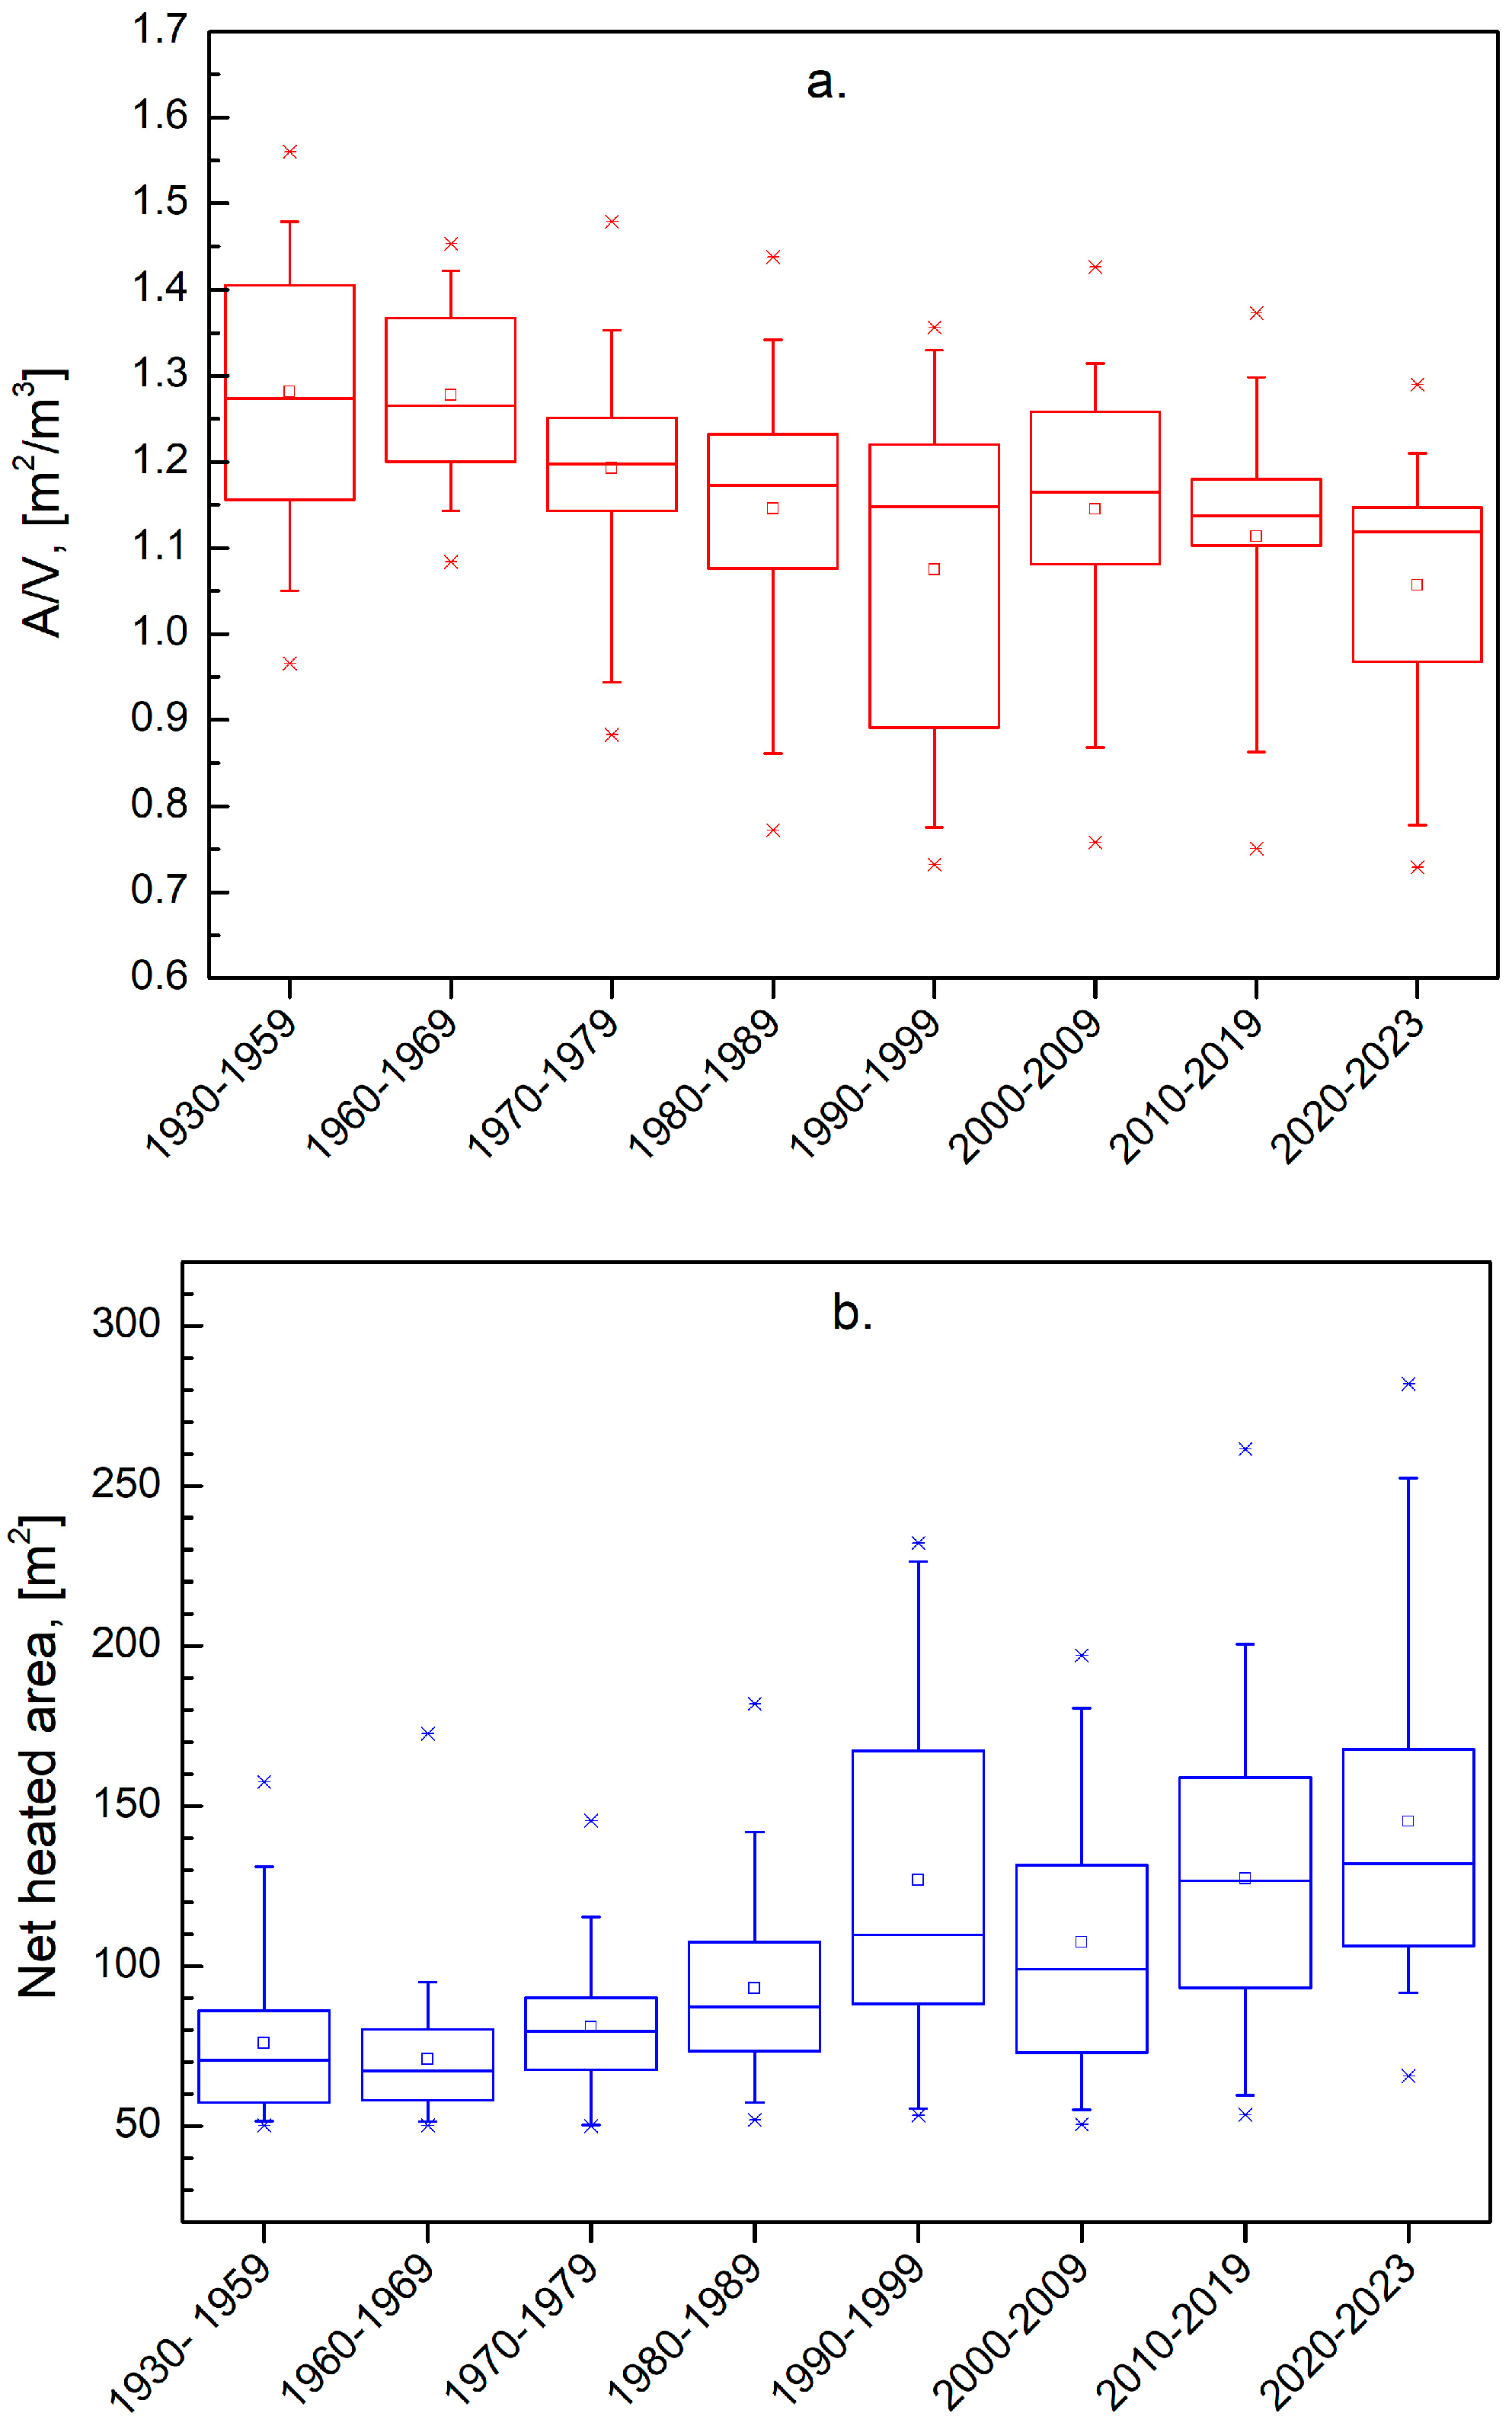
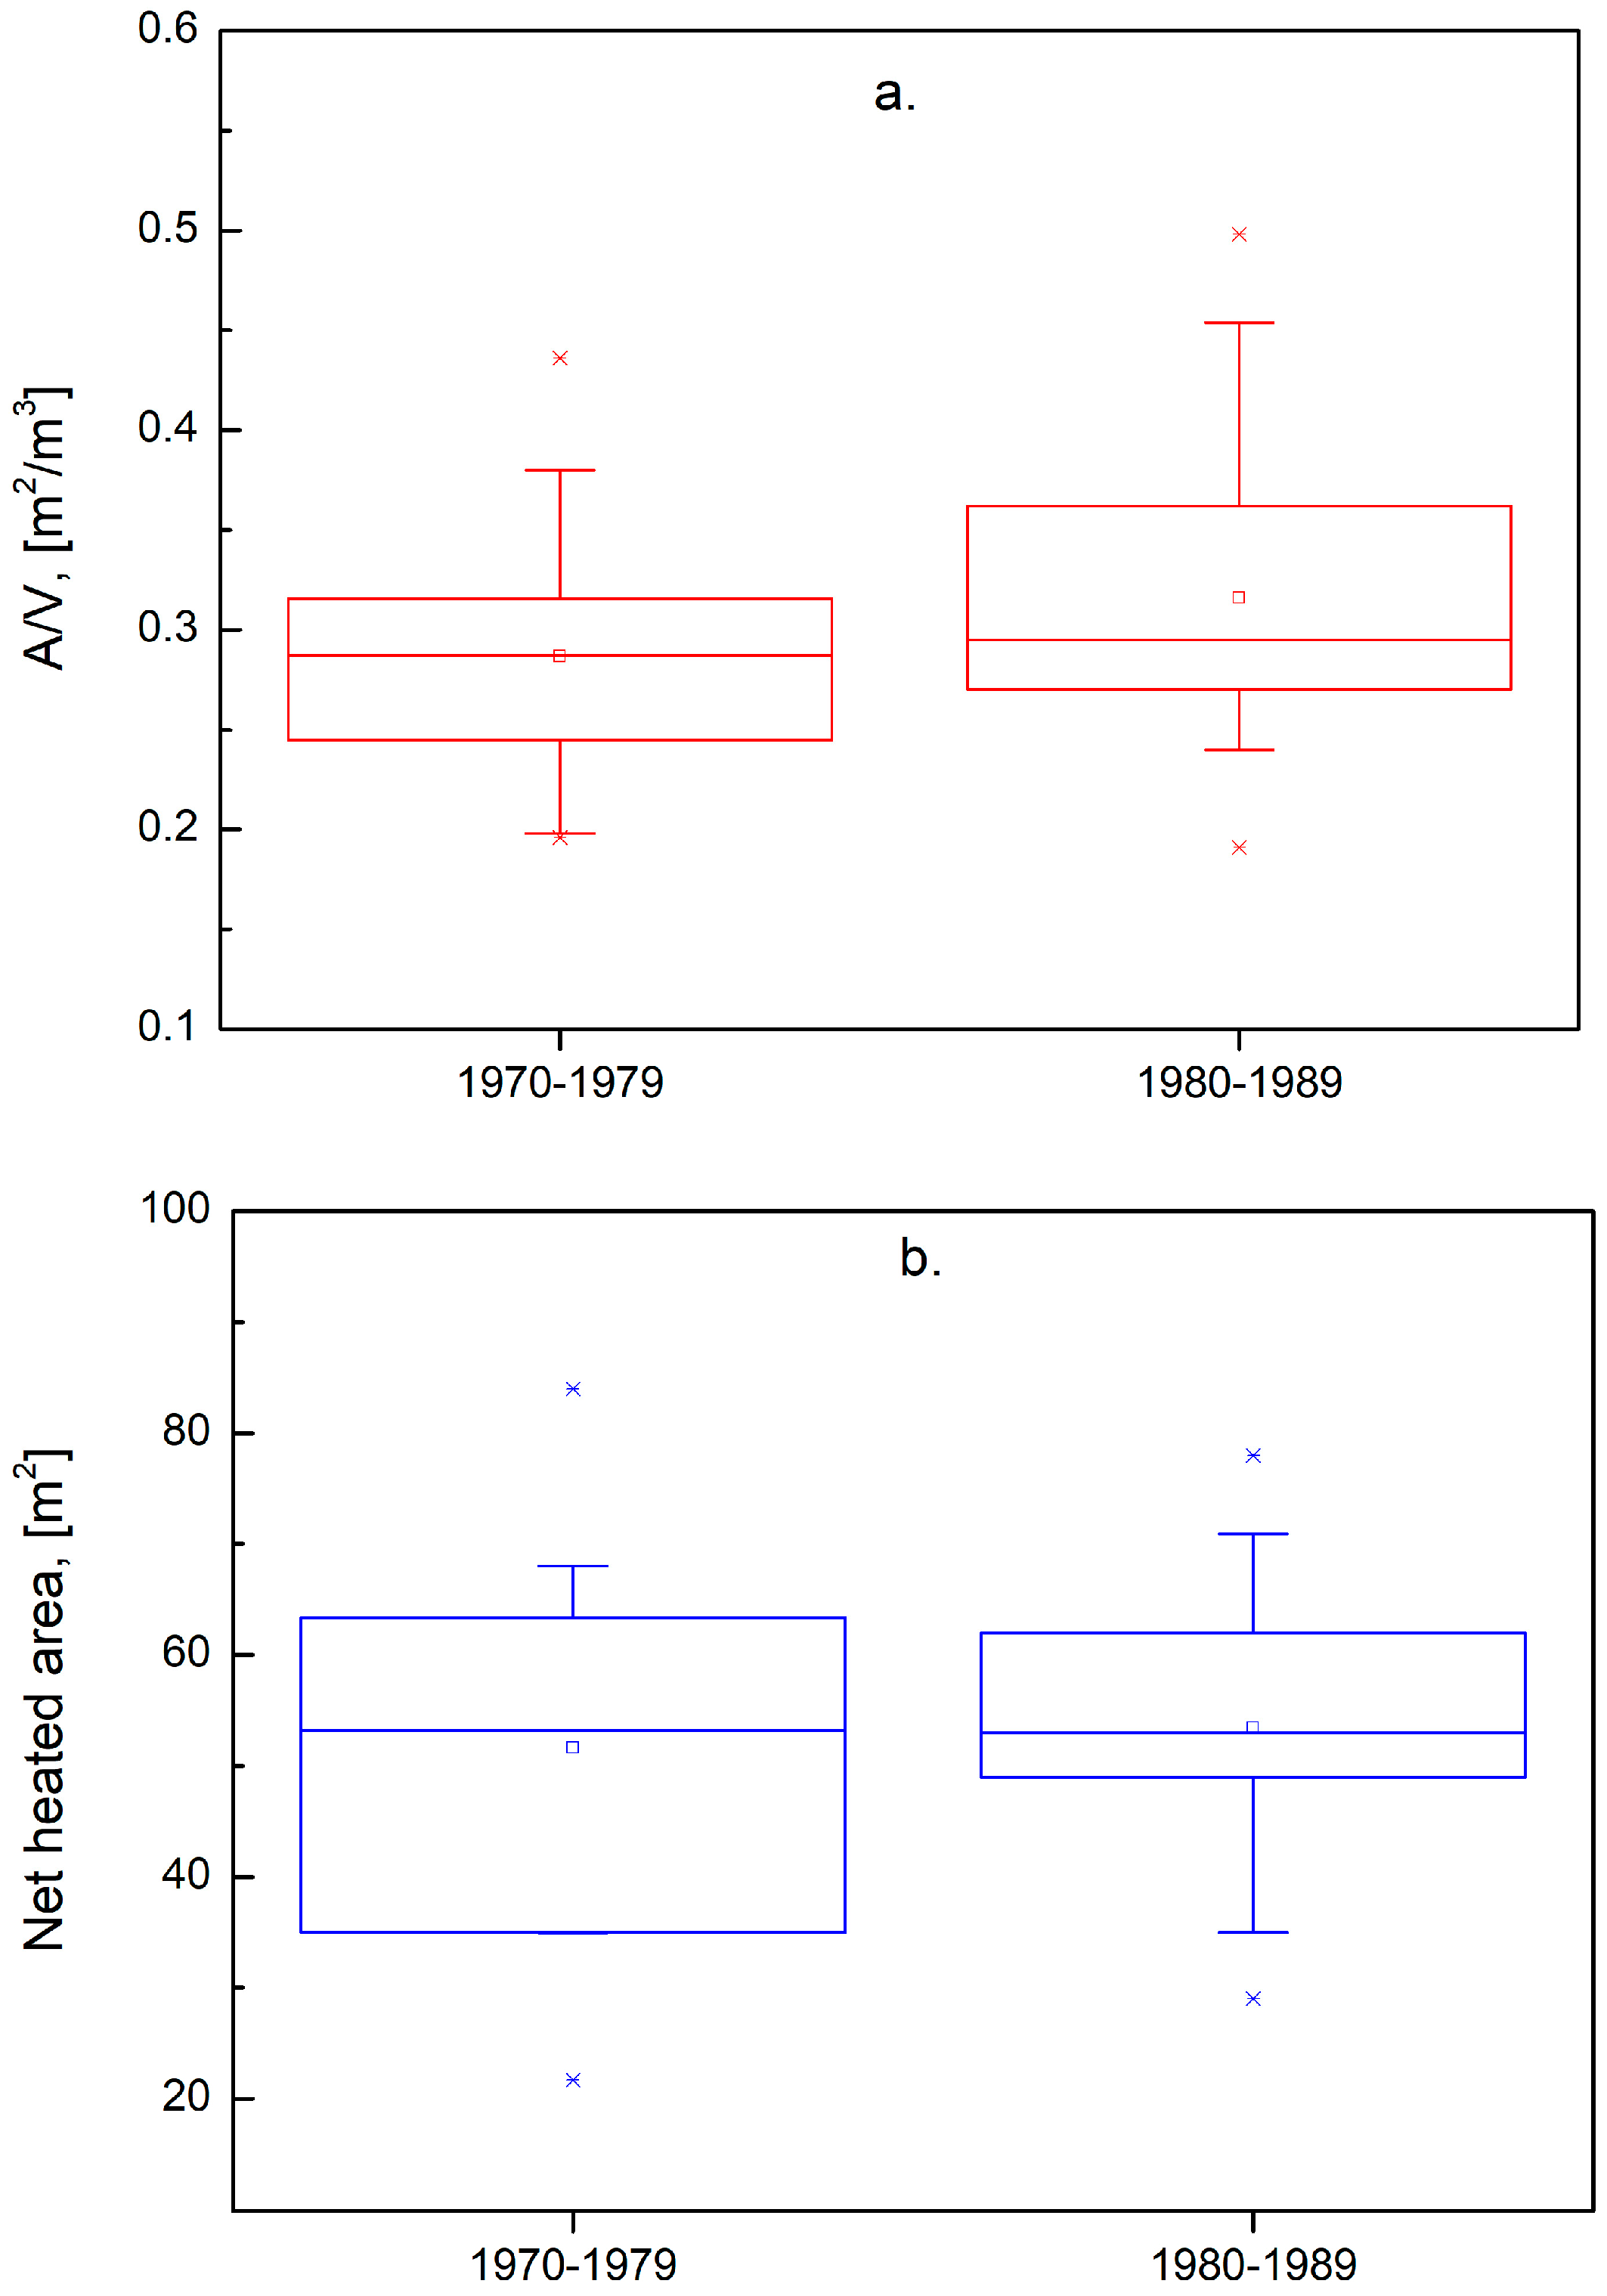
- In both rural and urban regions, the compactness of single-family houses has improved in recent decades (with a more pronounced decrease in urban regions), and the net floor area of the buildings is increasing in both urban and rural areas (though the increase is more notable in urban regions). Hence, the trends of the A/V parameter and net heated area are similar in urban and rural single-family houses; however, the A/V parameter is significantly higher in rural houses, while the net heated area is significantly greater in urban houses.
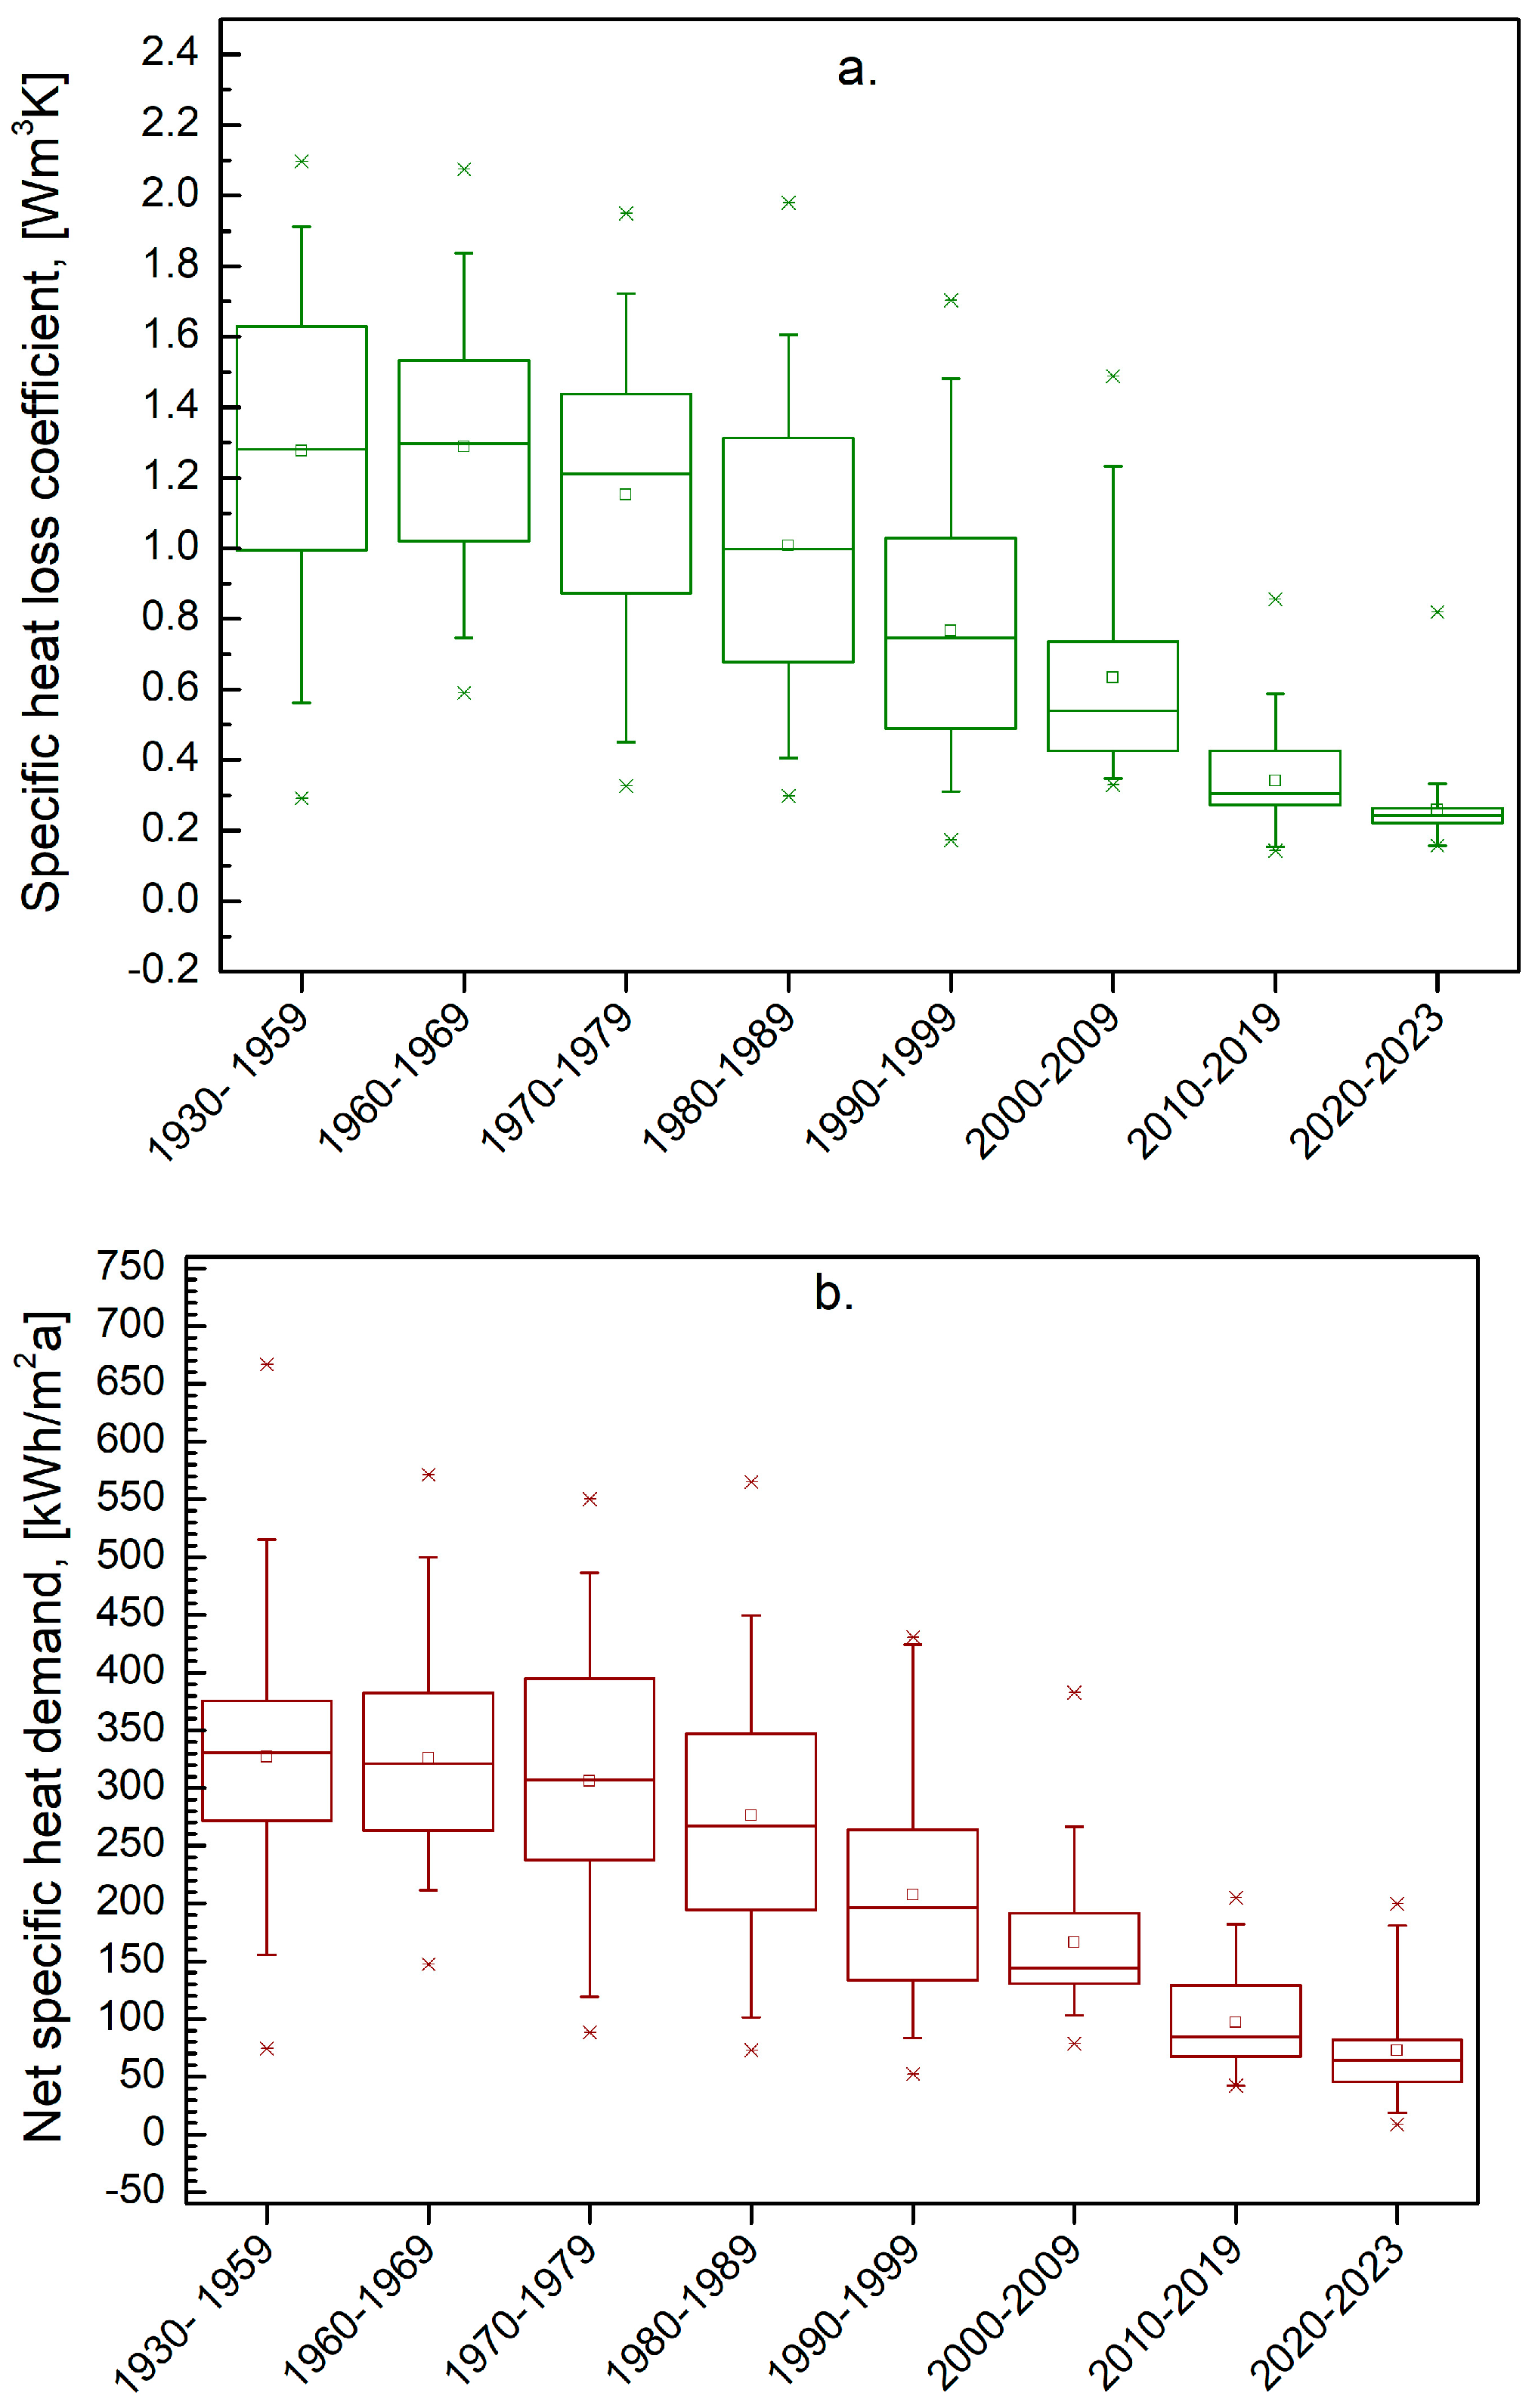
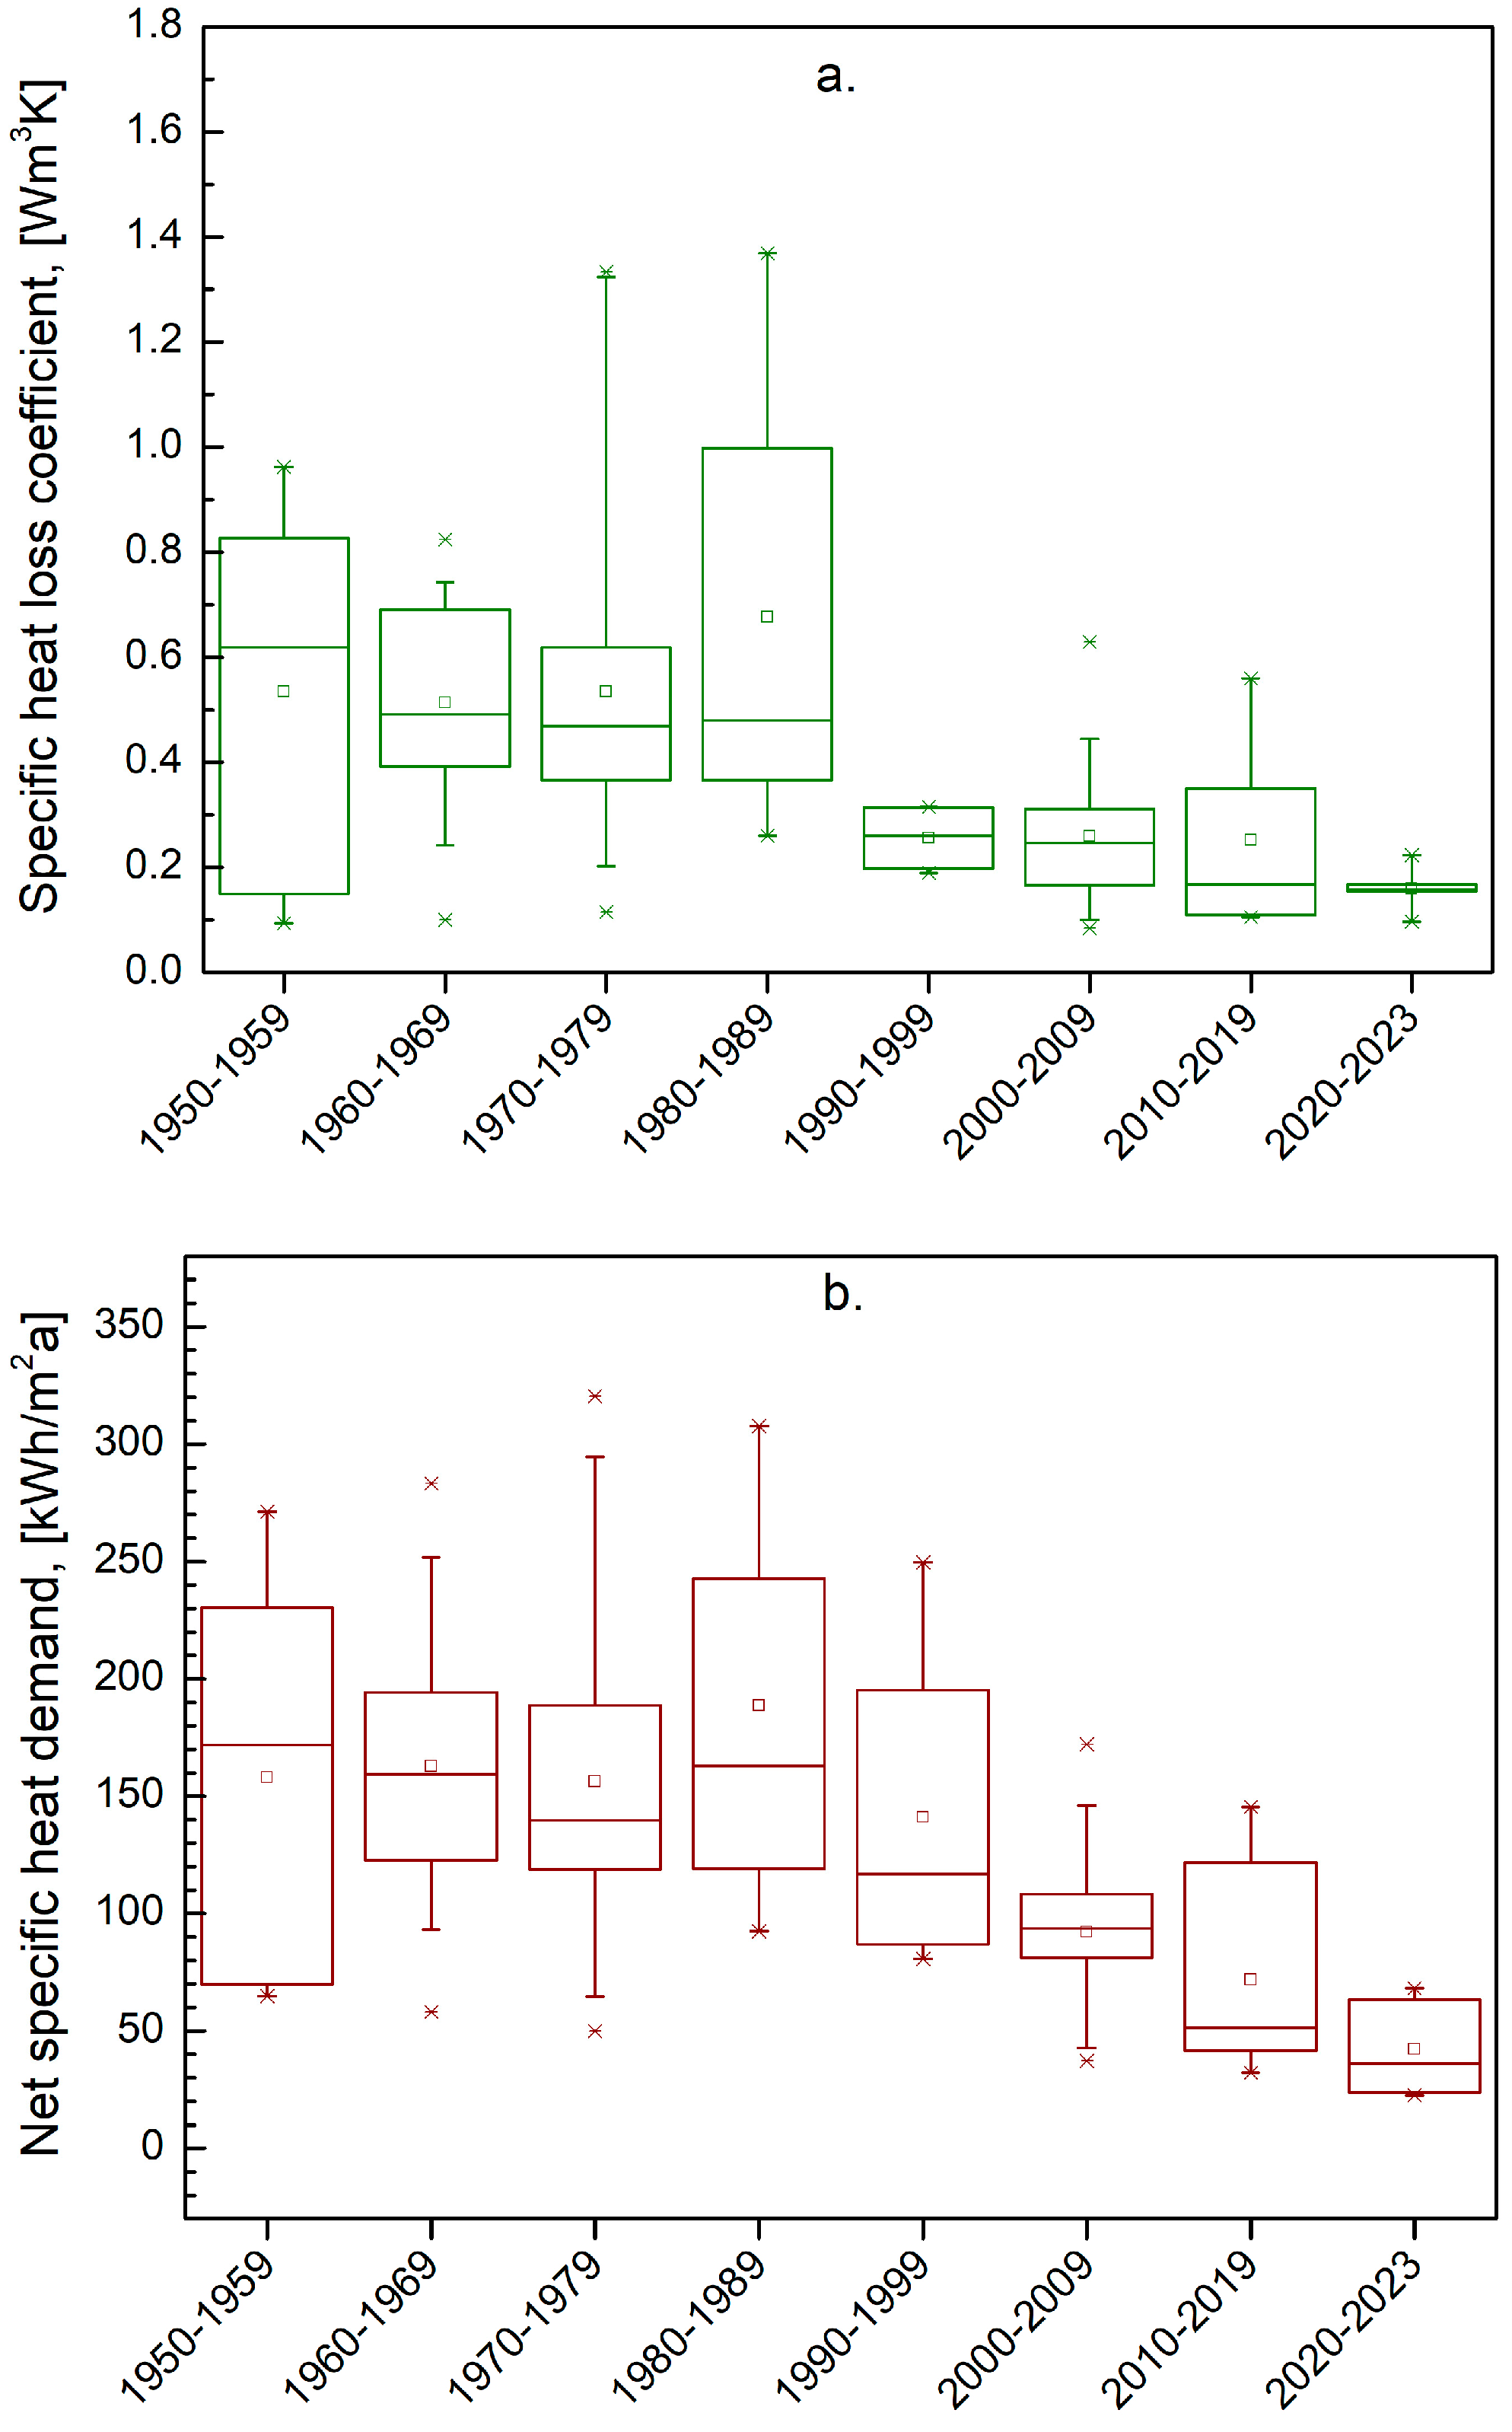
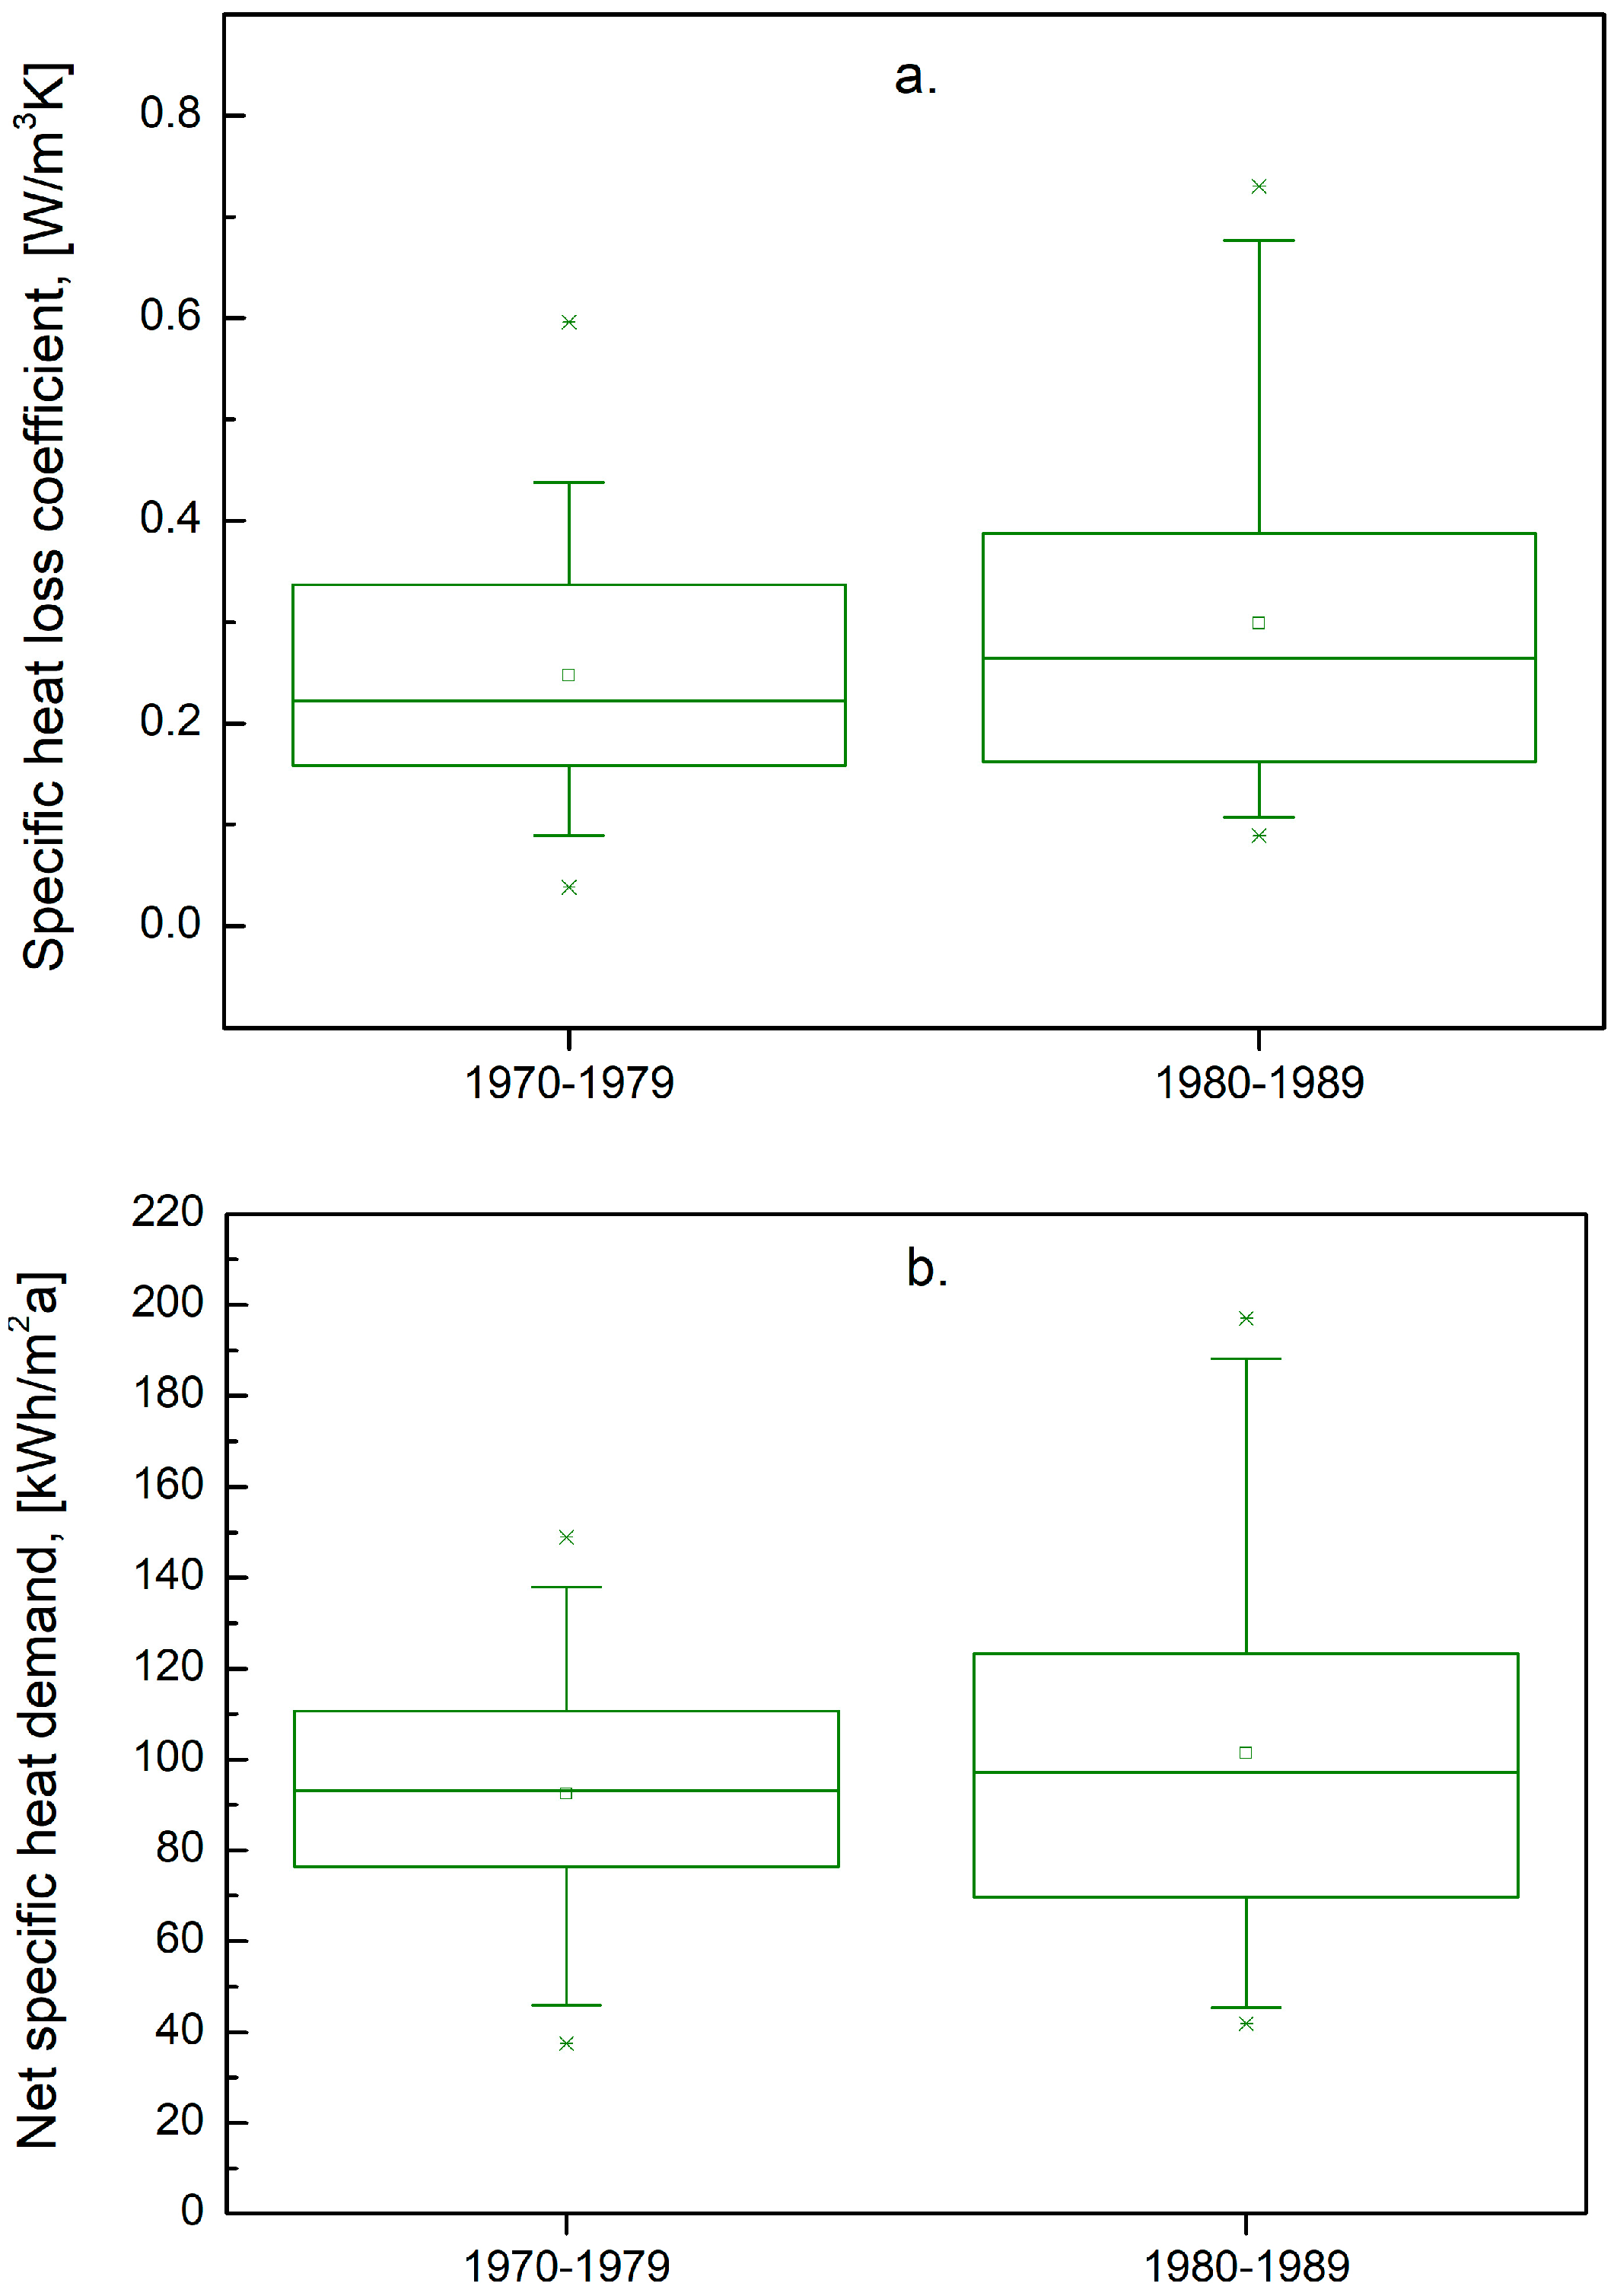
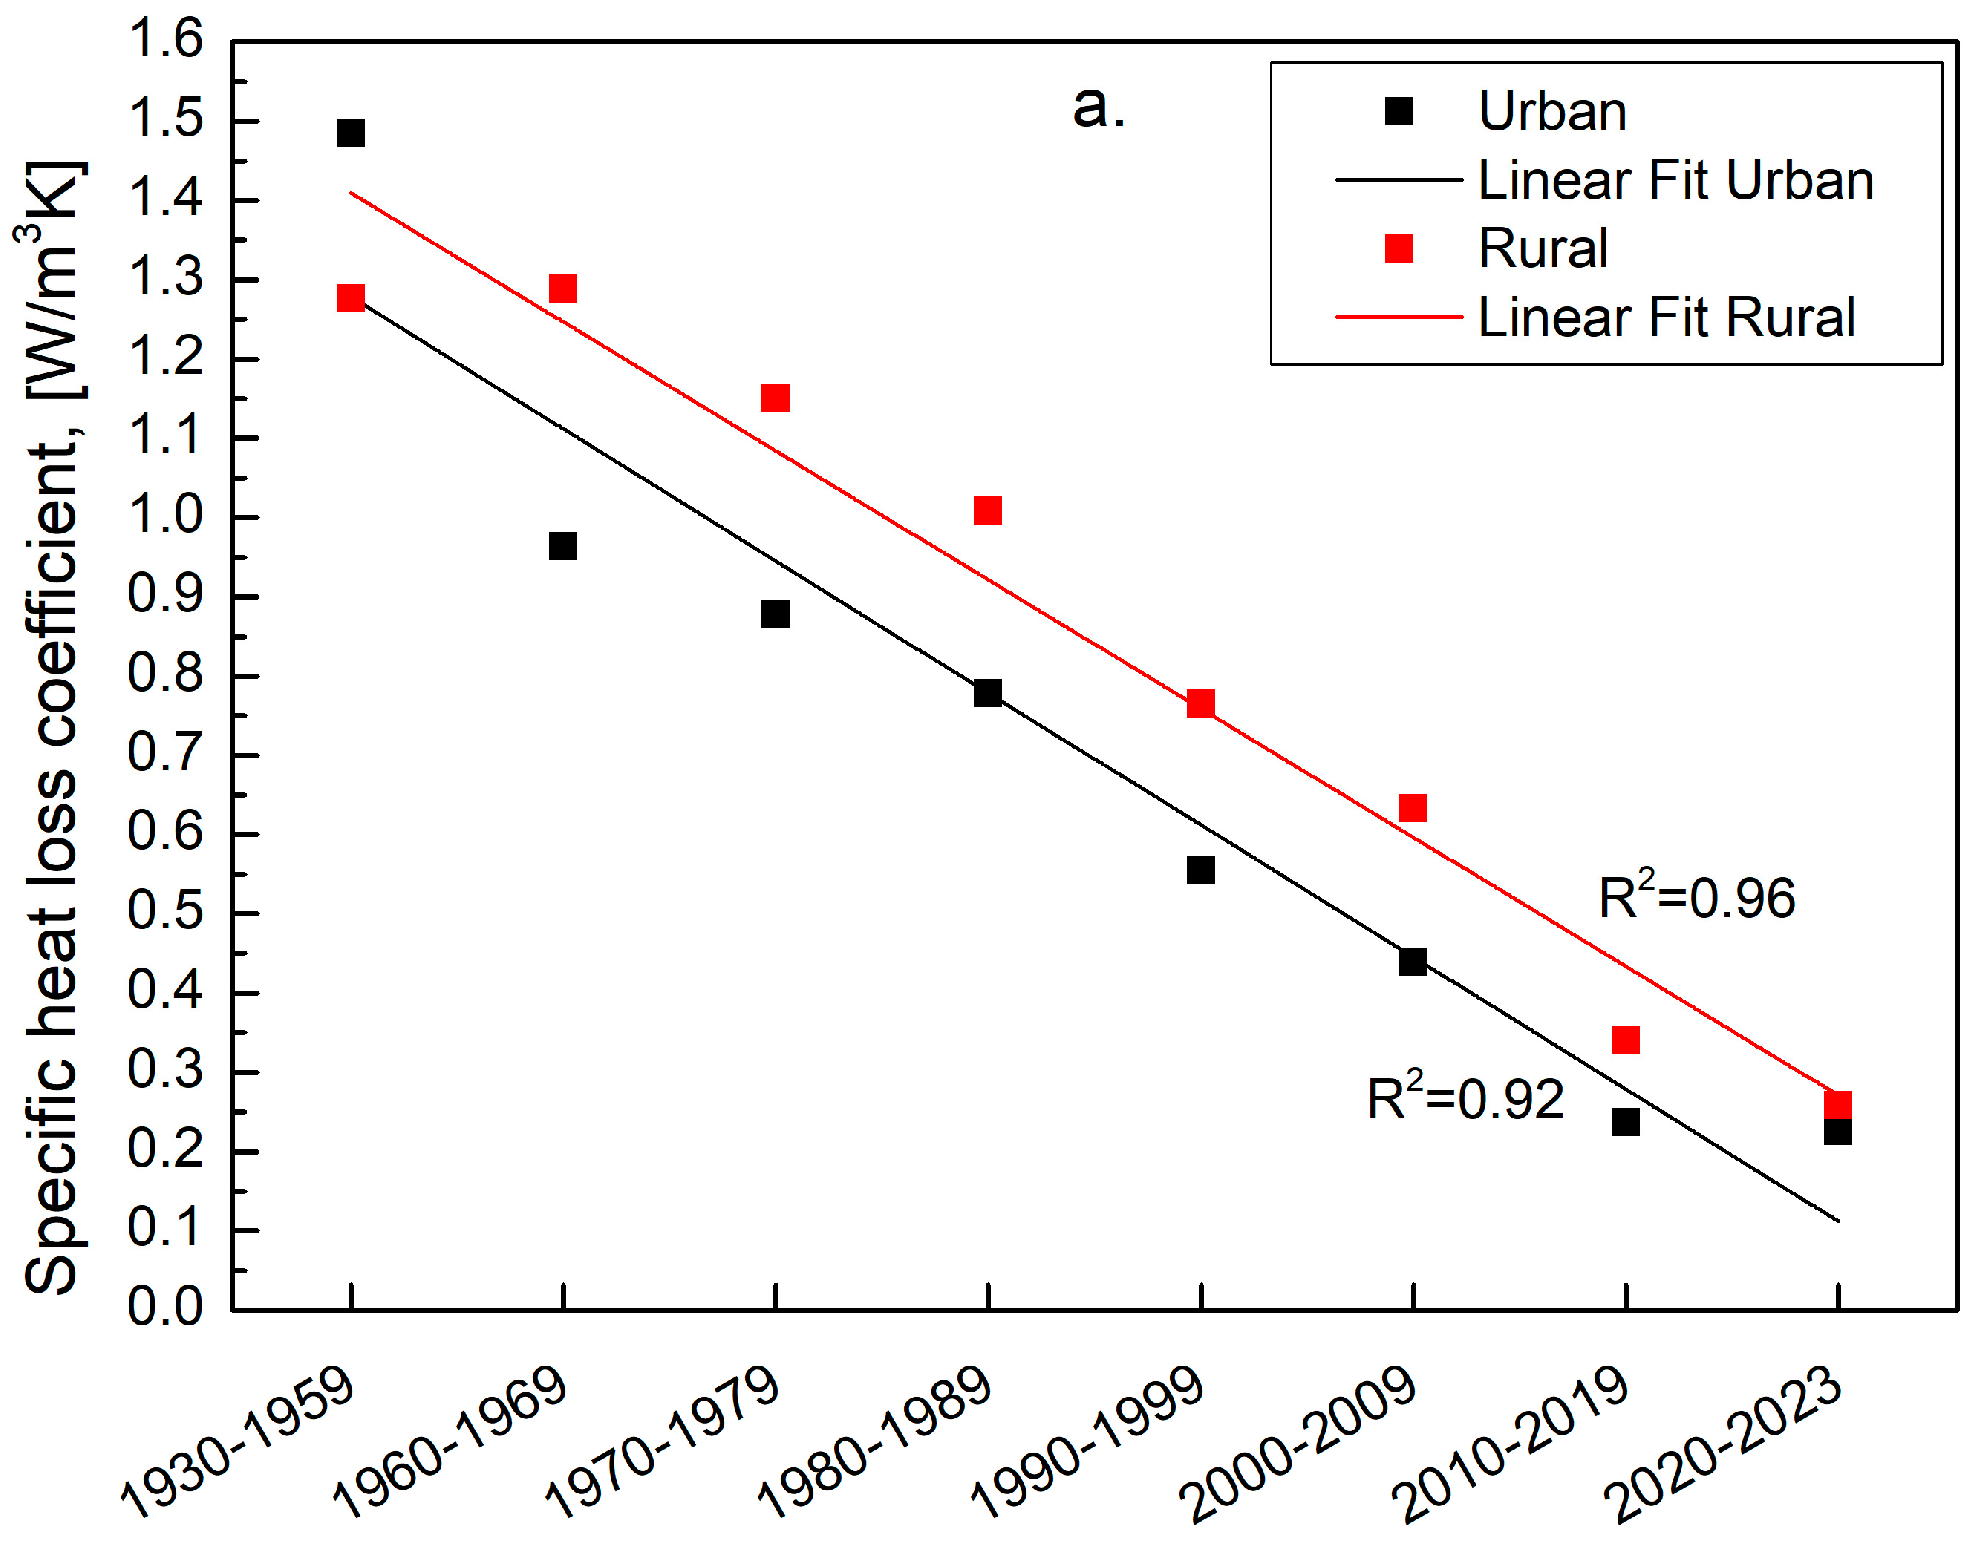
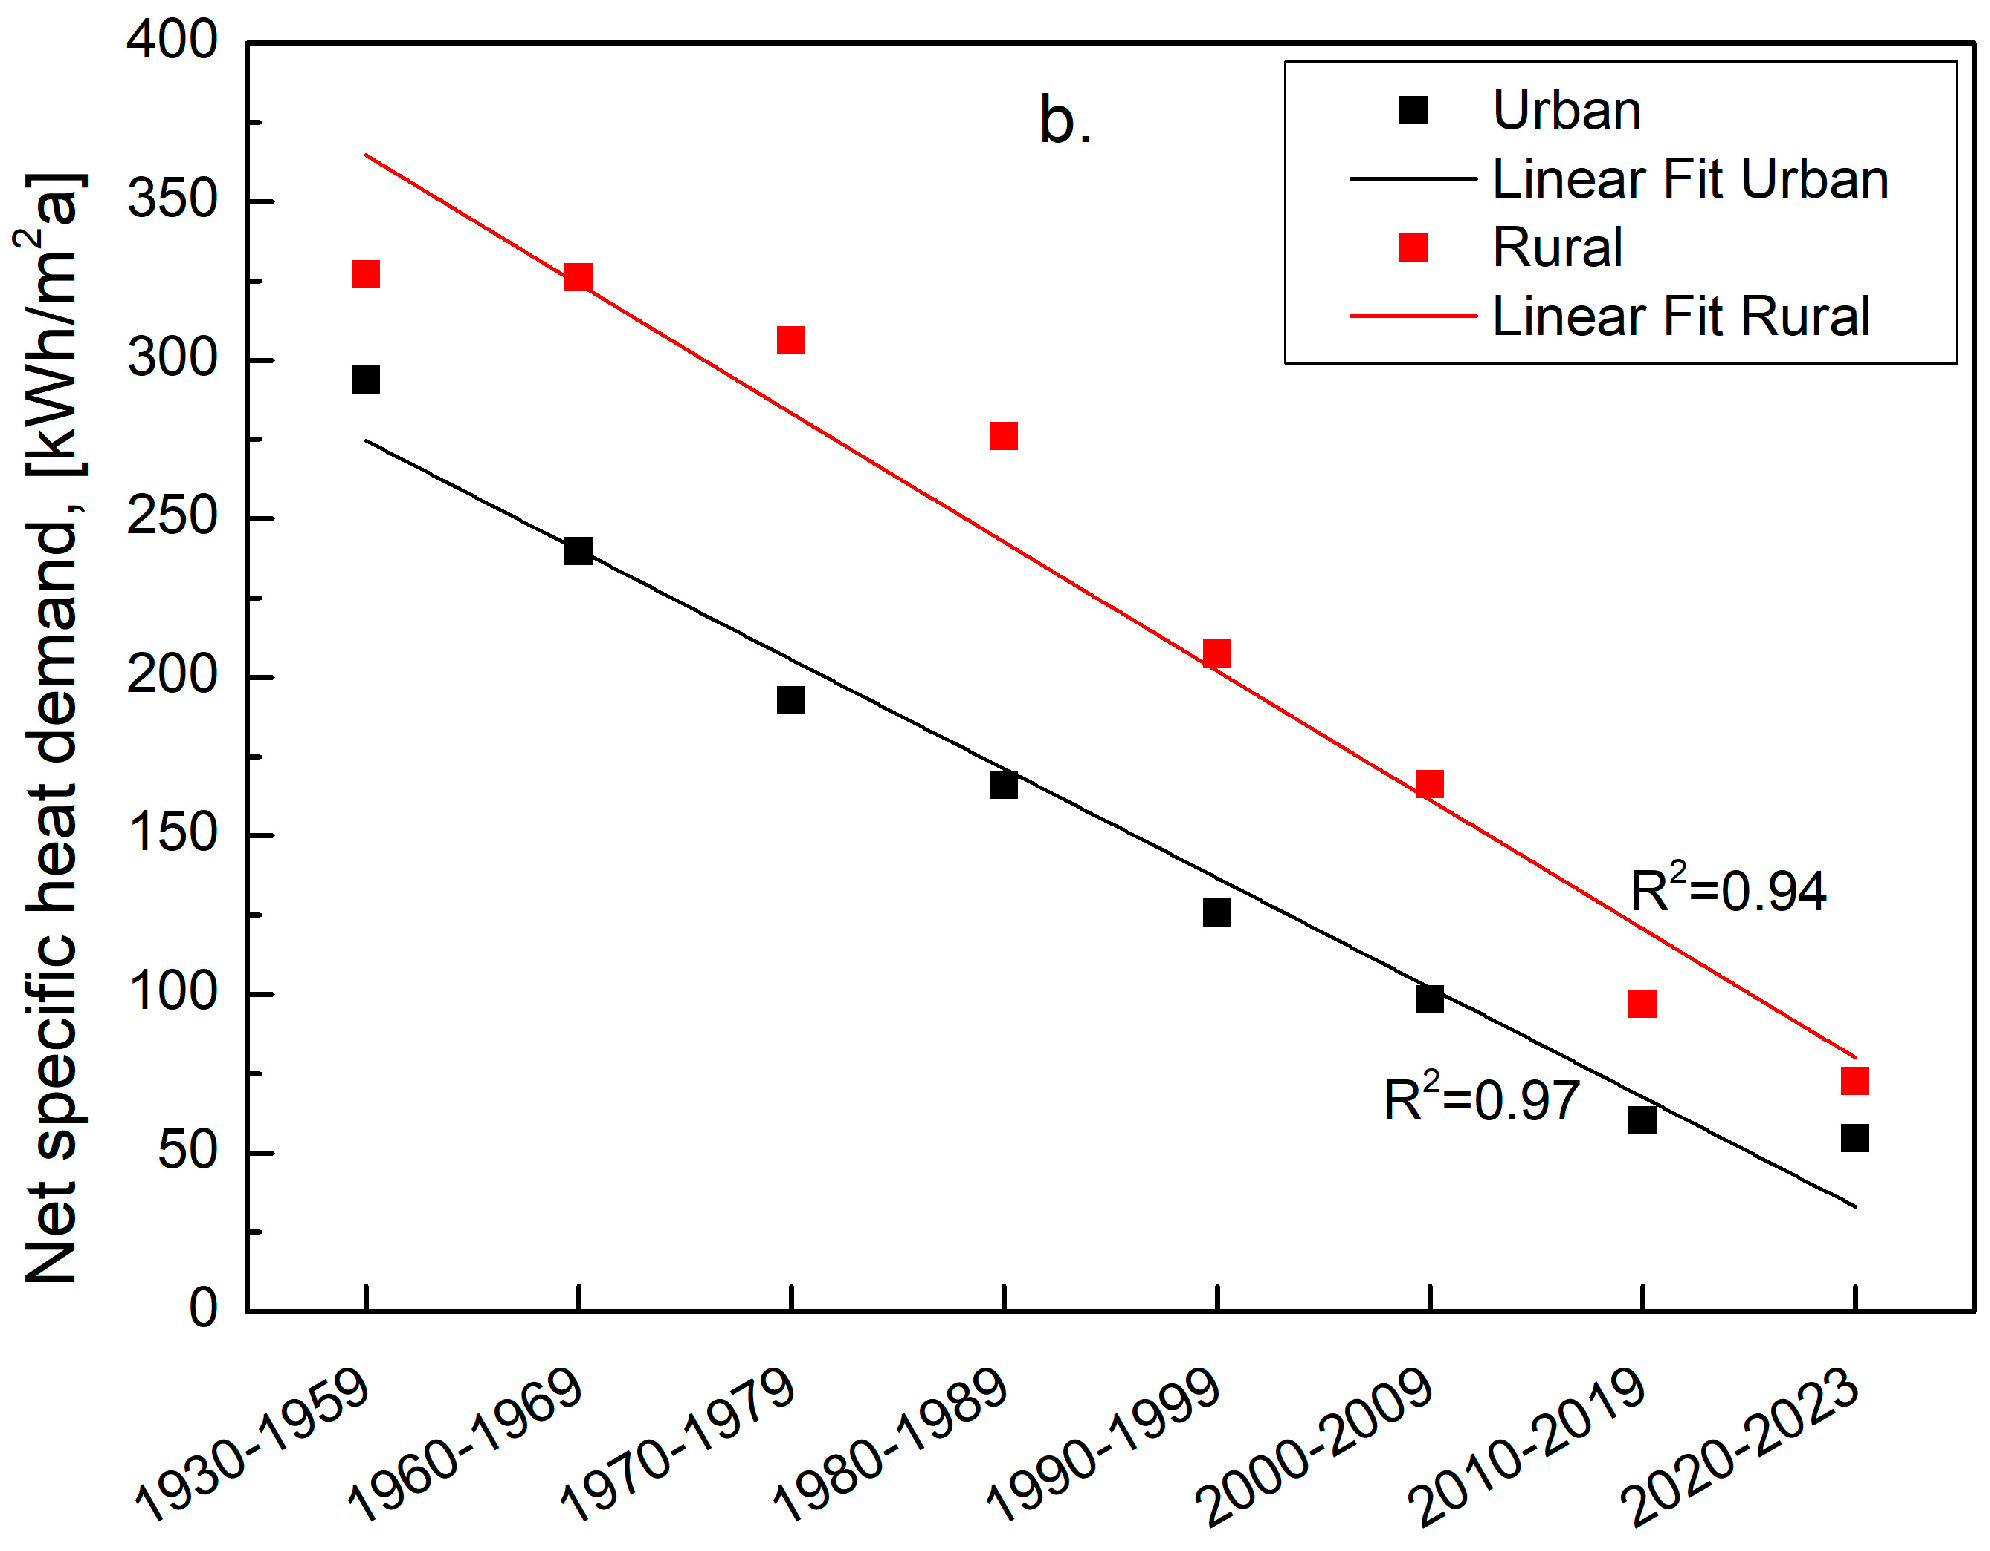
- Between 1930 and 2023, the specific heat loss coefficient was reduced by 6.7 times in urban buildings and by 4.9 times in rural buildings. For the net specific heat demand, a reduction of 5.4 for urban houses and 4.5 for rural houses is observed, respectively. The specific heat loss coefficient and net specific heat demand exhibit similar trends in both urban and rural single-family houses. However, these parameters are significantly higher in rural buildings.
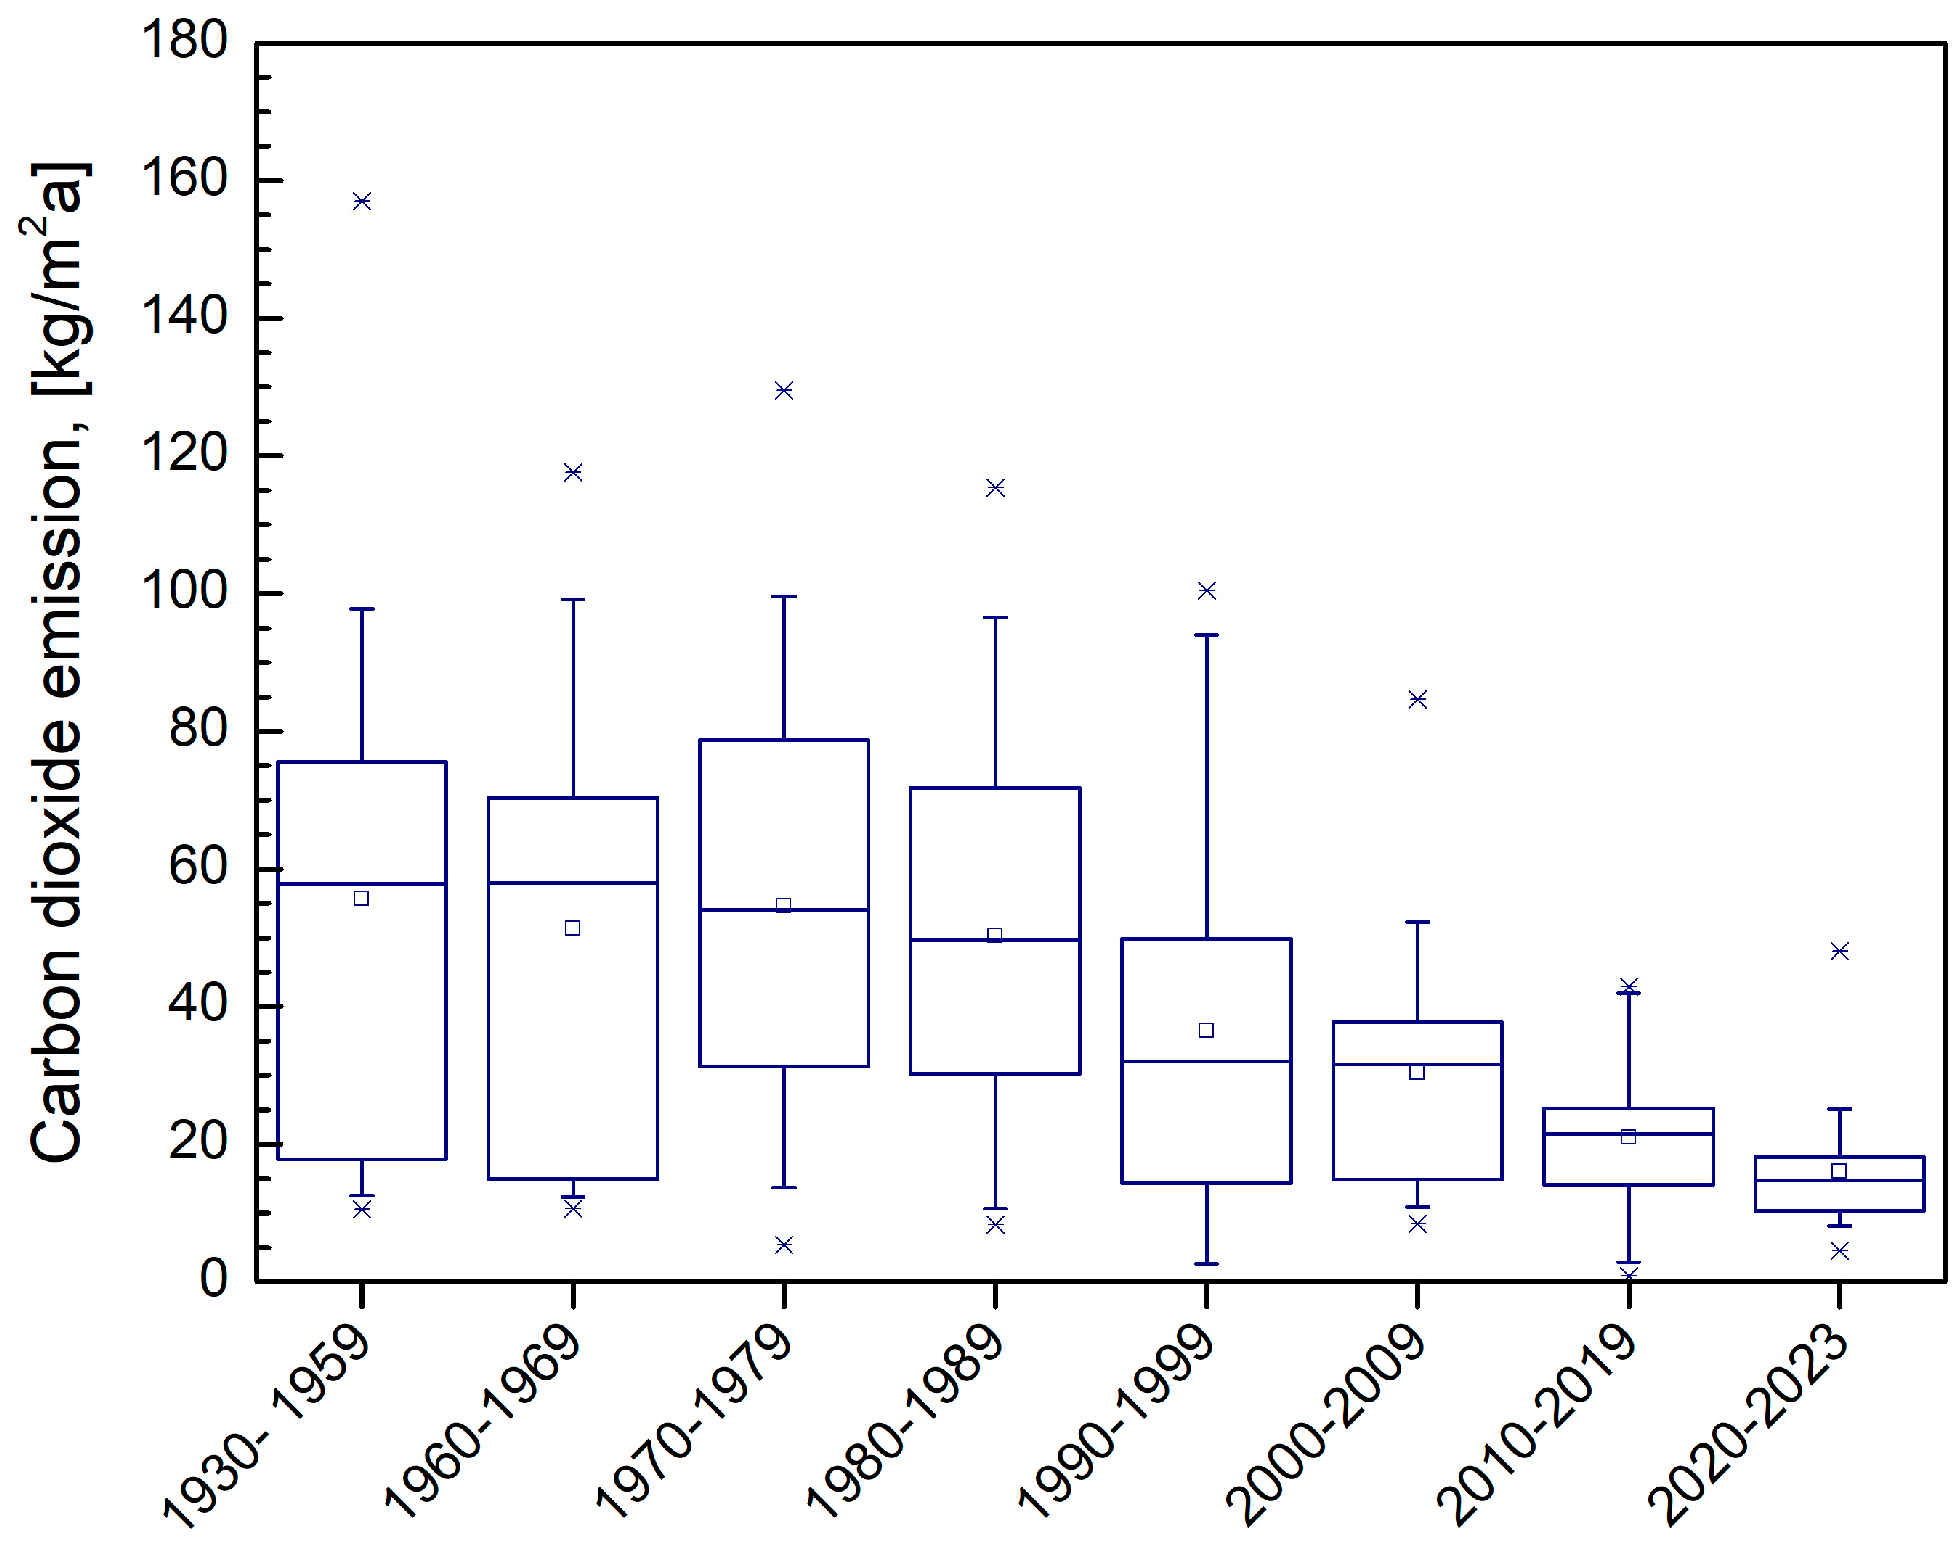
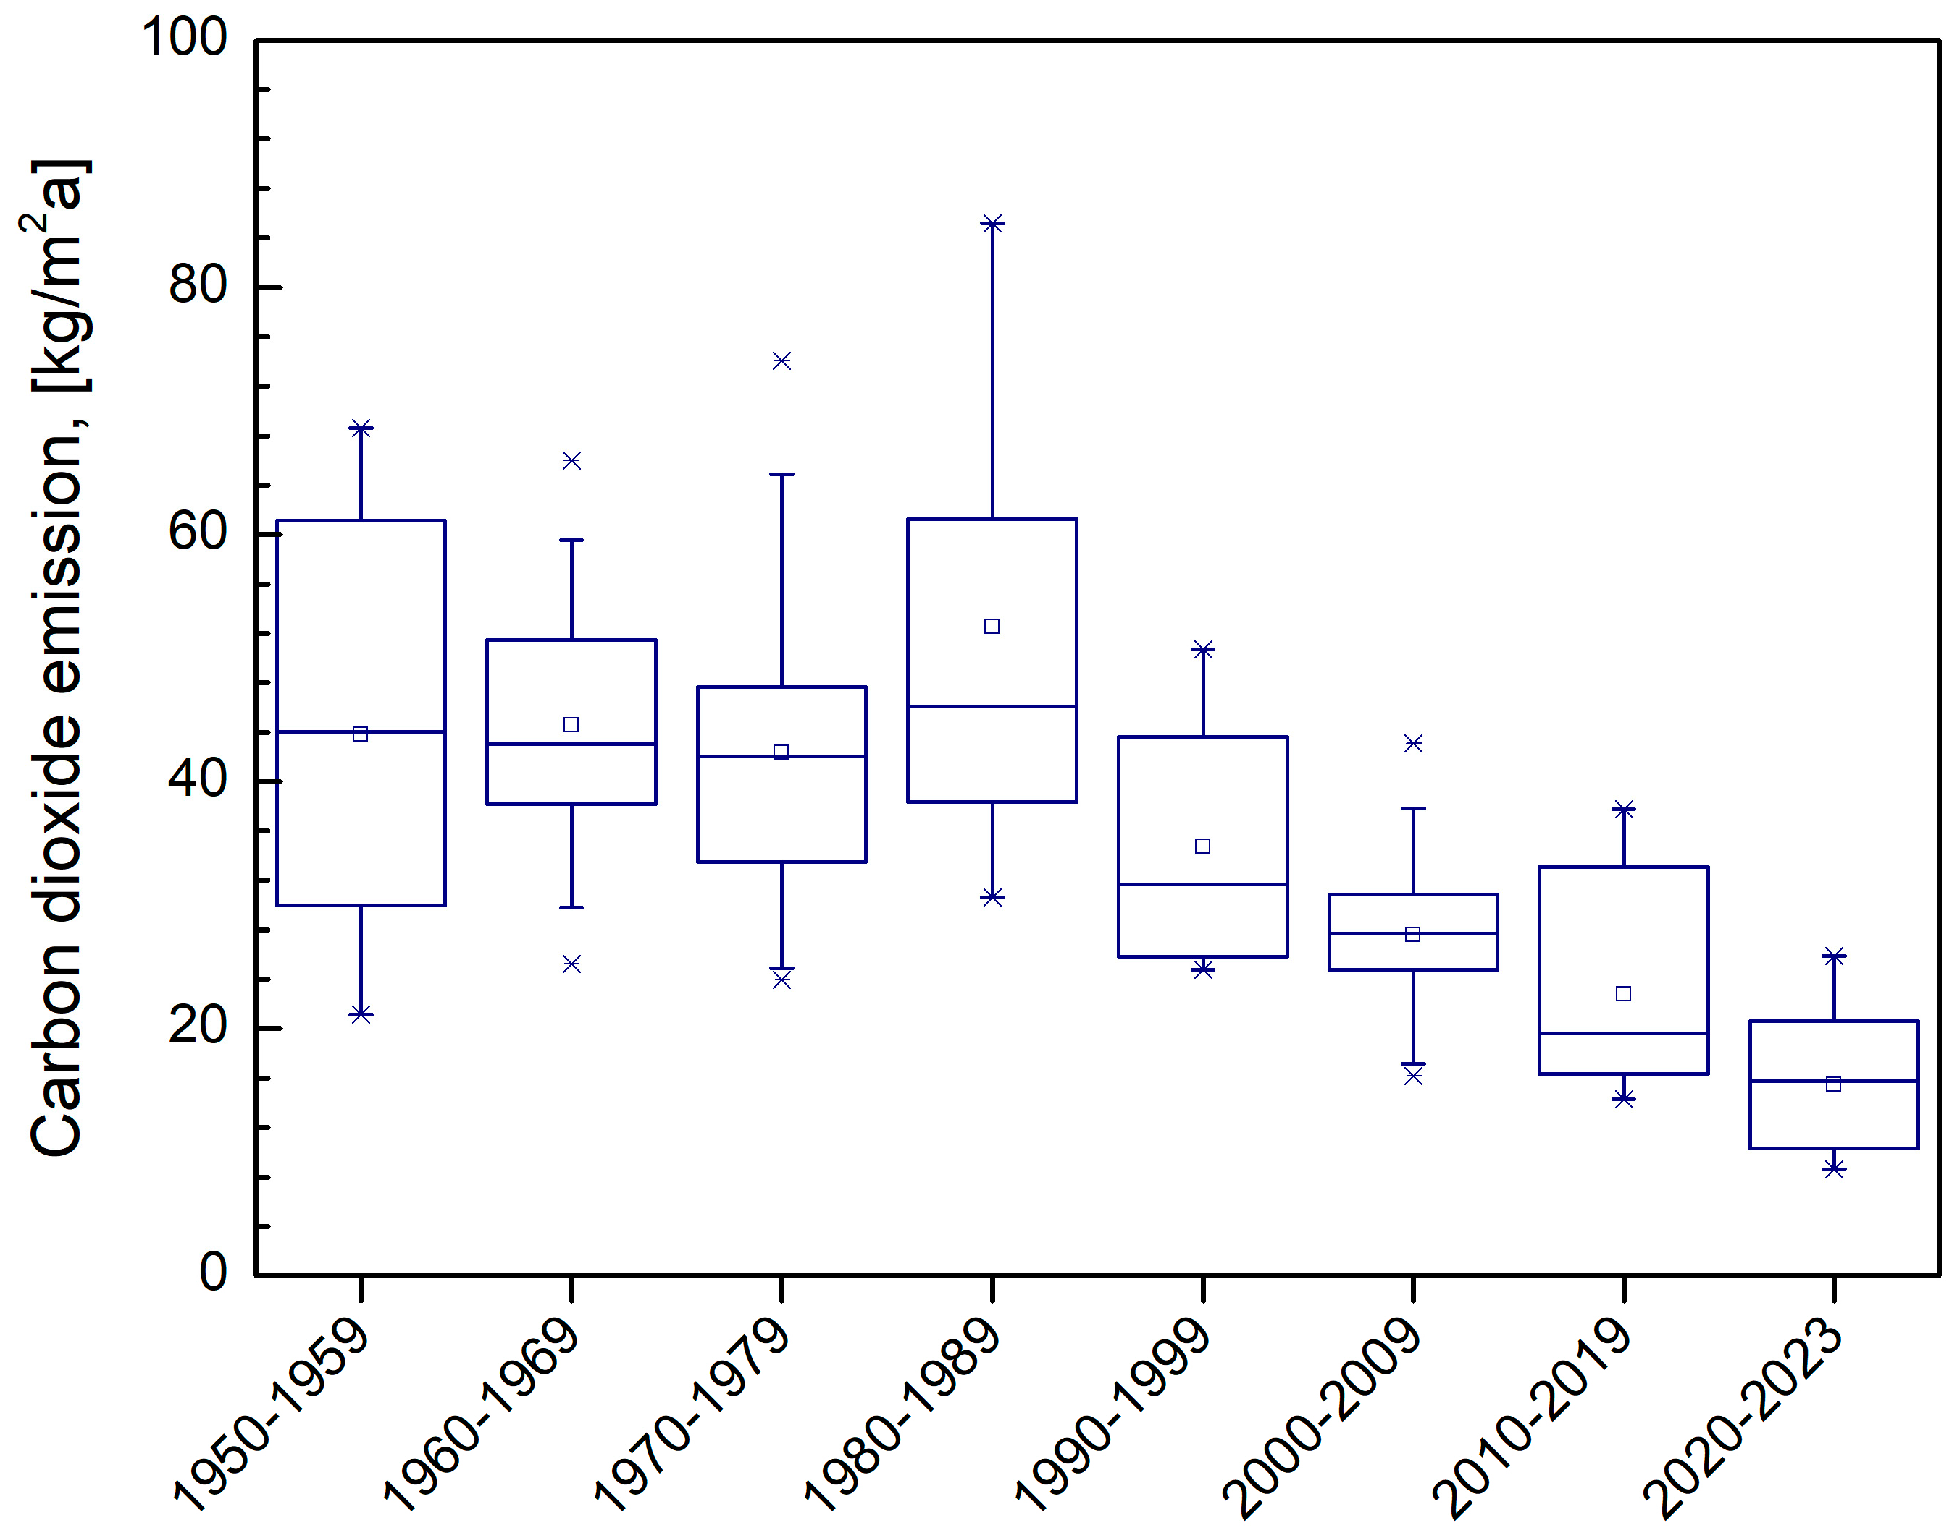
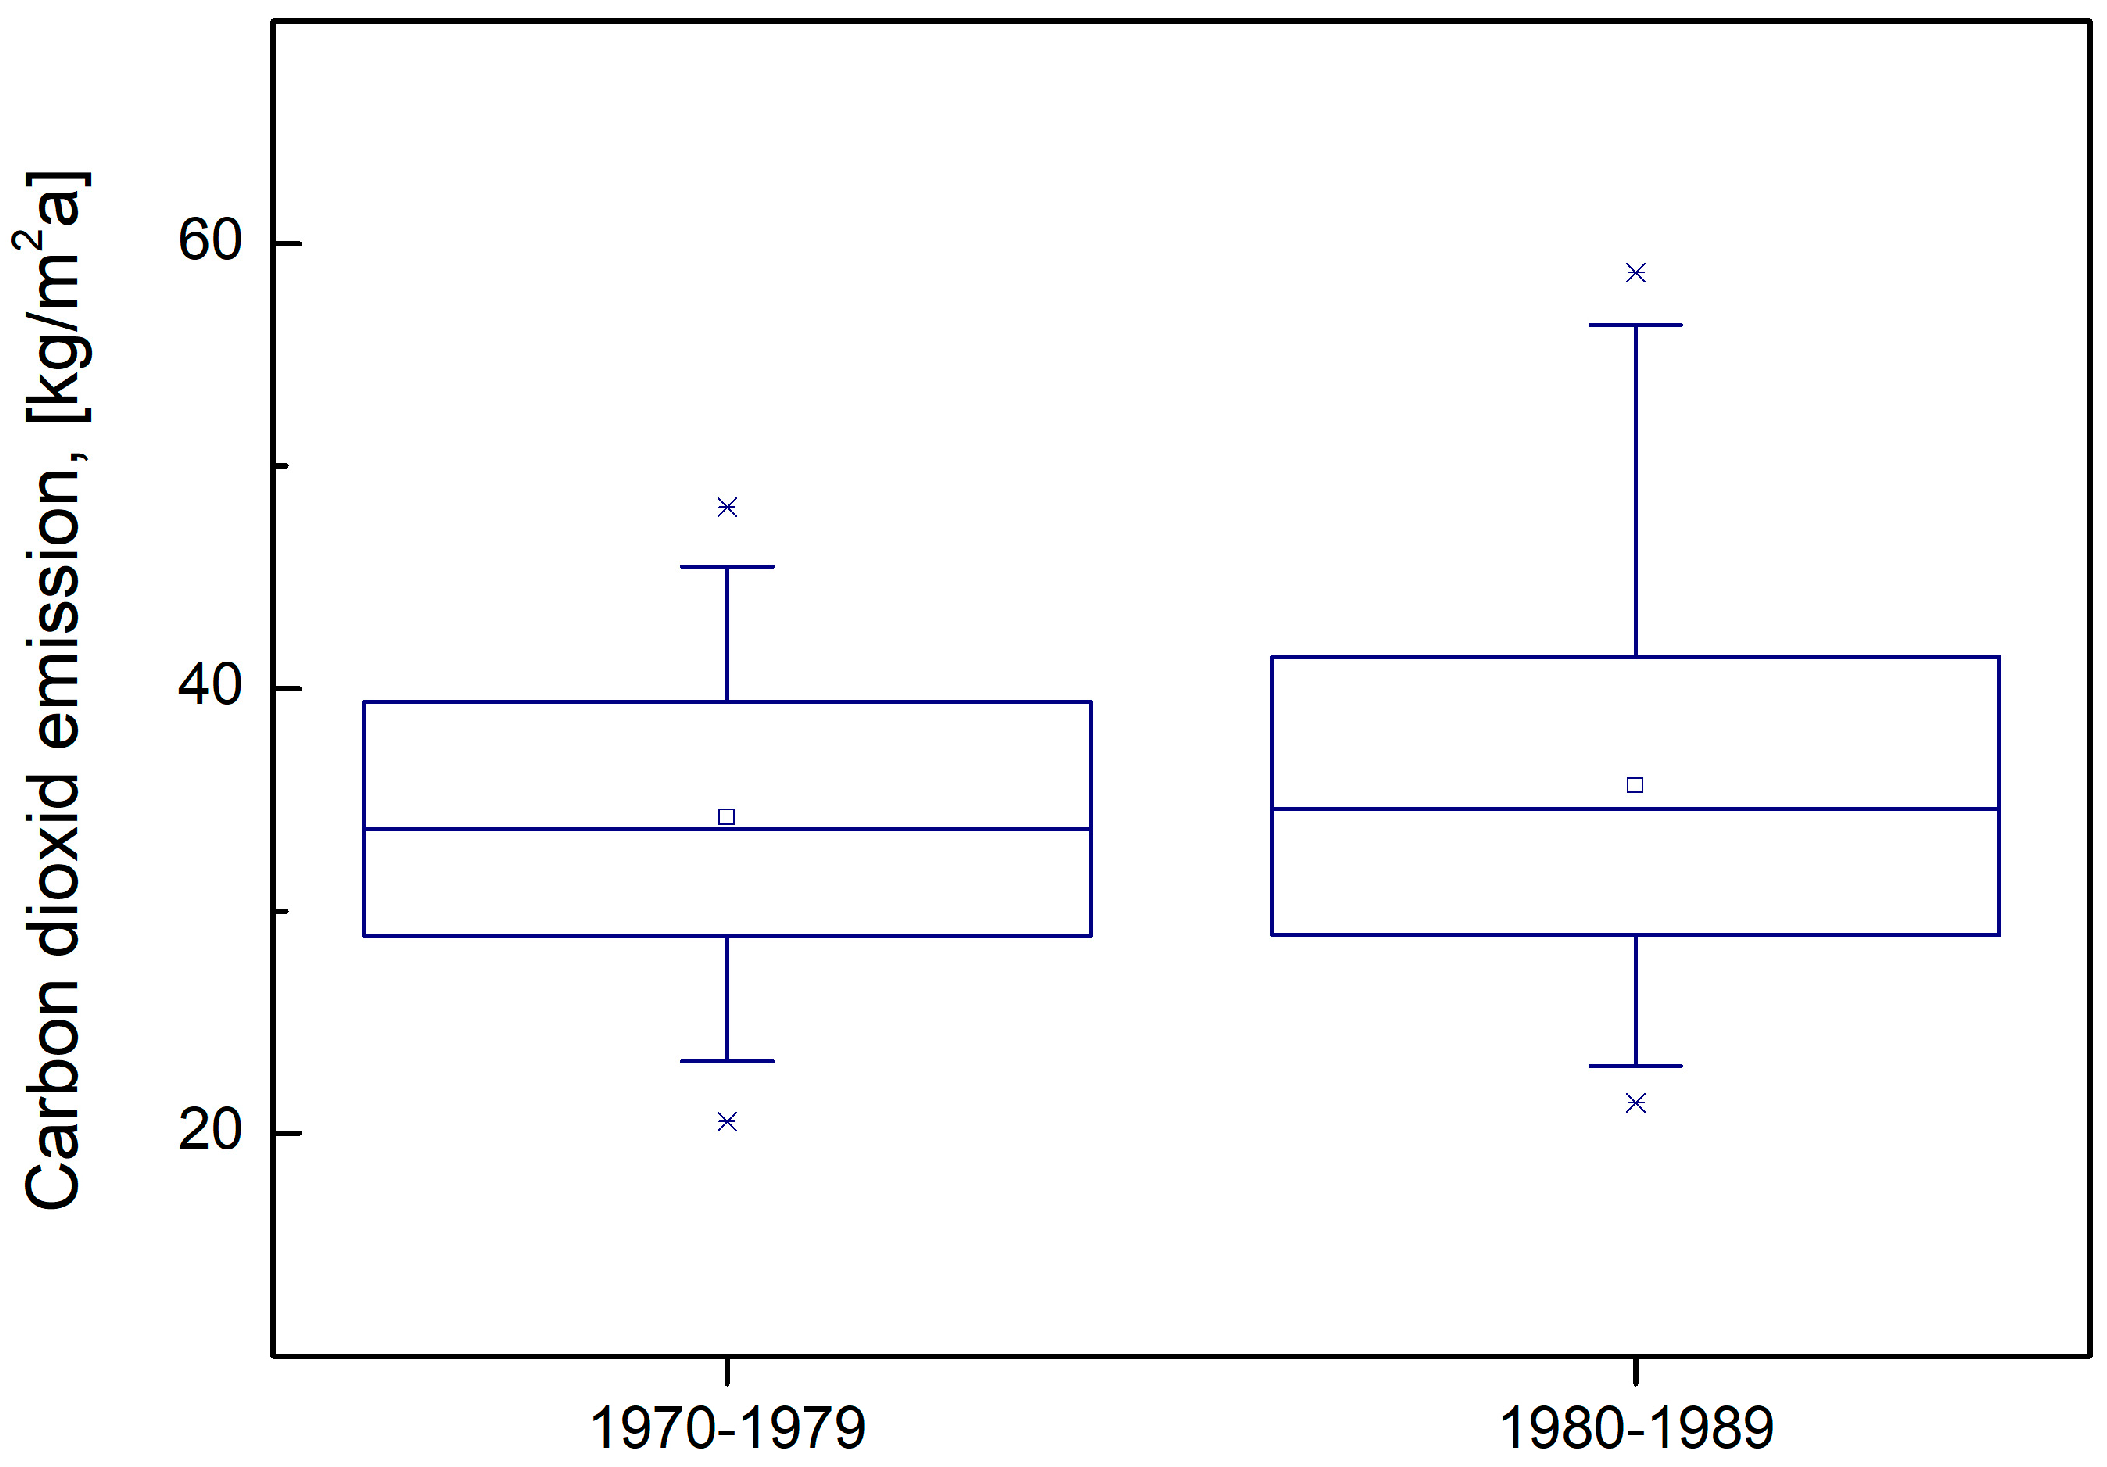
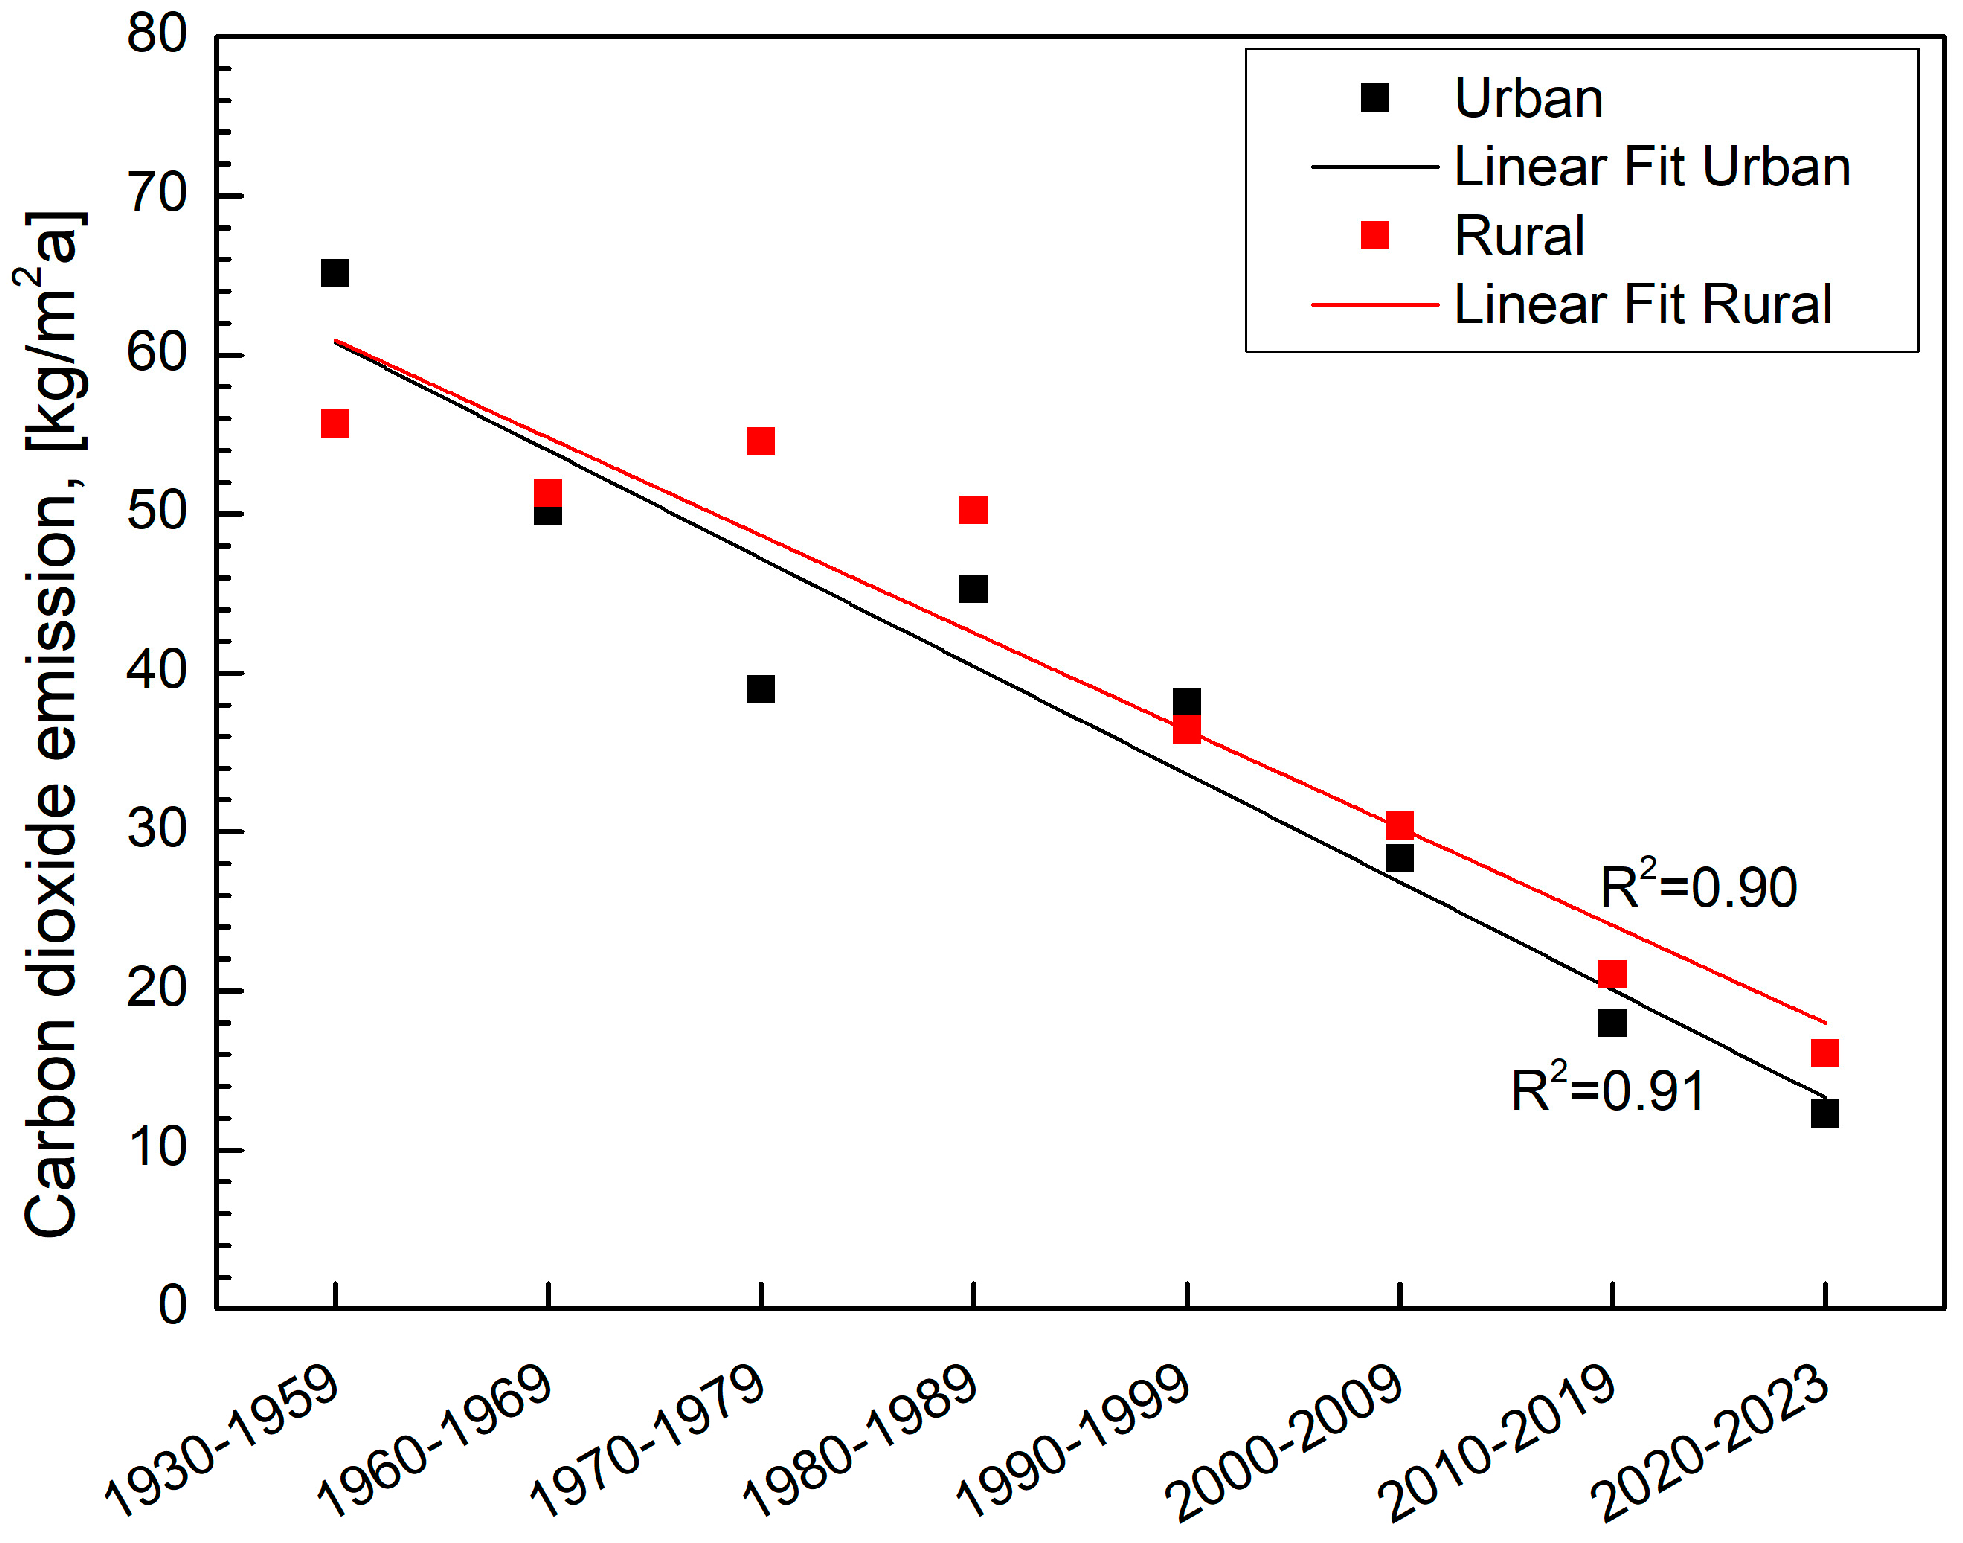
- The specific CO2 emissions show a reduction of 5.3 times in urban houses and 3.5 times in rural houses. At a p = 0.05 level, no significant differences can be observed between urban and rural single-family houses.
- It can be stated that urban buildings have significantly better thermal properties, though the differences in CO2 emissions are not significant. The reason for this lies in the heat carriers used. In old rural buildings, biomass and wood are predominantly used, while natural gas is used in old urban buildings. In new buildings, there are no significant differences between the heat sources; however, wood and biomass are still utilised in rural houses, while rarely utilised in urban houses. Heat pumps are widely used in both regions.
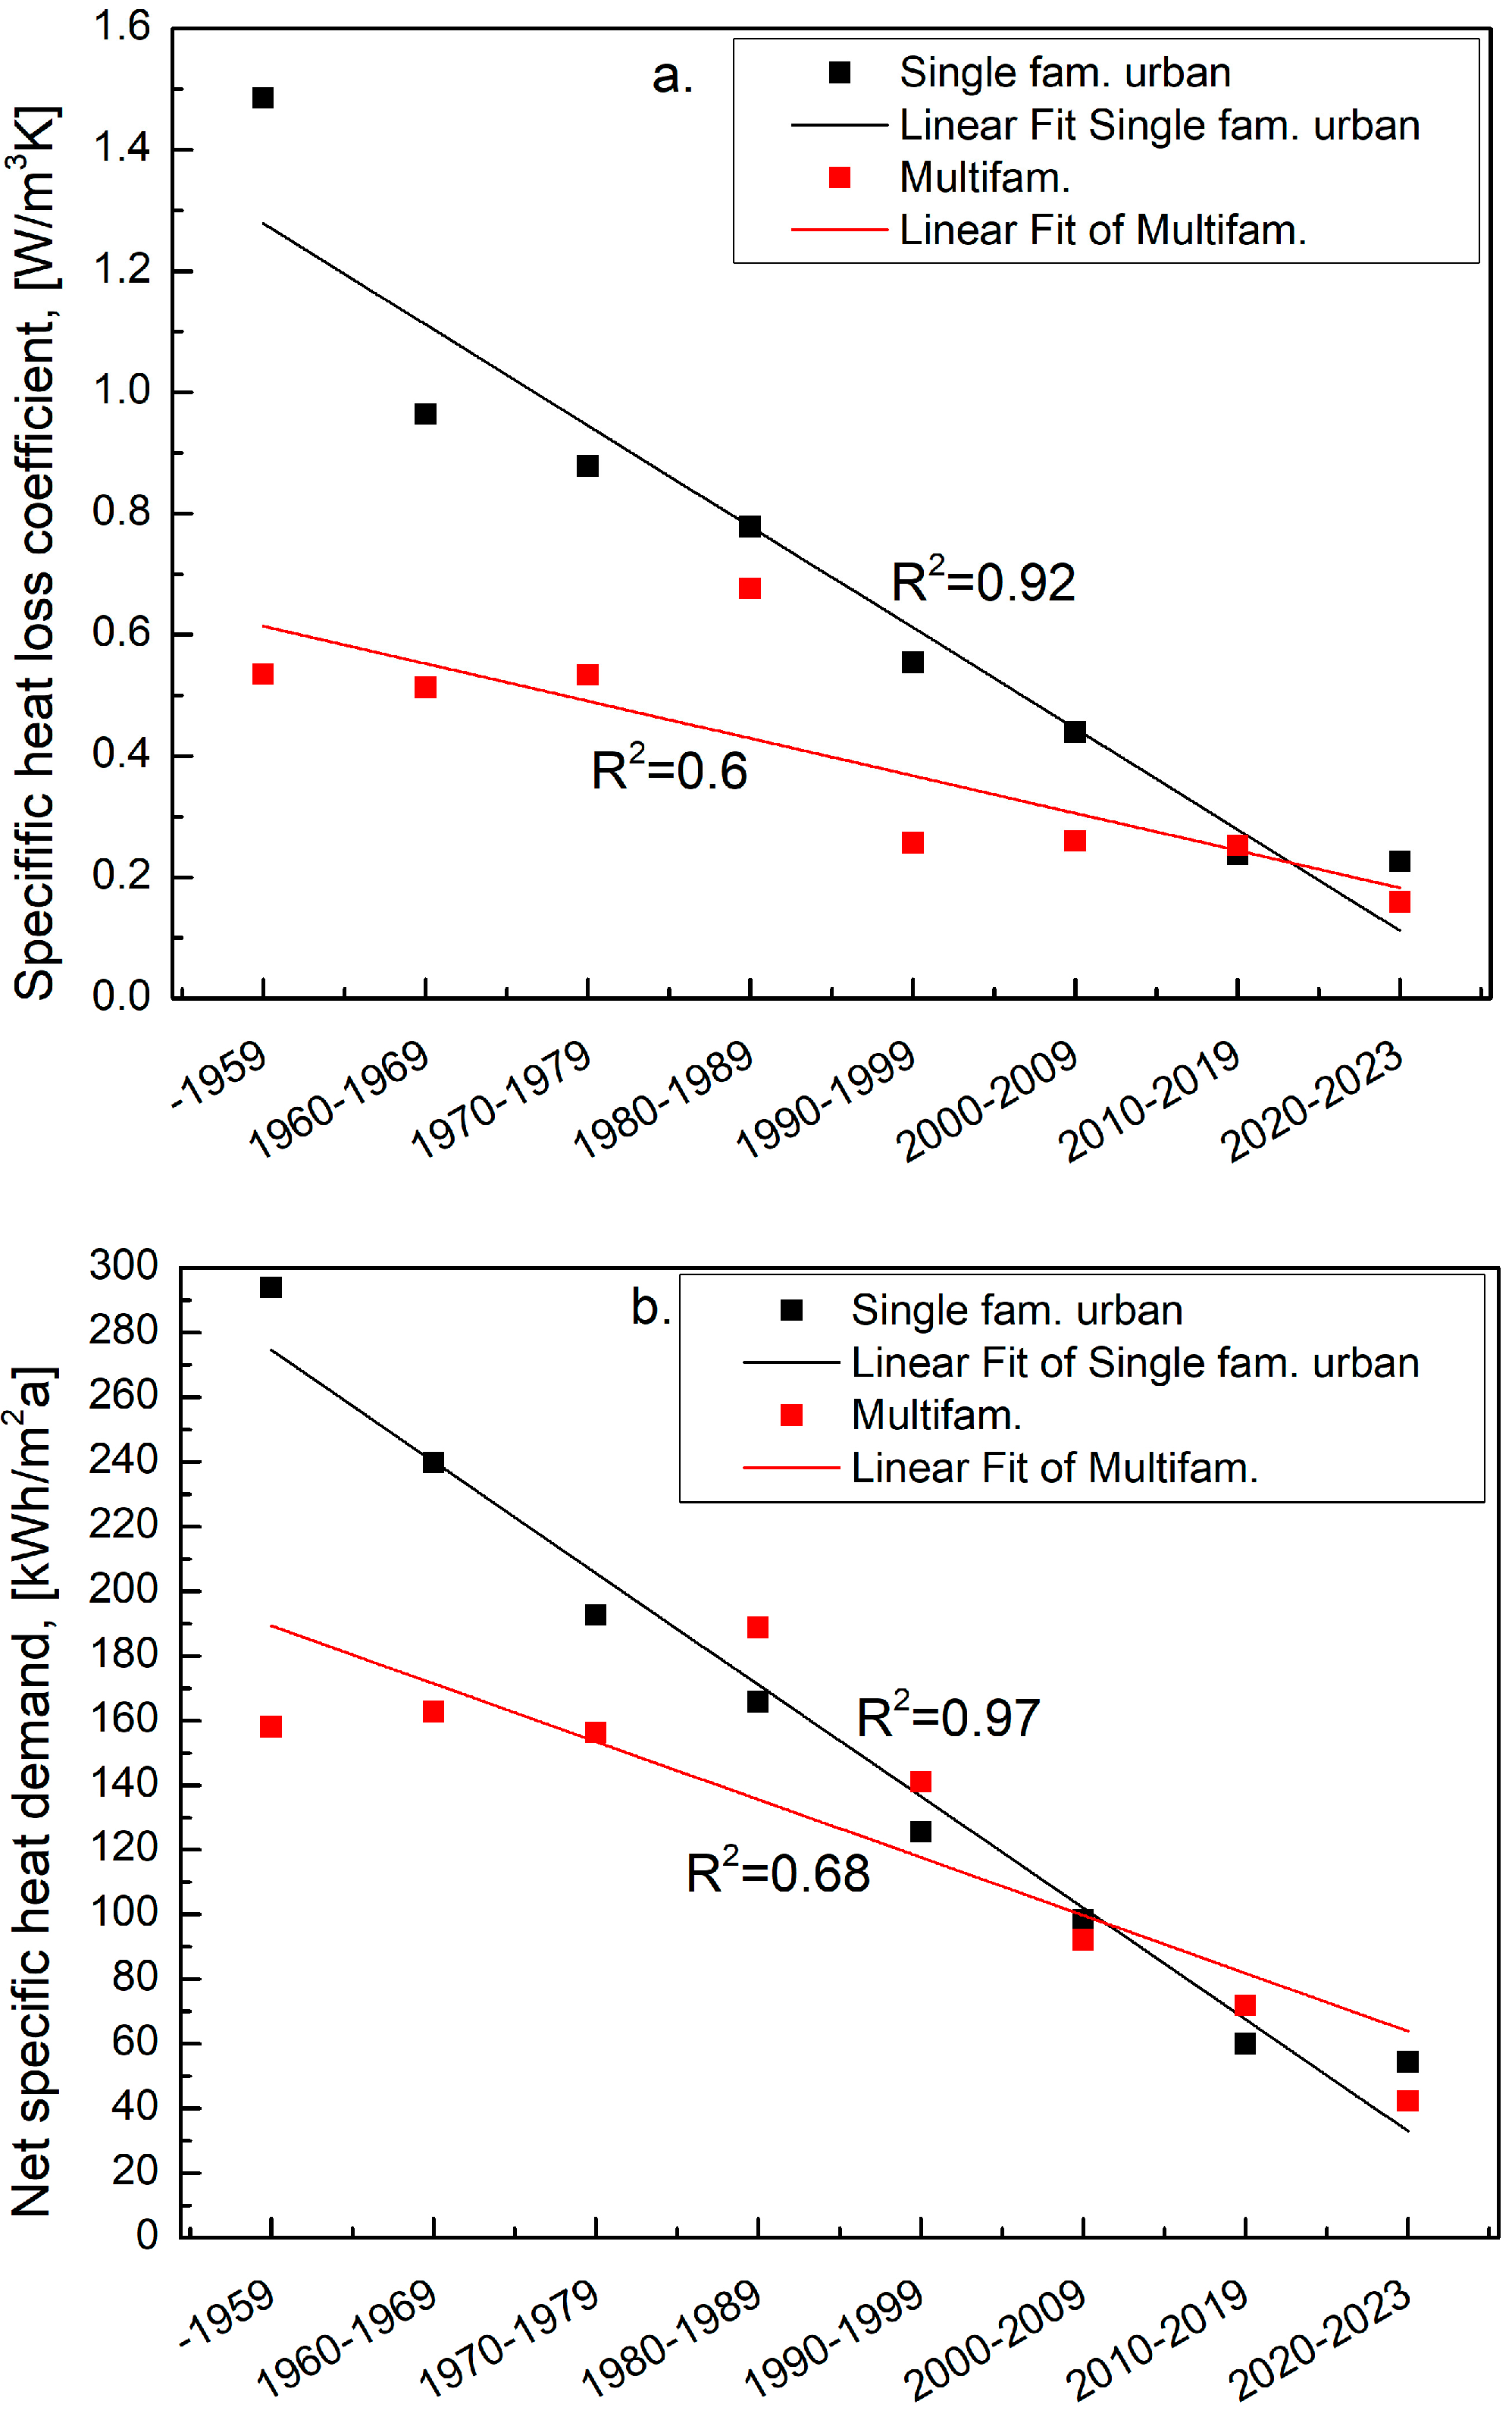
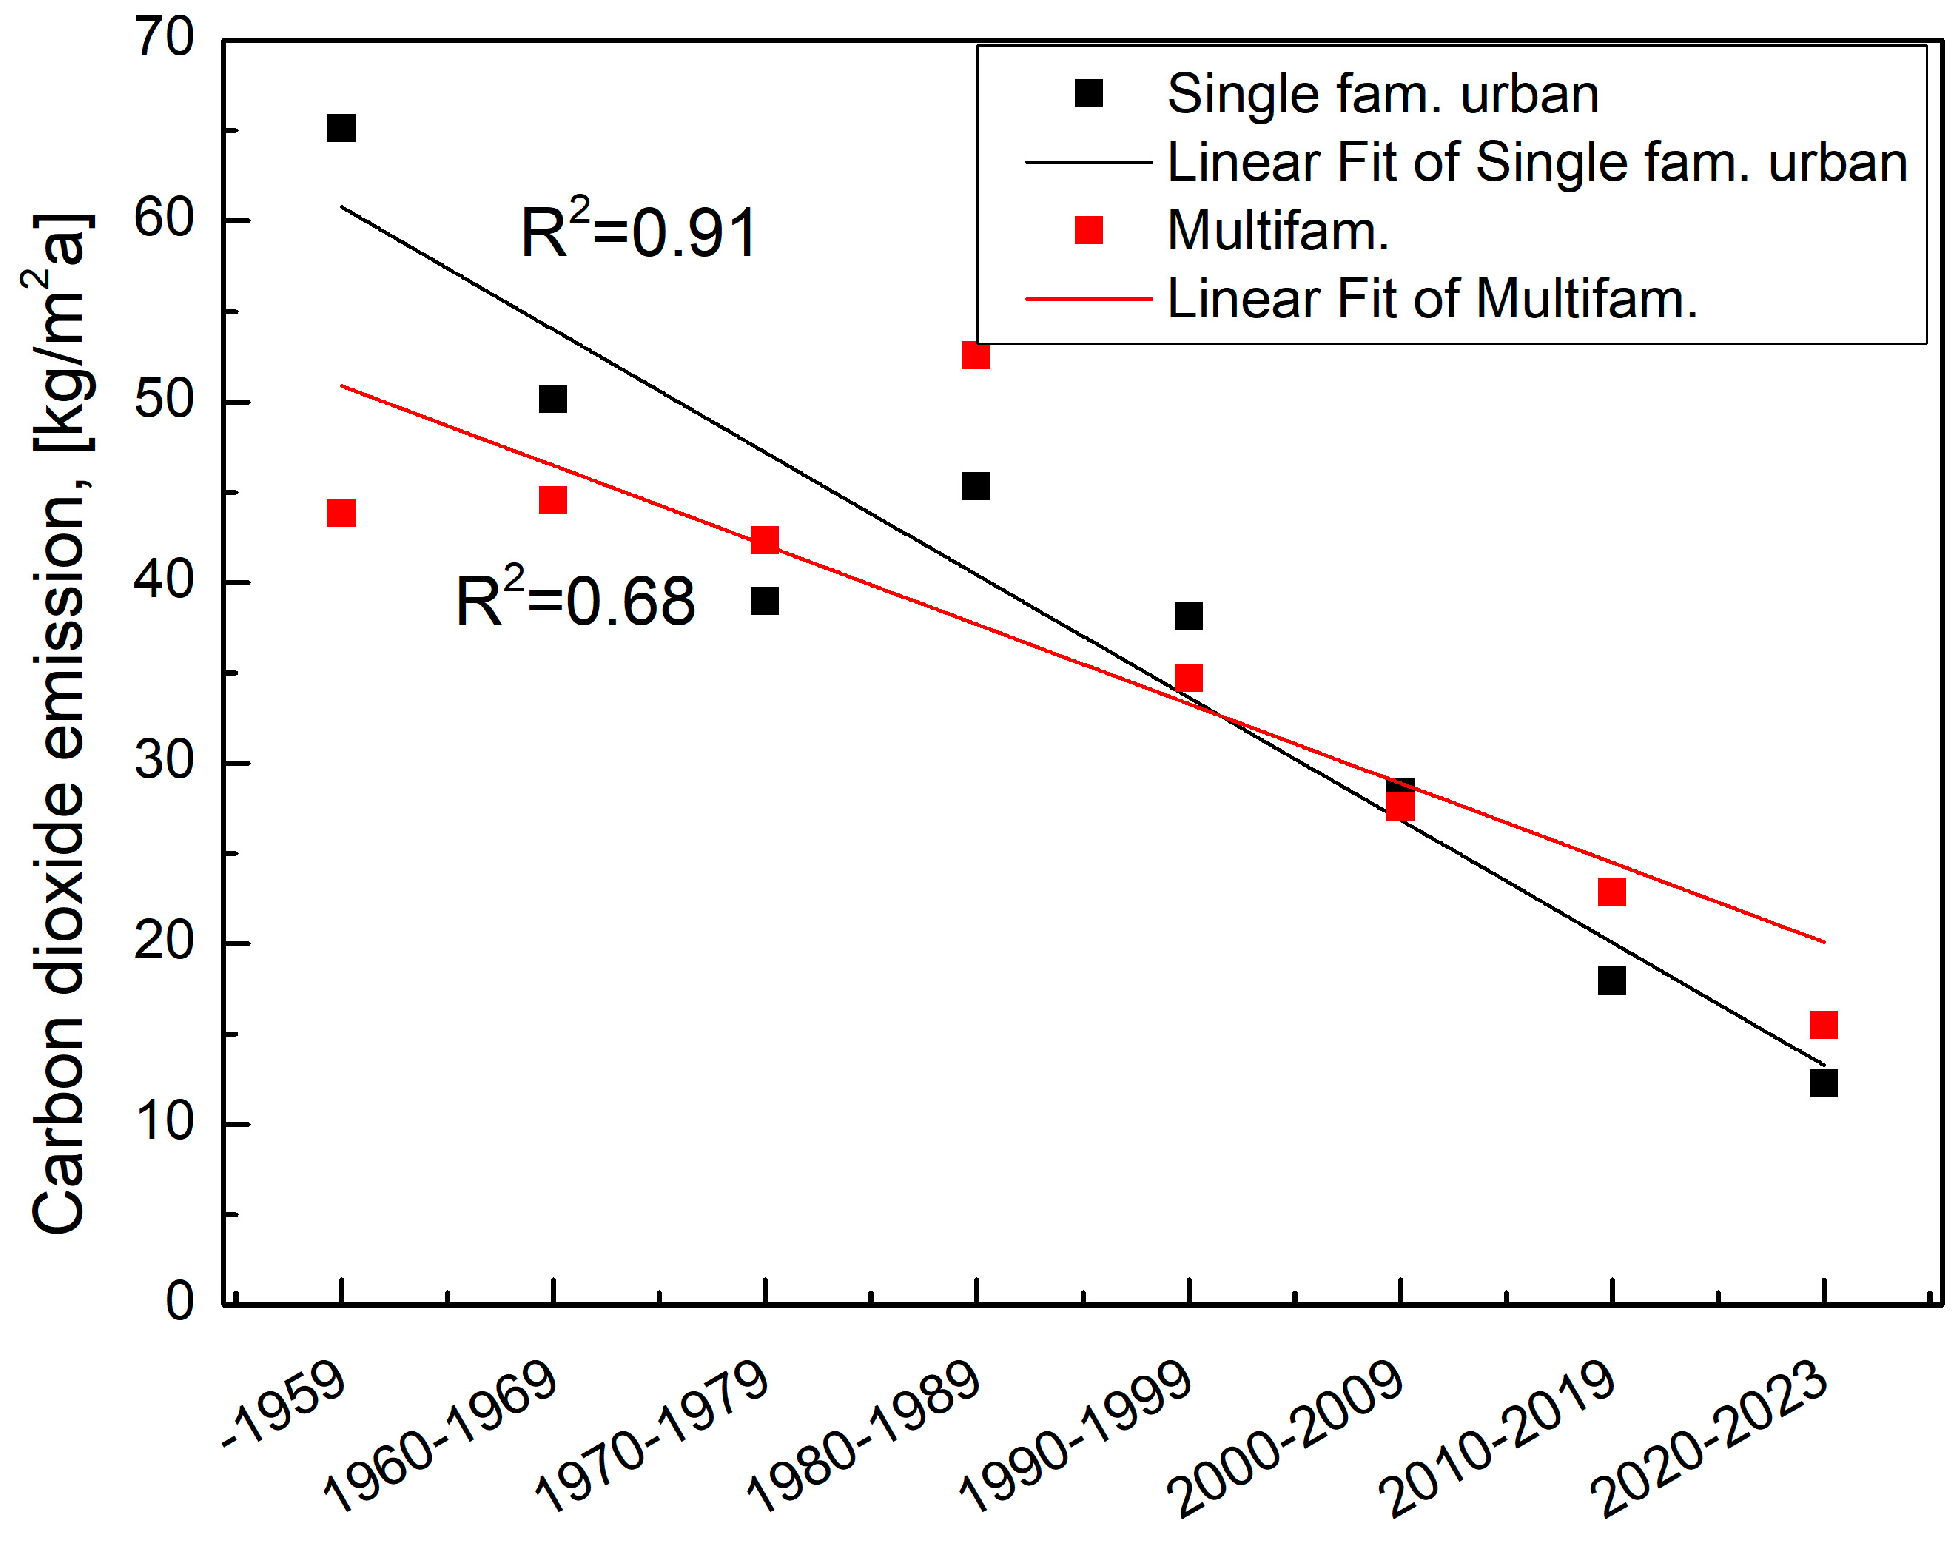
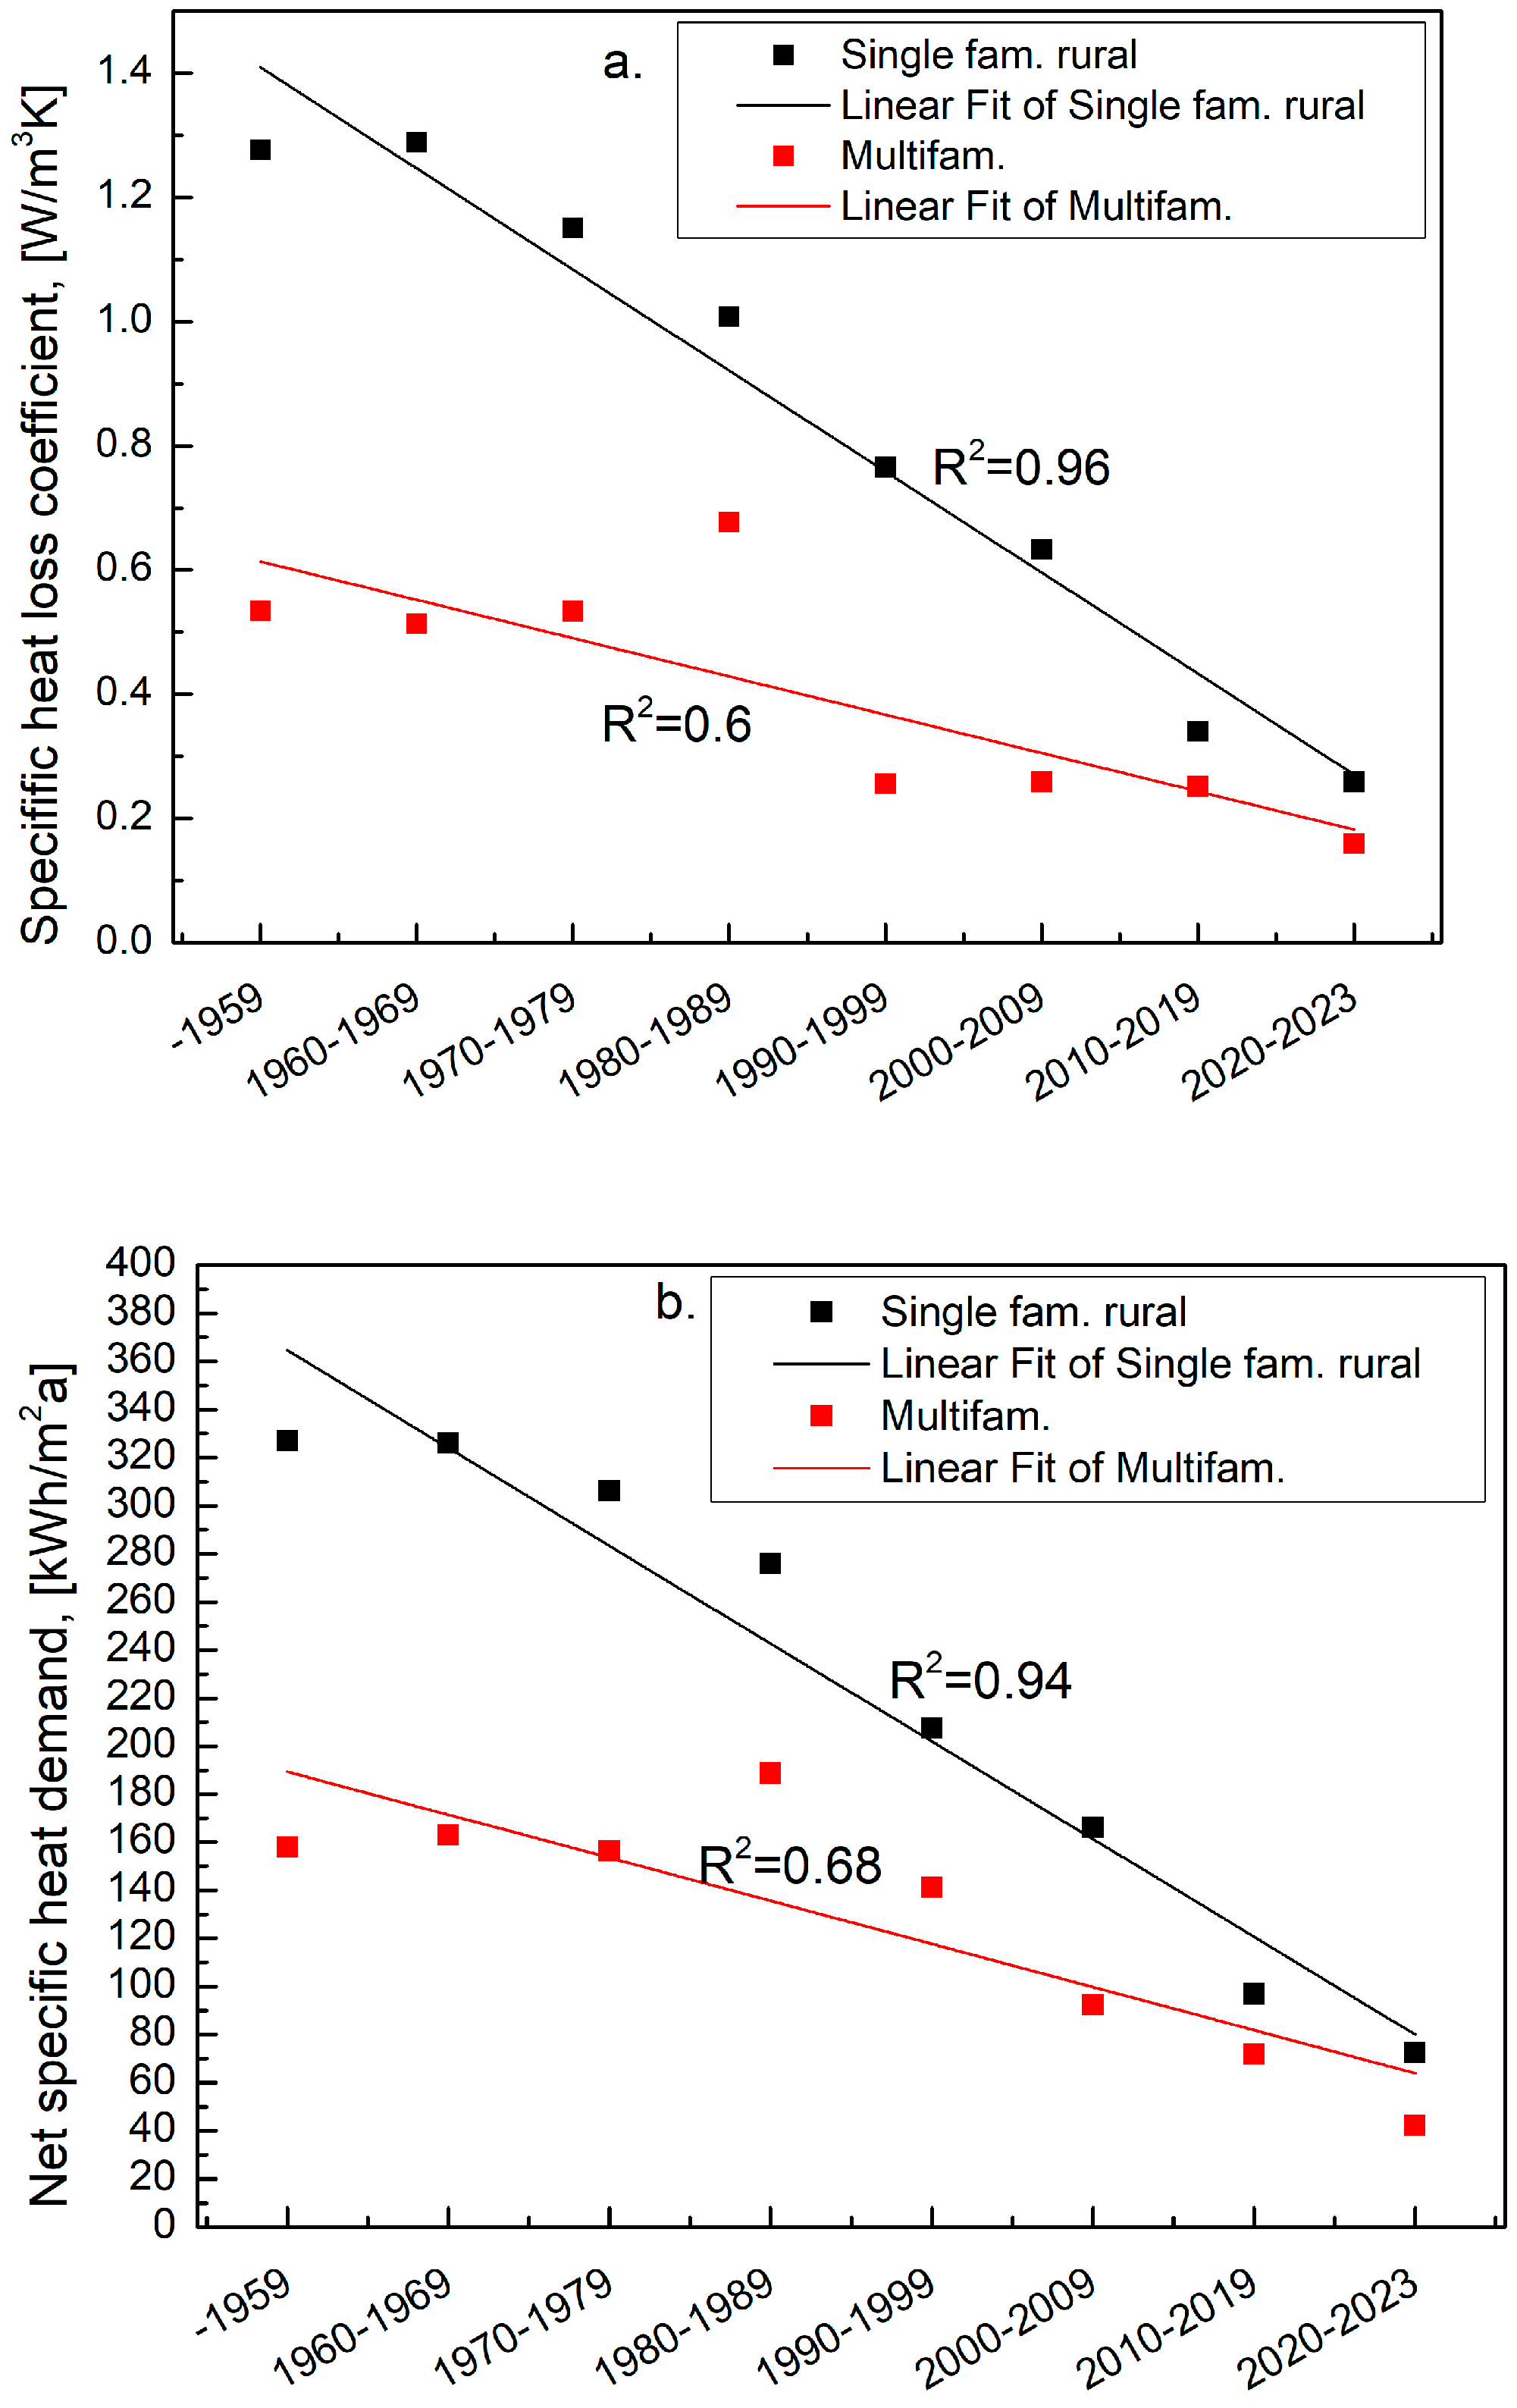
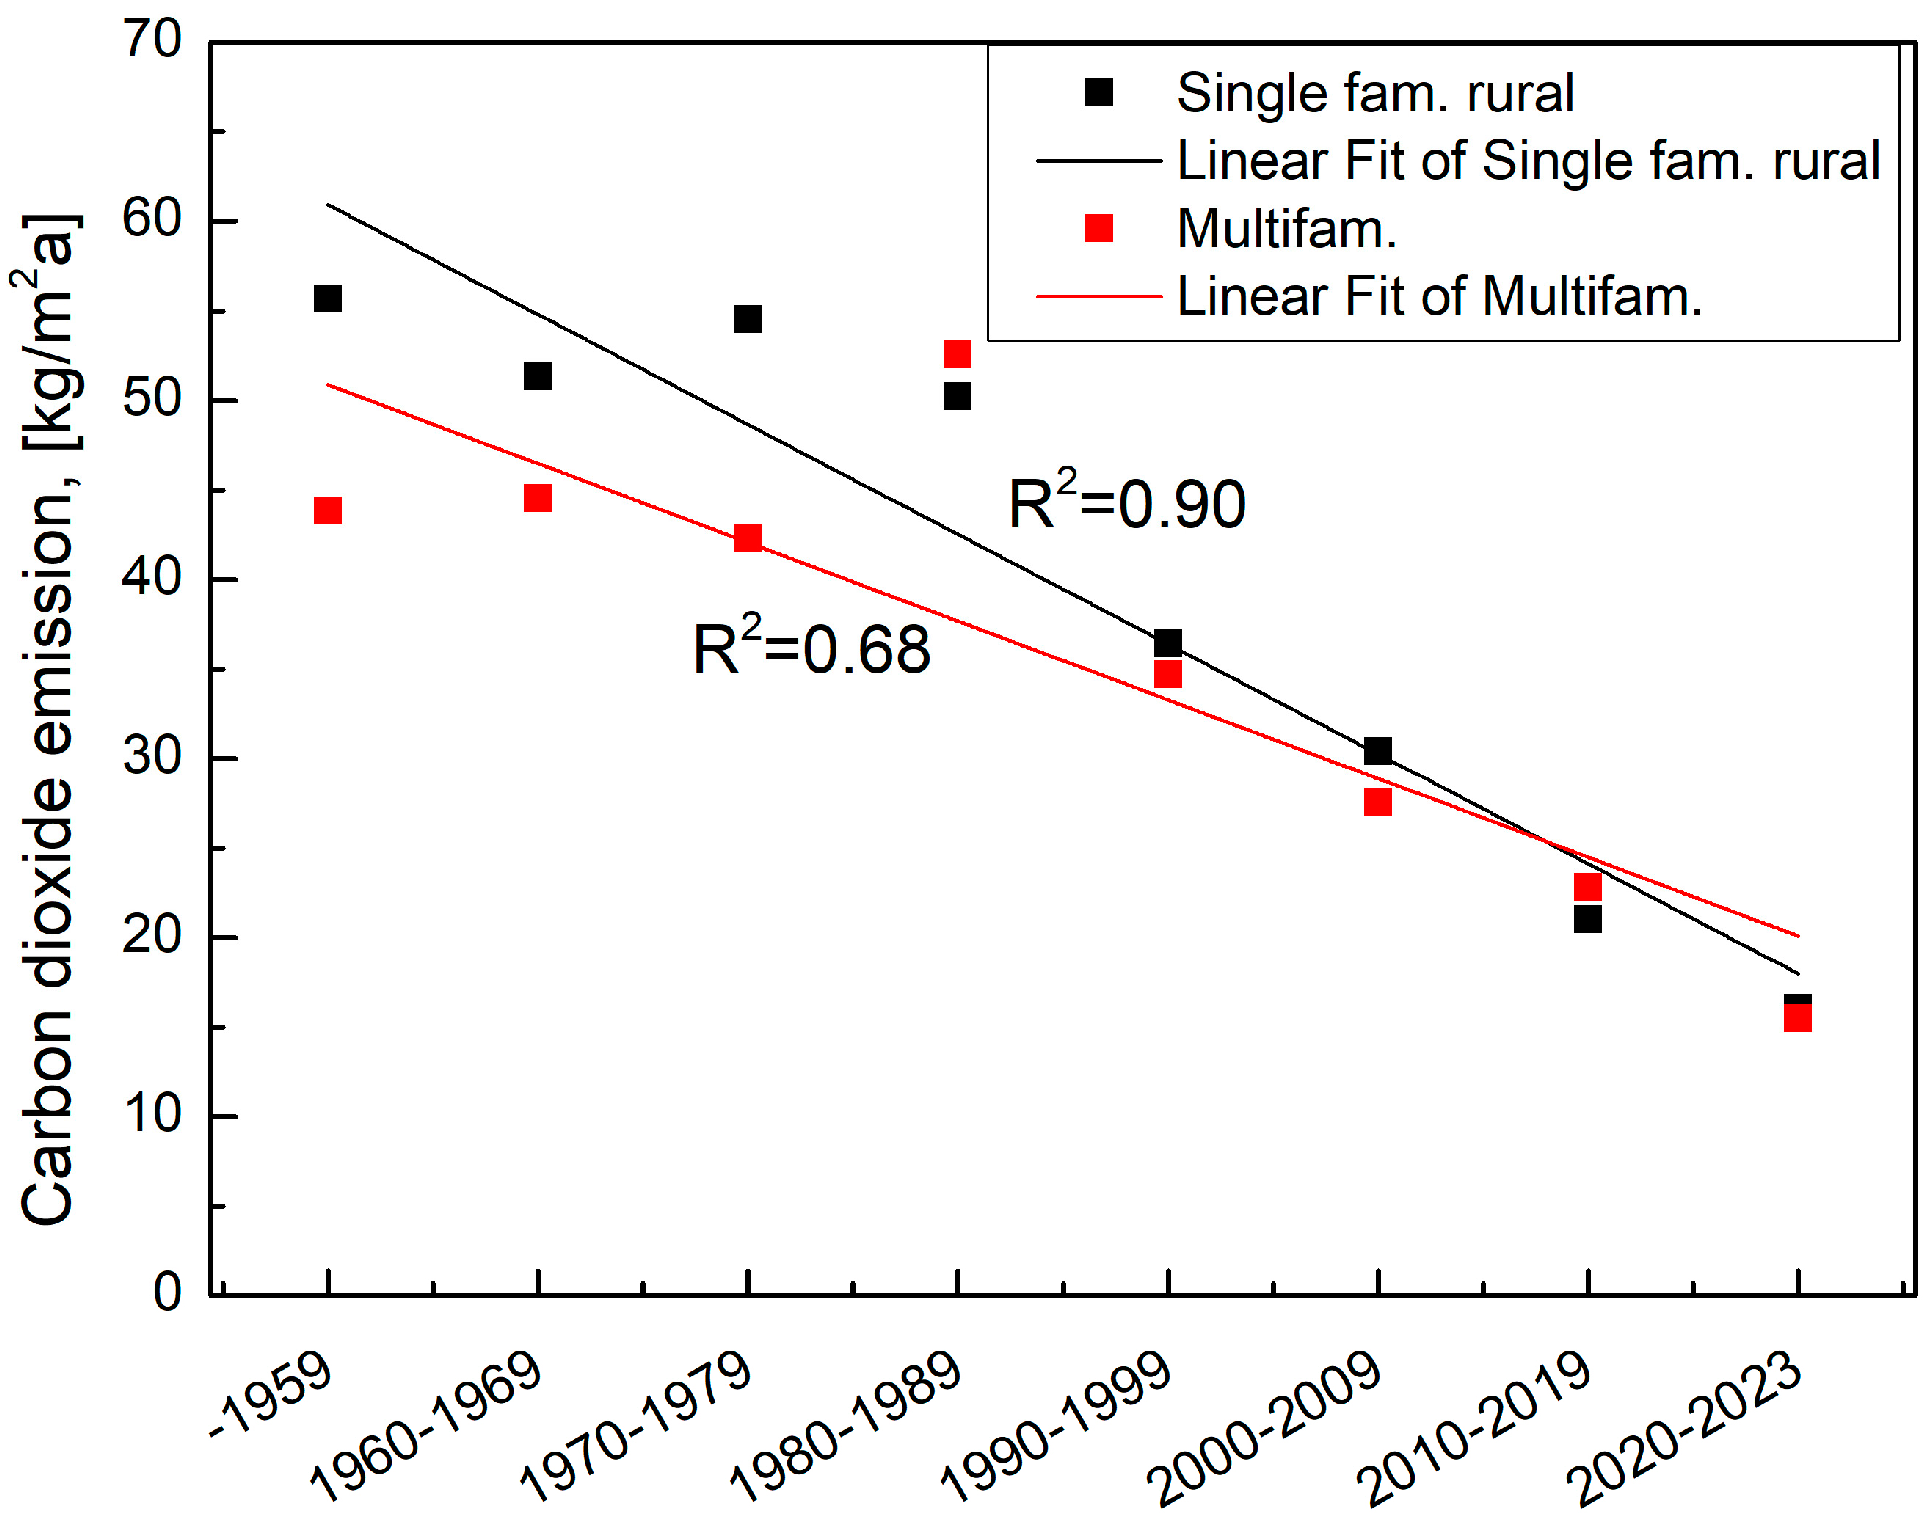
- Comparing masonry-structured multifamily buildings with urban and rural single-family houses, similar results were obtained. The specific heat loss coefficient, the net specific heat demand and the specific CO2 emissions are higher in single-family houses than in multifamily houses. In multifamily houses, the specific heat loss coefficient was reduced by 3.5 times, the net specific heat demand by 3.7 times and the CO2 emissions by 2.8 times, respectively. The differences between urban single-family houses and masonry-built multifamily buildings are significant only in the case of specific heat losses, while the differences between rural single-family houses and masonry-structured multifamily buildings are significant for both specific heat losses and the net specific heat demand.
- Panel buildings constructed between 1970 and 1989 show the best thermal and energy performance. Due to the high investment costs and the inability to change the heat source, these buildings now exhibit poor thermal performance.
- Single-family houses in both rural and urban regions can be effectively transformed into positive energy houses by utilising heat pumps and properly designed photovoltaic systems with appropriately chosen accumulators.
- In the case of masonry-structured multifamily buildings, zero CO2 emissions (from heating and hot water preparation) can be achieved by using air–water heat pumps, photovoltaic systems with accumulators and solar collectors.
- For panel buildings connected to the district heating system, the CO2 emissions have a lower limit that cannot be reduced further by using the current technologies. This is due to the efficiency of the district heating system (including heat losses and auxiliary energy use), heat sources and heat production.
6. Future Work
7. Limitations
Author Contributions
Funding
Data Availability Statement
Conflicts of Interest
Nomenclature
| A/V | ratio of the building envelope area A, [m2] and heated volume V, [m3]; |
| p | level of significance; |
| R2 | adjusted R-squared value (goodness-of-fit measure); |
| SD | standard deviation (average amount of variability in the dataset); |
| GHG | greenhouse gases; |
| EPS | expanded polystyrene; |
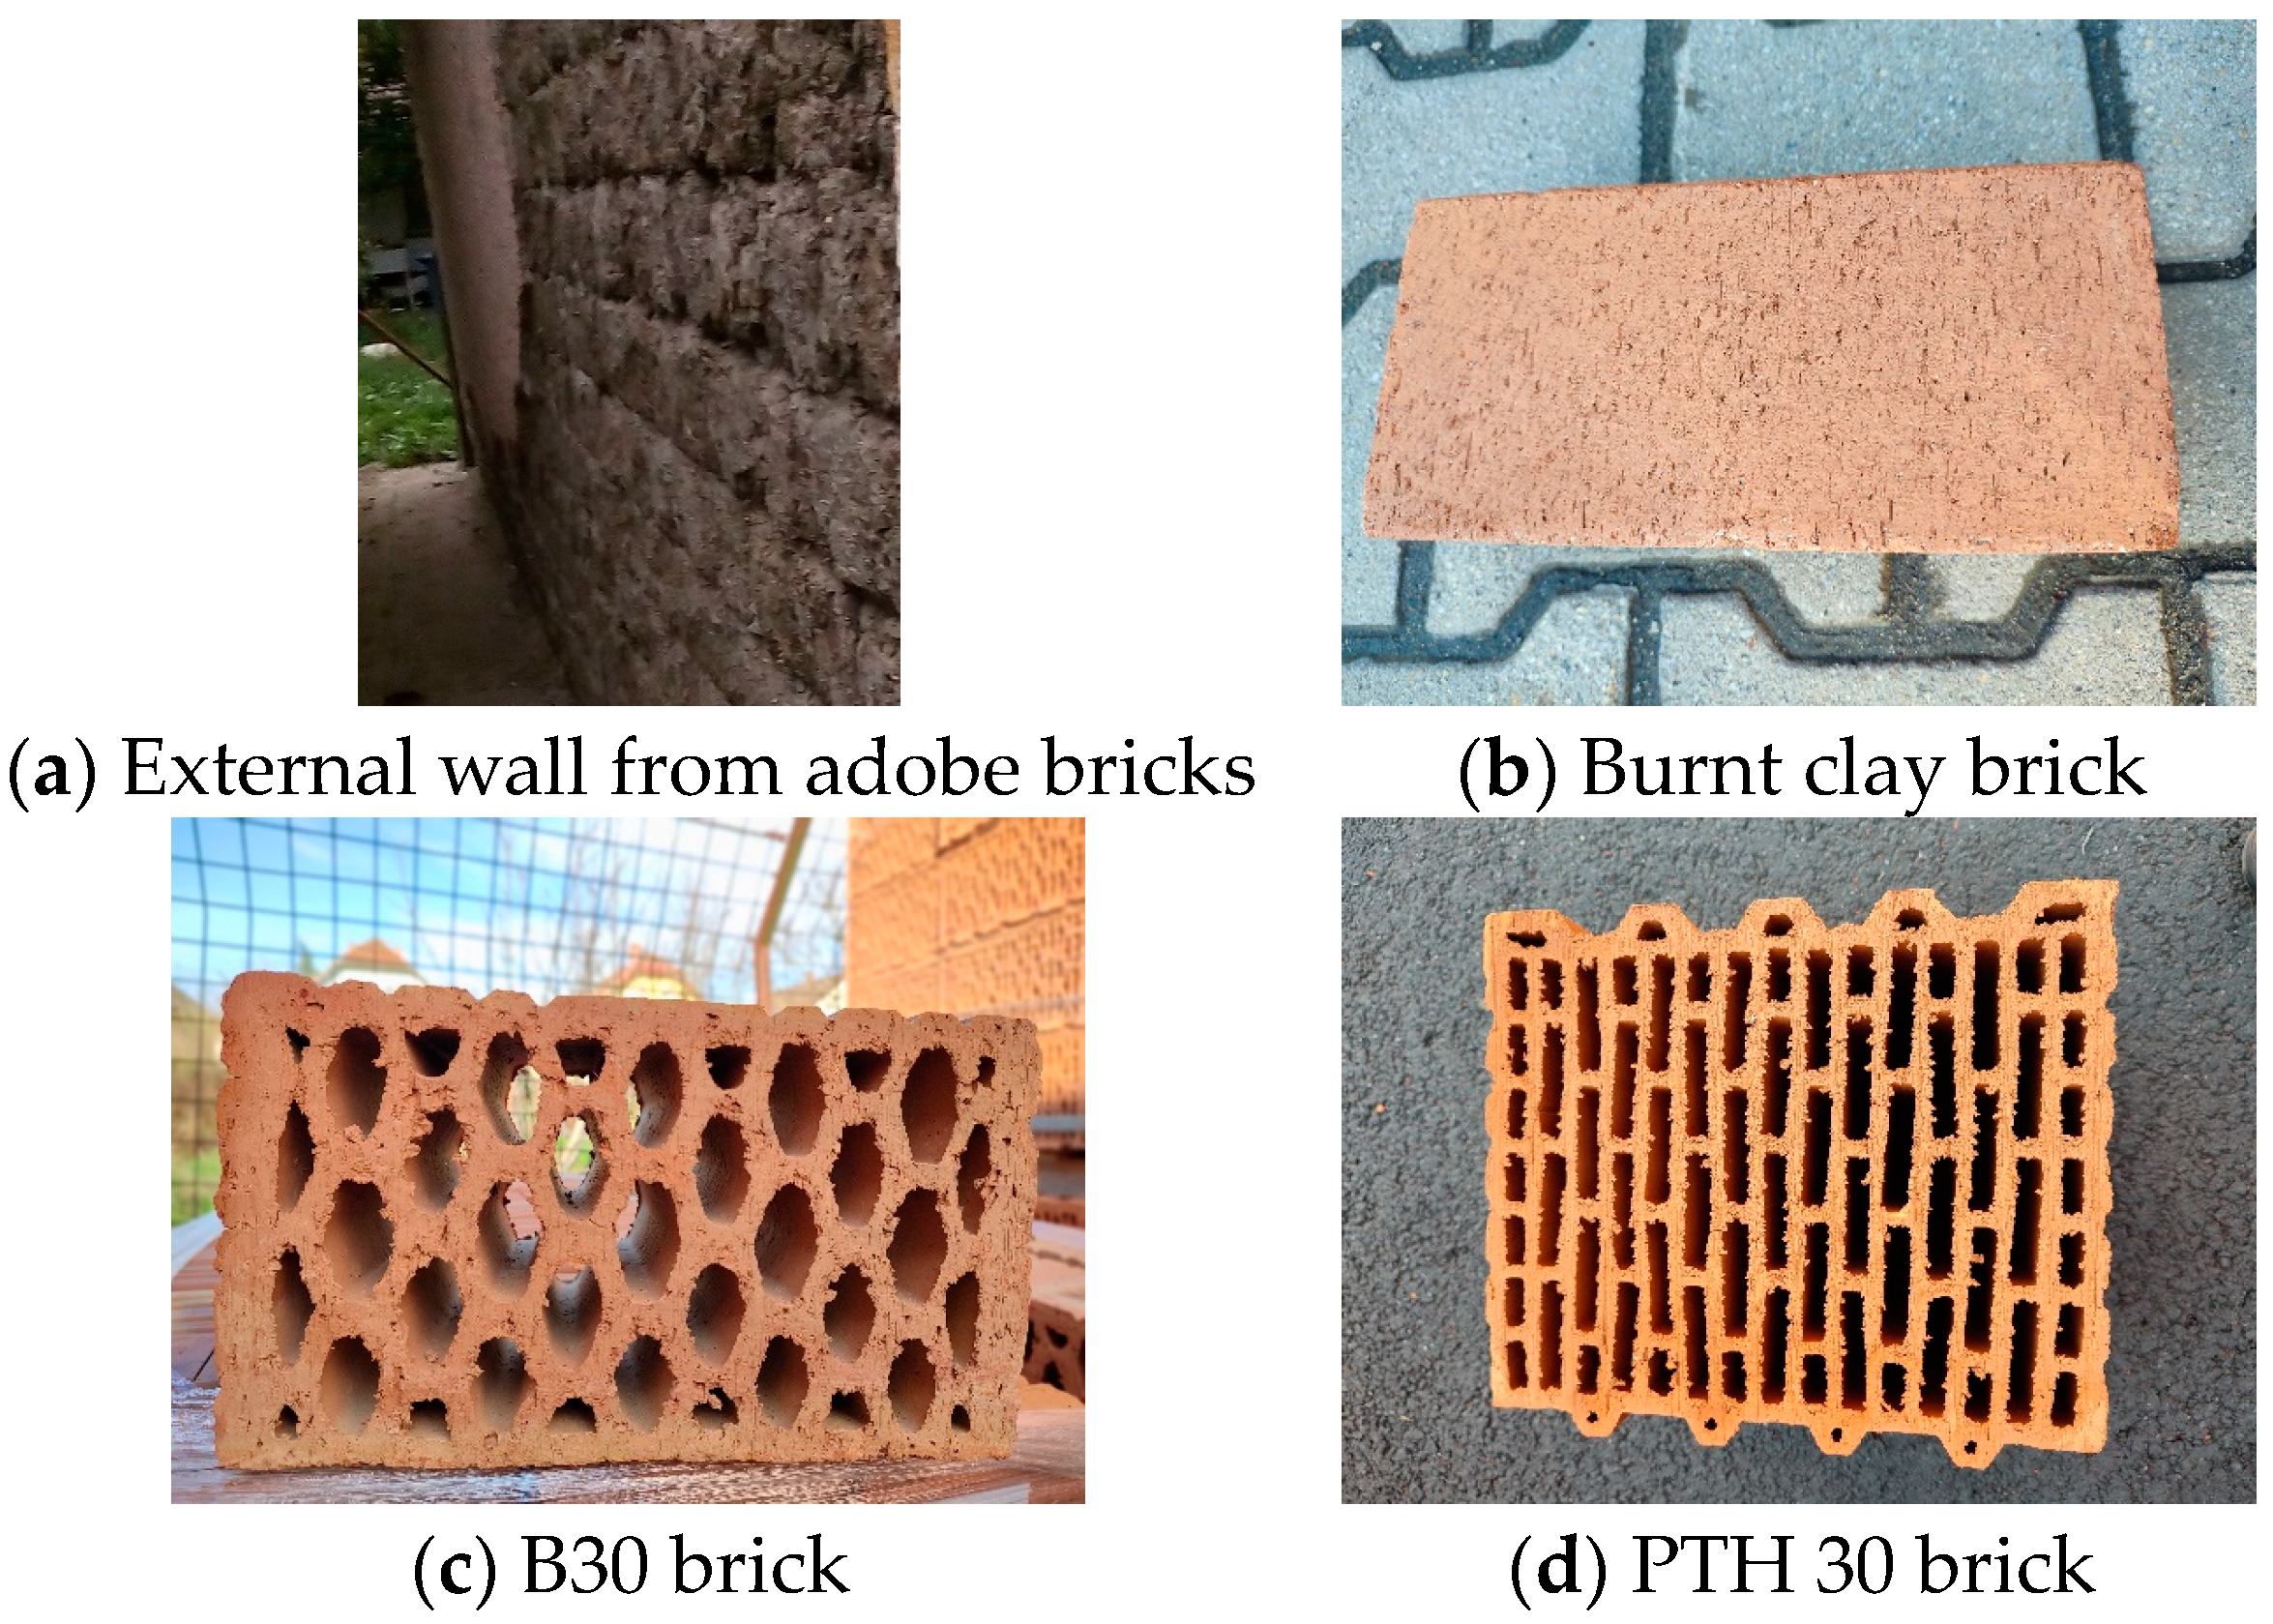
| B30,HB38, PTH | bricks with vertical hole types. |
Appendix A
References
- Directive (EU) 2018/844 of the European Parliament and of the Council of 30 May 2018 amending Directive 2010/31/EU on the Energy Performance of Buildings and Directive 2012/27/EU on Energy Efficiency, Official Journal of the European Union, 19.6.2018. Available online: http://data.europa.eu/eli/dir/2018/844/oj (accessed on 21 March 2025).
- Communication from the Commission to the European Parliament, the Council, the European Economic and Social Committee and the Committee of the Regions, Securing our Future Europe’s 2040 Climate Target and Path to Climate Neutrality by 2050 Building a Sustainable, Just and Prosperous Society, Strasbourg. 2024. Available online: https://www.carbonbrief.org/qa-european-commission-calls-for-90-cut-in-eu-emissions-by-2040/ (accessed on 21 March 2025).
- Ürge-Vorsatz, D.; Cabeza, L.F.; Serrano, S.; Barreneche, C.; Petrichenko, K. Heating and cooling energy trends and drivers in buildings. Renew. Sustain. Energy Rev. 2015, 41, 85–98. [Google Scholar] [CrossRef]
- Berardi, U. A cross-country comparison of the building energy consumptions and their trends, Resources. Conserv. Recycl. 2017, 123, 230–241. [Google Scholar] [CrossRef]
- Parshall, L.; Gurney, K.; Hammera, S.A.; Mendoza, D.; Zhou, Y.; Geethakumar, S. Modeling energy consumption and CO2 emissions at the urban scale: Methodological challenges and insights from the United States. Energy Policy 2010, 38, 4765–4782. [Google Scholar] [CrossRef]
- Zhou, N.; Khanna, N.; Feng, W.; Ke, J.; Levine, M. Scenarios of energy efficiency and CO2 emissions reduction potential in the buildings sector in China to year 2050. Nat. Energy 2018, 3, 978–984. [Google Scholar] [CrossRef]
- Akan, A.P.; Akan, A.E. Modeling of CO2 emissions via optimum insulation thickness of residential buildings. Clean Technol. Environ. Policy 2022, 24, 949–967. [Google Scholar] [CrossRef]
- Canbolat, A.S.; Albak, E.I. Multi-Objective Optimization of Building Design Parameters for Cost Reduction and CO2 Emission Control Using Four Different Algorithms. Appl. Sci. 2024, 14, 7668. [Google Scholar] [CrossRef]
- Zhu, W.; Feng, W.; Li, X.; Zhang, Z. Analysis of the embodied carbon dioxide in the building sector: A case of China. J. Clean. Prod. 2020, 269, 122438. [Google Scholar] [CrossRef]
- Heinonen, J.; Junnila, S. A Carbon Consumption Comparison of Rural and Urban Lifestyles. Sustainability 2011, 3, 1234–1249. [Google Scholar] [CrossRef]
- Heinonen, J.; Junnila, S. Residential energy consumption patterns and the overall housing energy requirements of urban and rural households in Finland. Energy Build. 2014, 76, 295–303. [Google Scholar] [CrossRef]
- Nematchoua, M.K.; Sadeghi, M.; Reiter, S. Strategies and scenarios to reduce energy consumption and CO2 emission in the urban, rural and sustainable neighbourhoods. Sustain. Cities Soc. 2021, 72, 103053.2. [Google Scholar] [CrossRef]
- Cai, J.; Jiang, Z. Changing of energy consumption patterns from rural households to urban households in China: An example from Shaanxi Province, China. Renew. Sustain. Energy Rev. 2008, 12, 1667–1680. [Google Scholar] [CrossRef]
- Guan, X.; Guo, S.; Xiong, J.; Jia, G.; Fan, J. Energy-related CO2 emissions of urban and rural residential buildings in China: A provincial analysis based on end-use activities. J. Build. Eng. 2023, 64, 105686. [Google Scholar] [CrossRef]
- Zhang, M.; Song, Y.; Li, P.; Li, H. Study on affecting factors of residential energy consumption in urban and rural Jiangsu. Renew. Sustain. Energy Rev. 2016, 53, 330–337. [Google Scholar] [CrossRef]
- Cheshmehzangi, A. Evaluating the Nexus between Housing and Energy Sectors: The Comparison of Urban, Peri-Urban and Rural Housing Areas in Zhuhai, China. Energy Power Eng. 2020, 12, 314–338. [Google Scholar] [CrossRef]
- Zhou, T.; Luo, X.; Liu, X.; Zhai, X.; Sun, Y.; Liu, G.; Liu, J.; Gao, Y.; Dang, D.; Li, N.; et al. The green and low-carbon development pathways in the urban and rural building sector in Shaanxi Province. China Energy Build. 2024, 306, 113952. [Google Scholar] [CrossRef]
- Du, Q.; Han, X.; Li, Y.; Li, Z.; Xia, B.; Guo, X. The energy rebound effect of residential buildings: Evidence from urban and rural areas in China. Energy Policy 2021, 153, 112235. [Google Scholar] [CrossRef]
- Wang, J.; You, K.; Qi, L.; Ren, H. Gravity center change of carbon emissions in Chinese residential building sector: Differences between urban and rural area. Energy Rep. 2022, 8, 10644–10656. [Google Scholar] [CrossRef]
- Zhou, Q.; Shi, W. Socio-economic transition and inequality of energy consumption among urban and rural residents in China. Energy Build. 2019, 190, 15–24. [Google Scholar] [CrossRef]
- Zhou, Y.; Liu, Y.; Wu, W.; Li, Y. Effects of rural–urban development transformation on energy consumption and CO2 emissions: A regional analysis in China. Renew. Sustain. Energy Rev. 2015, 52, 863–875. [Google Scholar] [CrossRef]
- He, B.J.; Yang, L.; Ye, M. Building energy efficiency in China rural areas: Situation, drawbacks, challenges, corresponding measures and policies. Sustain. Cities Soc. 2014, 11, 7–15. [Google Scholar] [CrossRef]
- Fan, J.L.; Ju, H.; Wei, Y.M. Residential energy-related carbon emissions in urban and rural China during 1996–2012: From the perspective of five end-use activities. Energy Build. 2015, 96, 201–209. [Google Scholar] [CrossRef]
- Chen, C.; Liu, G.; Meng, F.; Hao, Y.; Zhang, Y.; Casazza, M. Energy consumption and carbon footprint accounting of urban and rural residents in Beijing through Consumer Lifestyle Approach. Ecol. Indic. 2019, 98, 575–586. [Google Scholar] [CrossRef]
- Hu, S.; Yan, D.; Guo, S.; Cui, Y.; Dong, B. A survey on energy consumption and energy usage behavior of households and residential building in urban China. Energy Build. 2017, 148, 366–378. [Google Scholar] [CrossRef]
- Shahi, D.K.; Rijal, H.B.; Shukuya, M. A study on household energy-use patterns in rural, semi-urban and urban areas of Nepal based on field survey. Energy Build. 2020, 223, 110095. [Google Scholar] [CrossRef]
- Santamouris, M.; Papanikolaou, N.; Livada, I.; Koronakis, I.; Georgakis, C.; Argiriou, A.; Assimakopoulos, D.N. On the impact of urban climate on the energy consumption of buildings. Sol. Energy 2001, 70, 201–216. [Google Scholar] [CrossRef]
- Roxon, J.; Ulm, F.J.; Pellenq, R.J.M. Urban heat island impact on state residential energy cost and CO2 emissions in the United States. Urban Clim. 2020, 31, 100546. [Google Scholar] [CrossRef]
- Magli, S.; Lodi, C.; Lombroso, L.; Muscio, A.; Teggi, S. Analysis of the urban heat island effects on building energy consumption. Int. J. Energy Environ. Eng. 2015, 6, 91–99. [Google Scholar] [CrossRef]
- Li, X.; Zhou, Y.; Yu, S.; Jia, G.; Li, H.; Li, W. Urban heat island impacts on building energy consumption: A review of approaches and findings. Energy 2019, 174, 407–419. [Google Scholar] [CrossRef]
- Paolini, R.; Zania, A.; MeshkinKiya, M.; Castaldo, V.L.; Pisello, A.L.; Antretter, F.; Poli, T.; Cotana, F. The hygrothermal performance of residential buildings at urban and rural sites: Sensible and latent energy loads and indoor environmental conditions. Energy Build. 2017, 152, 792–803. [Google Scholar] [CrossRef]
- Fan, J.L.; Zeng, B.; Hu, J.W.; Zhang, X.; Wang, H. The impact of climate change on residential energy consumption in urban and rural divided southern and northern China. Env. Geochem Health 2020, 42, 969–985. [Google Scholar] [CrossRef]
- Madlener, R.; Sunak, Y. Impacts of urbanization on urban structures and energy demand: What can we learn for urban energy planning and urbanization management? Sustain. Cities Soc. 2011, 1, 45–53. [Google Scholar] [CrossRef]
- Myszczyszyn, J.; Supron, B. Relationship among Economic Growth, Energy Consumption, CO2 Emission, and Urbanization: An Econometric Perspective Analysis. Energies 2022, 15, 9647. [Google Scholar] [CrossRef]
- Győri, Á.; Huszár, Á.; Balogh, K. Differences in the Domestic Energy Consumption in Hungary: Trends between 2006–2017. Energies 2021, 14, 6718. [Google Scholar] [CrossRef]
- Hrabovszky-Horváth, S.; Pálvölgyi, T.; Csoknyai, T.; Talamon, A. Generalized residential building typology for urban climate change mitigation and adaptation strategies: The case of Hungary. Energy Build. 2013, 62, 475–485. [Google Scholar] [CrossRef]
- Csoknyai, T.; Hrabovszky-Horváth, S.; Georgiev, Z.; Jovanovic-Popovic, M.; Stankovic, B.; Villatoro, O.; Szendrő, G. Building stock characteristics and energy performance of residential buildings in Eastern-European countries. Energy Build. 2016, 132, 39–52. [Google Scholar] [CrossRef]
- Available online: https://www.originlab.com/doc/en/Origin-Help/LR-Algorithm (accessed on 3 May 2025).
- Available online: https://www.originlab.com/doc/Origin-Help/tTest-PairSample-Algorithm (accessed on 3 May 2025).
- Kalmár, F.; Bodó, B.; Li, B.; Kalmár, T. Decarbonization Potential of Energy Used in Detached Houses—Case Study. Buildings 2024, 14, 1824. [Google Scholar] [CrossRef]
- Tóth, G.; Jáger, V.; Kovalszky, Z.S.; Bóday, P.; Ádám, D.; Kincses, Á.; Szép, T. Characteristics of Household Energy Consumption in the Shadow of the Russia-Ukraine War—A Case Study from Hungary. Int. J. Sustain. Energy Plan. Manag. 2024, 40, 52–70. [Google Scholar] [CrossRef]
- Hungarian Central Statistical Office. Available online: https://www.ksh.hu/nepszamlalas/tables_regional_09?lang=en (accessed on 26 March 2025).
- Bodó, B.; Kalmár, F. Analysis of primary energy use of typical buildings in Hungary. Environ. Eng. Manag. J. 2014, 13, 2725–2731. [Google Scholar] [CrossRef]
- Regulation 7/2006. (V. 24.) TNM, (2006) on the Determination of Energy Performance of Buildings of the Minister Without Portfolio, Budapest (in Hungarian). Available online: http://new.etanusitvany.hu/uploads/editor/files/7_2006.pdf (accessed on 21 March 2025).
- Szabó, Á.; Lakatos, Á. Thermal analysis of aerogels and their vacuum-formed forms, their potential uses, and their effects on the environment. Case Stud. Therm. Eng. 2024, 56, 104284. [Google Scholar] [CrossRef]
- Lakatos, Á. Investigation of the thermal insulation performance of fibrous aerogel samples under various hygrothermal environment: Laboratory tests completed with calculations and theory. Energy Build. 2020, 214, 109902. [Google Scholar] [CrossRef]
- Csáky, I. Air Terminal Devices Developed for Personal Ventilation Systems. Energies 2020, 13, 1688. [Google Scholar] [CrossRef]


Disclaimer/Publisher’s Note: The statements, opinions and data contained in all publications are solely those of the individual author(s) and contributor(s) and not of MDPI and/or the editor(s). MDPI and/or the editor(s) disclaim responsibility for any injury to people or property resulting from any ideas, methods, instructions or products referred to in the content. |
© 2025 by the authors. Licensee MDPI, Basel, Switzerland. This article is an open access article distributed under the terms and conditions of the Creative Commons Attribution (CC BY) license (https://creativecommons.org/licenses/by/4.0/).
Share and Cite
Kalmár, F.; Bodó, B.; Kalmár, T. Comparison of Energy Demand for Heating and CO2 Emissions in Urban and Rural Areas, the Case of Hajdú-Bihar County, Hungary. Buildings 2025, 15, 1625. https://doi.org/10.3390/buildings15101625
Kalmár F, Bodó B, Kalmár T. Comparison of Energy Demand for Heating and CO2 Emissions in Urban and Rural Areas, the Case of Hajdú-Bihar County, Hungary. Buildings. 2025; 15(10):1625. https://doi.org/10.3390/buildings15101625
Chicago/Turabian StyleKalmár, Ferenc, Béla Bodó, and Tünde Kalmár. 2025. "Comparison of Energy Demand for Heating and CO2 Emissions in Urban and Rural Areas, the Case of Hajdú-Bihar County, Hungary" Buildings 15, no. 10: 1625. https://doi.org/10.3390/buildings15101625
APA StyleKalmár, F., Bodó, B., & Kalmár, T. (2025). Comparison of Energy Demand for Heating and CO2 Emissions in Urban and Rural Areas, the Case of Hajdú-Bihar County, Hungary. Buildings, 15(10), 1625. https://doi.org/10.3390/buildings15101625