Abstract
The effect of macro synthetic polyolefin fibers on the bond strength of tension lap splices in reinforced concrete (RC) beams is investigated in this study. The bond between the reinforcement and concrete plays a vital role in the strength of RC beams. The presence of polyolefin fibers in the lap splice zone confines the concrete and enhances the bond strength of the steel bars. The use of synthetic fibers is preferable to steel ones since steel suffers from corrosion over time. Tests were conducted on 12 full-scale beam specimens to determine the effect of fiber volume fraction (Vf), bar diameter (db) and concrete cover-to-bar diameter (c/db) on the response. Four volume fractions (Vf = 0, 0.5, 1 and 1.5%) of polyolefin fibers and three bar sizes (db = 16, 20 and 25 mm) with the corresponding (c/db = 2.31, 1.75 and 1.30) were considered to evaluate the bond strength. The test results demonstrated that the polyolefin fibers noticeably enhanced the bond strength and ductility of spliced tension bars. Experimental results were compared with those obtained from two theoretical methods including ACI Committee 318 design provisions. The results showed that the equation proposed by the ACI Committee overestimates the bond strength.
1. Introduction
The structural performance of reinforced concrete structures is dependent on the bond between reinforcing bars and concrete. The bond strength between lap-spliced bars and concrete is dependent on many factors including bar diameter, embedment length, concrete cover, concrete strength, and confinement. Experimental studies have demonstrated that the confinement of the splice regions in RC members can be achieved using two different methods. One method is to provide a certain amount of transverse reinforcement across the splice zone. The alternative method involves using fiber reinforcement during casting in the splice zone. As fiber reinforcement is increasingly used for structural engineering applications, the impact of fibers on the stress transfer between the steel rebar and concrete through bonding must be considered. The most common fibers used in concrete are steel and synthetic fibers due to the importance of their mechanical properties.
Many studies have been conducted on the mechanical, physical and durability properties of fiber-reinforced concrete (FRC). Some experimental and numerical investigations have been carried out to show the effect of steel fibers on bond strength. Harajli and Salloukh [1] carried out an experimental study to investigate the effect of steel fibers on the development/splice strength of reinforcing bars in RC beams. They reported that using steel fibers with 2% volume fraction, the average bond strength increased by about 55%. In 2001, Hamad et al. [2] conducted an experimental study to evaluate the influence of steel fiber on the bond strength and ductility of tension lap splices embedded in high-strength concrete. They found that the steel fiber significantly improved the development/splice strength and the ductility of the bond failure. Harajli [3] presented experimental and analytical studies on the effects of steel fibers on bond capacity and bond stress-slip response of reinforcing steel bars in RC beams subjected to static and cyclic loads. It was shown that as a result of the steel fibers in the lap-spliced zone, the tensile splitting bond strength was improved and the ductility of bond failure was significantly enhanced. This improvement became more pronounced as the fiber volume fraction increased. The effectiveness of the steel fibers on the tension lap-splice in ultra-high-performance concrete also has been studied [4,5,6,7,8].
There is no doubt that steel combined with concrete performs well; however, it has some drawbacks. Steel has a significant tendency for corrosion, and it is also expensive to purchase, store, and handle. The development of the plastic industry made it possible to produce chemically stable fibers and solve the durability issues of steel fiber-reinforced concrete [9]. In general, synthetic fibers are divided into two categories: micro synthetic fibers and macro synthetic fibers. The micro synthetic fibers are generally used to minimize early age cracks. They do not significantly affect the properties of hardened concrete, as reported by Pelisser et al. [10]. The macro fibers are also known as structural fibers and have the capacity to carry loads. They are used to minimize or prevent cracks at early and late ages. It has been found that the macro synthetic fibers improve the mechanical properties of concrete, including tensile strength, flexural strength, shear strength, and ductility [11,12,13,14]. However, limited studies have been conducted on the effect of synthetic polypropylene fiber usage in the lap-spliced zone on bond strength. Harajli and Salloukh [1] studied the influence of polypropylene fibers on the development and splice strength. They found that using fibers of a volume fraction of 0.6% of concrete enhanced the ductility of the bond failure. Mohebi et al. [15] studied the impact of polypropylene fibers on the behavior of bonds between reinforcing bars and high strength concrete. It was shown that the deflection of a splice specimen with fiber-reinforced concrete at the failure stage is 20% higher than that with plain concrete. The test results indicated that the pullout test was not suitable for assessing the strength of bonds based on polypropylene fibers. Akın et al. [16] examined the effect of micro and macro polypropylene fibers on RC beams with inadequate lap-splice length. They reported that the use of the macro polypropylene fibers in a beam with insufficient lap-splice resulted in about a 30% increase in energy absorption and about an 18% increase in load-carrying capacity; however, the micro polypropylene fibers had a limited effect.
Previous studies on steel and synthetic fibers indicated that fibers contributed positively to the bond strength of tension lap splices in RC beams by increasing the confinement of the splice zone. However, to the best of the author’s knowledge, the influence of macro polyolefin fibers on the bond strength of tension lap splices has not been investigated yet. The aim of this study was to investigate the effectiveness of macro polyolefin fibers in improving the bond strength of tensile reinforcement lap splices in RC beams. The parameters considered in the study were the volume fractions of polyolefin fibers (Vf = 0, 0.5, 1 and 1.5%) and the bar diameter (db = 16, 20 and 25 mm) with the corresponding concrete cover-to-bar diameter (c/db = 2.31, 1.75 and 1.30).
2. Experimental Program
In the present study, a total of 12 simply supported RC beams were cast and tested in the laboratory of Civil Engineering Department at University of Basrah to investigate the effect of polyolefin fibers on the behavior of bonds between steel reinforcement and concrete.
Test Specimens
Tests were conducted on 12 simply supported RC beams with tension reinforcing bars spliced at midspan. The four-point loading system was designed so that the lap-spliced region was within a constant moment zone.
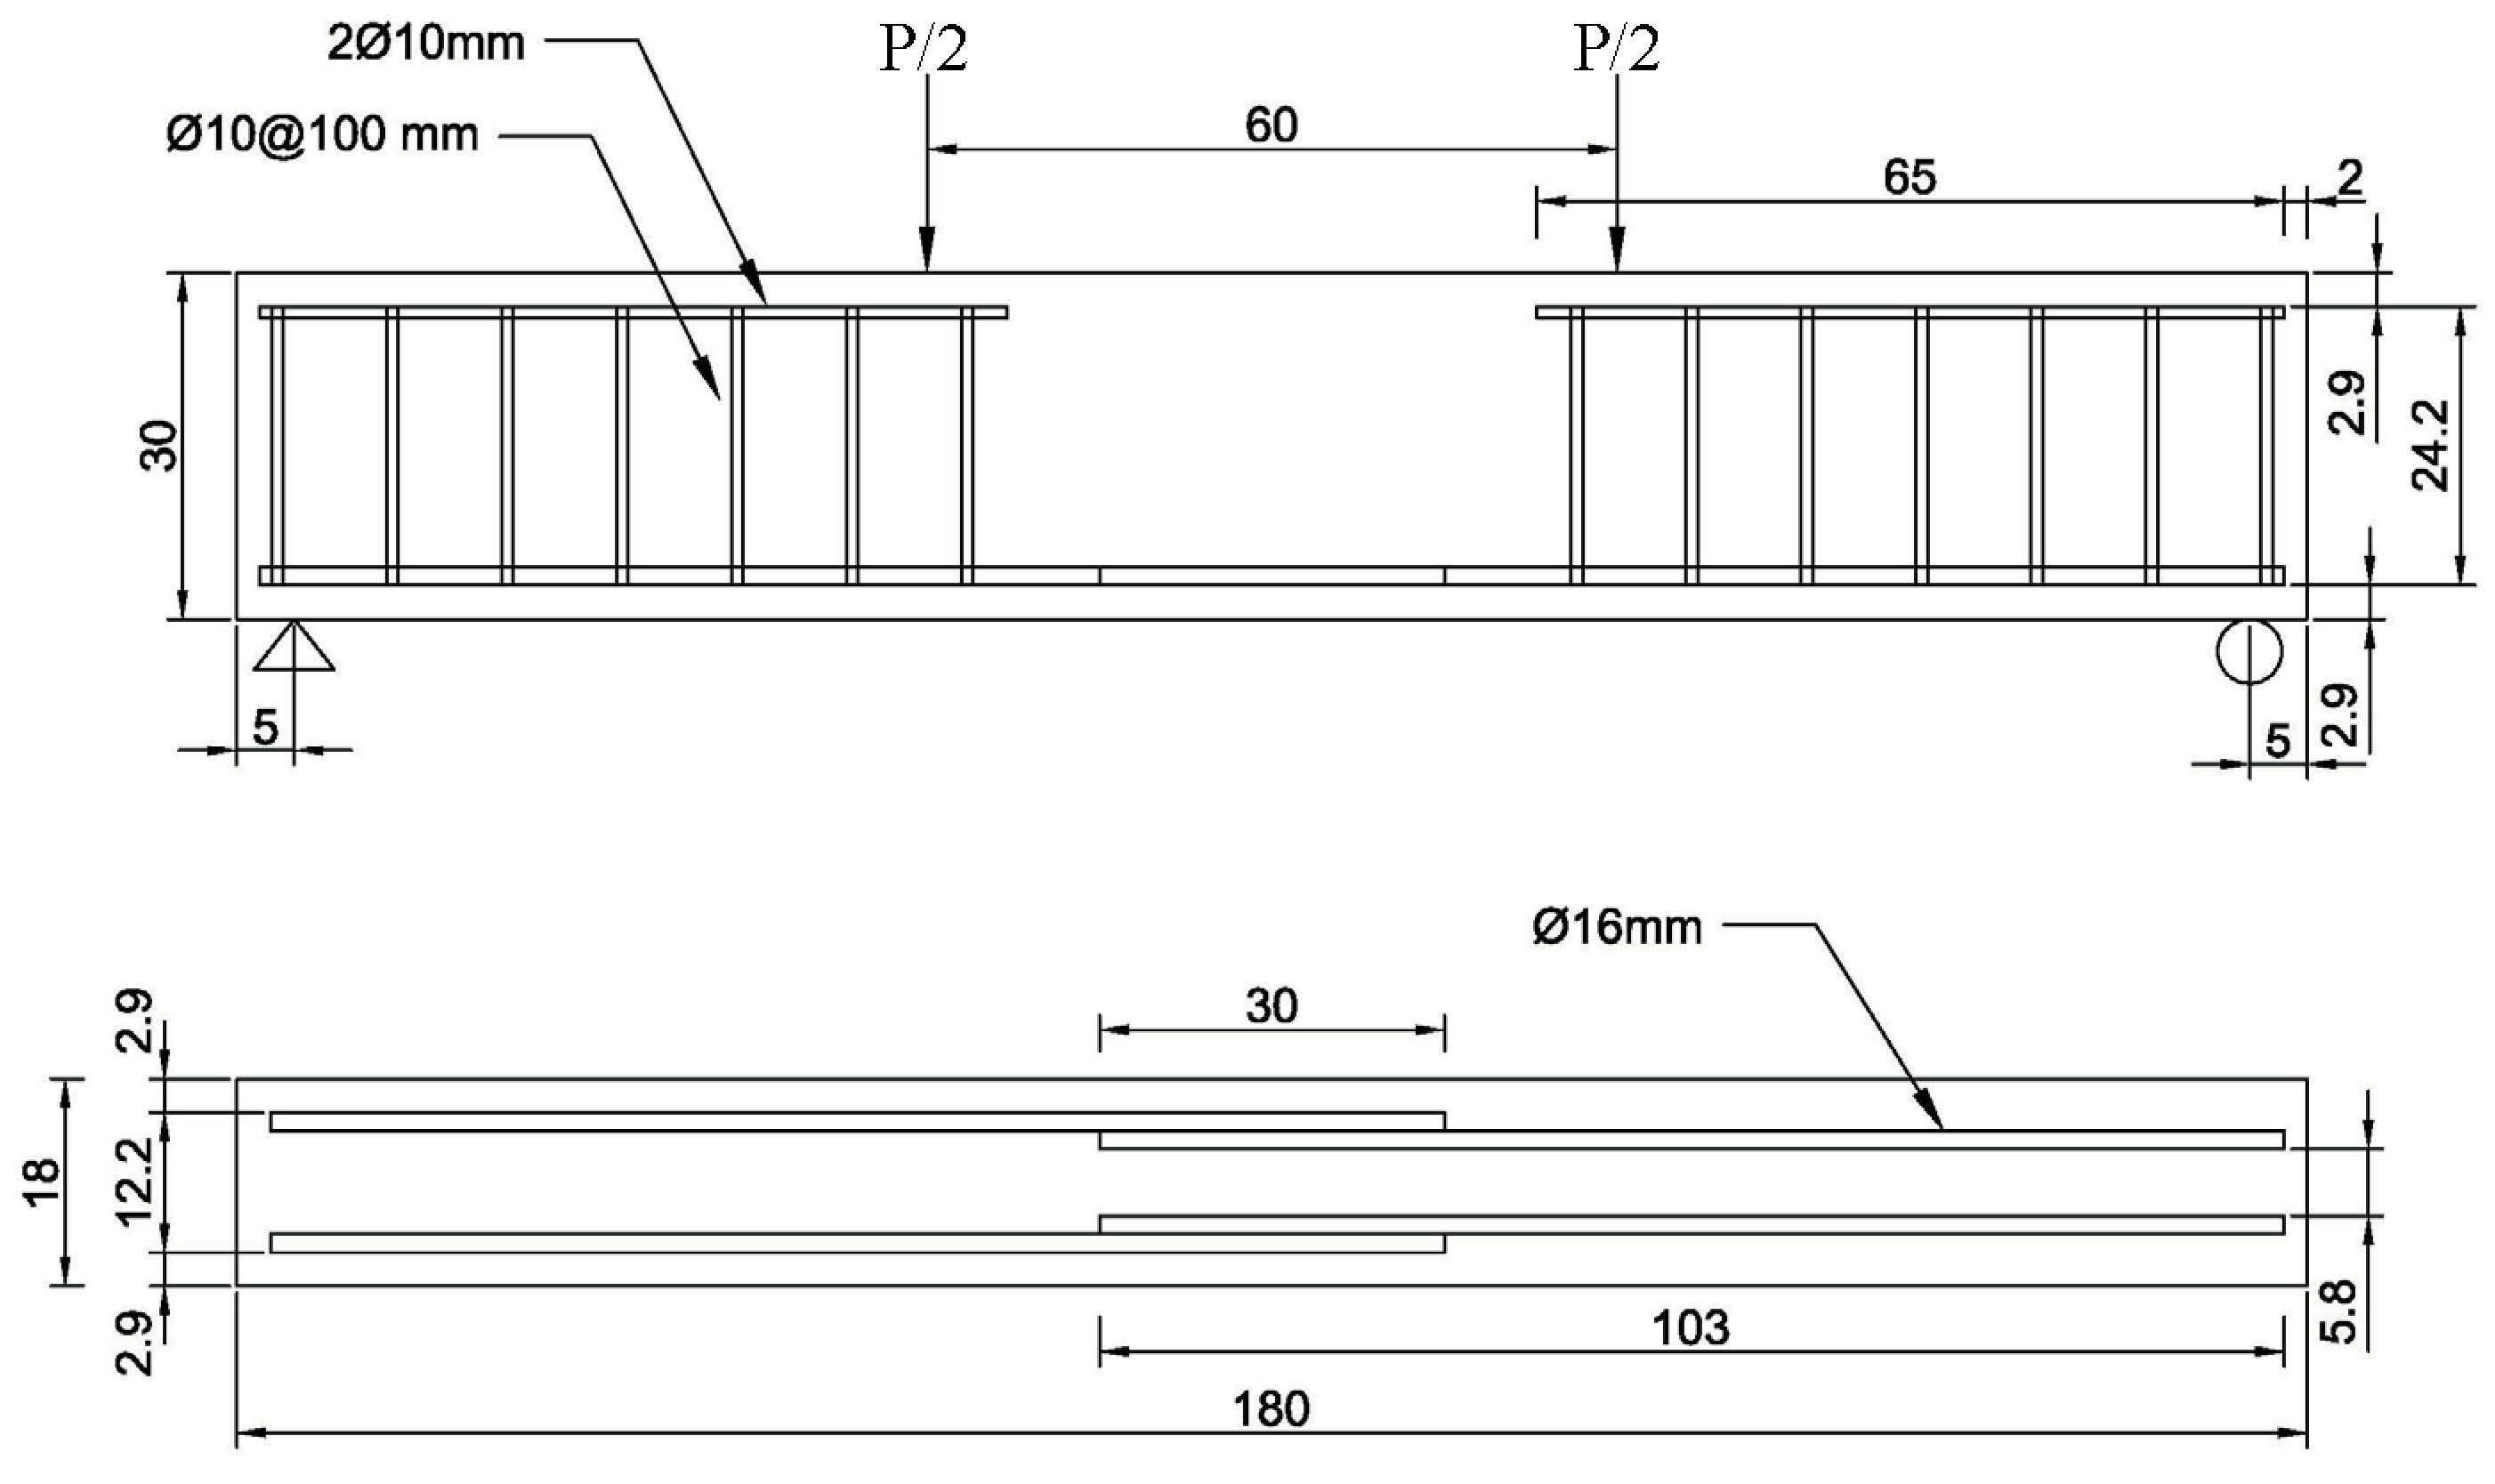
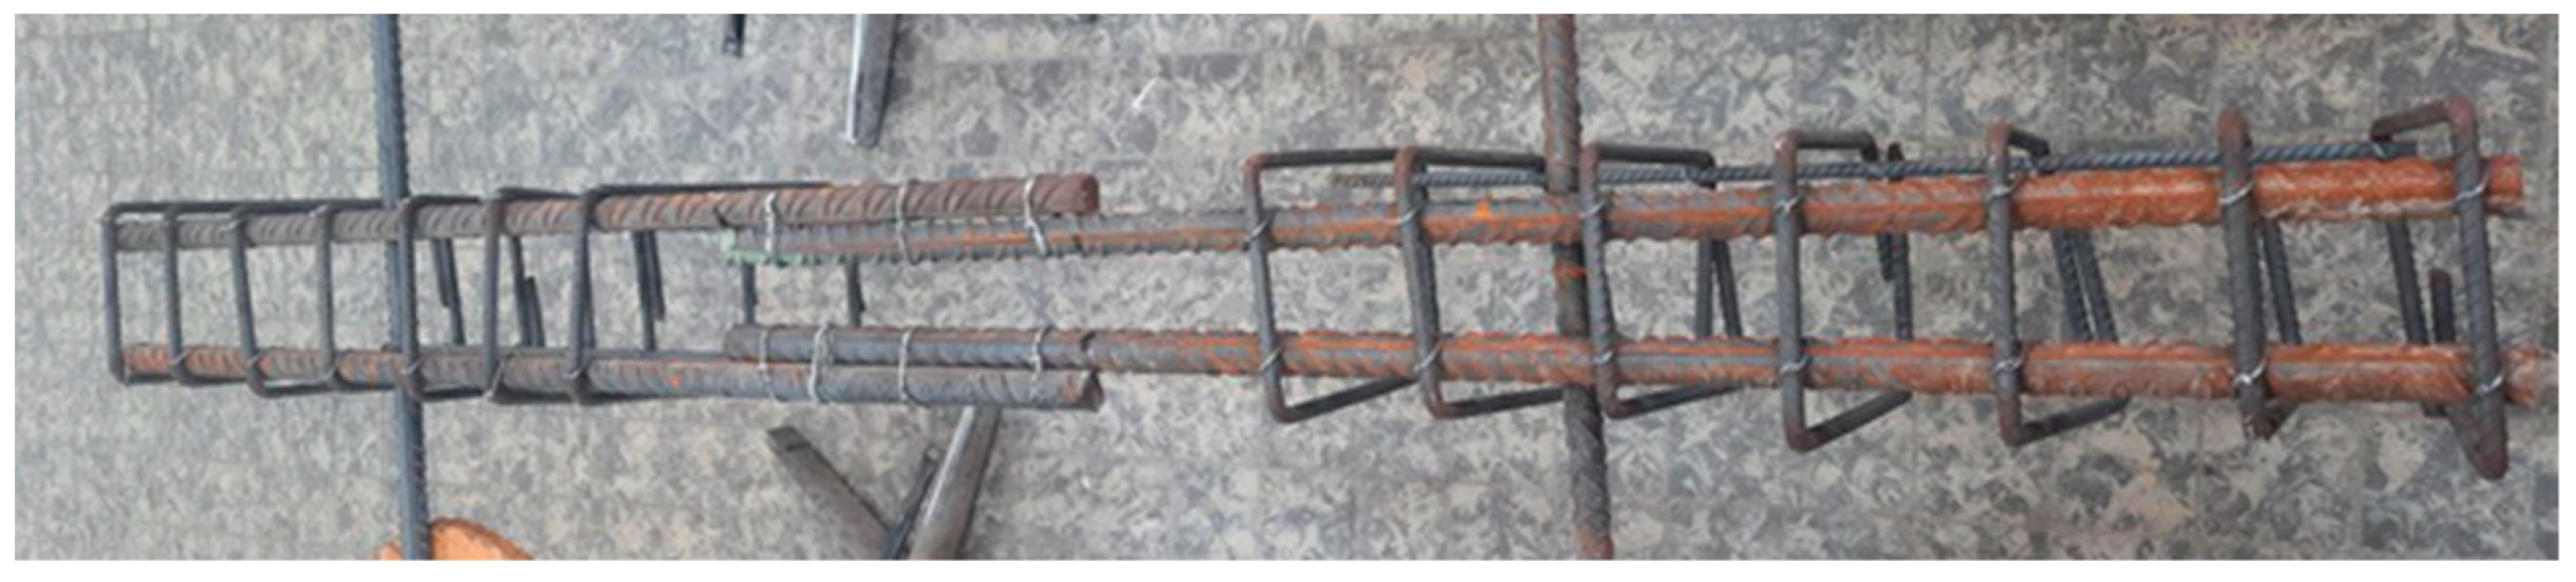
All the tested beams had a 180 mm × 300 mm cross section and a 1700 mm clear span. The distance between the two loading points was 60 cm. The beams were divided into three series based on the sizes of tension reinforcing bars (db = 16, 20, and 25 mm) and each series consisted of four beams with different volume fractions (Vf = 0, 0.5, 1 and 1.5%) of polyolefin fibers. In all beams, the tension reinforcement comprised two longitudinal bars spliced at midspan with an insufficient splice length (ls) of 300 mm. The sizes of tension reinforcing bars in series one, two and three were 16 mm (No. 5), 20 mm (No. 6) and 25 mm (No. 8), respectively. The bottom reinforcements in all beam specimens were arranged such that the concrete covers (side cover and bottom cover) were the same and the clear spacing between the spliced bars was double that of the side or bottom cover in order to provide uniform concrete confinement. The compression reinforcement consisted of two longitudinal bars with 10 mm (No. 3) diameter outside the splice zone to support the shear reinforcement. Transverse reinforcement with a diameter of 10 mm and spacing of 100 mm (Ø 10 @ 100 mm) was provided outside the splice region of all beams, but the transverse reinforcement was not utilized along the splice length. The dimensions and reinforcement layout of the test beams are illustrated in Figure 1, Figure 2 and Figure 3. Figure 4 illustrates a sample of lap splices reinforcement of the beam specimen.

Figure 1.
Beam specimen details of Series (1).

Figure 2.
Beam specimen details of Series (2).
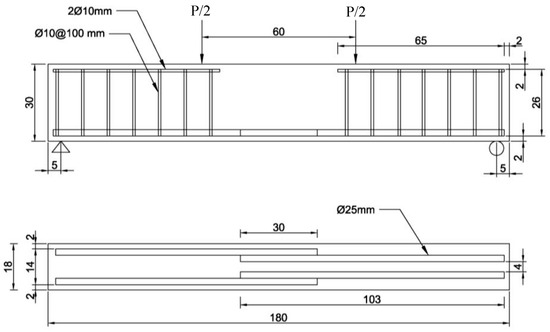
Figure 3.
Beam specimen details of Series (3).
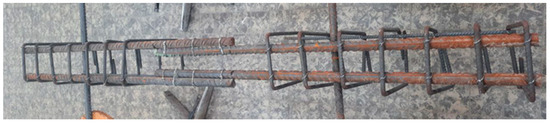
Figure 4.
Lap splices reinforcement of beam specimen.
Table 1 summarizes the test specimens and test parameters. The notation system consisted of two parts to represent the variables of each beam. The first part of the notation B16, B20 and B25 corresponds to bar diameters of 16 mm, 20 mm and 25 mm, respectively. The second part of the notation F0.0, F0.5, F1.0 and F1.5 corresponds to fiber volume fractions of 0, 0.5, 1.0 and 1.5%, respectively. The variable c presented in Table 1 indicates the lowest side cover and bottom cover space measured to the center of the bar, or half of the center-to-center bar spacing.

Table 1.
Details of the test specimens.
3. Materials
3.1. Reinforcing Steel
Steel reinforcement was Grade 60 deformed bars meeting the requirements of ASTM standards [17]. The average yield strength (fy), ultimate strength (fu) and elongation of steel bars used in the specimens are summarized in Table 2.
Table 2.
Mechanical properties of steel bars.
3.2. Macro Polyolefin Fiber
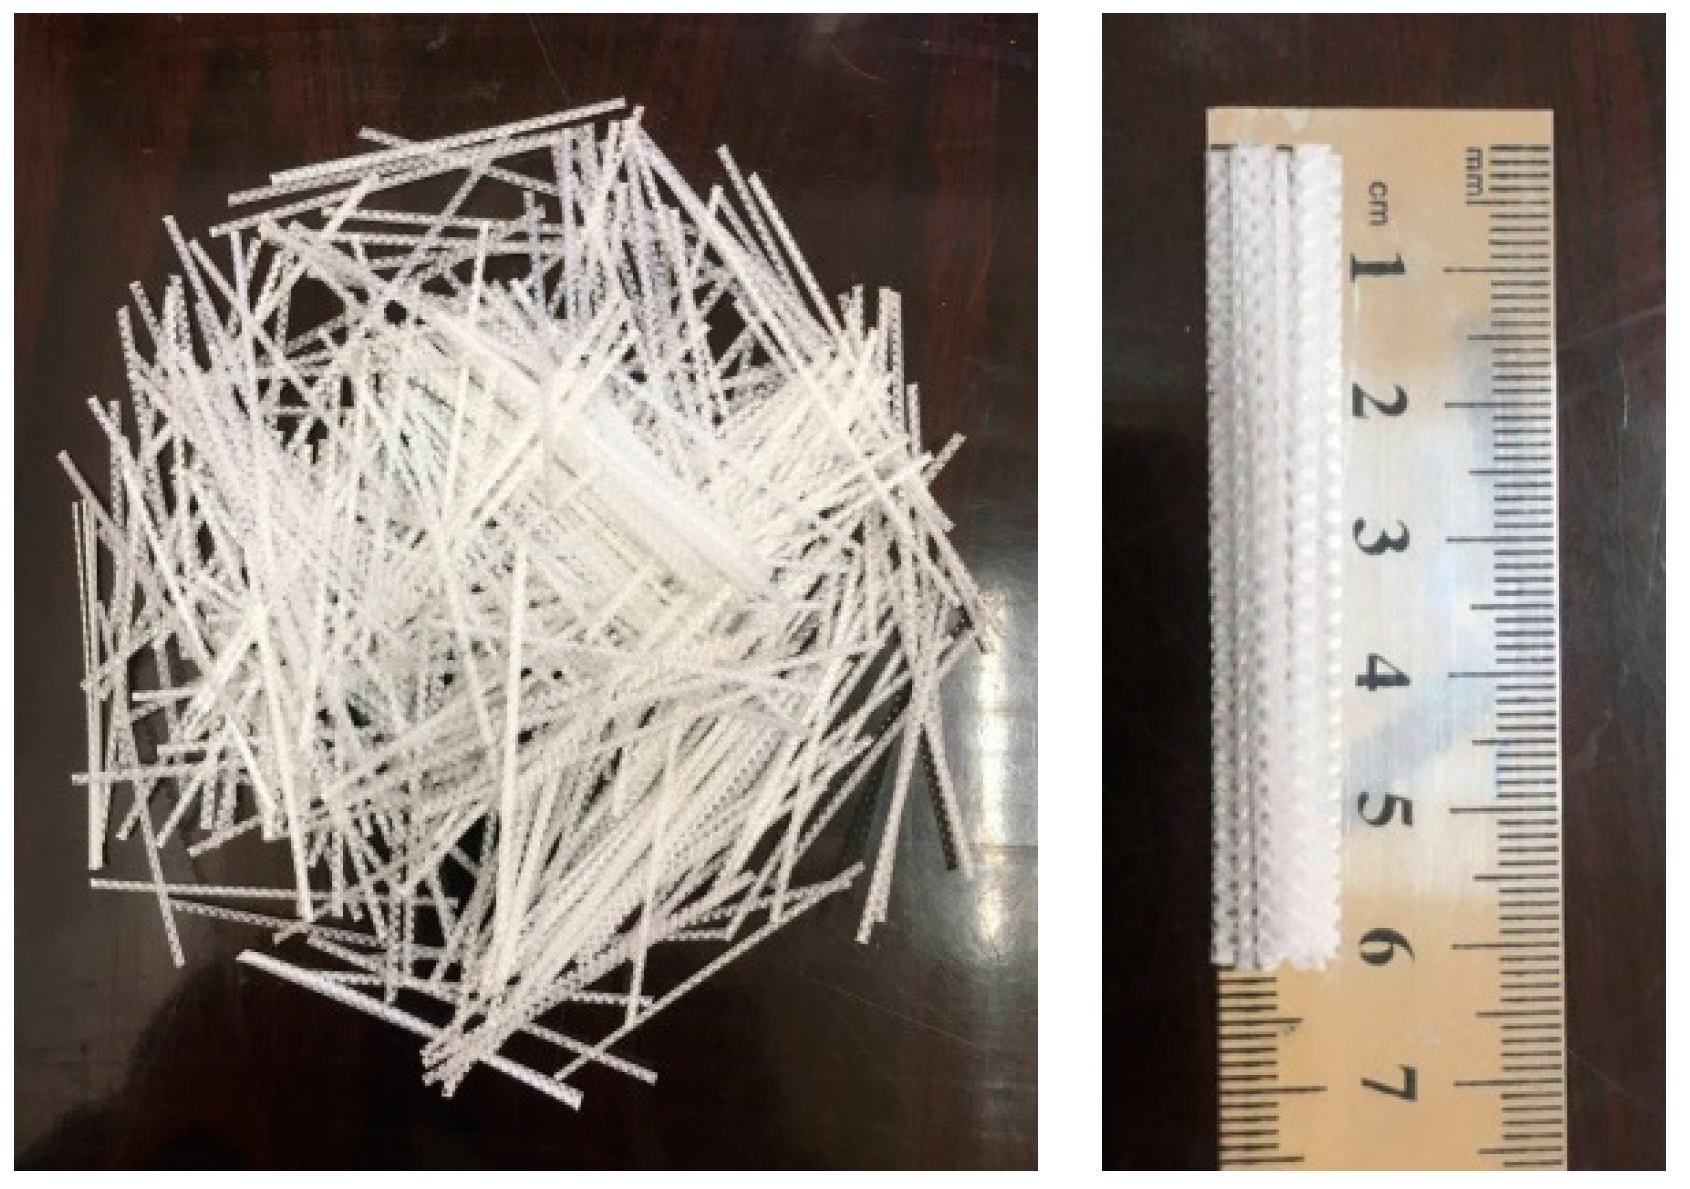
The macro polyolefin fibers used in all beam specimens had a diameter of 0.84 mm and a length of 60 mm with an aspect ratio of 60/0.84 = 71.4. The density, elasticity modulus and tensile strength of the fibers were 910 kg/m3, 7.5 GPa and 465 MPa, respectively. The polyolefin fibers utilized in this study are shown in Figure 5. The discrete fibers were randomly dispersed into the concrete during the mixing procedure. The fiber volume fractions of 0, 0.5, 1.0 and 1.5%, which correspond to fiber dosages of 0, 4.55, 9.10, and 13.65 kg per 1 m3 of concrete, respectively, were considered in this study.

Figure 5.
Macro polyolefin fibers.
3.3. Concrete
The concrete mixes were designed to attain a target compressive strength of cylindrical specimen of 28 MPa after 28 days. The basic ingredients of concrete were ordinary Portland cement, natural sand, natural gravel, potable water, superplasticizer and macro polyolefin fibers. The proportions of the concrete mix are shown in Table 3. The chemical and physical properties of cement are summarized in Table 4 and Table 5, respectively. The dry ingredients were initially mixed and the polyolefin fibers were spread by hand evenly over the concrete mixture to achieve a homogenous dry mixture to prevent balling of fibers in one place. Then, the potable water and superplasticizer were added. Before casting the specimens, the molds were lightly oiled to avoid concrete sticking to their sides.
Table 3.
Details of materials used in concrete mix.
Table 4.
Chemical properties of cement.
Table 5.
Physical properties of cement.
For each mixture, cubic specimens of 150 × 150 × 150 mm (to determine compressive strength), cylindrical specimens of 150 × 300 mm (to determine compressive strength and splitting tensile strength) and prismatic beam specimens of 150 × 150 × 500 mm (to determine the flexural strength) were prepared. Figure 6 shows concrete test specimens. At 24 h after casting, the specimens were demolded and cured in water at 23 ± 2 °C for 28 days.

Figure 6.
Concrete test specimens.
4. Test Procedure
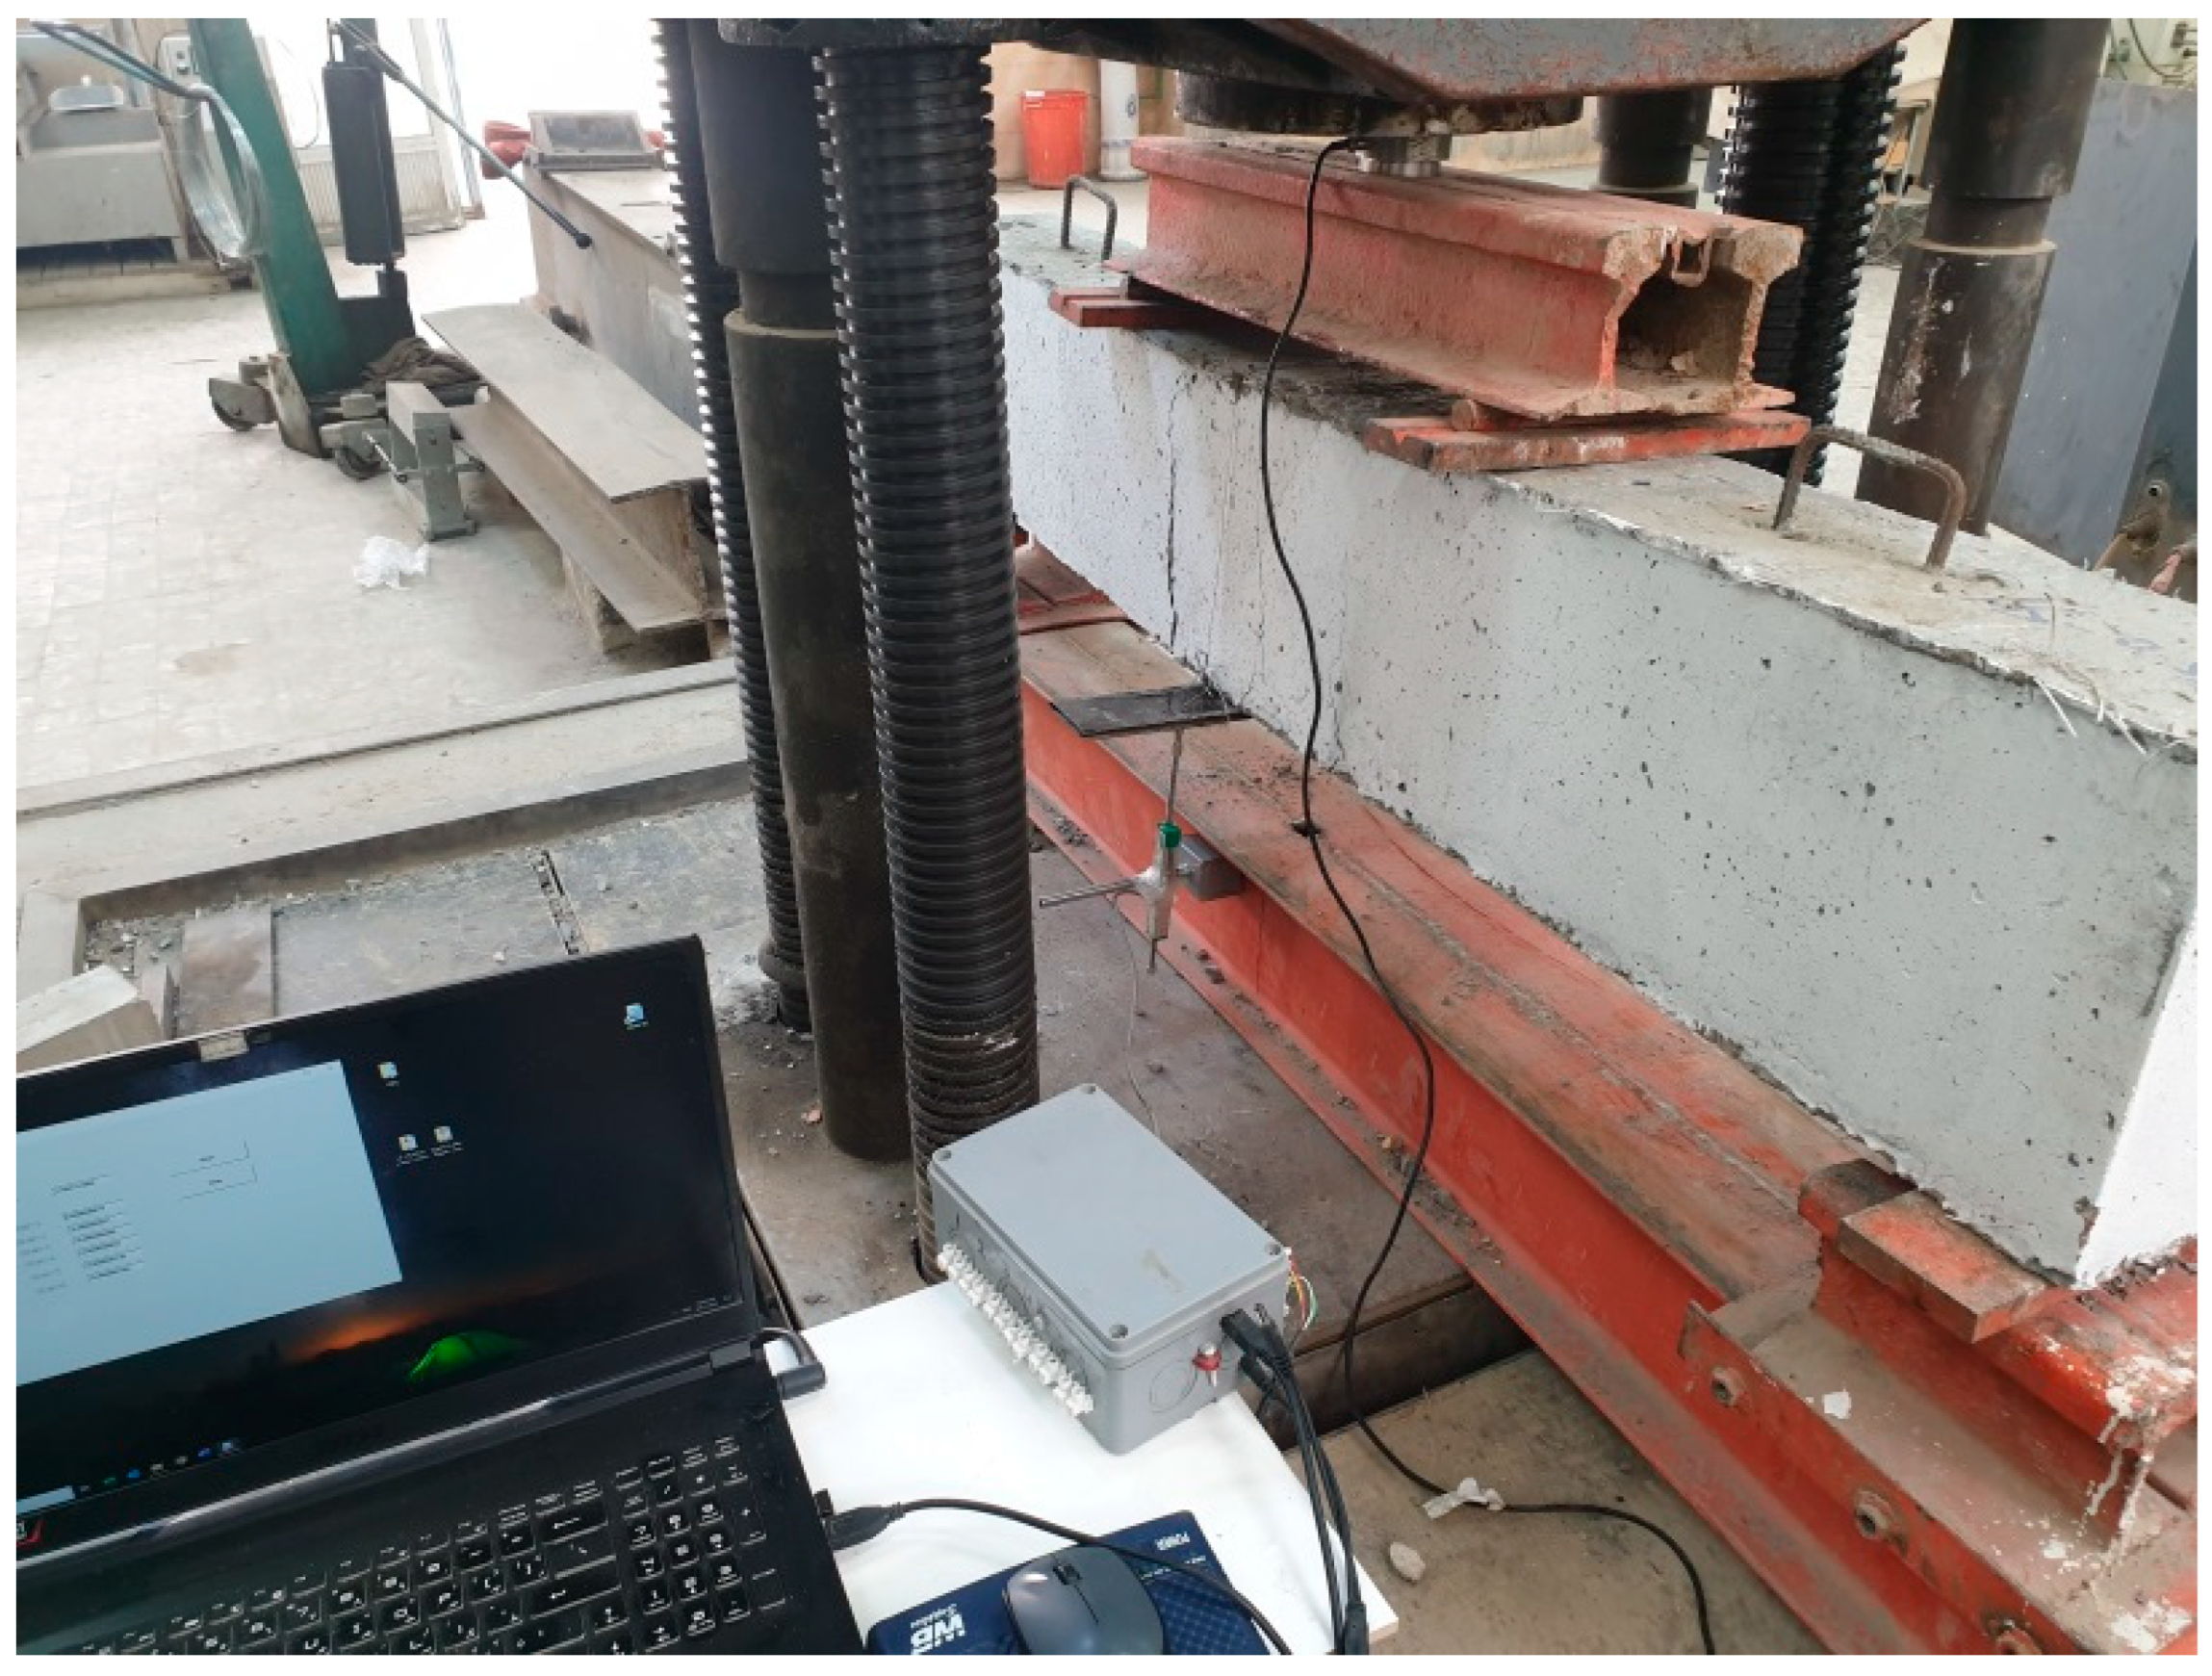
The beam specimens were loaded with two symmetrical concentrated loads in order to achieve a constant moment in the splice zone. The tests were carried out using a 2 MN capacity MTS hydraulic testing machine, with a spreader beam spanning 60 cm between two concentrated loads. The spacing between the two concentrated loads was considered to be the splice length plus the member height. For the purpose of transferring load to a data acquisition system, a load cell was installed underneath the hydraulic jack and atop the spreader beam. To measure the midspan displacements of the specimen, a linear variable displacement transducer (LVDT) was placed at its center, as shown in Figure 7. Therefore, in the data logger, load increments and corresponding displacements were recorded directly. A load-displacement curve was plotted for each specimen, and its ductility was assessed.

Figure 7.
Test setup.
Compressive strength testing of cubic concrete specimens and cylindrical concrete specimens was conducted. Splitting tensile strength testing of cylindrical specimens was carried out in accordance with ASTM C496-17 [19]. The flexural strength testing was conducted on prismatic beam specimens under four-point loading in accordance with ASTM C78-21 [20]. These tests were conducted on the same day of testing of the spliced beam specimens. The test results of the specimens are summarized in Table 6.
Table 6.
Mechanical properties of the concrete.
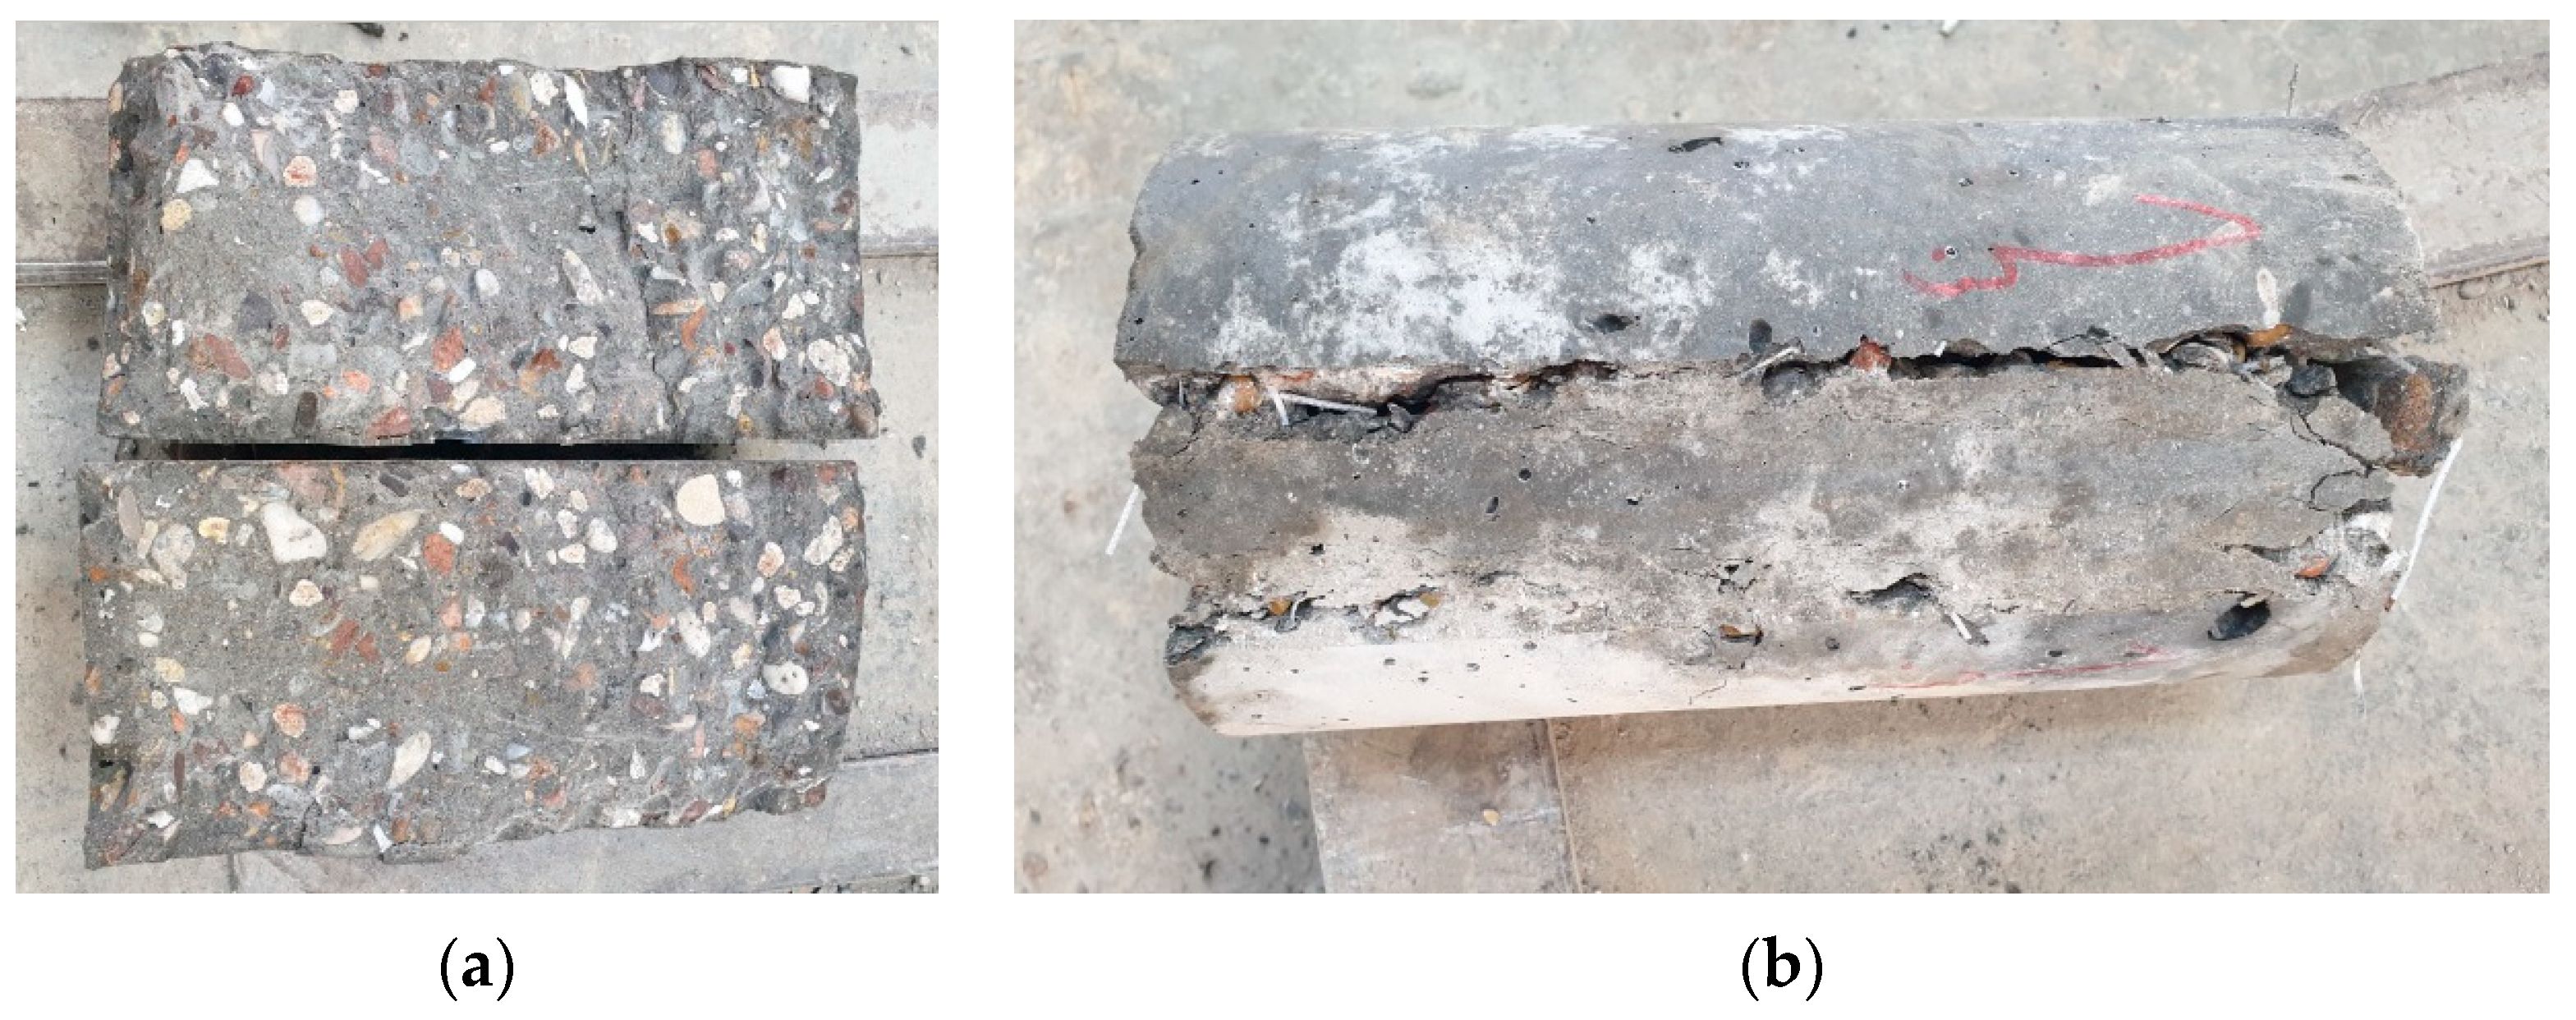
It was noted that the compressive strength was not affected significantly by macro plastic fibers. However, the cubic concrete specimens that were reinforced by plastic fibers failed with many minor cracks, in contrast to the plain concrete that failed catastrophically. The flexural strength and splitting tensile strength tests showed that the failure mode of the specimens without fibers was a brittle failure; however, the specimens with fibers showed ductile failure. Figure 8 shows concrete specimens with and without fiber after splitting test. A random distribution of discontinuous fibers has the role of bridging cracks that develop and providing some ductility post-cracking.
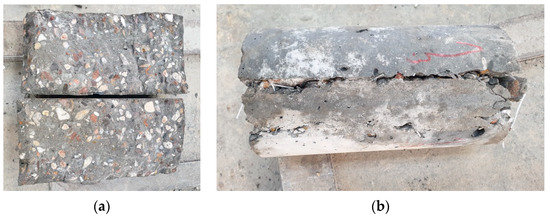
Figure 8.
Splitting test for concrete specimens: (a) without fiber; (b) with fiber.
5. Test Results and Discussion
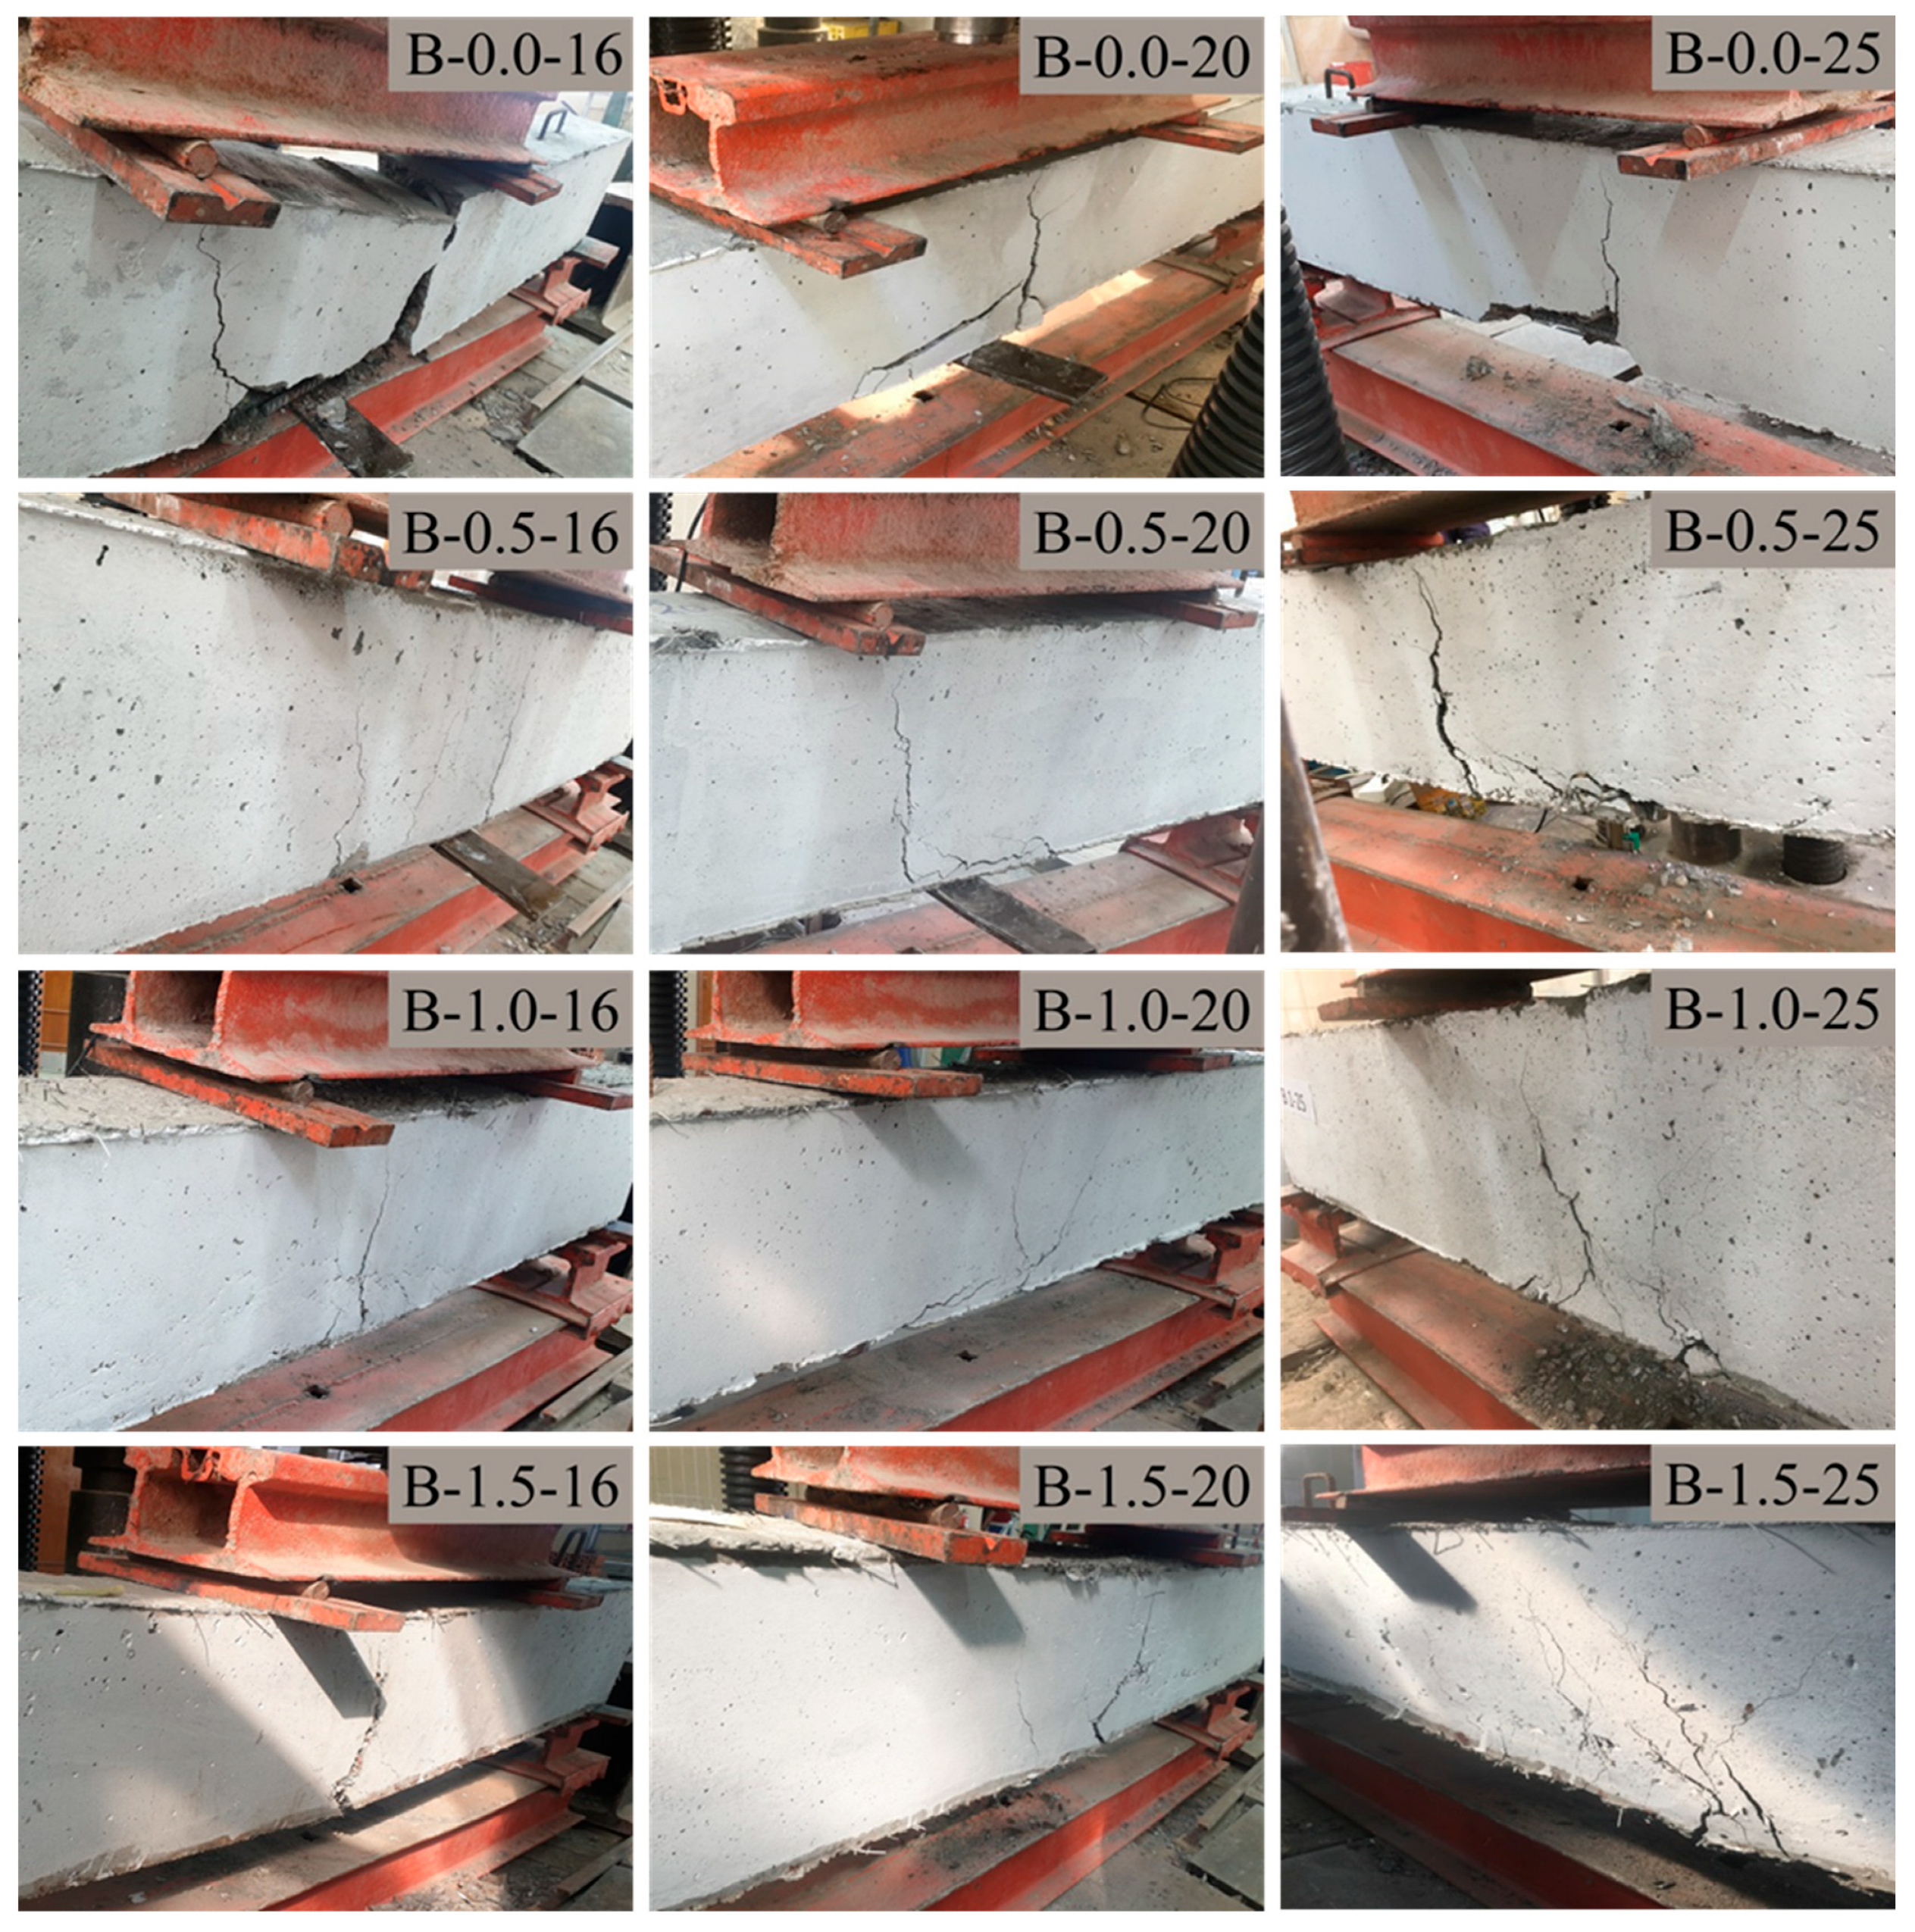
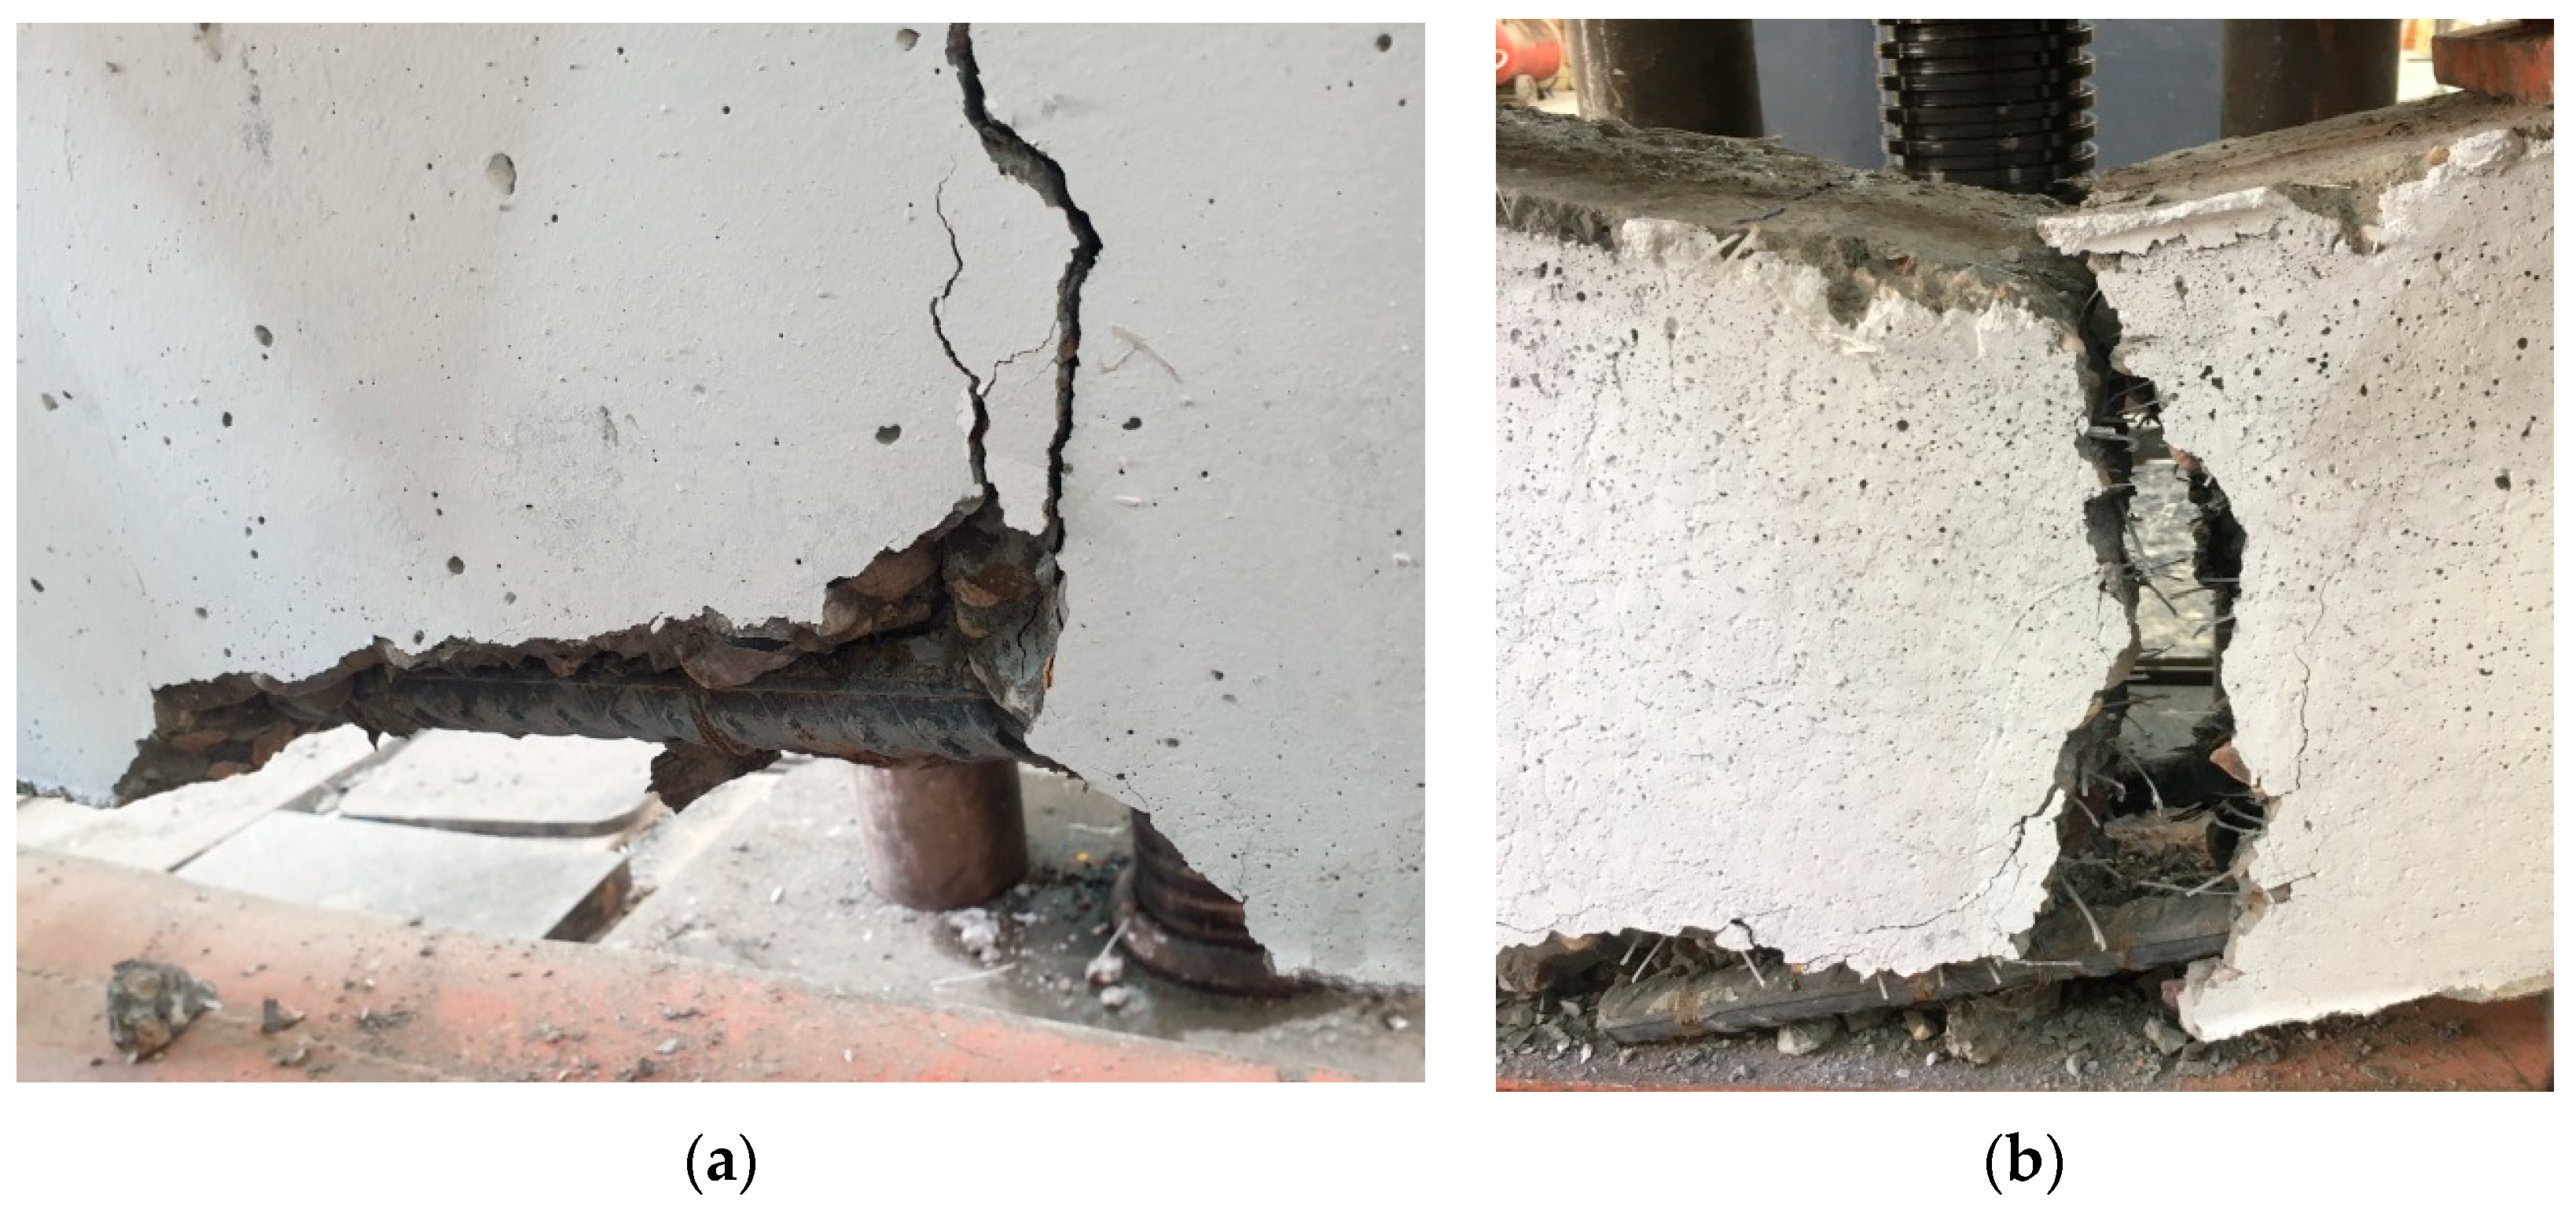
The failure mode observed in all beam specimens was face and side splitting. All of them developed their first flexural cracks randomly outside the splice length on the tension side in the constant moment zone. This is due to the fact that the reinforcement area in the region of the splice was twice that of the regions outside the splice. With an increase in applied load, cracks appeared throughout the constant moment zone including the splice length. The splice region eventually failed, causing the failure of the beam. Figure 9 shows all of the tested lap-spliced beam specimens and Table 7 provides a summary of the first cracking load (Pcr), ultimate load (Pu) and corresponding deflections (δcr and δu) at midspan for each tested beam specimen. The failure of beams without fibers and with a small amount of fibers of (Vf = 0.5%) occurred after longitudinal splitting cracks occurred at the side and bottom covers on the tension side of beam specimens at the splice region. As a result of longitudinal cracks forming on these surfaces, the covers in the splice regions blew apart, as shown in Figure 10. A further deflection was applied to the beams after ultimate loading to intensify the severity of the splitting. As a result of the added splitting, the bottom and side concrete covers could be easily removed to reveal the failure plane in the splice area.
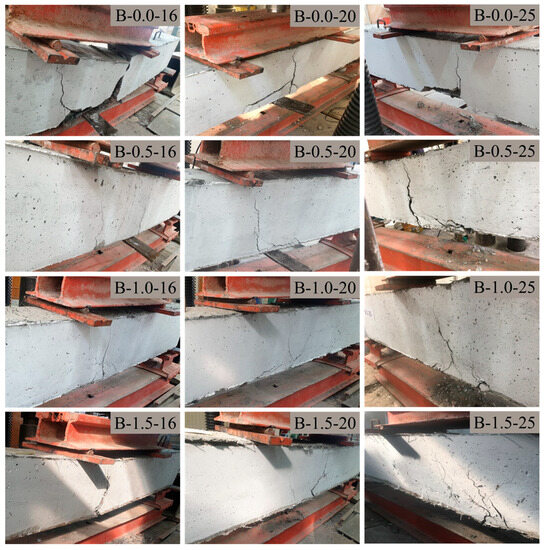
Figure 9.
Tested lap-spliced beam specimens.
Table 7.
Results of the splice beam tests.
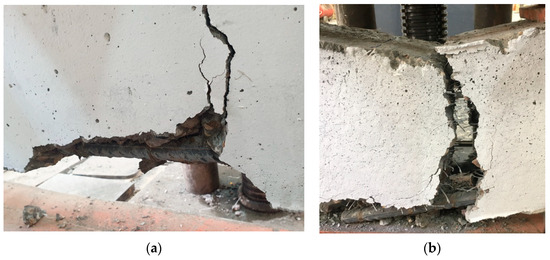
Figure 10.
Beam specimens of 25 mm bar diameter after concrete splitting: (a) for Vf = 0; (b) for Vf = 0.5%.
It was noted that higher fiber content resulted in improved adhesion between the lapped spliced rebars and concrete. A similar observation was reported by [1,2,21]. The failure mode of specimens without fibers or with fiber content of Vf = 0.5% was sudden and brittle; however, with increasing fiber content in the splice region, failure became gradual and more ductile.
It was shown that a few large cracks developed in the plain beam specimens before failure; however, dense micro-cracks developed in the fiber-reinforced beam specimens.
For the purpose of comparison among all beam specimens, the ultimate loads and bond strengths were normalized at the target compressive strength of 28 MPa. The ultimate load was adjusted by multiplying it by , where the compressive strength () of the tested beam was measured at the day of testing.
Tensile force is transferred between spliced bars through surrounding concrete by the bond between them [22]. Based on the assumption that the bar embedded in concrete has a uniform bond stress distribution, the average bond stress () is determined by dividing the force developed in the steel reinforcement by the contact area between the reinforcement and concrete as follows.
where
- : cross-sectional area of the reinforcing bar (mm2);
- : maximum tensile stress developed in the reinforcing bar (MPa), which was calculated using elastic cracked section analysis;
- : nominal bar diameter (mm);
- : lap splice length (mm).
The average bond stresses () associated with the maximum tensile stress () developed in the reinforcement are presented in Table 8. The ultimate load, reinforcement stress, bond stress and bond stress ratio presented in Table 8 are normalized values with respect to of 28 MPa. The bond stress ratio is the ratio between the bond stresses of the beam with fiber to that of the counterpart beam without fiber.
Table 8.
Normalized bond stress and bond stress ratio.
6. Load-Deflection Behavior
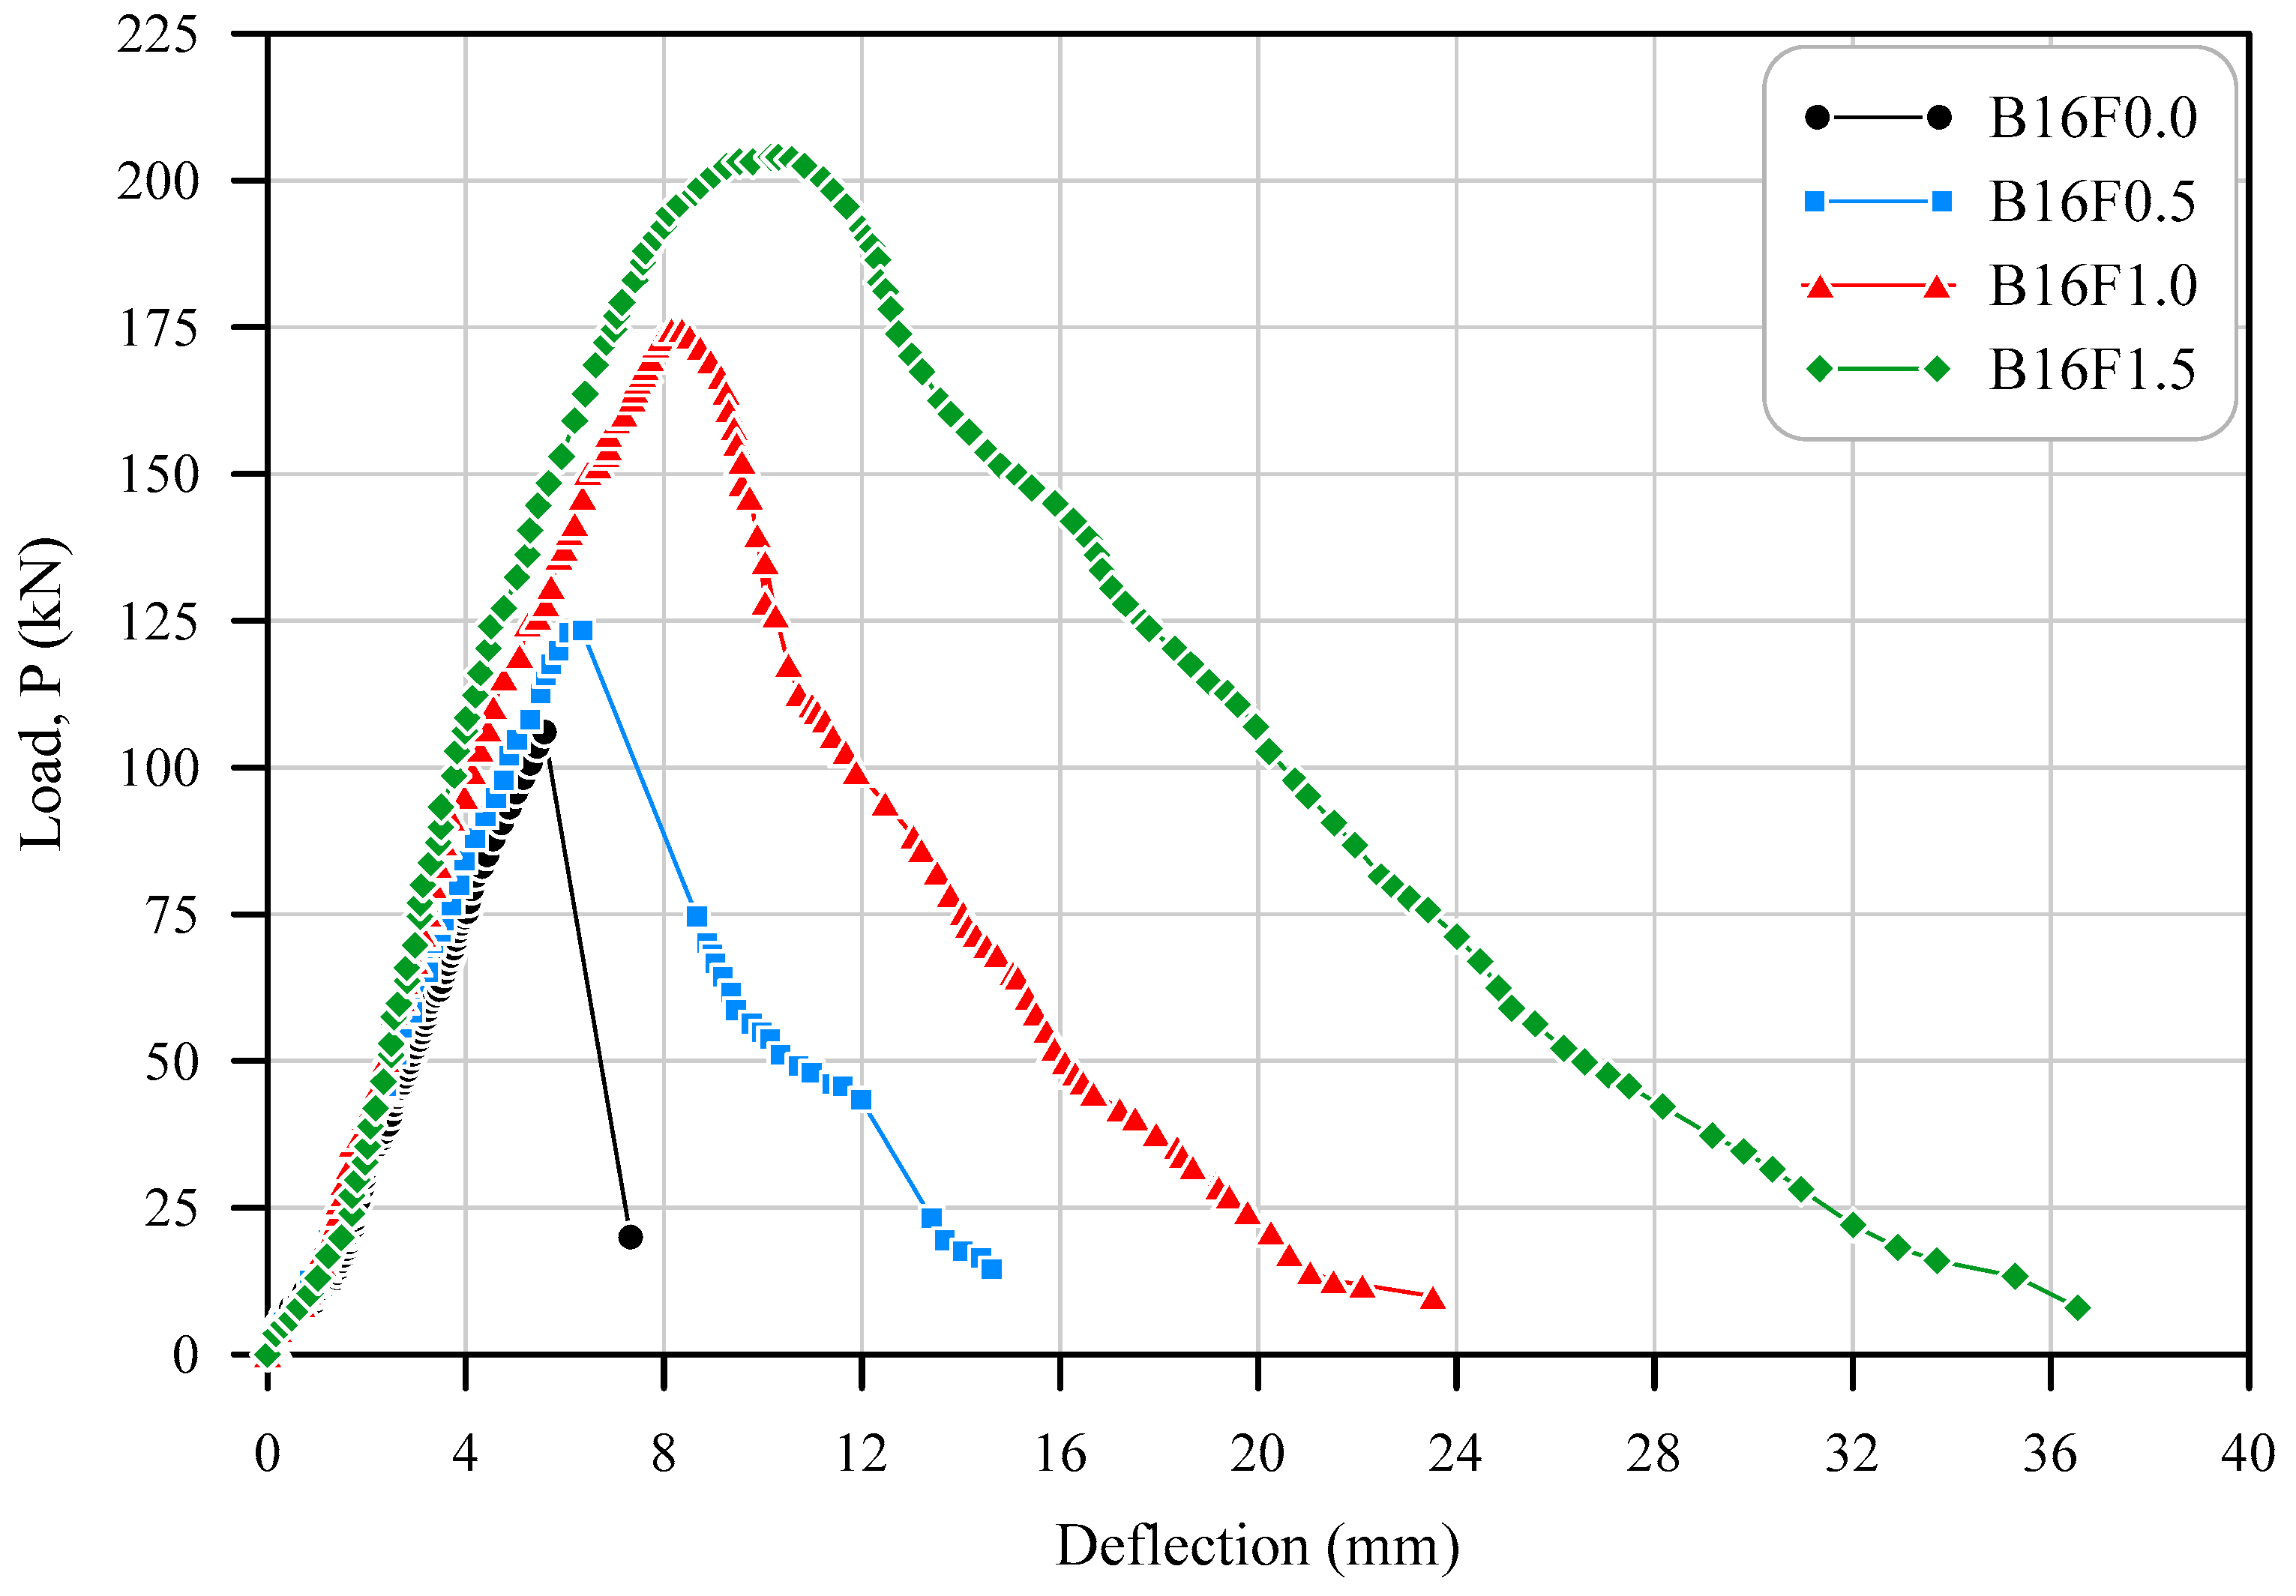
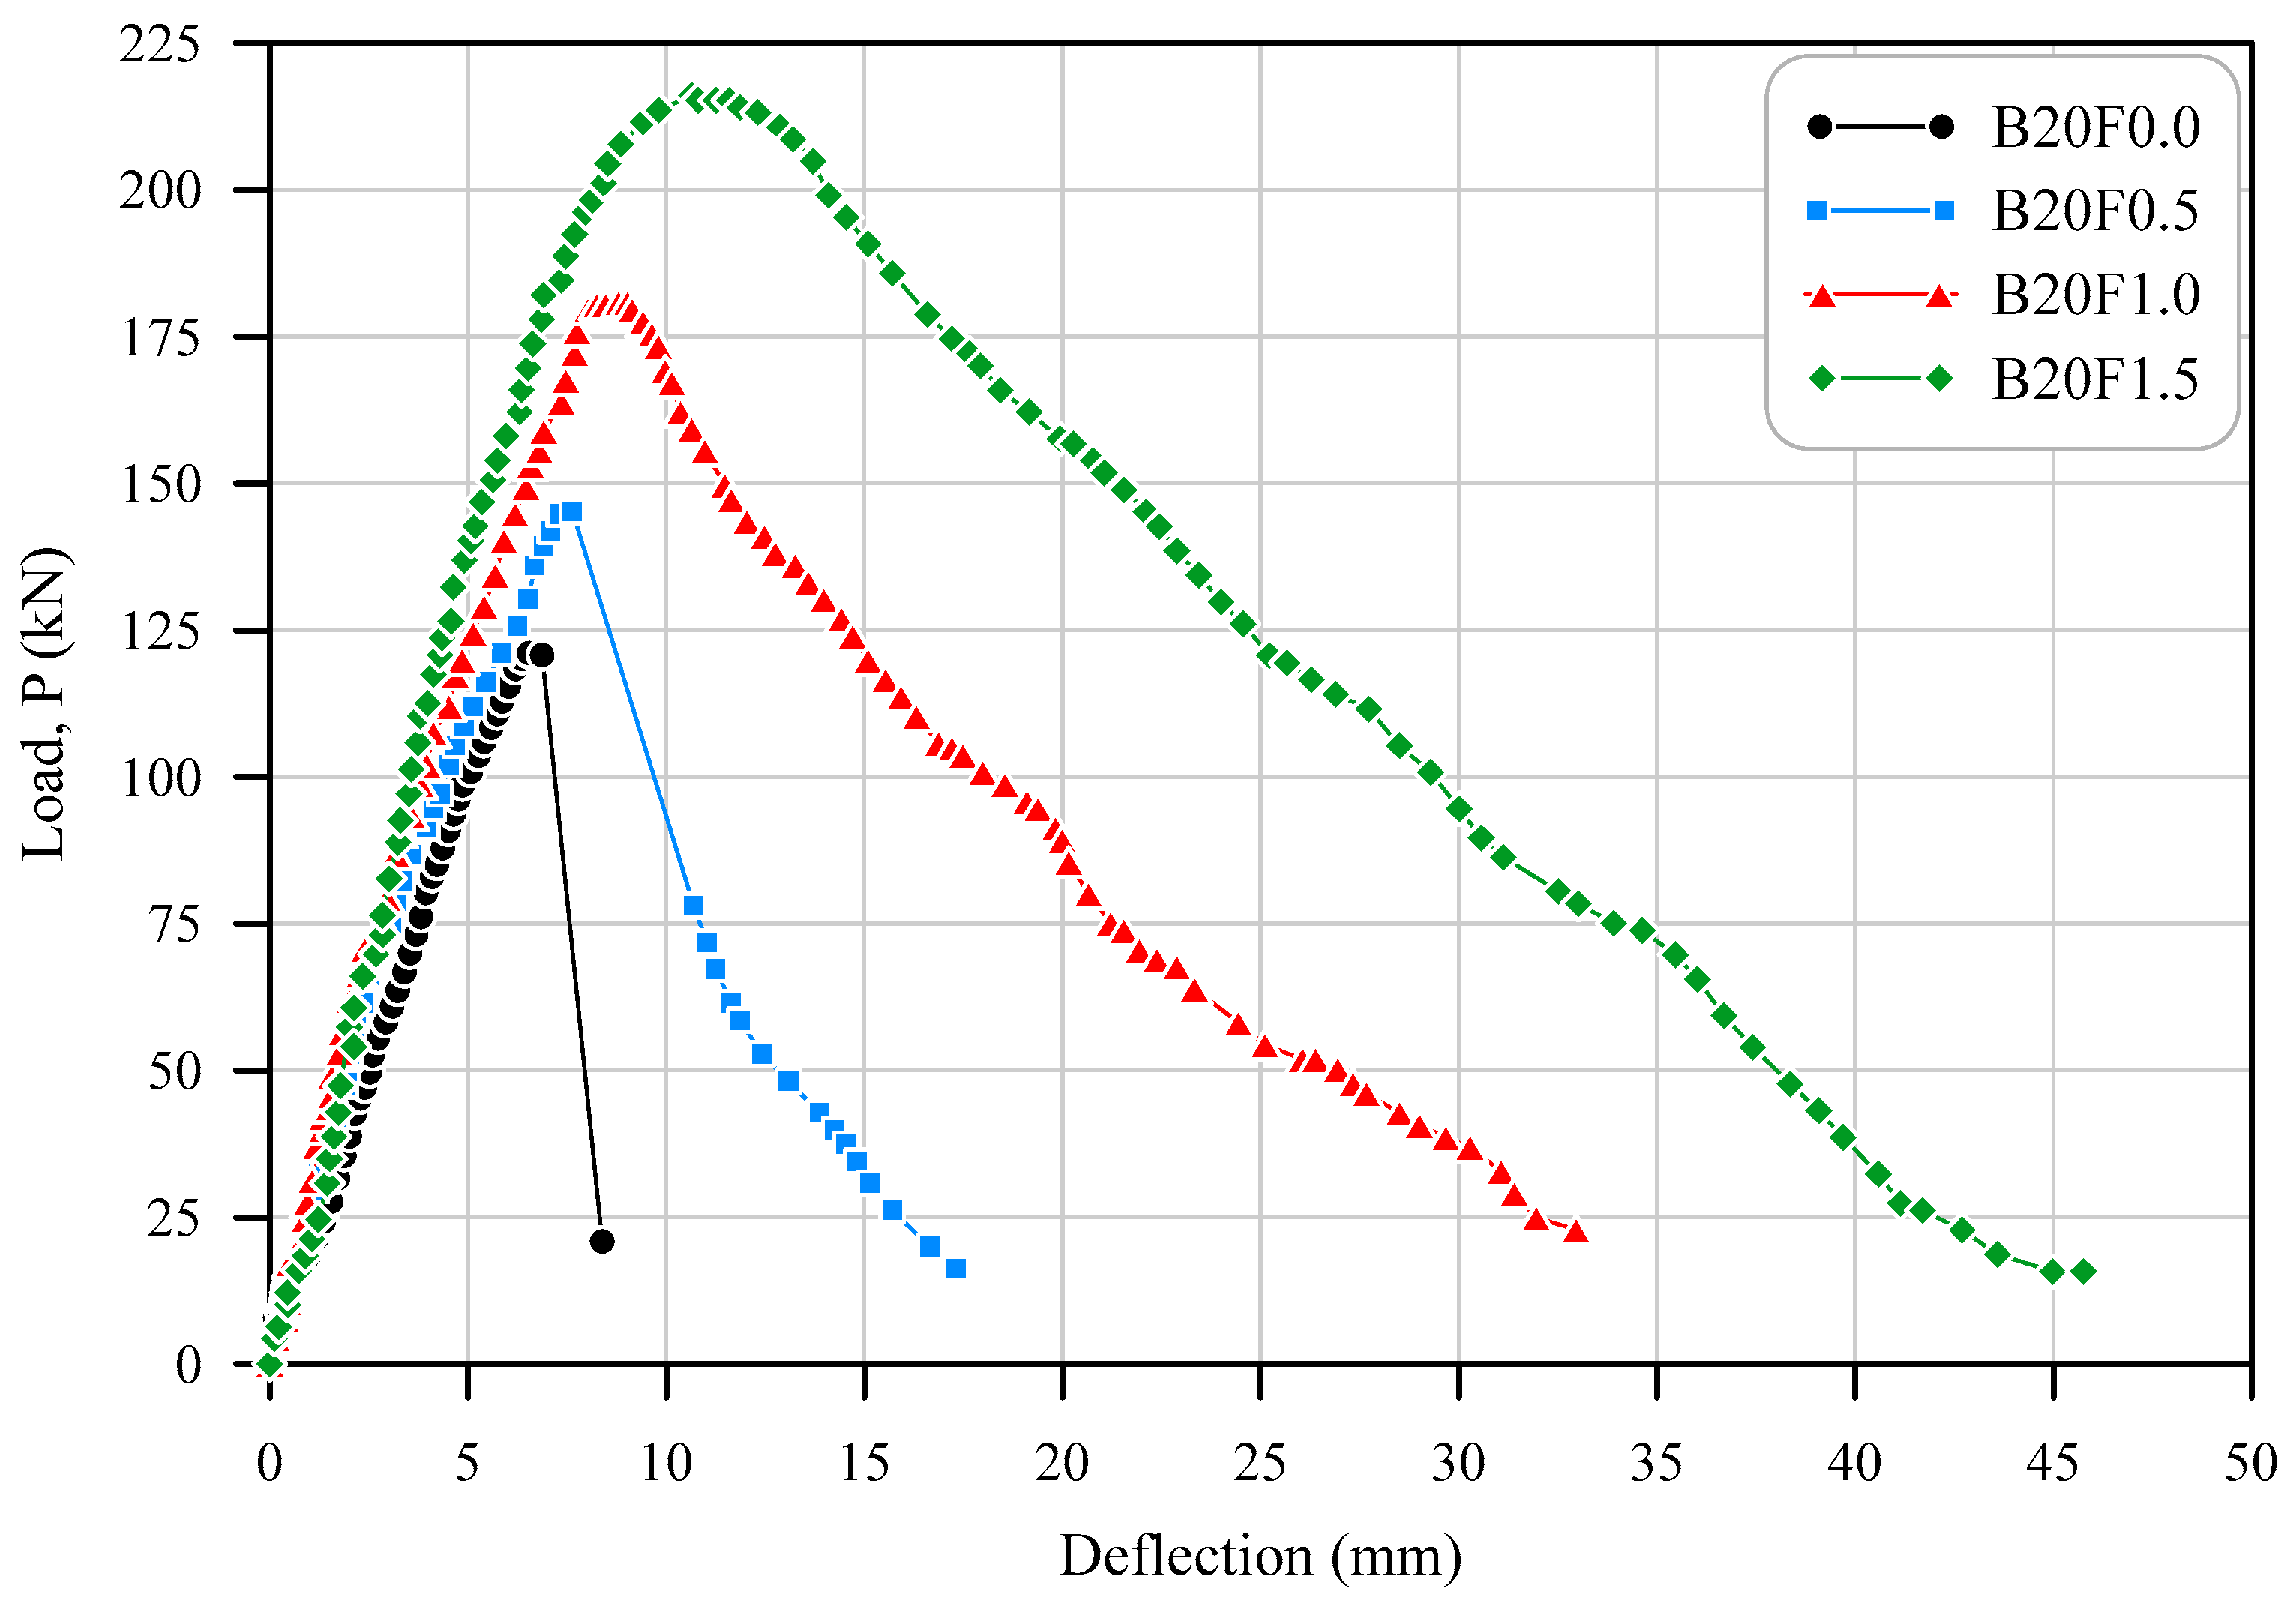
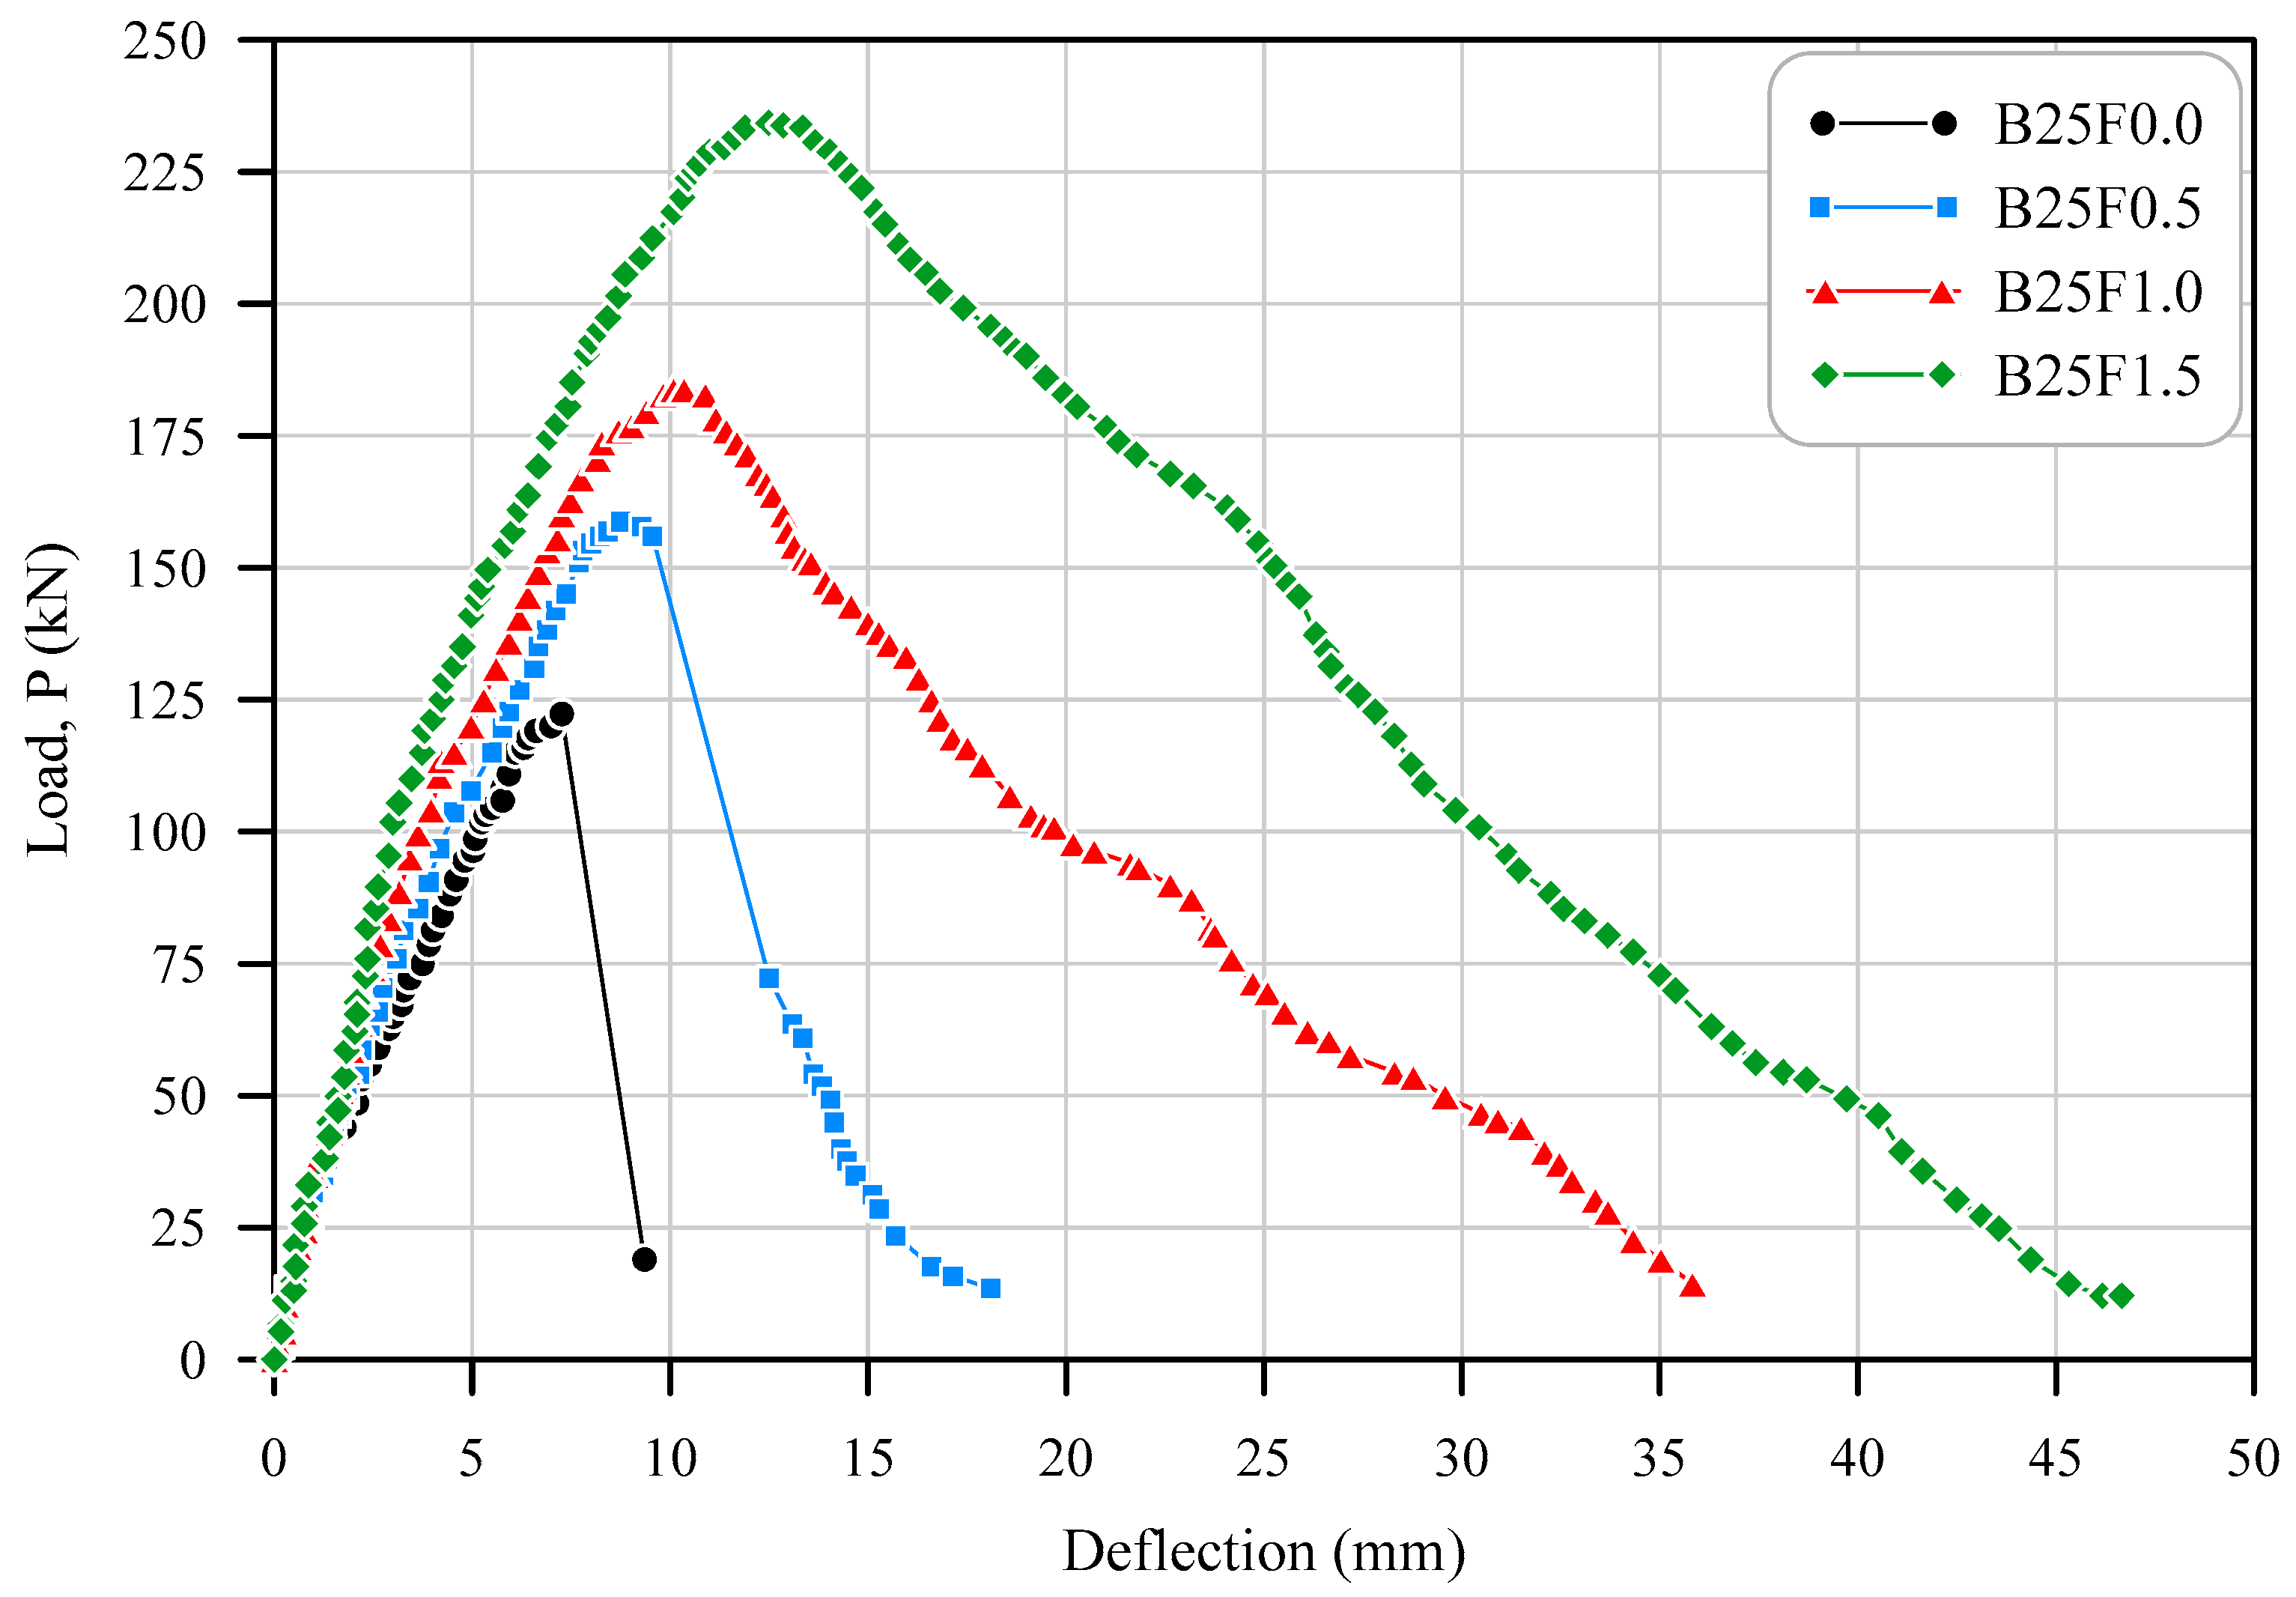
The behavior of the tested beams in terms of load-deflection responses for the three series is shown in Figure 11, Figure 12 and Figure 13. For the purpose of comparison, the beam with no fiber and the beams with different percentages of fibers in the same series were plotted together. In general, the load-deflection response of the beam comprised three stages: stiff pre-cracking stage, a post-cracking stage from cracking up to the peak load where splitting bond failure occurred, and a post-failure stage with gradually decreasing stiffness.
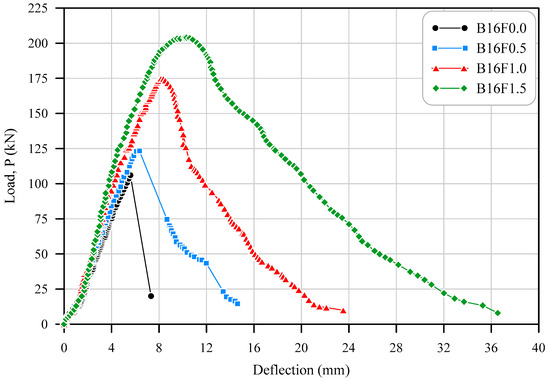
Figure 11.
Load versus midspan deflection plot of beam specimens of Series (1).
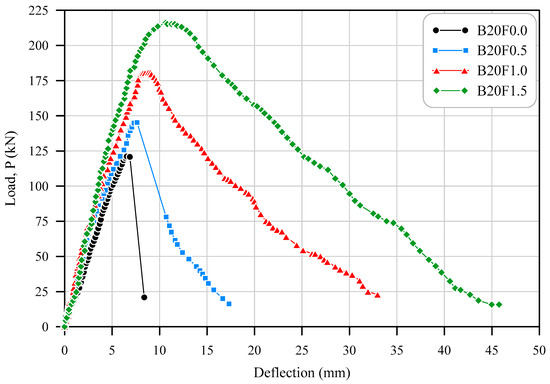
Figure 12.
Load versus midspan deflection plot of beam specimens of Series (2).
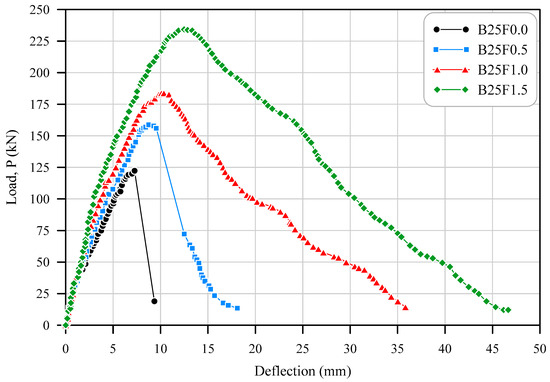
Figure 13.
Load versus midspan deflection plot of beam specimens of Series (3).
In all series, it was obvious that the inclusion of macro polyolefin fibers in the splice zone of reinforced concrete beam specimens affected the flexural stiffness of the beam specimens before and after the flexural cracking load. The flexural stiffness of the beam specimen increased with increasing fiber volume fraction. With a higher percentage of fibers, flexural stiffness might increase due to greater concrete confinement at tension lap splices. In addition, in all test series the ultimate loads of fiber-reinforced beam specimens increased with increasing fiber volume fraction.
The beam specimens with no fibers exhibited brittle failure, where an abrupt drop in the load-deflection curve occurred after reaching the ultimate load with only a small amount of displacement. This observation could be attributed to a loss of bond that occurred between steel and concrete at the lap splice. The existence of fiber reinforcement in the splice zone resulted in a more ductile and gradual failure mode than that in companion beams with no fibers. As a result of the bridging effect of the fibers, the crack in the fiber-reinforced specimen opened slowly, resulting in further deformation of the reinforcing bars. Ductility was demonstrated by a relatively lesser percentage reduction in the ultimate load-carrying capacity as deflection increased.
7. Bond Strength
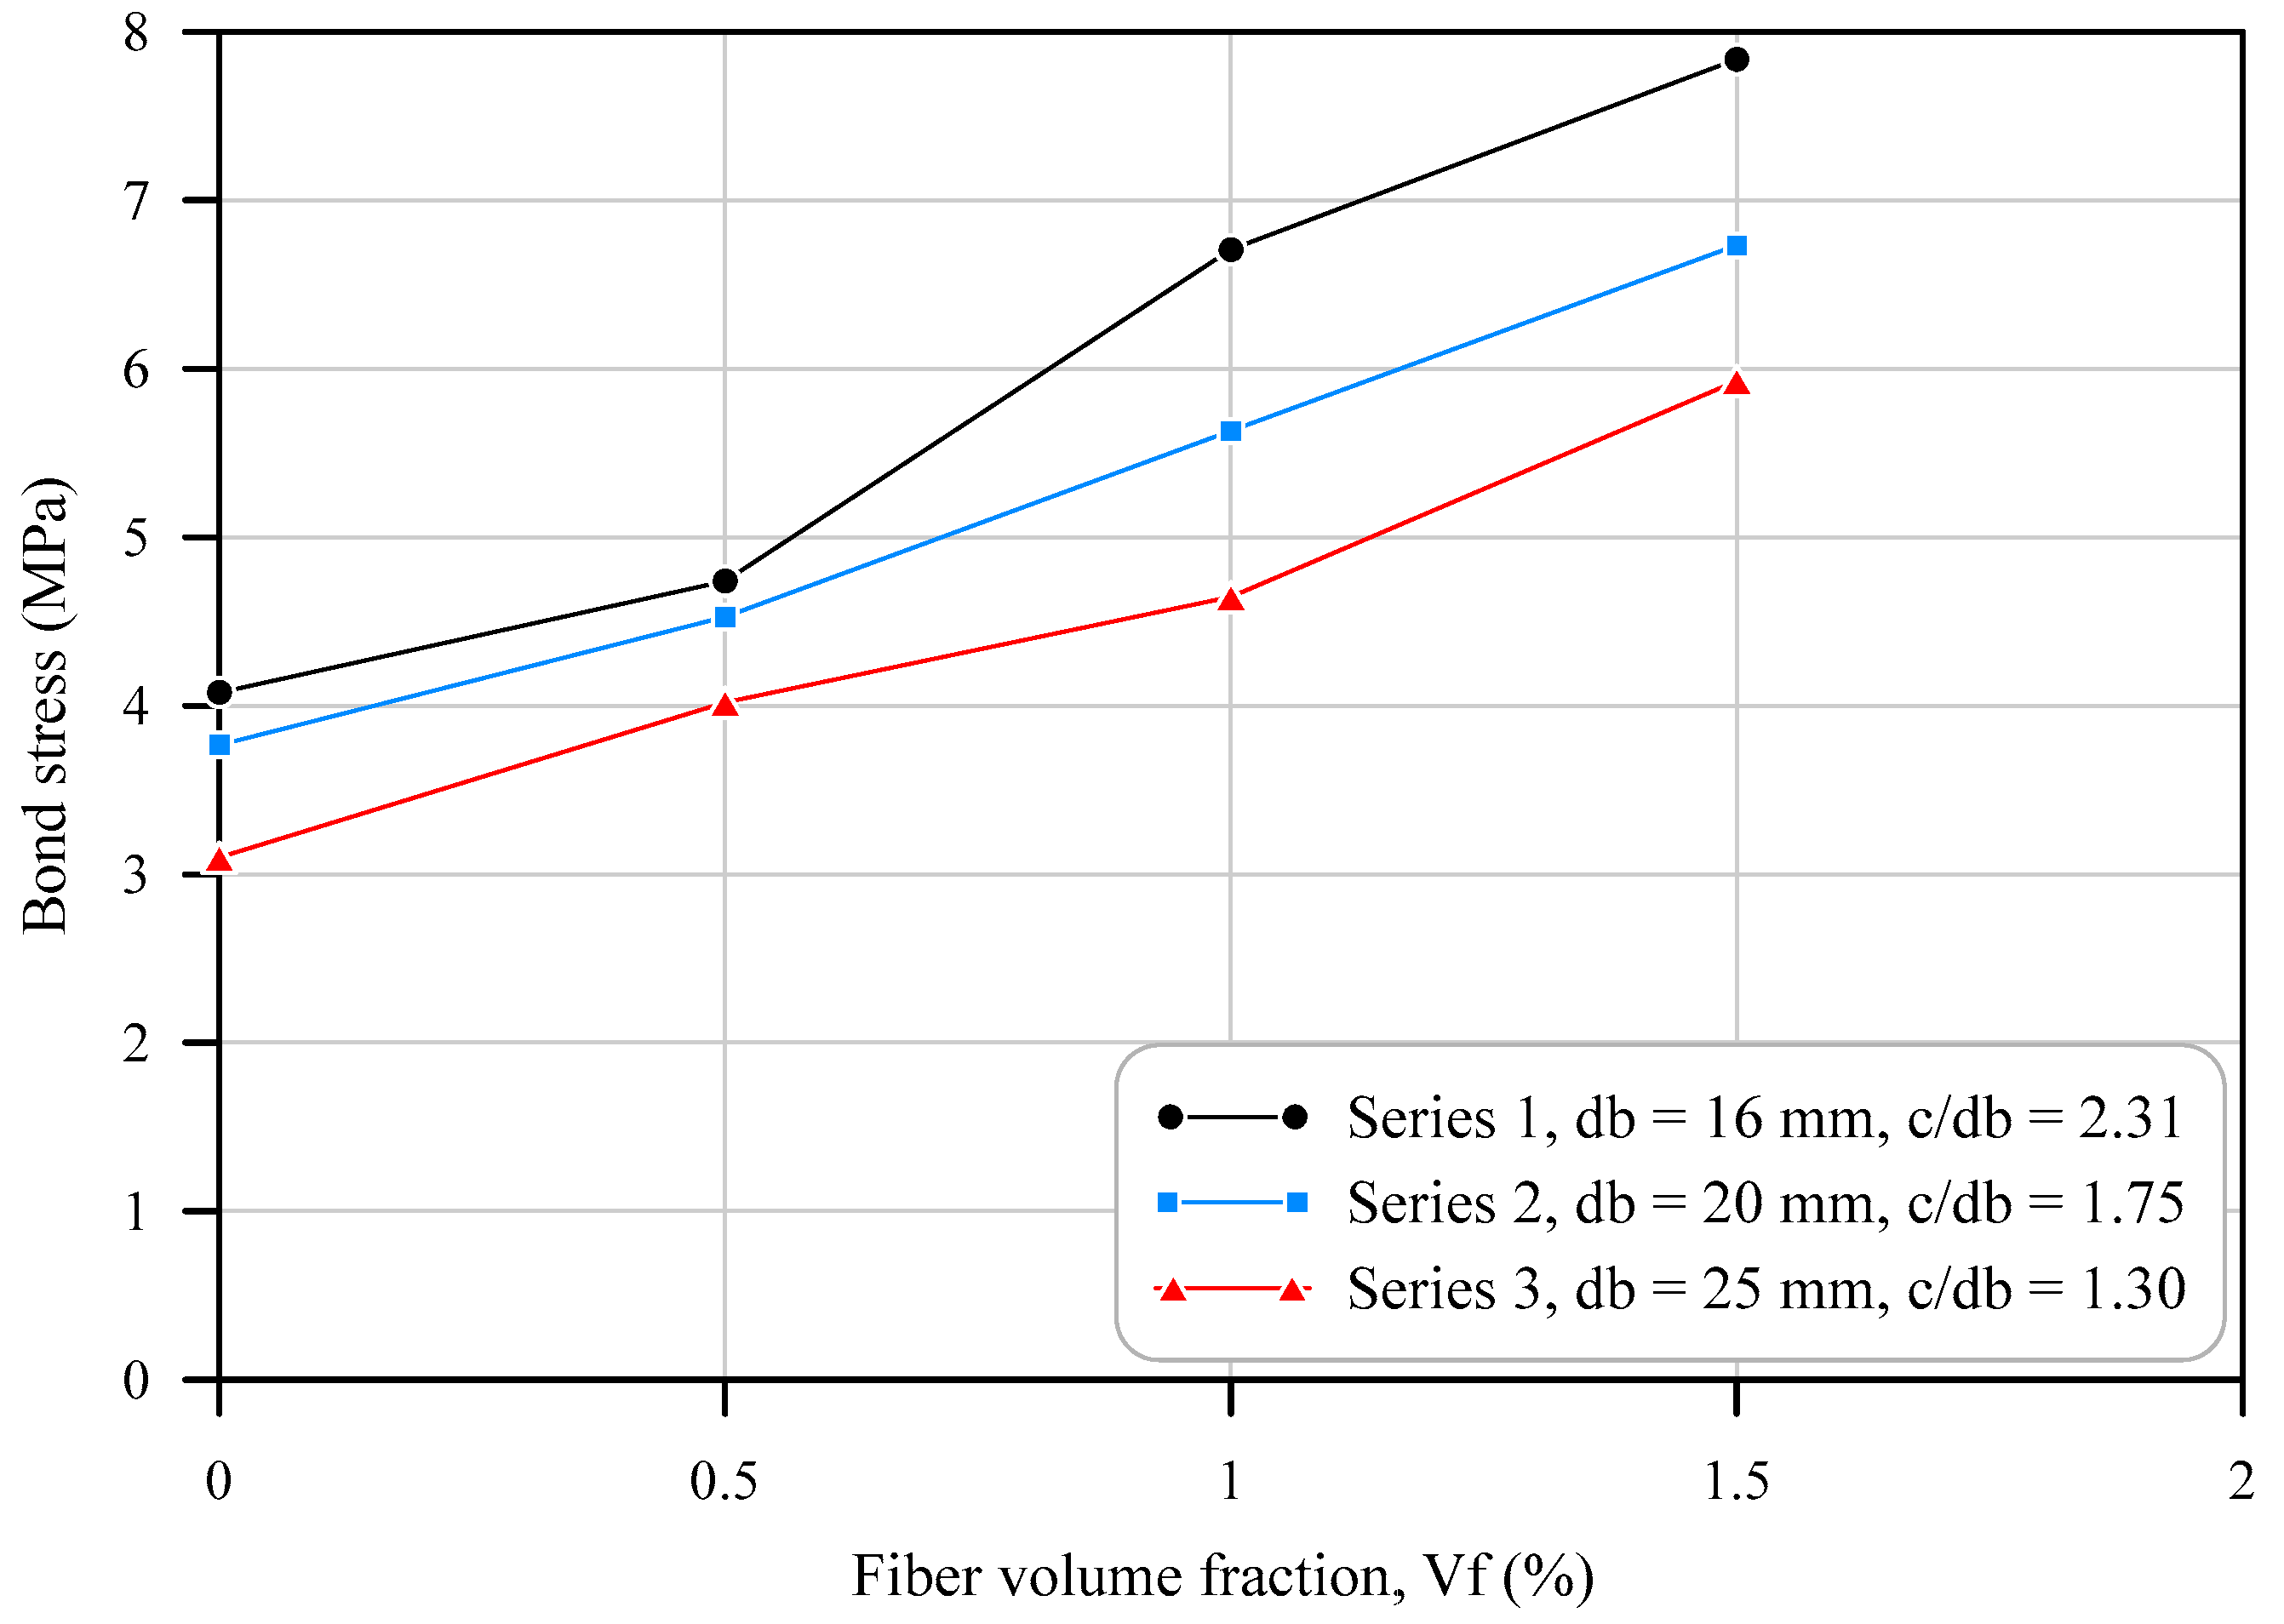
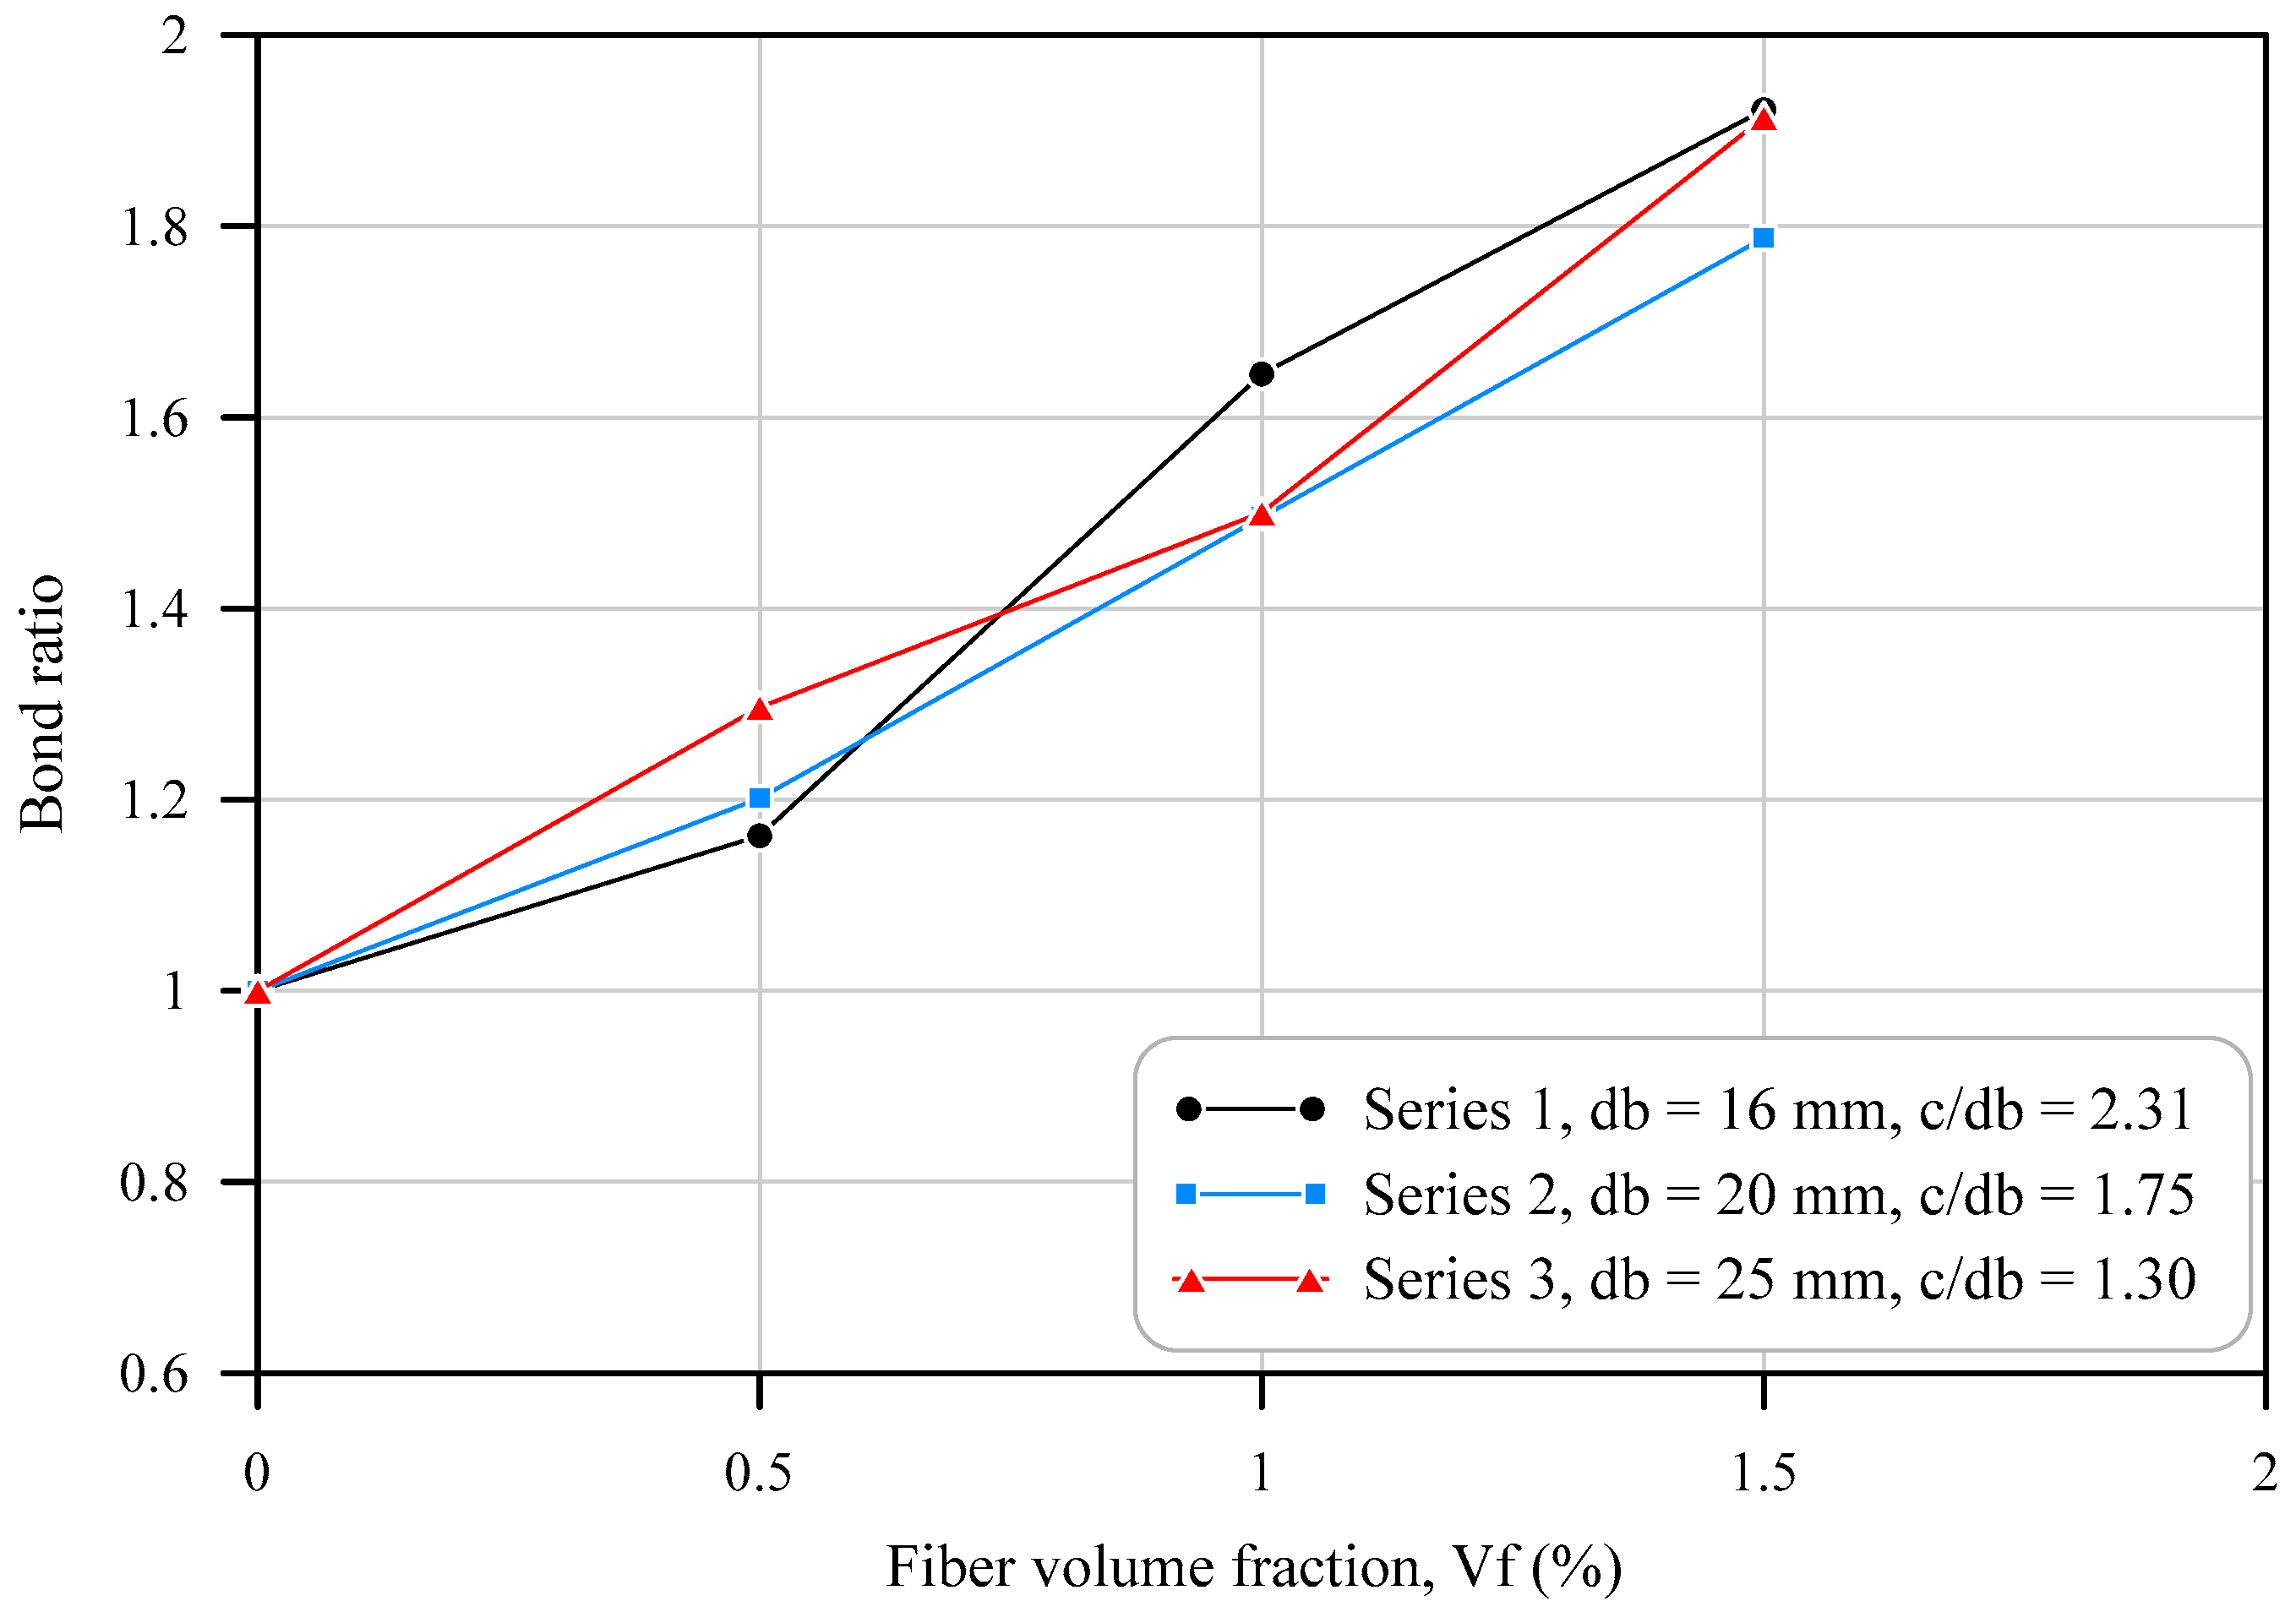
The bond stresses associated with the maximum tensile stress developed in the reinforcement and the bond stress ratio are presented in Table 8. The bond stresses of tested beams with different fiber contents in each series are plotted in Figure 14 and the bond stress ratios for each series are plotted in Figure 15.
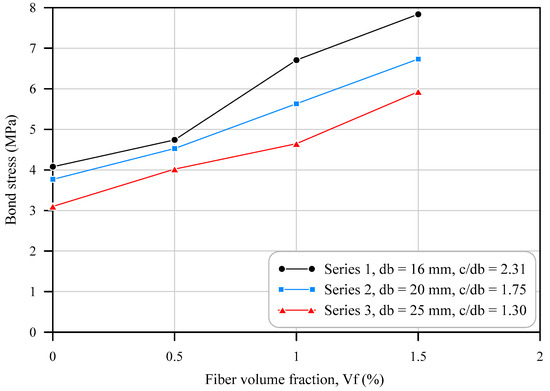
Figure 14.
Bond stress versus fiber content.
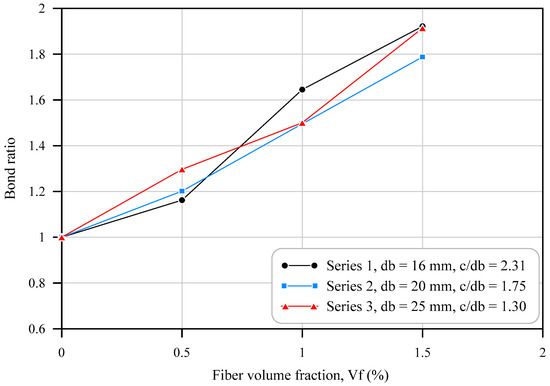
Figure 15.
Bond ratio versus fiber content.
The results clearly demonstrated a consistent increase in the bond stress as the fiber contents increased in all test series. In addition, in Series 1 (db = 16 mm and c/db = 2.31), the steel stress exceeded the yield strength for fiber volume fraction (Vf) of 1.0, and 1.5%. It was noted that the increase in bond stress did not depend on the bar diameter (db) or the ratio of concrete cover-to-bar diameter (c/db). In Series 1 (db = 16 mm and c/db = 2.31), the increases in bond strengths of the fiber-reinforced specimens as compared to the plain concrete specimens were about 16, 65 and 92% for fiber volume fraction (Vf) of 0.5, 1.0 and 1.5%, respectively. The corresponding increases in Series 2 (db = 20 mm and c/db = 1.75) were 20, 50 and 79%. In Series 3 (db = 25 mm and c/db = 1.30), the increases in bond strengths were 30, 50, and 91%.
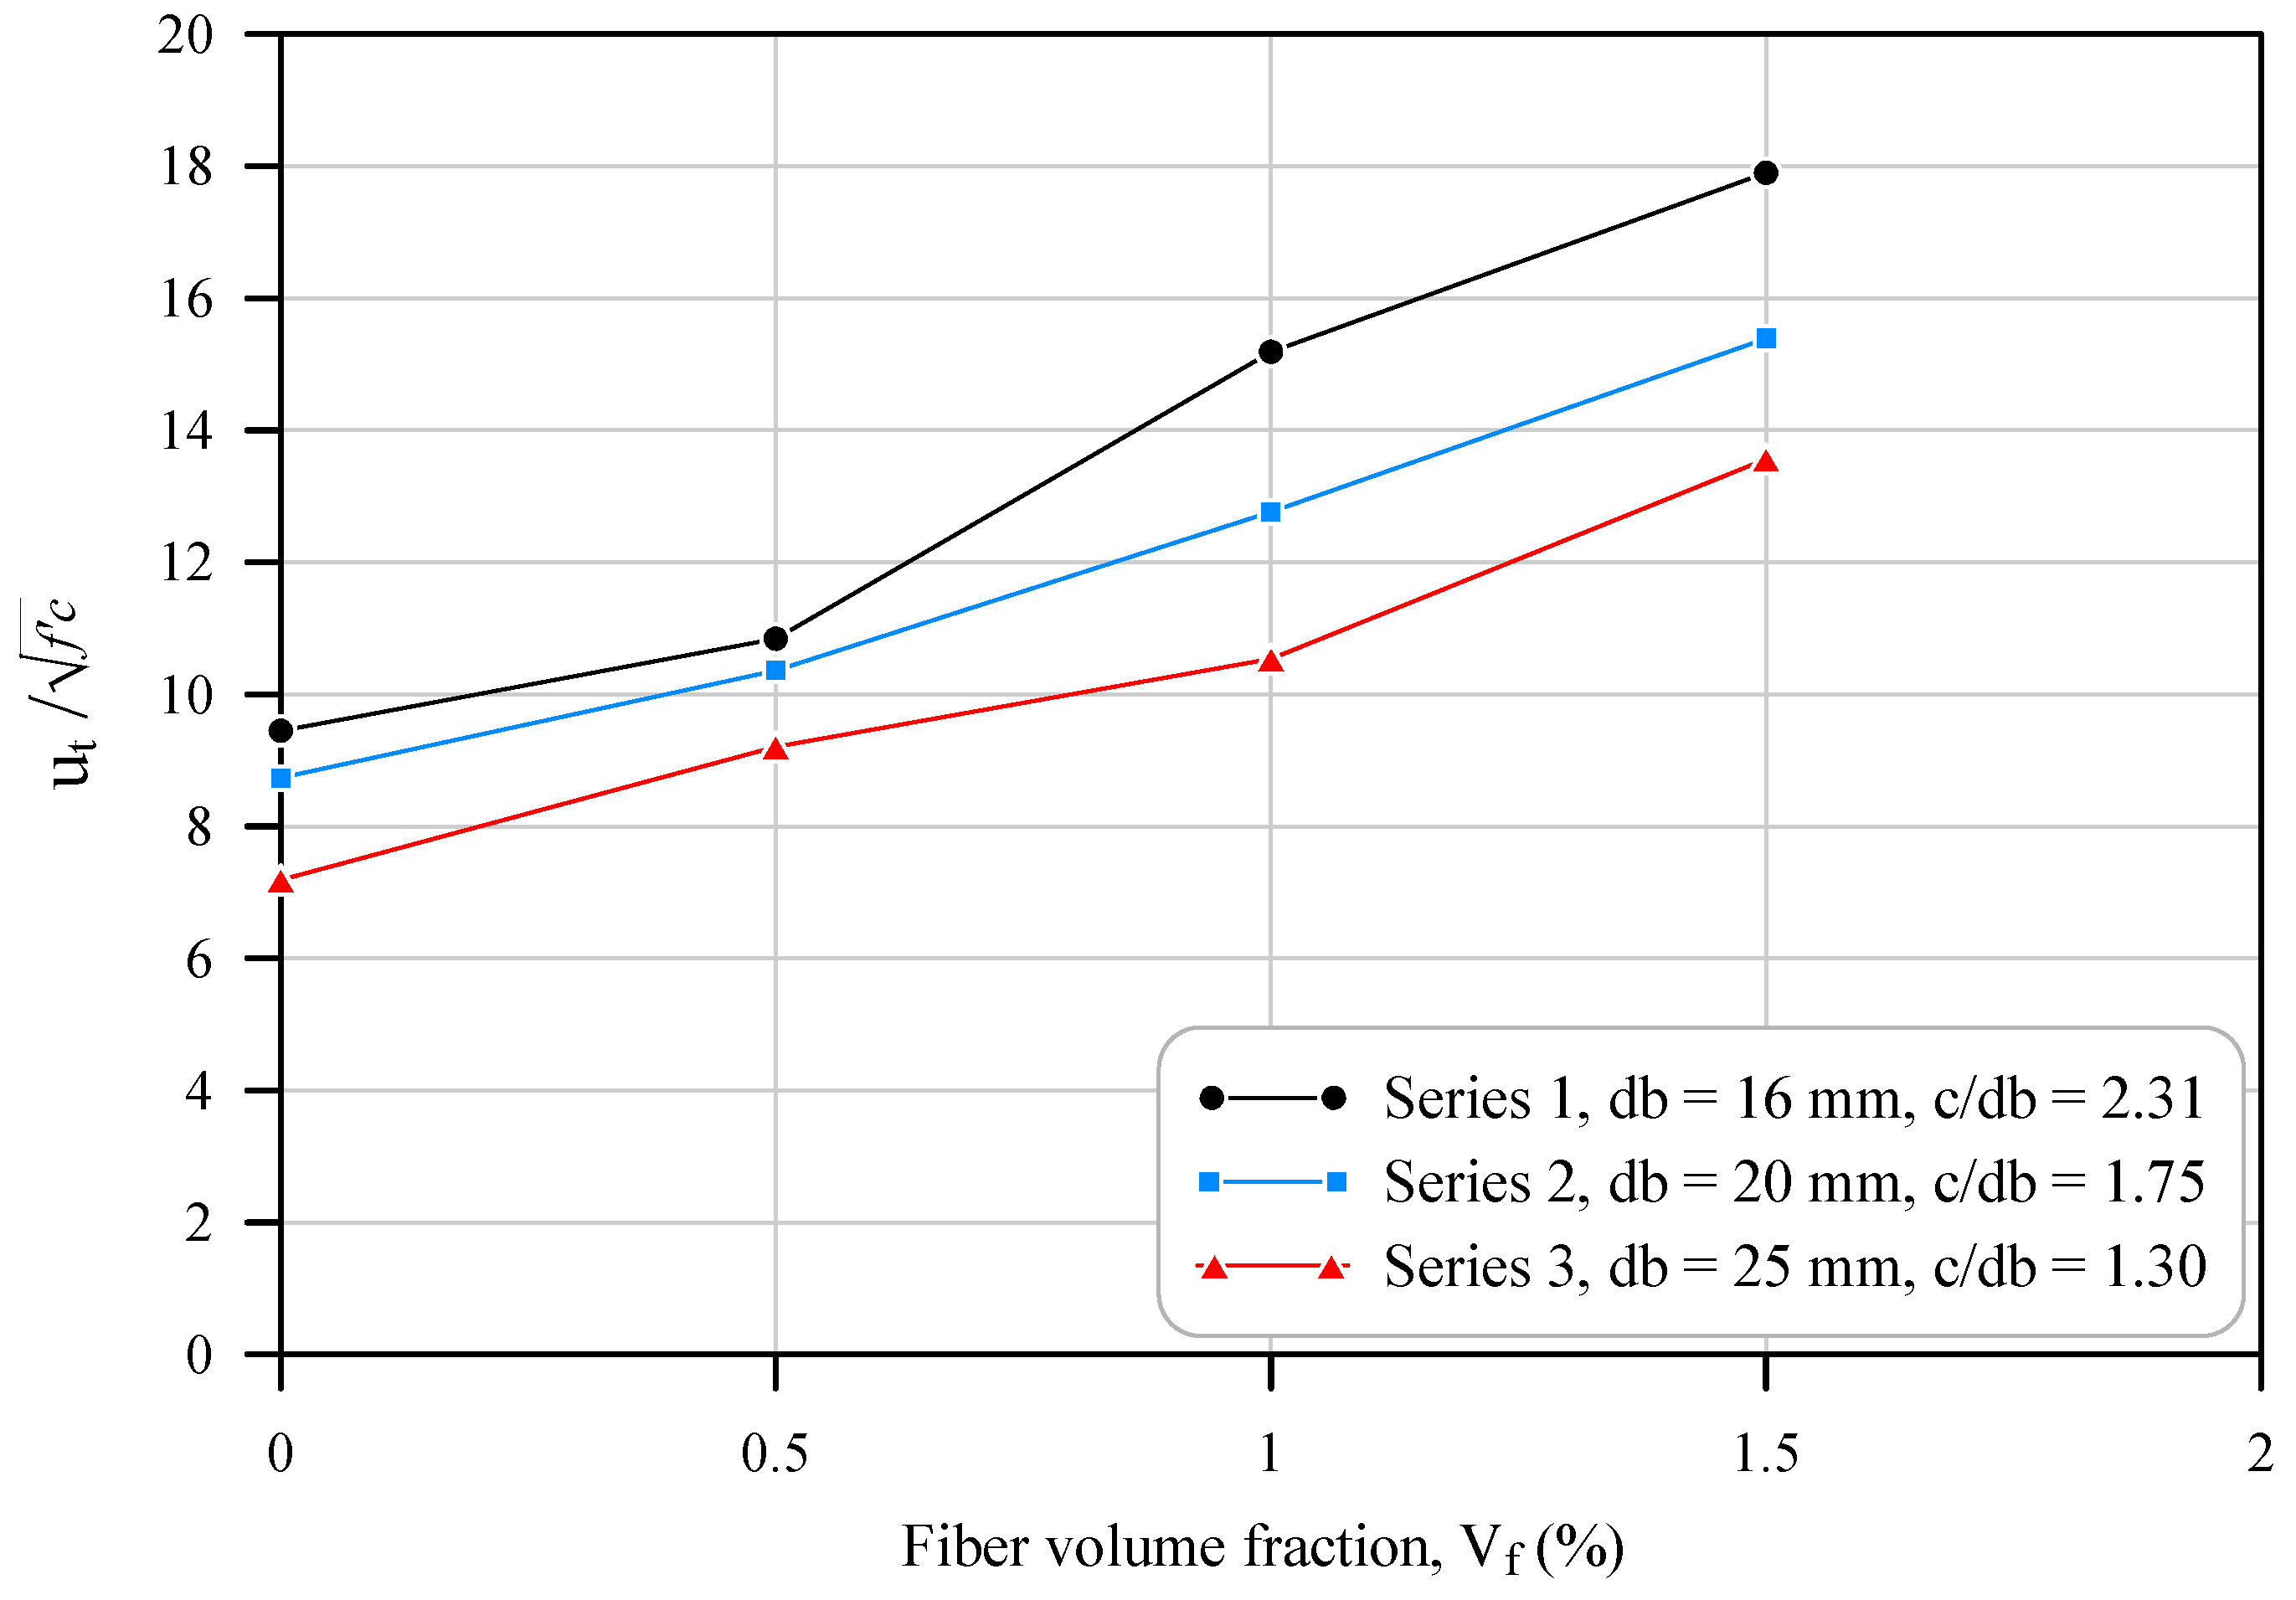
In order to determine the fiber effect on average bond strength (ut) as a function of concrete strength (), (the units of and are in psi) was determined for all test specimens, as summarized in Table 9, and plotted versus fiber volume fraction (Vf) in Figure 16. It can be observed that in all test series, the beam specimens with fiber volume fractions of 1 and 1.5% exceeded in comparison to the companion plain concrete specimens. According to their study, Orangun et al. [23] found that when the transverse reinforcement was utilized in the splice region of a reinforced concrete beam, the maximum bond strength increase was versus fiber content.
Table 9.
Theoretical and test results of bond strengths.
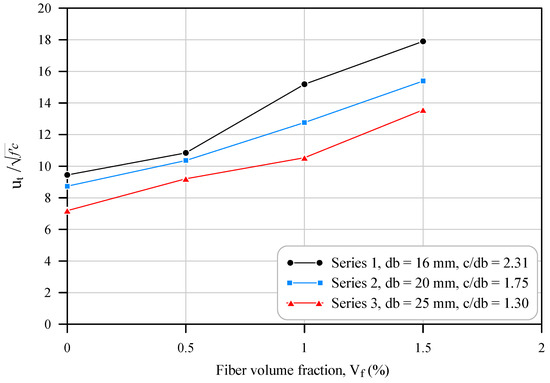
Figure 16.
versus fiber content.
8. Comparison between Theoretical and Experimental Results
The bond strength assessed from the test results in this study was compared with the empirical equation presented by [23,24] and the equation of ACI Committee 318 [25]. Orangun et al. [23,24] used statistical methods to develop expressions for describing the bond strength of bars without and with transverse reinforcement as follows:
Equation (2) is applicable for , where
- = smaller of clear side cover, bottom cover or half the clear spacing between bars;
- = steel confinement index ( = 0 for no transverse reinforcement);
- Atr = cross-sectional area of transverse reinforcement within spacing s and crossing the plane of splitting;
- fyt = specified yield strength of transverse reinforcement, psi;
- s = spacing of transverse reinforcement within the splice zone;
- db = nominal diameter of the spliced bar.
The design provisions of ACI Committee 318 [25] for development length of deformed straight reinforcing bars in tension are:
where
- = reinforcement location factor ( = 1 for bottom-cast bars);
- = coating factor ( = 1 for non-epoxy-coated reinforcement);
- = reinforcement size factor ( = 0.8 for 19 mm (No. 6) and smaller bars and = 1.0 for 22 mm (No. 7) and larger bars);
- = reinforcement grade factor ( = 1 for Grade 420);
- = lightweight concrete factor ( = 1 for normal weight concrete);
- = the least of the side cover, the bottom cover to the center of the bar, or half of the center-to-center bar spacing;
- = steel confinement index ( = 0 for no transverse reinforcement);
- n = number of bars being spliced.
Substituting tension lap splice length requirement and Equation (1) of bond stress into Equation (3) and substituting the parameter values mentioned above, Equation (3) becomes:
For Series 1 and 2;
For Series 3;
A comparison of test results with predicted bond strength using equations of Orangun et al. (Equation (2)) and ACI committee 318 (Equation (3)) is presented in Table 9. In order to demonstrate the effectiveness of the theoretical equations, the measured bond stress (ut) from experimental results was divided by the predicted bond stress (u) as summarized in Table 9. It is evident that the empirical equation proposed by Orangun et al. [23,24] provided a more accurate estimate of the bond strength of macro polyolefin fiber-reinforced concrete than that of the equation proposed by ACI. The mean of (ut/u) using Orangun et al.’s equation (Equation (2)) for all series is 1.39 with a standard deviation of 0.34; however, the mean of (ut/u) using the ACI equation (Equation (3)) for all series is 2.33 with a standard deviation of 0.80. It can be noted that as the fiber content increased, the bond strength from the test results gave higher values than the predicted bond strength for both equations (Equations (2) and (3)). This is due to the fact that neither equations includes a factor to reflect the effect of fiber on the bond strength.
9. Conclusions
The experimental program presented in this study was designed to determine the contribution of macro polyolefin fiber to the bond strength of tension lap splices in reinforced concrete (RC) beams. To isolate the contribution of macro polyolefin fibers, no transverse reinforcements were used in the lap splices of the test specimens. Twelve full-scale beam specimens were cast and tested in a four-point loading system. The influence of different parameters was examined, including fiber volume fractions, bar diameter and the corresponding concrete cover-to-bar diameter ratio. Based on the results of the test and the analysis of load-deflection behavior and bond strength, the following conclusions were drawn:
- The average bond stress of the lap splice of the fiber-reinforced beam specimen increased with increasing fiber content. The average bond stress of the beam specimen with a fiber volume fraction of 1.5% was about 1.9 times that of the companion plain beam specimen in all three series. Among the three volume fractions of fibers (Vf = 0.5, 1.0 and 1.5%) considered in this study, Vf of 1.5% gave the highest improvement in bond strength.
- The flexure stiffness of the fiber-reinforced beam specimens increased as the fiber content increased. This increase in flexural stiffness may be ascribed to the increase in concrete confinement at tension lap splices. In addition to that, the ultimate load of fiber-reinforced beam specimens increased with increasing fiber content.
- The failure mode of specimens without fibers or with fiber of Vf = 0.5% was sudden and brittle; however, with increasing fiber content in the splice region, failure became gradual and more ductile. A few large cracks developed in the plain beam specimens before failure; however, dense micro-cracks developed in the fiber-reinforced beam specimens.
- In all test series, the fiber-reinforced beam specimens with fiber volume fractions of 1 and 1.5% exceeded , in comparison to the companion plain concrete beam specimens. According to the study of Orangun et al. [23], it was found that the maximum bond strength increase of a reinforced concrete beam was when the transverse reinforcement was utilized in the splice region.
- The bond strength values of test beam specimens, which underwent bond failure, were compared to the predicted bond strength values using the two empirical equations presented by Orangun et al. [23] and ACI committee 318 (2019). The comparison indicates that the equation of Orangun et al. yielded a more satisfactory prediction of results than the ACI equation.
Author Contributions
Conceptualization, A.A.-H. and F.H.M.; methodology, A.A.-H. and F.H.M.; validation, A.A.-H., F.H.M. and A.M.A.; formal analysis, A.A.-H.; investigation, A.A.-H., F.H.M. and A.M.A.; resources, A.A.-H., F.H.M. and A.M.A.; data curation, A.A.-H., F.H.M. and A.M.A.; writing, original draft preparation, A.A.-H.; writing, review and editing, F.H.M. and A.M.A.; supervision, A.A.-H.; project administration, F.H.M.; funding acquisition, A.A.-H., F.H.M. and A.M.A. All authors have read and agreed to the published version of the manuscript.
Funding
This research received no external funding.
Data Availability Statement
The data presented in this study are available on request from the corresponding author.
Conflicts of Interest
The authors declare no conflict of interest.
References
- Harajli, M.H.; Salloukh, K.A. Effect of Fibers on Development/Splice Strength of Reinforcing Bars in Tension. Mater. J. 1997, 94, 317–324. [Google Scholar] [CrossRef]
- Hamad, B.S.; Harajli, M.H.; Jumaa, G. Effect of Fiber Reinforcement on Bond Strength of Tension Lap Splices in High-Strength Concrete. ACI Struct. J. 2001, 98, 638–647. [Google Scholar] [CrossRef]
- Harajli, M.H. Bond Behavior in Steel Fiber-Reinforced Concrete Zones under Static and Cyclic Loading: Experimental Evaluations and Analytical Modeling. J. Mater. Civ. Eng. 2010, 22, 674–686. [Google Scholar] [CrossRef]
- Bae, B.-I.; Choi, H.-K. Experimental Study on the Flexural Behavior of Lap-Spliced Ultra-High-Performance Fiber-Reinforced Concrete Beams. Polymers 2022, 14, 2138. [Google Scholar] [CrossRef] [PubMed]
- Lagier, F.; Massicotte, B.; Charron, J.P. Bond Strength of Tension Lap Splice Specimens in UHPFRC. Constr. Build. Mater. 2015, 93, 84–94. [Google Scholar] [CrossRef]
- Al-Quraishi, H.; Al-Farttoosi, M.; AbdulKhudhur, R. Tension Lap Splice Length of Reinforcing Bars Embedded in Reactive Powder Concrete (RPC). Structures 2019, 19, 362–368. [Google Scholar] [CrossRef]
- Hung, C.-C.; Yuen, T.Y.P.; Huang, C.-W.; Yen, C.-H. Tension Lap Splices in UHPC Beams: Influence of Rebar Size, Steel Fibers, Splice Length, and Coarse Aggregate. J. Build. Eng. 2022, 55, 104716. [Google Scholar] [CrossRef]
- Lee, J.K. Bonding Behavior of Lap-Spliced Reinforcing Bars Embedded in Ultra-High Strength Concrete with Steel Fibers. KSCE J. Civ. Eng. 2016, 20, 273–281. [Google Scholar] [CrossRef]
- Ramakrishnan, V. Structural Application of Polyolefin Fiber Reinforced Concrete. 1999, Volume 182, pp. 235–253. Available online: https://www.concrete.org/publications/internationalconcreteabstractsportal.aspx?m=details&id=5530 (accessed on 1 September 2023).
- Pelisser, F.; Neto, A.B.D.S.S.; Rovere, H.L.L.; Pinto, R.C.D.A. Effect of the Addition of Synthetic Fibers to Concrete Thin Slabs on Plastic Shrinkage Cracking. Constr. Build. Mater. 2010, 24, 2171–2176. [Google Scholar] [CrossRef]
- Abousnina, R.; Premasiri, S.; Anise, V.; Lokuge, W.; Vimonsatit, V.; Ferdous, W.; Alajarmeh, O. Mechanical Properties of Macro Polypropylene Fibre-Reinforced Concrete. Polymers 2021, 13, 4112. [Google Scholar] [CrossRef]
- Blazy, J.; Drobiec, Ł.; Wolka, P. Flexural Tensile Strength of Concrete with Synthetic Fibers. Materials 2021, 14, 4428. [Google Scholar] [CrossRef]
- Al-Salim, N.H.; Jaber, M.H.; Hassan, R.F.; Mohammed, N.S.; Hussein, H.H. Experimental Investigation of Compound Effect of Flexural and Torsion on Fiber-Reinforced Concrete Beams. Buildings 2023, 13, 1347. [Google Scholar] [CrossRef]
- Daneshfar, M.; Hassani, A.; Aliha, M.R.M.; Sadowski, T.; Karimi, A. Experimental Model for Study of Thickness Effect on Flexural Fatigue Life of Macro-Synthetic-Fiber-Reinforced Concretes. Buildings 2023, 13, 642. [Google Scholar] [CrossRef]
- Mohebi, Z.H.; Bahnamiri, A.B.; Dehestani, M. Effect of Polypropylene Fibers on Bond Performance of Reinforcing Bars in High Strength Concrete. Constr. Build. Mater. 2019, 215, 401–409. [Google Scholar] [CrossRef]
- Akın, S.K.; Kartal, S.; Müsevitoğlu, A.; Sancıoğlu, S.; Zia, A.J.; İlgün, A. Macro and Micro Polypropylene Fiber Effect on Reinforced Concrete Beams with Insufficient Lap Splice Length. Case Stud. Constr. Mater. 2022, 16, e01005. [Google Scholar] [CrossRef]
- ASTM A615/A615M-20; Standard Specification for Deformed and Plain Carbon-Steel Bars for Concrete Reinforcement. ASTM International: West Conshohocken, PA, USA, 2020.
- ASTM C150-04; Standard Specification for Portland Cement. ASTM International: West Conshohocken, PA, USA, 2004.
- ASTM C496/C496M-17; Standard Test Method for Splitting Tensile Strength of Cylindrical Concrete Specimens. ASTM International: West Conshohocken, PA, USA, 2017.
- ASTM C78/C78M-21; Standard Test Method for Flexural Strength of Concrete (Using Simple Beam with Third-Point Loading). ASTM International: West Conshohocken, PA, USA, 2021.
- Yerex, L.; Wenzel, T.H.; Davies, R. Bond Strength of Mild Steel in Polypropylene Fiber Reinforced Concrete. J. Proc. 1985, 82, 40–45. [Google Scholar] [CrossRef]
- ACI 408R-03; Bond and Development of Straight Reinforcing Bars in Tension. American Concrete Institute: Farmington Hills, MI, USA, 2003; pp. 1–49.
- Orangun, C.O.; Jirsa, J.O.; Breen, J.E. Reevaluation of Test Data on Development Length and Splices. J. Proc. 1977, 74, 114–122. [Google Scholar] [CrossRef]
- Orangun, C.O.; Jirsa, J.O.; Breen, J.E. The Strength of Anchor Bars: A Reevaluation of Test Data on Development Length and Splices. 1975. Available online: https://trid.trb.org/view/32142 (accessed on 1 September 2023).
- ACI 318M-19; Building Code Requirements for Structural Concrete and Commentary. American Concrete Institute: Farmington Hills, MI, USA, 2019; Volume 552.


Disclaimer/Publisher’s Note: The statements, opinions and data contained in all publications are solely those of the individual author(s) and contributor(s) and not of MDPI and/or the editor(s). MDPI and/or the editor(s) disclaim responsibility for any injury to people or property resulting from any ideas, methods, instructions or products referred to in the content. |
© 2023 by the authors. Licensee MDPI, Basel, Switzerland. This article is an open access article distributed under the terms and conditions of the Creative Commons Attribution (CC BY) license (https://creativecommons.org/licenses/by/4.0/).