Abstract
The precision and reliability of test findings are closely related to the uniformity of remolded loess samples. Although many methods to evaluate the uniformity of remolded loess have been proposed, they have not been widely accepted, due to the many defects. Therefore, it is necessary to explore the evaluation method and index of the uniformity of remolded loess samples in laboratory tests. In this paper, variations in shear strength and microscopic properties along the sample height were examined using the direct shear test and scanning electron microscopy (SEM) test. The feasibility and reliability of employing shear strength as an indicator to assess the uniformity of remolded loess samples were confirmed based on the test results. The results showed that the shear strength and shear strength parameters decreased from top to bottom along the sample height, and that the difference in the shear strength and shear strength parameters between the top and the bottom of remolded loess samples increased with the increase in the sample height. The variation tendency of the shear strength and shear strength parameters altered when the height–diameter (H/D) ratio exceeded 0.97. The SEM test results revealed that as the sample height increased, the disparity in microstructure and pore distribution in various portions of remolded loess samples became more apparent. The effect of sample height on the uniformity of remolded loess samples was mostly attributable to the variation in coating thickness and the content of clay particles on the surface of coarse particles, induced by a reduction in compactness from the top to the bottom of samples. The coefficient for evaluating the uniformity of the remolded loess sample was defined as the ratio of the shear strength at the top to that at the bottom of the remolded sample, and 0.8 was chosen as the threshold value. The shear strength reflected the uniformity of remolded loess samples as accurately as the microscopic test parameters. Furthermore, the direct shear test is the most classic and widely used laboratory test, with a low cost, easy accessibility, short test cycle, simple data processing and low environmental requirements, which provides another feasible method to evaluate the uniformity of remolded loess.
1. Introduction
Loess is a predominantly silt-sized clastic sediment with visible pores formed by the accumulation of wind-blown dust that covers approximately 10% of Earth’s land area. In China, the Loess Plateau accounts for 6.44% of land area and 45% of Shaanxi Province [1,2,3,4]. As a kind of building material, its special mechanical properties have always been the focus of geotechnical engineering [5,6,7,8,9]. The laboratory test of remolded loess is a prerequisite to engineering operations, and the laboratory test index is a key reference for engineering.
The uniformity influences the laboratory test index by affecting the microstructure of the soil [6], which has direct effects on the safety and reliability of engineering [10,11]. In this context, researchers exerted considerable effort to improve the uniformity of remolded samples [12,13,14]. However, regardless of the procedure used, the heterogeneity of the remolded sample could not be prevented [12,13,14,15,16,17]. Therefore, researchers redirected their attention to developing techniques for evaluating the uniformity of remolded samples. Table 1 summarizes the methods or tests for evaluating soil uniformity. Mehlich [18] examined the uniformity of the samples by measuring the volumetric weight of the soil and determined that the height–diameter (H/D) ratio should not exceed 0.4. Meshram et al. [19] established the empirical correlation of in situ density estimation of subgrade materials, based on the penetration rate and moisture content obtained from the dynamic conical penetrator test, to evaluate the uniformity of soil. Bradshaw [20] used the density of the whole sample as an index to evaluate the uniformity. Jung et al. [11] investigated the uniformity of the roadbed based on the bearing ratio of California. Zhang et al. [21] evaluated the uniformity of artificial loess and natural loess using the compression modulus and demonstrated that in the vertical direction, the uniformity of artificial loess was larger than that of natural loess, while the converse was true in the horizontal direction. Although the above methods can directly obtain the index to evaluate the homogeneity of the sample, they cannot reflect how the homogeneity changes in the sample, either from the whole or the local. In addition, the methods are inevitably disturbed by external factors (such as temperature and water evaporation) and human factors (such as the extrusion of adjacent soil when cutting the sample). Consequently, the effectiveness and precision of the uniformity assessment approach are highlighted. Xue [22] used the air permeability rate as an index to evaluate soil uniformity and concluded that the uniformity of samples increased with their height and degree of compaction. Bellotti et al. [23] used the local relative density value to evaluate the sample uniformity based on the test correlation between dry sand and thermal conductivity. Reza et al. [24] studied the influence of various cone-falling parameters (cone angle, diameter, overload, and cone surface roughness) on the liquid limit of the sample, and found that the uniformity of the sample could be evaluated by the drop weight depth. The aforementioned methods have the benefits of a short testing period and straightforward operation, but the results of parallel tests frequently reveal differences and require sophisticated experimental environments. With the development of science and technology, it is possible to study uniformity from the microscopic perspective. The available methods include scanning electron microscopy (SEM) [1,6,25], mercury intrusion porosimetry (MIP) [26], and computed tomography (CT) [4]. By acquiring objective microscopic metrics, these methods may more precisely assess the homogeneity of soil. Unfortunately, these methods are often time-consuming and costly, and have some drawbacks in the identification of the interface between soil particles and pores. Therefore, the development of a method to evaluate the uniformity of the sample that is cheap and easy to apply, with a short test period and accurate and reliable results, is the key to ensure the accuracy of the test results and the safety and reliability of the building. In the realm of geotechnical engineering, soil failure was often referred to as shear failure [2,27,28]. Not only are shear strength and strength parameters (internal cohesion c and internal friction angle) a representation of the mechanical properties of soil, but they are also the fundamental indices of engineering design [7,29,30]. In addition, the direct shear instrument was widely used in engineering activities due to its low cost (a brand new ZJ strain-controlled direct shear instrument costs no more than USD 3000), easy operation, rapid data processing (the whole test took less than 10 min to conduct), and reliable test data [31]. Of course, the direct shear test also has some defects, such as the prescribed shear surface and inability to control the drainage conditions strictly.

Table 1.
Summary of methods or tests for evaluating the uniformity of soil sample.
In this study, the direct shear test was carried out on specimens cut from remolded loess samples with heights of 2~10 cm in layers to verify the feasibility of evaluating the uniformity of remolded loess samples by shear strength. The scanning electron microscopy (SEM) tests were carried out on the remolded loess specimens and their shear planes in order to analyze the changes of microstructure and pore distribution along the sample height, and thus verify the accuracy of evaluating the uniformity of remolded loess samples by shear strength. In addition, the coefficient to evaluate the homogeneity of remolded loess was defined based on the shear strength. The direct shear test has the advantages of low cost, short cycle, simple operation, wide application, and accurate test results, which provides another feasible method for evaluating the uniformity of remolded loess samples.
2. Materials and Methods
2.1. Materials
The loess soil used in this paper was taken from a typical loess section in Xi’an, China. The sampling depth was 5 m below the surface and the disturbance to the soil was minimized during sampling. The basic physical indexes and compression curves of the samples are shown in Table 2 and Figure 1, respectively. The moisture content and dry density used in this paper are the optimal moisture content (17.2%) and the corresponding maximum dry density (1.72 g/cm3).
Table 2.
Physical properties of the test sample.
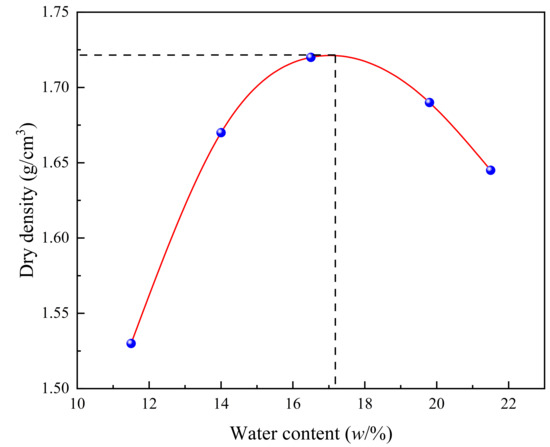
Figure 1.
The compaction curve of loess used in this study.
2.2. Direct Shear Specimens Preparation and Direct Shear Test
The natural loess samples were dried in an oven at 105 °C for more than 24 h, then crushed and sieved with a 2 mm sieve. The water was sprayed on the soil with a watering can and mixed to form a soil–water mixture, then the mixture was weighed until the target moisture content was reached. Subsequently, the mixture was sealed in a plastic bag for more than 24 h to make the moisture fully uniform.
The remolded loess samples were prepared by a one-time static pressing method using a self-made hydraulic sample preparation instrument (Figure 2a). The instrument consists of four parts: frame; hydraulic jack; sample mold (the inner diameter of which is 6.18 cm); and pressure hammer. The sample preparation process was as follows: The oil valve of the jack was first tightened and the hammer was fixed in the groove of the top slab, and the mold was placed on the jack tray to align the axes of the press hammer, mold, and piston rod. The mixture was then added to the mold and compressed to its maximum dry density by shaking the hand lever to make the piston rod move upward. The height and dry density of the remolded sample can be controlled by the length of the pressure hammer entering the mold and the mass of the mixture added. Finally, the oil valve was released and the remolded sample was removed from the mold (Figure 2b). The specimens used for the direct shear test were cut alternately along the sample height with a thickness of 2 cm, to reduce the disturbance to the nearby soil, and labelled with the sample height and the number of layers (Figure 2c). For example, 4-2 represents the specimen taken from the second layer of the remolded sample with a height of 4 cm. The specimens were sealed in plastic bags and the direct shear test was performed immediately.
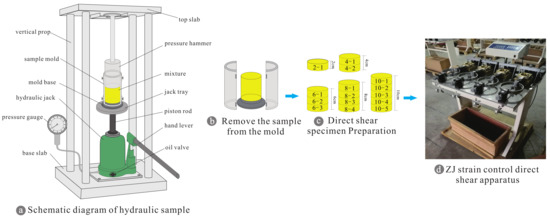
Figure 2.
Preparation of specimens for direct shear test.
In this study, the ZJ strain control direct shear apparatus was employed (Figure 2d). Four identical specimens were placed in a shear box with vertical pressures of 100 kPa, 200 kPa, 300 kPa, and 400 kPa, respectively. The loading rate of 0.8 mm/min was set to make the specimens sheared within 5 min. In this test, 3 batches of parallel tests were conducted on the same number of specimens, each batch of 4 single specimens, and a total of 180 specimens were tested. The direct shear test scheme is shown in Table 3. The specimen was damaged if the dial gauge readings reversed significantly or stayed constant throughout the test. Generally, the specimen should be shear to 4 mm; however, if the dial gauge reading continues to increase, the specimen should be shear to 6 mm. The shear stress of the sample is calculated according to the following formula:
where τ is shear stress, measured in kPa; C is the calibration coefficient of the dynamometer, measured in N/0.01 mm; R is the dial indicator reading, measured in 0.01 mm; and A0 is the sample area, measured in mm2. Then, the τ-∆L relationship curve was drawn with the shear stress τ as the vertical coordinate and the shear displacement (corresponding to R) ∆L as the horizontal coordinate. The peak value or stable value on the curve was selected as the shear strength, τf. If there was no obvious peak value, the shear stress corresponding to the shear displacement of 4 mm was selected as the shear strength. According to Mohr–Coulomb criterion, the relationship between shear strength and shear strength parameter (c and φ) meets the following equation:
where τf is the shear strength, measured in kPa; c is the internal cohesion, measured in kPa; and φ is the internal friction angle, measured in degrees. Next, the τf -P relationship curve was drawn with the τf as the vertical coordinate and the vertical pressure P as the horizontal coordinate. For a straight line drawn on the curve, the intercept between the line and the vertical coordinate is c, while the angle between the line and the horizontal coordinate is φ.
Table 3.
Direct shear test scheme.
2.3. Specimen Preparation for SEM Test
Figure 3 shows the preparation process of the loess cylindrical specimens used for the SEM test. The SEM tests were performed on cylindrical specimens cut from 2 cm and 10 cm samples to show the difference in microstructure induced by the sample height. The cylindrical specimen includes remolded and sheared cylindrical specimens. The remolded cylindrical specimens of the 10 cm sample were cut from top to bottom along the sample height at a distance of 2 cm, while for the 2 cm sample, the cylindrical specimens were cut from the top, middle, and bottom of the sample to correspond with the 10 cm sample (Figure 3a). The sheared cylindrical specimens were cut from the center of the soil after shearing and air drying with the shear plane as the observation surface (Figure 3b). The diameter and height of the cylindrical specimen were 1 cm (Figure 3c). All the cylinders were labelled according to sample height, sample position, and whether they were remolded or sheared. The letters R and S signify remolded and sheared, respectively, the numbers 10 and 2 represent sample height, and the number behind the short line represent the layer to which the cylinder specimen belongs. For example, the R 10-3 represents the cylindrical specimen cut from the third layer of the remolded sample with a height of 10 cm. All the cylindrical specimens were broken to expose the fresh section (except for the sheared cylindrical specimens) and treated with gold spraying (Figure 3d). Then, the Quanta FEG 450 SEM was used for image observation and acquisition (Figure 3e).
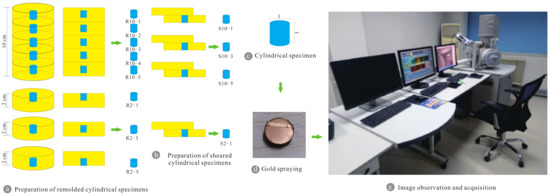
Figure 3.
Preparation of SEM test specimens.
2.4. Image Post-Processing
In this paper, the Image-Pro Plus (IPP) software was used for image processing and data collection of the SEM images obtained. Refer to the papers of Wang et al. for the relevant operational details [25].
3. Results and Discussion
3.1. Shear Strength and Shear Strength Parameter
The shear strength of soil in different layers of remolded loess samples is shown in Figure 4. As the sample height increased, the shear strength at the top and middle of the sample increased, while the shear strength at the bottom of the sample decreased. This finding indicates that the difference in shear strength between the top and bottom of the sample increased with the increase in sample height, but the uniformity of the sample decreased. The fluctuation of shear strength at the top of the sample was stronger than that at the bottom, indicating that the interaction of soil particles at the top of the sample was more intense than that at the bottom during the shear process. This can be attributed to the fact that the compactness at the top of the sample increased with the increase in the sample height, that the pores in the soil were few and small in size, and that the soil was relatively uniform. Consequently, the interaction between soil particles began to strengthen shortly after the shear test began and became more intense as the test continued. In contrast, the compactness at the bottom of the sample decreased gradually with the increase in sample height, the pores in the soil were greater in number and larger in size, and the uniformity of the soil deteriorated. The majority of the shear process was dominated by the decrease in the spacing between soil particles, and the interaction of soil particles was only strengthened gradually over a brief period of time before the shear test concluded.
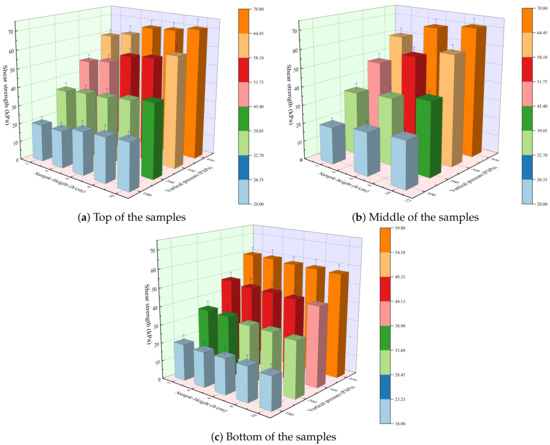
Figure 4.
Shear strength of different layered soils of the remolded loess samples.
Figure 5 depicts the shear strength parameters (internal friction angle φ and internal cohesion c) of different layered soils of remolded loess samples. The φ and c decreased from top to bottom along the sample height and the variation of c was greater than φ. Furthermore, the φ and c at the top of the sample increased with the increase in the sample height, but at the bottom of the sample the opposite was true. The reduction of φ from the top of the sample to the bottom increased from 4.98% of 4 cm to 19.31% of 10 cm, whereas the corresponding reduction of c was 6.26% and 52.83%, respectively. As the sample height increased from 2 cm to 10 cm, the φ and c at the top of the sample increased by 34.03% and 17.20%, respectively, while they decreased by 36.77% and 5.42%, respectively, at the bottom of the sample. These findings imply that the response of c to the uniformity of remolded loess samples was more sensitive than φ. In addition, the increment of φ from 2 cm to 6 cm was greater than that from 6 cm to 10 cm, whereas the change of c was the opposite, indicating that the sample height has a clear effect on the uniformity of remolded loess samples, and that the non-homogeneity will be exacerbated significantly when the height–diameter (H/D) ratio exceeds 0.97.
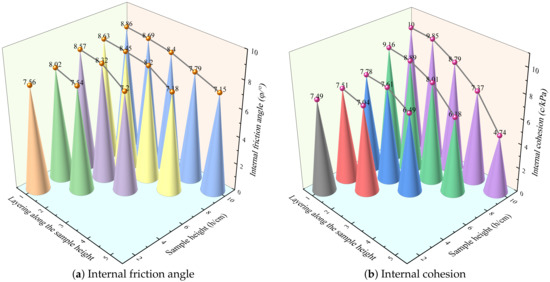
Figure 5.
Variation of shear strength parameters of different layered soils along the sample height.
Figure 6 shows the variations in φ and c at the top and bottom of remolded loess samples. The variations of φ and c with sample height can be divided into two stages: the modest change stage (2–6 cm) and the obvious change stage (6–10 cm). At the top of the sample, as the sample height increased from 2 cm to 6 cm, the c and φ increased by 3.84% and 13.36%, respectively, while the comparable increases from 6 cm to 10 cm were 29.08% and 3.38%, respectively. At the bottom of the sample, when the sample height increased from 2 cm to 6 cm, the c and φ decreased by 13.41% and 4.76%, respectively, and the corresponding reduction from 6 cm to 10 cm was 26.98% and 0.69%, respectively. The different change trends can be attributed to the decrease in compactness along the sample height [32]. With the increase in compactness, the void ratio and the distance between soil particles decreased, and the interlocking between soil particles was enhanced. In addition, the soil-ring wall friction was relatively weak when the H/D was less than 0.97; moreover, the component of the external force required to overcome the friction was modest, and the sample tended to be compressed as a whole. When the H/D exceeded 0.97, the friction was enhanced and the component of the external force required to overcome the friction increased, causing the soil to be partially compressed. The above discussion proved that it is feasible to evaluate the uniformity of remolded loess samples by shear strength.
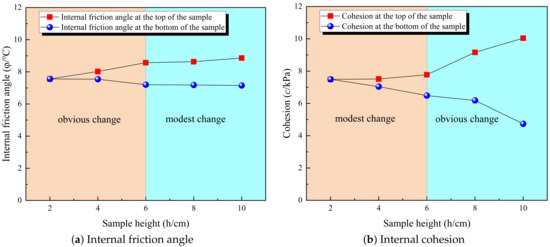
Figure 6.
Variation of φ and c at the top and bottom of the remolded loess samples with sample height.
3.2. Pore Distribution
Analyzing the distribution of pores is the key to effectively evaluating the uniformity of samples [4,14,33]. The pores in loess can be divided into four types according to their mean diameters (the average length of diameters measured at 2-degree intervals and passing through the pore’s centroid) [25]: macropores (>32 μm); mesopores (8–32 μm); small pores (2–8 μm); and micropores (<2 μm). The inhomogeneity of the sample becomes more obvious when the total pore area increases and the distribution frequency of macropores at a lower level under the observation area is fixed; otherwise, the sample is generally uniform [33]. The pore frequencies and total pore areas of 2 cm and 10 cm samples are presented in Figure 7. The pore frequency of all parts of a 2 cm and 10 cm sample decreased rapidly as the mean pore diameter increased, and the pores of all parts of the samples were mainly distributed in the range of 2–12 μm (Figure 7a). The disparity in pore frequencies across various portions of the 10 cm sample was more pronounced than that of the 2 cm sample. As for pore area (Figure 7b), which increased from top to bottom along the sample height in the 10 cm sample, this result is consistent with the findings of Wang et al. [4] and Jiang et al. [14], but the pore area of various parts of the 2 cm sample was almost identical. Based on the difference in the distribution of pore frequency and pore area between the 10 cm and 2 cm samples, it can be concluded that the pore distribution at the top of the 10 cm sample is small in size and high in number, whereas the pore distribution at the bottom is the exact opposite, indicating that the connectivity of the pores in the 10 cm sample is enhanced from top to bottom along the sample height. However, there was no discernible variation in the pore distribution of the 2 cm sample. This discrepancy indicates that the uniformity of remolded loess samples deteriorated as sample height increased, but the shear strength differential across sample portions increased, comparable to the findings of the direct shear test. Comparing the variation of the shear strength and pore distribution of the 10 cm sample with the sample height reveals that the response of shear strength to the uniformity of the remolded loess sample has a strong correlation with the SEM test results.
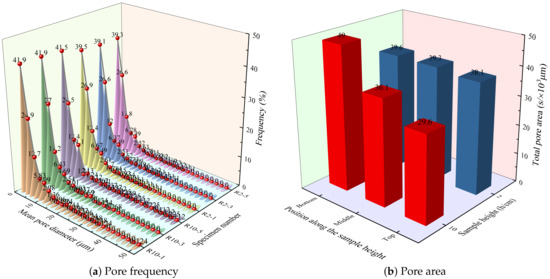
Figure 7.
Pore frequency and pore area in different parts of the 2 cm and 10 cm samples.
3.3. Microstructure of Shear Plane
Figure 8 shows the SEM images of the shear planes at the top (S10-1 and S2-1), middle (S10-3), and bottom (S10-5) of the 2 cm and 10 cm samples (the 2 cm sample has only one shear plane). The magnifications on the left and right were chosen to be 1000 times and 5000 times, respectively, to study the soil’s general structure and the finer details of the particles. The magnifications on the left and right were chosen to be 1000 times and 5000 times, respectively, to study the soil’s general structure and the finer details of the particles. All shear planes showed evidence of aggregates, inter-aggregate pores, and intra-aggregate pores, and the microstructure of S2-1 was comparable to that of S10-1. On S10-1 and S2-1, dense structures were observed, with indirect cementing connections serving as the primary forms of connection between soil particles. In contrast, the structures of S10-3 and S10-5 were relatively loose, with improved direct connections between particles but primarily indirect cementing connections. On all shear planes, the coarse particles (mainly silt) are closely coated by clay particles and cementing materials (mainly carbonates) to form clay-coated silts, which form the indirect cementing connections with other soil particles. From S10-1 to S10-5, the intensity of indirect cementing connection decreased, the number and size of inter-aggregate pores increased, and the surface of the coarse particle became relatively clean and easier to identify, leading to the increase in pore connectivity and intergranular distance. Additionally, the fissure was observed in S10-1 and S2-1 but not in S10-3 and S10-5, and the chute with the same width as the soil particle size was observed at S10-5. High magnification images also revealed clastics and sliding scratches on the surfaces of all soil particles, indicating that particle slippage and breakage occurred during the shear process. Similar phenomena were also observed by Nan et al. [30]. Furthermore, the failure surface of the coarse particles at S10-1 and S2-1 was relatively smooth and complete, while the S10-5 was distributed with grooves.
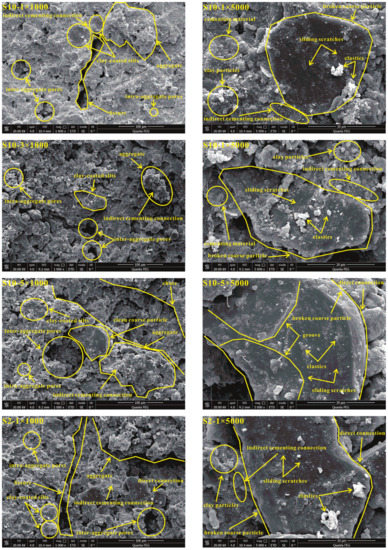
Figure 8.
SEM images of the 2 cm and 10 cm samples.
As can be seen from Figure 8, both inter-aggregate pores and intra-aggregate pores are distributed on all shear planes. From S10-1 to S10-5, the compactness decreased, and the number and size of the inter-aggregate pores increased. This result is similar to that of Meng et al. [33] and Wang et al. [4]. On the one hand, this result demonstrates that the shear strength of the remolded loess sample decreased from top to bottom along the sample height, which is consistent with the results of the direct shear test. On the other hand, the shear process does not fully alter the compactness and pore distribution (inter-aggregate and intra-aggregate pores exist concurrently). The similar result was reached by Nan et al. [30], who found that, even with increased compactness, double pores will not totally vanish. The fissure in S10-1 and S2-1 showed that the soil was relatively uniform. This is due to the fact that, during the process of shear, soil particles slide and rotate [28,30,31], necessitating the soil to create corresponding space through the compression of pores. The compression primarily occurs in inter-aggregate pores because the intra-aggregate pores are not easily compressed [30,31]. When the compactness was smaller, the proportion of inter-aggregate pores was larger, the non-uniformity of the sample was more obvious, and the space required for the soil particles to slide was provided by the compression of the inter-aggregate pores. When the compactness was higher, the proportion of inter-aggregate pores was relatively small, and the uniformity of the sample was more obvious. In this case, the space needed for a particle to slide was partially supplied by the inter-aggregate pores, and the remaining space was provided by the shape of fissures. Therefore, in the shear plane of a sample with a large compactness, noticeable fissures were more likely to manifest themselves.
Particles larger than 5 μm are considered the skeleton particles of loess [1,6,25]. Table 1 shows that the total proportion of clay and silt is greater than 97%. As a result, silt and clay can be regarded as the primary functional components of loess. The cementing material in loess is fully dissolved at a higher moisture content, and the coating on the surface of coarse particles, together with clay particles (Figure 9a), form a clay-coated silt (Figure 9b), which serves as a wrapping and fixing material [1,6]. The coated silt particles form clay–silt mixture aggregates by clay particles and a clay bridge bond (Figure 9c); the intra-aggregates pores are mainly formed during this process. Subsequently, the clay–silt mixture aggregates are cemented by clay particles and clay bridge bonds to form the larger aggregates (Figure 9d); the inter-aggregate pores are mainly formed during this process. A change in this process was not obvious even at a higher moisture content [34]. With the compactness decreased from top to bottom along sample height, the thickness of the coating and the amount of clay also decreased (Figure 9b,e), and the wrapping and fixing effect on coarse particles also weakened. The thickness of the coating and the amount of clay were considered as one of the reasons for the difference in soil uniformity of different parts of the remolded loess sample.
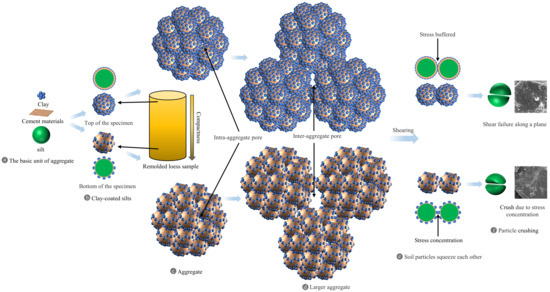
Figure 9.
A conceptual model for the effect of uniformity on the cementation process and the failure of particles in remolded loess.
The thicker coating and numerous clay particles at the top of the remolded loess sample buffered soil-ring wall friction and caused the extrusion of soil particles during the shear process. In this case, the external forces the coarse particles were subjected to were more uniform, and the coarse particles tended to be shear failure along a plane; hence, the failure surface was relatively smooth. However, the coating thickness and the number of clay particles on the coarse particle surface at the bottom of the remolded loess sample decreased. As a result, the buffering effect reduced, and the coarse particles were crushed due to the local stress concentration. Consequently, grooves were observed on the failure surface of the coarse particle (Figure 9f). The different failure surfaces of coarse particles showed that the influence of the microstructure change on the uniformity caused by the sample height should be attributed to the change in the number of clay particles and the thickness of the coating on the surface of the coarse particles.
3.4. Uniformity Coefficient Based on Shear Strength
The pore area ratio (PAR), which measures the proportion of the pore area to the image area, was developed to assess the uniformity of samples [6,14]. The correlation between the PAR and the shear strength of the 10 cm sample is shown in Figure 10. In contrast to the shear strength, the PAR increased progressively from top to bottom along the sample height. The relationship again proved that the response of shear strength to the uniformity of remolded loess samples was highly consistent with the SEM test results, and that it is accurate and reliable to characterize the uniformity of the remolded loess sample by shear strength.
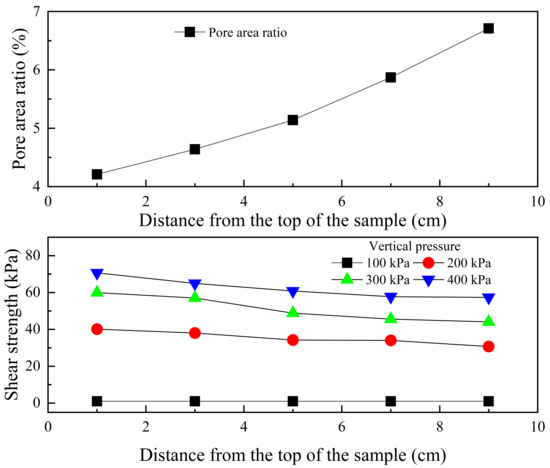
Figure 10.
The relationship between the PAR and shear strength of the 10 cm sample.
The non-uniformity of the remolded loess sample was primarily illustrated by the noticeable difference between the top and bottom of the sample by discussing the findings of the direct shear test and SEM test. Because the direct shear test has the advantages of low cost, high efficiency, and simple operation, a quantitative index to evaluate the uniformity of remolded loess was proposed.
where Su is defined as the uniformity index of the remolded loess sample based on shear strength. Sb and St represent the shear strength at the bottom and top of the sample, respectively. This definition provides a dimensionless and easy-to-apply index for evaluating the uniformity of remolded loess samples. The more uniform the remolded loess sample, the closer the uniformity coefficient is to 1. The calculation results of the uniformity coefficient of remolded loess samples with different heights, under all levels of vertical pressure, is shown in Table 4. The variance of the uniformity coefficient is smaller at 400 kPa, illustrating that the data obtained from the direct shear test at 400 kPa was more stable.
Table 4.
Uniformity coefficient based on shear strength under different vertical pressures.
The correlation between the uniformity coefficient and sample height is seen in Figure 11. The uniformity coefficient and sample heights were discovered to have an exponential connection through the fitting relationship. The uniformity coefficient of 0.8 at 400 kPa was used as the threshold value for assessing the uniformity of the remolded loess sample based on the experimental results. When the uniformity coefficient is more than 0.8, the remolded loess sample was quite homogeneous; otherwise, the inhomogeneity of the remolded sample may have significantly affected the test results.
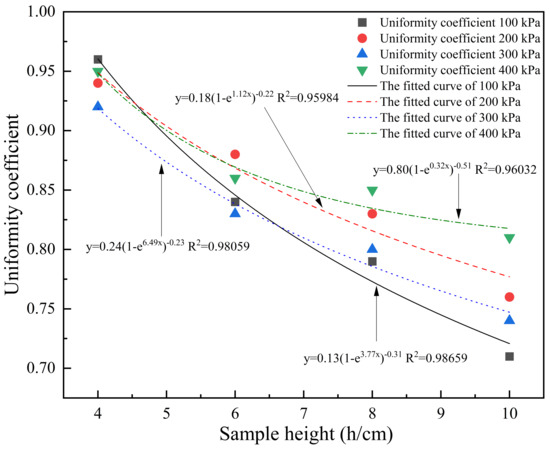
Figure 11.
The relationship between the uniformity coefficient and sample height.
In conclusion, the direct shear test has the advantages of simple operation, short test cycle, low cost, and accurate experimental results. Additionally, the uniformity coefficient based on the shear strength offers the benefits of straightforward computation and easy application, and it has a unique advantage in evaluating the uniformity of remolded loess samples.
4. Further Studies and Limitations
In conclusion, it is demonstrated that the shear strength is a useful measure for assessing the uniformity of remolded loess samples. The samples used for this test were, however, prepared by a one-time static pressing at the optimal moisture content and maximum dry density. Expanding the range of moisture content and dry density will help further illustrate how the conclusion is applicable. Additionally, the shear strength cannot define microscopic factors like pore frequency and pore area when compared to the microscopic test. Future research should include more correspondences and parameters to further improve this.
5. Conclusions
- (1)
- The shear strength and shear strength parameters decreased from top to bottom along the sample height. The shear strength and shear strength parameters at the top of the remolded loess sample increased with the increase in sample height, but at the bottom the opposite was true. The difference in shear strength and the shear strength parameters between the top and bottom of the remolded loess sample increased with the increase in sample height and increased significantly when the H/D exceeded 0.97;
- (2)
- The difference in pore distribution and microstructure of different parts of the remolded loess sample increased with the increase in sample height. The reduction in compactness was the key factor in how sample height affected the uniformity of remolded loess. The content of clay particles and the coating thickness on the surface of coarse particles in the soil decreased with the decrease in compactness. The coarse particles at the top of the sample crushed along a certain plane, due to the buffered external forces, while the coarse particles at the bottom of the sample were crushed due to stress concentration;
- (3)
- The ratio of the shear strength at the top of the remolded loess sample to that at the bottom at 400 kPa was defined as the uniformity coefficient, and 0.8 was considered as the evaluation threshold value. The sample was relatively uniform when the uniformity coefficient exceeded 0.8. Otherwise, the non-uniformity of the sample may have significantly affected the experimental results;
- (4)
- According to the analysis of the results of the direct shear test and SEM test, there is a certain correlation between the response of shear strength to the uniformity of remolded loess and the microscopic test. The direct shear test has the advantages of accurate experimental results, low cost, short test cycle, and easy operation, while the uniformity coefficient has the advantages of simple calculation and easy application. It provides another feasible method to evaluate the uniformity of remolded loess samples.
Author Contributions
Conceptualization, W.Y. and X.L.; methodology, W.Y., X.L., N.Z., Y.R. and J.S.; software, W.Y., N.Z., Y.R., J.S. and C.Z.; validation, X.L., N.Z., Y.R.,J.S. and C.Z.; formal analysis, W.Y., N.Z., Y.R., J.S. and C.Z.; investigation, W.Y., N.Z., J.S., C.Z., Q.X. and Z.H.; resources, X.L., N.Z., Y.R. and J.S.; data curation, W.Y., C.Z., Q.X. and Z.H.; writing—original draft preparation, W.Y., Y.R., Q.X. and Z.H.; writing—review and editing, W.Y.; visualization, C.Z., Q.X. and Z.H.; supervision, X.L., N.Z., Y.R., Q.X. and Z.H.; project administration, X.L.; funding acquisition, X.L. All authors have read and agreed to the published version of the manuscript.
Funding
This research was funded by the National Natural Science Foundation of China, grant number 42230712, the National Natural Science Foundation of China, grant number 41877225.
Institutional Review Board Statement
Not applicable.
Informed Consent Statement
Not applicable.
Data Availability Statement
Not applicable.
Conflicts of Interest
The authors declare no conflict of interest.
References
- Li, X.A.; Li, L.C. Quantification of the pore structures of Malan loess and the effects on loess permeability and environmental significance, Shaanxi Province, China: An experimental study. Environ. Earth Sci. 2017, 76, 523. [Google Scholar] [CrossRef]
- Li, Y.R. A review of shear and tensile strengths of the Malan Loess in China. Eng. Geol. 2018, 236, 4–10. [Google Scholar] [CrossRef]
- Peng, J.B.; Fan, Z.J.; Wu, D.; Huang, Q.B.; Wang, Q.Y.; Zhuang, J.Q.; Che, W.Y. Landslides triggered by excavation in the loess plateau of China: A case study of Middle Pleistocene loess slopes. J. Asian Earth Sci. 2019, 171, 246–258. [Google Scholar] [CrossRef]
- Wang, H.K.; Qian, H.; Gao, Y.Y. Characterization of macropore structure of remolded loess and analysis of hydraulic conductivity anisotropy using X-ray computed tomography technology. Environ. Earth Sci. 2021, 80, 197. [Google Scholar] [CrossRef]
- Xie, B.L.; Zhang, W.Y.; Sun, X.L.; Huang, Y.L.; Liu, L.Q. Experimental Study on the Effects of Freeze–Thaw Cycles on Strength and Microstructure of Xining Region Loess in China. Buildings 2022, 12, 795. [Google Scholar] [CrossRef]
- Li, X.A.; Li, L.C.; Song, Y.X.; Hong, B.; Wang, L.; Sun, J.Q. Characterization of the mechanisms underlying loess collapsibility for land-creation project in Shaanxi Province, China—a study from a micro perspective. Eng. Geol. 2019, 249, 77–88. [Google Scholar] [CrossRef]
- Wang, J.D.; Xu, Y.J.; Ma, Y.; Qiao, S.N.; Feng, K.Q. Study on the deformation and failure modes of filling slope in loess filling engineering: A case study at a loess mountain airport. Landslides 2018, 15, 2423–2435. [Google Scholar] [CrossRef]
- Zhu, C.H.; Li, N. Ranking of influence factors and control technologies for the post-construction settlement of loess high-filling embankments. Comput. Geotech. 2020, 118, 103320. [Google Scholar] [CrossRef]
- Zhang, H.X.; Zeng, R.Q.; Zhang, Y.; Zhao, S.F.; Meng, X.M.; Li, Y.X.; Liu, W.C.; Meng, X.P.; Yang, Y.P. Subsidence monitoring and influencing factor analysis of mountain excavation and valley infilling on the Chinese Loess Plateau: A case study of Yan’an New District. Eng. Geol. 2022, 297, 106482. [Google Scholar] [CrossRef]
- Hu, C.M.; Wang, X.Y.; Mei, Y.; Yuan, Y.L.; Zhang, S.S. Compaction techniques and construction parameters of loess as filling material. Geomech. Eng. 2018, 15, 1143–1151. [Google Scholar] [CrossRef]
- Jung, C.; Jung, S.; Siddiki, N.Z.; Bobet, A. Field investigation of engineering properties and uniformity of subgrades chemically treated with LKD. Int. J. Pavement Eng. 2013, 14, 134–145. [Google Scholar] [CrossRef]
- Huang, A.B.; Chang, W.J.; Hsu, H.H.; Huang, Y.J. A mist pluviation method for reconstituting silty sand specimens. Eng. Geol. 2015, 188, 1–9. [Google Scholar] [CrossRef]
- Chen, H.E.; Li, H.; Jiang, Y.L.; Yu, Q.B.; Yao, M.; Shan, W.C. Feasibility study on artificial preparation of structured loess. Geosci. Lett. 2022, 9, 21. [Google Scholar] [CrossRef]
- Jiang, M.J.; Konrad, J.M.; Leroueil, S. An efficient technique for generating homogeneous specimens for DEM studies. Comput. Geotech. 2003, 30, 579–597. [Google Scholar] [CrossRef]
- Liu, Y.; Zhu, X.D.; Wan, C.Y. Study on Sample Preparation Method of DEM. In Proceedings of the International Conference on Structures and Building Materials, Guizhou, China, 9–10 March 2013. [Google Scholar]
- Tastan, E.O.; Carraro, J.A.H. A New Slurry-Based Method of Preparation of Hollow Cylinder Specimens of Clean and Silty Sands. Geotech. Test J. 2013, 36, 811–822. [Google Scholar] [CrossRef]
- Zhu, Z.H.; Zhang, F.; Dupla, J.C.; Canou, J.; Foerster, E.; Peng, Q.Y. Assessment of tamping-based specimen preparation methods on static liquefaction of loose silty sand. Soil Dyn. Earthq. Eng. 2021, 143, 106592. [Google Scholar] [CrossRef]
- Mehlich, A. Uniformity of soil test results as influenced by volume weight. Commun. Soil Sci. Plan 1973, 4, 475–486. [Google Scholar] [CrossRef]
- Meshram, K.; Rangwala, H.M.; Sanvaliya, P.; Goliya, H.S. On-Field Assessment of Sub-Grade Uniformity Using DCP. Geotech. Test J. 2016, 39, 447–451. [Google Scholar] [CrossRef]
- Bradshaw, A.S.; Baxter, C.D.P. Sample preparation of silts for liquefaction testing. Geotech. Test J. 2007, 30, 324–332. [Google Scholar]
- Zhang, L.X.; Qi, S.W.; Yu, Y.T.; Zhang, Y.G.; Li, Z.Q.; Hou, X.K.; Ma, L.N.; Zou, Y.; Guo, S.F.; Peng, J.B. A comparative study on the physical properties of natural sedimentary loess and manual filling compacted loess. Environ. Earth Sci. 2021, 80, 721. [Google Scholar] [CrossRef]
- Xue, Q. Study on Air Permeability of Malan Loess and Homogeneity of Remolded Samples Based on Air Permeability; Chang’an University: Xi’an, China, 2020. [Google Scholar]
- Bellotti, R.; Ghionna, V.N.; Morabito, P. Uniformity tests in calibration chamber samples by the thermal probe method. Geotech. Test J. 1991, 14, 195–205. [Google Scholar]
- Azadi, M.R.E.; Monfared, S.R. Fall cone test parameters and their effects on the liquid and plastic limits of homogeneous and non-homogeneous soil samples. Electron. J. Geotech. Eng. K 2012, 17, 1615–1646. [Google Scholar]
- Wang, L.; Li, X.A.; Li, L.C.; Hong, B.; Yao, W.; Lei, H.N.; Zhang, C. Characterization of the collapsible mechanisms of Malan loess on the Chinese Loess Plateau and their effects on eroded loess landforms. Hum. Ecol. Risk Assess 2020, 26, 2541–2566. [Google Scholar] [CrossRef]
- Yu, B.; Fan, W.; Dijkstra, T.A.; Wei, Y.N.; Deng, L.S. Pore structure evolution due to loess collapse: A comparative study using MIP and X-ray micro-CT. Geoderma 2022, 424, 115955. [Google Scholar] [CrossRef]
- Liu, J.W.; Fan, H.H.; Song, X.Y.; Yang, X.J. Characteristics of Shear Strength and Deformation of Compacted Q3 Loess. Soil Mech. Found Eng. 2020, 57, 65–72. [Google Scholar] [CrossRef]
- Yuan, W.N.; Fan, W.; Jiang, C.C.; Peng, X.L. Experimental study on the shear behavior of loess and paleosol based on ring shear tests. Eng. Geol. 2019, 250, 11–20. [Google Scholar] [CrossRef]
- Mei, Y.; Hu, C.M.; Yuan, Y.L.; Wang, X.Y.; Zhao, N. Experimental study on deformation and strength property of compacted loess. Geomech. Eng. 2016, 11, 161–175. [Google Scholar] [CrossRef]
- Nan, J.J.; Peng, J.B.; Zhu, F.J.; Ma, P.H.; Liu, R.; Leng, Y.Q.; Meng, Z.J. Shear behavior and microstructural variation in loess from the Yan’an area, China. Eng. Geol. 2021, 280, 105964. [Google Scholar] [CrossRef]
- Wen, B.P.; Yan, Y.J. Influence of structure on shear characteristics of the unsaturated loess in Lanzhou, China. Eng. Geol. 2014, 168, 46–58. [Google Scholar] [CrossRef]
- De Lima, R.P.; Keller, T. Impact of sample dimensions, soil-cylinder wall friction and elastic properties of soil on stress field and bulk density in uniaxial compression tests. Soil Till Res. 2019, 189, 15–24. [Google Scholar] [CrossRef]
- Meng, J.; Li, X.A.; Zhao, X.K.; Liu, J.Y.; Wang, J.X. Uniformity of remoulded loess samples based on high precision μCT scanning. J. Chang. Sci. Res. Inst. 2019, 36, 125. [Google Scholar]
- Milodowski, A.E.; Northmore, K.J.; Kemp, S.J.; Entwisle, D.C.; Gunn, D.A.; Jackson, P.D.; Boardman, D.I.; Zoumpakis, A.; Rogers, C.D.F.; Dixon, N.; et al. The mineralogy and fabric of “Brickearths” in Kent, UK and their relationship to engineering behaviour. B Eng. Geol. Environ. 2015, 74, 1187–1211. [Google Scholar] [CrossRef]


Disclaimer/Publisher’s Note: The statements, opinions and data contained in all publications are solely those of the individual author(s) and contributor(s) and not of MDPI and/or the editor(s). MDPI and/or the editor(s) disclaim responsibility for any injury to people or property resulting from any ideas, methods, instructions or products referred to in the content. |
© 2023 by the authors. Licensee MDPI, Basel, Switzerland. This article is an open access article distributed under the terms and conditions of the Creative Commons Attribution (CC BY) license (https://creativecommons.org/licenses/by/4.0/).