1. Introduction
Historic sites are particularly exposed to the adverse effects of natural disasters, with results that might range from progressive decline to complete catastrophe [
1]. Seismic risk is usually measured as a function of three main factors: hazard, vulnerability and exposure, which refers to all the elements subject to potential losses. Over time, researchers introduced the concept of “coping capacity”, which is strictly related to resilience, defined as “the ability to resist the impact of disasters and absorb it by adapting to the hazard” [
2].
Risk assessment is a crucial part of safeguarding cultural assets from natural hazards. This is especially true in historic areas where the built environment, community and social life, and cultural assets of both tangible and intangible qualities, exhibit significant levels of vulnerability and exposure.
Common actions for risk reduction aim to reduce the factors causing disasters; when talking about earthquakes, it is impossible to reduce or predict the hazard. Therefore, classic risk mitigation strategies focus on reducing mainly vulnerability but also exposure to limit the impacts of an event; vulnerability generally refers to the probability of damage when a hazard occurs.
Most research on the built environment focuses on evaluating physical vulnerability, particularly in the case of seismic events, whose effects are significantly influenced by the restricted ability of buildings to withstand an earthquake [
3].
The best-known results of a vulnerability analysis are the fragility functions, mathematical functions that express the probability that undesired events occur as a function of a specific intensity measurement. In other words, as reported in Porter’s guide [
4], fragility functions represent the probability that an indefinite quantity is less than or equal to a given value as a function of that value (cumulative distribution function).
The ability of the fragility curves to correctly predict the probability distribution of damage depends on the level of detail of the data collected by generating numerical models that could best simulate the behavior of the building.
There are four approaches in the literature to develop fragility functions: (i) expert reviews; (ii) empirical method; (iii) analytical method; and (iv) hybrid method.
The vulnerability assessment through the empirical approach derives from observing the damage distribution in buildings after past seismic events. This approach is the most realistic, and data concerning soil-structure interaction, topography, site and characteristics of the case study are considered. However, this condition implies the need for large amounts of observed data.
There are three main categories of empirical methods:
This method is based on field inspections and expresses in a discrete form the conditional probability that a level of damage will be reached given a seismic intensity. Their main use is the probabilistic forecast of damage levels on buildings. This method is based on data relating to damage from past earthquakes and considers the correlation between the seismic intensity, the material and the construction methods of the different areas. This method has been widely used in the past for several applications. An example is the research after the Irpinia (Italy) earthquake [
5], which proposed a statistical study on building damage using the MSK-76 scale. Even after the Friuli earthquake, a conceptual framework was proposed for a large-scale assessment of the building’s seismic vulnerability using the DPM [
6]. Dolce et al. [
7] proposed a significant damage scenario for the building stock of the municipality of Potenza, in Southern Italy, where the vulnerability assessment is carried out using the DPM of four vulnerability classes ranging from the high class (class A) to the low class (class D) according to EMS-98. Giovinazzi and Lagomarsino [
8] proposed a method in which the DPM is evaluated for the six vulnerability classes considered by the EMS98 scale: the vulnerability curves are derived for these classes and different building types. This approach has undergone additional development in recent years [
9] since it was calibrated on the observed damage in Italy and made available in the database Da.D.O. [
10] created by the Italian Department of Civil Protection (DPC).
- 2.
Vulnerability Index (VI)
This method evaluates the seismic vulnerability of historic buildings by calculating a vulnerability index using specific parameters that influence the building’s seismic response. Current VI-based methods have been developed and calibrated on specific construction types. Among the traditional approaches applied to historical buildings in aggregate are the GNTD method [
11], the Formisano method [
12,
13] and the Vicente method [
14]. The GDNT method [
11] adopts eleven parameters and four vulnerability classes to evaluate the VI.
Formisano [
12] added five parameters: the interaction of buildings with different heights, the percentage of openings in the facade walls, the structural difference between adjacent structural units, the presence of staggered floors and the position of the structural unit in the aggregate.
The Vicente method [
14] introduced three new parameters and four macro-classes of parameters relating to the structural construction system, irregularities and interaction, floors and roofing, the state of conservation and other elements.
These VI methodologies’ reliability has been recently verified through the observation of real seismic damages on the masonry buildings in Campi Alto di Norcia (Italy) hit by the earthquakes of 24 August and 30 October 2016 [
15].
Among the recent developments of VI methods, it is possible to mention [
16], which adopts only eight variables from the CARTIS form that were deemed to have the most significant impact on a building’s seismic behavior were taken into account when developing a new predictive model.
- 3.
Continuous Vulnerability Curves
This approach defines continuous functions to express the vulnerability of a building or building classes. It describes the probability of overcoming a specific state of damage given a seismic intensity. The reported damage is the one observed during past seismic events.
All vulnerability functions have a dispersion value for all damage states given a building class to consider uncertainties. Furthermore, it is assumed that all damage levels are interrelated and that one level may be derived from the others.
The three classifications are very distinct from one another, and the researchers agree that vulnerability assessment on an urban scale cannot be relied on numerical models due to the challenges in obtaining a uniform and thorough understanding of the entire settlement. Moreover, empirical methods like DPM and VI have historically been applied on masonry structures and calibrated using damage data from field observations and surveys conducted after an earthquake.
Exposure in historic centers involves various factors such as people, buildings, and immovable, movable, intangible and tangible assets. Human exposure is usually quantified by census data, which, unfortunately, refers to the entire area. Only after extensive prior processing, it is possible to separate this information from the census data that might belong to the historic center.
The analysis of the seismic loss is essential for the decision-making process. It is defined as (i) direct economic losses associated with the repair of damage within a structure; (ii) direct losses associated with accidents and casualties; and (iii) indirect losses associated with loss of income due to business interruption. Generally, these three forms of losses (damage, death and downtime) are known as “3D” [
17] and have often been applied to the residential building fabric of historic centers [
18,
19]. Since it is challenging to quantify cultural heritage losses, current research has focused on the evaluation of potential loss through non-economic indicators. [
20,
21].
Once the information on hazard, vulnerability and exposure has been combined, it is possible to obtain risk maps as already experimented by [
22] for the city of Pordenone (Italy). However, in the framework of historical contexts, it is necessary to consider the conservation principles based on the idea of authenticity and the significance of keeping historic structures and locations in their natural and historical contexts.
Although quantitative methods and frameworks have been created in various sectors with regard to the resilience component, [
23] methodologies that address specific aspects relating to the conservation of cultural heritage assets are still largely unavailable. In this situation, pre-event actions like the implementation of training programs in emergency/recovery procedures are typically used to address prevention in order to deal with the effects of disasters or specific investigations carried out on the different functional and formal subsystems of the urban settlement through which to justify the design choices at different scales of intervention and provide indications in on the priority of interventions.
However, when it comes to cultural assets, a significant conceptual barrier is the asset’s value’s multidimensionality and the complexity of its evaluation [
24]. As a result, it is much harder to forecast in these situations how long it would take and what resources will be needed to restore functionality and quality. Based on these descriptions, a framework that incorporates a thorough risk assessment process and regular updating of its results over time must integrate the following important aspects [
25]: (i) sufficient reliable data to establish adequate risk models; (ii) a good quantity of reliable data on risk assets; (iii) adequate procedures for modelling vulnerability; (iv) adequate models to predict the consequences of the hazard; and (v) sufficient human, time and financial resources.
Regardless of the risk present, (iv) is the most challenging issue to handle in the context of a risk assessment approach for cultural heritage assets. Additionally, having access to (v) is necessary for successfully addressing (i), (ii) and (iii). These resources will typically set the parameters of the breadth and thoroughness of the risk analysis, and they will also be essential to success. Therefore, when dealing with numerous cultural heritage assets, it’s crucial to have a straightforward technique that can be used for preliminary risk analyses to determine risk mitigation priorities or to identify assets that require more detailed analysis and that require resources. Romão et al. [
25] applied a qualitative approach for defining a simplified method for risk analysis. The latter is defined by a non-numerical estimate that simplifies risk analysis by condensing the number of calculations and inputs needed to a handful of judgments. Policymakers and stakeholders can then be easily informed of the simplified risk categories that were generated as outputs. When theory, data, time or experience are scarce, qualitative analyses can be helpful. They can also be used when decision-makers simply need a qualitative risk assessment.
Additionally, they can be helpful even for issues for which quantitative risk analysis is not applicable. This method was implemented by Giuliani et al. [
20], including some quantitative risk assessments in the qualitative methodology. Similarly, the strategy applied by D’Amico and Currà [
26] identifies the possible qualitative and quantitative correlations between the structural/analytical and urban/systemic spheres, identifying a priority matrix for a temporal optimization of preventive planning.
The paper aims to define a framework for the resilience assessment of a historical city with significant cultural and historical importance but without adequate analysis methods to produce large-scale, trustworthy results. The framework developed corresponds to the original contribution of the paper concerning the current state-of-the-art. The model developed is based on an organized knowledge of constructive, evolutionary and vulnerability data at the building and aggregate scale and prefigures its preparation in the pre-event phase, outside the emergency [
27]. The predictive scenarios of the damage, based on seismic vulnerability analyses present in the literature, identify the expected damage scenarios, with the consequent evaluation of the losses that will allow obtaining a map of the seismic risk of the historic center. Through further analyses, sometimes qualitative, a priority matrix will be obtained to define the resilience scenarios to support the preventive phases of Disaster Risk Management.
2. Materials and Methods
2.1. GIS-Based Resilience Assessment
In accordance with the Sendai Framework [
28], the model proposed has been structured as an iterative process, which can be continuously implemented and managed through a GIS platform, in particular, the open-source program Qgis, which is easy to read and accessible to anyone. A GIS is a computer tool capable of storing, managing, processing, comparing, correlating, and showing a wide range of spatial information collected from several georeferenced datasets, useful for many different kinds of applications, such as risk assessment and environmental impact, emergency response and management, and urban planning, cartography, concerning extensive territorial areas [
29]. GIS analysis allows the performing of many operations ranging from the simple graphic display of the data entered to arrive at complex analytical processing. Furthermore, another non-negligible potential of this tool is the possibility of continuously updating the information available on buildings little by little, creating a unique georeferenced database.
Because of these factors, GIS is also a potent instrument in the field of seismic vulnerability and large-scale risk assessment, where all procedures and approaches must be founded on a comprehensive and reliable dataset. However, the key challenge at this application scale is overcoming the accessibility, availability, and reliability of data. The emphasis should be on data-gathering procedures and refining methodologies for analyzing the seismic susceptibility of buildings [
30].
The use of information systems for similar purposes has already been proposed on several occasions by different research groups, testifying that this tool lends itself to different uses and currently represents one of the most functional means for managing large amounts of information from various kinds. Among the case studies already developed on the use of GIS software for the assessment of vulnerability and seismic risk in historic areas, it is possible to mention [
12,
31,
32,
33,
34].
In all the studies mentioned above, GIS is a key tool for risk assessment, allowing the following functions:
the processing and integration of various information layers;
the quick adoption of numerous extensive evaluation techniques;
the administration of numerous georeferenced data;
data processing that produces quick, easy-to-understand thematic maps.
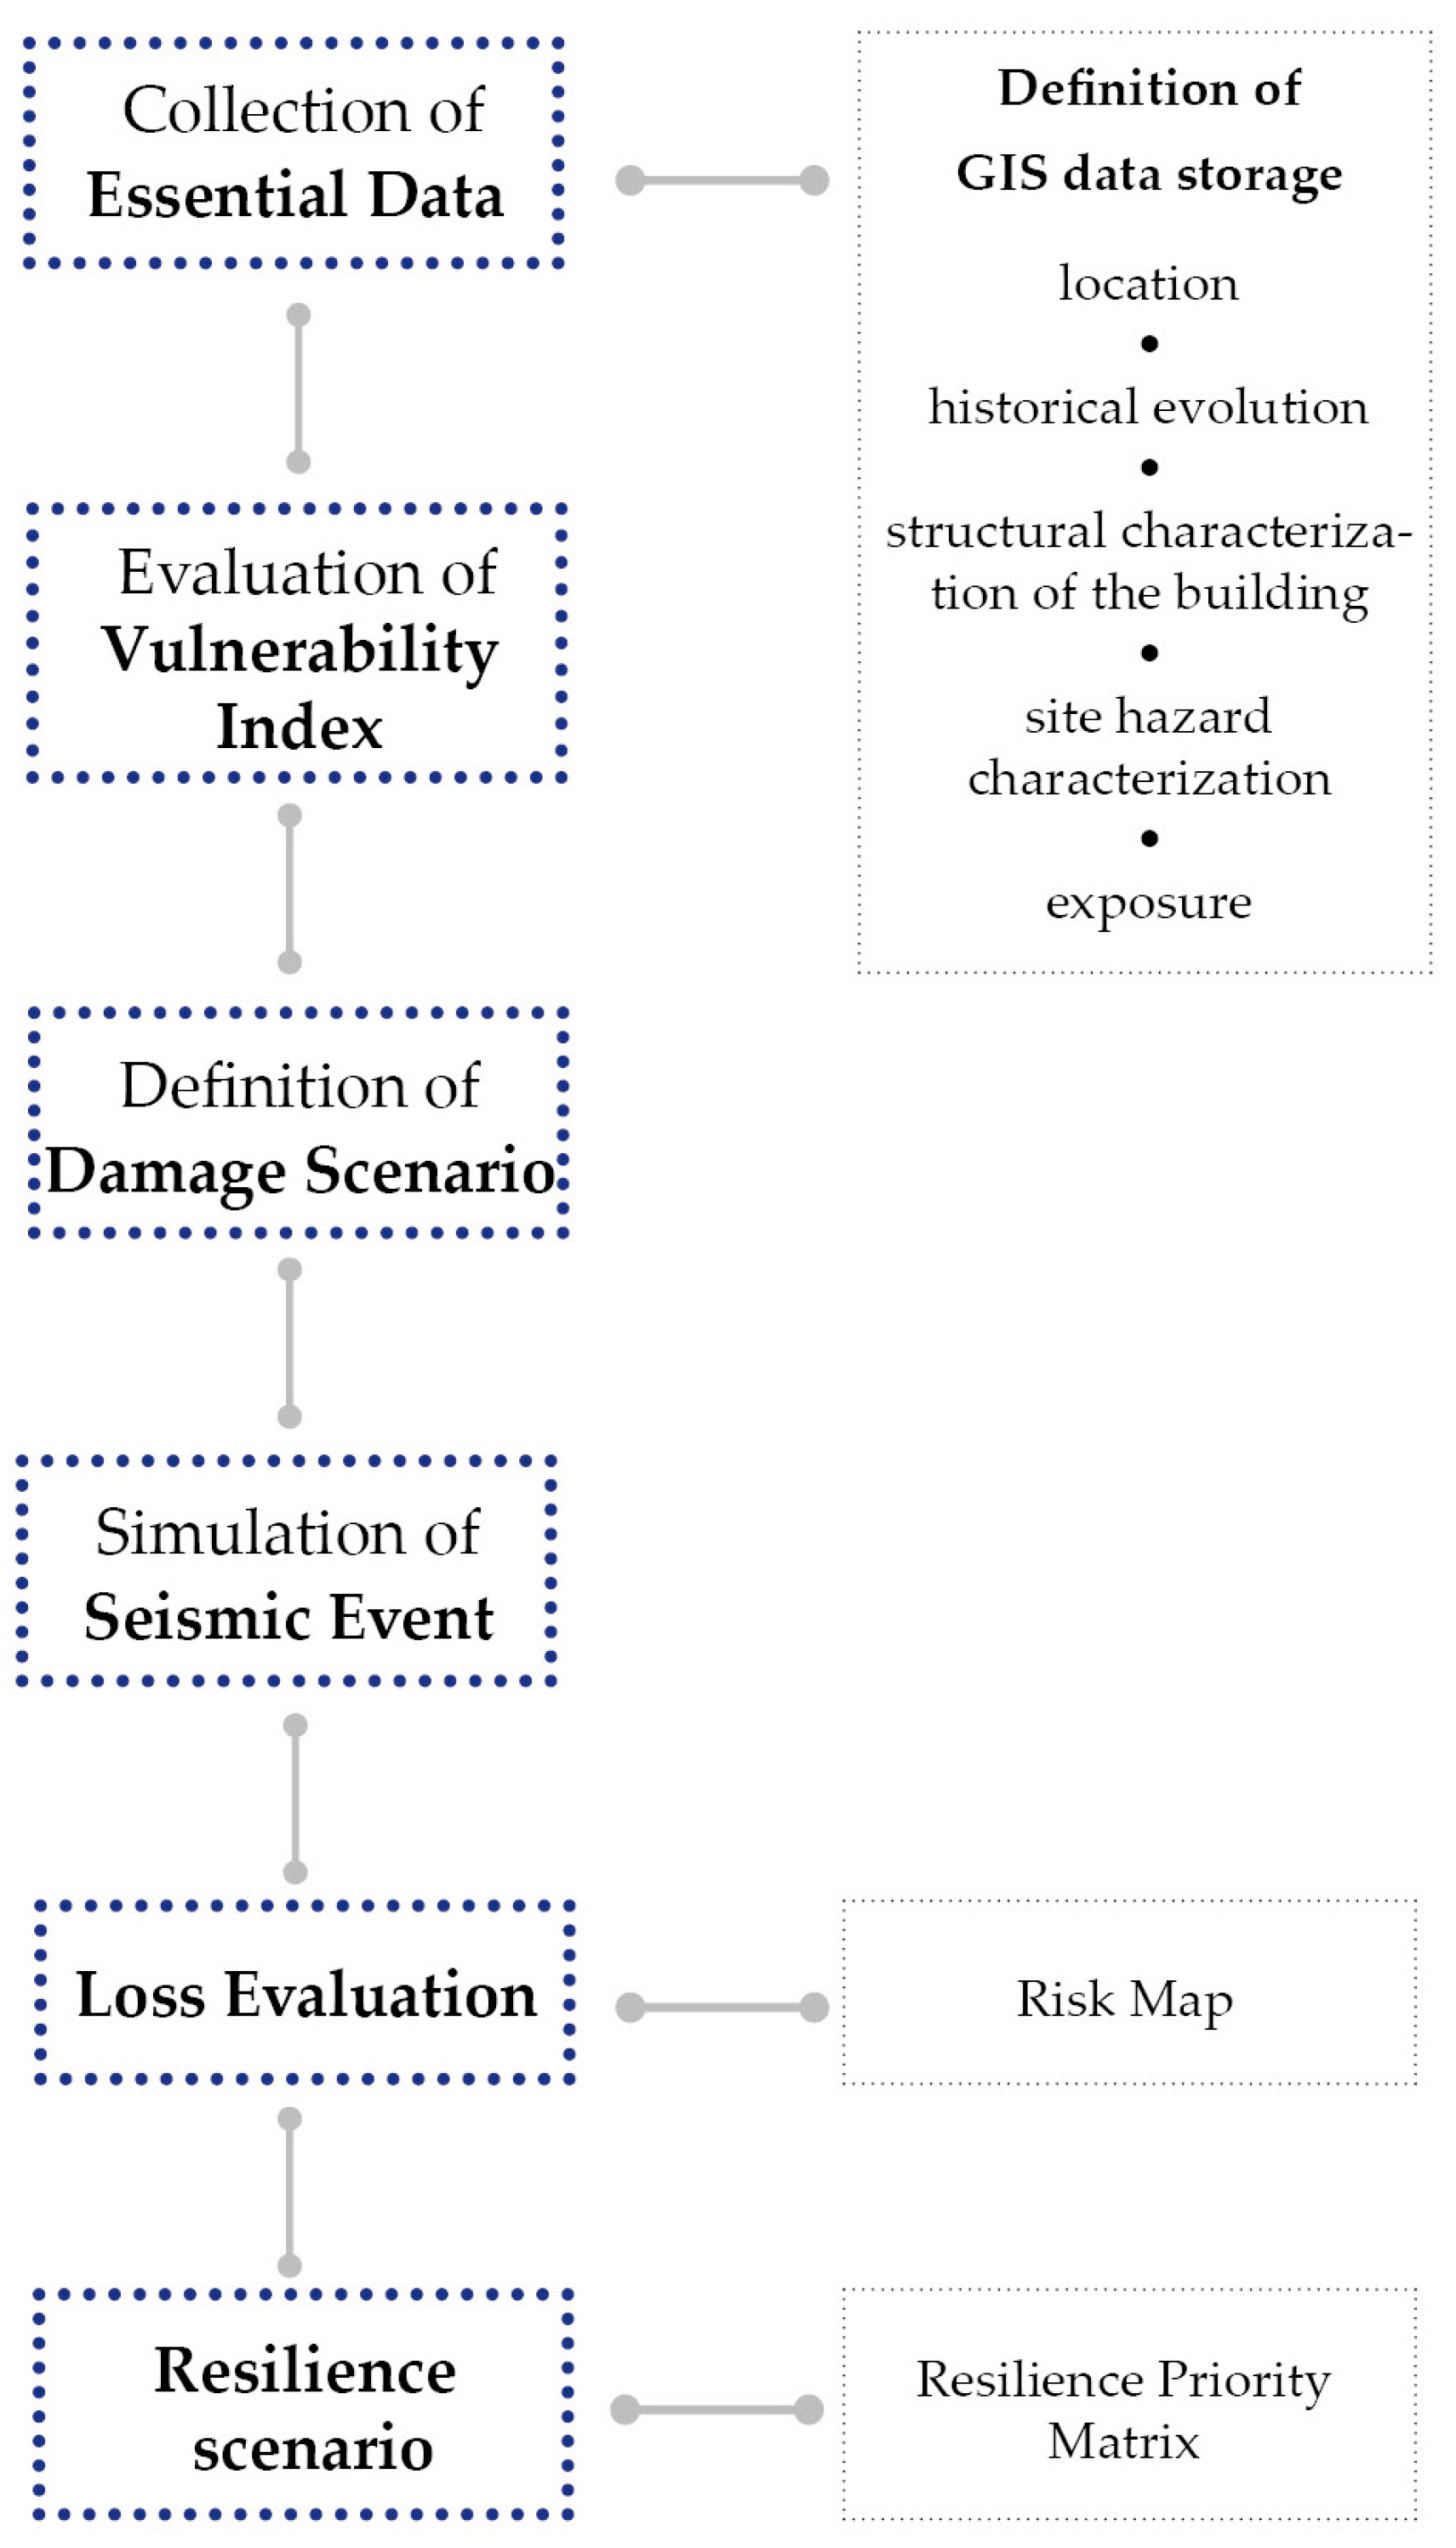
The proposed framework is mainly based on six operational phases (
Figure 1):
The collection of essential data
The evaluation of vulnerability index
The definition of damage scenario
The simulation of the seismic event
Loss evaluation
Resilience scenario
The reliability of the framework depends on the quantity and quality of the input data. Detailed analysis and in-depth knowledge will lead to a more reliable result.
2.2. Collection of Essential Data
The first phase of the framework is the definition, collection and implementation of data on the GIS platform. Within this process, the key step is the derivation of all possible information on existing buildings from different types of sources aiming at building an adequate GIS platform for the implementation of procedures of seismic evaluation. However, it is worth noting that, in all the studies and applications mentioned above, the starting point was a wide variety and quantity of data, which is not always possible to rely on such a complete dataset. This work is contextualized in this framework, proposing an approach suitable for all circumstances relating to the scarcity of data, time and economic resources that are able to obtain missing information on the existing building stock, from the urban scale to the building scale, without resorting to in-depth and onerous on-site inspections, with the aim of creating an information tool that is easily searchable and dynamically implementable by exploiting the potential of GIS and applying expeditious methodologies that make it possible to have a cognitive framework as complete as possible in the timing of planning.
To this purpose, it is advisable to make an initial selection of the objects to be investigated through a screening that uses a first-level cognitive framework obtained from already available data and eventually deepens the investigation.
The cognitive framework is divided into three progressive levels of knowledge which are divided into five points:
They derive primarily from the essential knowledge of historical evolution as a cardinal principle, which the characteristics of the places must follow. Data on historical evolution are collected at the first level of knowledge based on historical cartography and existing studies. They will be the basis on which to derive the necessary information, the retrieval of which would be possible only through specific inspections.
2.3. Evaluation of Vulnerability Index
The information obtained through phase 1 represents the first level of information to start the subsequent phase of identifying the vulnerability of the individual building aggregates and structural units.
The assessment of the seismic vulnerability of buildings is carried out by using two different approaches: the first one used by Vicente [
14] and already used in experiments in Lisbon downtown by [
32], which assigns to each building a vulnerability index (VI) based on the weighted sum of factors that have an impact on seismic performance. The method has a total of fourteen parameters, with the least significant ones in terms of seismic behavior having a p
i weight of 0.25 and the most significant ones having a p
i weight of 1.50 (
Table 1). According to the inherent qualities of the building, each parameter is consequently assigned to one of the four classes of increasing vulnerability: A = 0, B = 5, C = 20, and D = 50. The weights of these parameters are summed to obtain the VI. The index is then normalized in the range of 0–100. It is vital to note that the specification of these weights is a significant source of the method’s uncertainty and should be validated using additional in-depth studies (e.g., the results of investigations on damage after an earthquake or numerical analyzes).
The second method applied for the definition of the vulnerability index is that adopted by Polese [
35] based on the RISK-EU vulnerability model [
8], which uses the macroseismic method by measuring seismic vulnerability in terms of a vulnerability V and a ductility parameter Q, both evaluated considering the type of building and its construction characteristics. The EMS-98 [
36] damage scale is used in the model. The RISK-EU model only considers the building material and basic information about the vertical structural system when classifying structures. In particular, the V
* vulnerability index and relative range of values relating to more probable (V
−/V
+) or less probable (V
−−/V
++) behaviors of the structure are assigned to seven masonry building types (
Table 2).
If more information is available, the characterization of the vulnerability can be improved by adopting the following equation:
In Equation (1), the score modifier score ΔV considers the effect of relevance to vulnerability factors. As can be seen in
Table 3, the maximum variation ΔV for masonry buildings is due to the height of the buildings (from ME to LO or HI, function of the number of storeys), the presence of vaults or the presence/absence of retrofit interventions (±0.08).
2.4. Definition of Damage Scenario
Once the vulnerability index relating to individual buildings was obtained, a methodology for calculating the expected average damage was applied. The correlation between the seismic input and the expected damage is expressed in terms of vulnerability curves as a function of the assessed vulnerability, described by a closed analytical function.
It is possible to predict the expected damage to buildings for a particular level of seismic intensity from the vulnerability index (
) acquired for each building and, if necessary, produce vulnerability and fragility curves, which are a function of the different degrees of seismic intensity. According to [
14], Equation (2) defines the relationship between the vulnerability index (
) and the macroseismic vulnerability (V):
As a result, the vulnerability is stated as mean damage (
), which is described by the equation:
The seismic intensity (EMS98) is calculated as a function of the PGA through the equation:
The macroseismic intensity I and vulnerability V affect the mean damage which also depends on the ductility parameter. Depending on the type of construction, the Q parameter, which determines the slope of the curves, can have a variety of values. Masonry structures that aren’t particularly intended to exhibit ductile behavior can have a representative value of Q = 2.3.
2.5. Loss Evaluation
The risk maps integrate the damage map results to create indicators of impacts and losses based on predetermined formulas defined in [
18]. Based on the agreement on methods to estimate the risk in terms of expected damage for residential buildings, the methodology employs a shared approach in the Italian scientific community operating in the seismic vulnerability and risk sector. The impact specifically lists the amount of buildings that can be used or not in the short and long term and those which have collapsed. Casualties, injuries, and economic losses are used to express losses.
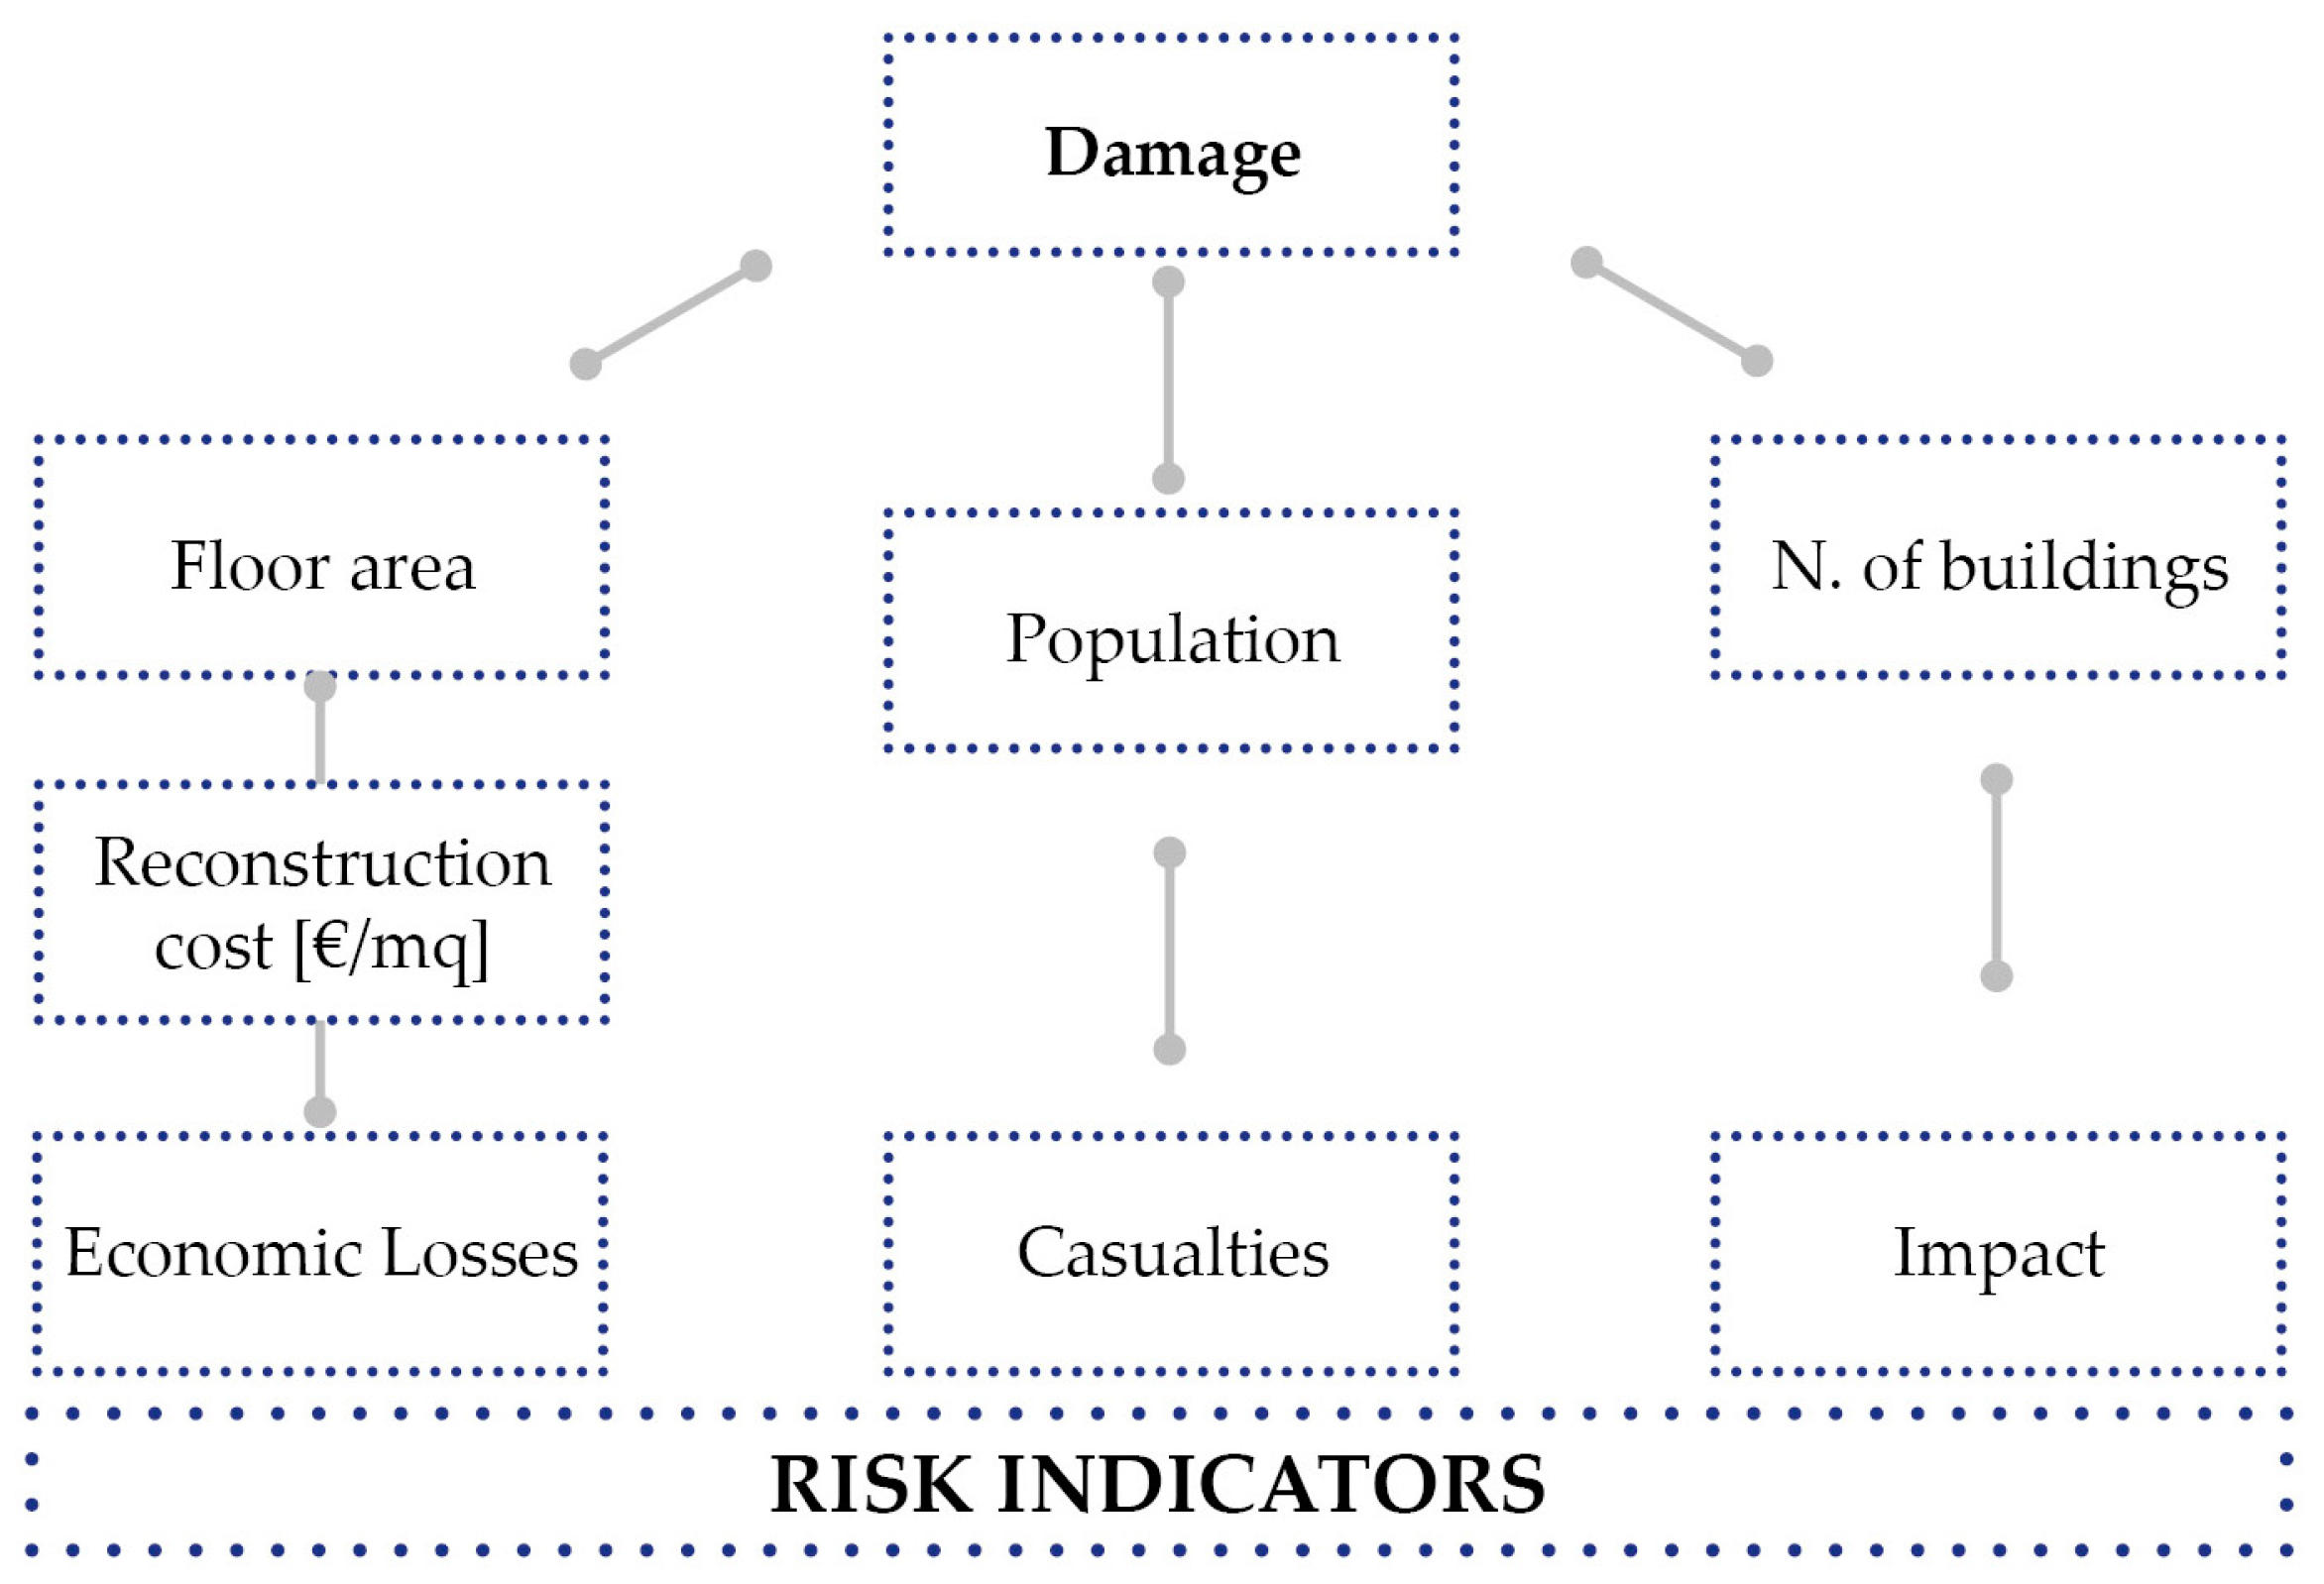
Damage-risk matrices give instructions on how to convert damage levels into risk indicators. Each matrix indicates the percentage to which each level of damage adds to an impact or loss: in order to estimate losses, the research employed default percentages from the IRMA Platform [
19]. The steps for risk assessment are shown in
Figure 2. The percentage of damaged structures matching to the selected impact is provided by matrix 1 (
Table 4). Matrices 2 and 3 provide the values to evaluate economic and human losses (
Table 5 and
Table 6).
In accordance with the formulation of [
19], the values foresee, for example, that 60% of the buildings with D3 damage and all the buildings with D4 damage are to be considered unusable for a long period of time. The likelihood of injury or death to occupants is usually assessed based on the level of damage to the building. It is considered that only damage levels D4 and D5 have significant injury and fatality ratios relative to the population. The probability of occurrence of each level of harm can be multiplied to combine these partial results and create the risk map.
2.6. Resilience Scenario
The final strategy for the assessment of resilience is built through a matrix-type approach by combining the analysis data on the constructed data and those of systemic reading at a building scale for a temporal optimization of process management and preventive planning aimed at defining an order of priority of intervention.
The final strategy for the assessment of resilience takes up and re-adapts the method used by D’Amico and Currà [
26], based on the so-called “tyranny of urgency”, i.e., the overwhelming pressure to act quickly to the catastrophic event or to act in a preventive perspective to invest the available resources efficiently. Through a matrix-type approach, the data from the analysis of the built data and expected losses are combined with managing tangible and intangible values, for a temporal optimization of process management and preventive planning, aimed at defining an intervention priority order based not only on the intrinsic vulnerability of the artefacts but also on the potential loss of cultural heritage.
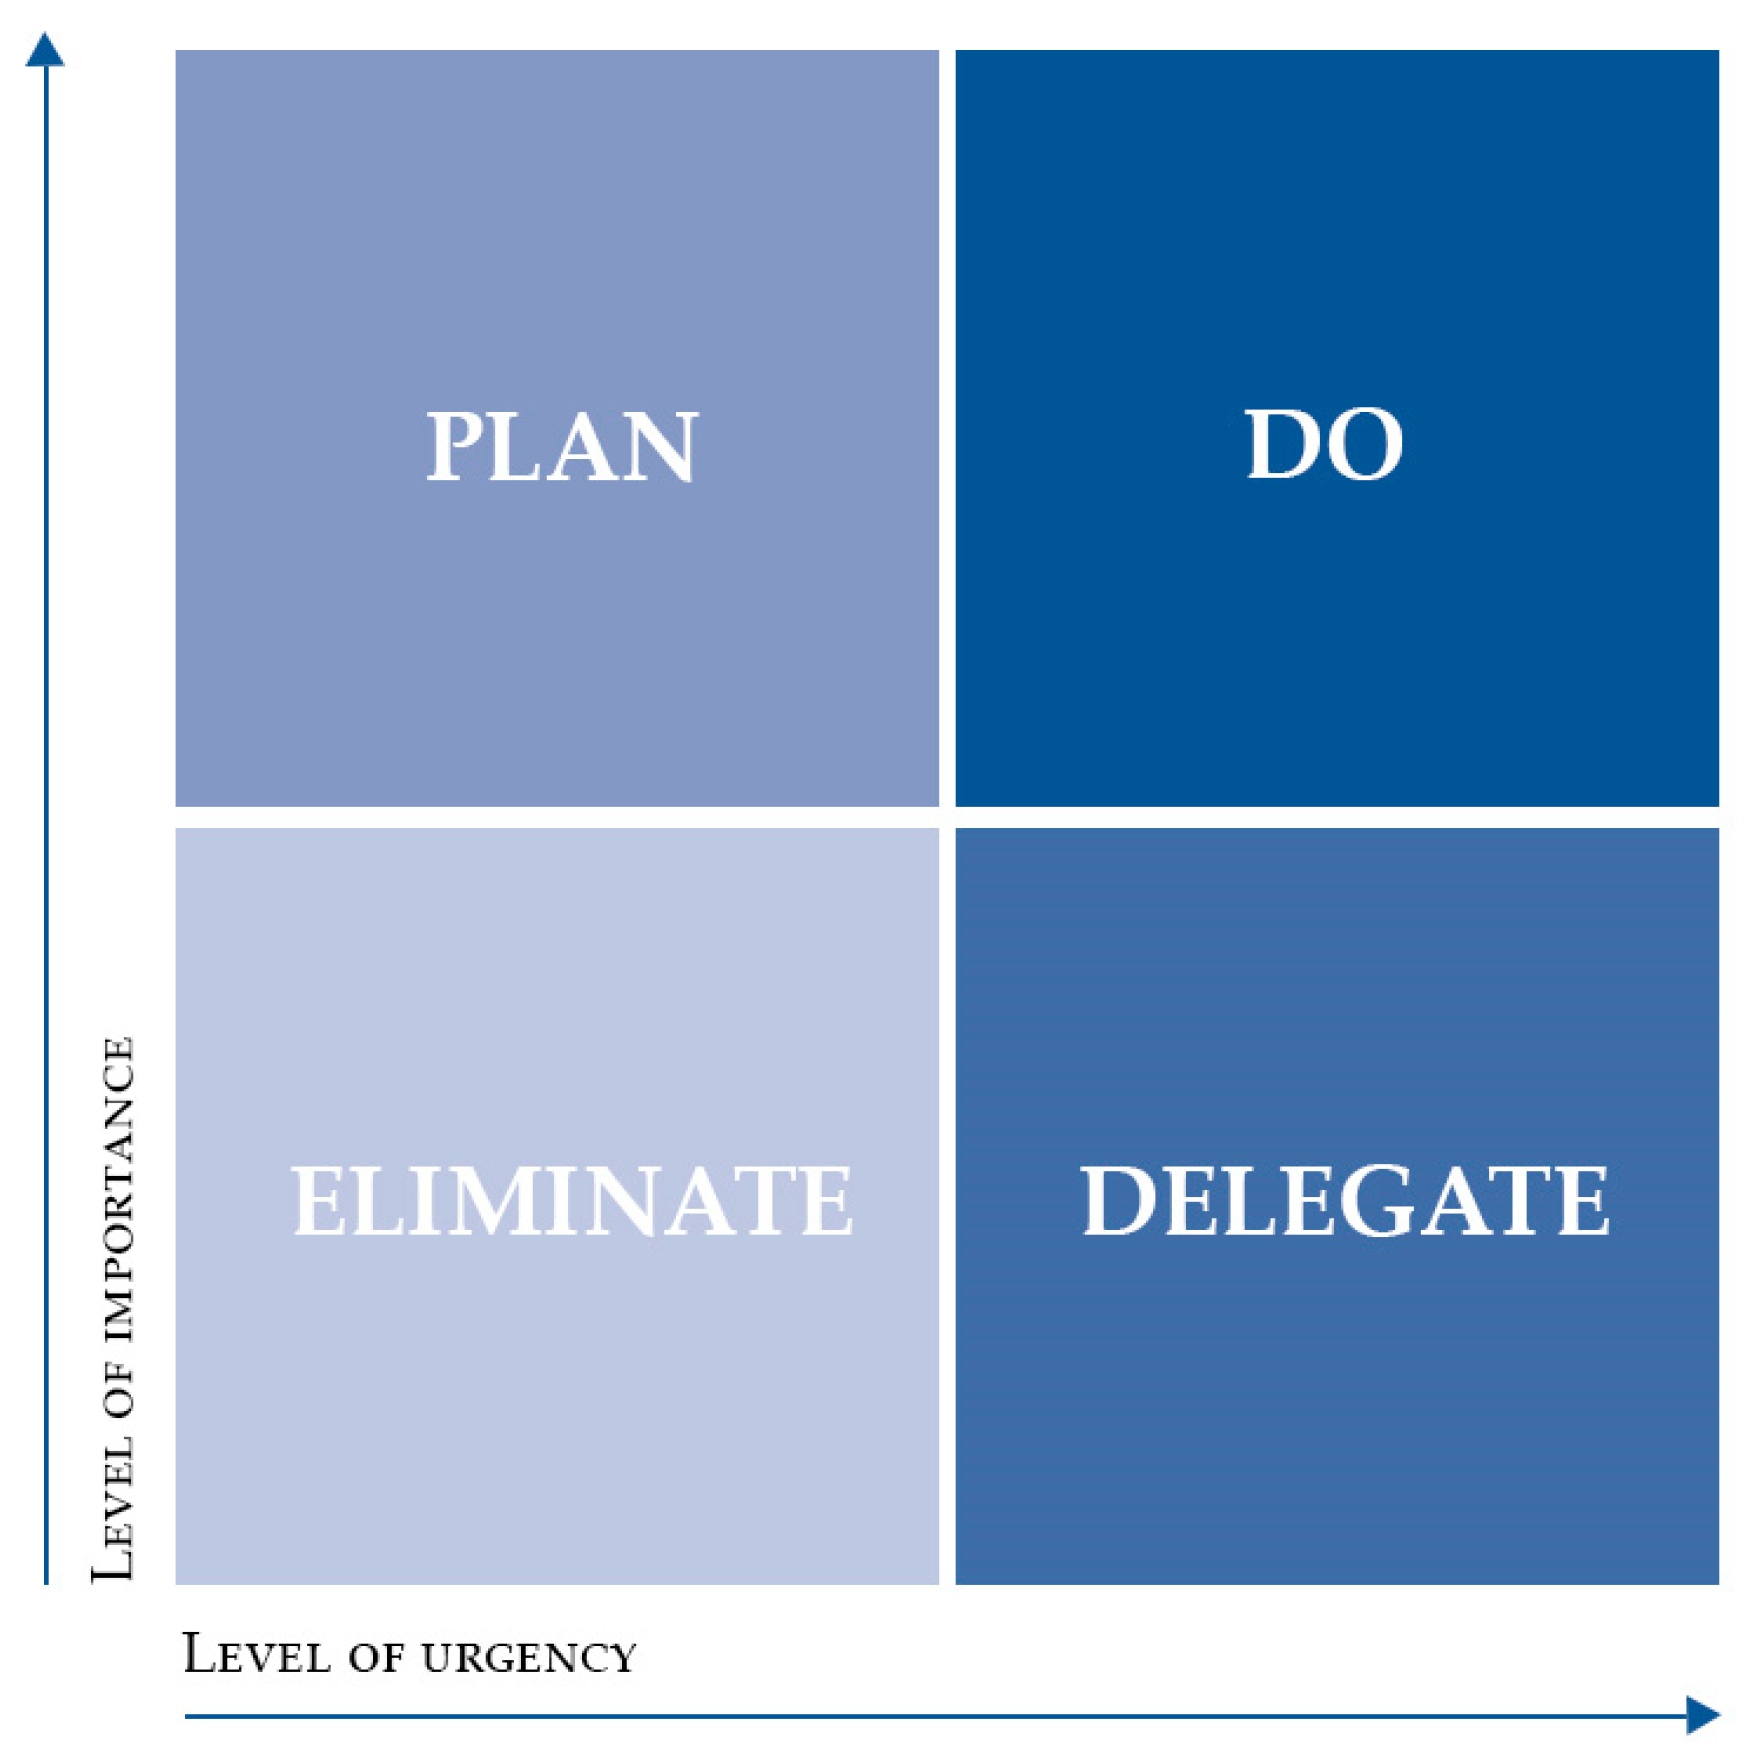
The generated matrix, called the “Matrix of Priorities”, is structured on the decision-making principle underlying Covey’s writings [
37]. The economist configures the operational tool that takes the name of “Covey Quadrants” or “Eisenhower Matrix”, starting from the assumption that “what is important is rarely urgent and what is urgent is rarely important” [
37]. Therefore, the key words for understanding the model are two: “urgency” and “importance”.
The analysis relating to the built environment that has an element of objectivity, based on data analysis, cartographies, and surveys, and therefore defined by the risk map, defines the element of “urgency”, linked to conditions that require attention immediately and are those considered up to now with the methods applied for the definition of the damage and expected losses.
The parameters of the historic city related to the cultural heritage are instead linked to the definition of “importance”, which is defined through the following categories [
21]:
historical value;
aesthetic value;
community value;
economic value.
Each value category is assigned a V quality score based on the following criteria, which are derived from the National Trust of Australia [
38]:
exceptional value: the asset has characteristics of exceptional significance out of national borders (score: 20);
considerable value: the asset has characteristics of national importance (score: 15);
some value: the asset has characteristics of certain importance at a regional level (score: 10);
limited value: the activity has characteristics of local relevance (score: 5);
no value: the asset has no value (score: 0).
Therefore, the basic pre-disaster value of a specific building in the historic center I given by (5):
where V
i is considered as the score of the i-th category of values.
The values proposed in Equation (5) have already been used in the 2011 Iorca earthquake (Spain) [
21] and in two cases in two case studies in central Italy earthquake of 2016, for the city of Camerino and Vezzano [
27].
The result of this elaboration, therefore, makes it possible to define the “urgency” and relative “importance” of intervention on a part of the historic center, trying to guide the preparation process in the preventive phase, or in the unfortunate case to serve as a basis for the reconstruction process in post-disaster phase.
The values thus obtained on the one hand of the damage and expected losses, and on the other hand, the basic value of the cultural assets was then normalized to a scale of 10 on the totals for each building’s “urgency” and “importance” in the historic city under consideration, defining a pair of input values (x,y) for each building’s priority matrix (
Figure 3).
3. Results
3.1. Lisbon Case Study
The presented framework is applied to the case study of Lisbon downtown, and it starts from former research started by [
32]: the data present in the study carried out by Catulo et al. have been updated to 2022 and have been implemented by collecting information also on the other areas of the historic center.
The district has been regulated by a detailed heritage protection plan since 2011 (Plano de Pormenor de Salvaguarda da Baixa Pombalina—PPSBP). The data used in this study included:
building footprints and street network provided by Lisbon Municipality (Shapefile). All the data were relative to the coordinate system Hayford-Gauss, datum 73;
Plano de Pormenor de Salvaguarda da Baixa Pombalina—PPSBP)—Heritage protection plan;
orthophoto maps from Google maps;
building information retrieved from Lisbon Municipal Council archives, which regards geometrical properties, type of building, year of construction, retrofit interventions, and structural typology [
39];
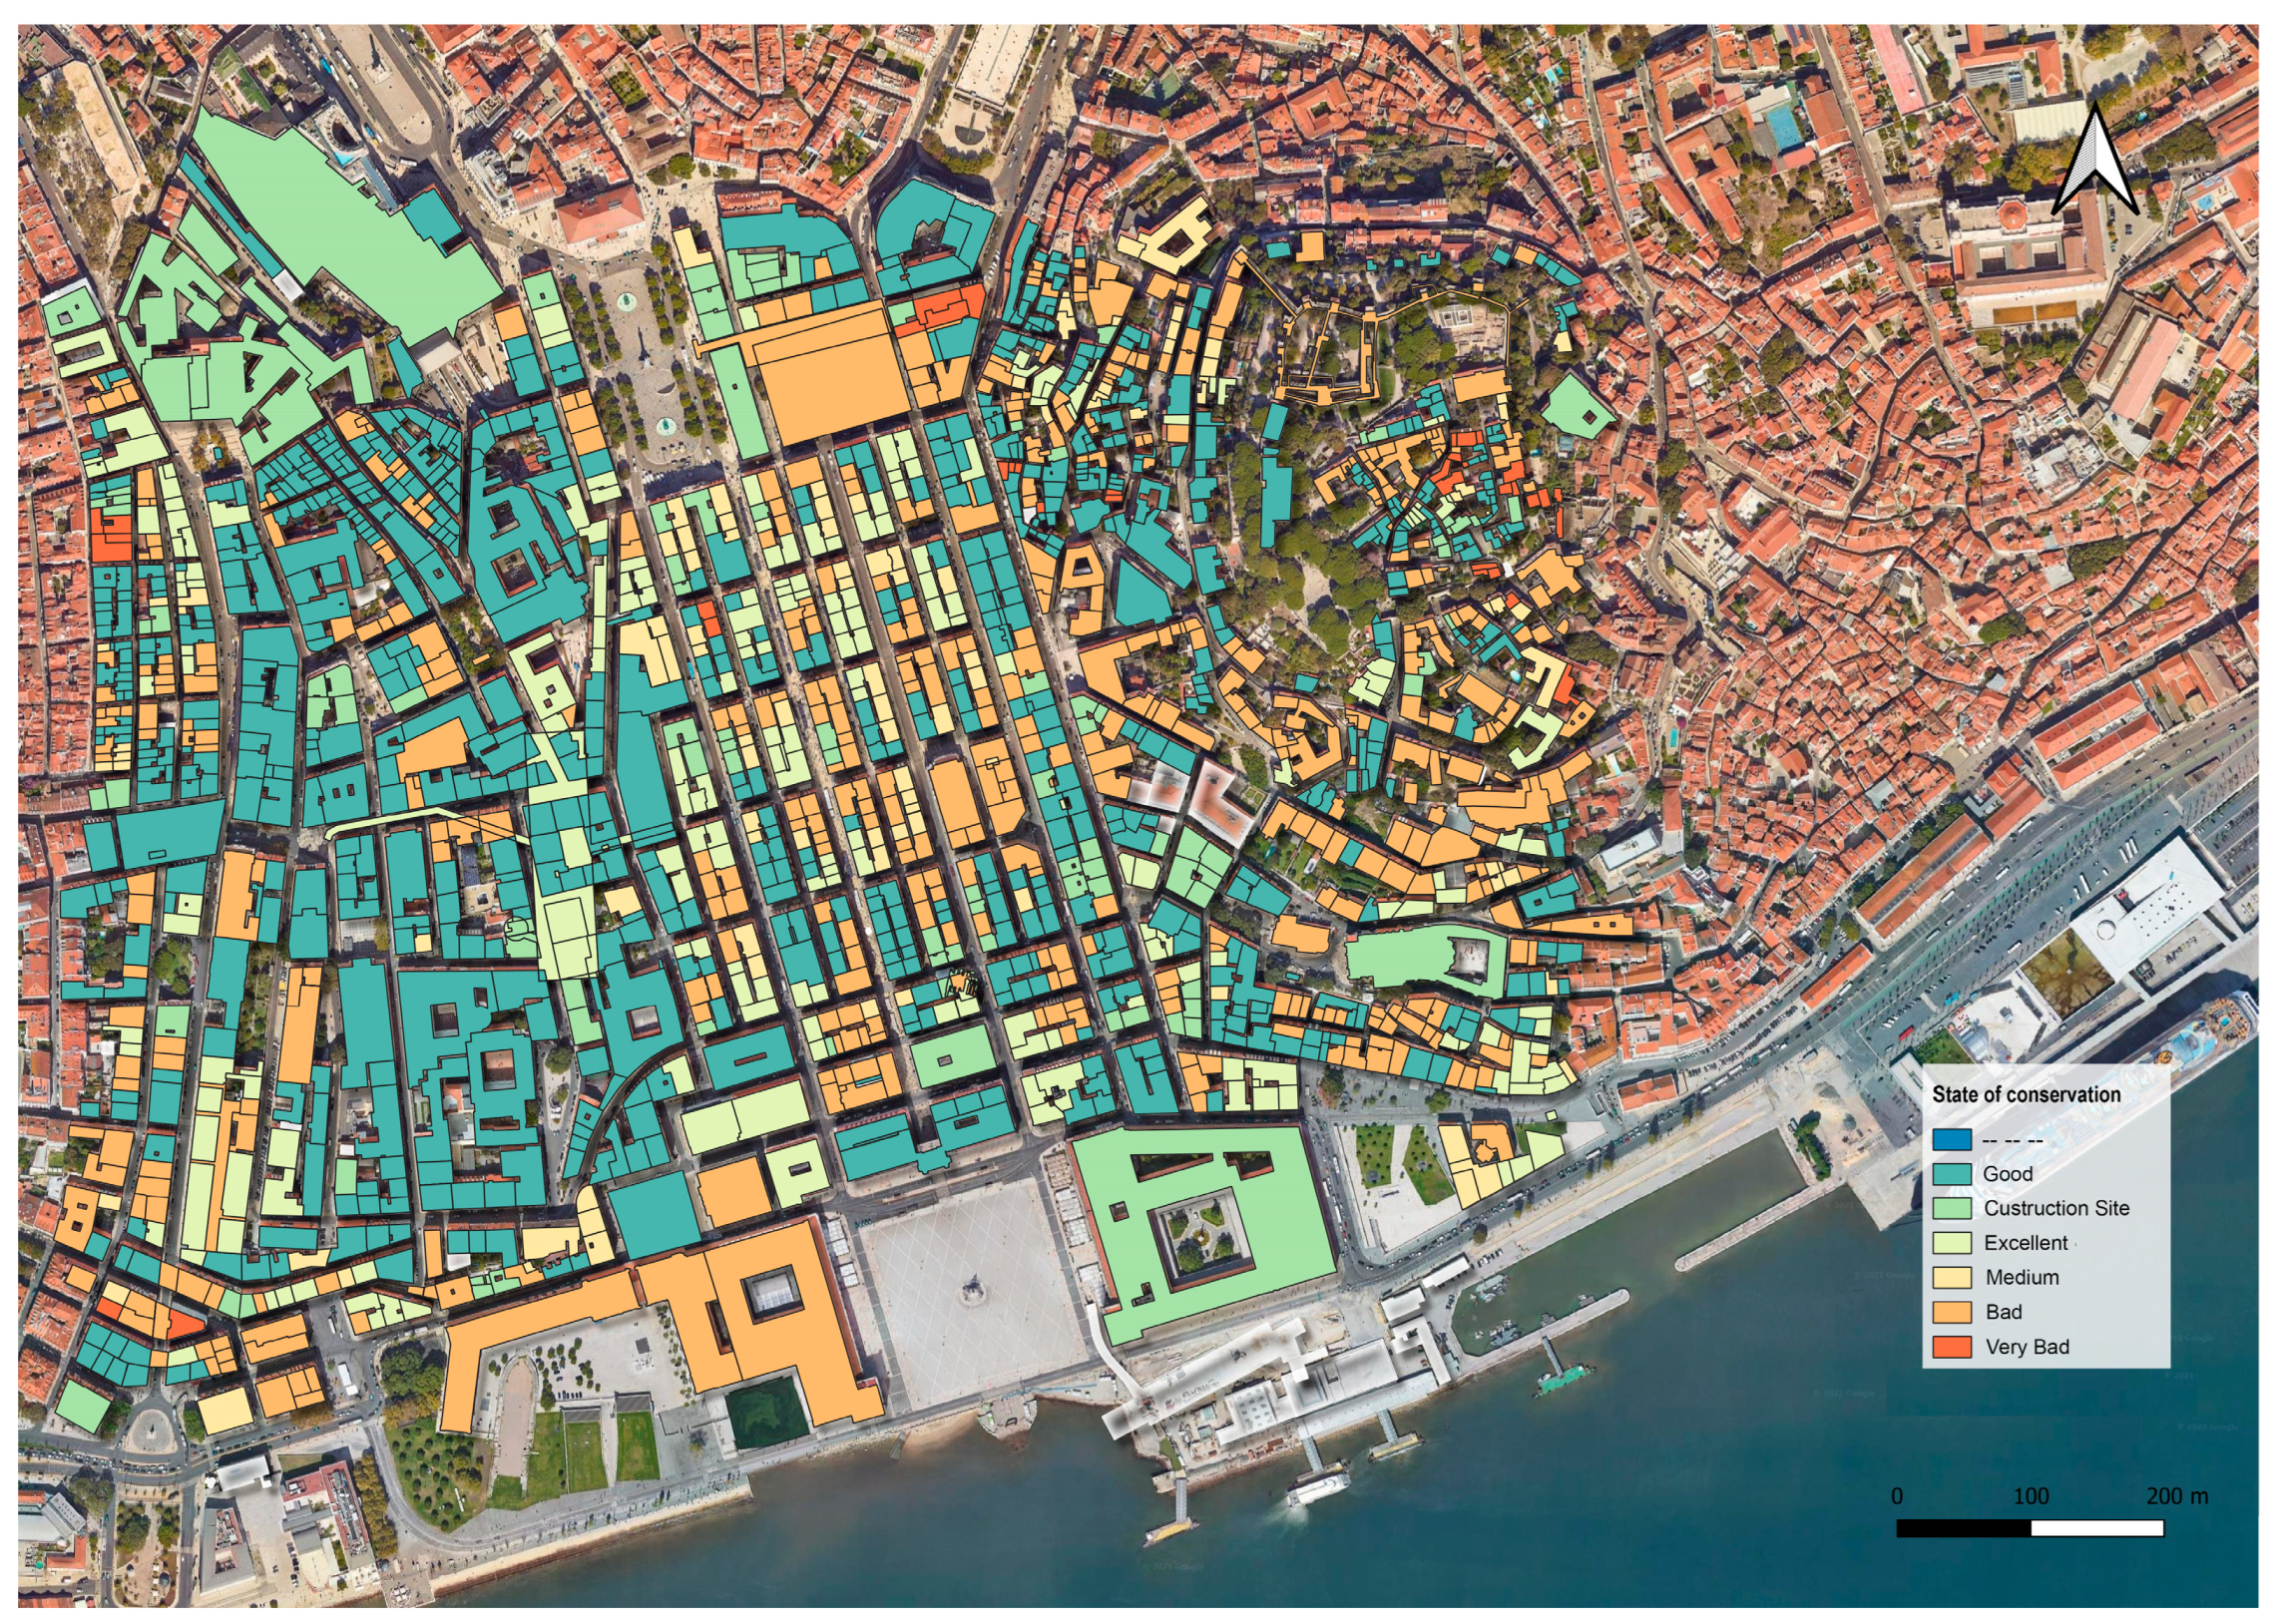
all the data obtained has been verified and updated by on-site inspections: Lisbon downtown is quickly changing, and many building sites were ongoing during the surveys. From those analyses, from 2017 to 2022 at least four buildings have been rebuilt in reinforced concrete (RC). Therefore, the records of these recent transformations are still not completely available; for this reason, on-site surveys were necessary to have a complete dataset.
3.2. Location
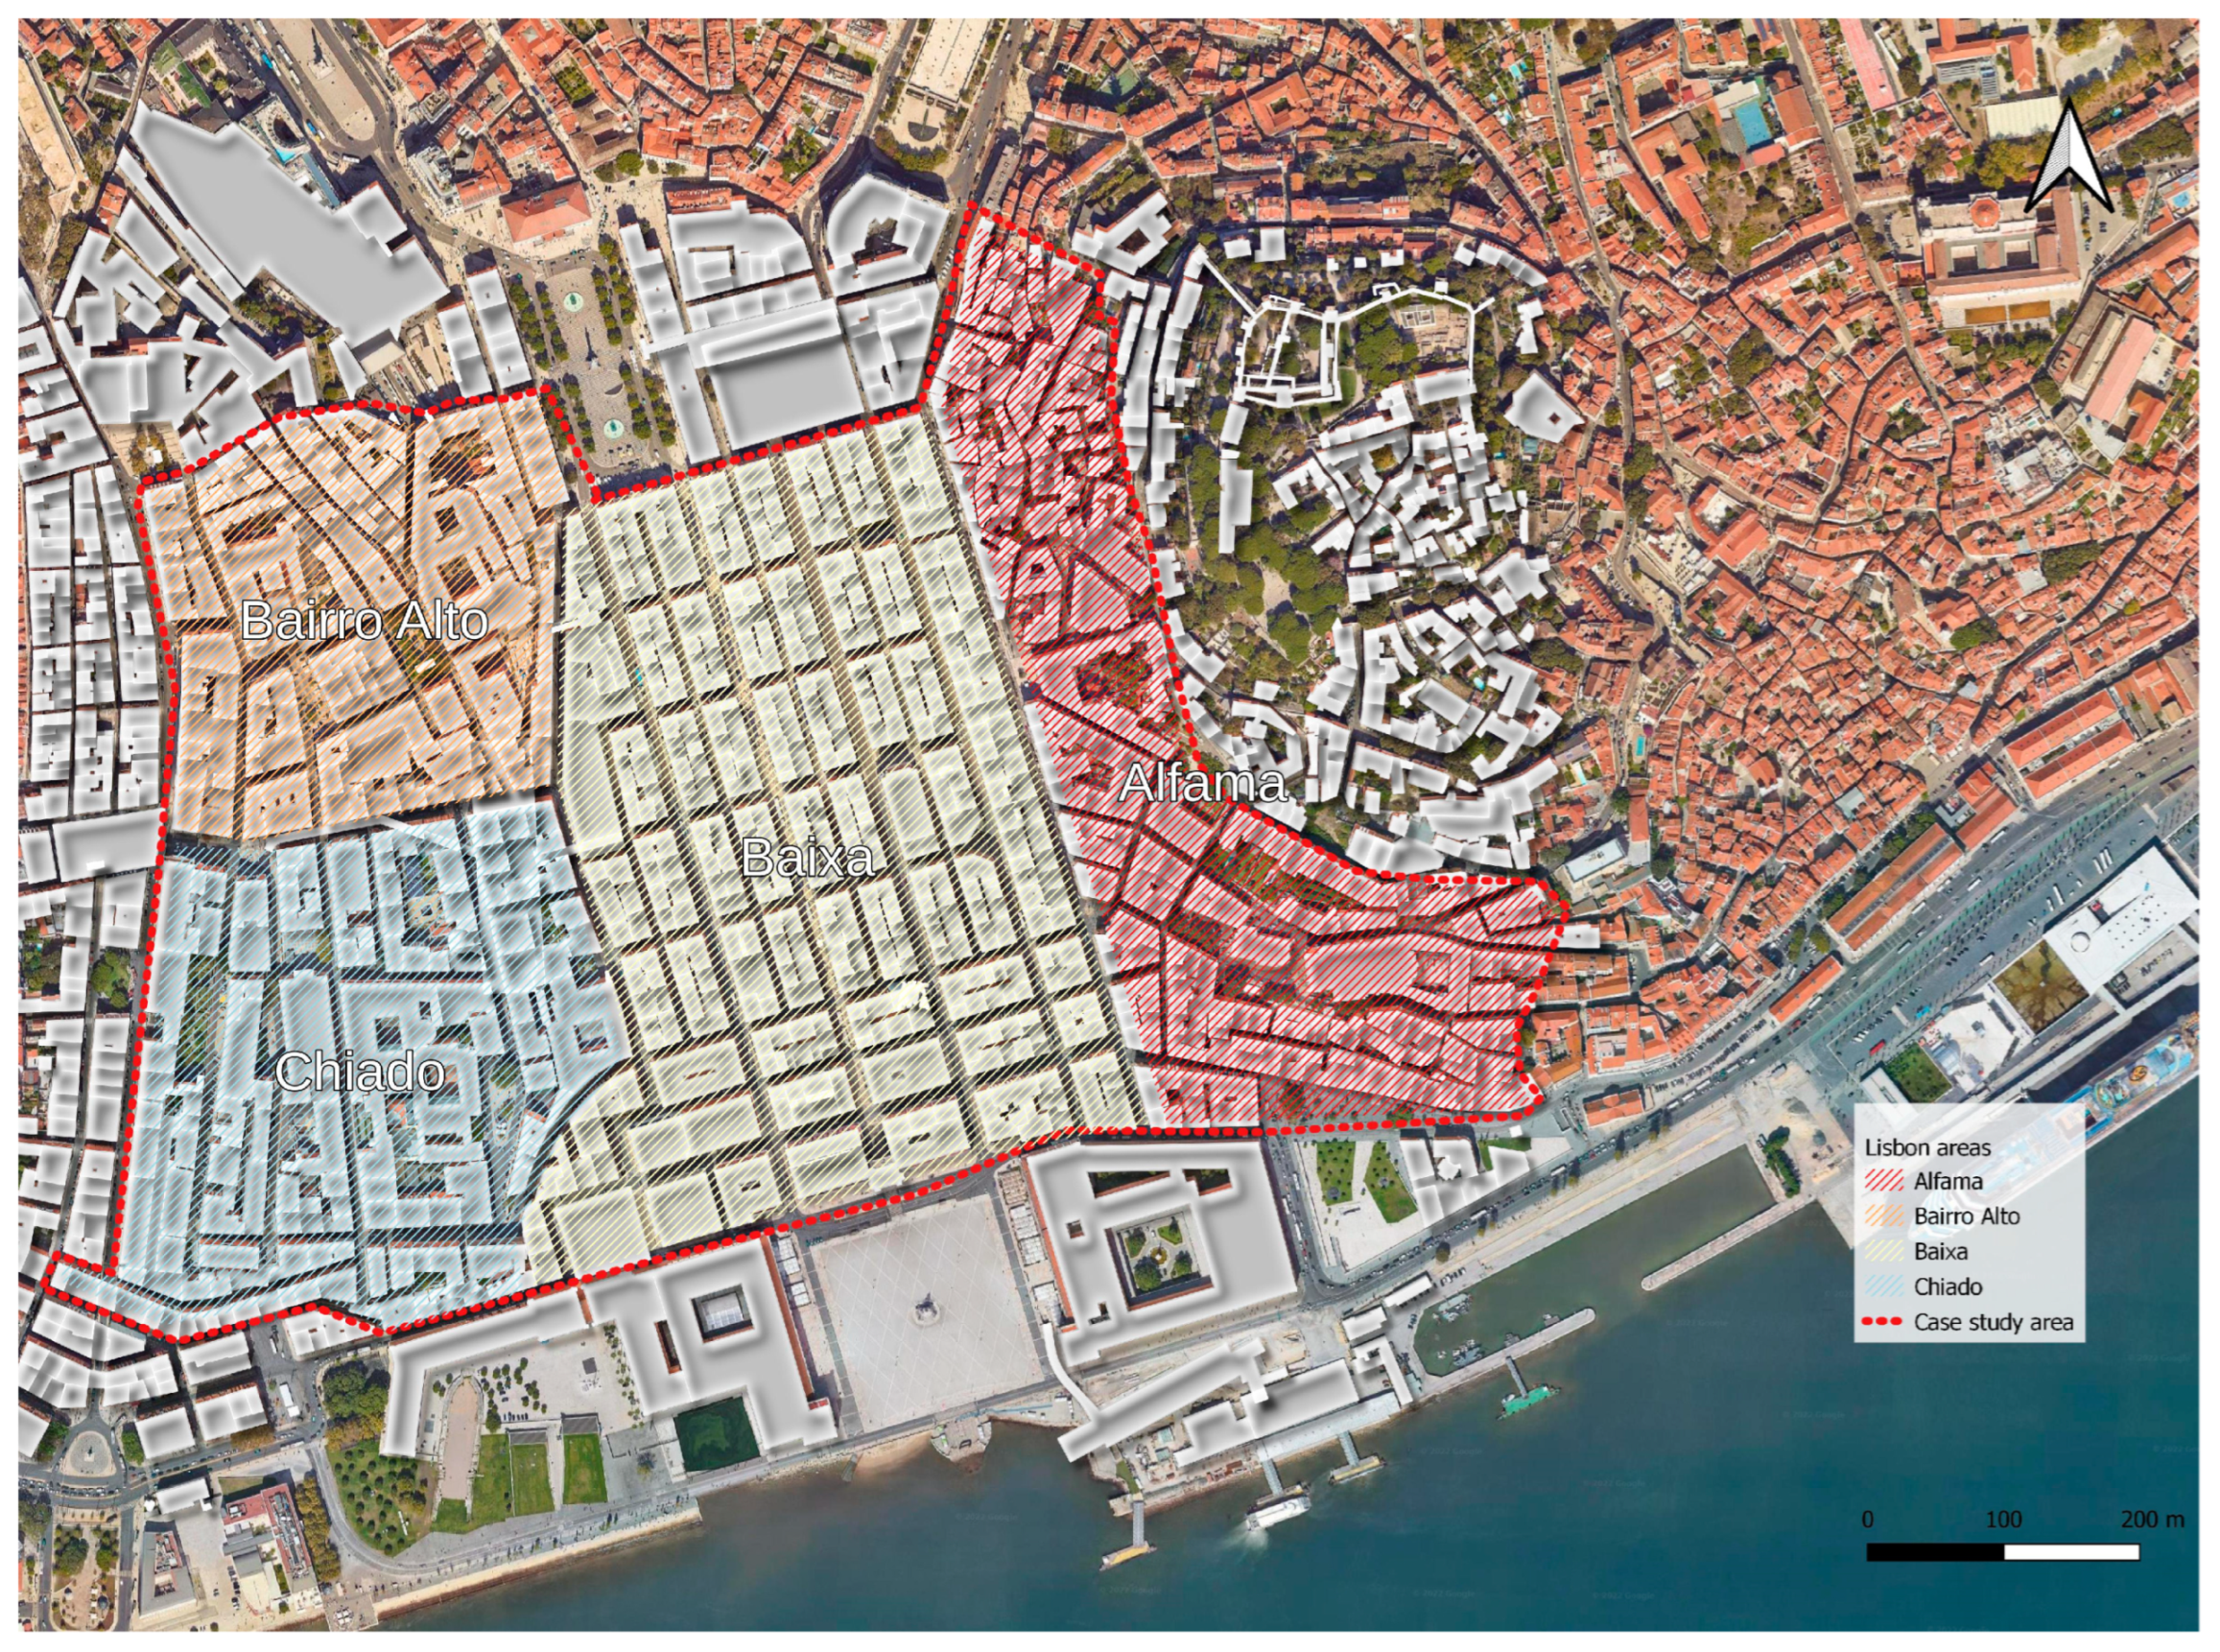
The area of Lisbon downtown studied in this paper includes the Baixa area, or the lower part of the city, the districts of Bairro Alto and Chiado to the west and Alfama to the east (
Figure 4).
The part of the Baixa was completely rebuilt after the earthquake of 1755 [
40] and is composed of buildings that include commercial activities on the ground floor and residential functions on the upper floors. In some cases, the historic family businesses and the interiors of the first shops are still preserved.
Although the residential component is decreasing, the city continues to be a center of culture and commerce. Chiado is one of the most traditional and characteristic neighborhoods of the city of Lisbon, and it is located between the Bairro Alto and the Baixa. On 25 August 1988, a fire that began in Rua do Carmo and quickly spread to Rua Garrett destroyed a total of 18 buildings in Chiado. In terms of the area of the city damaged and the number of buildings destroyed, the Chiado fire is considered the worst disaster that has hit the city since the 1755 earthquake.
Alfama is the oldest district of Lisbon and extends on the slope enclosed between the Castle of São Jorge and the Tagus River. Its name comes from the Arabic Al-hamma, which means “fountains” or “baths”.
3.3. Historical Evolution
The Portuguese building heritage, especially in Lisbon, has undergone great transformations over the centuries up to the present day.
Based on the observation of the available cartography and iconography (
Figure 5) regarding Lisbon before the earthquake of 1755, the urban structure of the central part of the city has remained unchanged since the 16th century.
The urban fabric corresponds to a set of different juxtaposed structures: the area that rises on the eastern and western slopes of the Colina do Castelo has characteristics that can bring it closer to those observed in the Moorish cities. For this reason, they appear as simple organisms and little differentiated on a functional level, with a very dense and irregular fabric. Being a city without continuity, in which the private space crosses the public space, the churches are seen as central and neuralgic points that generate the surrounding space.
The westernmost part of the historic city (Carmo and Chiado), on the other hand, has a regular urban structure. This change perhaps coincides with the genesis of a more organized municipal authority interested in the control and growth of the urban layout of the city.
With the earthquake of 1 November 1755, most of the existing buildings in Lisbon were destroyed or severely damaged. At the time of the earthquake, Lisbon had a population of around 100,000 and an area of 350 hectares. After the earthquake, about 17,000 of the existing 20,000 houses were destroyed or made uninhabitable, as well as palaces, convents and churches, many of which were demolished and later rebuilt in other places due to the Baixa reconstruction plan. The new urban fabric planning was one of the strategies implemented by the then prime minister, the Marquis of Pombal.
3.4. Typological Analysis
To establish a clear and concise evolution of building typologies, it can be said that masonry buildings constitute an important percentage of the building heritage of the city. Given the evolution over time of construction practices in masonry buildings, it is possible to detect variations in terms of architecture and construction types and structural design [
41]. These differences determine significant variations in the seismic resistance of the different building types identified. Among the types of masonry buildings built after 1755, three phases can be distinguished: “Pombalino”, “Gaioleiro” and “Placa” buildings. The differentiation between the building types mentioned is based not only on the time of construction but essentially on the presence or less of wooden structural elements [
42]. It is, therefore, possible to establish a subdivision in terms of building types based on their structural characteristics directly related to the time of construction and the construction technologies used (
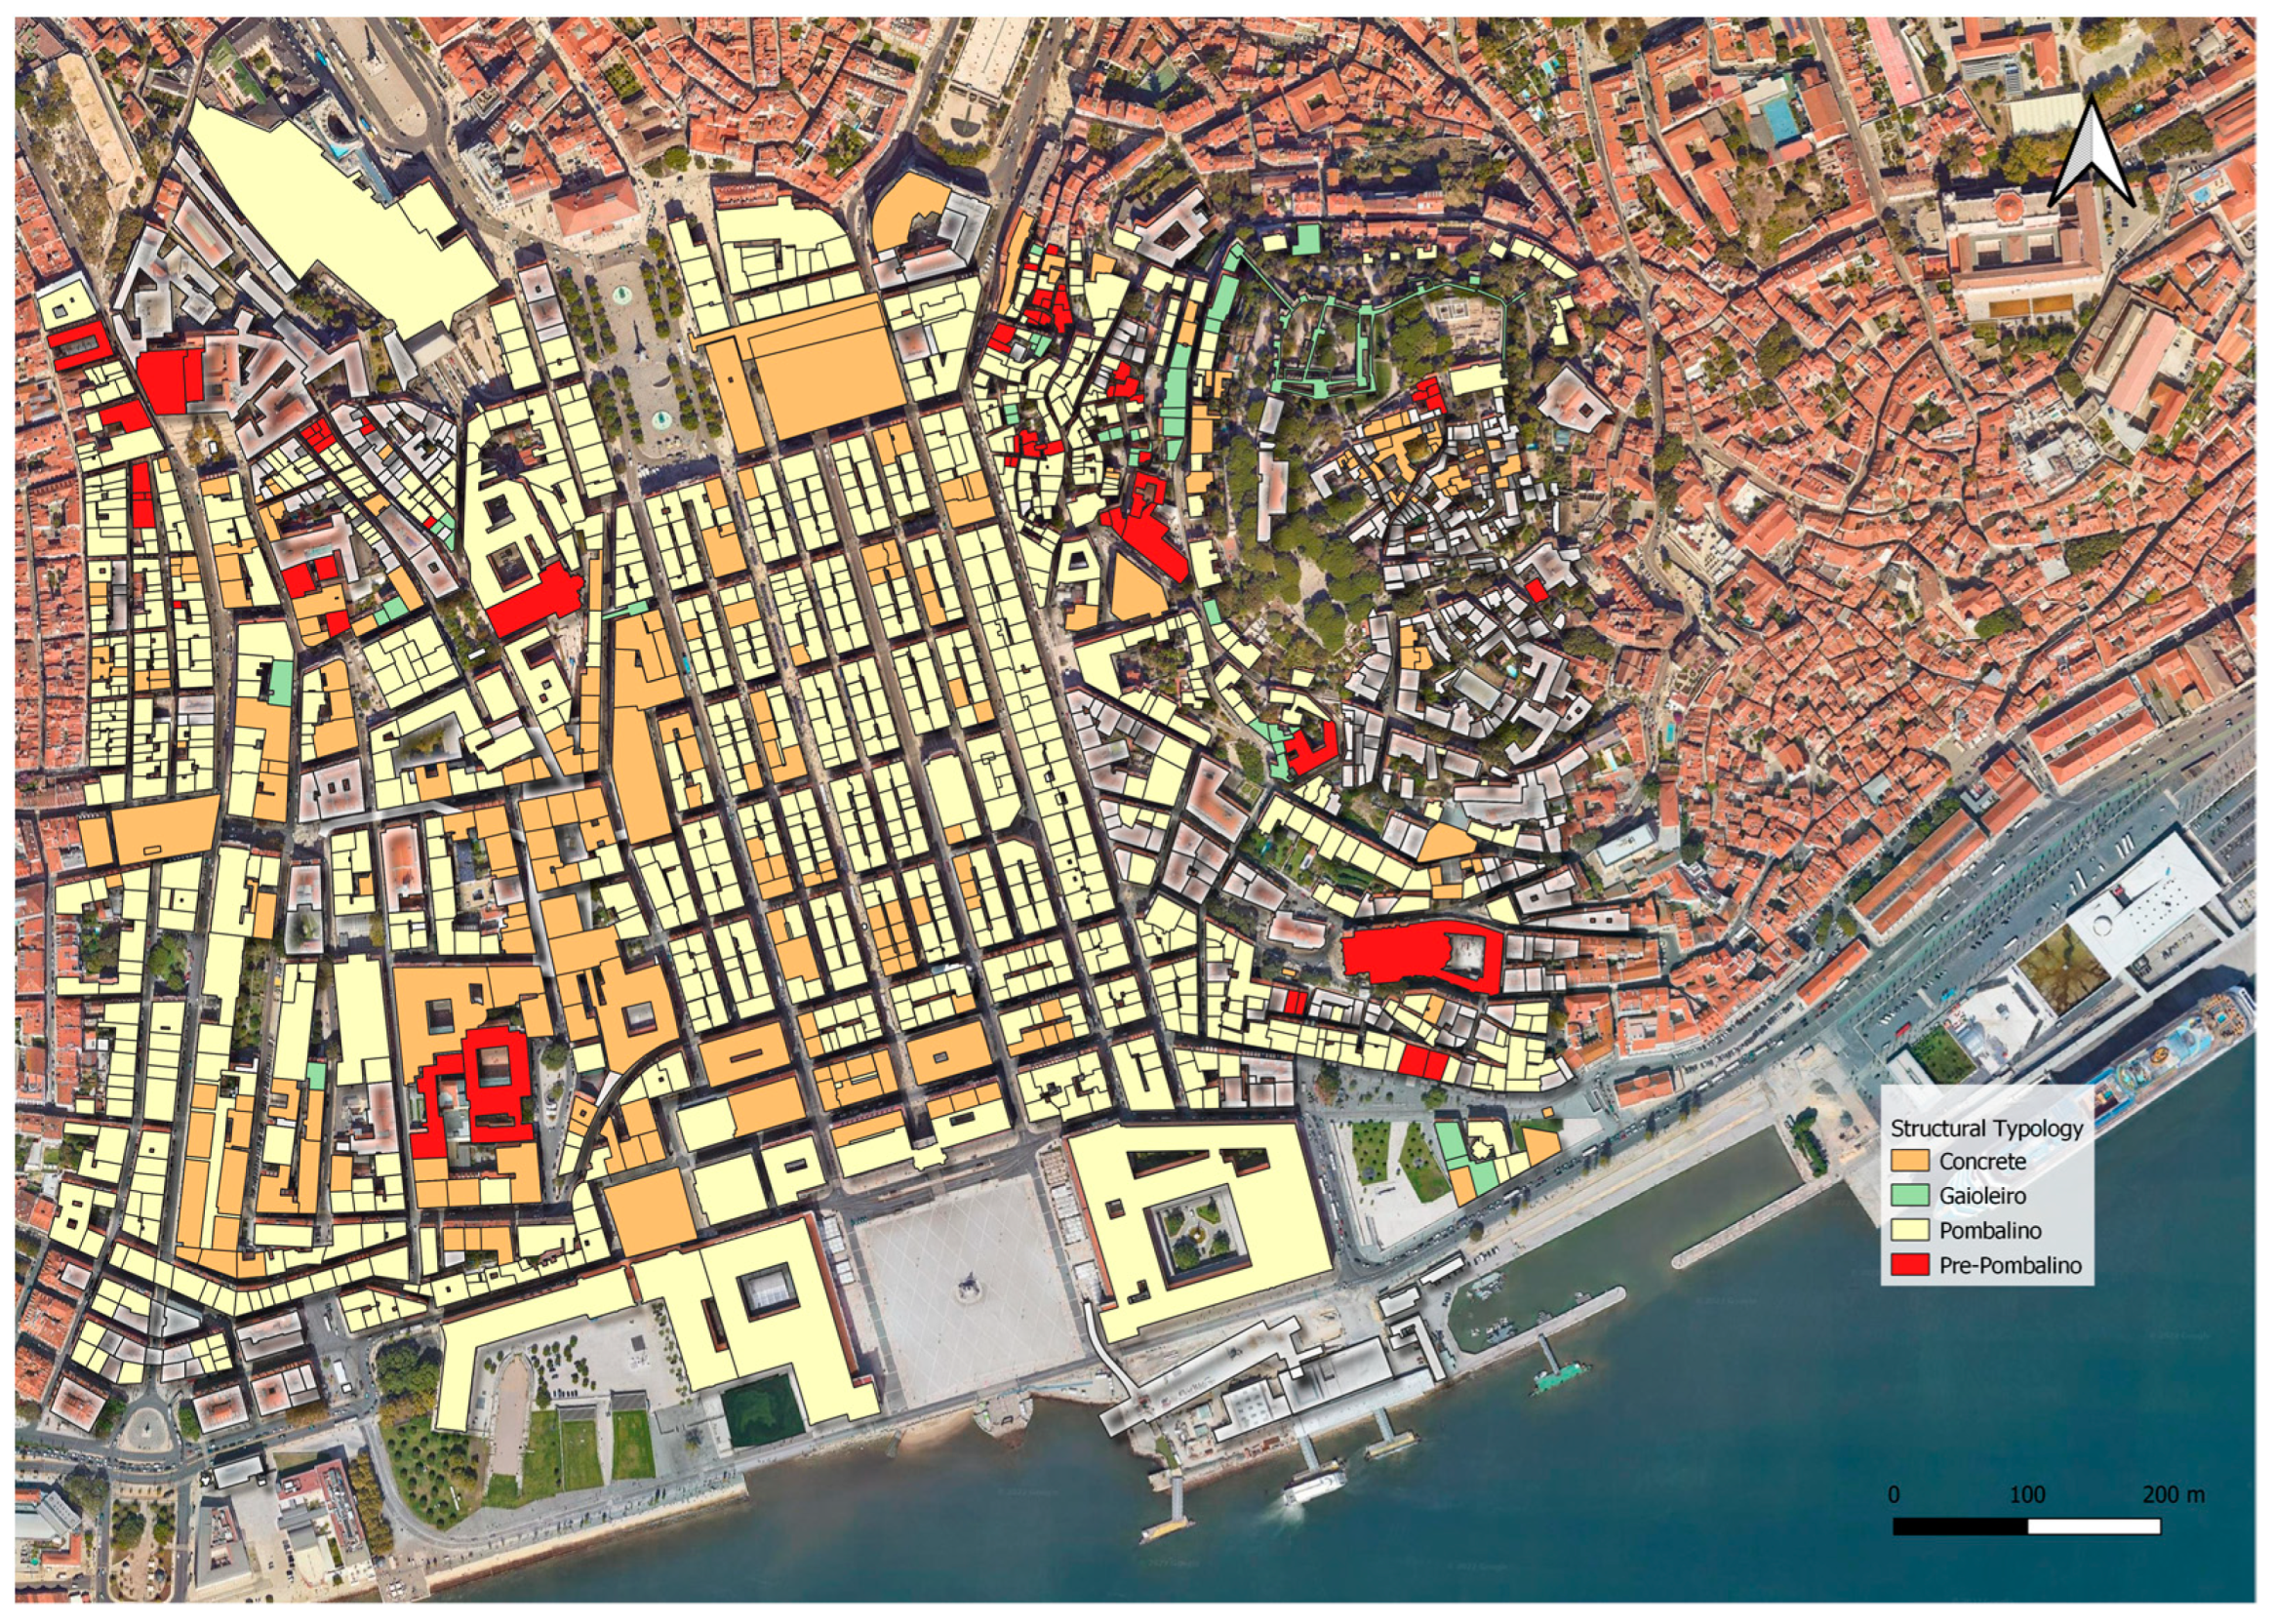
Figure 6).
Buildings that have withstood the great earthquake of 1755 in whole or in part and have been preserved over time to this day are considered an integral part of this category. This category includes buildings of historical interest, although many are in poor condition. This type of building consisted of two, three or at most four floors, generally with very low ceilings, a high density of walls and few openings to the outside. The floors of ground floors were generally made of limestone slabs. As for the floors of the upper floors, the use of wooden floors was more common. The vertical structures could be of three types: regular stone masonry (cantaria), ordinary masonry (alvenaria) or partitions (tabique). The differentiation is based on the type of material used in its construction and the related construction process.
The pombaline plan is characterized by coherence, homogeneity and balance based on a layout of the road axes with a reticulated and regular structure and in the uniformity of the buildings designed, both in terms of elevations and in terms of internal subdivision [
43].
The Gaiola (Cage) is made up of a set of timber frames with masonry infill, called “frontais”, connected at the corners by vertical bars that belong to the orthogonal walls. The connection between the orthogonal front walls through common vertical wooden bars and the timber floors forms a three-dimensional structure capable of resisting forces in any direction. In general, the space between the wooden bars of the front walls is filled with poor quality masonry and the surfaces are covered with finishing material, so the gaiola is generally not visible. Usually, the gaiola develops above the ground floor and in the internal walls.
The facades and walls between adjacent buildings are generally built with ordinary stone masonry, with some exceptions of better-quality masonry at the angles and in some columns and walls of the ground floor.
The period between 1880 and 1930 was fundamentally characterized by a great expansion of the city, both for the creation of large urban areas, and for the increase in the height of the buildings: the name “Gaioleiro”, is intended to translate the simplification and the enormous changes in terms of structural and constructive systems on the Pombalino buildings, which included the increase in the height of the buildings which quickly reached five or six floors, accompanied by the distortion of the original cage, in which some elements of solidarity have simply disappeared of the “frontais” walls. The observed changes have given rise to another type of building characterized by the absence of structural and three-dimensional continuity.
Around 1930, concrete appeared, used in full attics, progressively replacing wooden floors in kitchens and bathrooms, and protruding elements such as balconies up to the entire attics (Placa).
Reinforced concrete beams begin to be used during this transition period at the ground floor ceiling level, mainly in situations where shops are installed or to facilitate the opening of larger spaces.
The so-called integral reinforced concrete structures only appeared between the 1930s and 1940s, but it was only in 1950 that they began to have a great expression.
3.5. Seismic Hazard
Identifying the seismic impact of the most significant earthquakes that occurred in Portugal was considered essential in the development of the research. As for the number of earthquakes recorded in Portugal, most of the events occurred in the 18th and 19th centuries.
From an interpretation of the national historical record, the Lisbon earthquake of 1755, the Benavente earthquake of 1909, the Algarve earthquake of 1969 and the Azores earthquake of the 1980s, despite their different circumstances, are considered the most relevant events, which are supported by the quantity the available documentation. The year 1909 stands out with great evidence, but equally significant values are recorded in the years 1983 and 1984, respectively, with 115 and 143 earthquakes, and in 1975 (116 events). In 1969, 75 earthquakes were recorded; in 1978, there were 71 tremors. In 1931, 1951, 1954, 1964 and 1969 earthquakes were recorded with a maximum intensity level higher than 7. The Benavente earthquake, despite its dramatic consequences, recorded a much lower intensity (6.2).
When dealing with the consequences, the information that mentions these phenomena focuses mainly on the recorded human victims. The exception is the earthquake of 1755 [
44]. Following the disaster, all Portuguese parishes had to send the prime minister a written report of all the damage.
The Lisbon region and the Algarve region are located in the area with the highest seismic risk on the Portuguese continent; noteworthy are the regions of Tagus Lezíria and the Setúbal peninsula, located in the “Lower Tagus Valley Fault”, which also have a high seismic vulnerability. In addition, the coastal region of Alentejo has a medium-high impact index, along with a significant frequency of seismic events (
Figure 7).
3.6. Exposure
The elements that characterize the Lisbon exposure have been catalogued according to the methodology described. In general, existing studies have been used [
46,
47] and the data collected from Lisbon municipality and from on-site surveys necessary to verify, update and gather all the information needed for the GIS platform.
The collected data are:
The data obtained were then used for the application of the framework.
3.7. Vulnerability Assessment for the Historic Center of Lisbon
From all the information obtained from the research data implemented above, it was possible to obtain all the information necessary to assess the seismic vulnerability of the buildings in the historic center of Lisbon. Two simplified assessments were performed: the first takes up the study done by Catulo [
32] on the
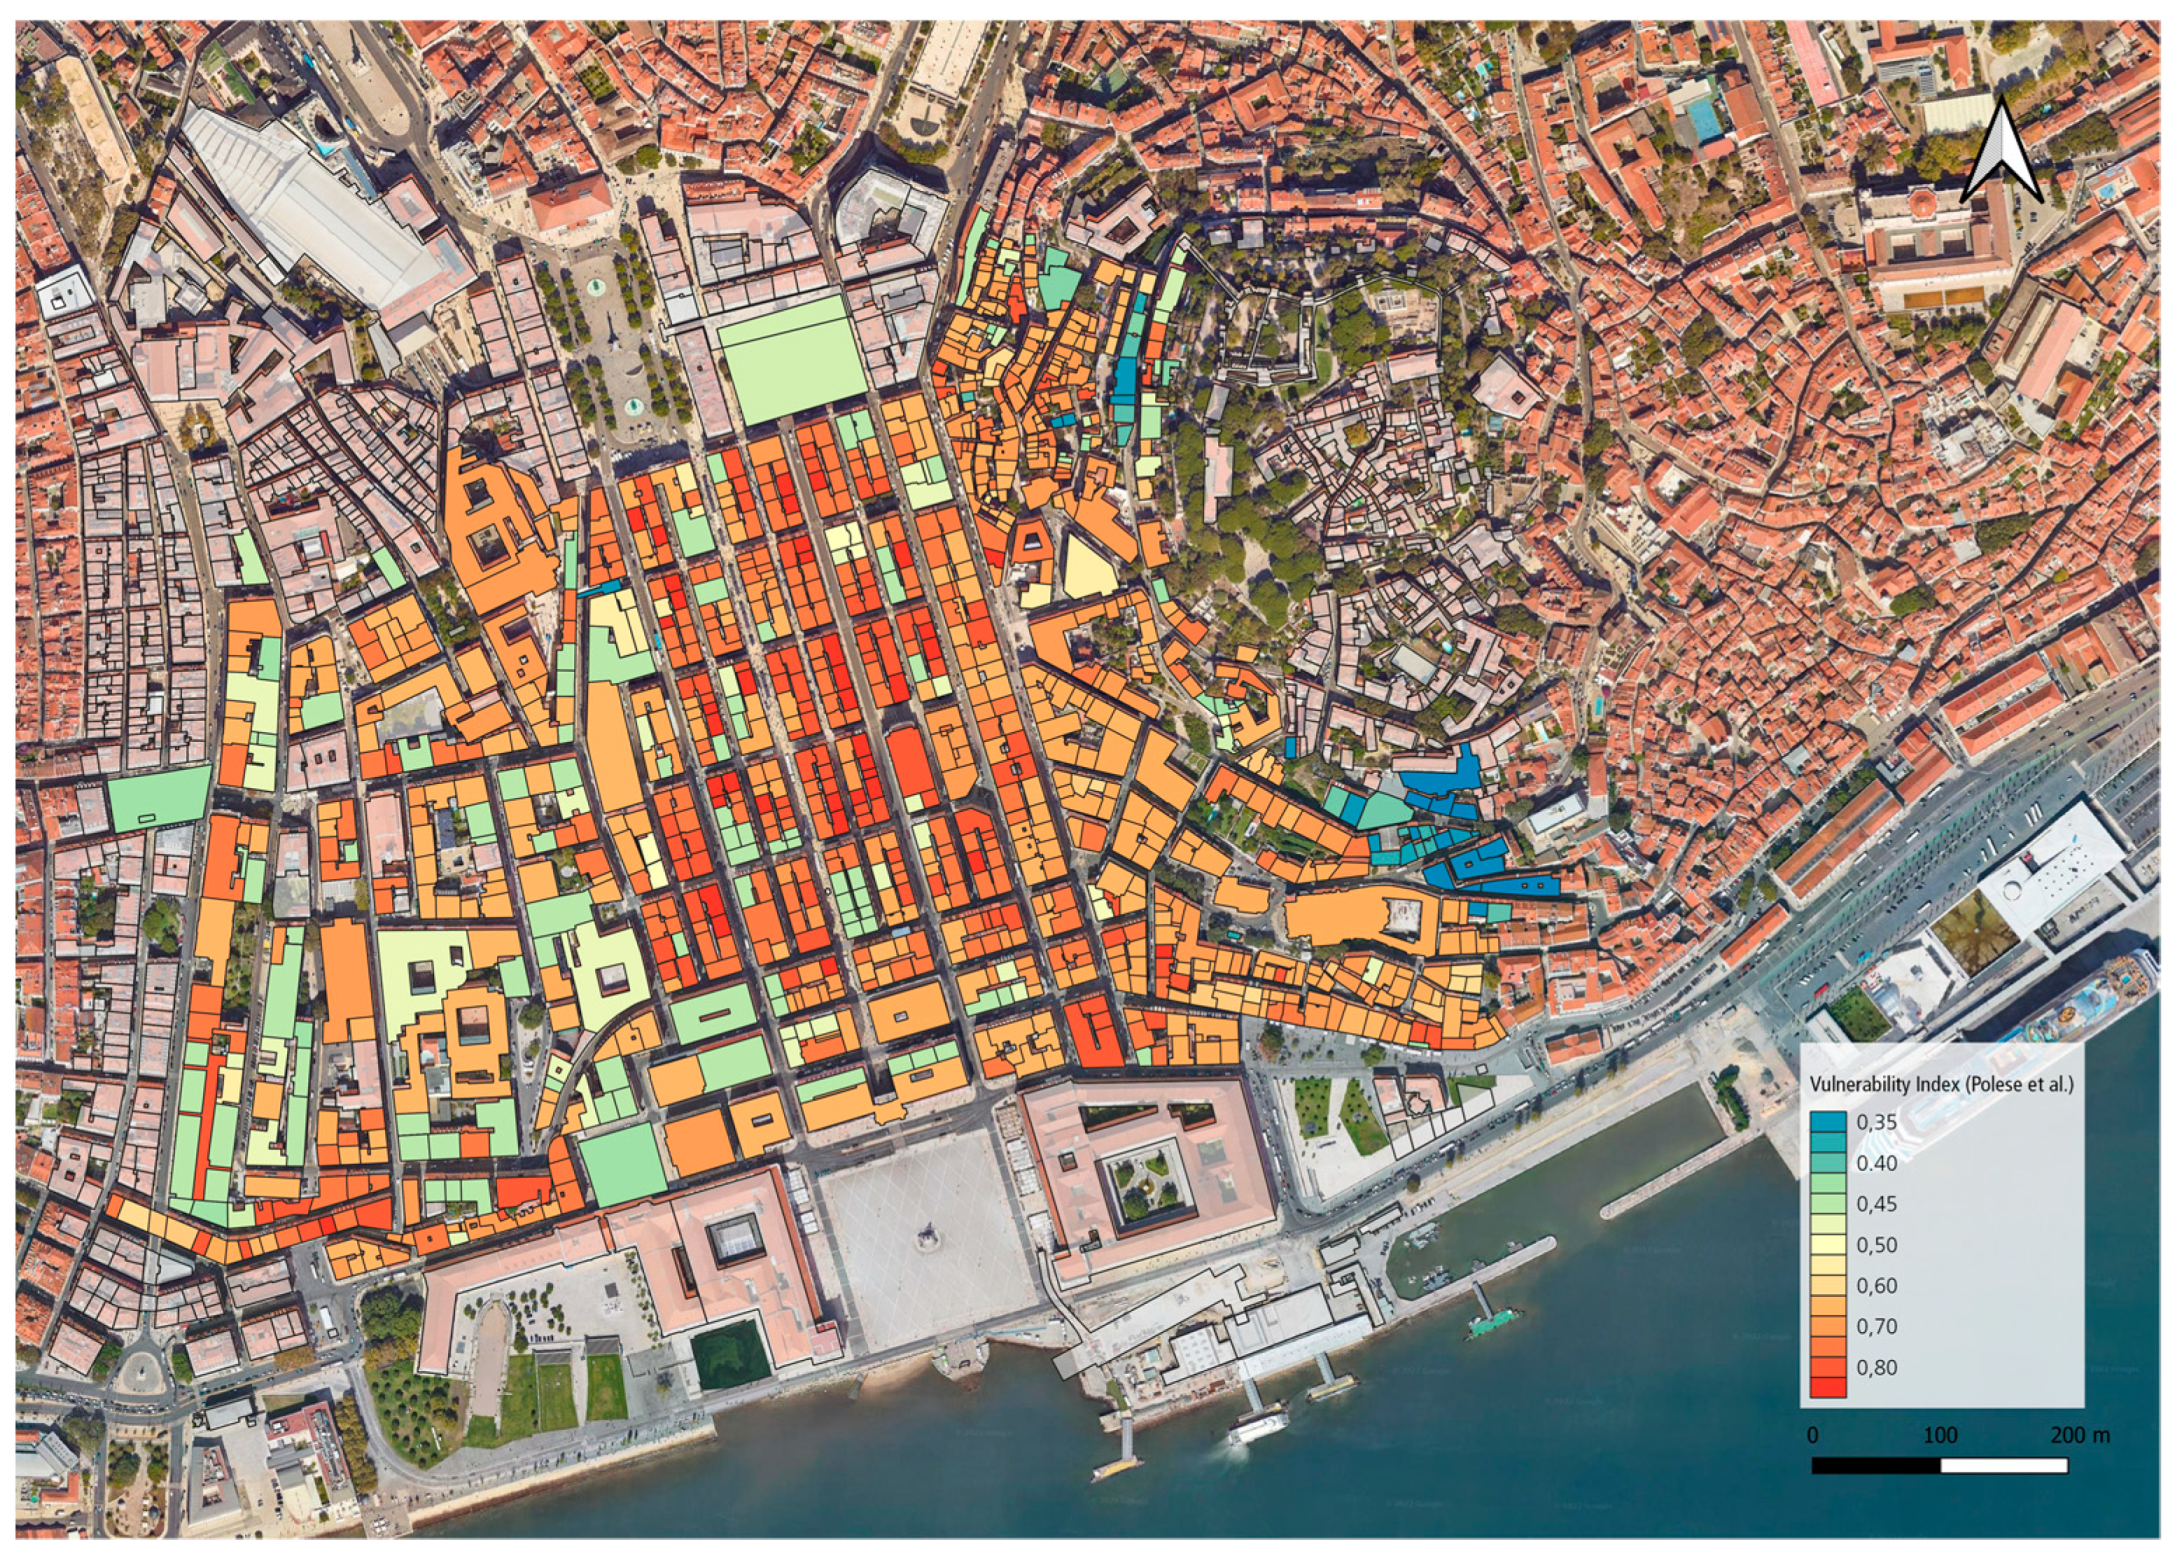
Baixa area, which is based on the Vicente method (2011) based on vulnerability index (VI).
Figure 10 shows the mapping of the vulnerability index VI obtained.
The second method applied for the definition of vulnerability V is the one proposed by Polese et al. [
35] (
Figure 11), which adapted the method applied by Lagomarsino and Giovinazzi [
8] based on the damage probability matrix (DPM). This method needs less data than the previous one.
These two different methods were applied for the definition of the vulnerability to verify, which is the most reliable and therefore choosing one for the development of the risk map and the resilience matrix.
From the results obtained from the two vulnerability maps and comparing them with the constructive information collected, it can be seen that the method experimented by Polese et al. is much more severe; however, it does not always reflect the vulnerability that one would expect from a specific construction typology and past vulnerability studies, while the method developed by Vicente et al. turns out to be more consistent. For this reason, the vulnerability index experienced by the latter was used for subsequent analysis.
3.8. Definition of Damage Scenarios
The expected damage for buildings given a level of seismic intensity can therefore be calculated from the vulnerability index (VI) and vulnerability (V) obtained for each building. If desired, vulnerability and fragility curves that depend on the various levels of seismic intensity can also be generated.
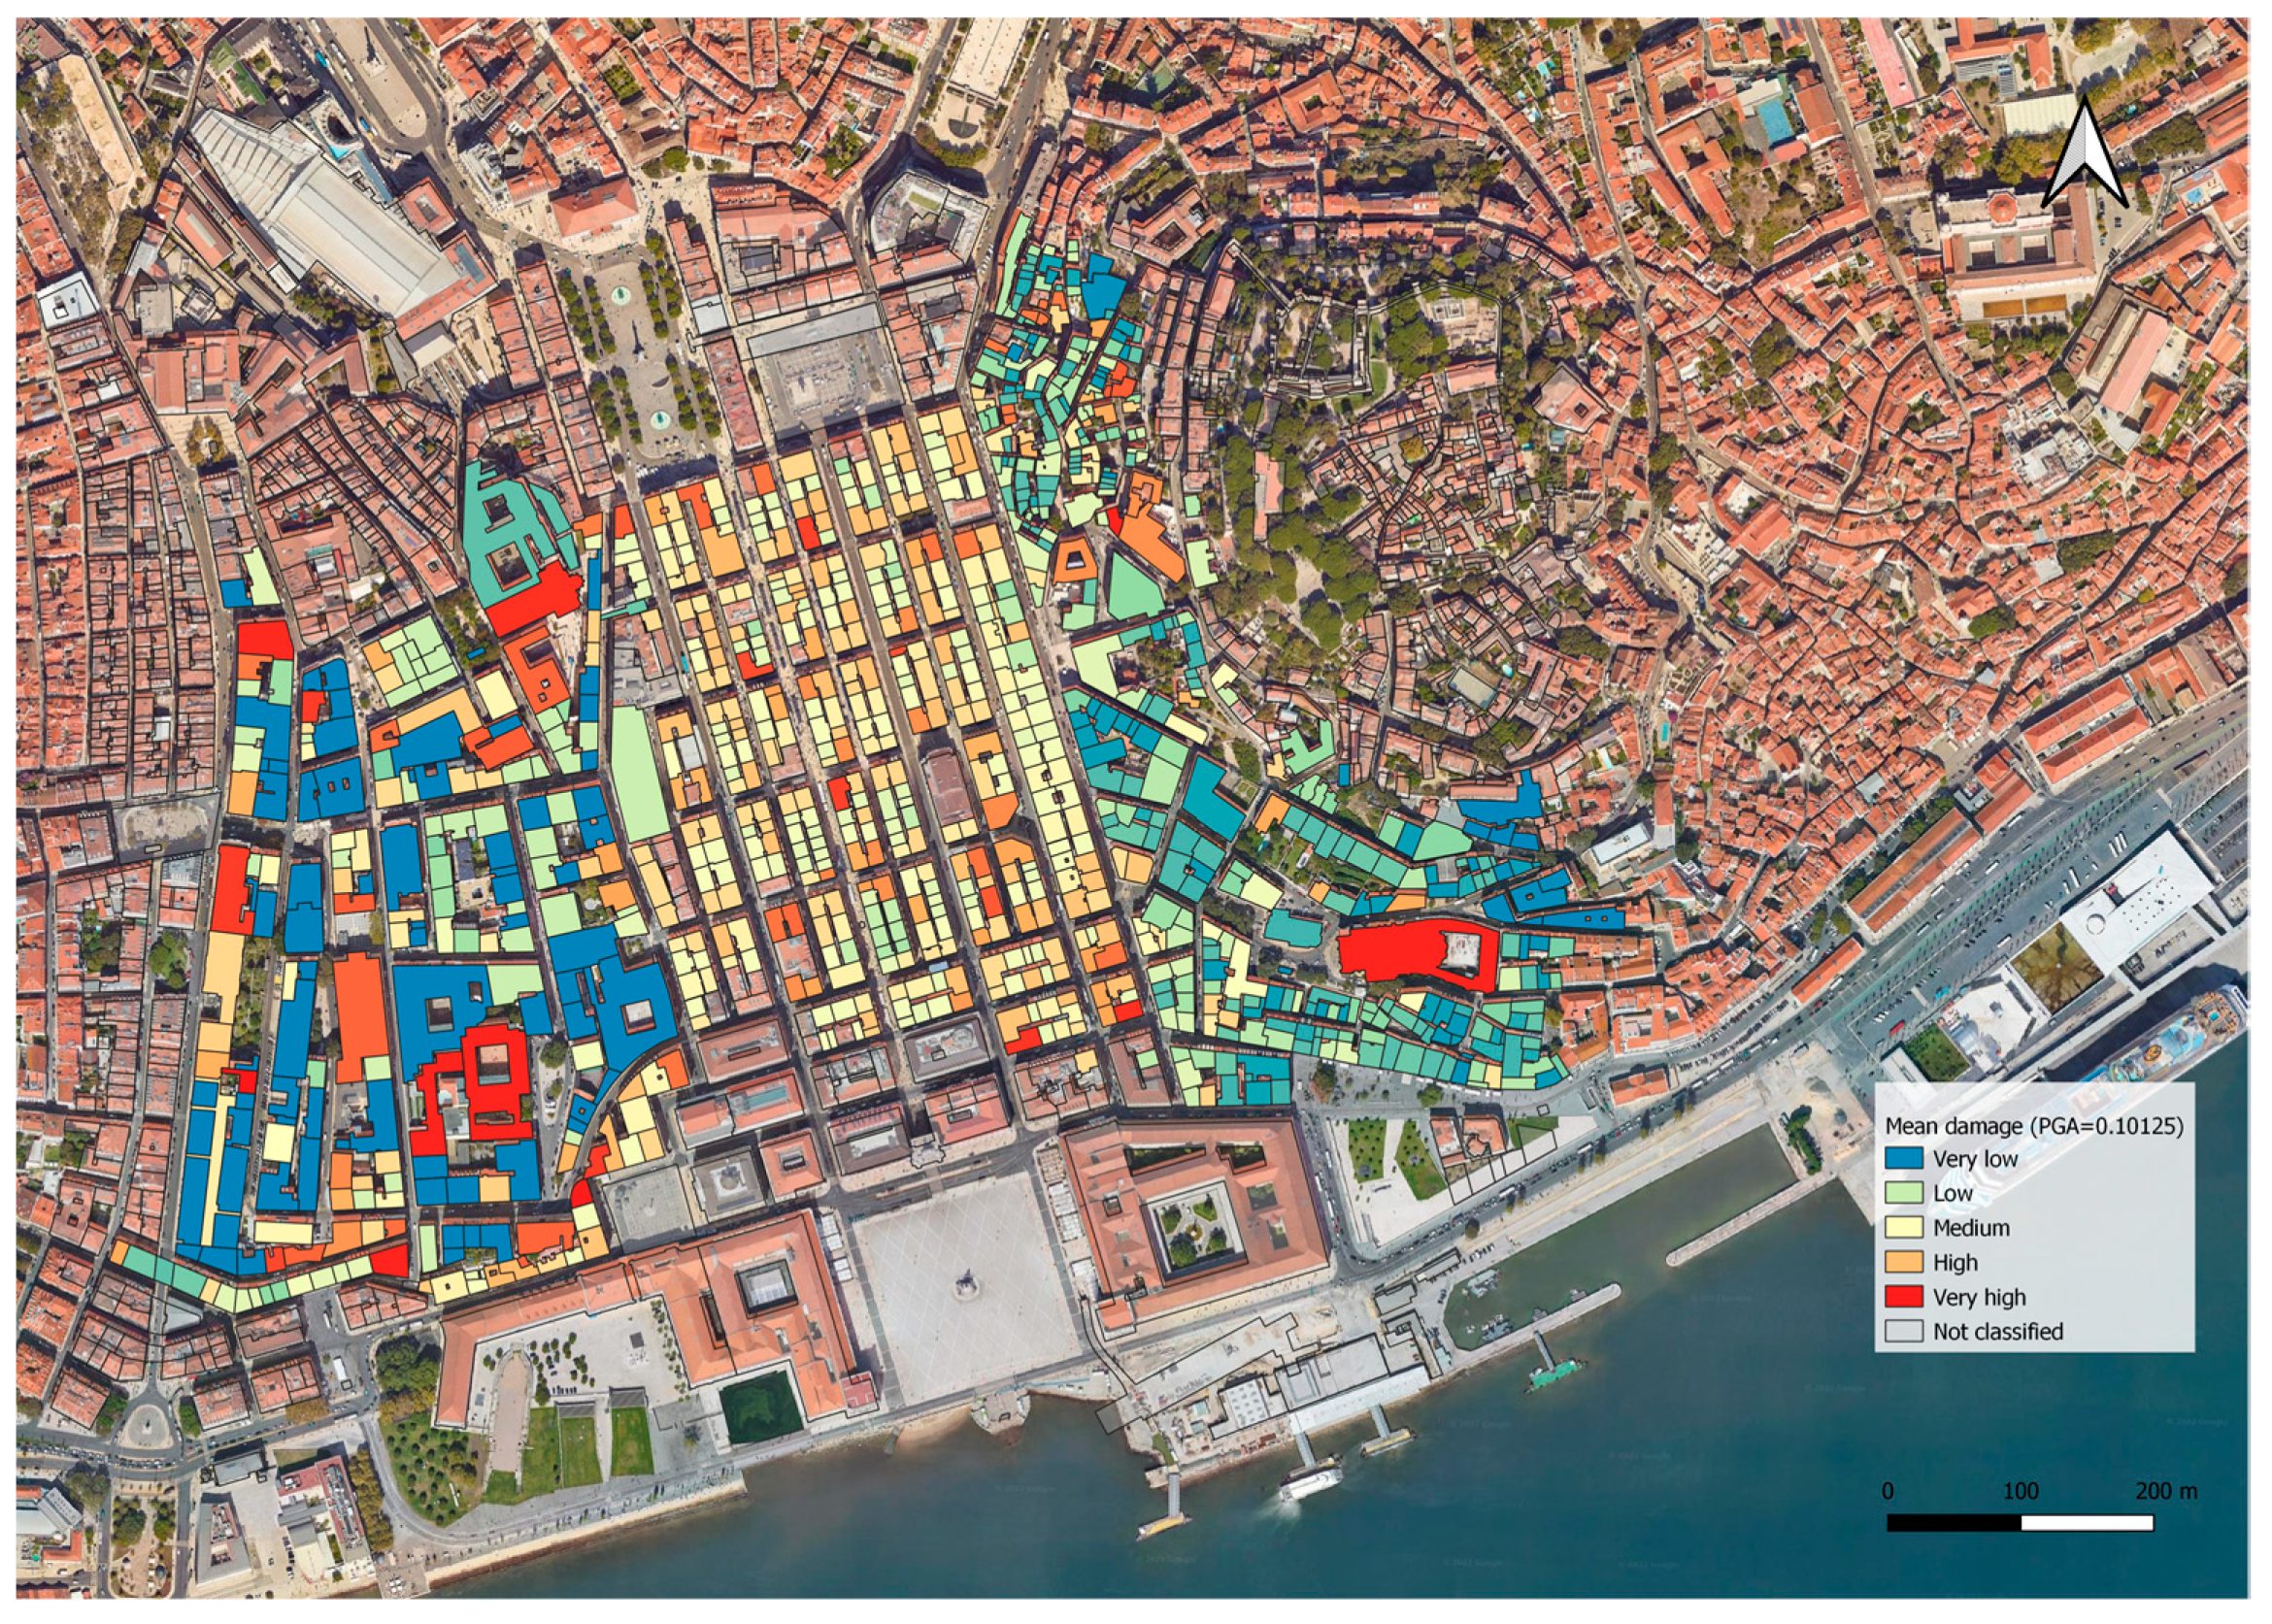
The mean damage based on the Vicente method (VI) is shown in
Figure 12.
The mean expected damage calculated based on the Polese et al. method is also reported (
Figure 13).
3.9. Evaluation of Social and Economic Losses
As described in
Section 2, damage maps combine vulnerability and seismic hazard. It is feasible to create risk maps that visually illustrate losses and impact indicators by including exposure information and finally define the priority matrix.
To calculate the economic losses, with reference to the procedure previously described, in the case of Lisbon, a reconstruction cost of EUR 5000/sqm was considered. By multiplying this cost by the floor area and the number of stories, the total cost of the considered building can be found. This value is then multiplied by the percentage referring to the level of damage based on Vicente et al. (
Table 5) to obtain an estimation of economic losses. The same technique can also be used to determine casualties, multiplying the proportion of fatalities and injuries by the total number of individuals and the impact, which is determined by multiplying the percentage of useable, unusable, or collapsed structures by the total number of buildings.
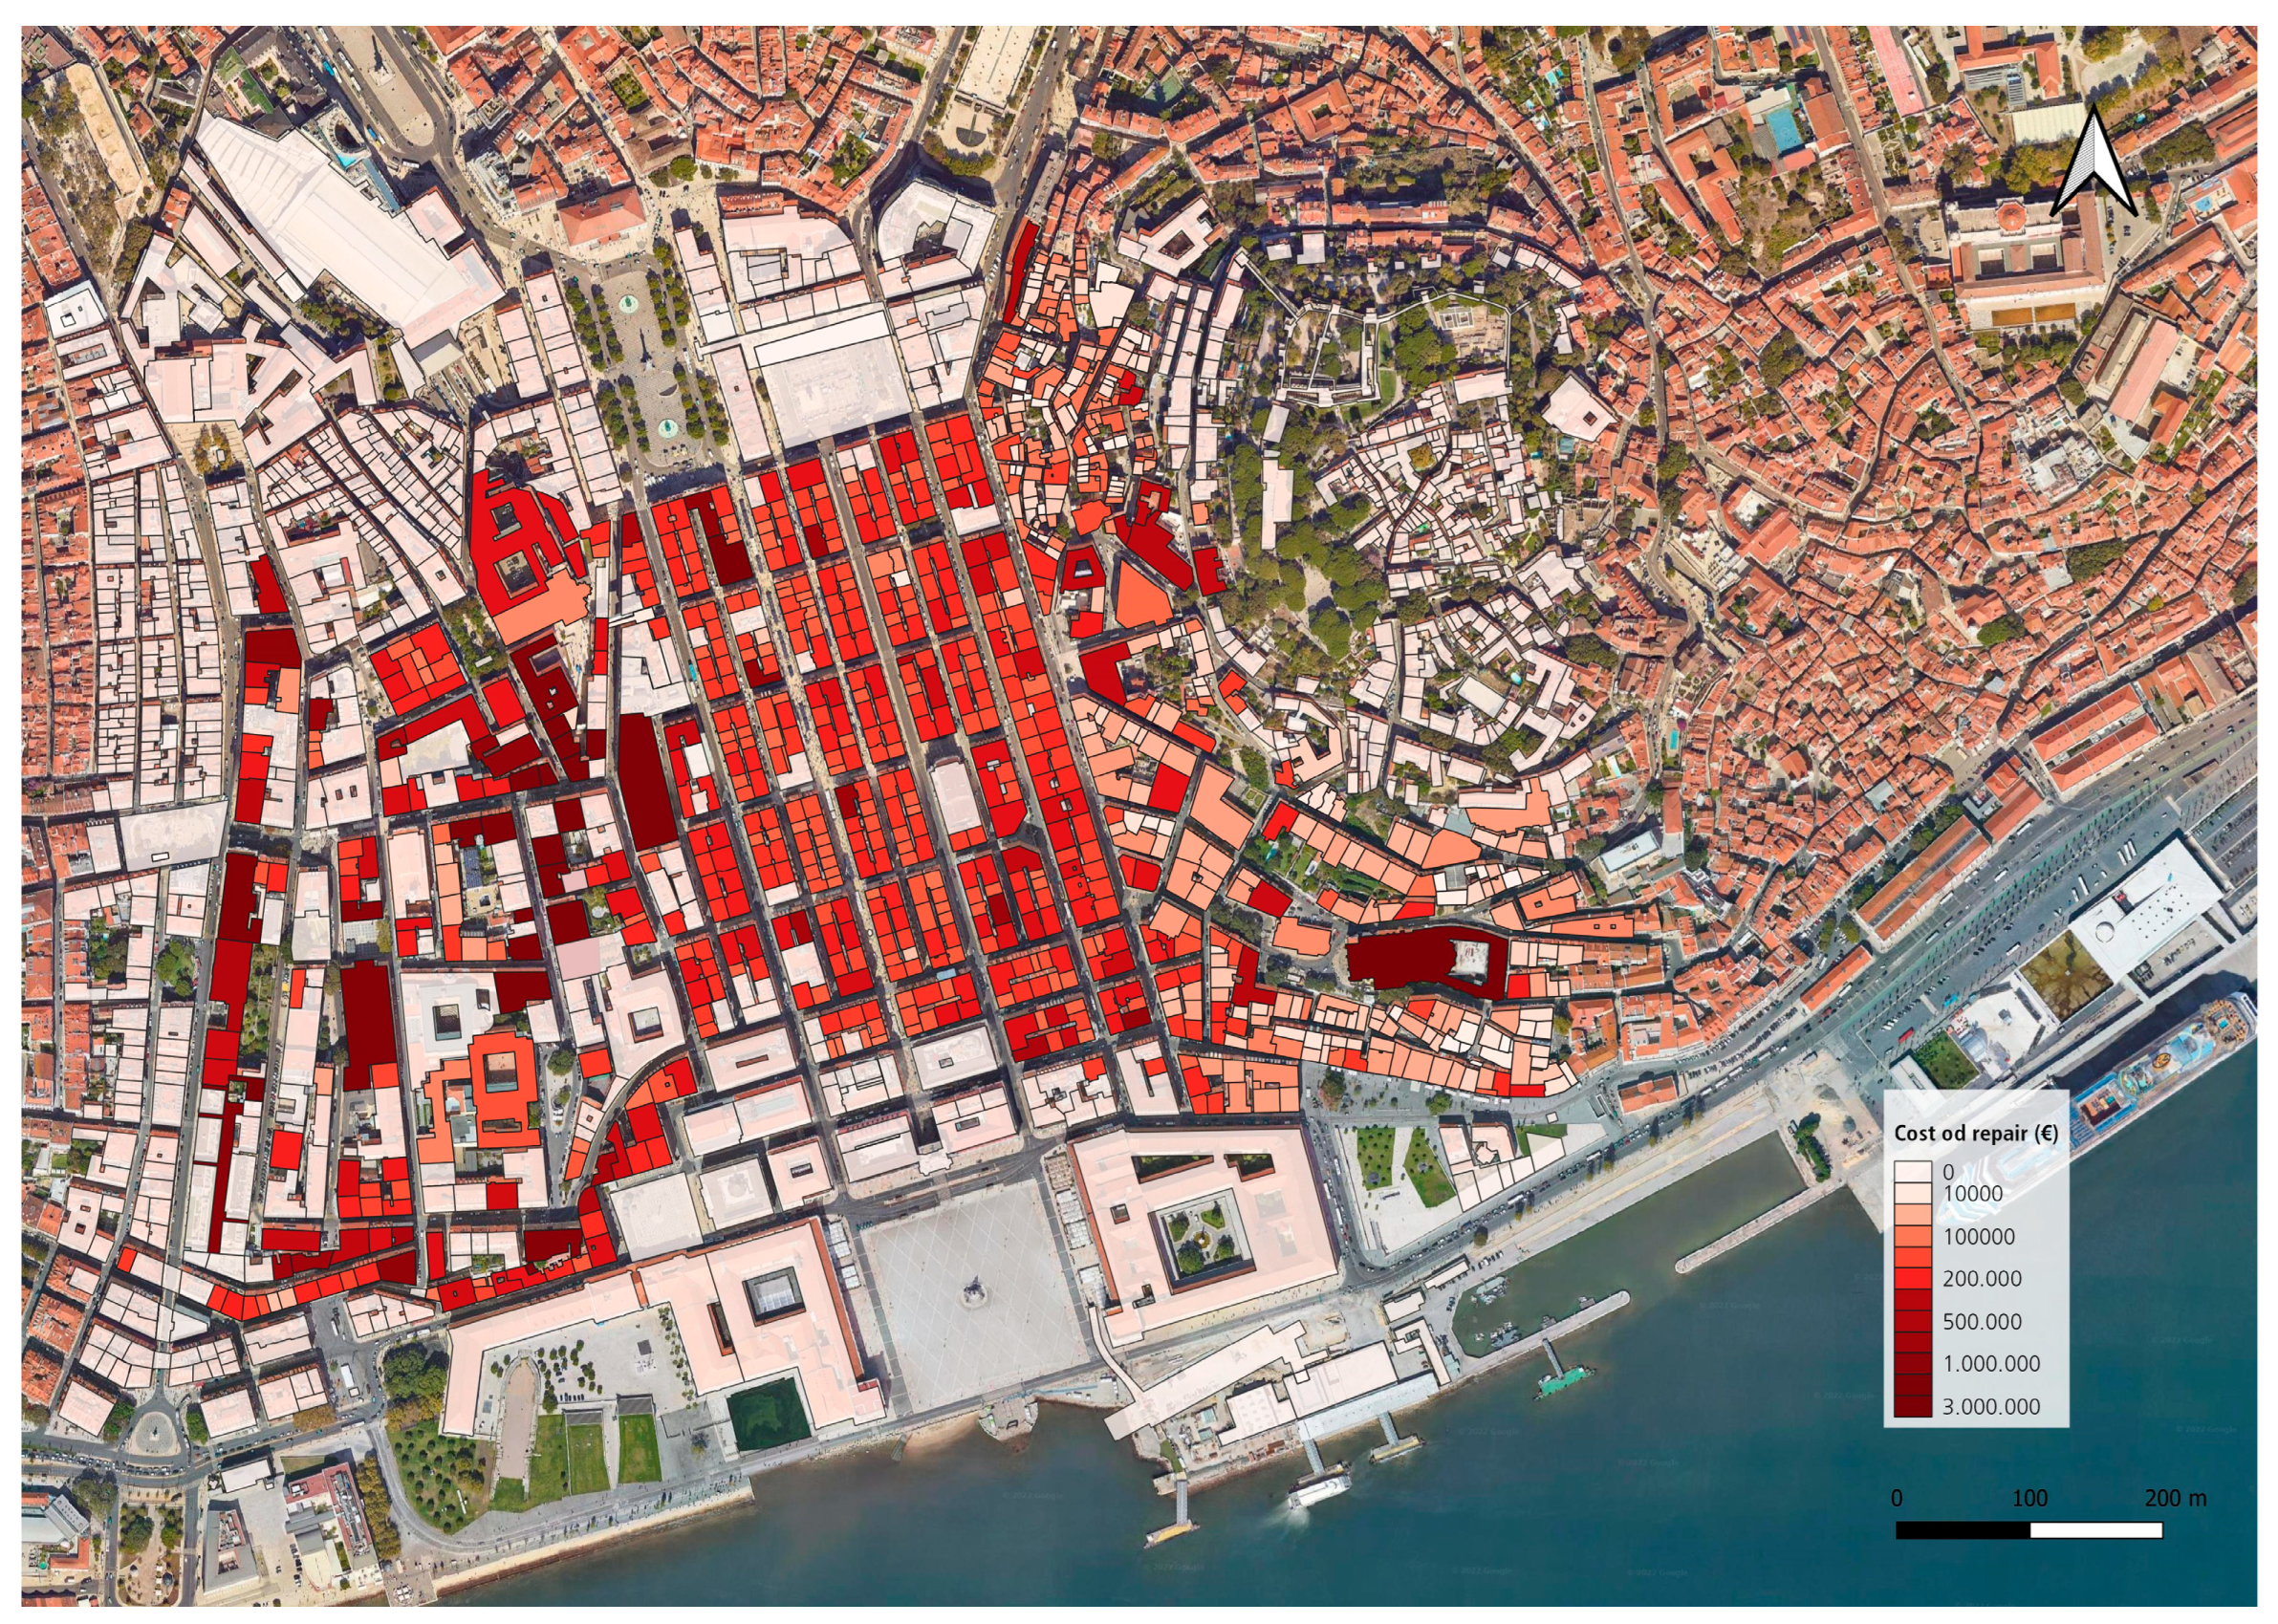
Table 7 shows the total losses for the entire area considered.
The results of the calculations carried out using the Qgis software [
48] in terms of repair costs are shown below since it is the most relevant result in terms of losses to be reported on the map (
Figure 14).
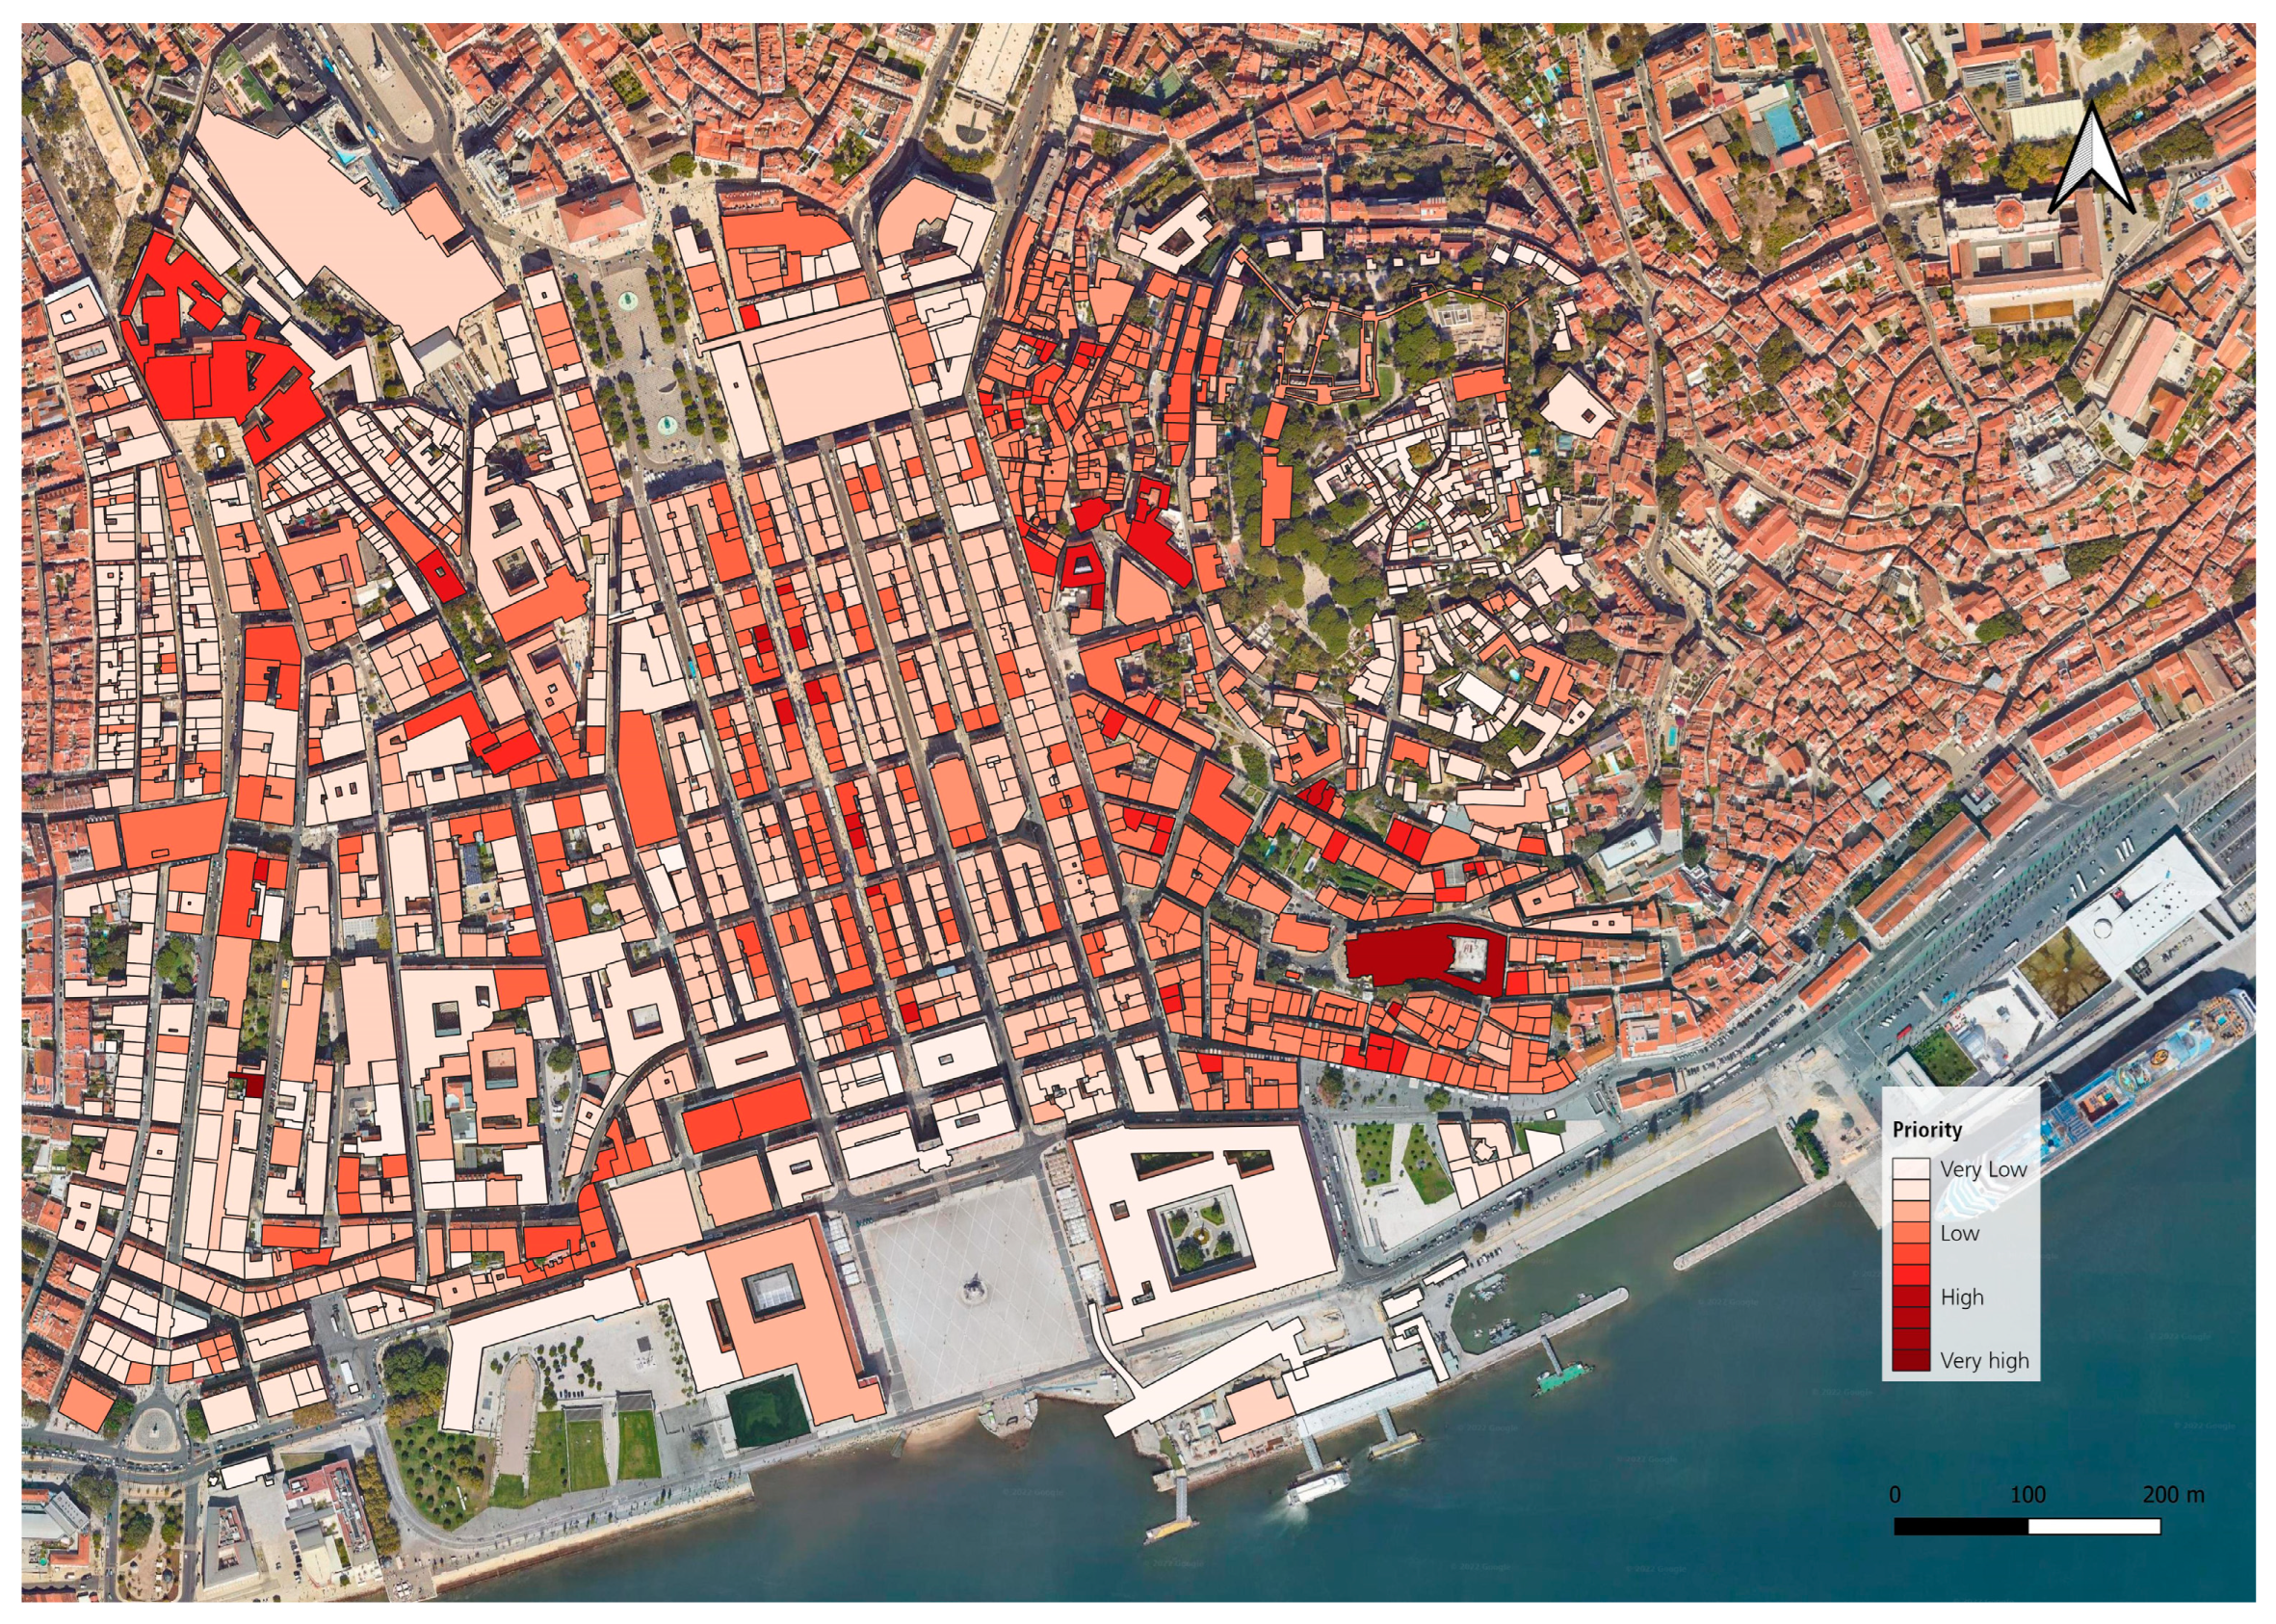
3.10. Urban Resilience Assessment for Lisbon Downtown
Finally, the final strategy for resilience assessment was applied as theorized in
Section 2.
Through a matrix approach, all the data collected and the processing carried out for risk management were combined, until a priority matrix was obtained to optimize the management of the recovery process and preventive planning.
The result of this processing is shown in the map in
Figure 15 which indicates the priorities for action on the built heritage in ascending order.
4. Discussion
This paper examines the conceptual and procedural aspects of resilience assessment in historic centers.
The methodology used is efficient on an urban scale, allowing for the quick identification of structures at risk and the display of the geometries, favoring the interpretation of the phenomenon’s geographical distribution. By creating a geodatabase that is as complete as feasible, engineers and planners may analyze the seismic damage to the building stock, record economic and human losses, and prepare swift responses by using space-based seismic scenarios. Novel elements derive from evaluating resilience for historic areas, focusing on tangible and intangible aspects of cultural heritage. A case study, the historic district of Lisbon, was used to validate the methodology. The results represent the starting point for the proposal of intervention measures.
The two methods used for the assessment of seismic vulnerability are effective in giving a first interpretation of the expected damage, although, for a real result, it would be useful to deepen and calibrate the two methods. The methodology experimented by Vicente [
14] would seem more suitable for describing the behavior of Pombalino buildings, while that experimented by Polese [
35] appears to be more severe in predicting damage, but being the latter more rapidly applied and considering fewer parameters, it presents a greater degree of uncertainty even if with the same level of knowledge. This method could be improved by using the regional modifier in Equation (1) as it has not been applied in this study because of the uncertainties related to the present dataset.
The limitation of the applied methodology lies in the constructions’ scenario to which they can be applied: the considerable number of data brings a great measure of uncertainty due to a lack of information, errors, incorrect classification etc. Data collection on-site will be necessary for a more thorough analysis of the seismic vulnerability of Pombalino buildings because those structures’ actual seismic susceptibility today greatly depends on the interventions that have been made to them throughout the course of their existence. These were typically connected to the installation of new systems (for instance water or gas piping), the expansion of spaces by adding additional floors or the interruption or suppression of columns and walls, particularly on the ground floor to open up large spaces for storefronts and indoors to create larger spaces, the introduction of reinforced concrete structural walls for the installation of elevators, and the replacement of the original roof structures with heavier struts. Most of these modifications were made without any consideration for the buildings’ seismic resistance, which was made possible by a legislative loophole and the absence of technical standards that applied to work on older structures. Additionally, most of these structural changes are not formally documented, making it impossible to identify them without thorough reconnaissance and inspection of the structures.
Finally, this case study would contribute to the seismic assessment of these types of masonry buildings and perform research for predicting losses, evaluating intervention priorities and resilience to support the management and reduction of seismic risk.
