1. Introduction
Several studies and engineering practices have demonstrated that steel-concrete composite frames can exhibit the mechanical properties of both steel and concrete [
1,
2,
3,
4]. However, at a certain height, the frame system formed by the rigid connection of the composite beams and columns can no longer satisfy the lateral stiffness requirements; this can be addressed by installing oblique braces between the frame columns to increase the lateral stiffness of the structure. This is known as a brace composite frame structural system. As a result, a horizontal or vertical steel beam serves as the shear link between the brace and frame beam or column, providing additional lateral stiffness and energy dissipation capacity through shear deformation.
Earlier studies focused primarily on eccentrically braced steel frames [
5,
6,
7]. Popov [
8,
9] reviewed existing research on eccentrically braced frames and provided design recommendations based on the capacity design approach. Roeder [
10], Manheim [
11], and Kasai [
12] proposed a plastic design method for the design of eccentrically braced frame structures built in the 1970s and 1980s. Sullivan [
13] proposed a direct displacement-based design method for eccentrically braced steel frame structures. This method provides the formulas for directly calculating the story drift ratio and yield strength of the structure, considering the effect of axial deformation of columns and supports. Montuori et al. [
14,
15] proposed a rigid plastic analysis method to solve the problem of the weak story of eccentrically braced frames caused by conventional design methods based on the plastic mechanism. A simple optimization principle is applied by analyzing the plastic deformation mechanism of single-story and multi-story structures to ensure the deformation mode of the final overall failure of the structure without a weak story.
An increasing number of researchers have begun to focus on eccentrically braced composite frames owing to advancements in the technology for composite frame structures [
16,
17,
18,
19]. Ciutina et al. [
20] conducted comparative tests on eccentrically braced single-story steel and composite frames. The results indicate that the combined effect of the concrete floor slab can effectively improve the lateral stiffness and seismic performance of the structural system. A finite element model of an eccentrically braced composite frame was established based on the test results of Danku [
21] and Prinz et al. [
22]. Furthermore, pushover and dynamic elastic-plastic time-history analyses were performed on 2-, 4-, 8-, and 12-story frame structures. The results show that the spatial combination of floor slabs in a composite frame structure can effectively improve the structural stiffness and reduce the displacement ratio and deformation requirements of the energy-consuming shear link.
The shear link plays a key role in determining the seismic performance of eccentrically braced composite frames [
23,
24], its effectiveness in energy dissipation is consistently emphasized in numerous studies. For instance, in the project FUSEIS, the FUSEIS1 system [
25,
26] is developed as two closely spaced strong columns rigidly connected to multiple shear links, the inelastic deformations are concentrated in these links and the input energy is efficiently dissipated by them. In the project DUAREM [
27], the dual load-resisting system comprised of an eccentrically braced frame with replaceable shear links and a moment frame is proposed and intensively investigated. It is determined that the removable shear links provide the majority of the system’s energy dissipation capacity. The shear links have been the subject of extensive research since the 1970s [
28,
29]. Early experimental studies by Popov et al. [
30,
31,
32] focused on the influence of link length ratio (denoted by
ρ = e/(
Mp/
Vp), where
e is the link length,
MP and
VP are the plastic moment capacity and plastic shear capacity, respectively) on the mechanical characteristics of the shear link, including its strength capacity, deformation capacity, and overstrength phenomenon. In terms of strength and ductility, they noted that short links (
ρ < 1.6) perform considerably better than long links (
ρ > 2.6) under severe cyclic loading. They discovered that the average overstrength factor of the shear link is 1.5. In contrast, an extremely small link length ratio (
ρ < 1.0) or relatively thick flanges could significantly improve the overstrength factor to as high as 2.0 [
33,
34,
35], as confirmed by Ghadami et al. [
36]. Their suggestions are still partially adopted by the prevalent design provisions [
37].
Nevertheless, the current design method for eccentrically braced composite frames primarily considers the case with a horizontal shear link [
38,
39,
40], which is based on experimental research and finite element simulation. Different deformation modes and stress mechanisms apply to eccentrically braced frames with vertical shear links. Therefore, it is necessary to conduct experimental research and numerical simulations on this system to evaluate the design method of eccentrically braced composite frames with vertical shear links. In this study, the relevant displacement and internal force variables are defined based on the basic theory of structural mechanics. In addition, the finite element program ABAQUS (version 2018) is utilized to create a numerical model of the test component in a previous study [
41]. By comparing the experimental and numerical results, the accuracy of the numerical model was verified, and the effect of the key design parameters on the mechanical properties of the eccentrically braced composite frame with a vertical shear link was determined. The findings of the study can provide a reference for the design of the structural system.
2. Basic Assumptions, Methods, and Definitions
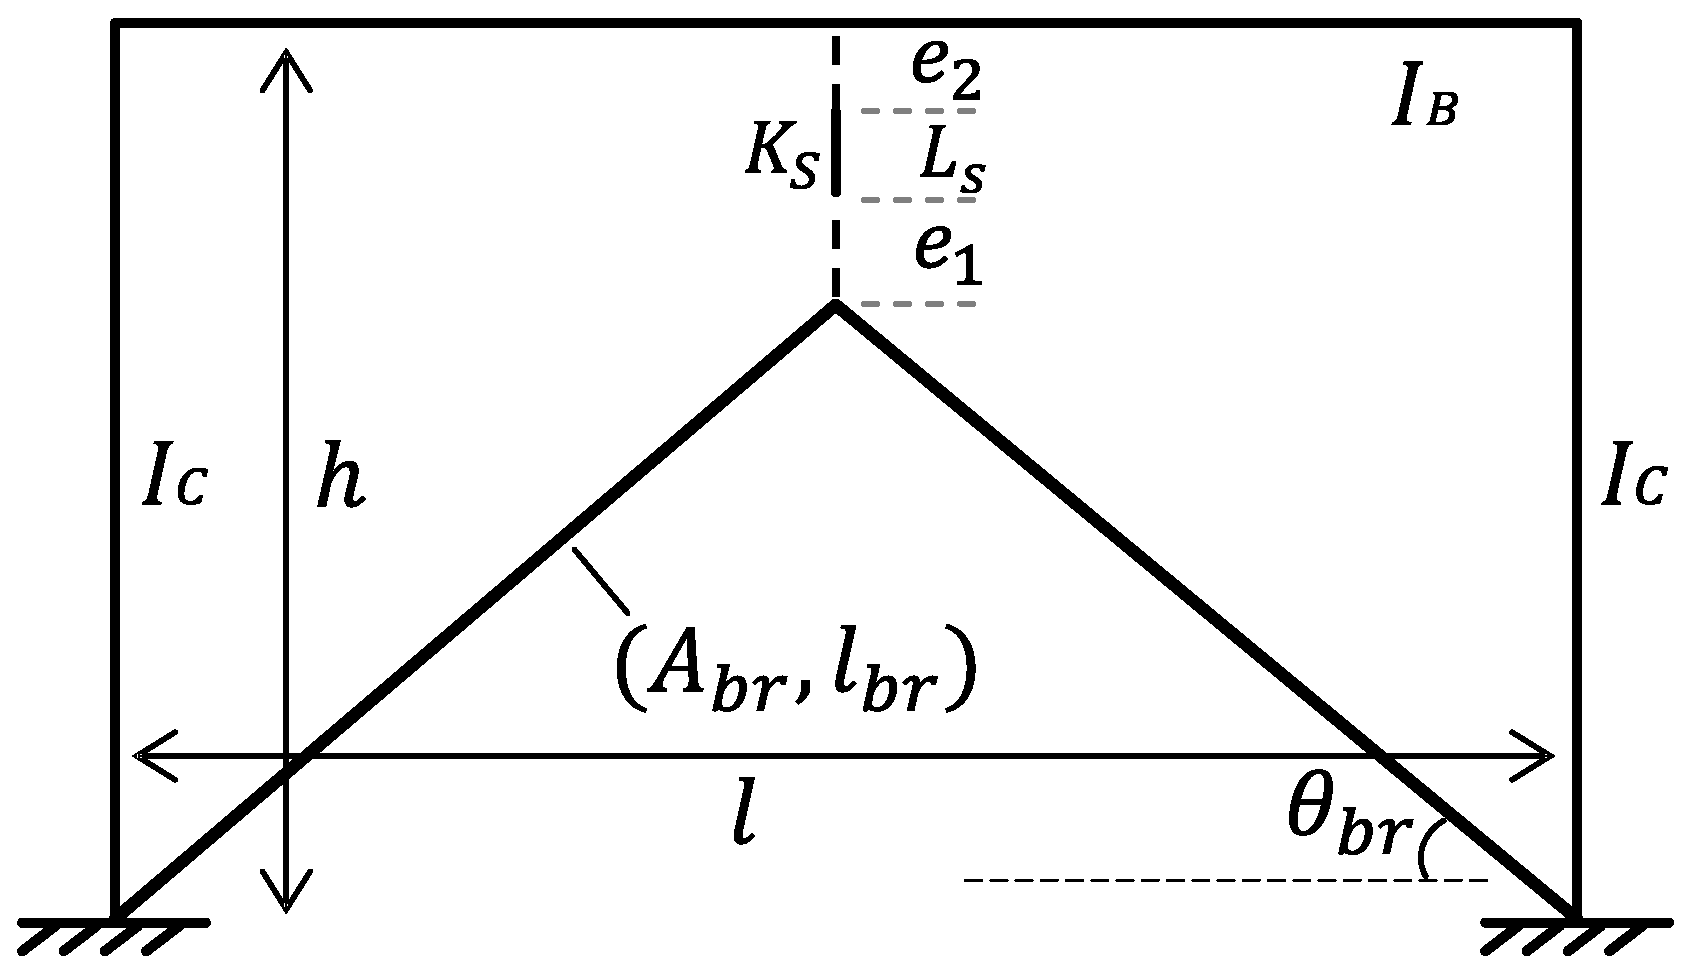
A schematic diagram of the theoretical model of an eccentrically braced composite frame with a vertical shear link is shown in
Figure 1.
l and
h represent the distance between the frame column and height of the frame beam, respectively, whereas
IB and
IC represent the section moments of inertia of the frame beam and column, respectively. The predominant mode of deformation of shear links is shear deformation. Therefore, the shear beam element simulation was adopted, with
LS and
KS representing the length and shear stiffness, respectively. The main force of the diagonal brace is the axial force; therefore, the diagonal brace is simulated using the truss unit. The effective length of the diagonal brace is
Lbr, the section area is
Abr, and the ratio between the diagonal brace and the horizontal plane is
θBr. The two ends of the shear link are rigidly connected to the frame and cross beams. The rigid joint has a certain eccentric distance of
e1 and
e2 from the center of the frame beam and the intersection of the diagonal brace, respectively. The linear stiffness ratio
α is a design parameter reflecting the relative stiffness of beam and column members in the frame structure, which can be calculated as
α =
IB h/
IC l. It is mainly used to adjust the distribution of internal forces between beams and columns in the frame structure to achieve the intended design result of strong columns and weak beams.
The theoretical model does not account for the effect of the node region, and the frame beam and column are rigidly connected. Completely fixed boundary conditions are applied at the bottom of the frame column.
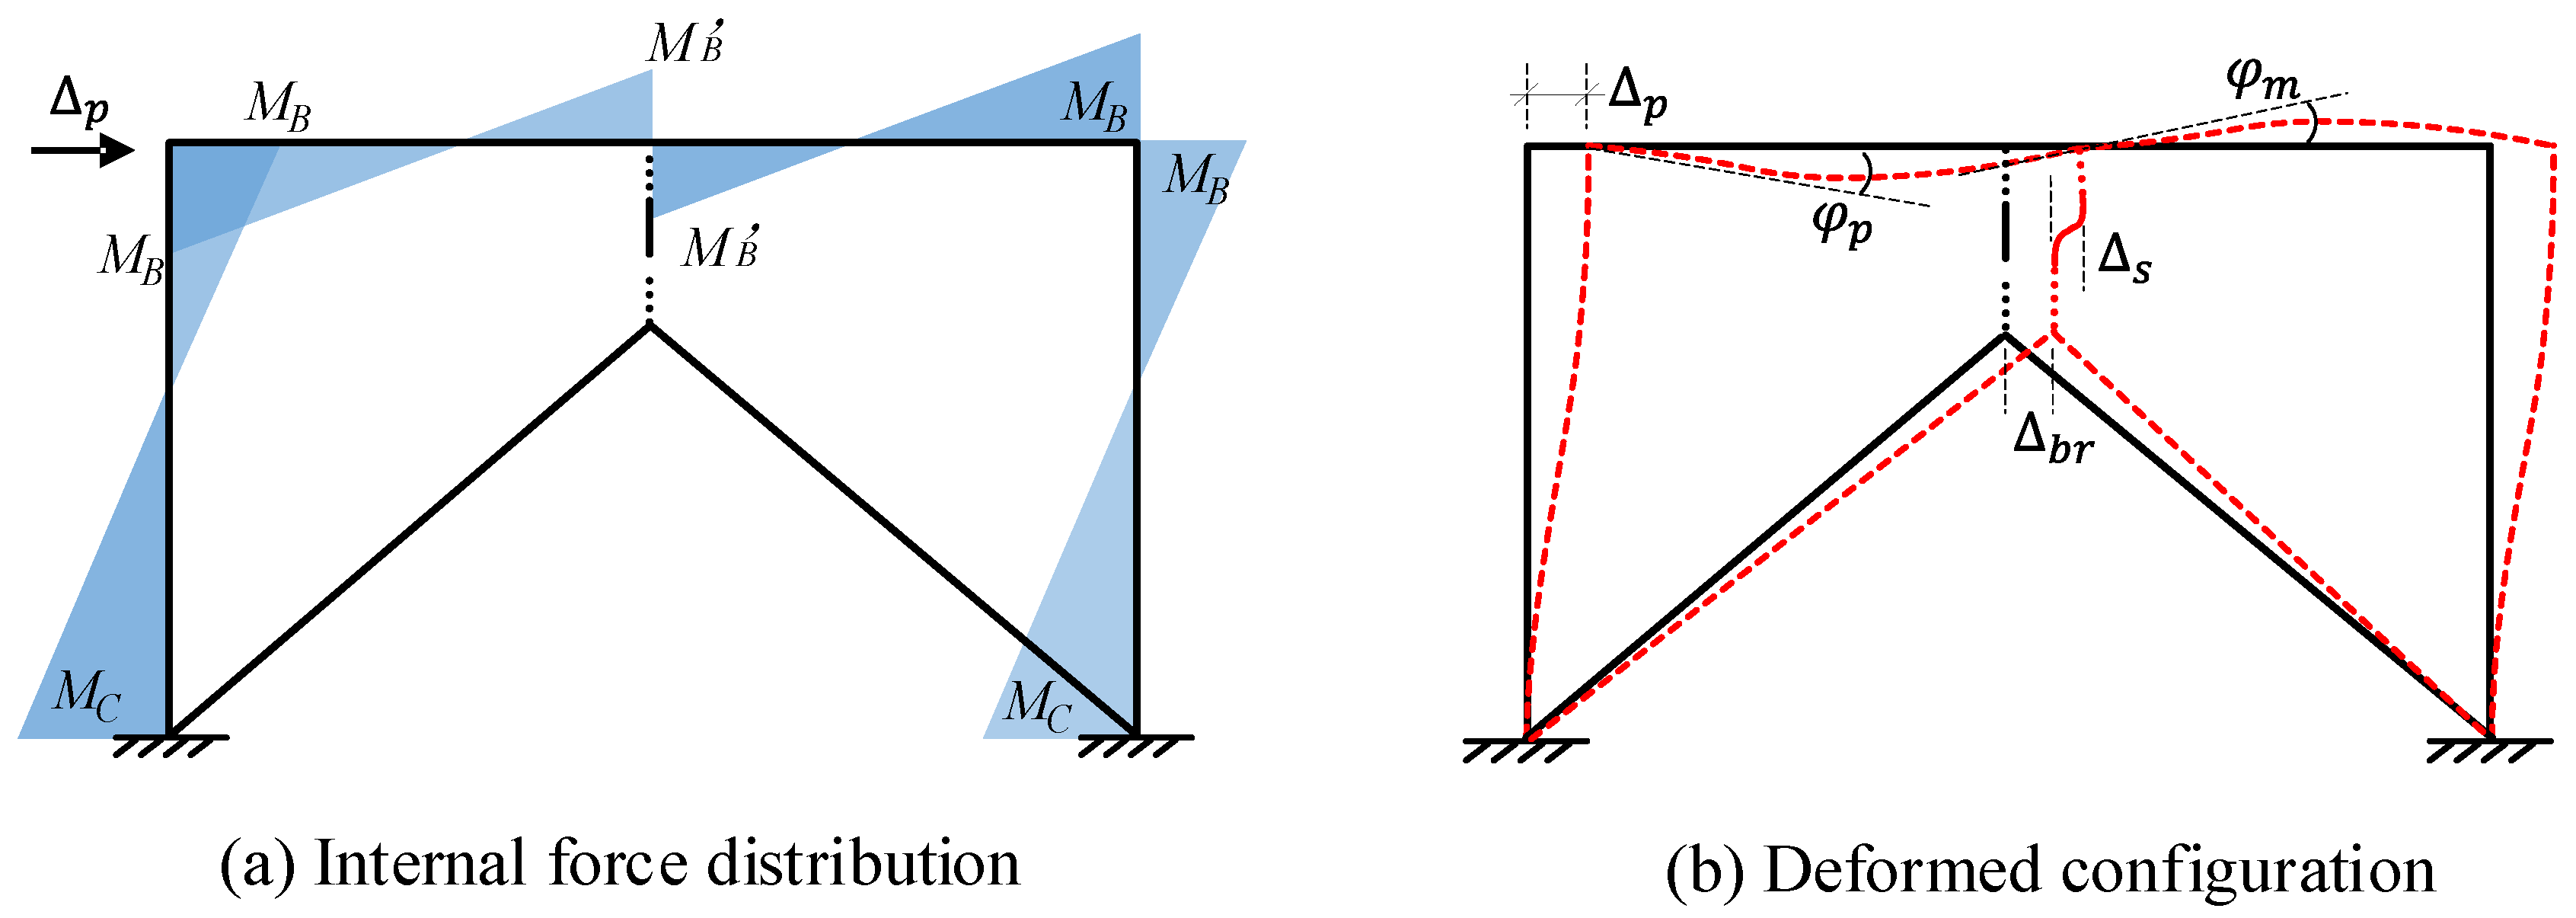
Figure 2 depicts the internal force distribution and deformation mode of the eccentrically braced composite frame structure with a vertical shear link. The maximum bending moment of the frame column is distributed at both ends of the column, which are represented by
MC and
MB. The shear reaction from the vertical shear link acting on the mid-span of the frame beam generates a bending moment
MB’ at the connection of the vertical shear link in the mid-span of the frame beam. According to the deformation mode shown in
Figure 2b, Δ
p is the overall horizontal lateral displacement of the frame, and Δ
s and Δ
br are the lateral deformations of the vertical shear link and diagonal brace, respectively.
φp and
φm are the angles at the end of the frame beam and middle of the beam, respectively.
The displacement method of structural mechanics is used to analyze the structure without lateral support. As illustrated in
Figure 2,
MB0,
MC0,
φp0, and
φm0 are the beam end bending moment, column bottom bending moment, beam end turning angle, and mid-span turning angle of composite frame structure without eccentric bracing member, respectively. According to the displacement method, the expressions of
MB0 and
MC0 can be obtained as shown in Equations (1)–(3).
Solving Equations (1) and (3) and substituting the results into (1) and (2) can give the formulas for
MB0,
MC0,
φp0, and
φm0 as shown in Equations (4)–(7).
Therefore, the lateral stiffness
Kl of a single frame column and the lateral stiffness
KF0 of a composite frame without eccentric bracing are shown in Equations (8) and (9), respectively.
For eccentrically braced frame structures, a spring with a stiffness of
Keq is added at a distance of
e2 +
L/2 from the composite frame beam and a bending moment
is applied to the span, as shown in
Figure 1. According to the symmetry of the structure, half of it can be selected for analysis. The rotation angle at the beam–column joint is
φp1 and the mid-span rotation angle is
φm1. Equations (10) and (11) can be obtained from the displacement method and the results are shown in Equations (12)–(15).
Combined with the calculation results of the non-eccentrically braced frame, the internal force, deformation, lateral stiffness, and lateral load of the key parts of the structure can be obtained as shown in Equations (16)–(19).
Keq is the lateral stiffness of eccentrically braced members, as shown in Equation (20). Therefore, the lateral stiffness
KF of eccentrically braced frames and the calculation formula of lateral thrust are shown in Equations (21) and (22), respectively.
where
E is the elastic modulus of the material,
KS is the shear stiffness of the coupling beam, which is determined by the design parameters of the coupling beam, and
Kbr is the horizontal stiffness of diagonal bracing members. Based on the layout of diagonal bracing,
Kbr can be calculated according to Equation (23).
According to the above formulas, the introduction of eccentric support increases the internal forces at the beam end and column end of the structure relative to the original structure, while reducing the beam end angle and mid-span angle deformation of the original structure. In addition, the amplitude of the increase in internal forces and the amplitude of the decrease in angle deformation are related to the lateral stiffness of the eccentric support. The lateral deformation of the structure and the center distance between the coupling beam and the frame beam are positively correlated. Moreover, compared with the original structure, the lateral stiffness of the structure after the addition of eccentric support increases not only the lateral stiffness Keq of eccentric support but also an additional stiffness. This shows that the introduction of eccentric support has a significant effect on the improvement of structural stiffness.
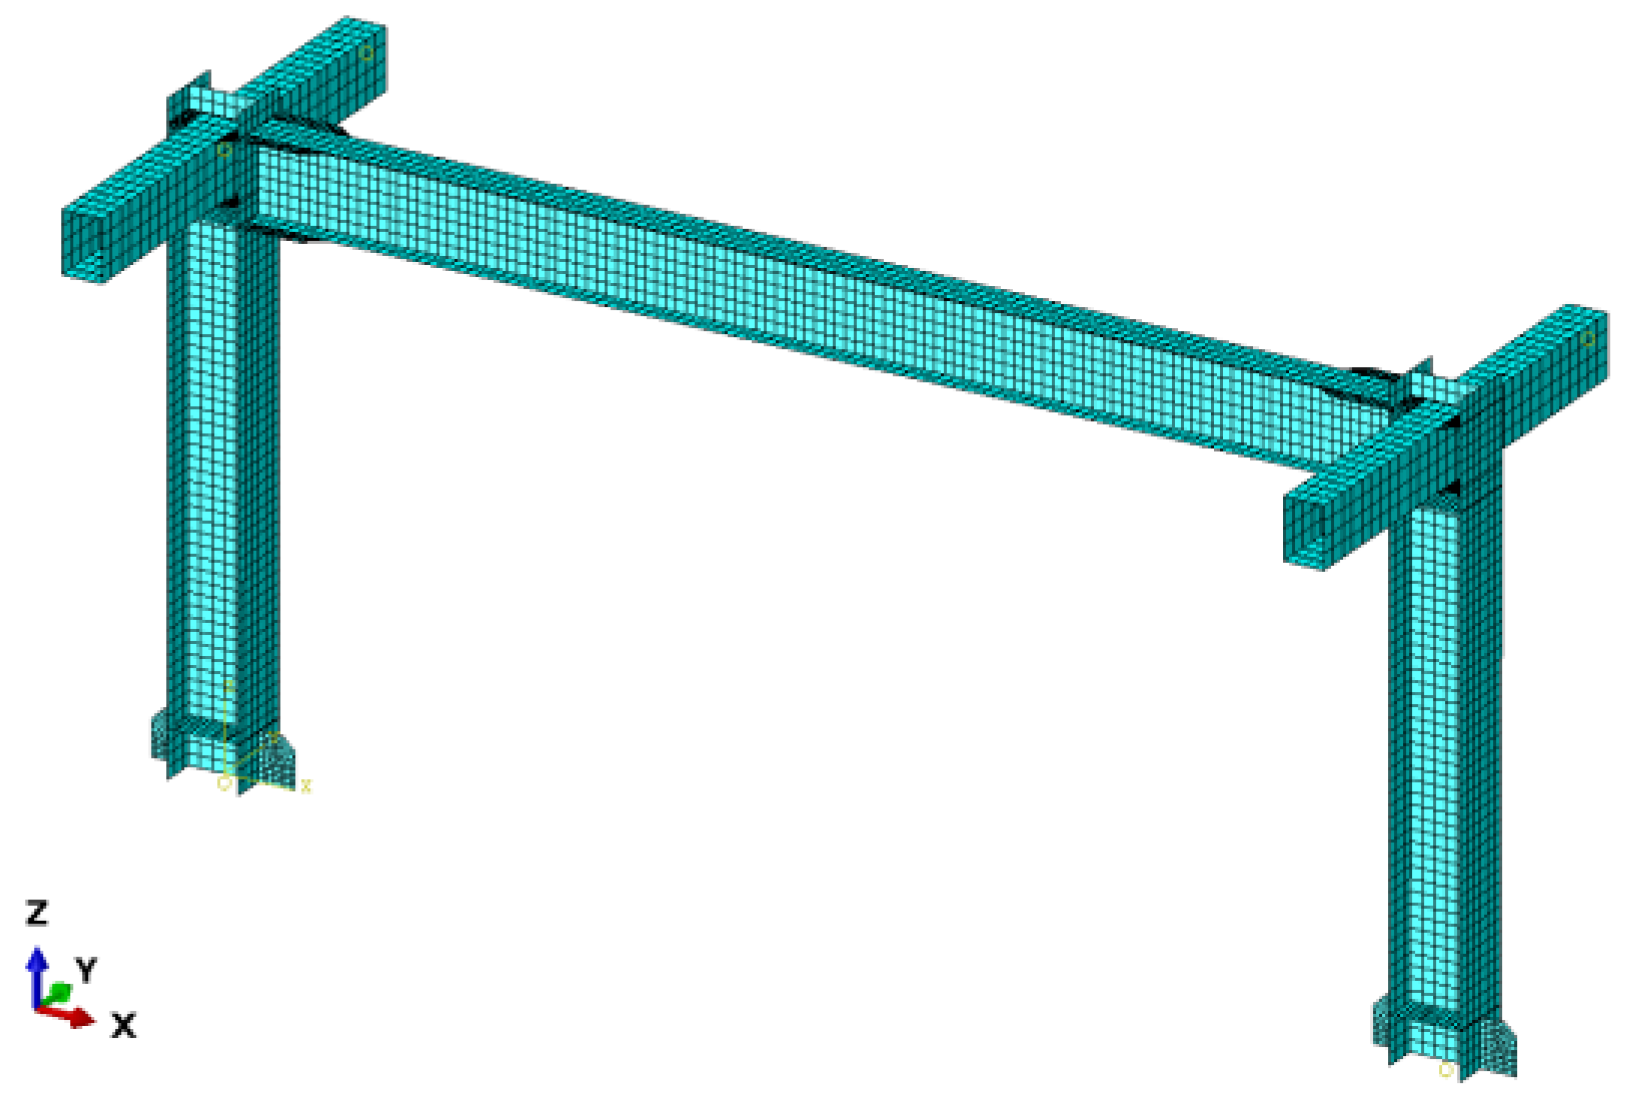
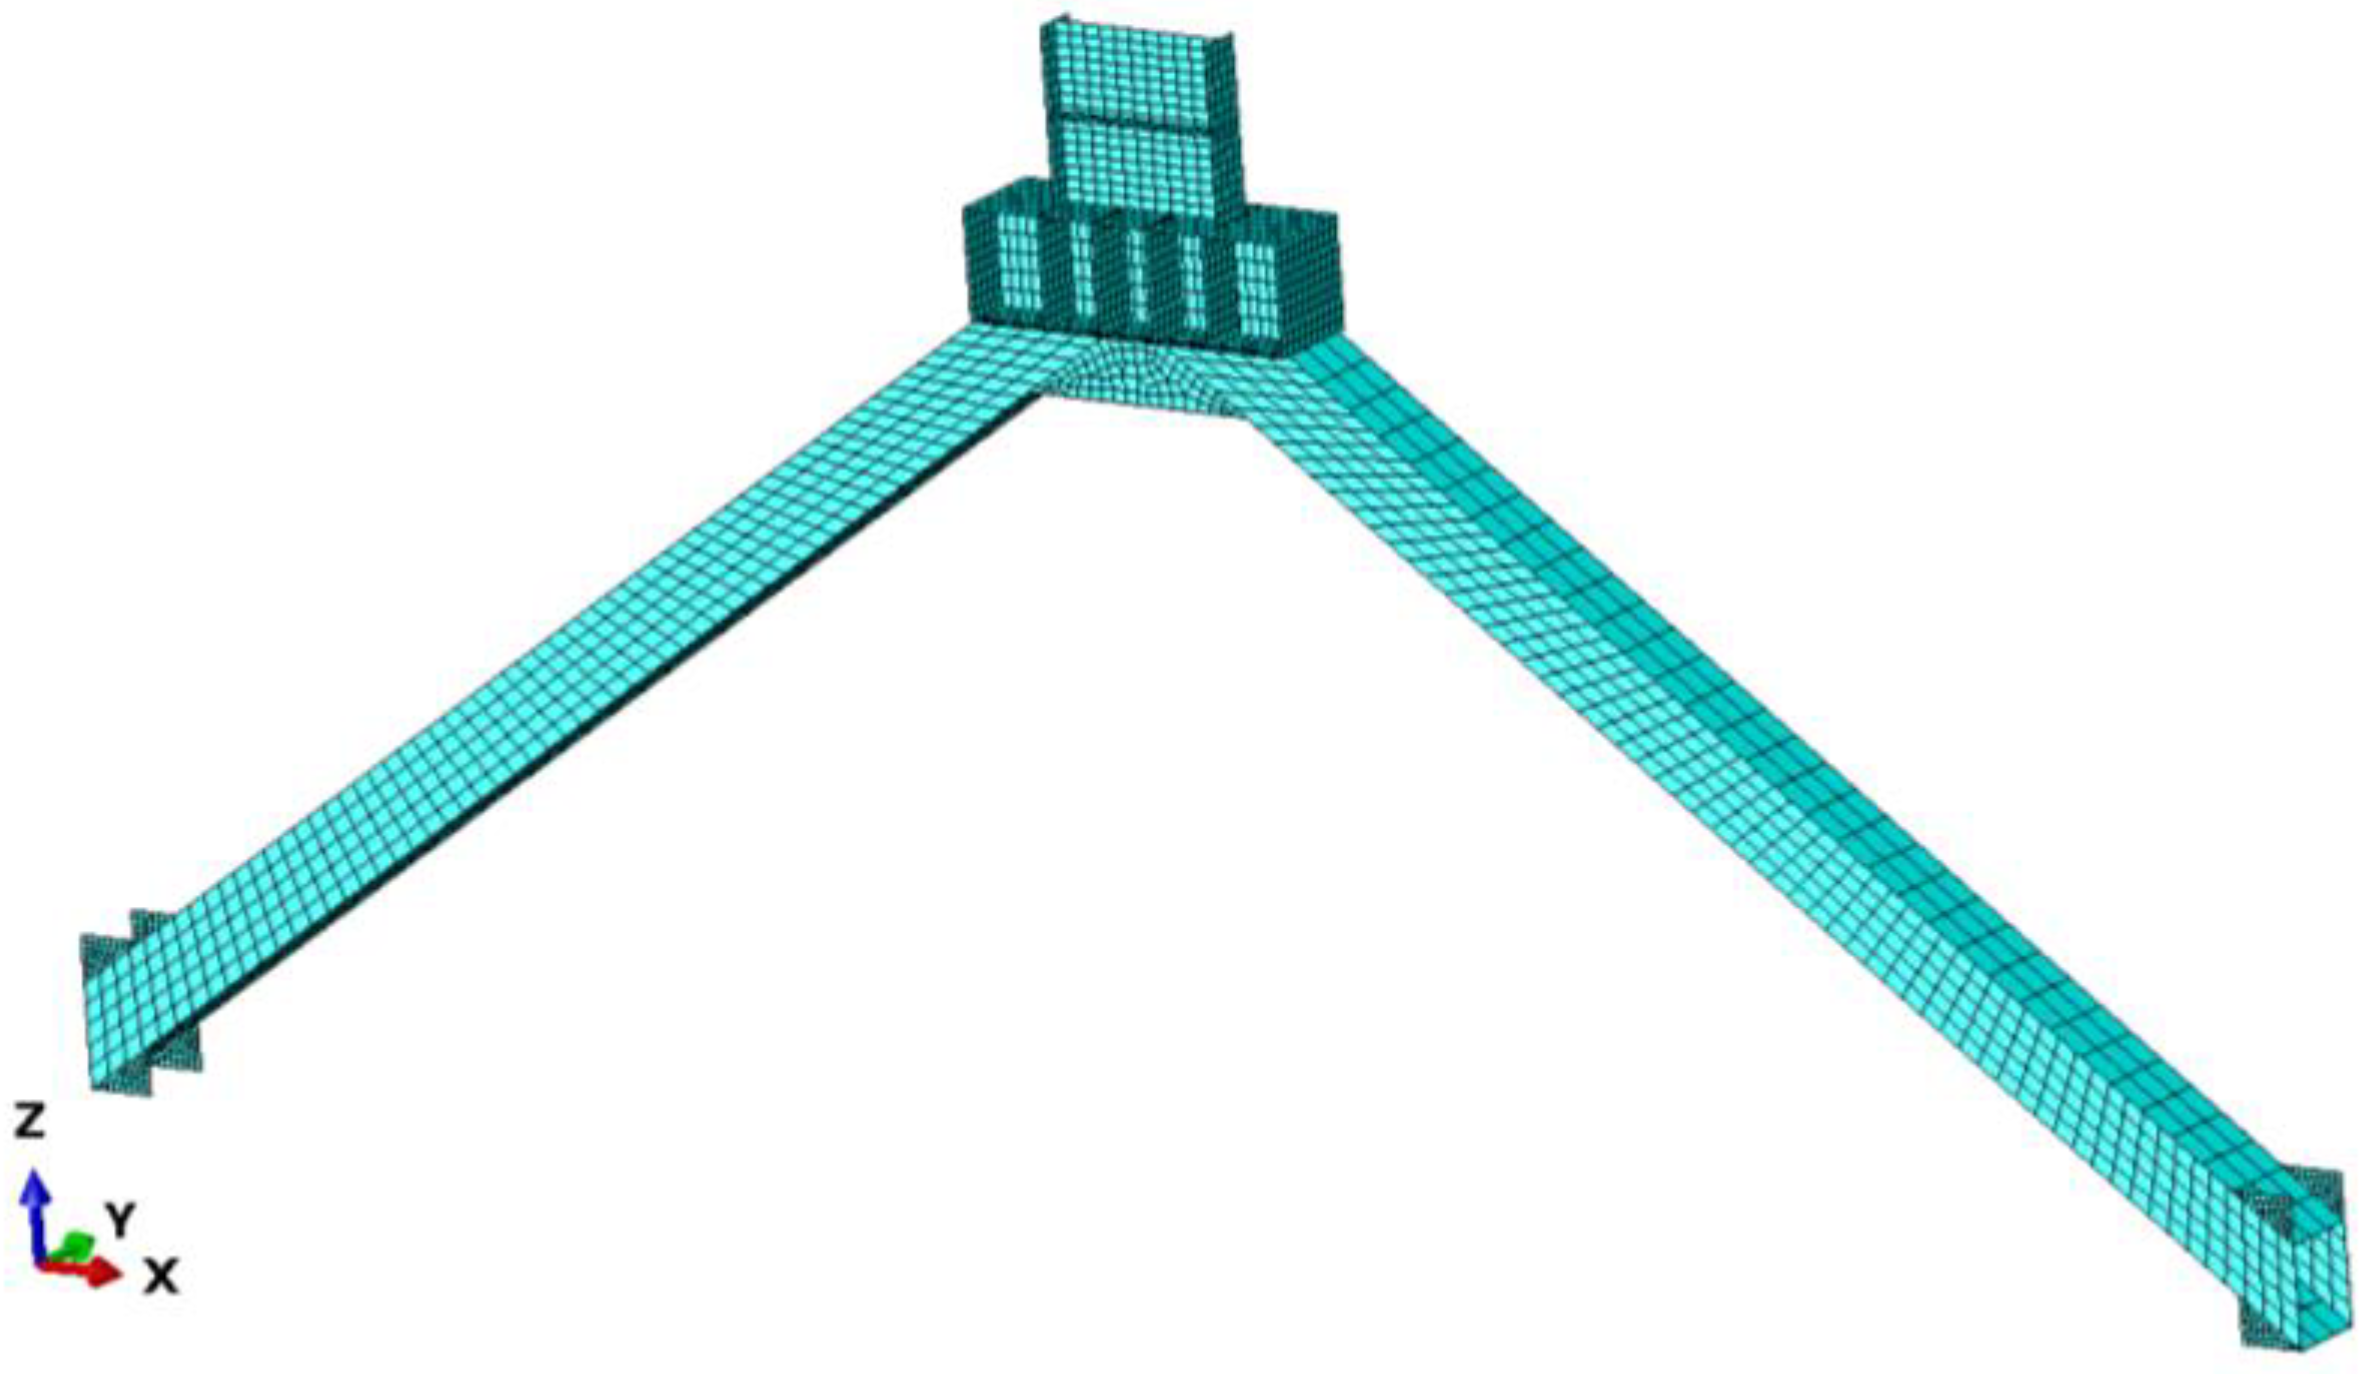
A nonlinear finite element model was developed to determine the mechanical properties of the eccentrically braced composite frame with a vertical LYP steel shear link, as illustrated in
Figure 3. A four-node quadrilateral linear reduced integral shell element (S4R element) was used for the simulation using ABAQUS. According to the grid test results, when the grid size is less than half of the extended length of the steel beam flange, the simulation results are stable, and the failure mode is consistent. To improve calculation efficiency, the grid size of the shell element in the steel frame model is in the range of 25–40 mm, and the local stiffener area or variable section area is appropriately densified.
Figure 3 depicts the mesh results of the steel frame model. The stress–strain curve of steel agrees with the uniaxial constitutive relationship recommended by the authors [
42,
43], based on the material property test results for LYP steel.
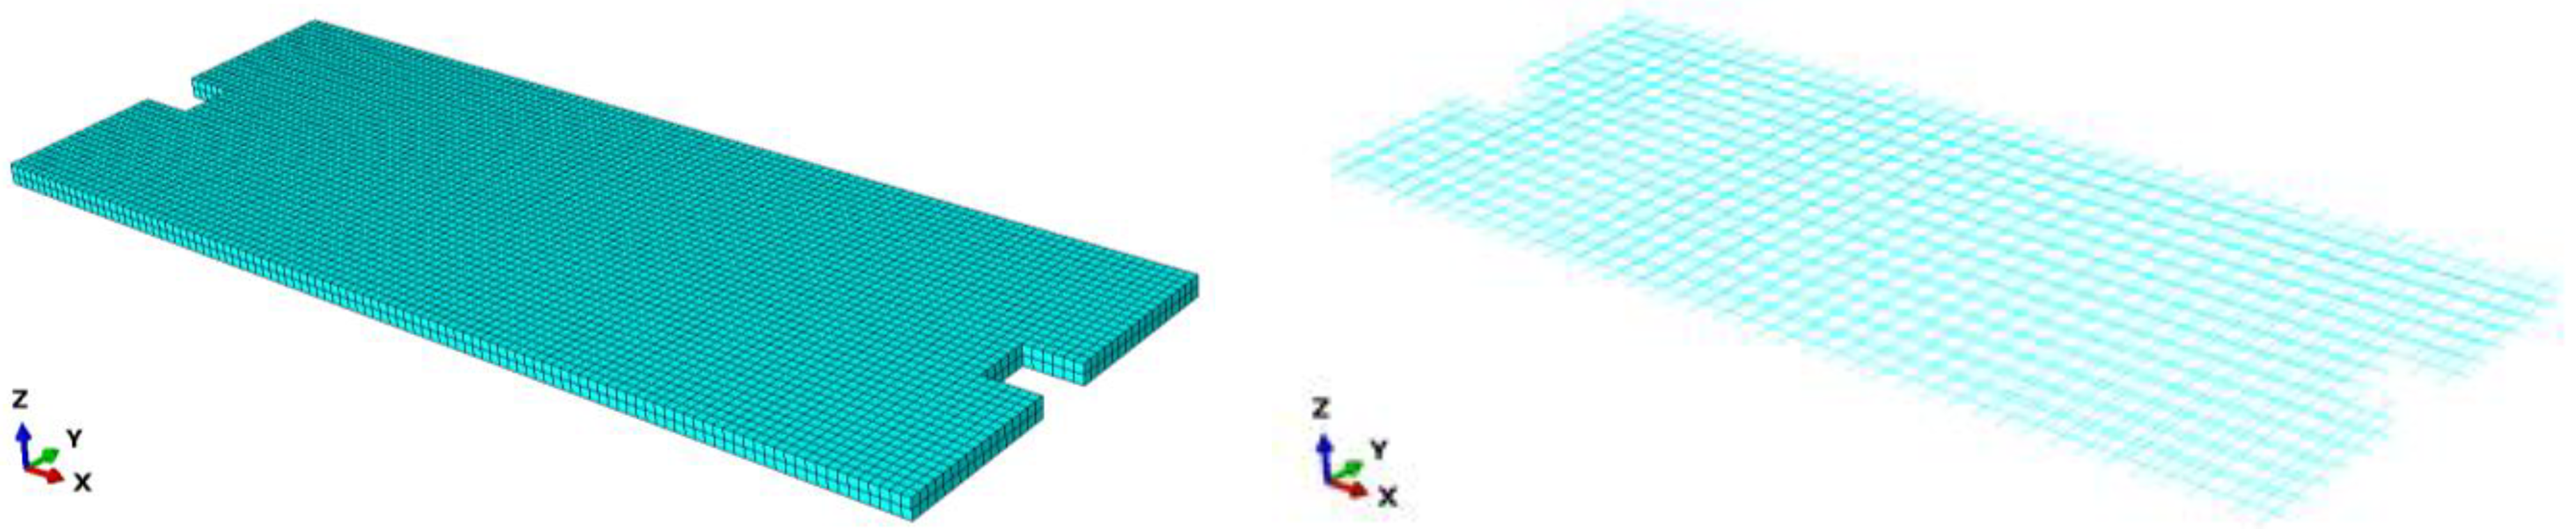
The reinforcement for the reinforced concrete slab was embedded in the concrete and deformed synergistically through bonding and anchoring. The concrete was simulated using an 8-node hexahedral linear reduced integration solid unit (C3D8R unit). The reinforcement was simulated using a truss element (T2D2 unit) and embedded in the concrete entity unit using the embedded function in ABAQUS. According to the results of the grid test, when the grid size of the concrete slab unit is less than 40 mm, the results of the model calculations did not change. The grid size of the concrete slab is 40 mm to improve calculation efficiency. The reinforcement grid size is consistent with that of the concrete grid size. The meshing results of the RC slab model are shown in
Figure 4.
There are two main constitutive models of concrete in ABAQUS: dispersion cracking and plastic damage models [
44]. Plastic damage simulations are primarily used in the modeling of concrete. Six basic design parameters are used to determine the plastic damage model of concrete in ABAQUS, as listed in
Table 1. The first three parameters were obtained from the material property test results, and the values of the last three parameters were converted using the formula recommended in the Code for Design of Concrete Structures (GB50010-2010) [
45].
The eccentric support mainly comprises a shear link, diagonal brace, and cross-beam using the S4R element. All the shear links are made of LYP steel, and the diagonal brace and cross-beam are made of Q355 steel, which is consistent with the steel frame.
According to the grid test results, when the grid size is less than half of the extension length of the flange of the shear link (25 mm), the calculation results are consistent and the local buckling deformation of the shear link can also be fully simulated. Therefore, the grid size of the eccentric support part is mostly 25 mm, and the local area of the stiffener was appropriately densified. The grid division results are shown in
Figure 5. The shear link component is composed of LYP steel; refer to the author’s article [
42,
43] for its material constitution and for some recent hysteretic models and accurate simulation of its complex nonlinear behavior [
46,
47].
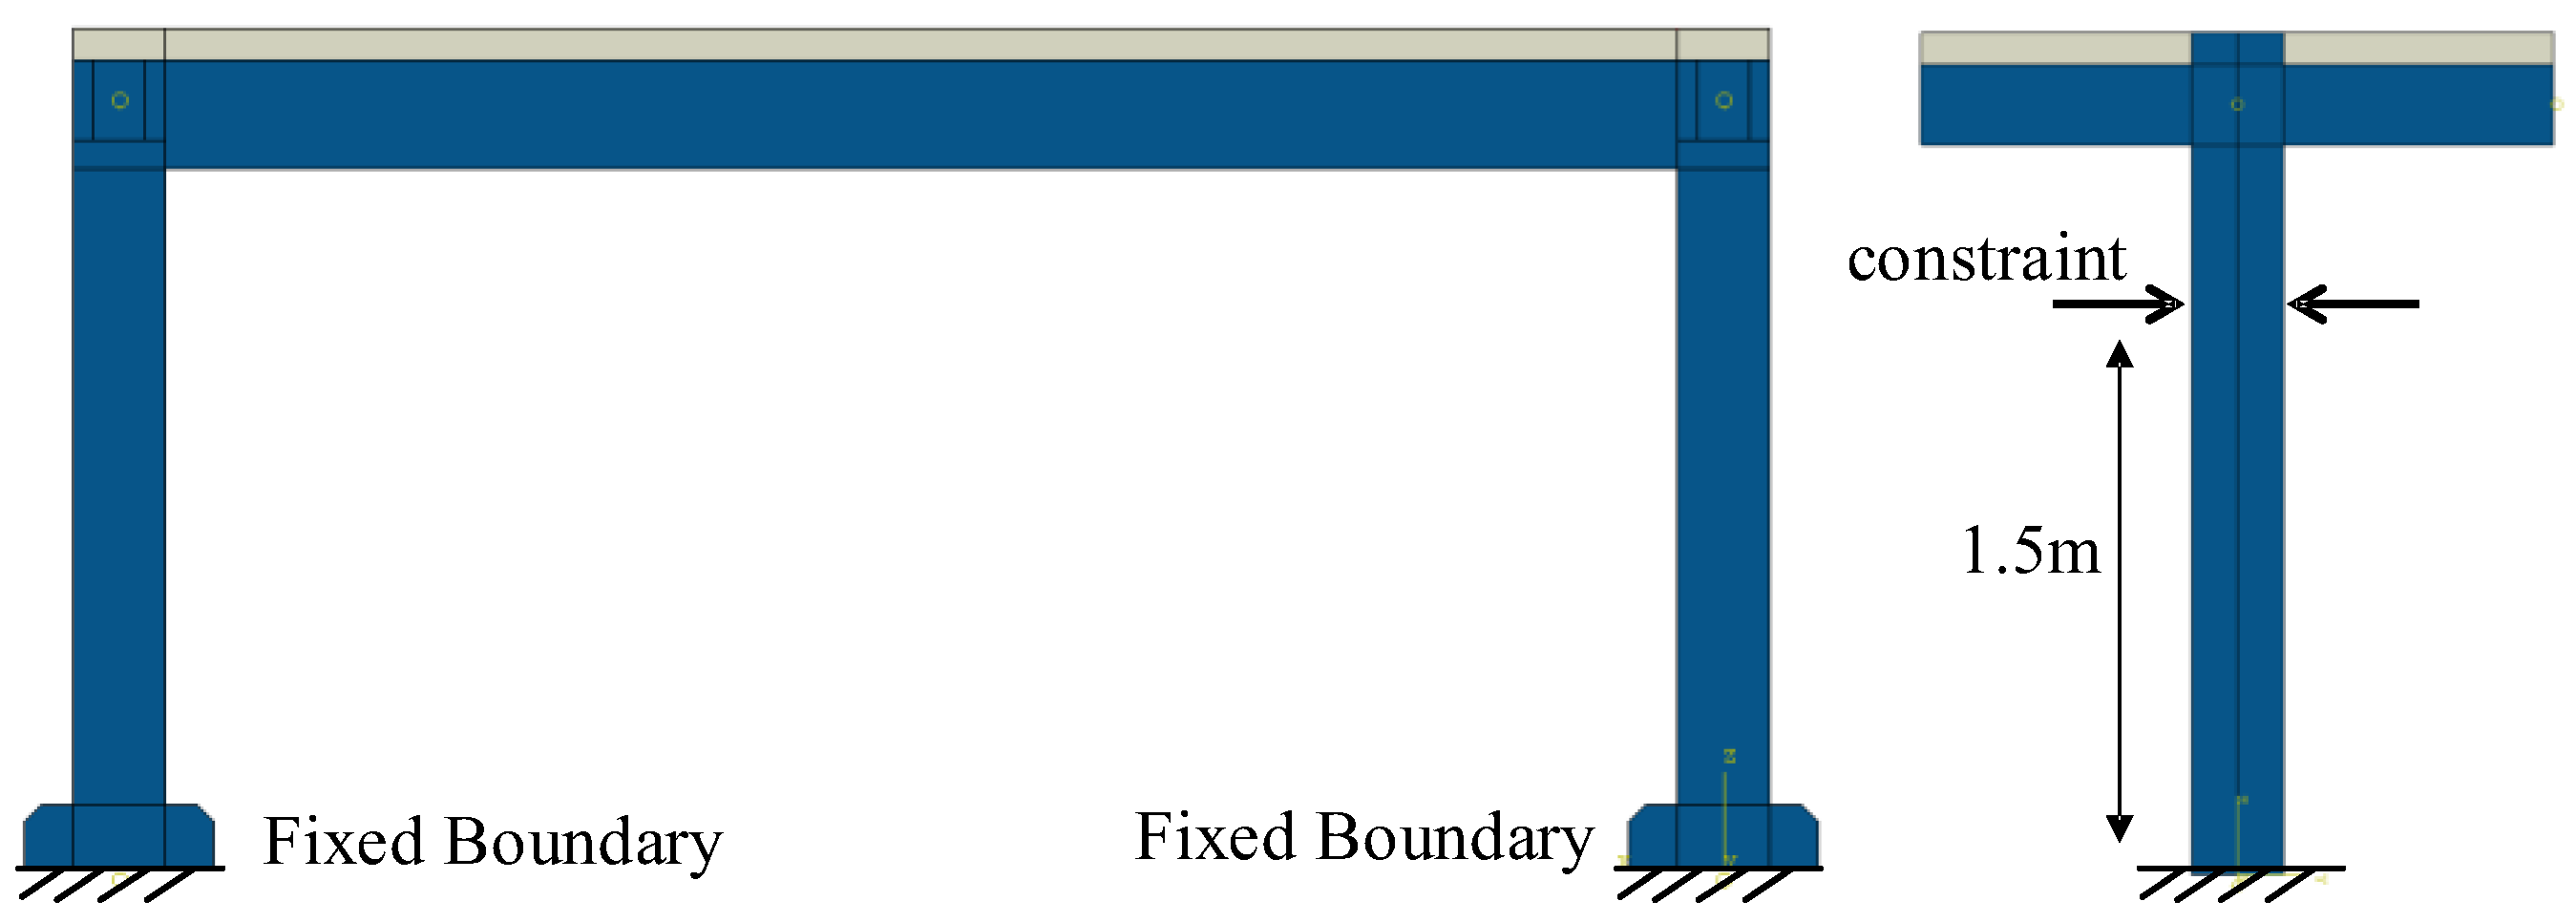
The bottom of each specimen was fixed to the ground beam using high-strength bolts. The bearing capacity of the high-strength bolt group was higher than the design shear force and bending moment at the bottom of the frame column in the design. The slip and separation between the end plate at the bottom of the specimen column and the ground beam were not observed during the test. Therefore, the bottom of the specimen can be regarded as a fixed boundary condition to constrain the degrees of freedom in all directions in the finite element model. The degree of freedom in the out-of-plane translation direction of the model was limited to the height of the frame column (1.5 m) to control the out-of-plane deformation of the specimen.
Figure 6 depicts the boundary conditions of the numerical model of specimen 1, which is consistent with specimen 2.
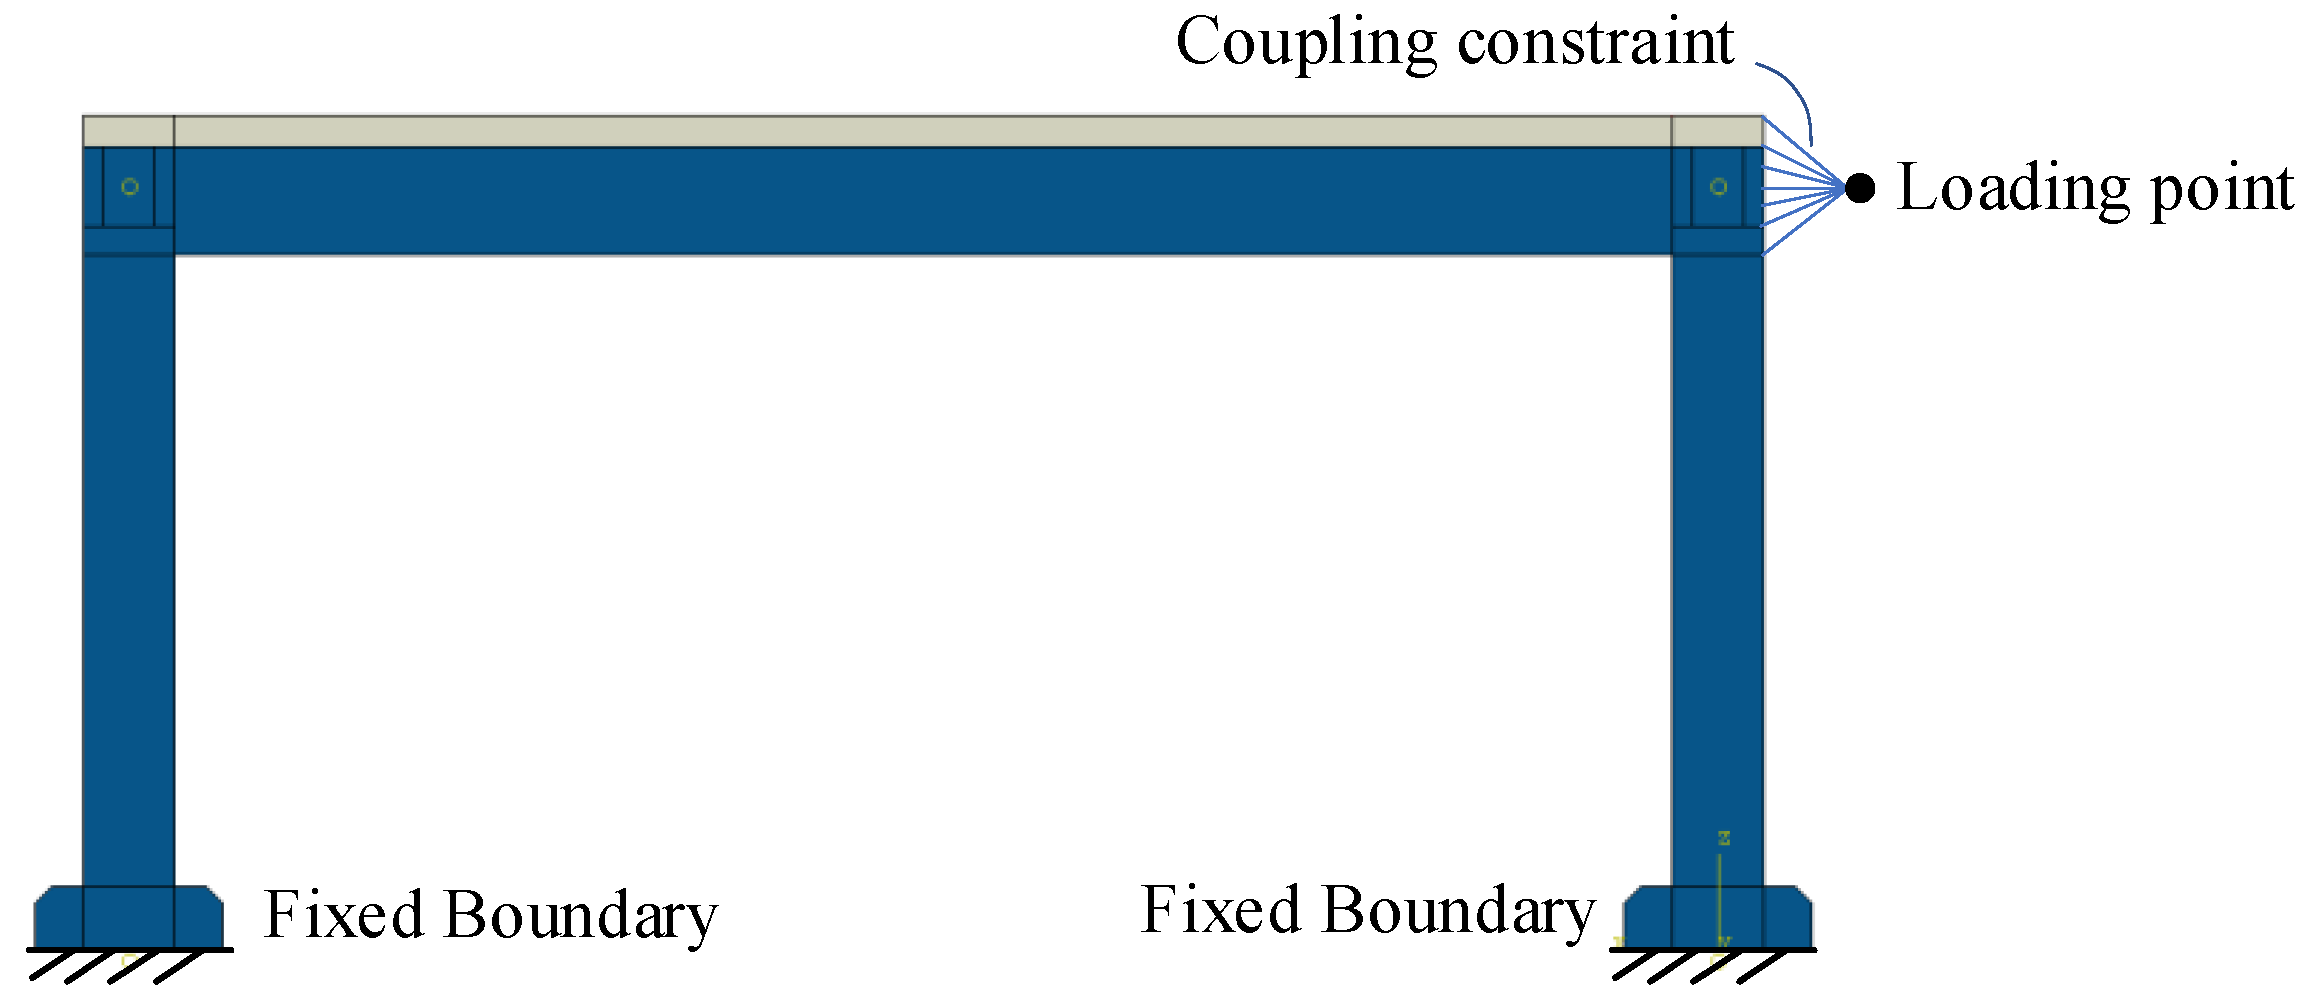
The loading point of the model was set at the center of the bracket protruding from the north side of the specimen, as shown in
Figure 7. The point and outer sides of the frame column were connected using the coupling constraint in ABAQUS. The coupling range is the contact surface between the outrigger and frame column. The coupling constraint ensured a rigid connection between the coupling surface and the loading point. It was used to simulate the welding connection between the outrigger and the end of the frame column. During the calculation, lateral action was applied to the loading point. The loading time in the numerical simulation is consistent with that in the experiment [
41].
3. Analysis Results and Verification
To validate the accuracy of the finite element model, we compared and thoroughly analyzed the finite element simulation and test results [
41], including conventional composite frame specimen 1 and eccentrically braced composite frame with vertical shear link specimen 2.
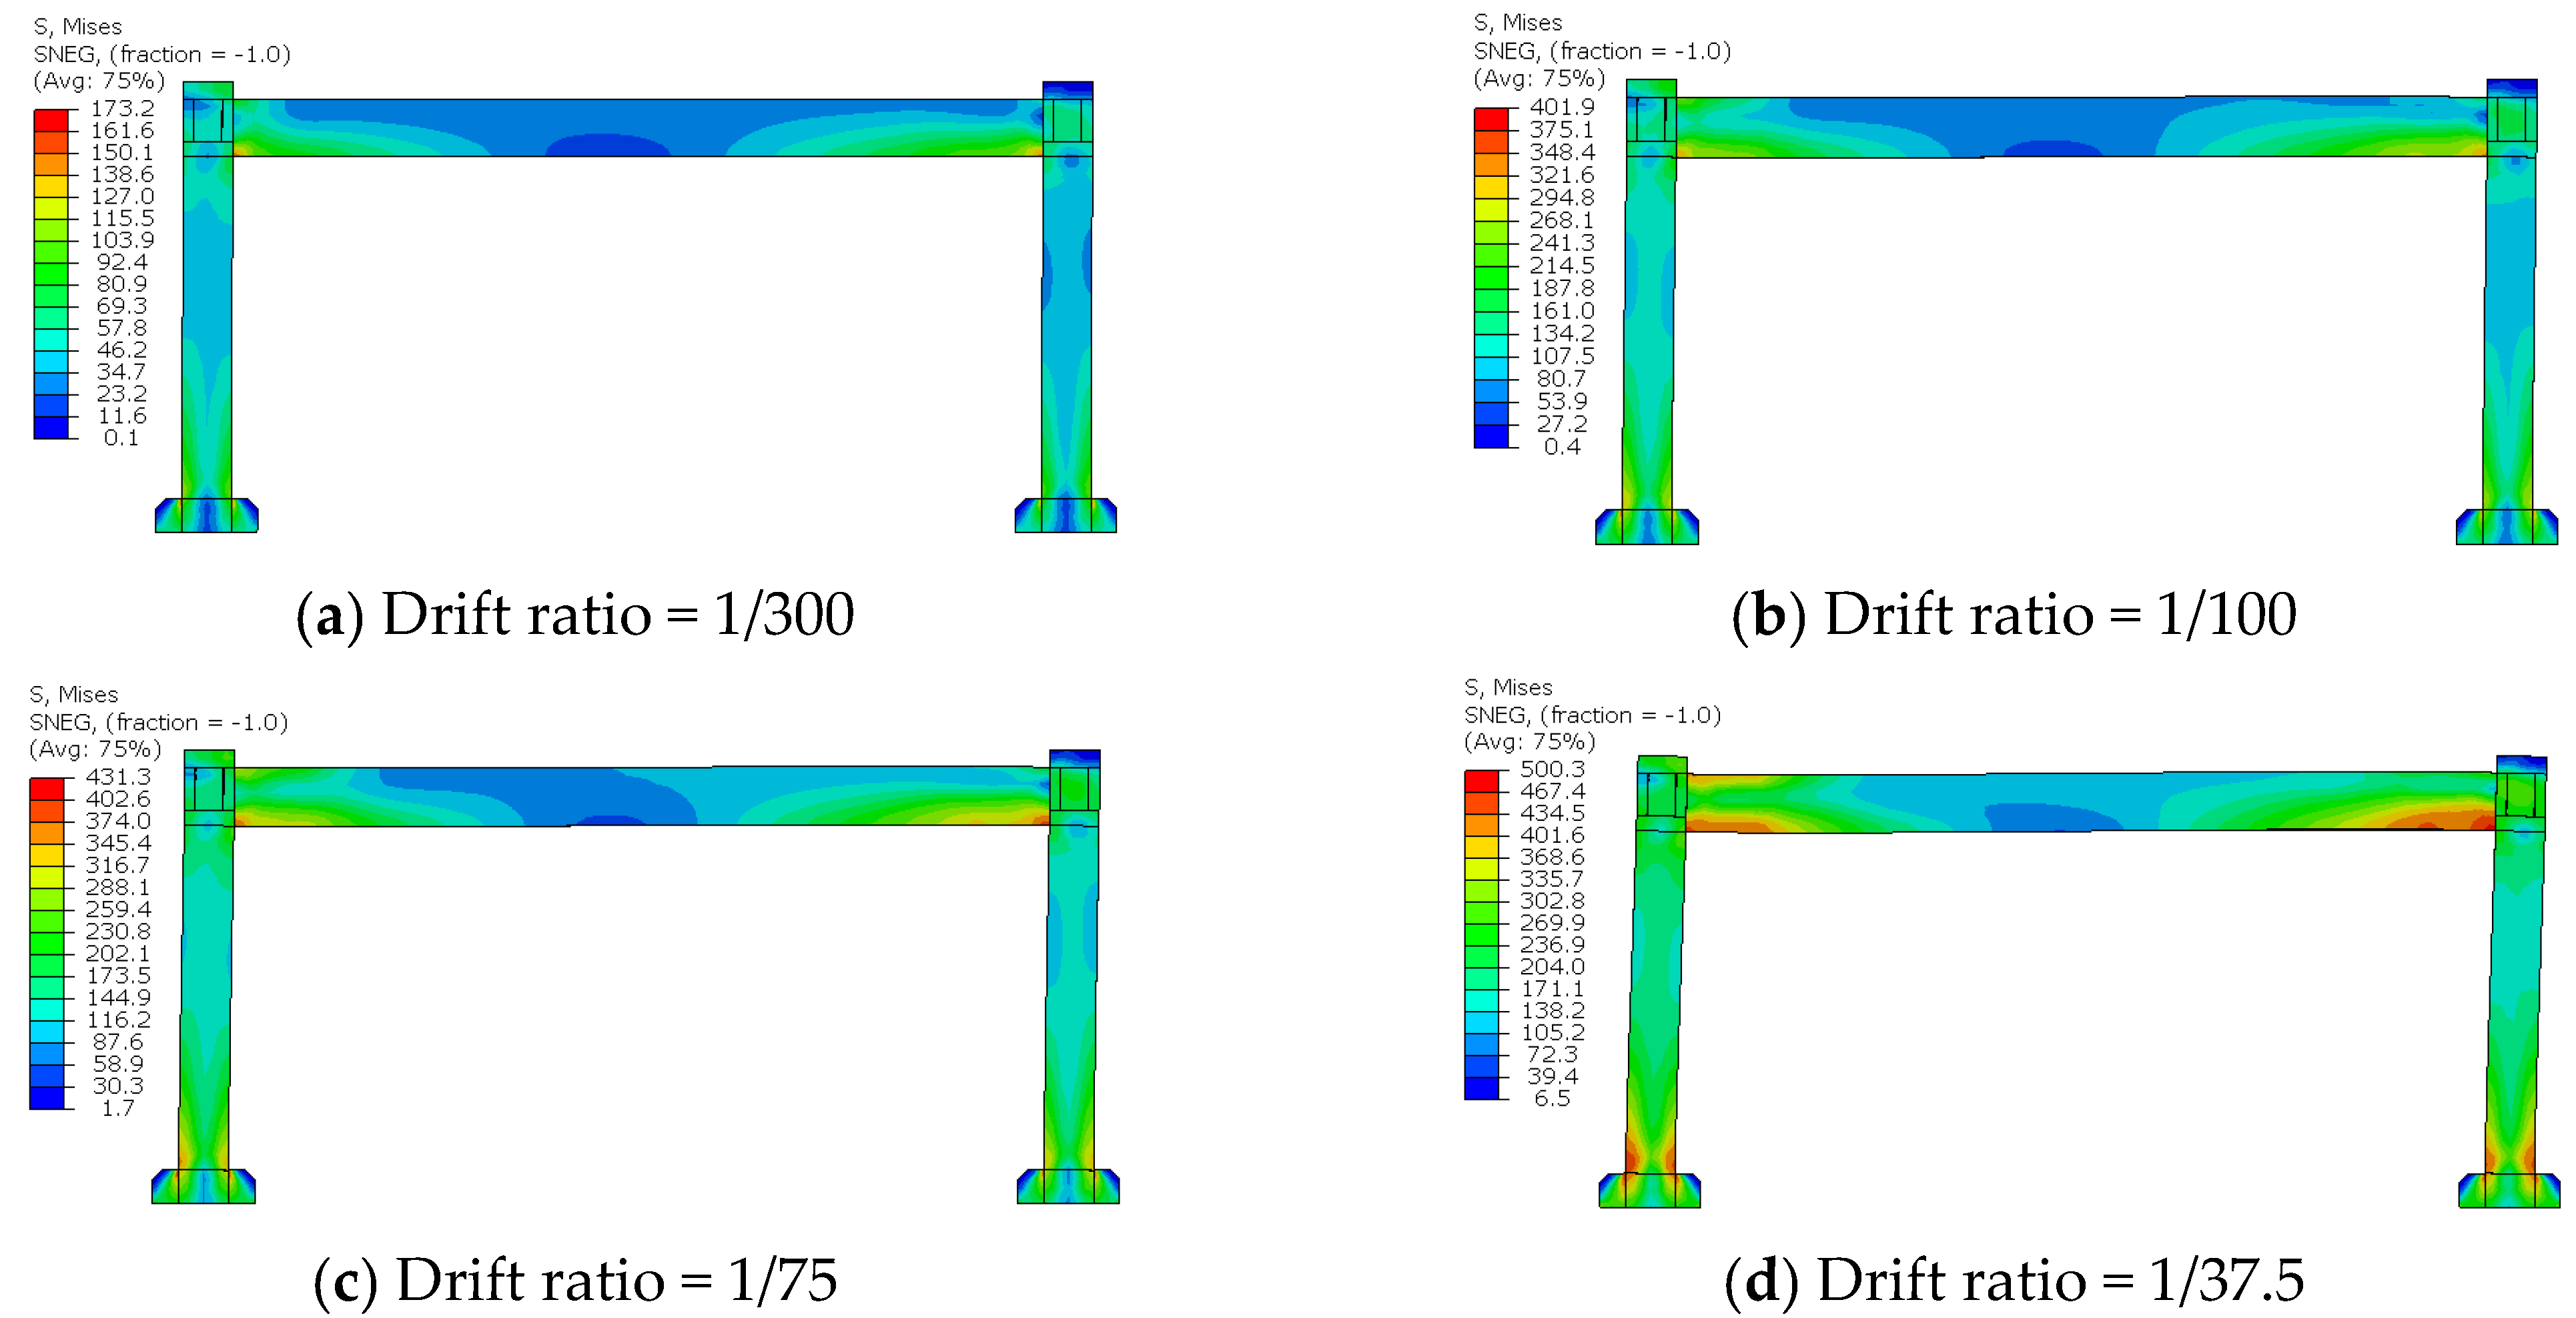
Figure 8 shows the stress nephogram of the steel frame of specimen 1 at a typical displacement ratio. The areas with large stress are mostly concentrated near the node at the beam end and the bottom of the column, and the stress at the beam end is slightly higher than the stress at the bottom of the column; therefore, the beam end yields before the column end. The numerical simulation results are consistent with the experimental observation results. The drift ratio is calculated using the deformation to height ratio. At a drift ratio of 1/100, the maximum stress at the end of the steel beam is 367 MPa, indicating that the frame beam has yielded at this time, whereas the maximum stress at the end of the frame column is 281 MPa, indicating that it has not yet yielded. When the drift ratio reaches 1/75, the maximum stress at the bottom of the frame column is 355 MPa, which exceeds the yield stress of steel and indicates that the frame column has entered the yield stage. When the drift ratio reaches 1/37.5, the beam end and column bottom end of the structure have all yielded and entered the strengthening stage, indicating that the structure formed plastic hinges and failed.
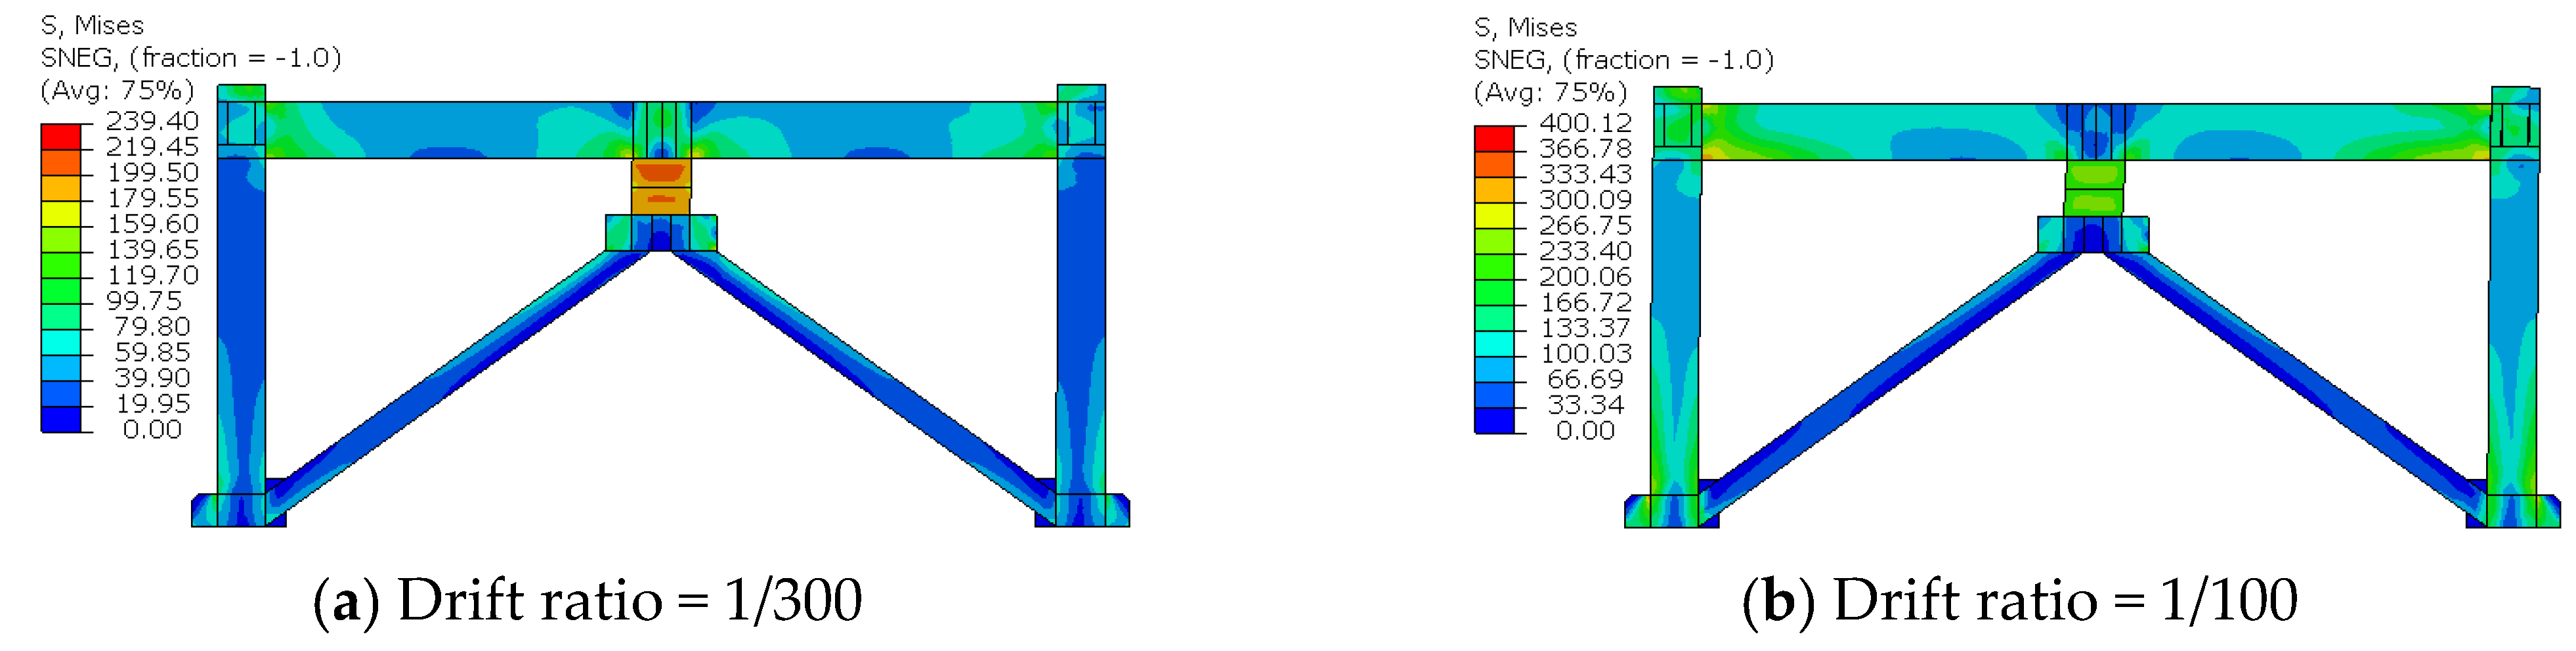
Figure 9 depicts the stress cloud diagram of specimen 2 at a typical drift ratio. When the drift ratio is 1/300, the steel frame remains in the linear elastic range, and the stress level is low. In contrast, the equivalent force level of the connecting beam member has reached 240 MPa, indicating that the connecting beam has begun to yield. This is consistent with the experimental observations. When the drift ratio reached 1/300, the tangent of the hysteresis curve of specimen 2 began to decrease. The structure already has a certain energy dissipation capacity because of the yield of the connecting beam. When the drift ratio reaches 1/100, the connecting beam undergoes obvious shear deformation, and its webs and flanges have yielded, indicating that it has completely entered the state of yield energy consumption. Under this condition, the maximum stress of the steel frame part is mainly concentrated at the end of the steel beam and the bottom of the column. The maximum stress at the end of the steel beam is 378 MPa, indicating that the steel beam has just entered the yield state, whereas the stress level at the bottom of the column is 301 MPa, indicating that the connecting beam has not yielded. Furthermore, the stress level at the bottom of the steel and the lower edge of the steel beam in the middle of the span are both relatively high, reaching up to 318 MPa, which is consistent with the test results. This is because of the additional bending moment caused by the vertical connecting beam in the middle of the span. When the drift ratio reaches 1/42.9, the frame beam and the column both yield and enter the strengthening stage. The plastic hinge of the structure is formed at both the end of the frame beam and the column, and the structure will fail soon.
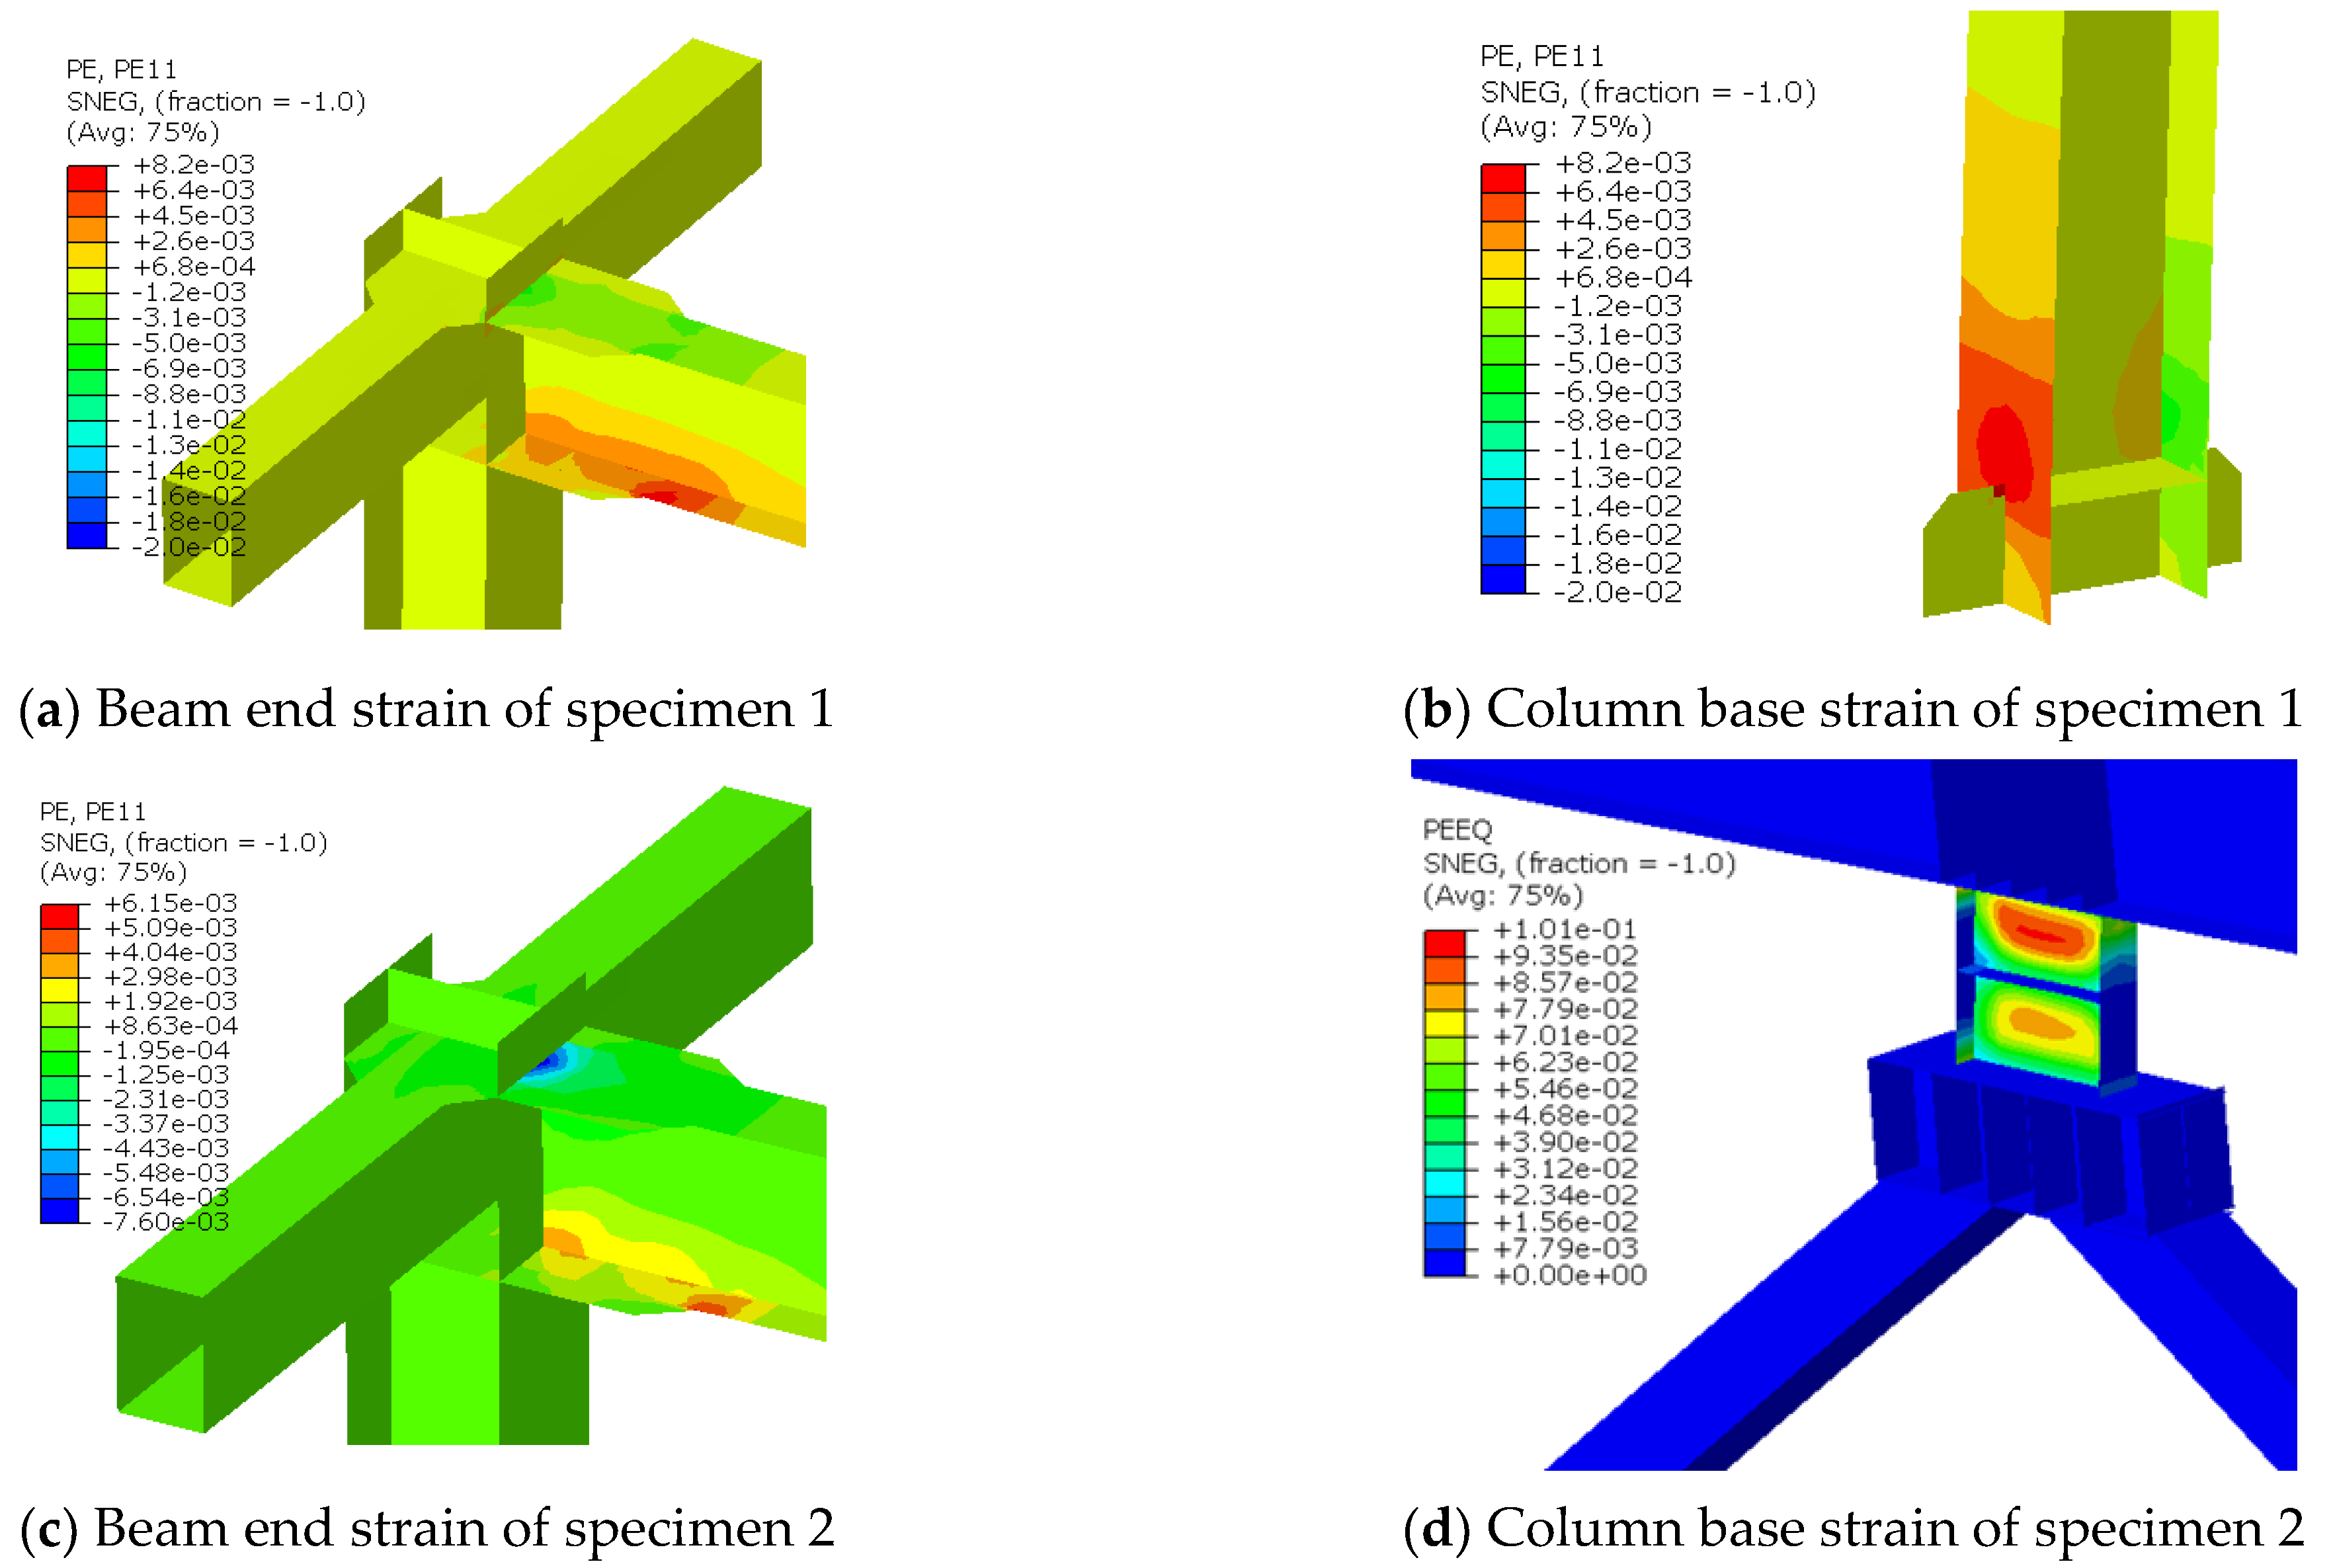
Figure 10a,b illustrates the local plastic strain nephograms of the beam end and bottom of the column when the failure drift ratio of specimen 1 has been reached. The following simulation results are consistent with the experimental results. The maximum plastic strain at the beam end is located at the flange widening. Obvious buckling or tearing failure initially occurred at the flange widening during the test. The maximum plastic strain at the column end is located at the upper part of the column end stiffener. When failure occurs, the column flange at the upper part of the column end stiffener exhibits out-of-plane buckling deformation. For specimen 2, when the structural drift ratio reaches 1/42.9, the shear link fails owing to excessive shear deformation, and the lower edge of the steel beam at the end of the beam undergoes relatively obvious buckling and tearing damage, as shown in
Figure 10c,d.
A comparison of the damage to the concrete slab of specimens 1 and 2 in the numerical model and test at failure, is shown in
Figure 11, which is represented by the tension damage factor in the numerical model and crack distribution diagram in the experimental results. Evidently, there is good agreement between the numerical and experimental results. For the concrete slab of specimen 1, the damage area is mainly distributed at the beam end; the damage is smaller if the damage area is closer to the mid-span. The damage to the concrete slab of specimen 2 is distributed at the beam end and in the damage area on both sides of the installation position of the mid-span vertical shear link. This indicates that the introduction of eccentric support causes additional damage to the concrete slab.
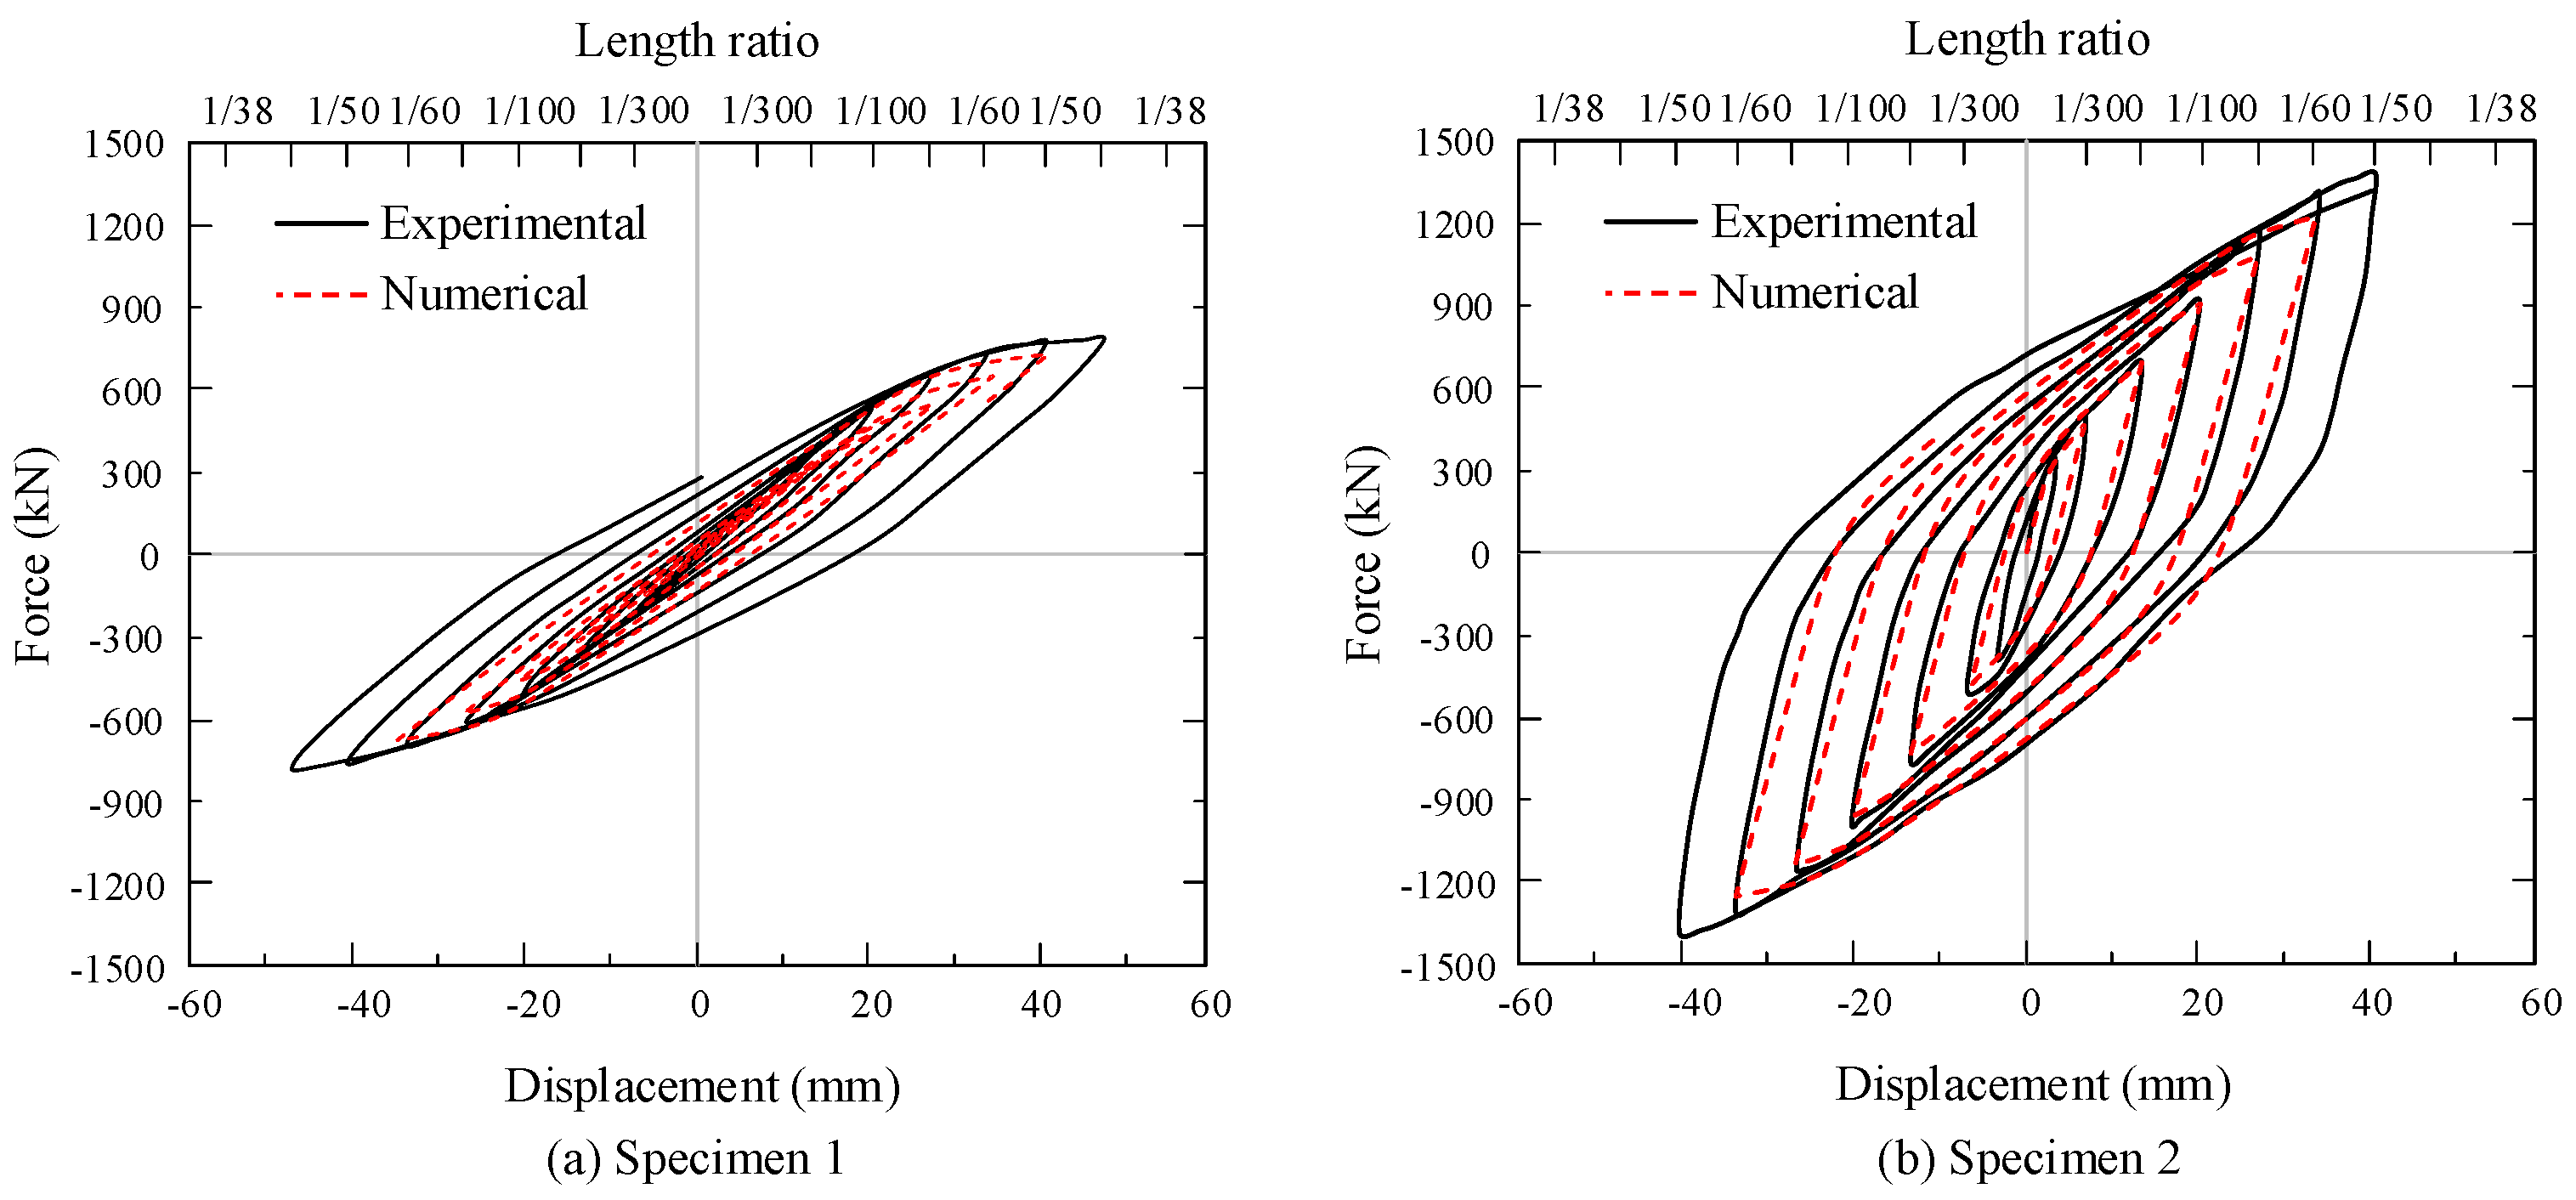
A comparison of the hysteresis loops obtained from the numerical model and test is shown in
Figure 12. The nonlinear responses are characterized by kinematic hardening [
47,
48]. Before the significant tearing of the lower edge of the steel beam, the numerical model analysis results are in good agreement with the experimental results. This verifies the accuracy of the model. In addition, the results of the numerical model analysis also demonstrate that compared to the conventional composite frame, the eccentrically braced composite frame with a vertical shear link has a fuller hysteresis loop, better energy dissipation capacity, higher bearing capacity and stiffness, and better seismic performance.
Table 2 compares the stress characteristic parameters of the skeleton curve obtained from the numerical model analysis to those obtained from the test skeleton curve. The error of both curves is less than 10%, indicating that the modeling method proposed in this study can accurately reflect the stress characteristics of the structural system, predicting the mechanical properties of the structure.
4. Analysis of Key Design Parameters
According to the experimental results in a previous study [
41] and the analytical results from this study, the main factors that affect the mechanical properties of the structure in an eccentrically braced composite frame with a vertical shear link include the size of the frame structure (height
h and width
l), moment of inertia
IB and
IC of the frame beam and column, respectively, length
ls, stiffness
KS, yield strength
Vp of the shear link, and stiffness
Kbr of the diagonal brace. The size of the frame structure and the moment of inertia of the frame beam–column joint influence the performance of the structure by affecting the frame beam-to-column stiffness ratio. The stiffness and yield strength of the shear link are primarily determined by the length
ls, web width
hw,s, and thickness
tw,s of the shear link. Therefore, the key parameters mainly include the frame beam-to-column linear stiffness ratio
α, length
ls, web width
hw,s and thickness
tw,s of the shear link, and stiffness
Kbr of the diagonal brace. In this study, the design parameters of specimen 2 served as a basis for enlarging or reducing the parameters, and the effect of the design parameters on the mechanical properties of the structures was evaluated, as presented in
Table 3.
The compactness of the web panel
aw is defined as the ratio of the width to the thickness. In the numerical model analysis when changing the web width or web thickness of the shear link, the compactness
aw of test specimens ranges from 2.0 to 32.0, and an additional horizontal stiffener is weld in the middle of the web panel, before analysis, the values of compactness of shear links in different numerical models are checked to satisfy the requirement for the highly ductile design of members according to the AISC 341-16 provisions [
37].
The link length ratio
ρ is determined in accordance with AISC 341-16 [
37], given by Equation (24). It is one of the key parameters that controls the stiffness, strength, ductility, and cyclic behavior of the shear link. The
ρ values of test specimens are designed between 0.6 and 2.40, which covered the typical range of
ρ values in previous studies [
42].
4.1. Beam-to-Column Linear Stiffness Ratio
Changing the thickness of the frame beam flange plate primarily affects the beam-to-column linear stiffness. According to the theoretical analysis, the internal force distribution and stiffness of EBF system are related to the height and width of the frame. To ensure the principle of single variable, these two parameters cannot be changed when exploring the beam-to-column linear stiffness ratio. Similarly, the height of the frame beam is the key factor to determine the eccentric distance of the connecting beam, so the height of the frame beam cannot be changed. In contrast, the base of the section of the frame column is connected with the support. If the section of the column is changed to adjust the linear stiffness ratio, it will lead to the early buckling of the bottom of the column where it is connected to the support because this section of the column is too weak. Therefore, the ratio of linear stiffness can only be controlled by adjusting the flange and web thickness of the frame beam. Considering that the variation of web thickness is inefficient to change the section stiffness of the frame beam and will affect the shear strength of the frame beam, the beam-to-column linear stiffness ratio is adjusted by varying the flange thickness of the frame beam.
Figure 13 shows the stress nephogram of the steel frame when the structure fails under different beam-to-column linear stiffness ratios. In this study, “the structure fails” is defined at the point when the frame achieve a drift ratio of 1/42.9, this drift ratio is obtained from previous experimental research on the EBF system with vertical shear links, according to the research the flanges of the frame beam are severely fractured or buckled, the frame tends to collapse when further loaded, therefore, no more displacement can be imposed on the frame at this drift ratio in reality, when the frame achieves this drift ratio, the structure is defined as reaching the failure point. At a small beam-to-column linear stiffness ratio, the damage of the structure occurs primarily at the beam end, and the entire section of the beam end has strong plastic damage, whereas only a few areas at the column base have plastic damage. With an increase in the beam-to-column linear stiffness ratio, plastic deformation at the beam end decreases while it increases at the column base. When the linear stiffness ratio reaches 2.0
α0, only a few areas of the beam end have yielded, whereas the bottom of the column and the beam–column joint area demonstrate yield and plastic deformation. Although an increase in the beam-to-column linear stiffness ratio is conducive to reducing damage to the frame beam, the damage to the frame column and joint area increased, which is not conducive to achieving the design concept of strong columns and weak beams.
Figure 14 shows the stress nephogram of the concrete slab when the structure fails under different beam-to-column linear stiffness ratios. Variations in the beam-to-column linear stiffness ratio have no discernible effect on the range and degree of cracking of the concrete slab at the beam end. However, as the ratio of beam-to-column linear stiffness increases, the stress in the mid-span region of the concrete slab gradually decreases. When the beam-to-column linear stiffness ratio increases to 2.0
α0, the concrete slab in the mid-span has no cracking area. Therefore, the structure should adopt a larger beam-to-column linear stiffness ratio to reduce cracking of the concrete slab in the middle of the span.
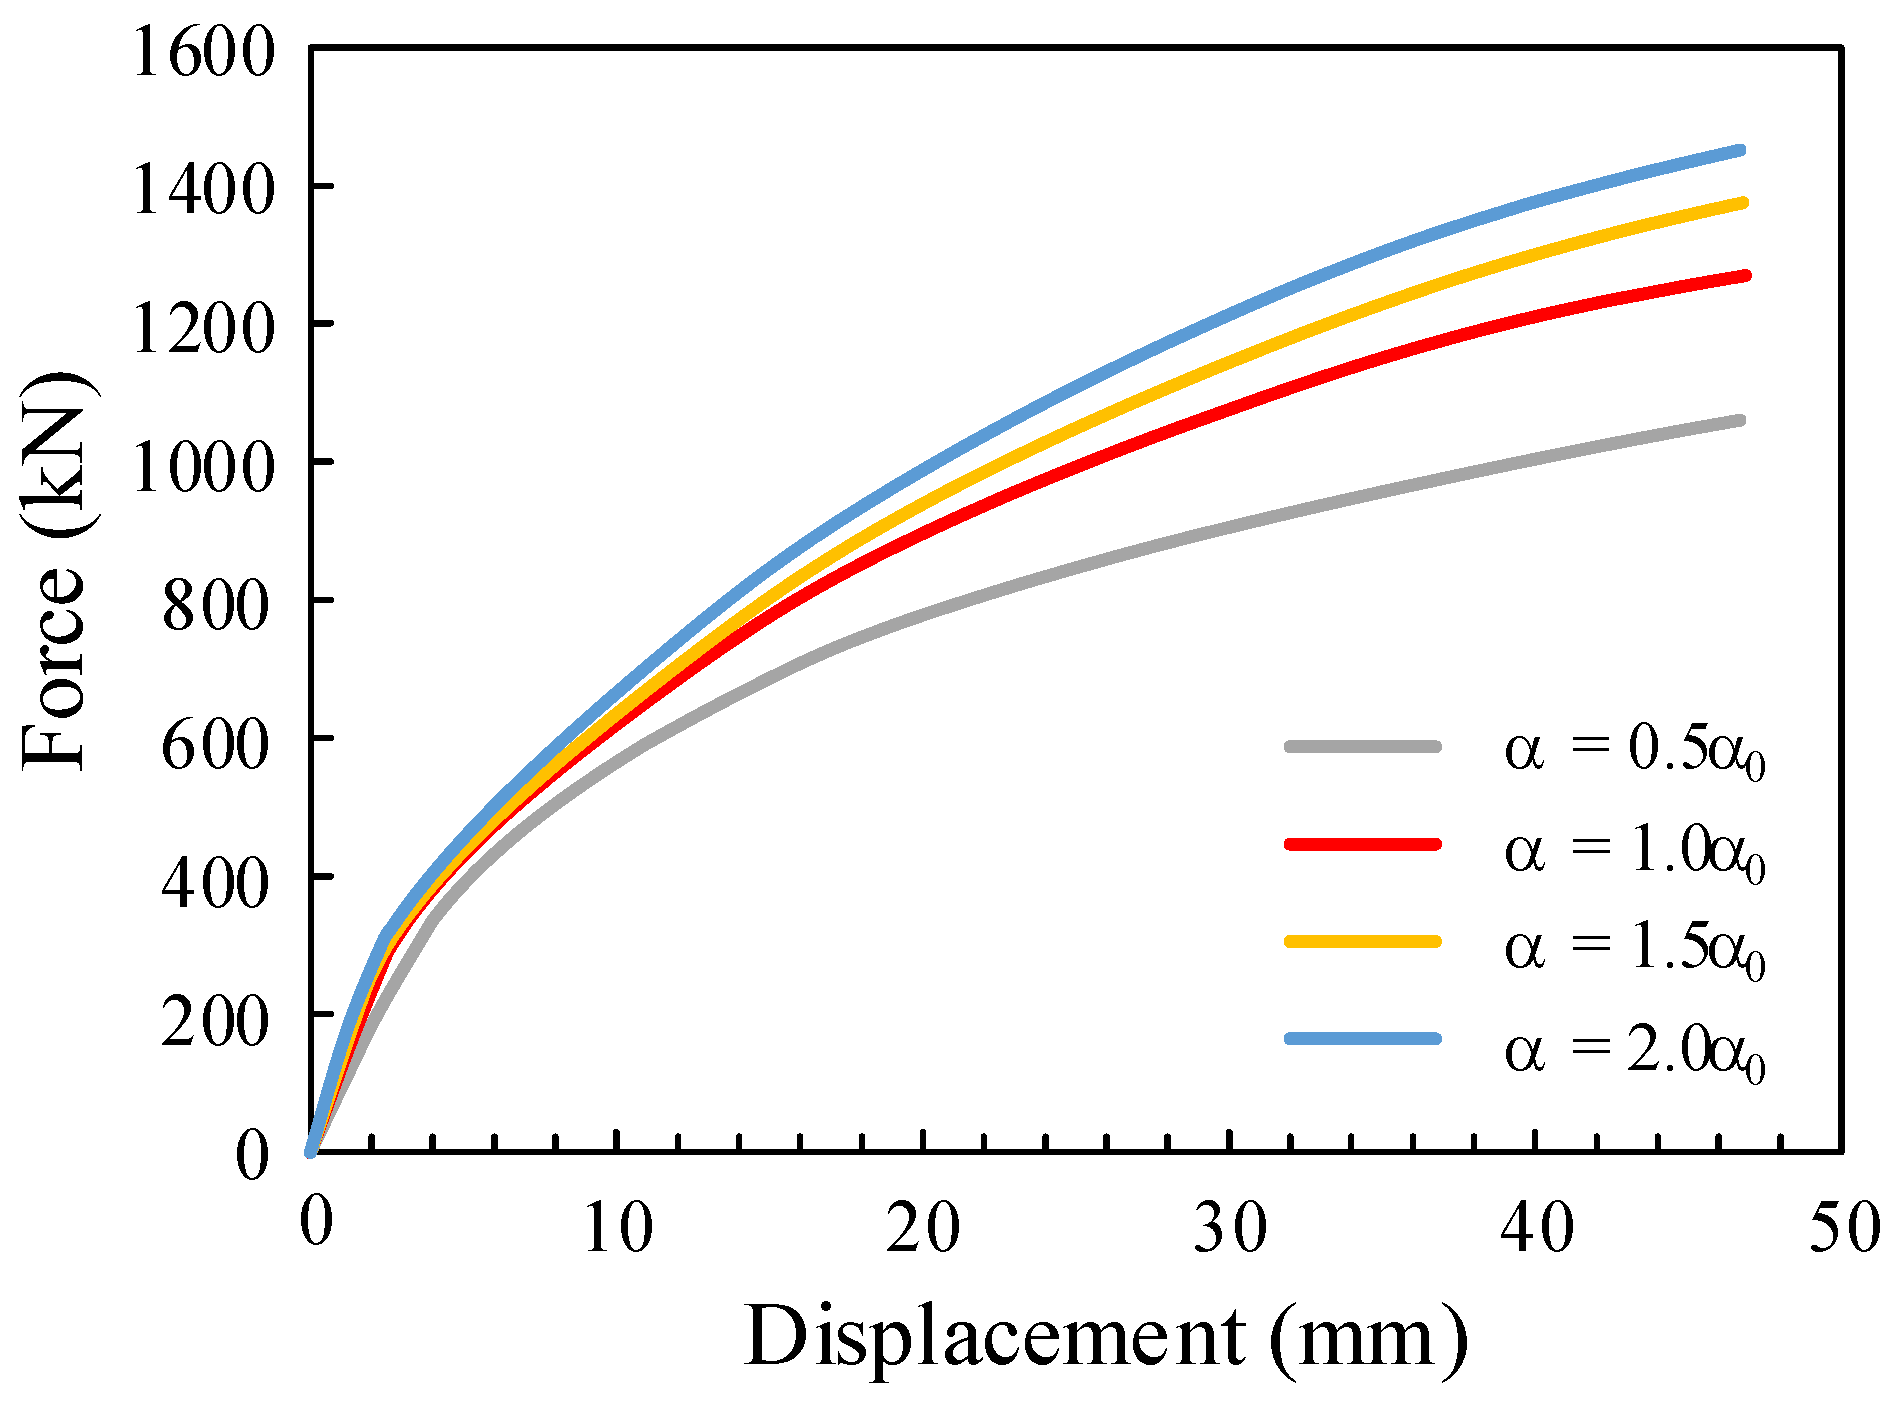
Figure 15 shows the load–displacement curves of the structure under different beam-to-column linear stiffness ratios. It can be seen that the progression of each curve is essentially identical.
Table 4 presents a comparison of the initial stiffness and ultimate bearing capacity obtained from the load–displacement curve of the structure. An increase in the beam-to-column linear stiffness ratio can increase the stiffness and bearing capacity of the structure, but the effect is minimal.
4.2. Shear Link Length
According to the previous studies [
42] and the design provisions of AISC 360-16 [
37], the shear link is classified as short, medium, and long links based on their link length ratio. When the link length ratio is less than 1.6, the shear link is classified as short links, which have the best ductility and energy dissipation capacity under cyclic shear loads. To ensure its seismic performance, the shear link employed here is specially designed with a link length ratio as small as 1.2. In addition, to ensure a ductile behavior of the flange, its slenderness (
bf/2
tf, where
bf and
tf are the width and thickness of the flange) is 3.5, which is smaller than the limited value of 0.30
proposed by the AISC 360-16 [
37], where
E is the elastic modulus of the steel and
Fy is the yield stress. The short shear link is predominantly deformed by shear with excellent deformation performance and ductility. The long shear link has poor deformability and is primarily deformed by bending. In terms of load–displacement curves, the stiffness and bearing capacity of short shear links surpass those of long shear link. The change proportion of stiffness and displacement is positively related to the change proportion of the link length. The
ρ values of test specimens in this paper are designed from 0.6 to 2.40, which corresponds to the typical range of
ρ values in previous studies [
49].
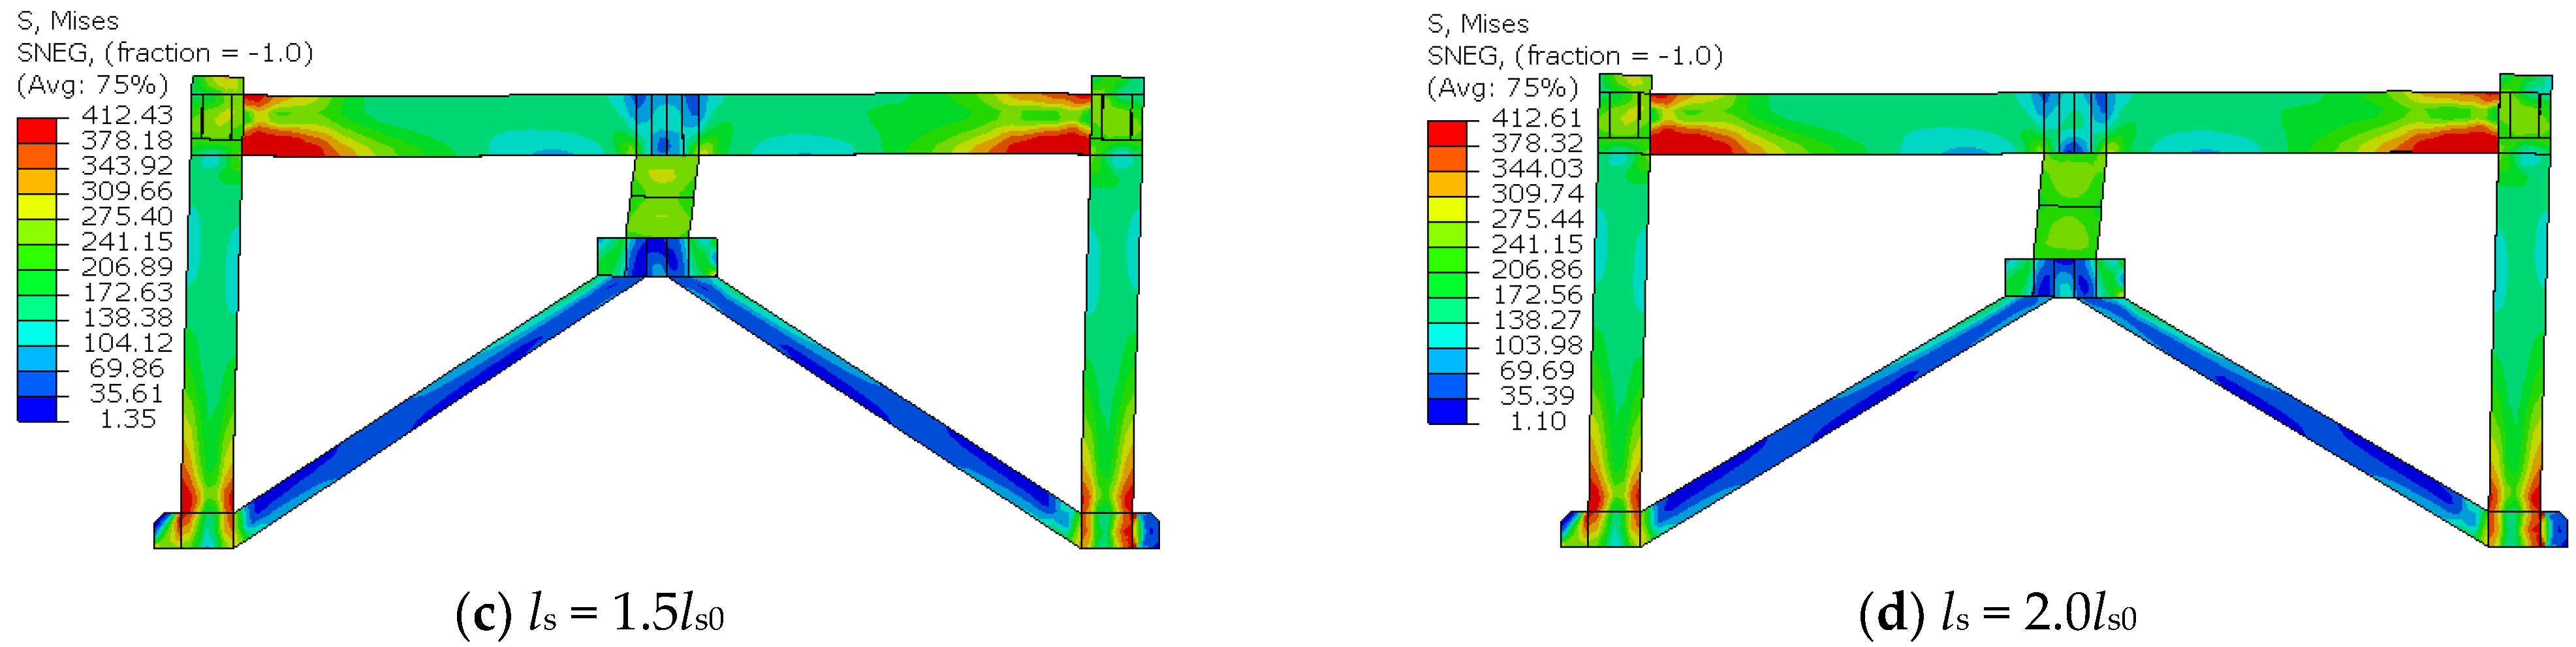
Figure 16 illustrates the stress nephogram of the steel frame when the structure fails under different shear link lengths. The length of the shear link has no discernible effect on the stress distribution at the beam end and bottom of the column. Changes in the shear link length have a considerable impact on the stress state of the mid-span steel beam. At a short shear link length, the stress level of the lower edge of the mid-span steel beam is high, and the stress of the diagonal brace increases slightly. Therefore, when the shear link length is short, the thickness of the lower edge plate in the middle of the steel beam span and the strength of the diagonal brace should be increased proportionally.
Figure 17 depicts the stress nephogram of the concrete slab when the structure fails under different shear link lengths. Variations in the shear link length has no discernible effect on the range and degree of cracking in the concrete slab.
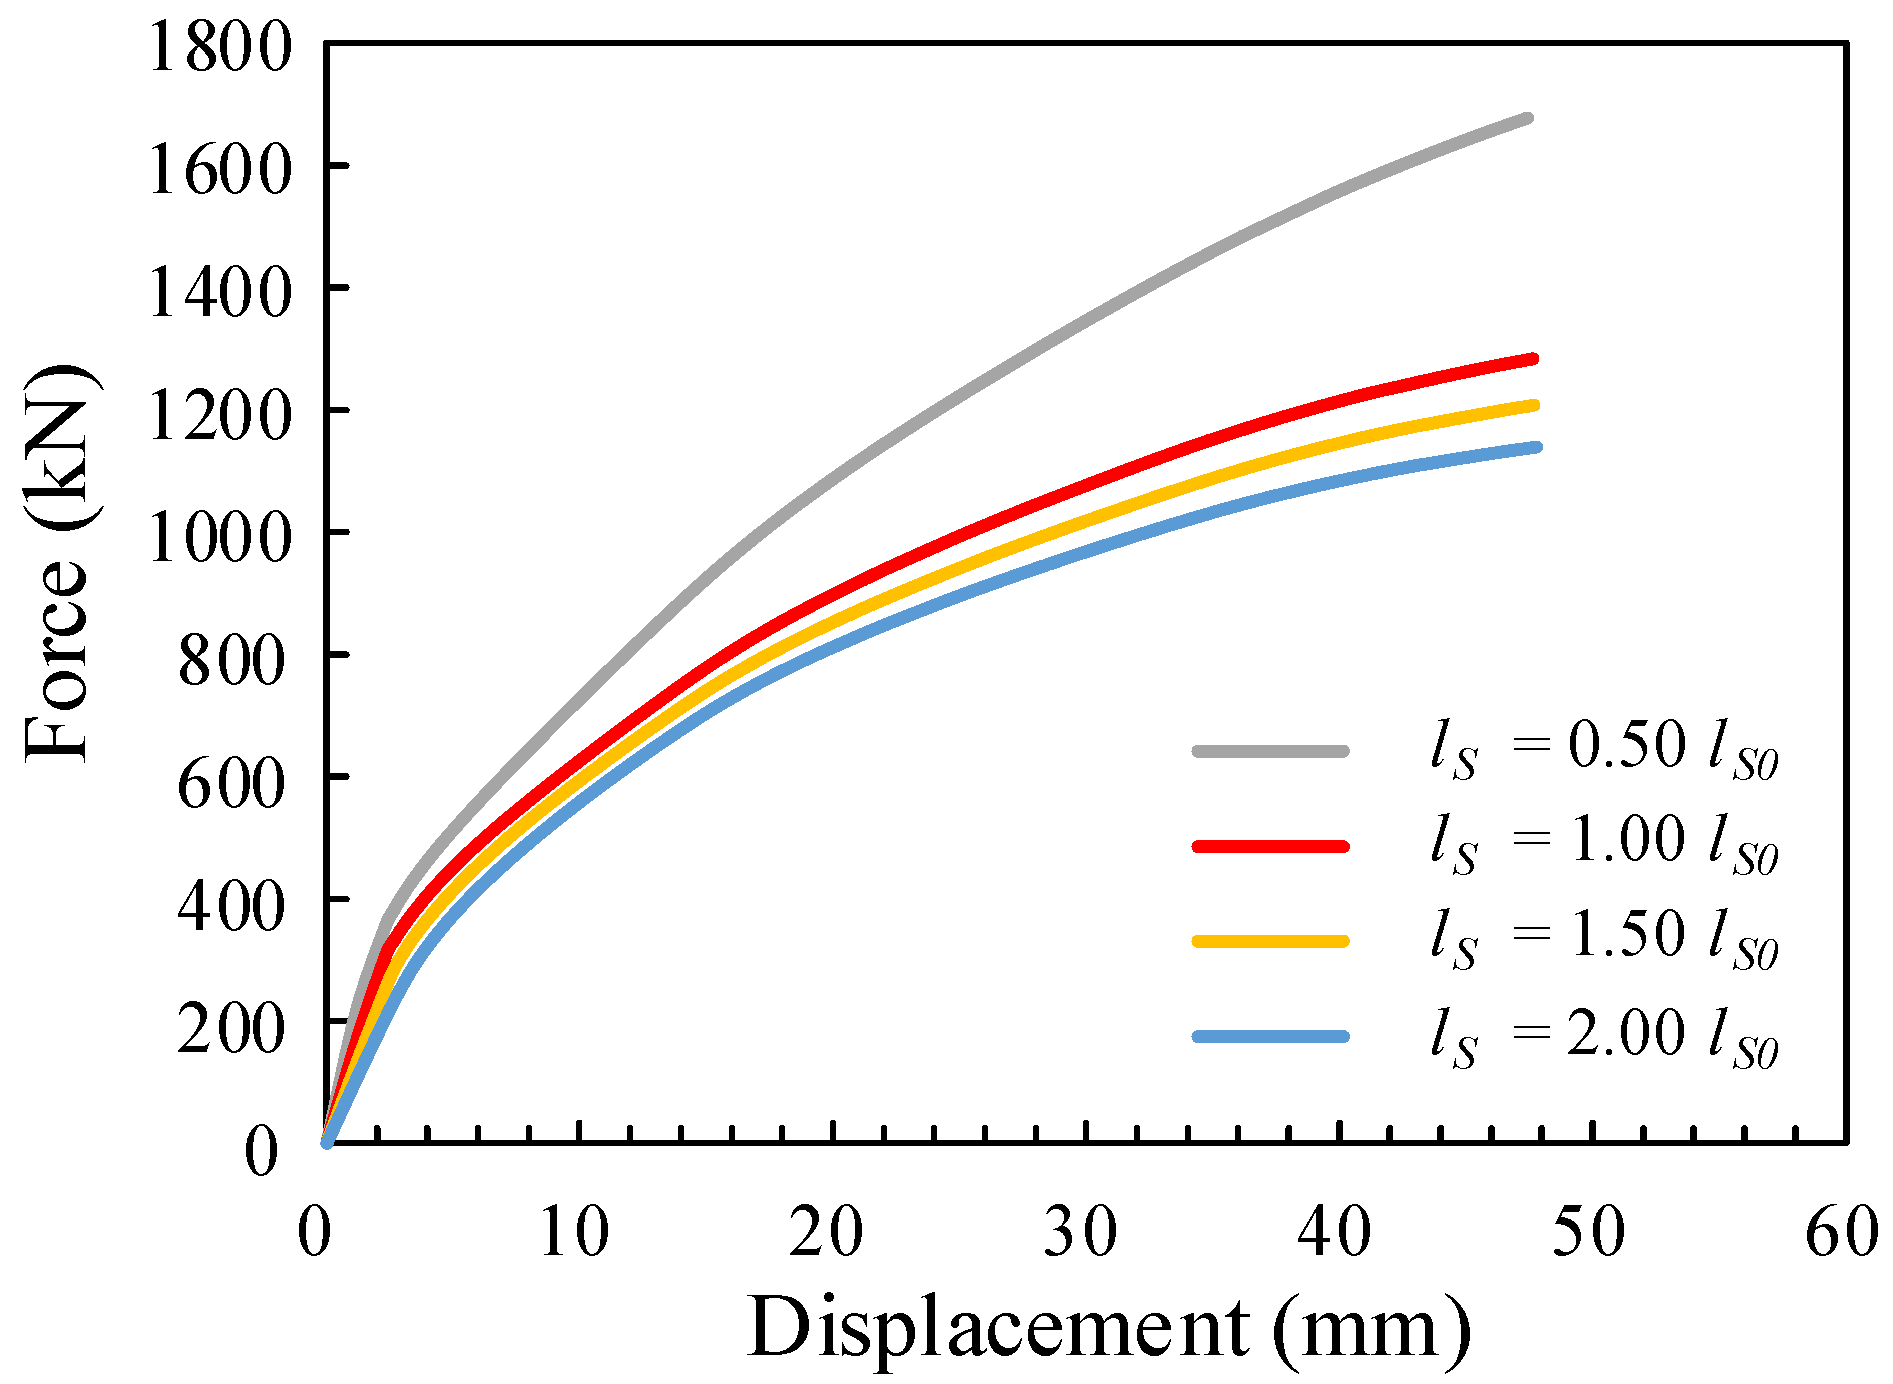
Figure 18 depicts the load–displacement curve of the structure for different shear link lengths; the development trend of each curve is essentially identical.
Table 5 compares the initial stiffness and ultimate bearing capacity of the structural load–displacement curve. The bearing capacity and stiffness of the structure decrease with an increase in the shear link length. When the shear link length exceeds 1.0
ls0, the effect of the shear link length on the structural bearing capacity is weakened. When the shear link length increases to twice the length of the original specimen, the bearing capacity decreased by only a factor of 0.89 compared with that of the original specimen. The effect of the shear link length on the stiffness of the structure is more evident. When the shear link length is reduced from 2.0
ls0 to 0.5
ls0, the stiffness of the structure increased to more than twice its original value.
4.3. Web Width of Shear Link
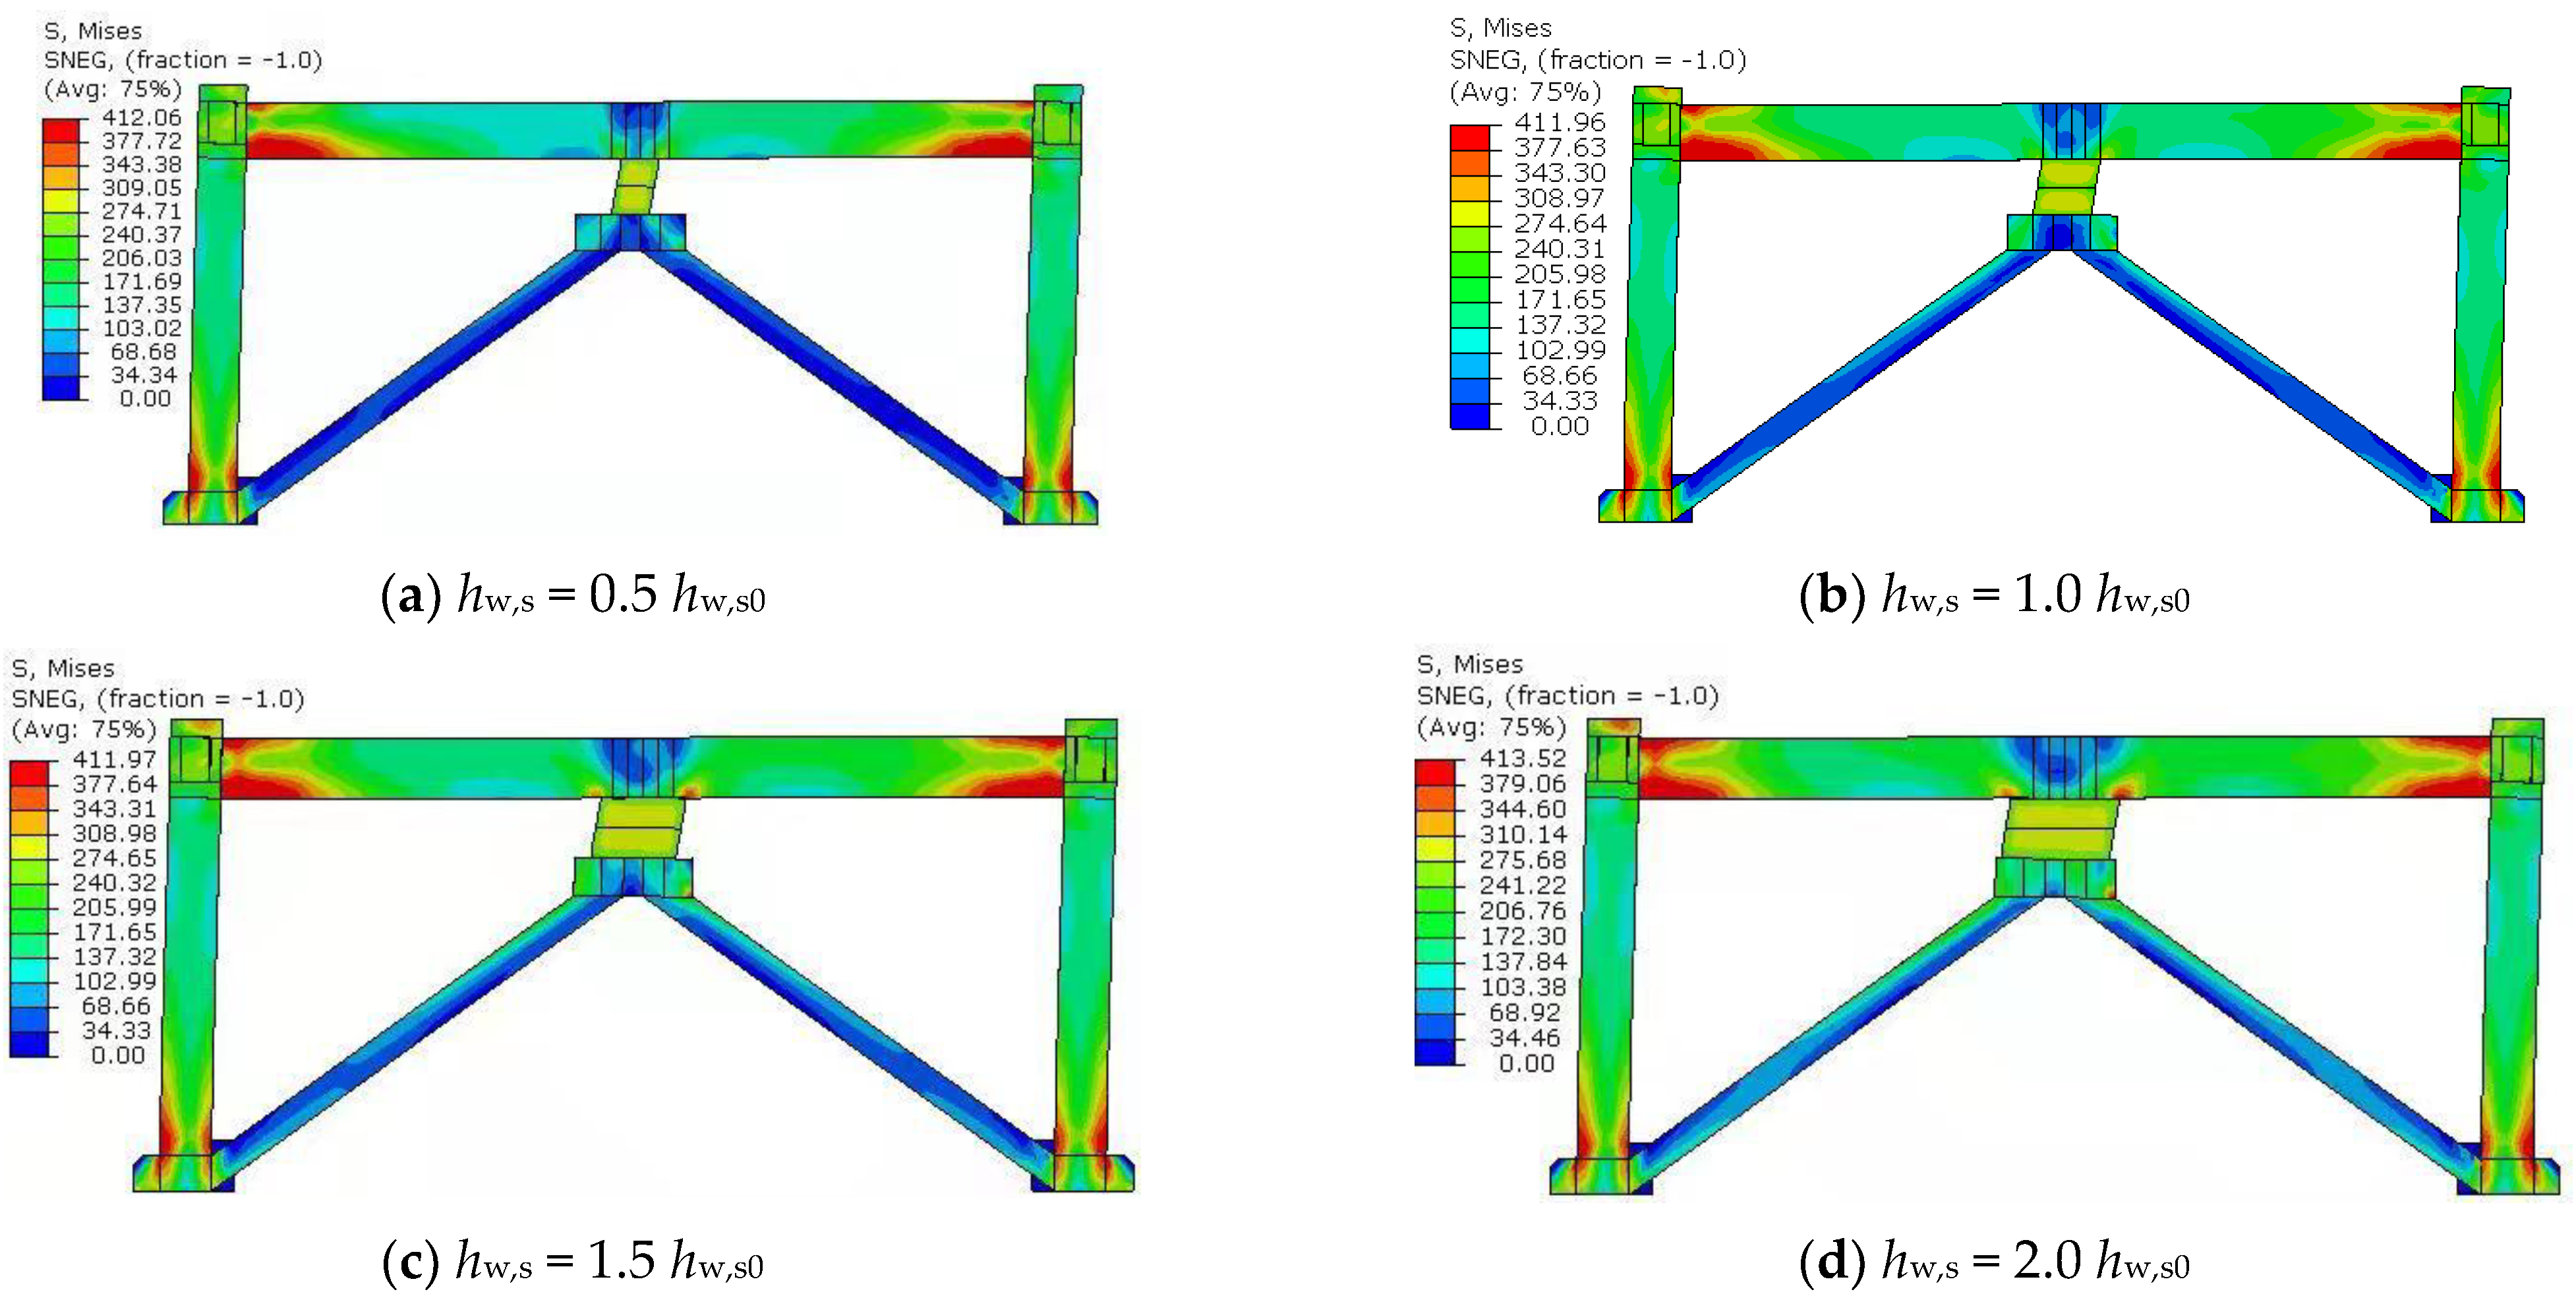
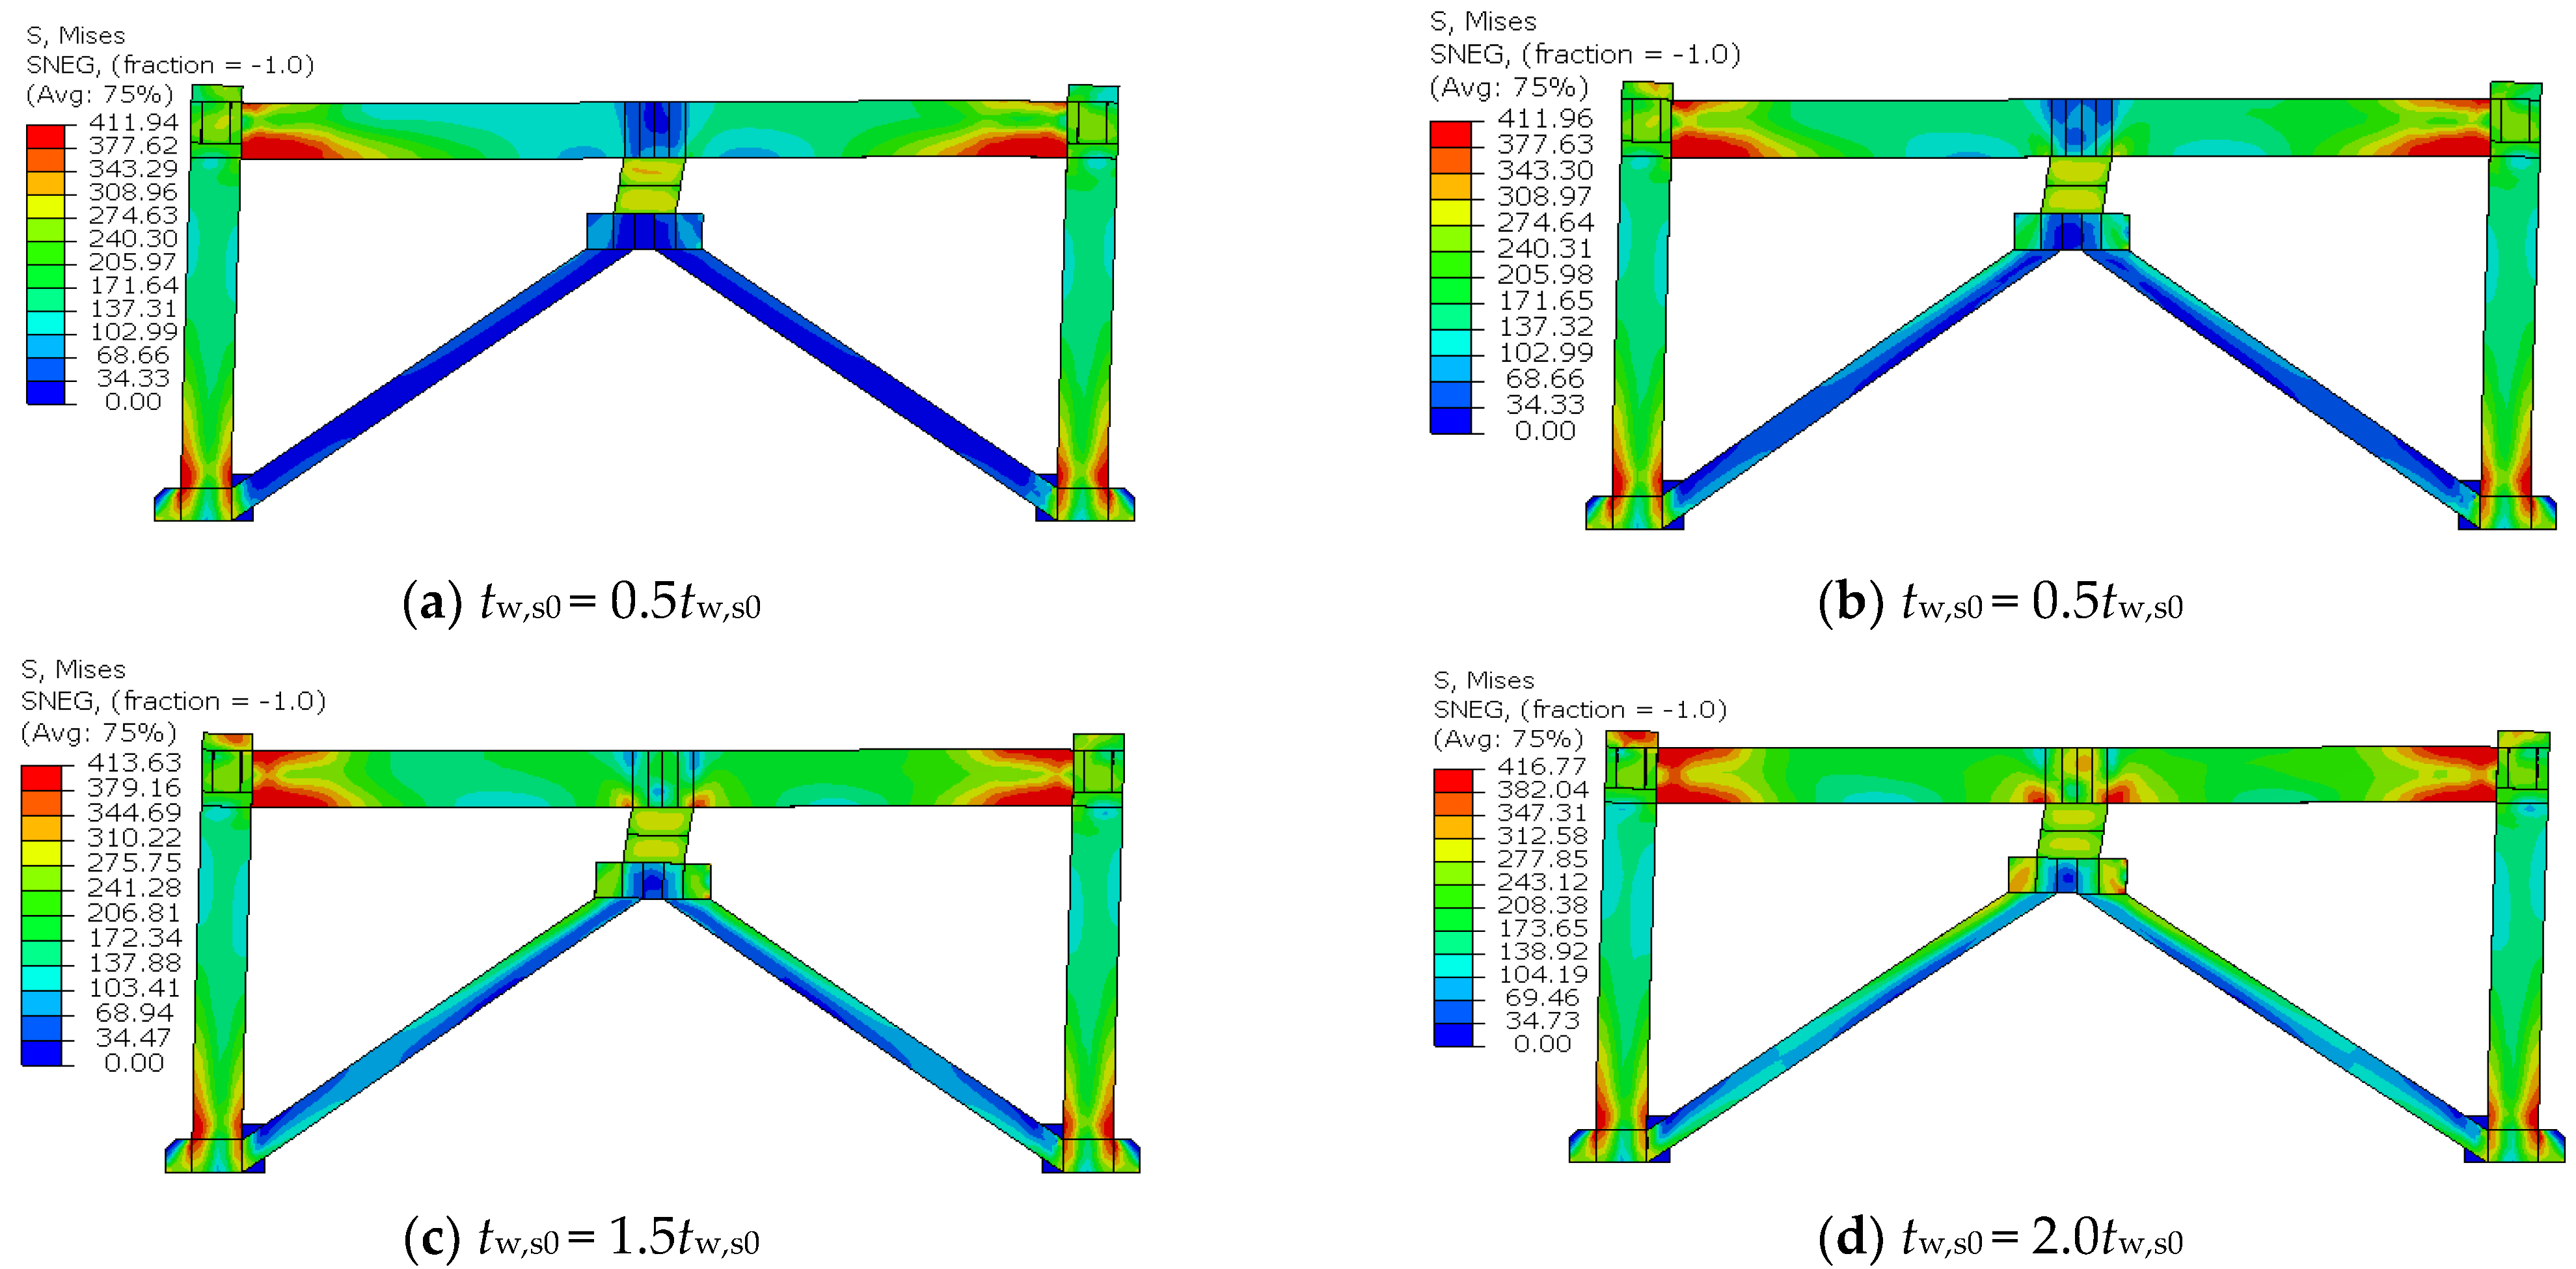
Figure 19 shows the stress nephogram of the steel frame when the structure fails under different shear link web widths. The shear link web width has no discernible effect on the stress distribution at the beam end and column bottom end. Variations in the shear link web width mainly affect the stress state of the mid-span steel beam. The larger the shear link web width, the higher the stress on the lower edge plate of the mid-span steel beam. When the shear link width exceeds 1.0
hw,s0, the frame structure yields at the beam end and column bottom end, and at the lower edge of the steel beam in the middle of the span. In addition, the stress of the diagonal brace increases slightly with an increase in the shear link width. Therefore, when the shear link web width is large, the thickness of the lower edge plate in the middle of the steel beam span and the strength of the diagonal brace should be increased appropriately.
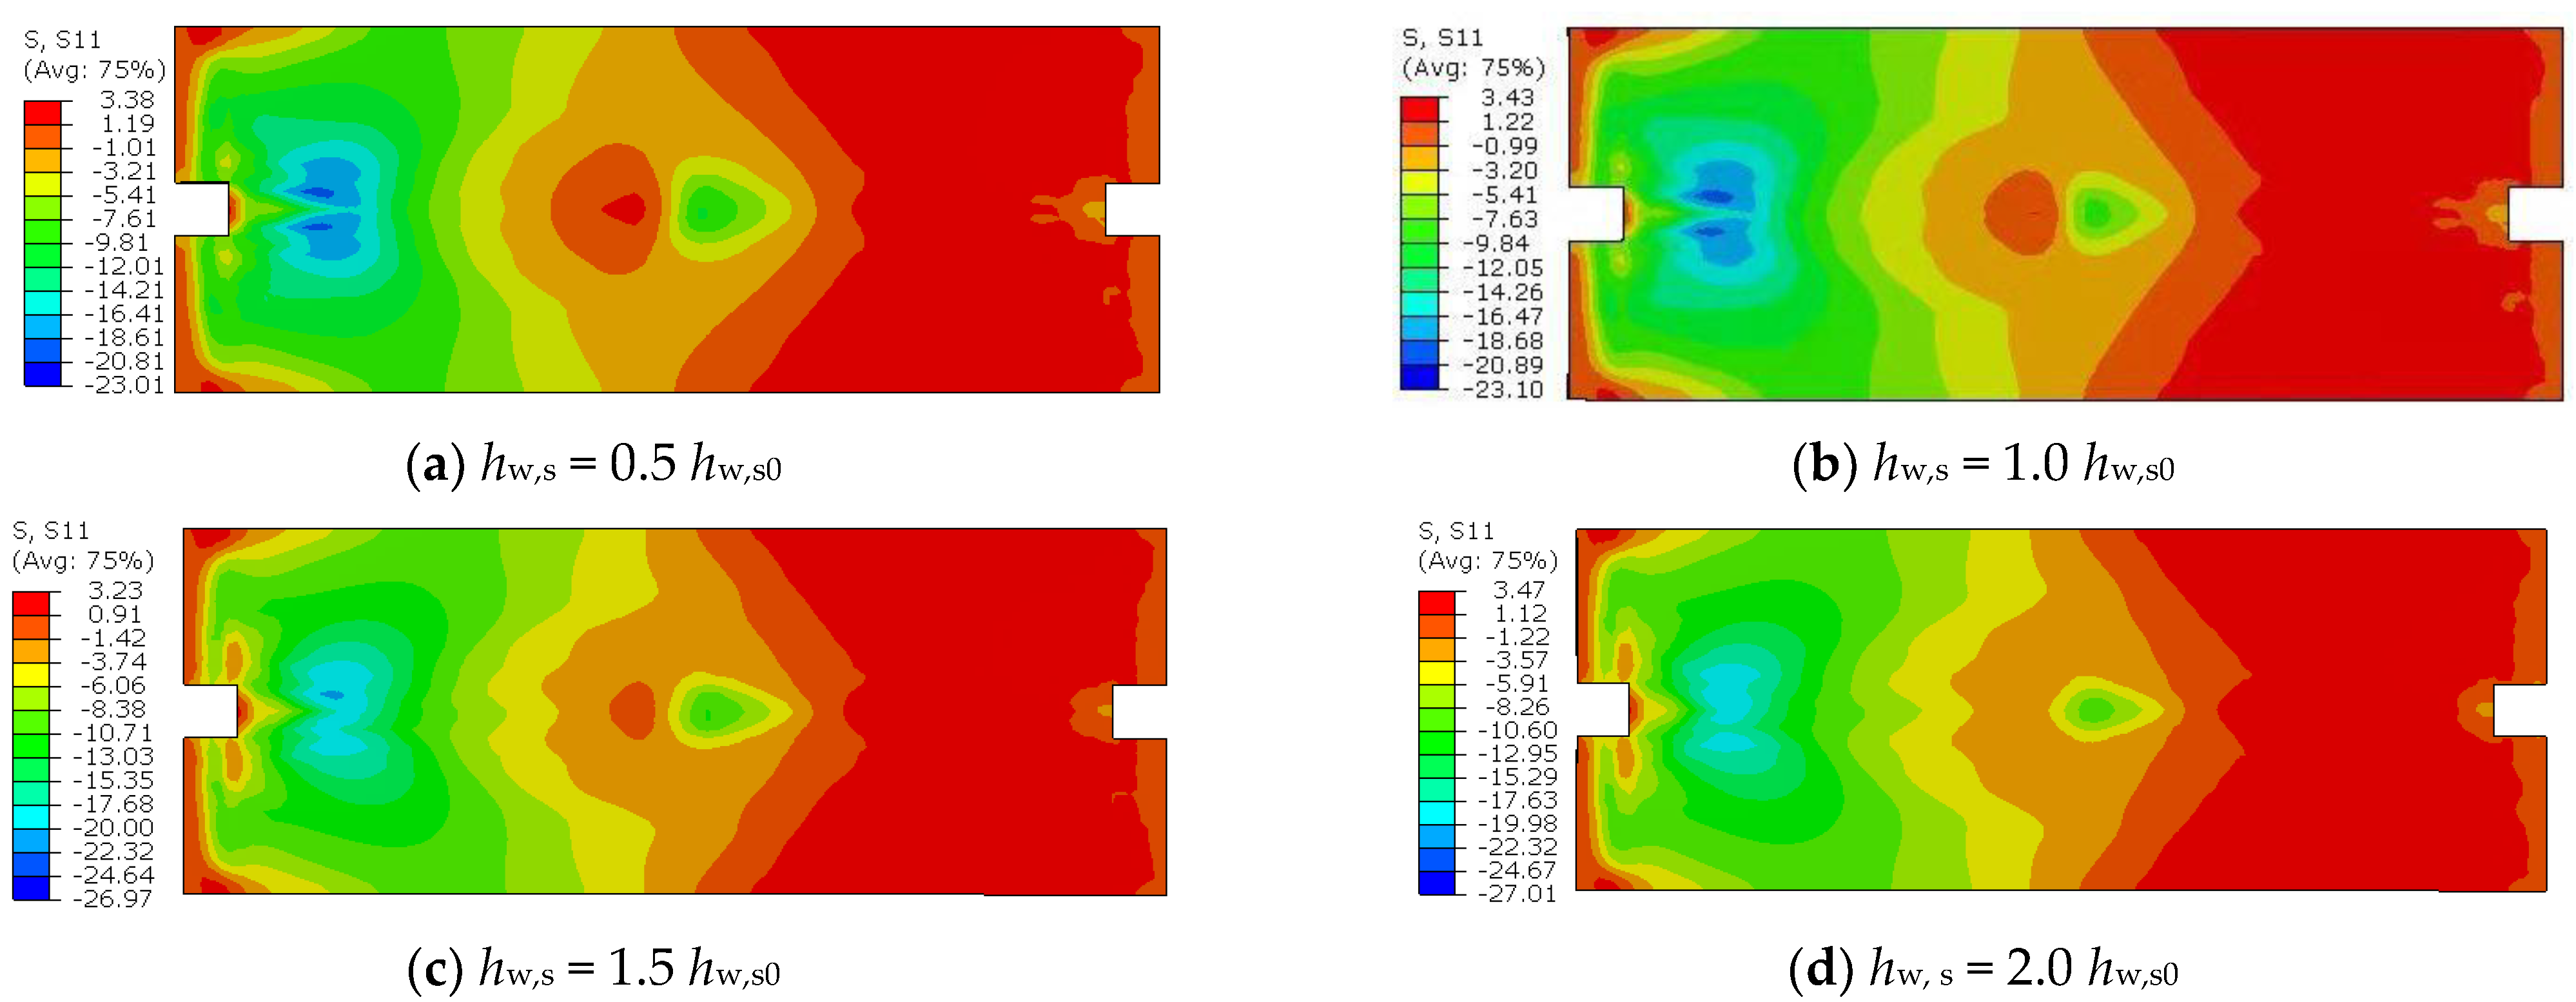
Figure 20 shows the stress nephogram of the concrete slab when the structure fails under different shear link widths. Variations in the shear link width has no effect on the damage of the concrete slab at the beam end; however, increasing the shear link width is conducive to reducing the damage to the concrete slab in the middle of the span. When the shear link width reaches 2.0
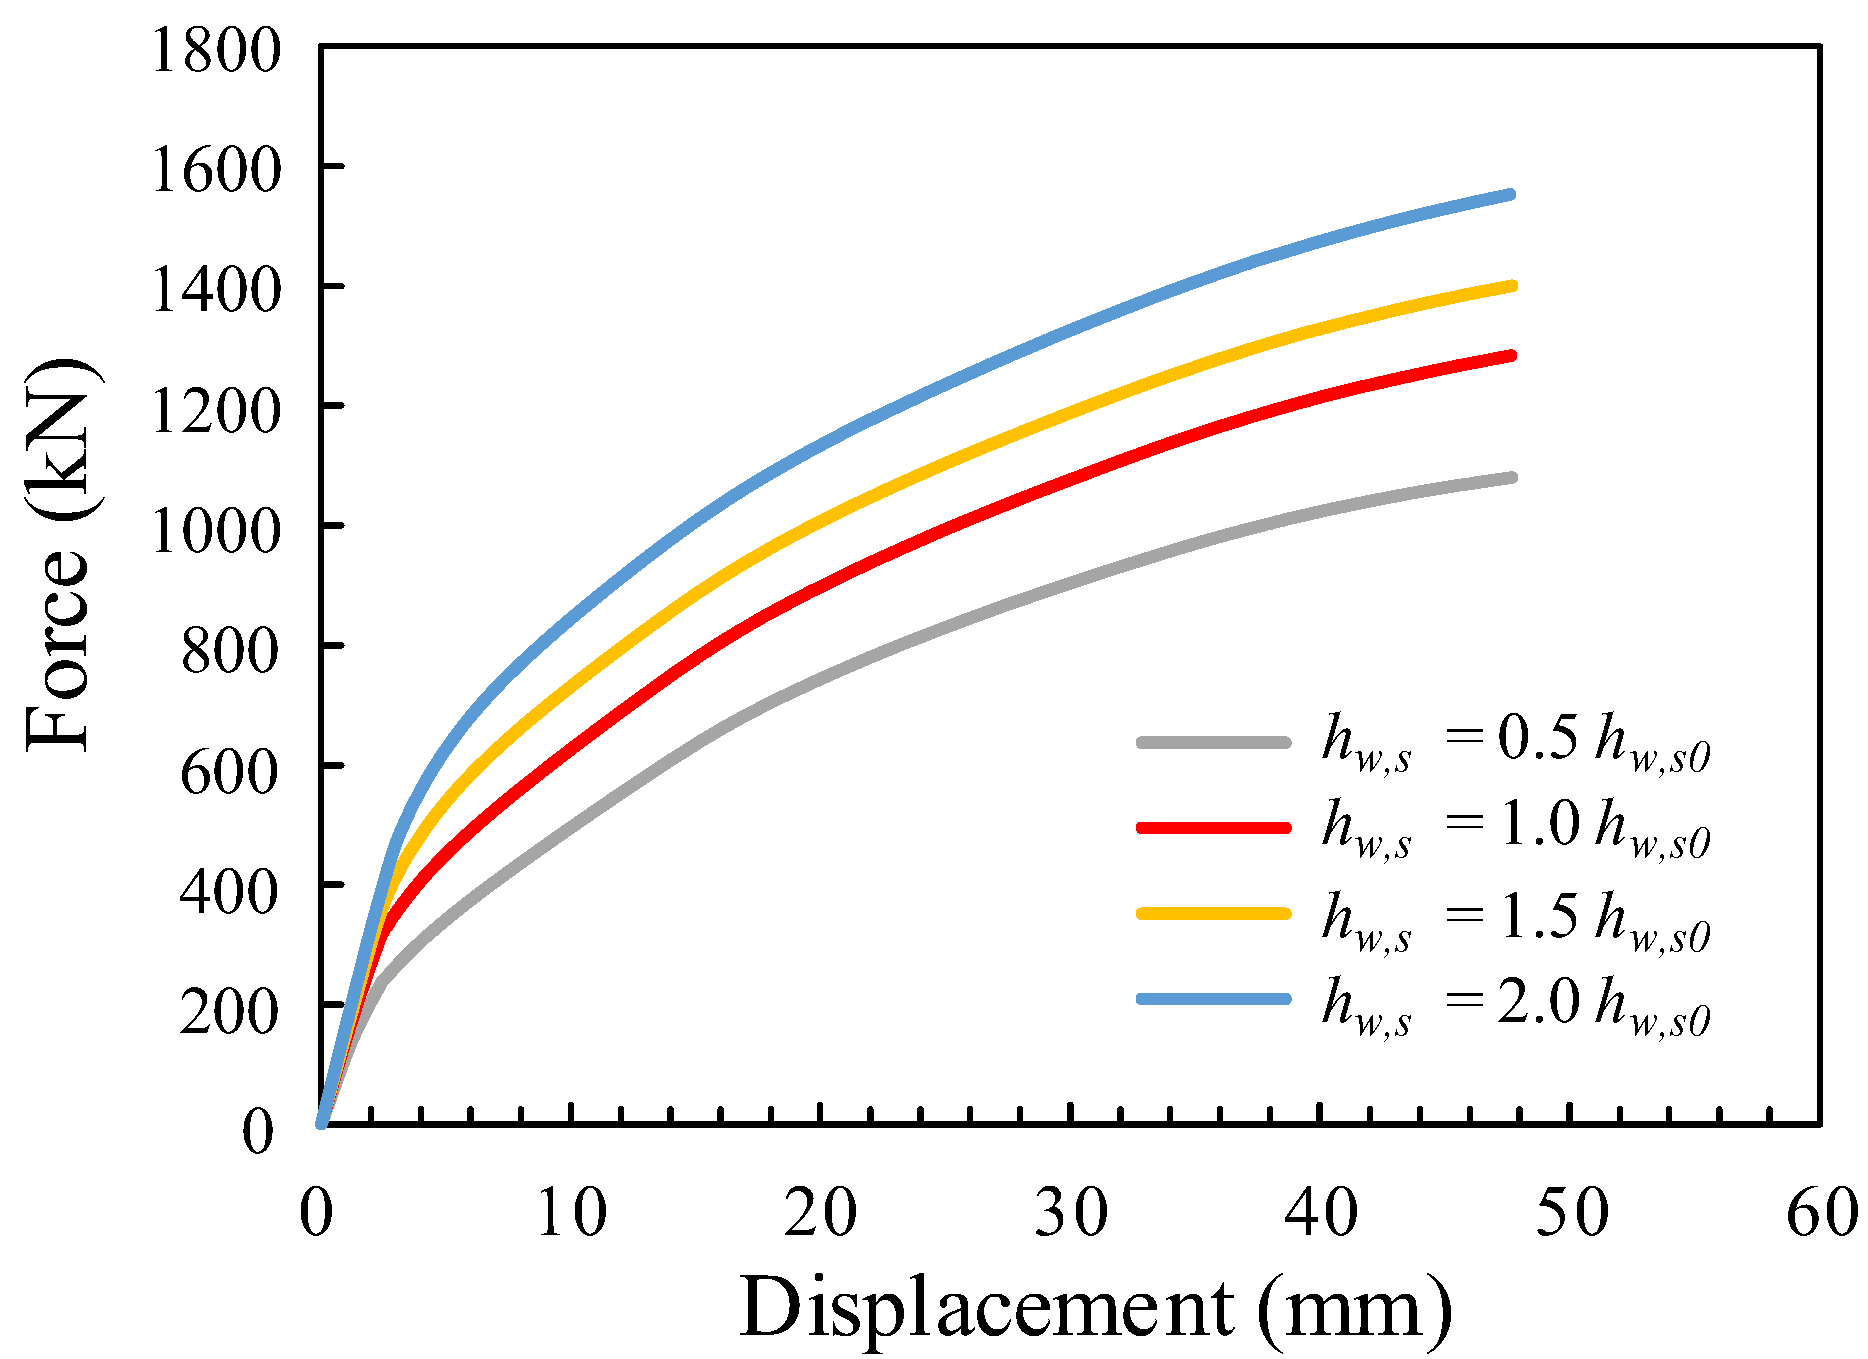
hw,s0, the concrete slab in the middle of the span does not reach the cracking stress, and there is no discernable damage to the concrete slab in the middle of the span.
Figure 21 shows the load–displacement curve of the structure for different shear link widths. The development trend of each curve is essentially identical. The initial stiffness and ultimate bearing capacity of the structural load–displacement curve are presented in
Table 6. Increasing the shear link width can effectively improve the bearing capacity and stiffness of the structure. The change ratio of the bearing capacity to the stiffness of the structure is the same as that of the shear link width.
4.4. Web Thickness of Shear Link
Figure 22 shows the stress nephogram of the steel frame when the structure fails under different shear link web thicknesses. The shear link web thickness has no discernible effect on the stress distribution at the beam end and column bottom end. Variations in the shear link web thickness mainly affect the stress state of the mid-span steel beam. The larger the shear link web thickness, the higher the stress level at the lower edge of the mid-span steel beam. When the shear link web thickness exceeds 1.0
tw,s0, the frame structure yields at the beam end and column bottom end, and at the lower edge of the mid-span steel beam. In addition, an increase in the shear link web thickness leads to a slight increase in the stress of the diagonal brace. When the shear link web thickness increases to 2.0
tw,s0, the junction of the diagonal brace and the connecting beam, and the lower edge of the mid-span steel beam, also yield. Therefore, when the shear link web thickness is large, the thickness of the lower edge plate in the middle of the steel beam span, strength of the connecting beam, and strength of the diagonal brace should be increased appropriately.
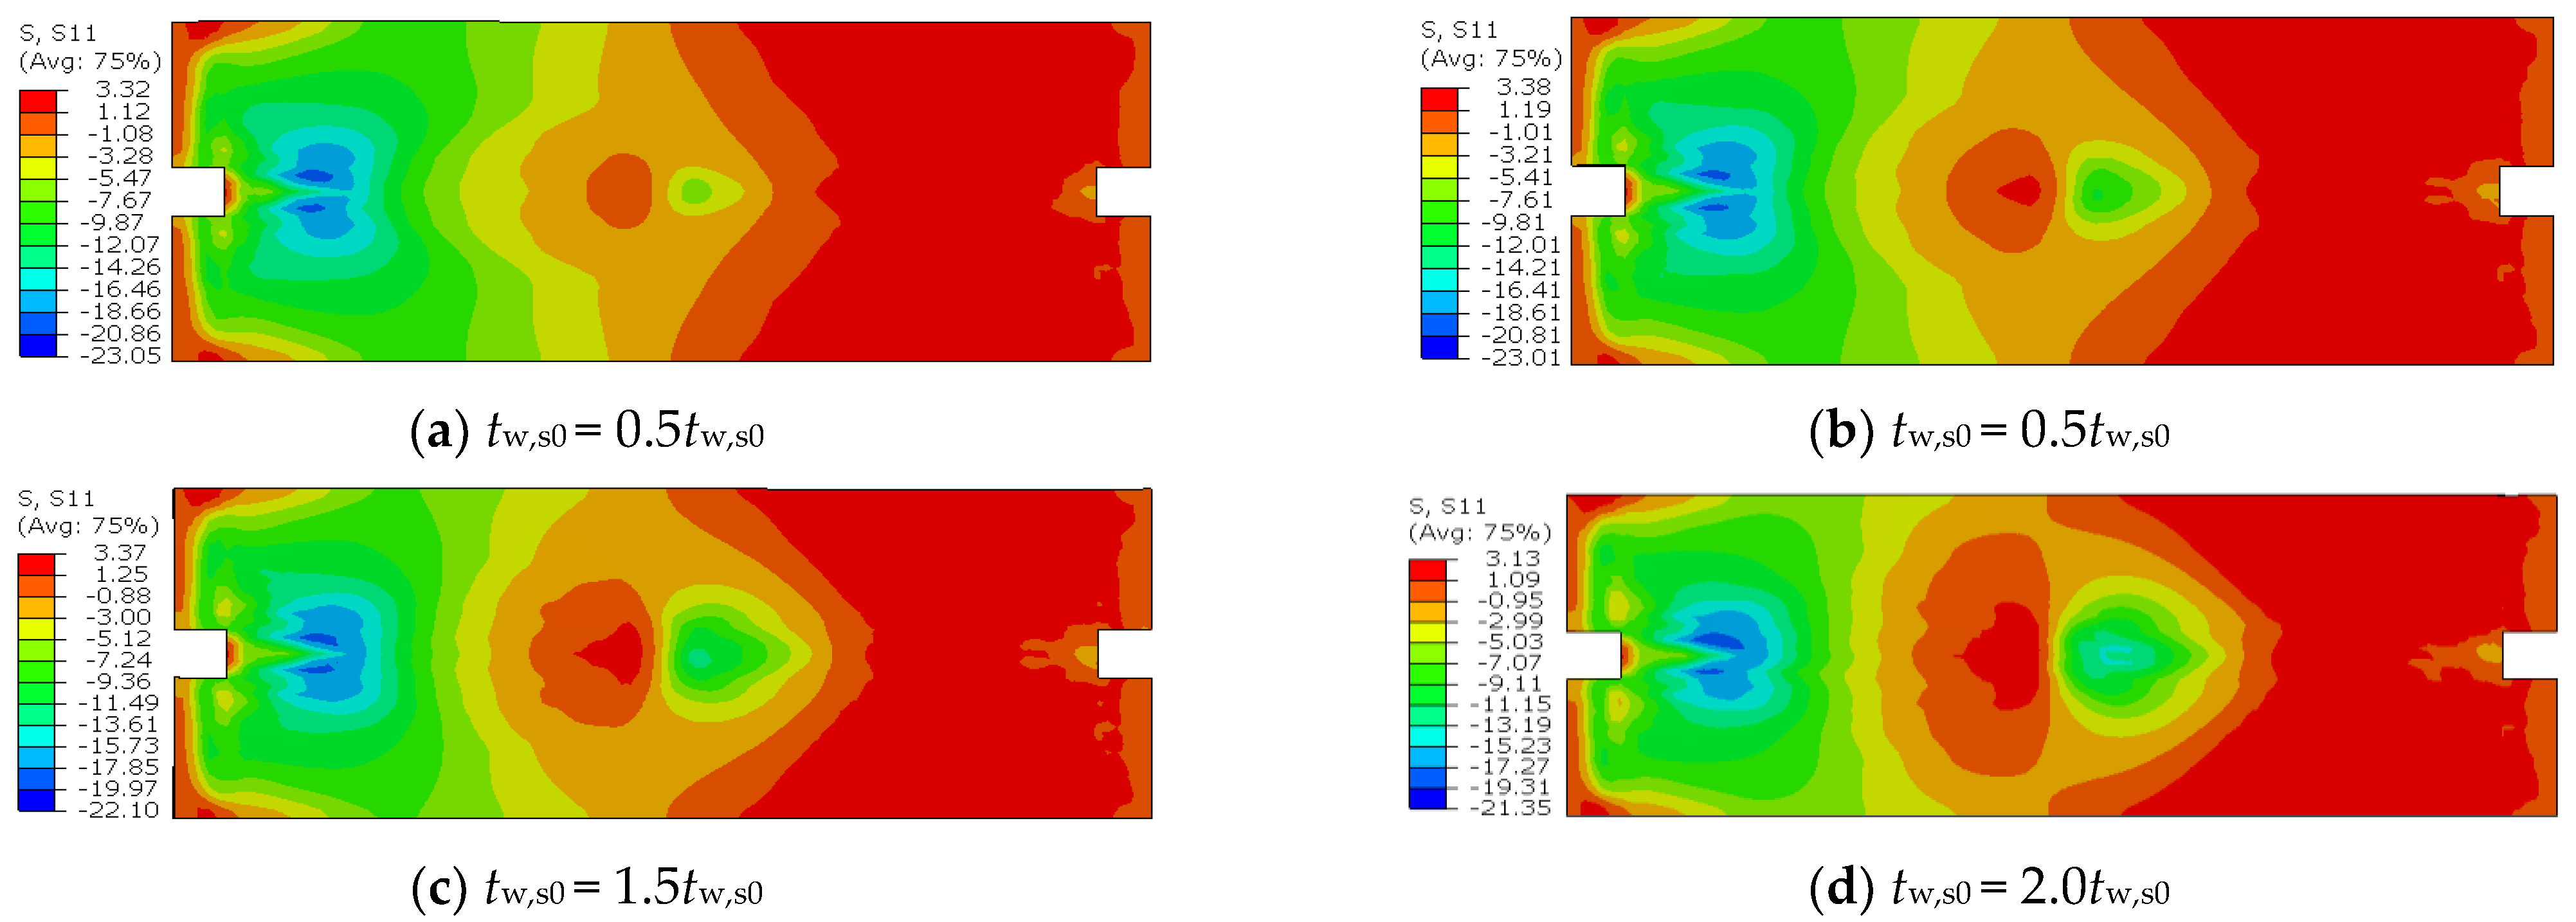
Figure 23 shows the stress nephogram of the concrete slab when the structure fails under different shear link web thicknesses. Variations in the shear link web thickness has no discernible effect on the damage of the concrete slab at the beam end. However, an increase in the shear link web thickness will increase the damage of the concrete slab at the mid-span. When the web thickness is less than 1.0
tw,s0, the damage to the concrete slab at the mid-span is mainly concentrated on both sides of the slab centerline. When the web thickness reaches 2.0
tw,s0, the cracking stress of the concrete slab in the middle of the span reaches the full width.
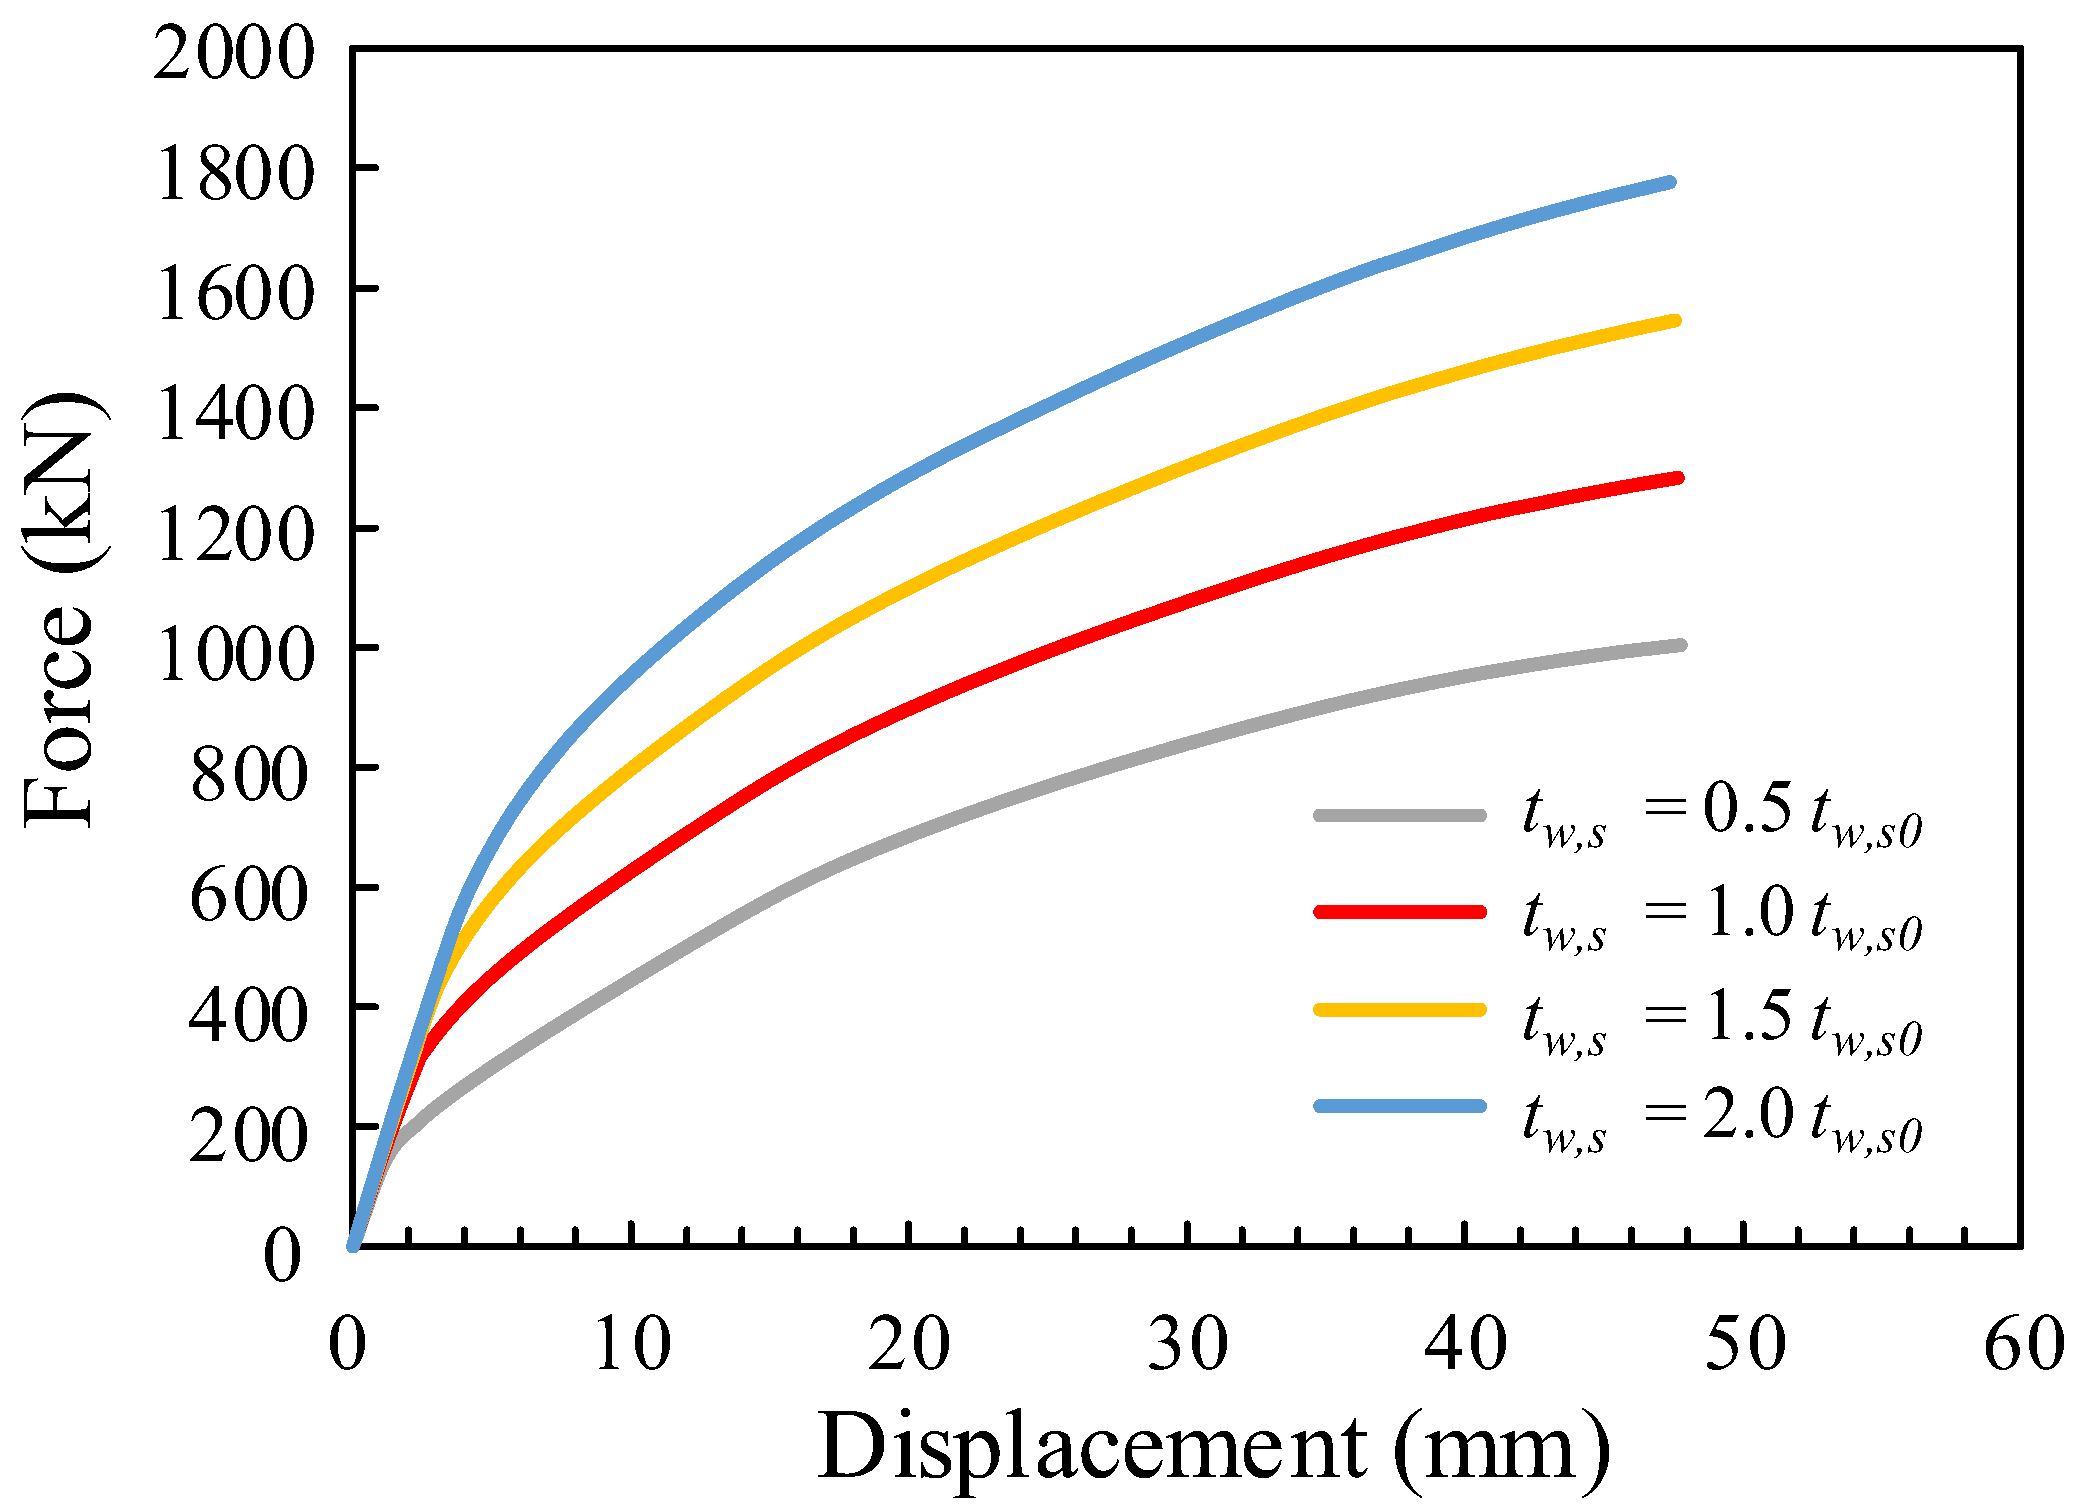
Figure 24 shows the load–displacement curves of the structure for different shear link web thicknesses. The development trend of each curve is essentially identical.
Table 7 presents a comparison of the initial stiffness and ultimate bearing capacity of the structural load–displacement curve. An increase in the shear link web thickness can effectively improve the bearing capacity and stiffness of the structure, and the change ratio of the bearing capacity and stiffness of the structure is the same as that of the shear link width.
4.5. Diagonal Brace Stiffness
The diagonal brace stiffness changes by adjusting the section width or thickness. The thickness is chosen in this study because the joint connection between the diagonal brace and the frame is difficult to achieve if the section width is changed. In addition, the width-to-thickness ratio of the section and the length ratio of the diagonal brace conform to AISC 360-16 [
37]. As a result, local and overall instability will not occur. Simultaneously, no global or local buckling of the brace was observed in the subsequent finite element analysis, indicating that the brace’s parameters are reasonable and the results of the finite element simulation will not be affected by the global and local buckling under compression.
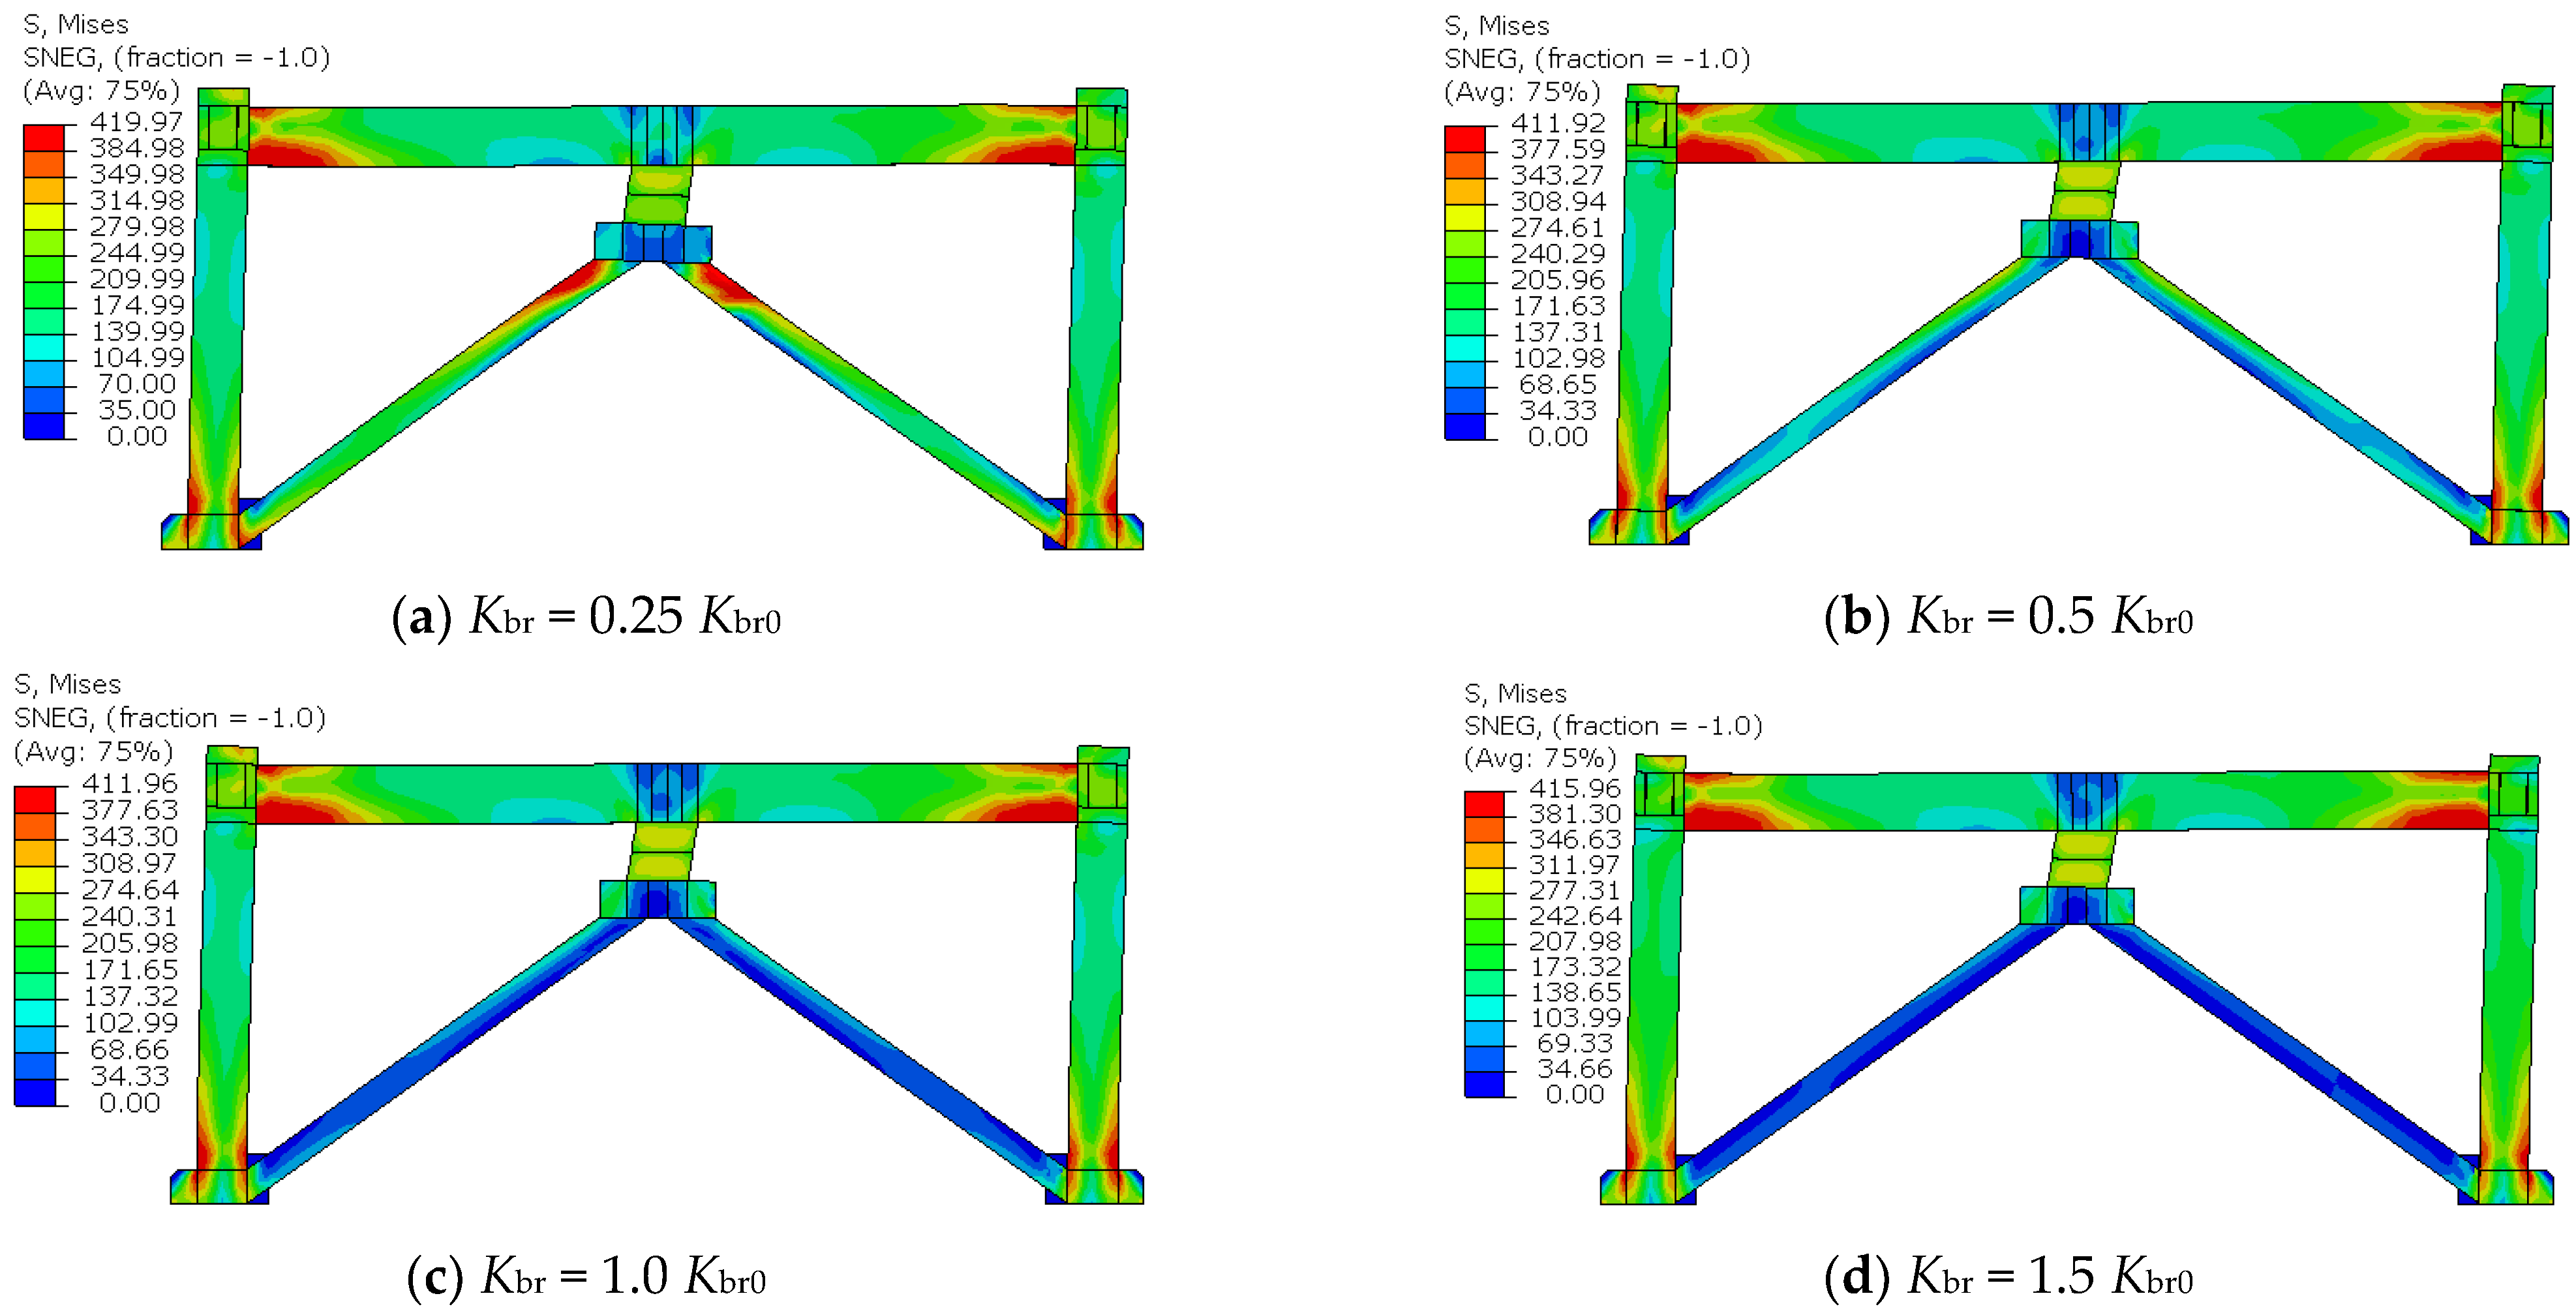
Figure 25 shows the stress nephogram of the steel frame when the structure fails under different diagonal brace stiffnesses. When the diagonal brace stiffness is small, the structure yields at the beam end and column bottom because of the small stiffness of the diagonal brace itself. This indicates that the diagonal brace cannot provide sufficient stable boundary conditions for the shear link for yield energy consumption. The stress level at the end of the frame beam increases gradually with an increase in the diagonal brace stiffness, and the yield range at the end of the frame beam increases significantly when the structure fails. The upper edge of the frame beam also yields significantly, but the stress state of the frame column does not change significantly, and some areas at the bottom of the frame column enter the yield state when the structure fails. In addition, an increase in the diagonal brace stiffness effectively improves its stress state, prevents it from yielding before structural failure, and effectively ensures the expected working mechanism of the vertical shear link.
Figure 26 shows the stress nephogram of the concrete slab when the structure fails under different brace stiffnesses. Variations in the diagonal brace stiffness have no discernible effect on the range and degree of cracking of the concrete slab.
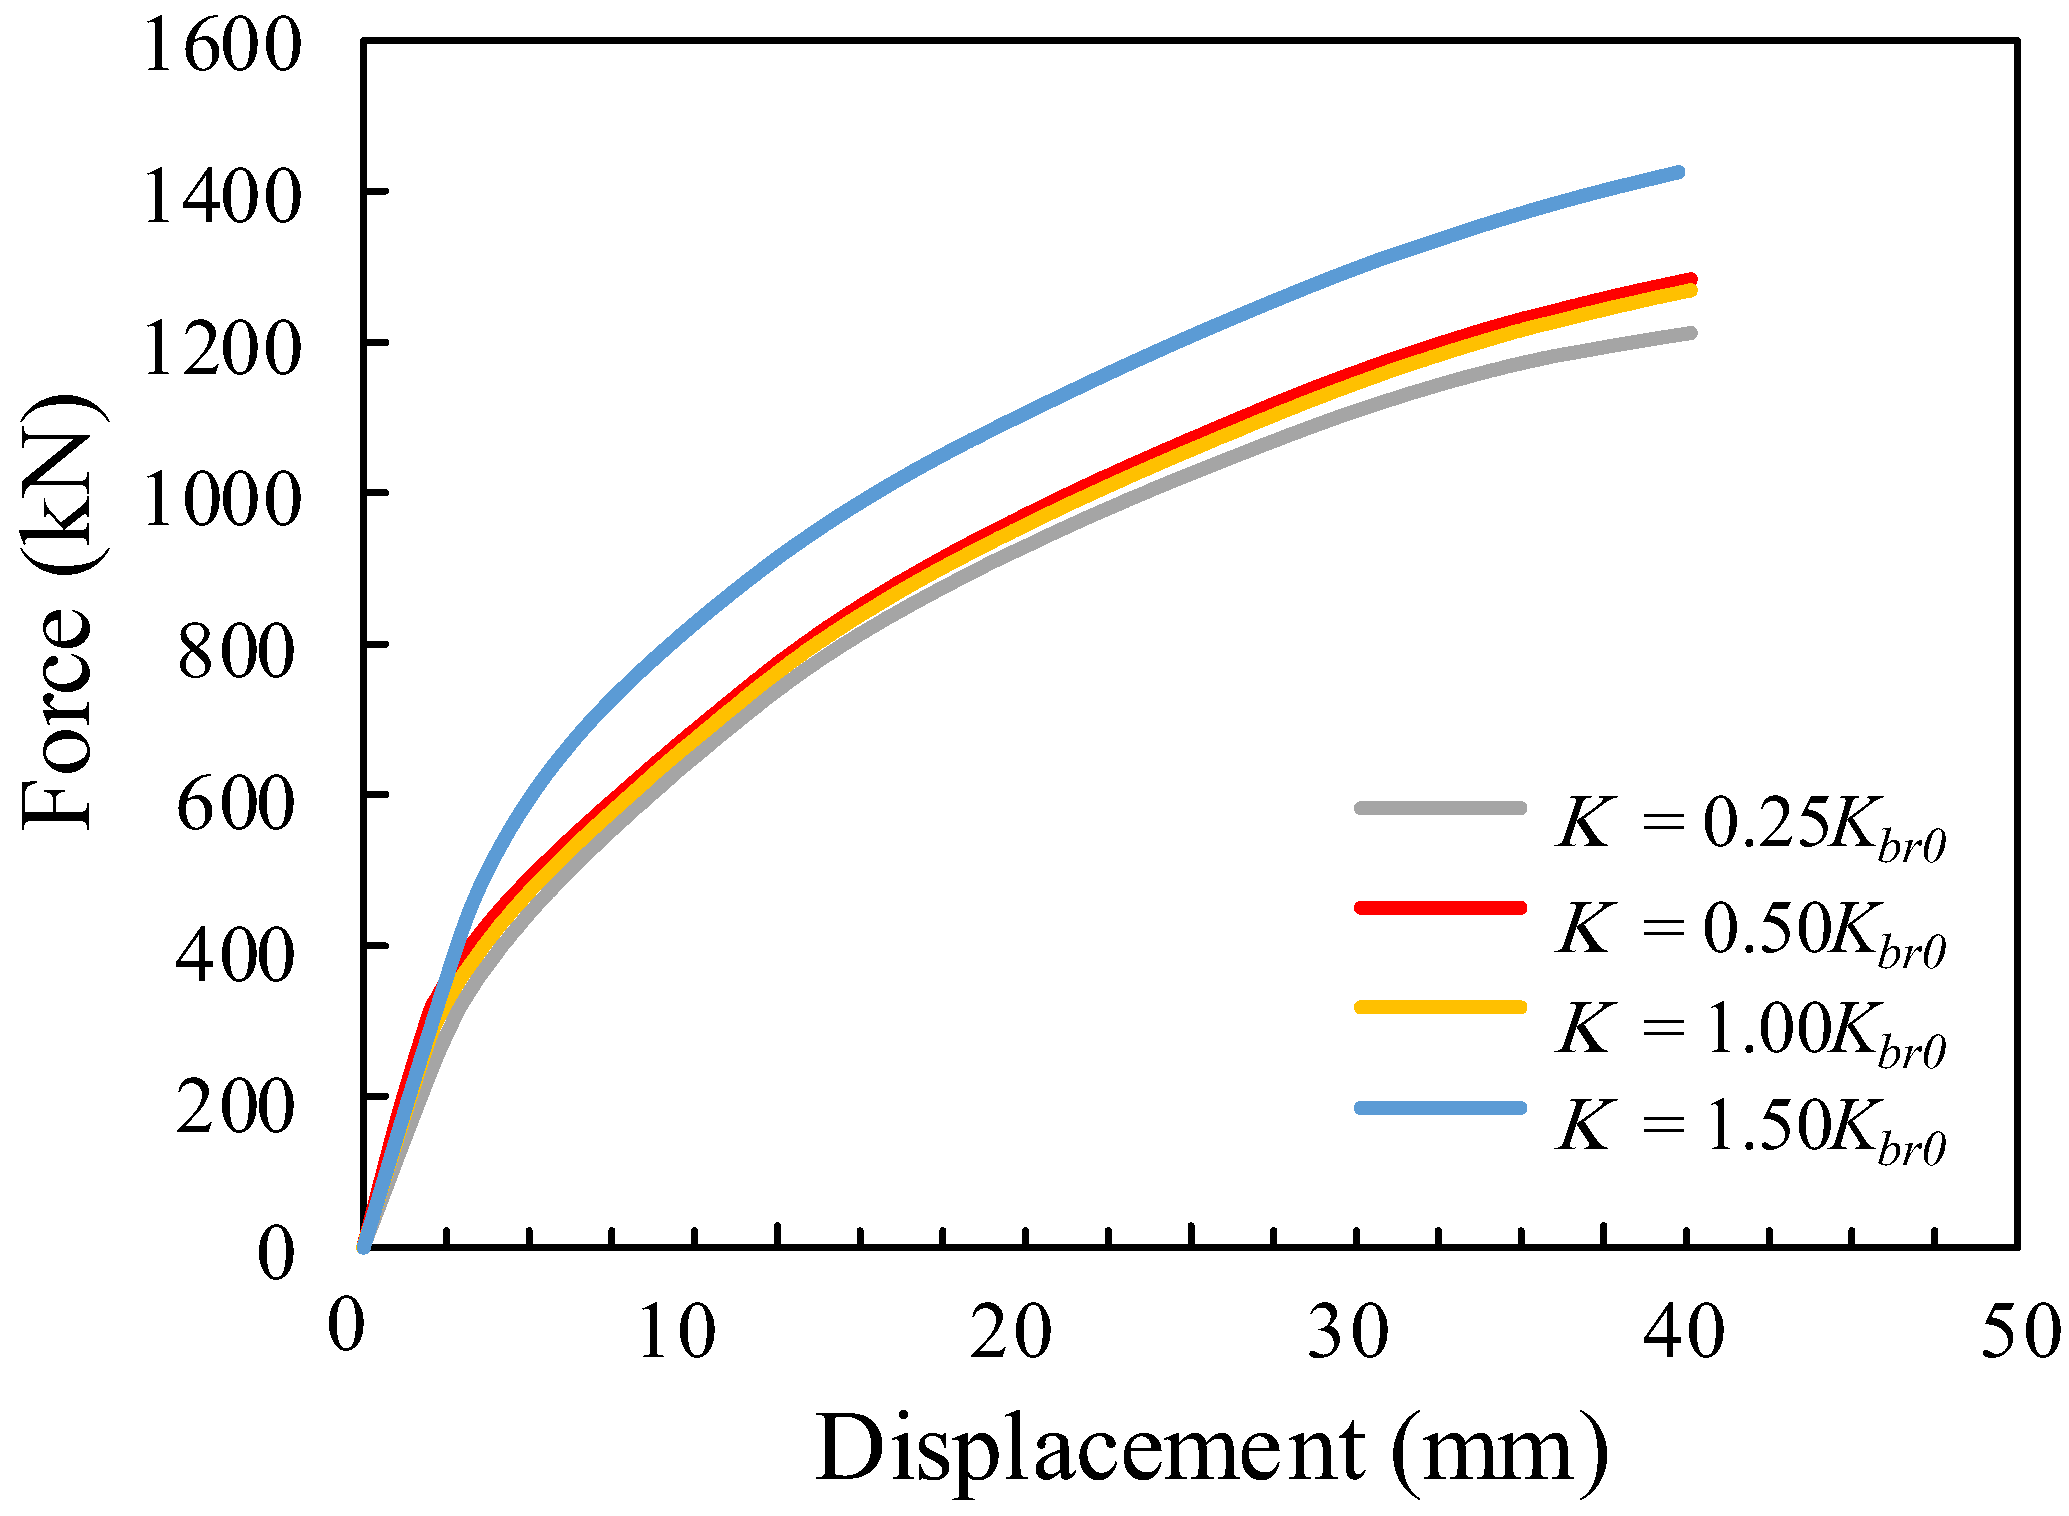
Figure 27 shows the load–displacement curves of the structure for different diagonal brace stiffnesses. The development trend of each curve is essentially identical.
Table 8 presents a comparison of the initial stiffness and ultimate bearing capacity of the load–displacement curve of the structure. The diagonal brace stiffness can effectively improve the stiffness of the structure. When the diagonal brace stiffness is less than 1.0
Kbr0, it has minimal effect on the bearing capacity of the structure; however, when it exceeds 1.0
Kbr0, the bearing capacity of the structure is significantly improved. Therefore, in the design, the diagonal brace stiffness should not be set too small to enhance the bearing capacity, stiffness, and lifting effect of the structure.


