Article

Experimental Study on the Seismic Behavior of Squat SRC Shear Walls with High Axial Load Ratio

1
State Key Laboratory of Subtropical Building Science, South China University of Technology, Guangzhou 510641, China
2
School of Civil Engineering & Transportation, South China University of Technology, Guangzhou 510641, China
*
Author to whom correspondence should be addressed.
Buildings 2022, 12(8), 1238; https://doi.org/10.3390/buildings12081238
Submission received: 6 July 2022 / Revised: 8 August 2022 / Accepted: 10 August 2022 / Published: 14 August 2022
(This article belongs to the Special Issue Steel-Concrete Composite Structures: Design and Construction)

Abstract

:
This paper aims to study the seismic behavior of squat steel-reinforced concrete (SRC) shear walls with a high axial load ratio. Nine squat SRC shear walls with varying axial load ratios, steel ratios, and horizontal distributed reinforcement ratios were tested under lateral cyclic reversed loading and an axial load. The failure process, load-deformation hysteretic response, shear strength, ductility, and the strain of the specimens are reported. The results show that all the specimens failed in shear with the crushing of the web concrete. No axial failure occurred after the web concrete was crushed since the boundary elements encased with structural steel sections maintained the axial load. Larger steel ratios reduced the buckling degree of the structural steel. A larger horizontal distributed reinforcement ratio was clearly beneficial for the ductility and energy dissipation capacity of the specimen, while it had a negligible effect on the shear strength. The Chinese code provided an extremely conservative prediction of the shear strength of the tested squat SRC shear walls with a mean calculated-experimental strength ratio of 0.42. An improved formula was established mainly by the modification of the shear resistance contributed by the concrete and the structural steel, leading to a mean calculated-experimental strength ratio of 0.74. More experimental data are still needed to establish more accurate deformation acceptance criteria for SRC shear walls and to promote the performance-based seismic evaluation of SRC structures.

1. Introduction

Reinforced concrete (RC) shear walls are lateral resistance components widely adopted in buildings because of their sufficient lateral stiffness and load-bearing capacity. Shear walls can be grouped according to the height-to-length aspect ratio (AR). Walls with an AR more than 2.0 are classified generally as slender walls, while those with an AR less than or equal to 2.0 are denoted as squat walls [1]. Squat RC shear walls are frequently used in low-rise buildings, nuclear power plants, and high-rise buildings where the shear walls are arranged at the lower few stories only. However, prior studies have shown that squat RC shear walls fail in a brittle shear manner with rapid strength and stiffness degradation after the peak strength is attained [2,3,4,5,6]. On the other hand, the RC shear walls used in the lower stories are usually subjected to high axial load ratios (ALRs) due to the functional requests. The ALR is crucial to the seismic behavior of the walls. Increasing ALR would reduce the ductility and limit the deformation capacity of the walls [7,8]. In addition, RC shear walls with high ALRs maybe collapse due to the failure of axial bearing capacity, as observed in the 2010 Chile earthquake [9].
To enhance the axial bearing capacity and the seismic behavior of the conventional RC shear walls, encasing structural steel in the wall is an effective approach, leading to the so-called steel-reinforced concrete (SRC) shear walls. The seismic behavior of SRC shear walls has been experimentally studied over recent decades.
Wei et al. [10] tested three SRC low shear walls with an AR of 0.95 and an ALR of 0.29. The results showed that structural steel increased the shear strength of the specimens. Qian et al. [11] and Ji et al. [12] tested six flexural-dominated SRC shear walls with an AR of 2.43 and ALRs of about 0.30. The test program concluded that both the flexural strength and the ultimate drift capacity of SRC walls were higher than those of the RC wall counterpart. The SRC shear walls under a high axial load ratio could reach an ultimate drift ratio of about 1.4%. Zhou et al. [13] studied the behavior of composite shear walls with multi-embedded steel sections at wall boundaries as well as wall middles. The ARs ranged from 0.8 to 3.75. It was concluded that the practice of multi-embedded steel sections in RC walls is a good way to improve the ductility and the energy dissipation capacity of shear walls. However, the axial load ratio of the tested specimens was not more than 0.24. Dan et al. [14,15] conducted an experimental program including five flexural-dominated SRC shear walls with different steel shape arrangements and an RC counterpart. The results showed that the shear walls reinforced by vertical steel sections achieved greater resistance and ductility than simple RC walls. Massone et al. [16] tested three SRC slender walls with an AR of 4. The SRC walls achieved up to and beyond 2% drift ratios without significant lateral strength loss. Ma et al. [17] studied the seismic behavior of eight SRC shear walls with an AR of 2.5 and ALRs of 0.20~0.25. Despite high-strength concrete being adopted, the walls exhibited good deformation capability. Liao et al. [18] investigated the seismic behavior of RC shear walls with SRC boundary columns. It was concluded that the ductility of RC walls with SRC boundary columns is generally superior to that of RC walls with RC boundary columns. Todea et al. [19] conducted a test on three composite shear walls with partially embedded I-shaped steel profiles and central openings. It was concluded that the axial load ratio has a significant effect on the seismic performance of the walls. In short, the above studies have shown that SRC shear walls usually possess better seismic behavior than conventional RC shear walls. Furthermore, regarding aspects of construction, the existence of steel sections in the walls will facilitate the connection between the walls and SRC beams [20].
Reviewing the literature above, past research has focused mainly on slender SRC walls, or squat walls with zero or low ALRs (no more than 0.30). The seismic behavior of squat SRC walls with higher ALRs, such as about 0.35 (approximately corresponding to the design ALR of 0.6, the upper limit of the design ALR for shear walls in the Chinese code), was not involved. Therefore, this research intended to: (1) study the failure modes and seismic behavior of squat SRC walls with higher ALRs (up to 0.35); (2) verify the validity of the encased steel shapes on the axial load capacity of the squat SRC shear walls; and (3) examine the accuracy of the shear strength formula and deformation acceptance criteria in codes and literature for the squat SRC shear walls.
For the above purpose, firstly, this study performs an experimental study on nine squat SRC shear walls subjected to lateral cyclic loading and high ALRs to investigate their seismic behavior. The included variables are the ALR, the steel ratio, and the horizontal distributed reinforcement ratio. The maximum ALR is up to 0.35. The results of lateral load versus lateral deformation hysteretic response, ductility, lateral stiffness degradation, and energy dissipation capacity are reported and discussed. Secondly, the axial load bearing effectiveness after the shear failure of the SRC shear walls is validated by the test results. Thirdly, the shear strength formula of the Chinese code and those proposed by other researchers are also evaluated. Finally, the deformation capacity of the test specimens is evaluated by the acceptance criteria of the ASCE 41-17 provisions.

2. Experimental Program

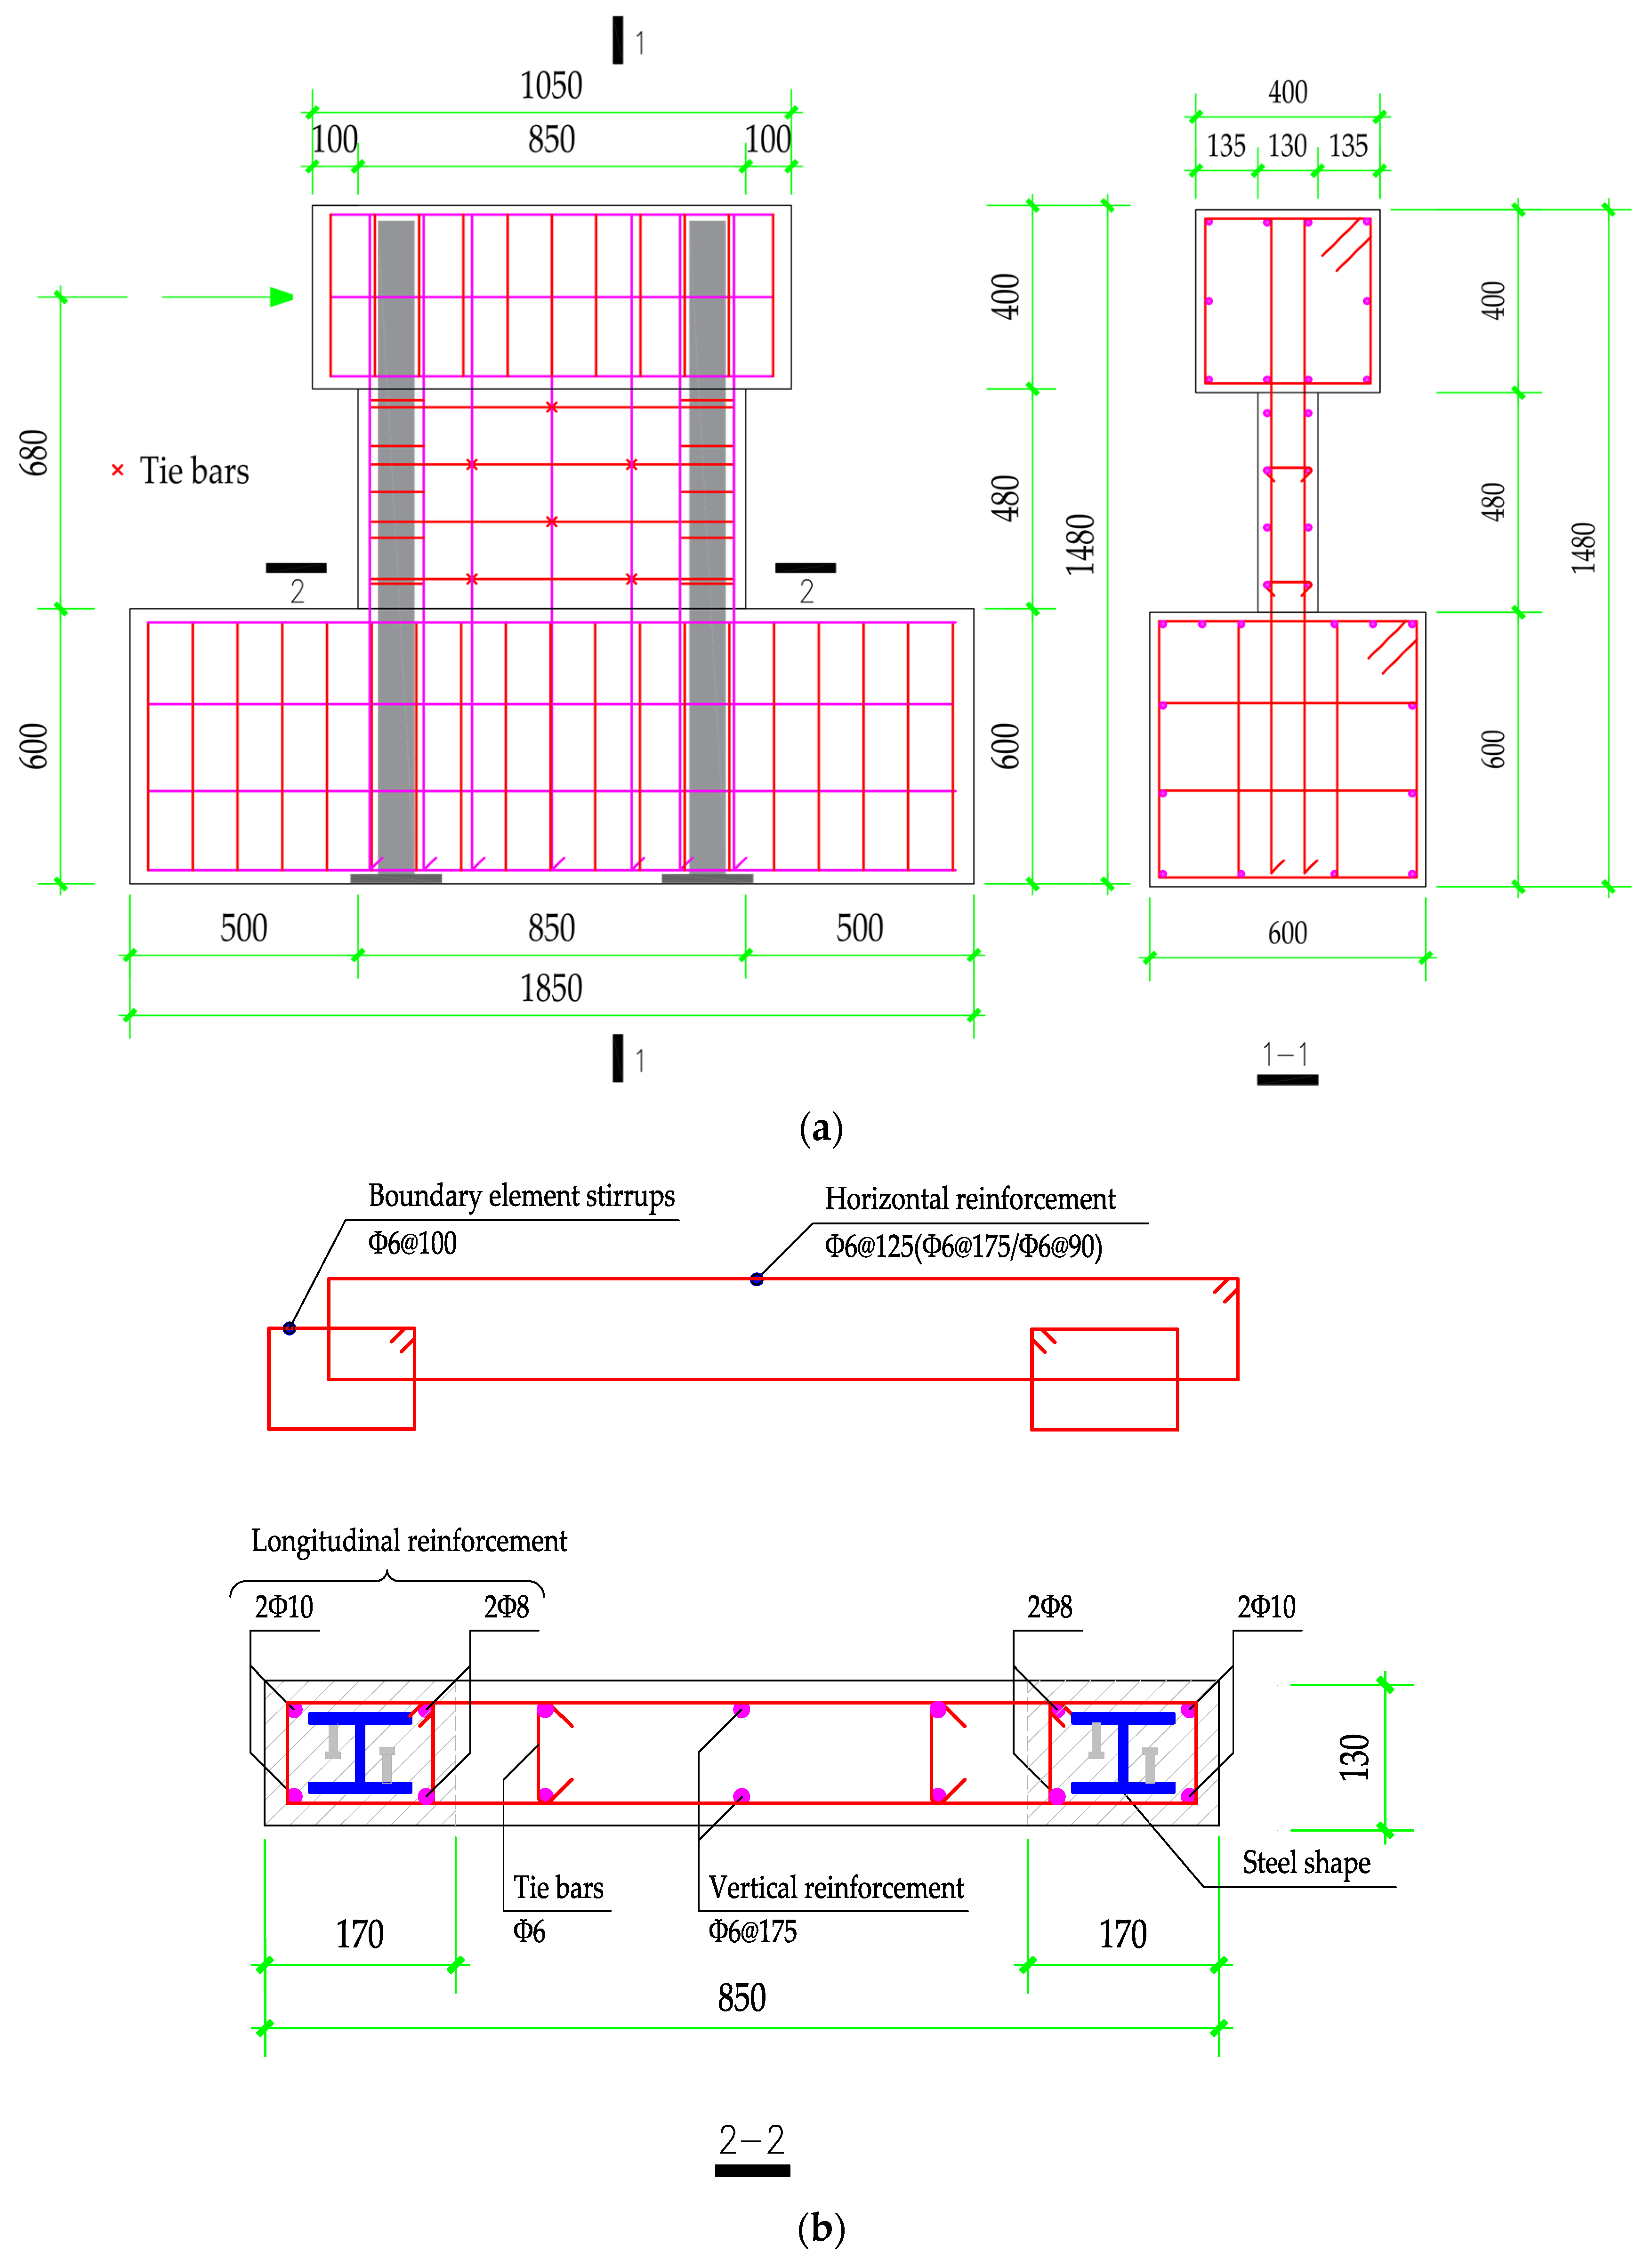
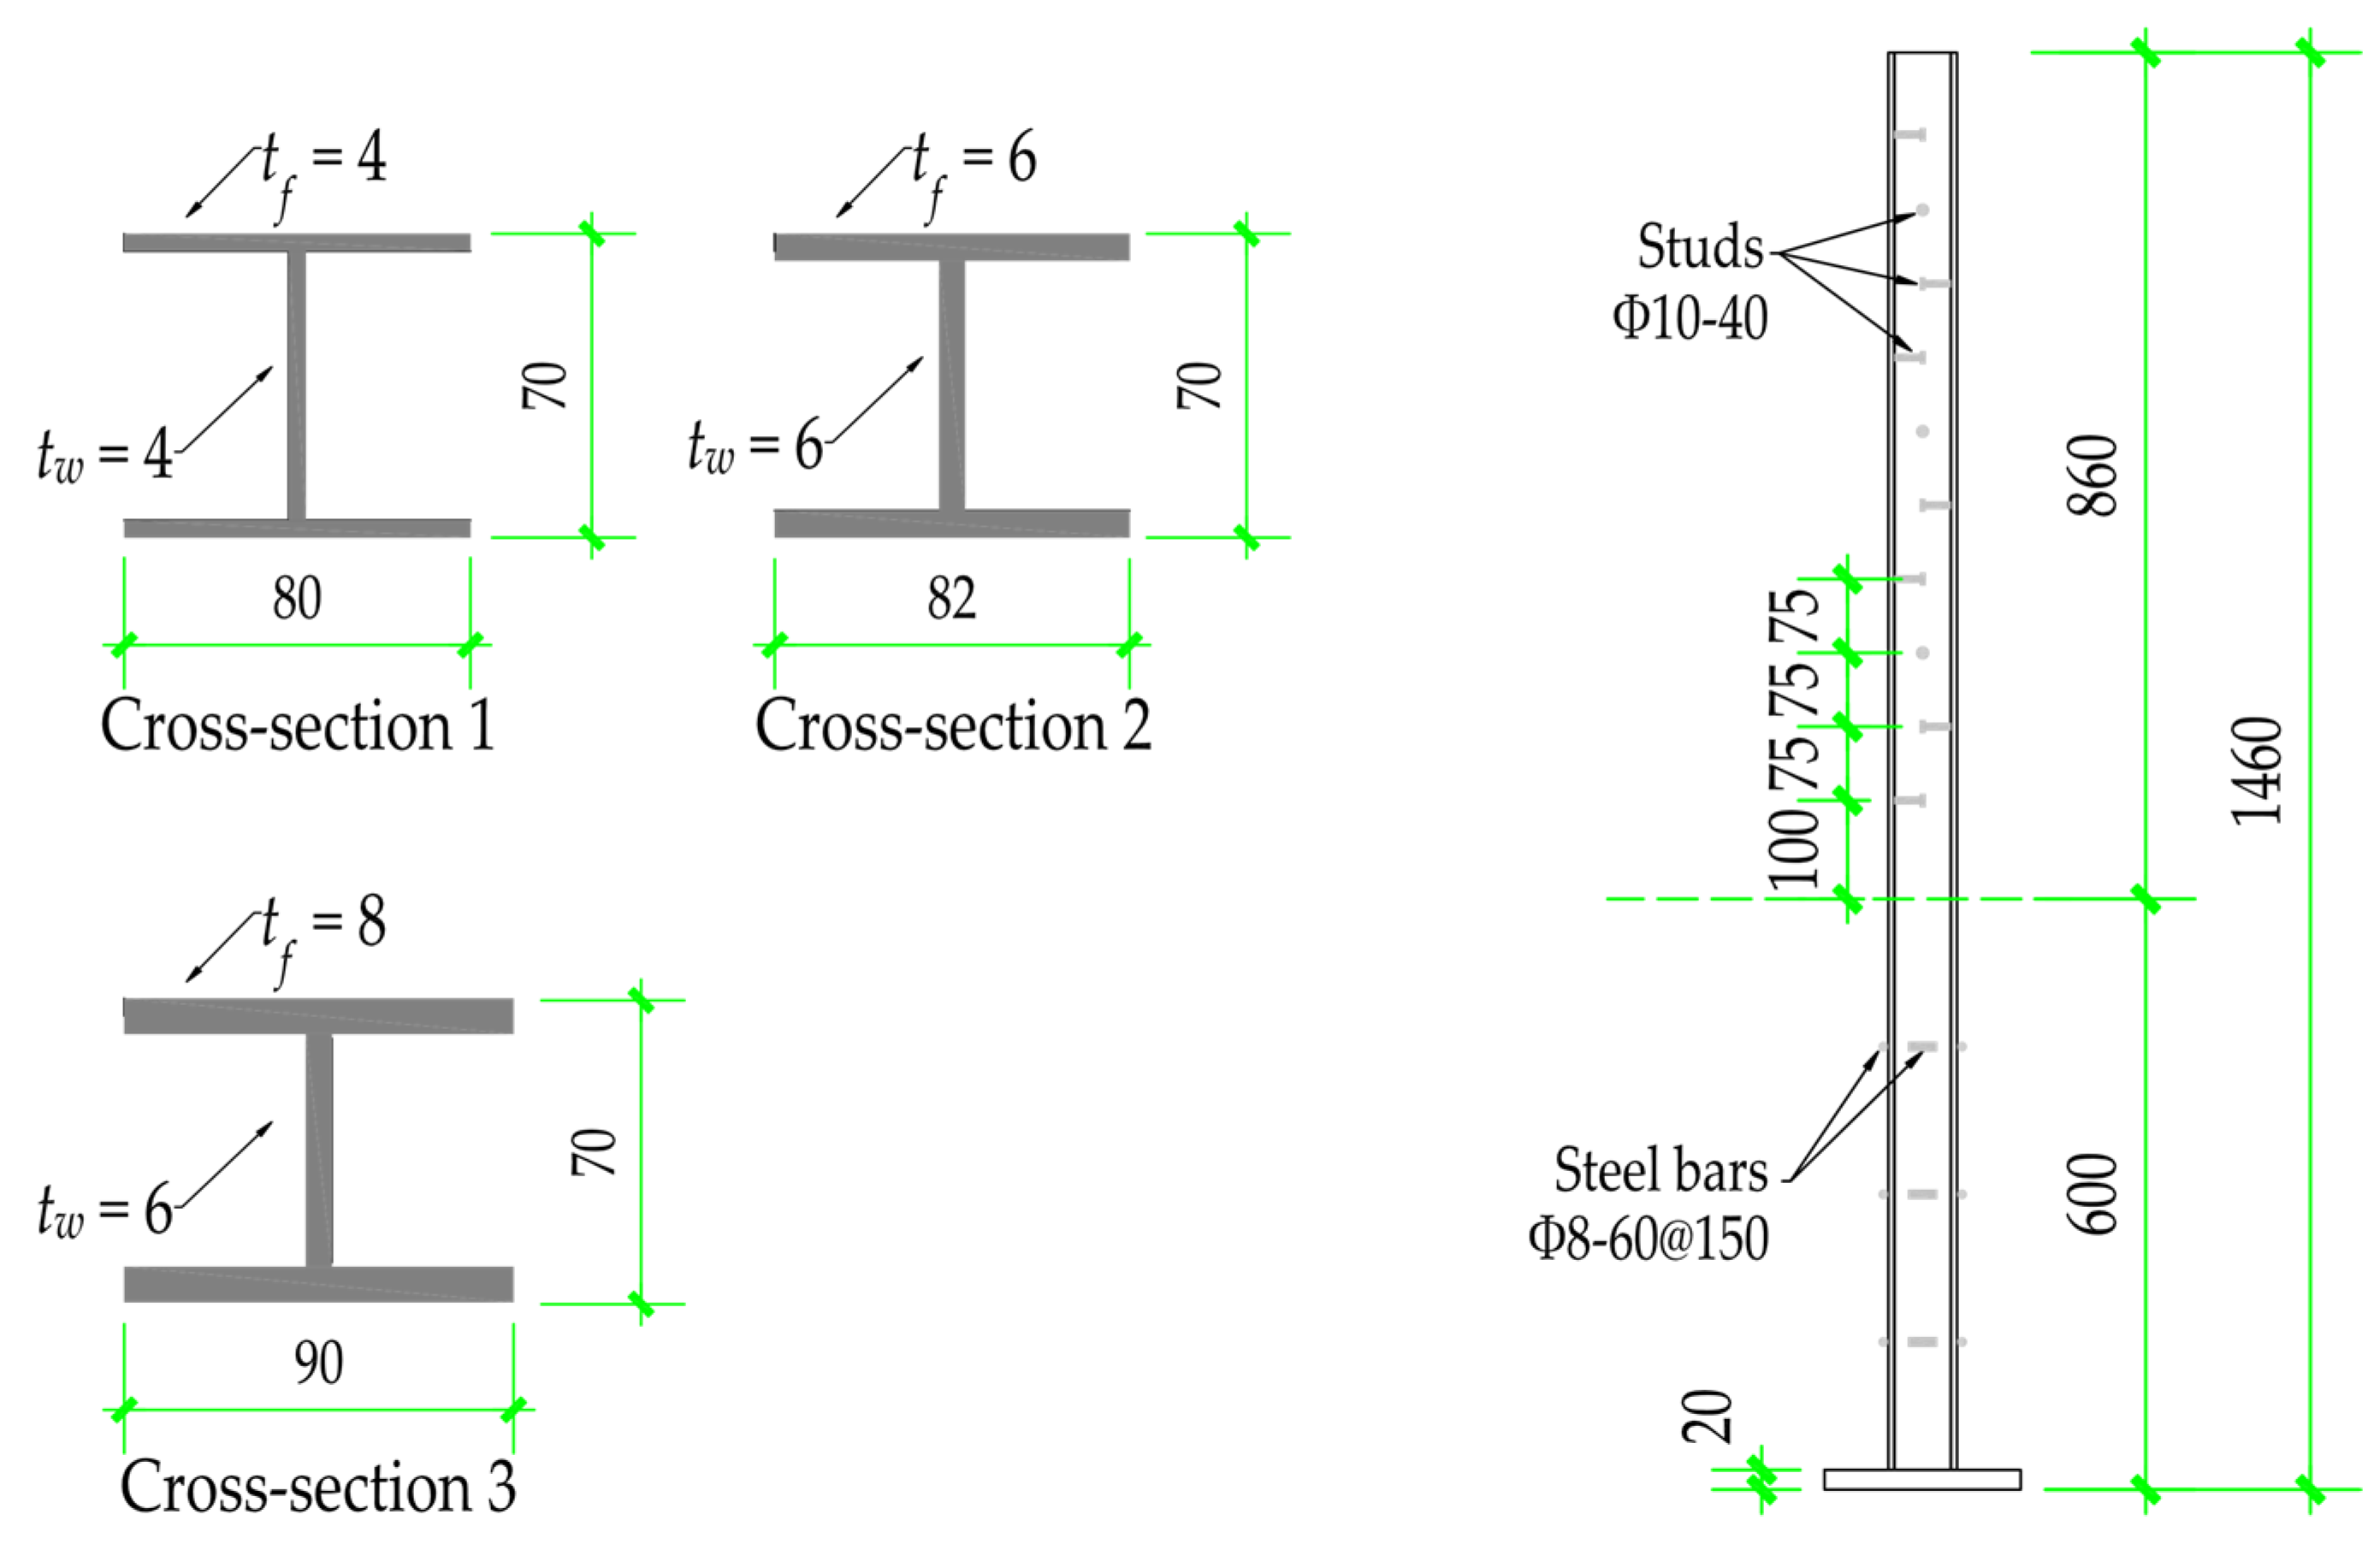
2.1. Details of Specimens
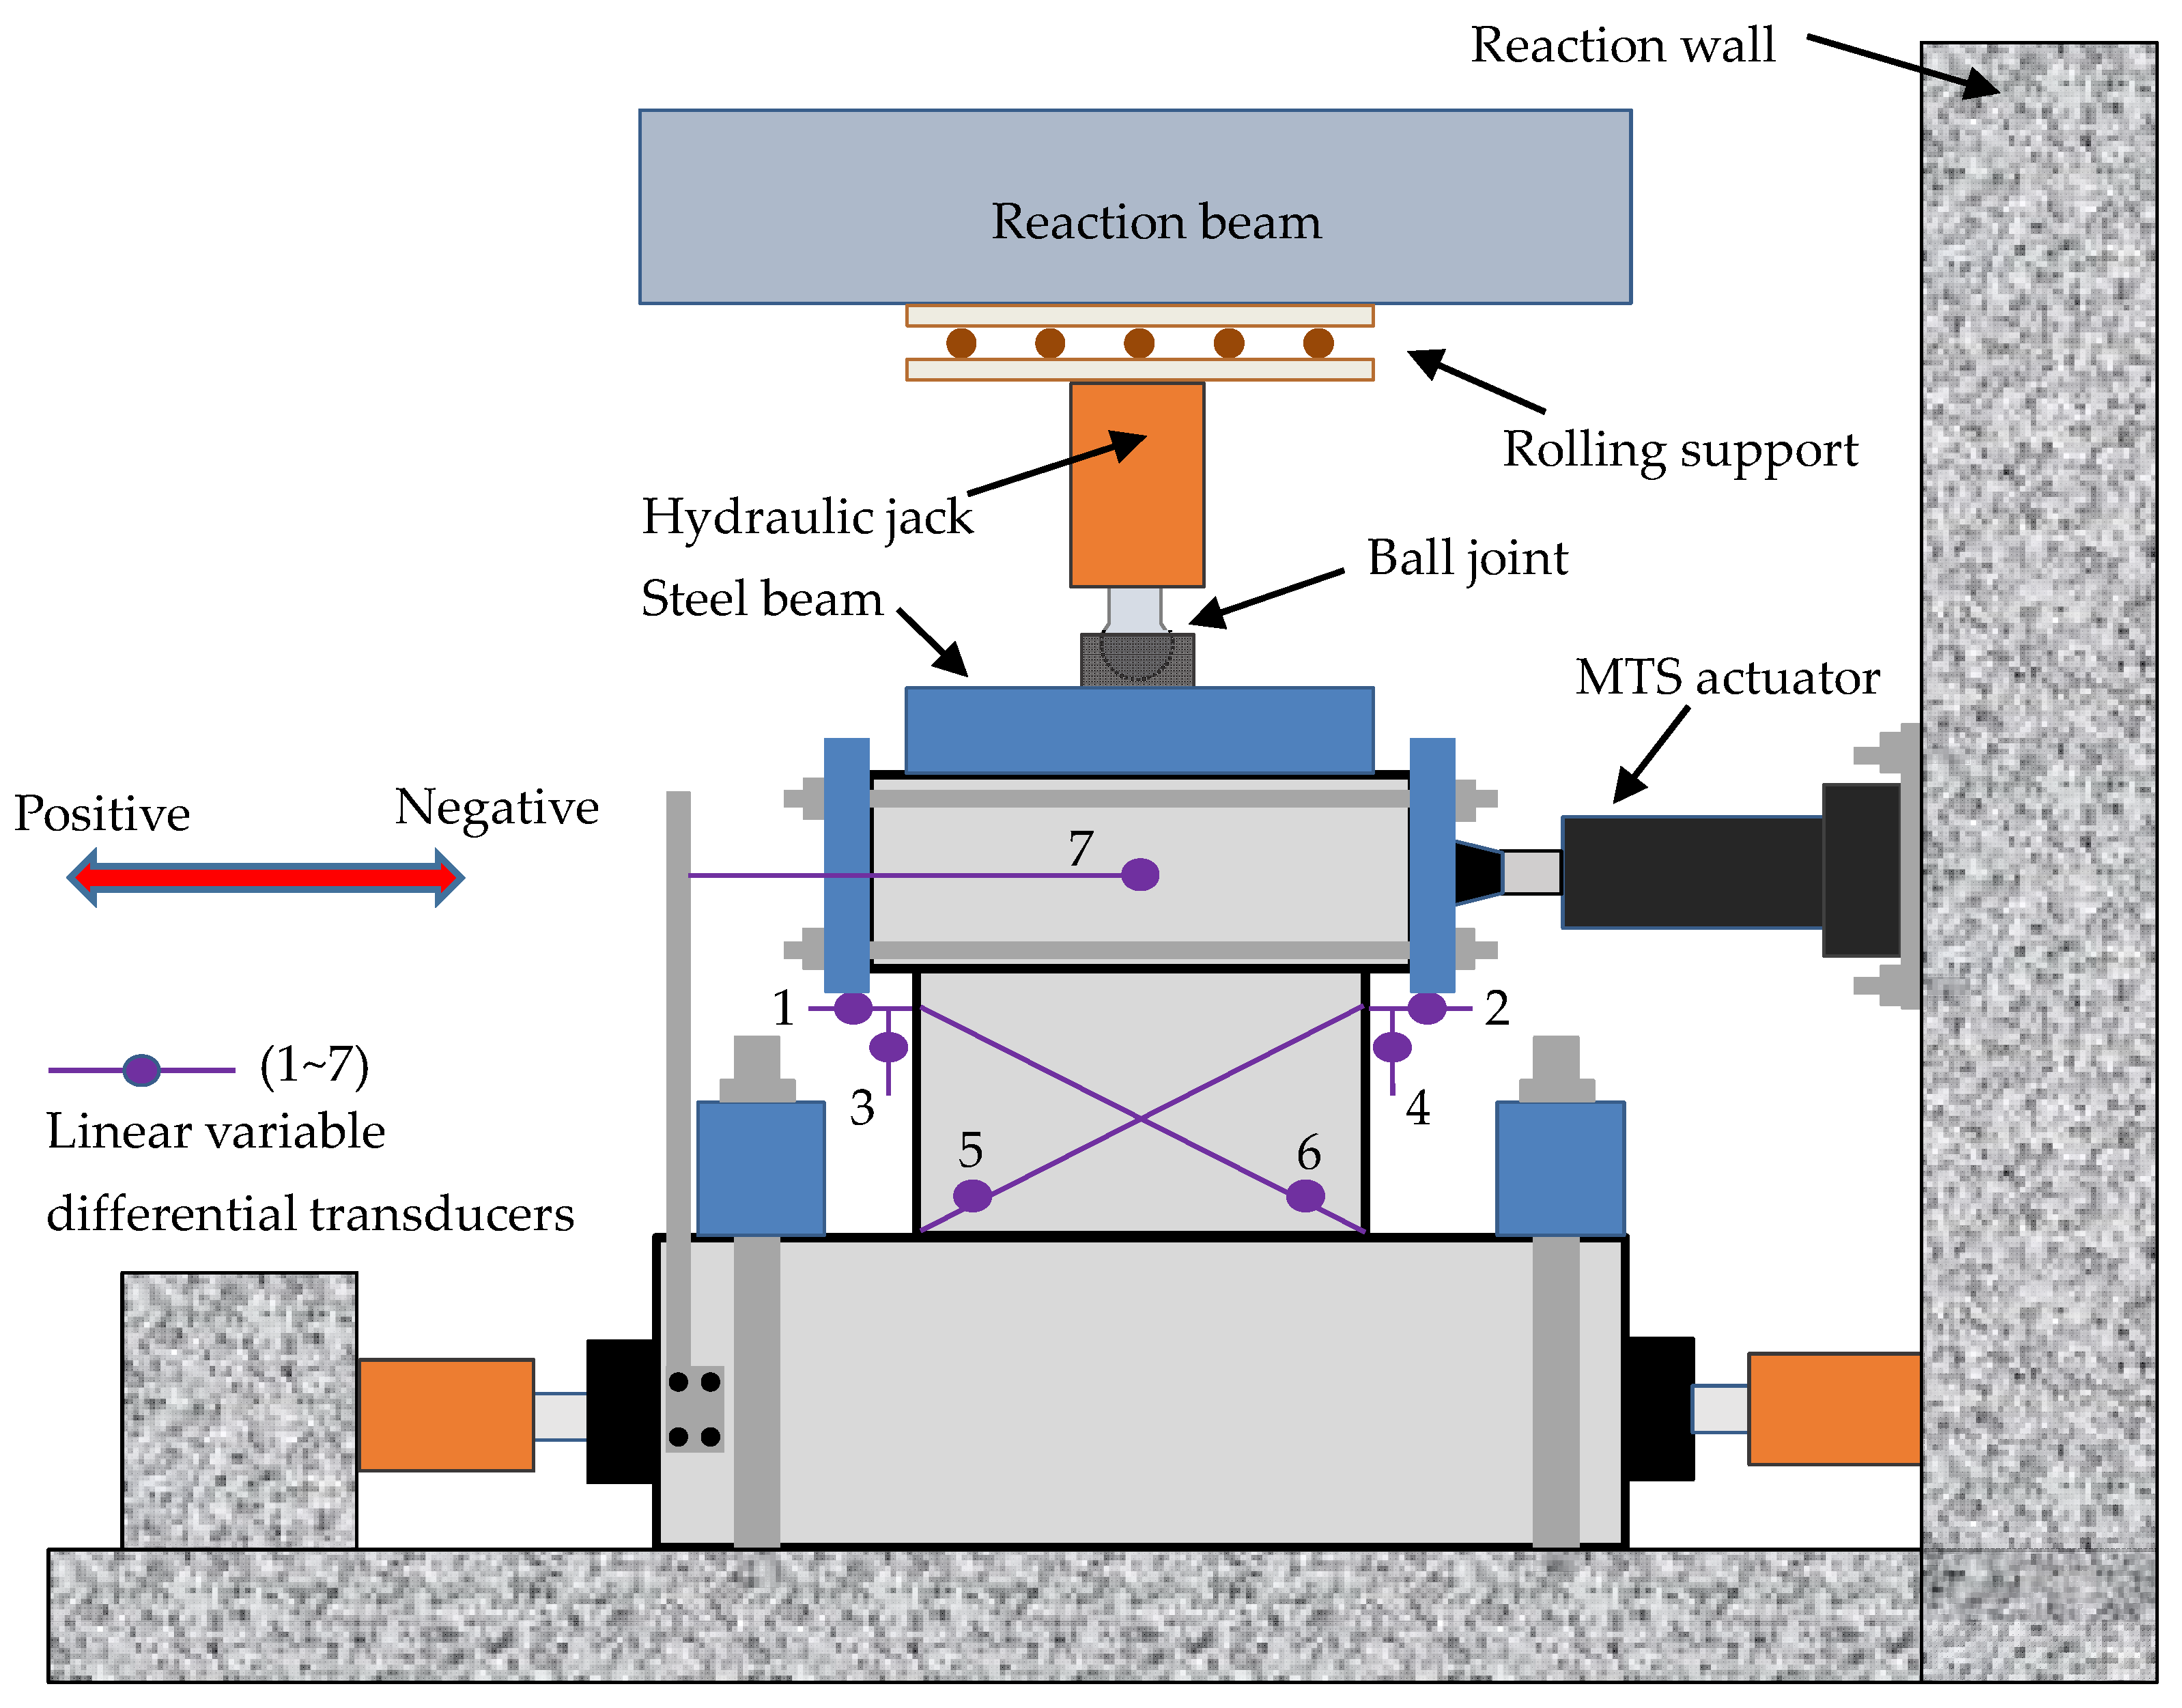
Nine squat SRC shear walls with a rectangular cross-section were designed according to the provisions of JGJ 138-2016 [21]. The studied variables included the axial load ratio (ALR), the area ratio of the embedded structural steel (steel ratio ρ s s ) of the wall boundary, and the horizontal reinforcement ratio ( ρ s h ). The ALRs were taken as 0.18, 0.26, and 0.35, respectively. ALR is defined as
A L R = N f c A c + f a A a
where N   is the experimental axial load; f c and f a are the compressive strength of the concrete and the yield strength of the structural steel, respectively; and A c and A a are the gross area of the concrete and the structural steel, respectively.
Detailed parameters and reinforcement information for the specimens are shown in Table 1 and Figure 1. All the specimens had the same dimensions and were tested as cantilever walls. The length and thickness of the wall cross-section were 850 mm and 130 mm, respectively. The distance from the top surface of the foundation beam to the lateral loading height was 680 mm. Thus, the shear span ratio (SSR, defined as the ratio of loading height to the cross-sectional length) was 680/850 = 0.8. The ρ s s was taken as 4%, 6%, and 8% relative to the area of the boundary element, respectively. The sectional length of the boundary element was 170 mm. The structural steel was welded from steel plates to satisfy the designed steel ratios. Details of the steel sections are shown in Figure 2. The horizontal distributed reinforcement ratios ρ s h were taken as 0.25%, 0.35%, and 0.50%, corresponding to a diameter of 6 mm and spacings of 175 mm, 125 mm, and 90 mm, respectively. The vertical distributed reinforcement ratio beside the wall boundary was 0.25% (Φ6@175) for all the specimens. The volumetric ratio of the stirrups (Φ6@100) of the boundary element was 1.20%. Each of the wall boundaries used 2Φ10 + 2Φ8 as the longitudinal reinforcement, leading to a boundary reinforcement ratio of 1.17%. The specimens are denoted as W- ρ s s -ALR(A/B), e.g., W-4-0.18 denotes the SRC shear wall with a ρ s s of 4%, an ALR of 0.18, and a ρ s h of 0.35% (default value when no suffix letter appears). The suffix letter A means that ρ s h is reduced to 0.25%, while the letter B representing ρ s h is increased to 0.50%.
Since all specimens were designed to fail in shear, shear studs with a diameter of 10 mm were arranged on the flange and web of the structural steel to make an effective shear transition between the concrete and the steel sections. Due to the narrow spacing, the shear studs were arranged alternately on the web and flange with a spacing of 75 mm along with the specimen height, as shown in Figure 2. Additionally, short reinforcement bars were welded on the steel sections in the foundation zone to enhance the anchoring.
Concrete with fine aggregate less than 10 mm was used to promote the casting quality because of the narrow space between the steel and reinforcement bars. The measured concrete compressive strength f c was 31.48 MPa. f c was computed as f c = 0.88 × 0.76 f c u , where f c u was the compressive strength of the concrete cubic of 150 mm. The mechanical properties of reinforcements and structural steels are summarized in Table 2 and Table 3, respectively.

2.2. Test Setup

All the specimens were tested in a cantilever manner, using the setup presented in Figure 3. Each specimen was fixed on the floor through the foundation concrete block, of which the rigid displacement was eliminated by the horizontal jacks, steel beams and threaded rods. A vertical hydraulic jack and a steel beam with sufficient flexural stiffness were adopted to generate a uniform axial pressure to the wall. The cyclic lateral loading was achieved by two MTS hydraulic actuators. Each of them possessed a capacity of 900 kN.

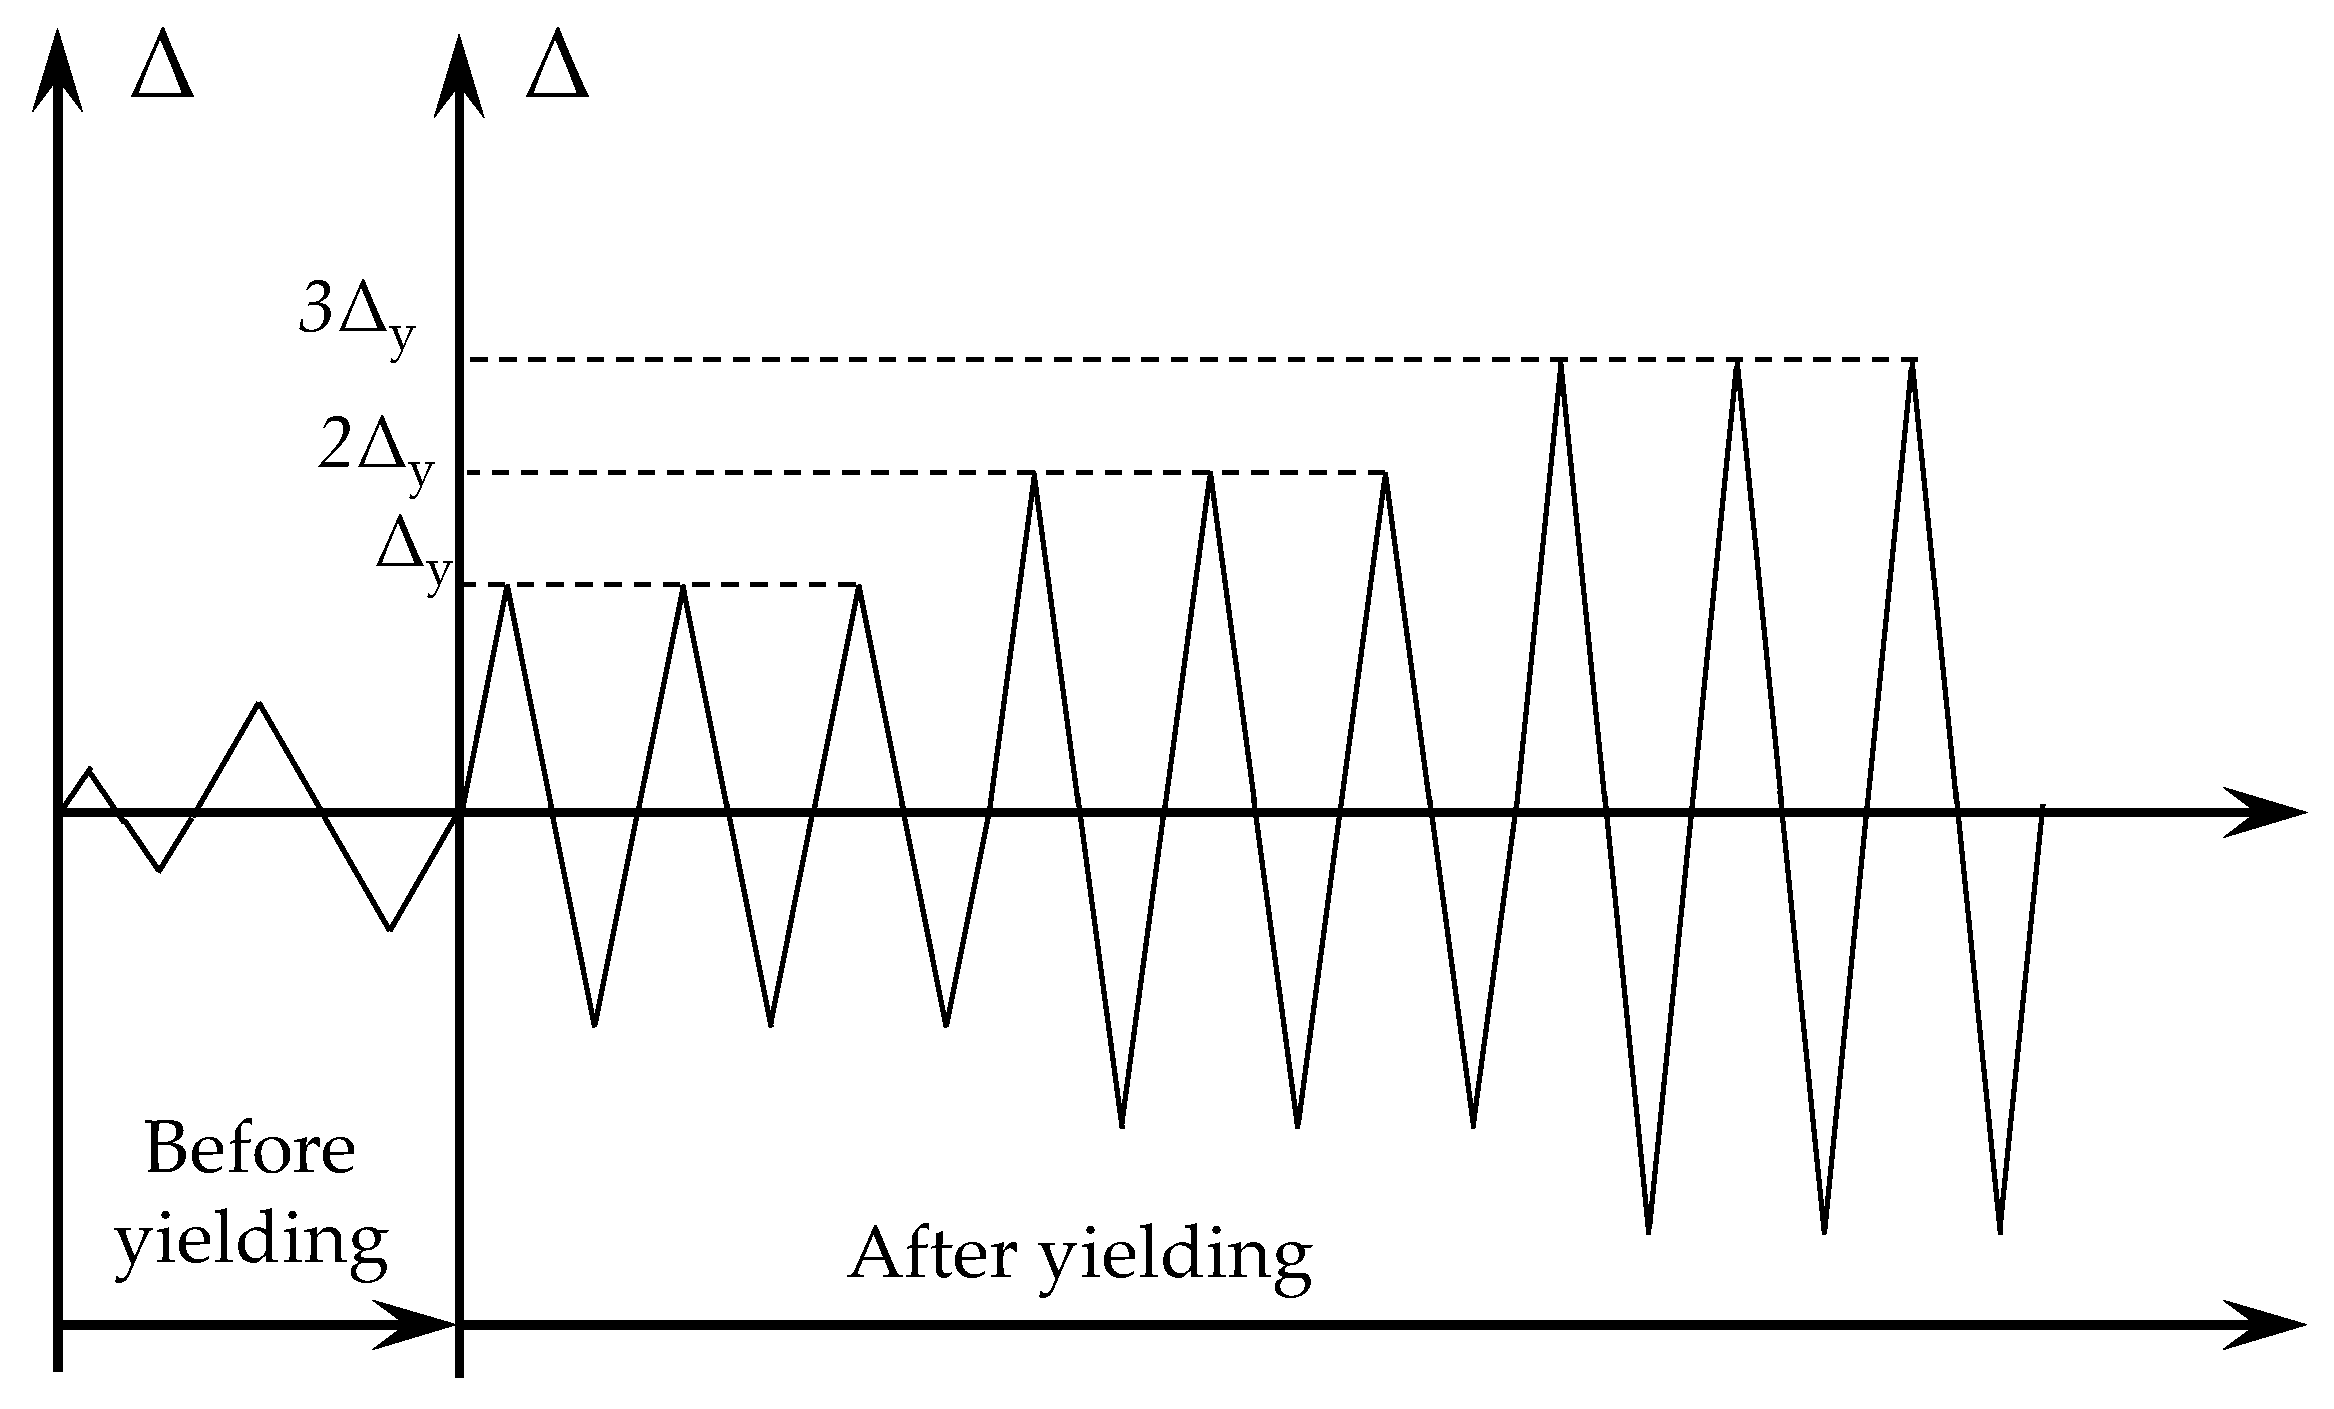
2.3. Loading Protocol

Prior to the cyclic lateral loading, the designed axial load was applied on the top end of the wall specimen and remained constant during the test procedure. The lateral loading was controlled by the lateral displacement at the loading height of the specimen, and the loading protocol is shown in Figure 4. Before the wall yield, each displacement level was conducted only once, while three cycles were repeated at each displacement level that was beyond the yield displacement. The yielding of the walls was determined through the strains of the reinforcement bars or the steel shapes, which were monitored by the strain gauges. The wall was assumed to be yielded once the reinforcement bars or the steel shapes reached their yield strains (assumed to be 2000 μ ϵ ), whichever came first. The test procedure was stopped when the lateral resisting capacity dropped more than 50% of the peak lateral strength or the axial failure occurred, whichever was earlier. As presented in Figure 3, positive loading refers to pushing the wall at the top, while negative loading means pulling.

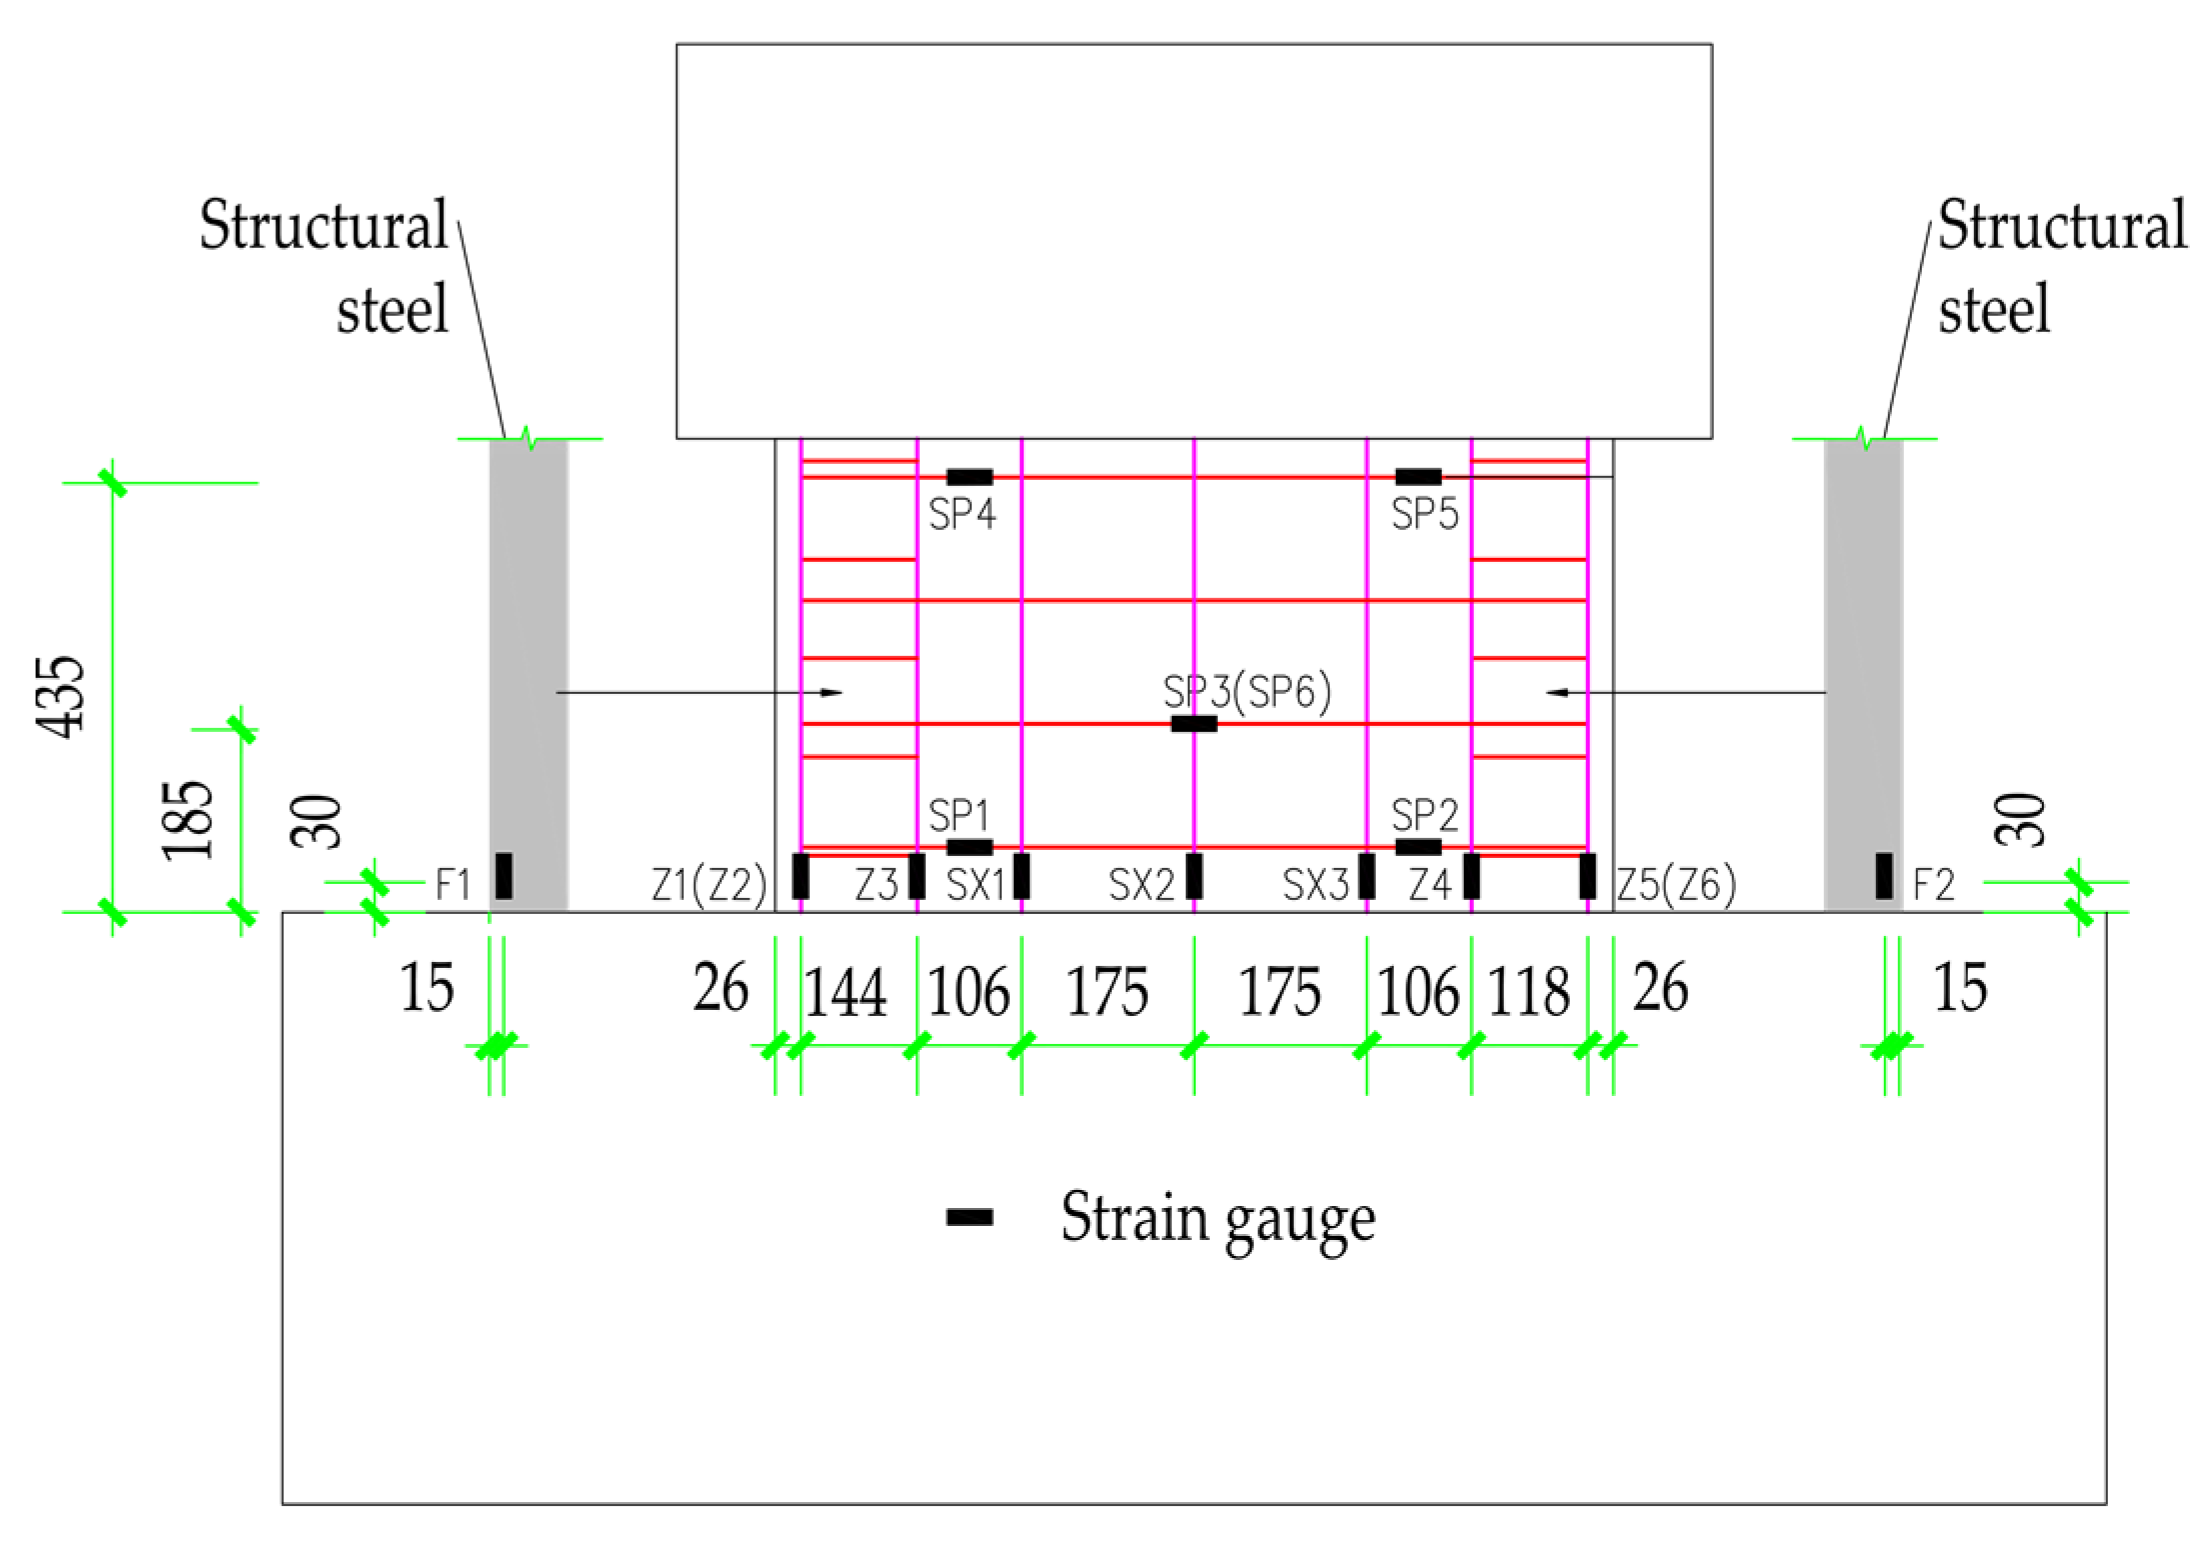
2.4. Instrumentation

To record strains and displacements during the test, each specimen was arranged with plenty of internal strain gauges and external measuring instruments. As illustrated in Figure 3, a linear variable differential transducer (LVDT) was used to monitor the top displacement of the wall and the other LVDTs were employed to record the flexural deformation, shear deformation, and axial deformation of the wall panel at a height of 425 mm measuring from the foundation. As shown in Figure 5, internal strain gauges were adopted to measure the strains of reinforcement bars and steel sections. The strain gauges located in the brackets were arranged at the back side of the wall. For clarity, the structural steel is offset to the outside of the specimen in Figure 5.

3. Experimental Results and Discussion

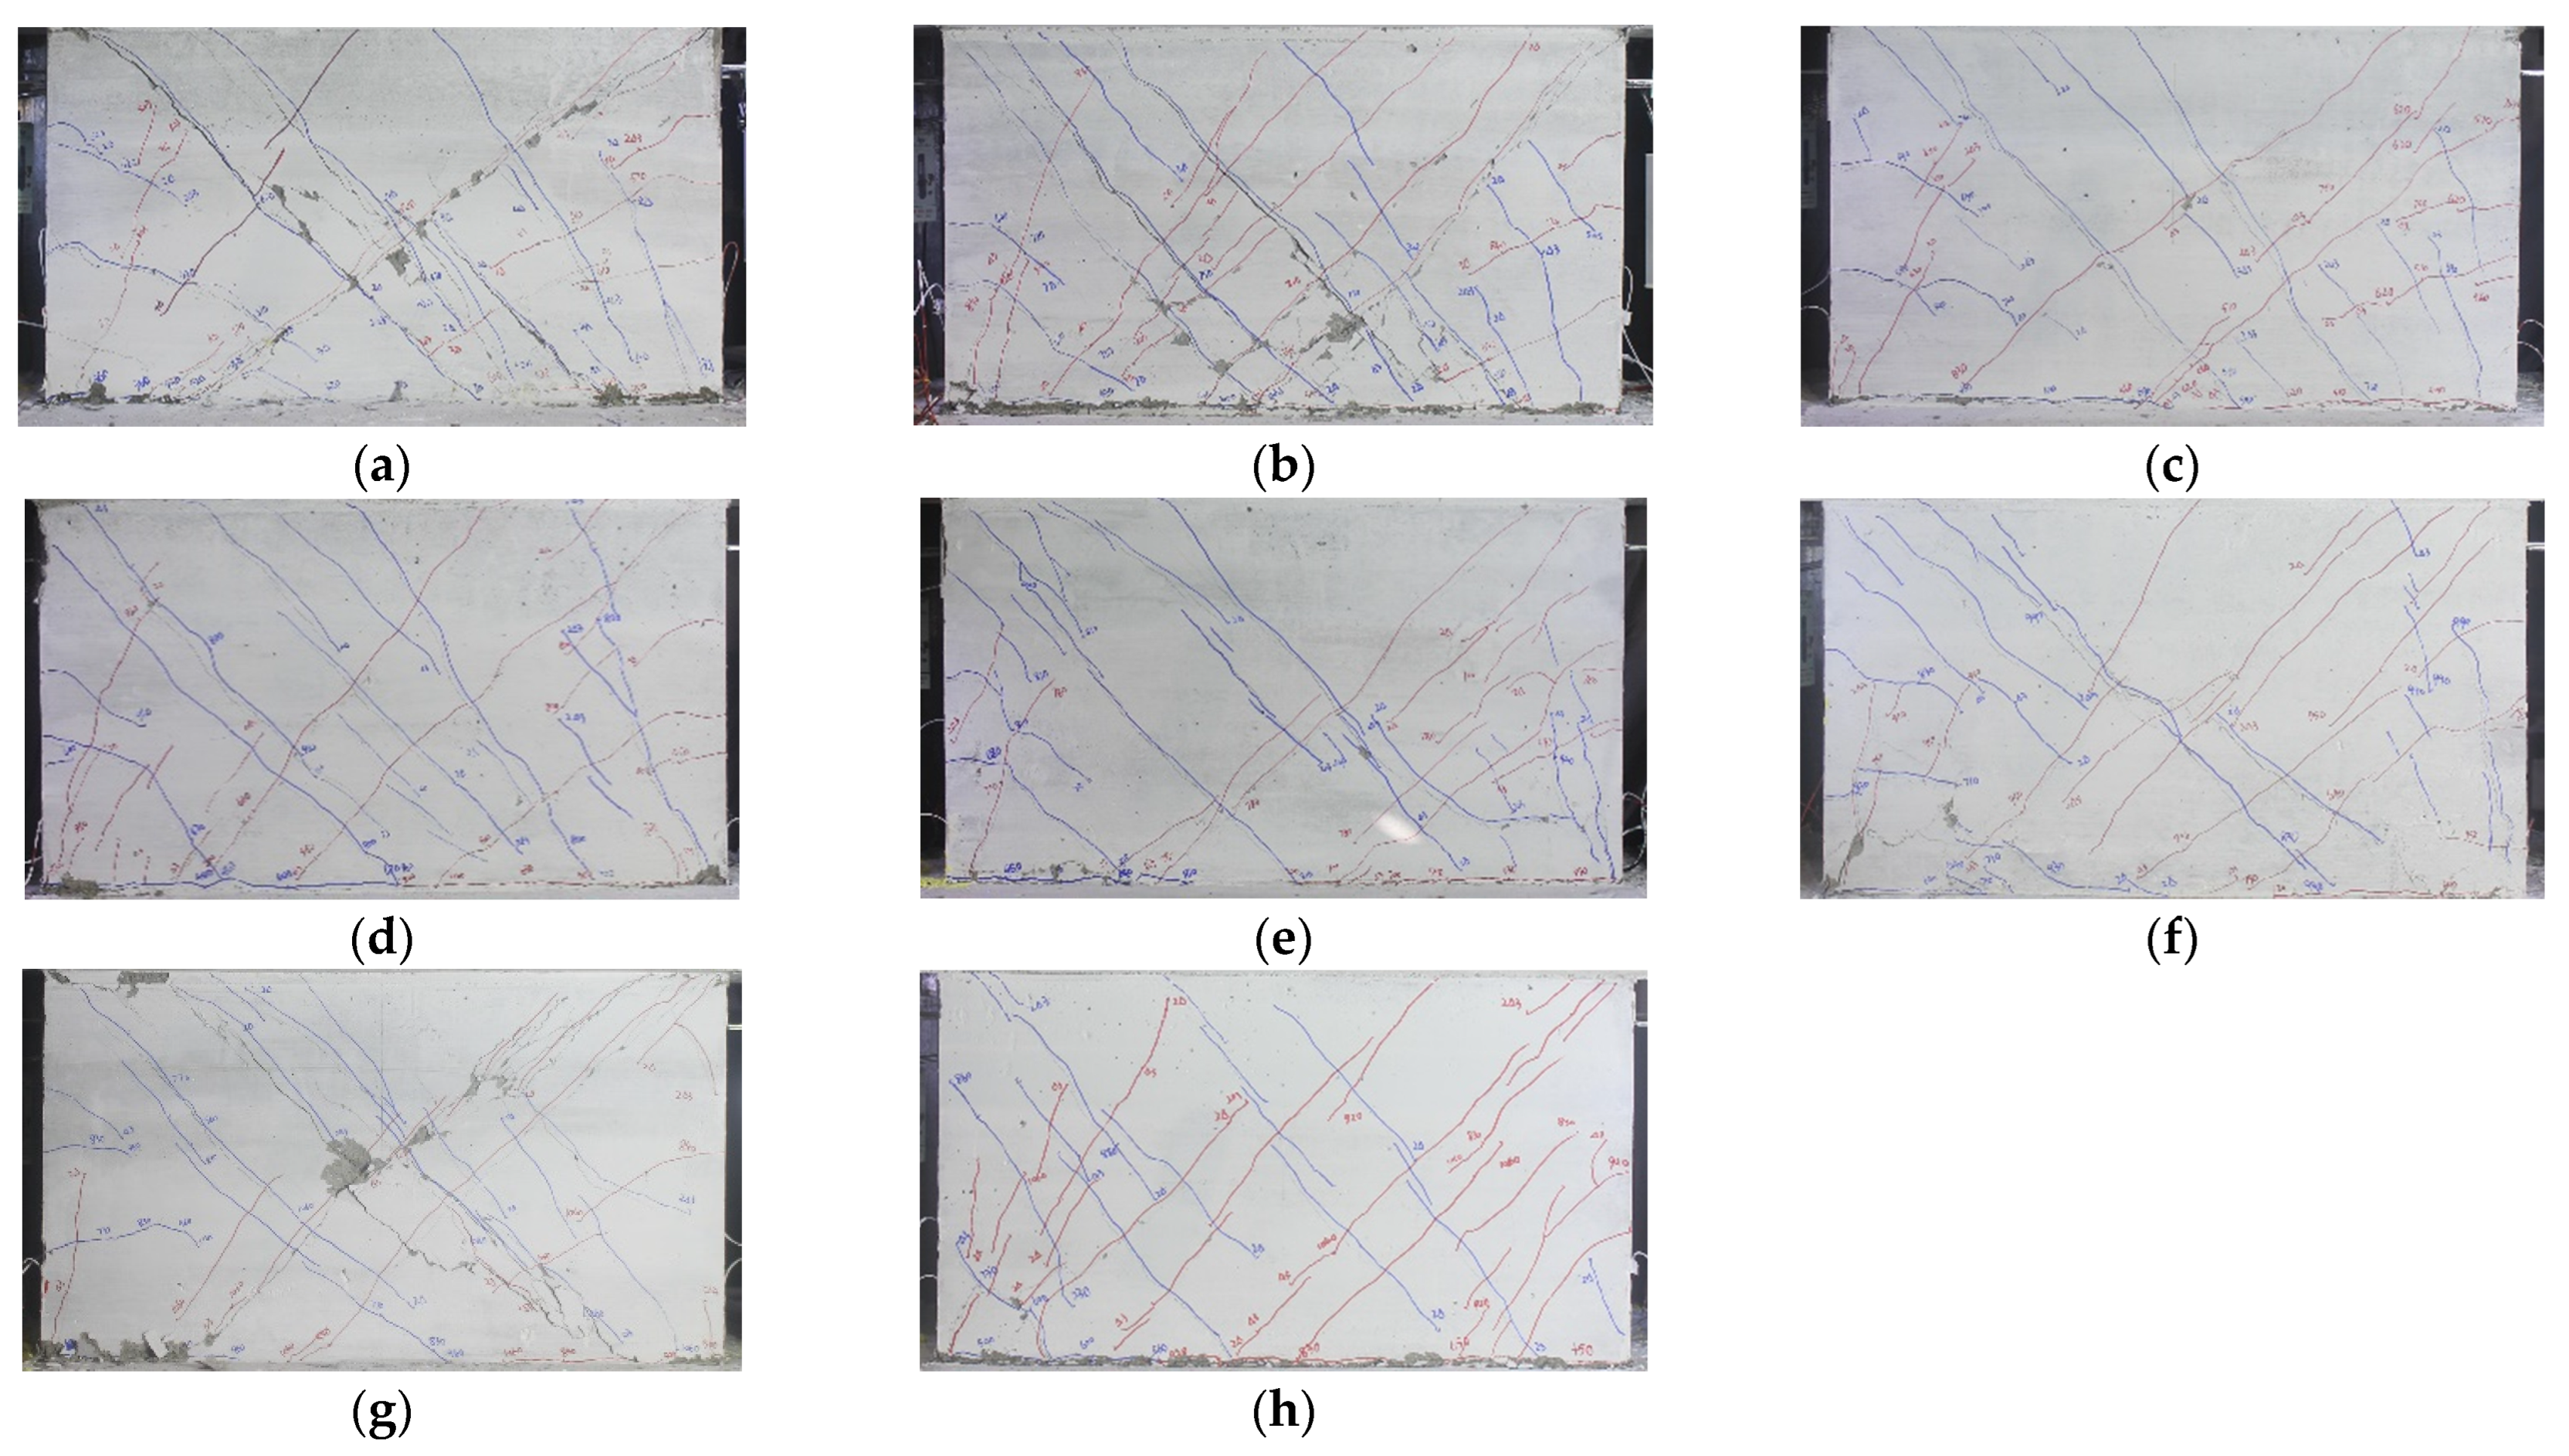
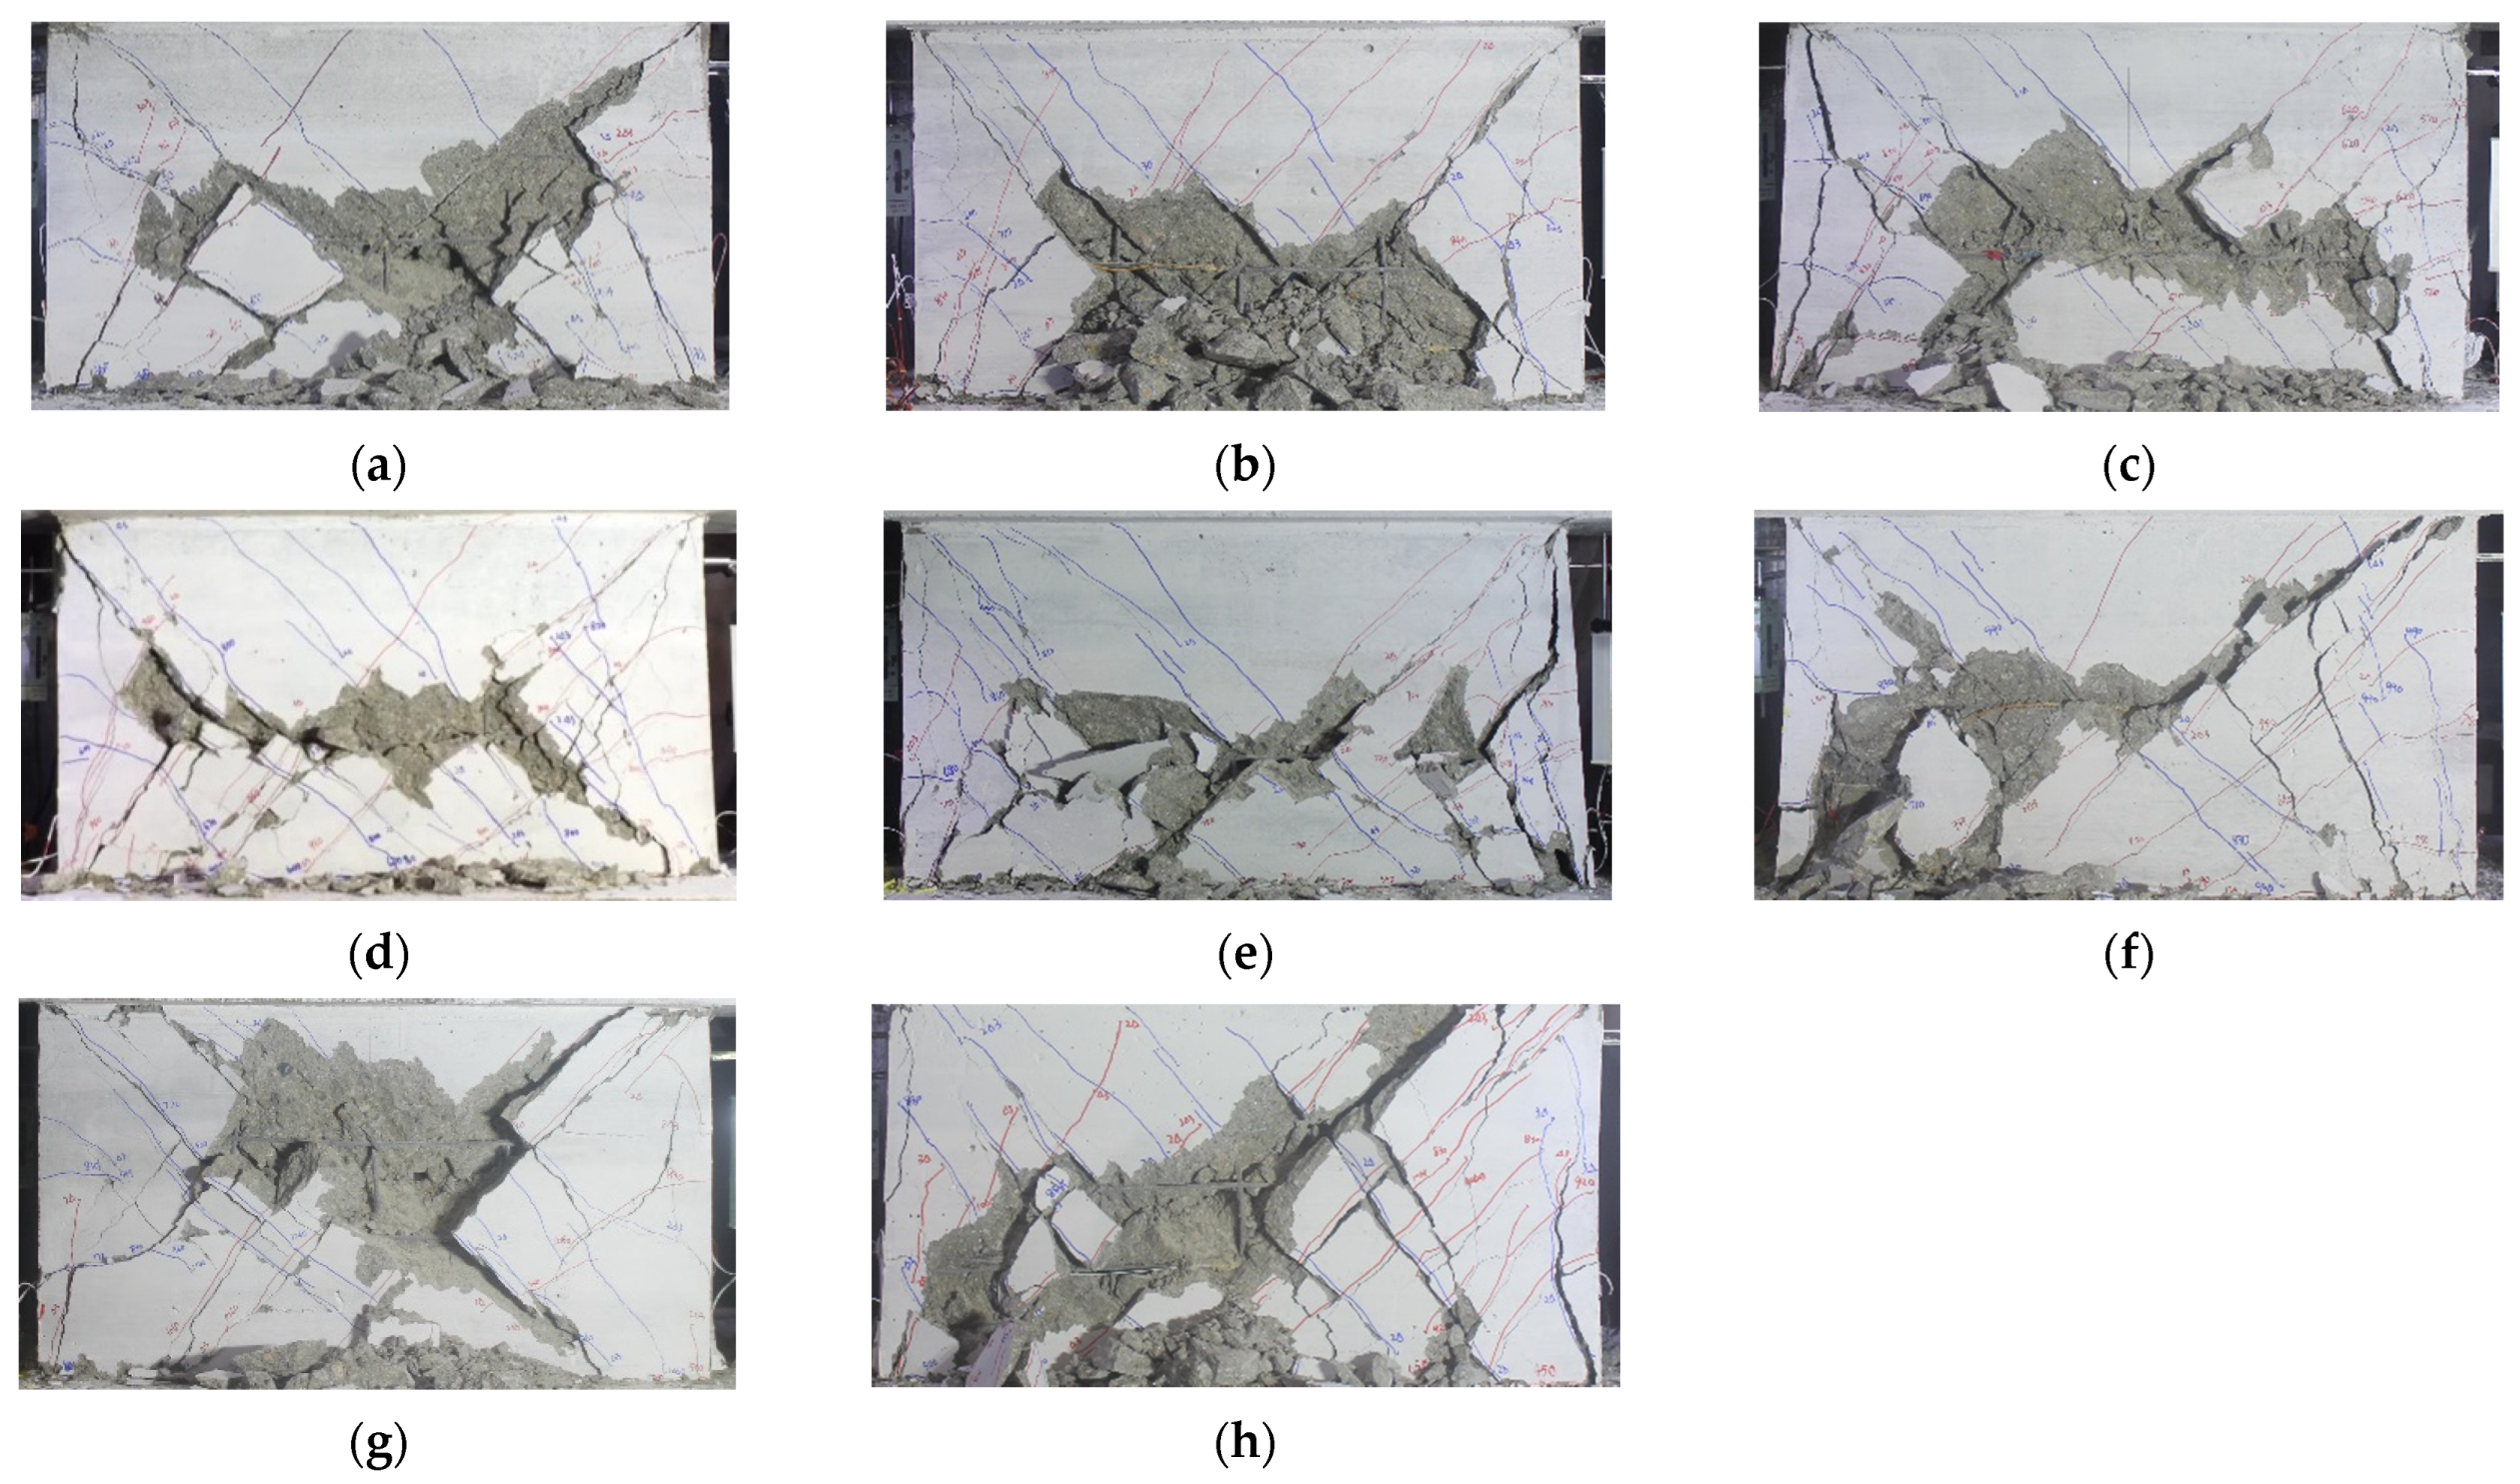
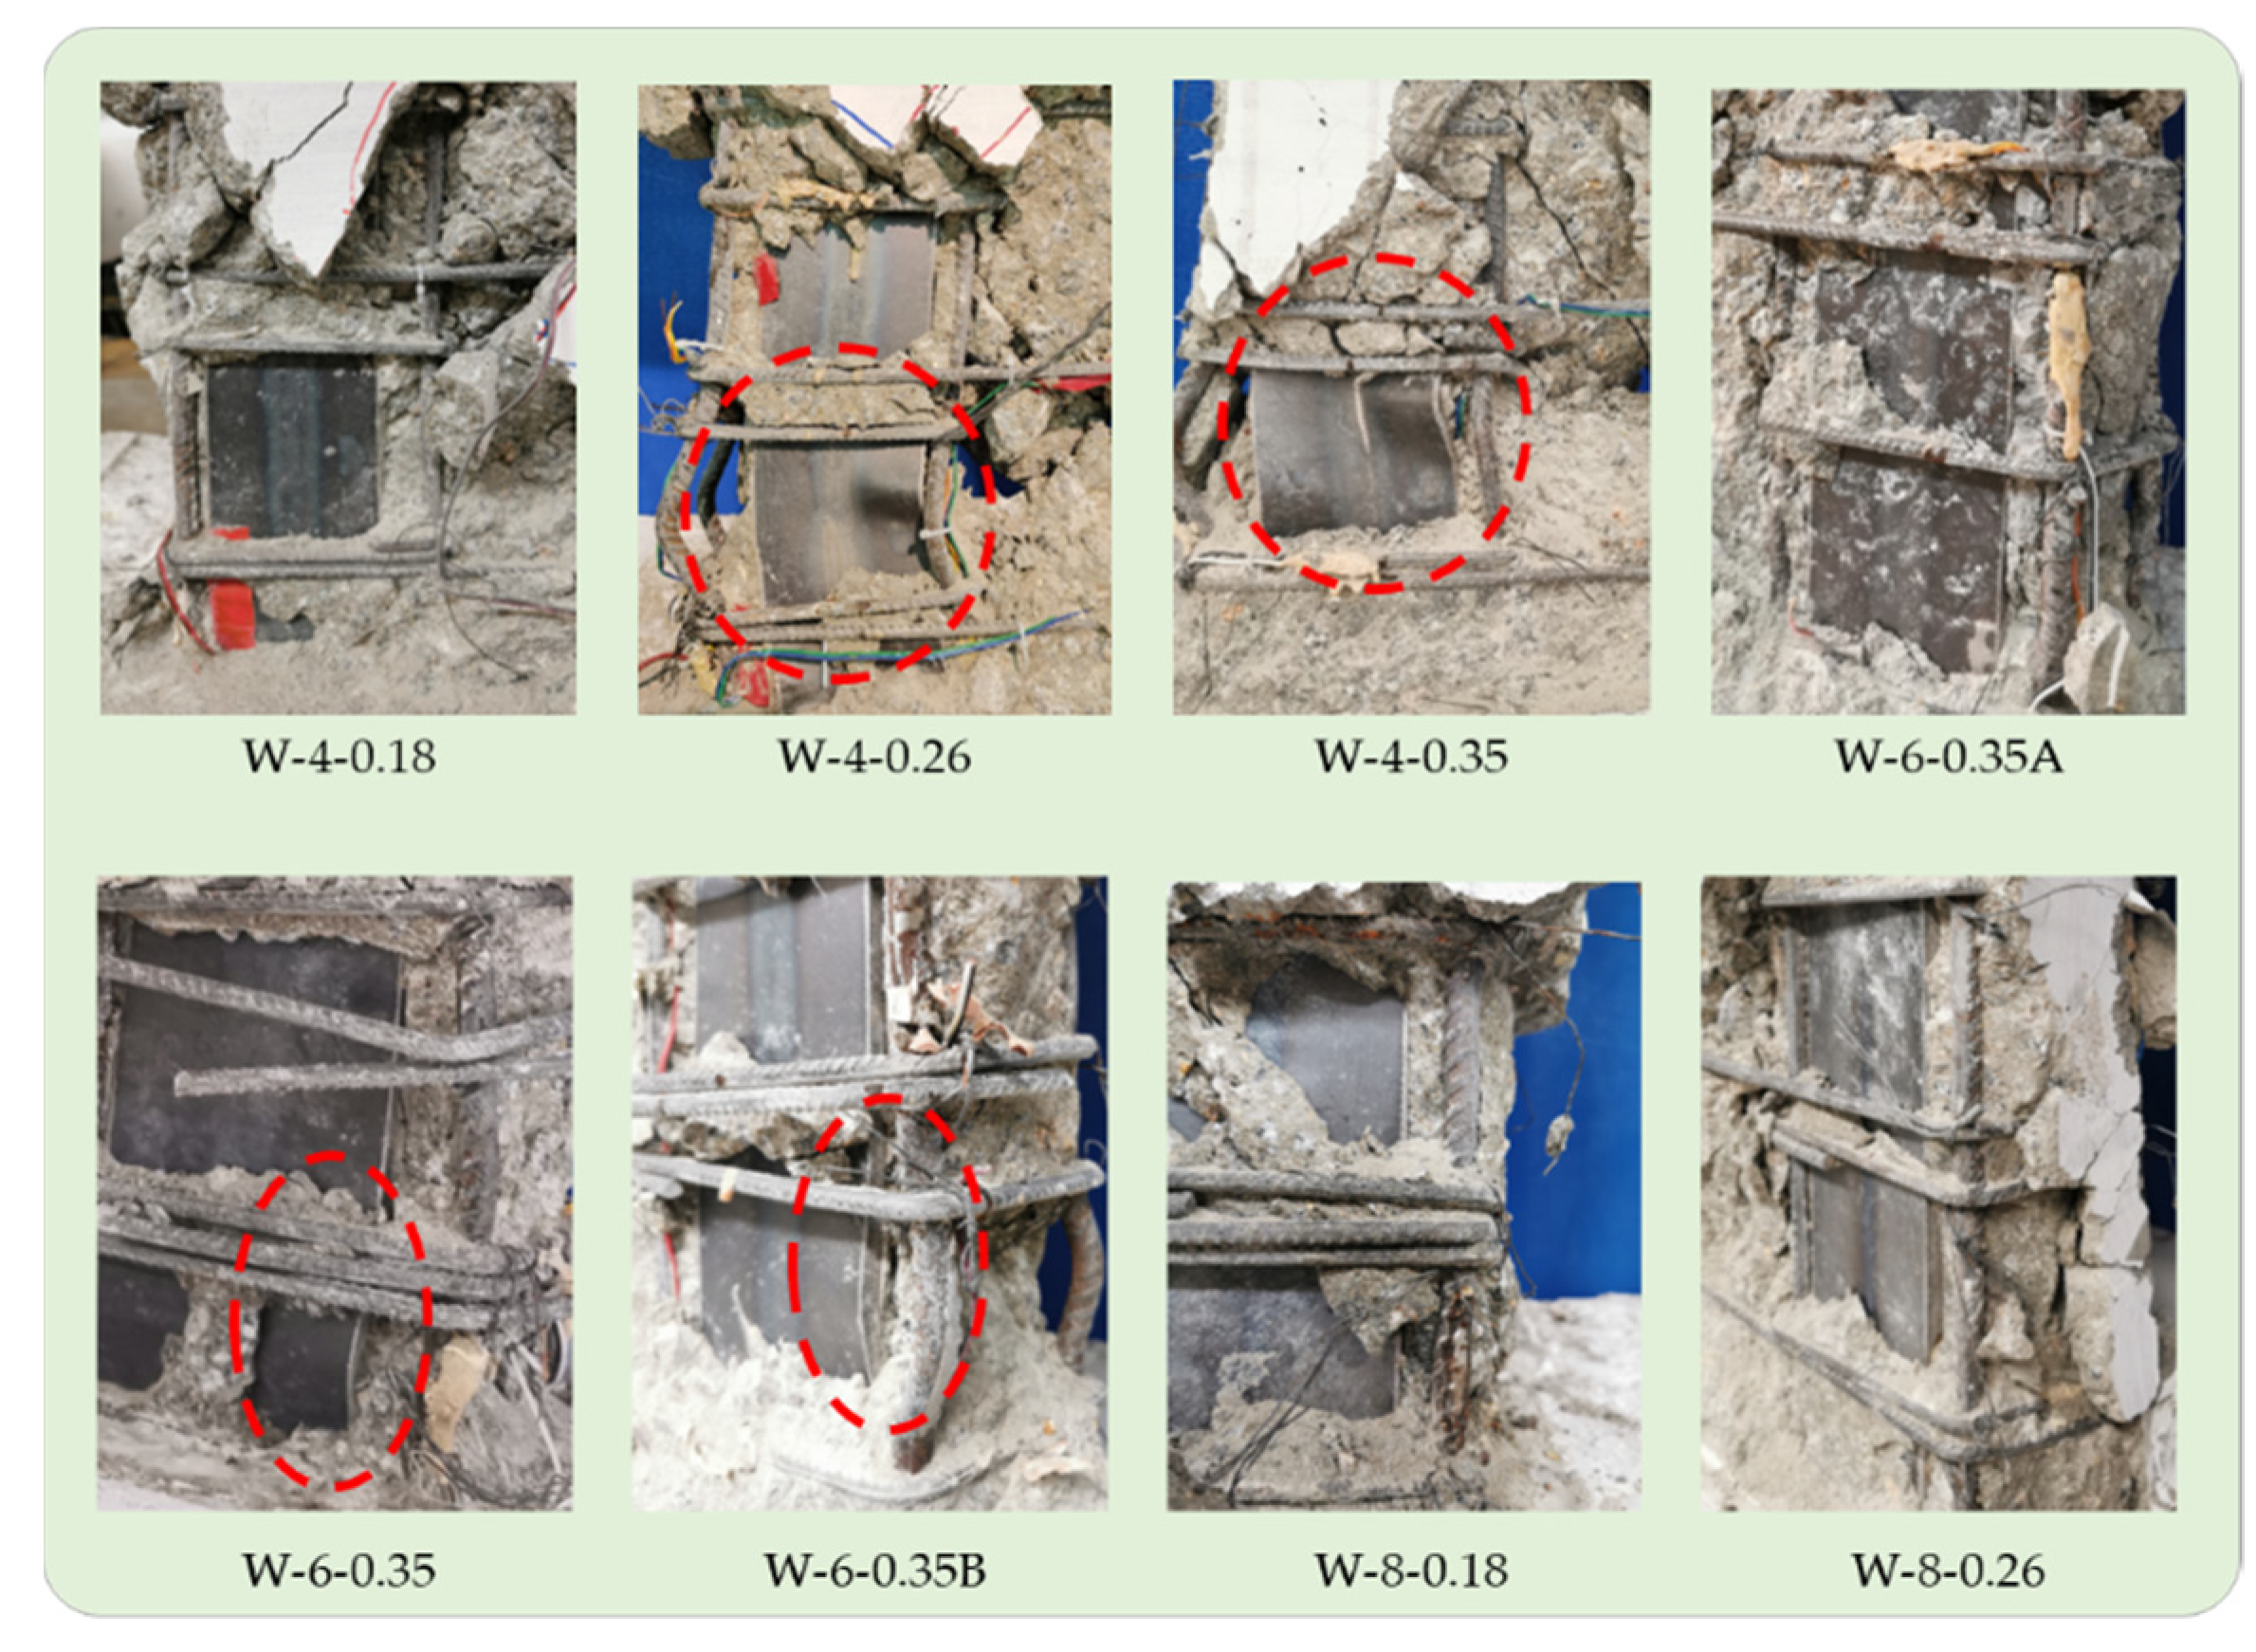
3.1. Failure Process and Failure Modes

It should be noted that the test data of specimen W-8-0.35 were not obtained due to the failure of the acquisition instrument. Thus, the following results and discussions will exclude this specimen.
As expected, all specimens failed in shear, due to their low SSRs. For specimen W-6-0.35 with typical shear failure, horizontal flexural hairline cracks appeared at the base of the wall boundaries when loaded to a drift ratio ( θ , defined as loading displacement divided by the loading height) level of 0.06% (1/1500). When the drift ratio reached 0.13% (1/800), 45°-inclined shear cracks appeared in the web. Once appeared, the inclined cracks developed more rapidly than the flexural horizontal cracks. As the drift ratio of 0.2% (1/500) was loaded, the number of inclined cracks increased and the maximum width of inclined cracks reached 0.2 mm. When specimen W-6-0.35 was loaded to a drift ratio of 0.33% (1/300), horizontal reinforcement bars achieved their yield strains, which were measured by strain gauges SP3 and SP6. At the same time, several inclined cracks intersected at the web of the wall, and diagonal X-shaped cracks formed. When the specimen was loaded to a drift ratio of 0.67% (1/150), a concrete cover split was observed at the base of the wall. At the same time, the peak strength of the specimen was recorded. When the third cycle of this loading drift level was accomplished, the concrete at the intersection of the X-shaped cracks bulged outwards and then was crushed and slightly dropped. The maximum width of inclined cracks reached 2 mm. As the drift ratio reached 0.93% (1/108), the web concrete was severely dropped out. Horizontal and vertical distributed reinforcement bars were exposed, and the latter was buckled. When the specimen was loaded to a drift ratio of 1.25% (1/80), more concrete was crushed and peeled off from the web. Concrete voids were observed and the vertical continuity of the web zone was broken down. Thus, a greater proportion of the axial load was redistributed to the boundary elements. Both the axial and the lateral resistance were provided almost only by the encased boundary elements. The test was terminated since the lateral shear strength decreased by more than 50% of the peak strength.
A similar damage process was observed in the other specimens, except for the following significant differences. (1) For the specimen with larger ρ s h (i.e., W-6-0.35B), the inclined cracks on the web were more intense, as seen in Figure 6. (2) The buckling degree of the steel sections was different for specimens with different steel ratios. The higher the steel ratio, the lighter the buckling degree. Since buckling was less likely to occur for the thicker steel plates, they were adopted for specimens with higher steel ratios. Figure 6 and Figure 7 show the damage states of all the specimens at the peak shear strength in the positive direction and at the final stage, respectively. The buckling patterns of the structural steel, after removing the crushed concreted, are shown in Figure 8.

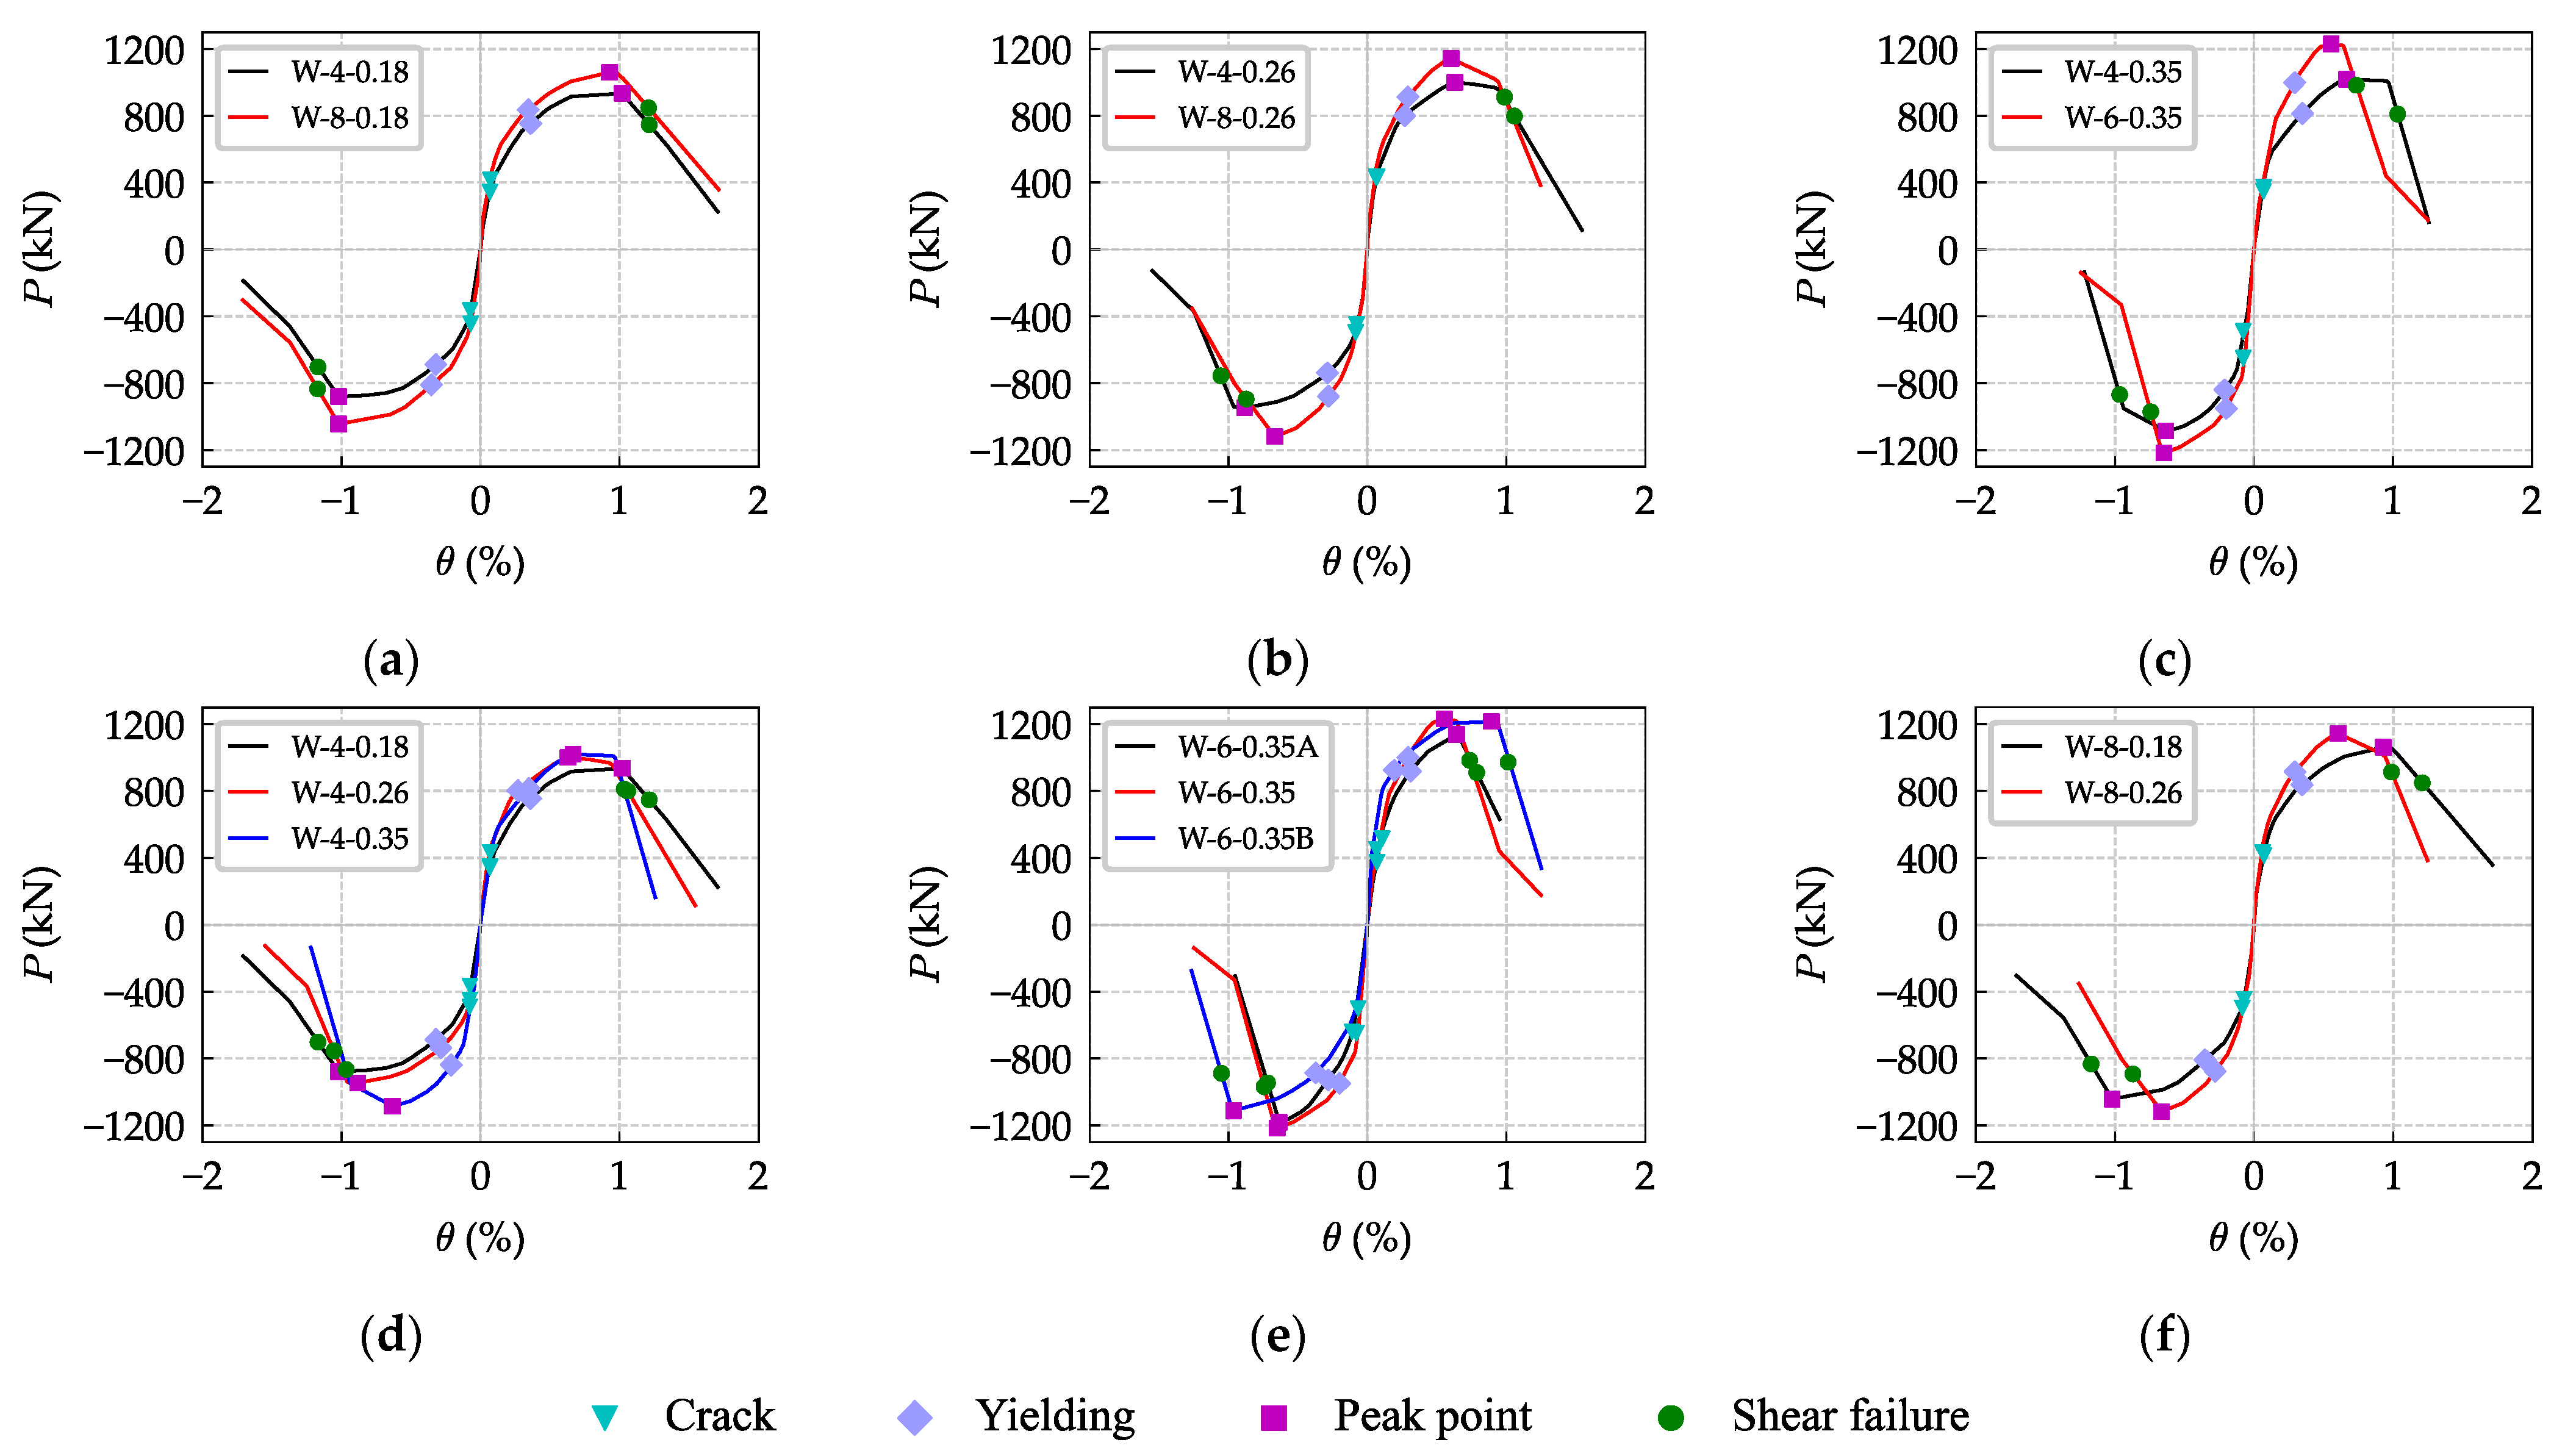
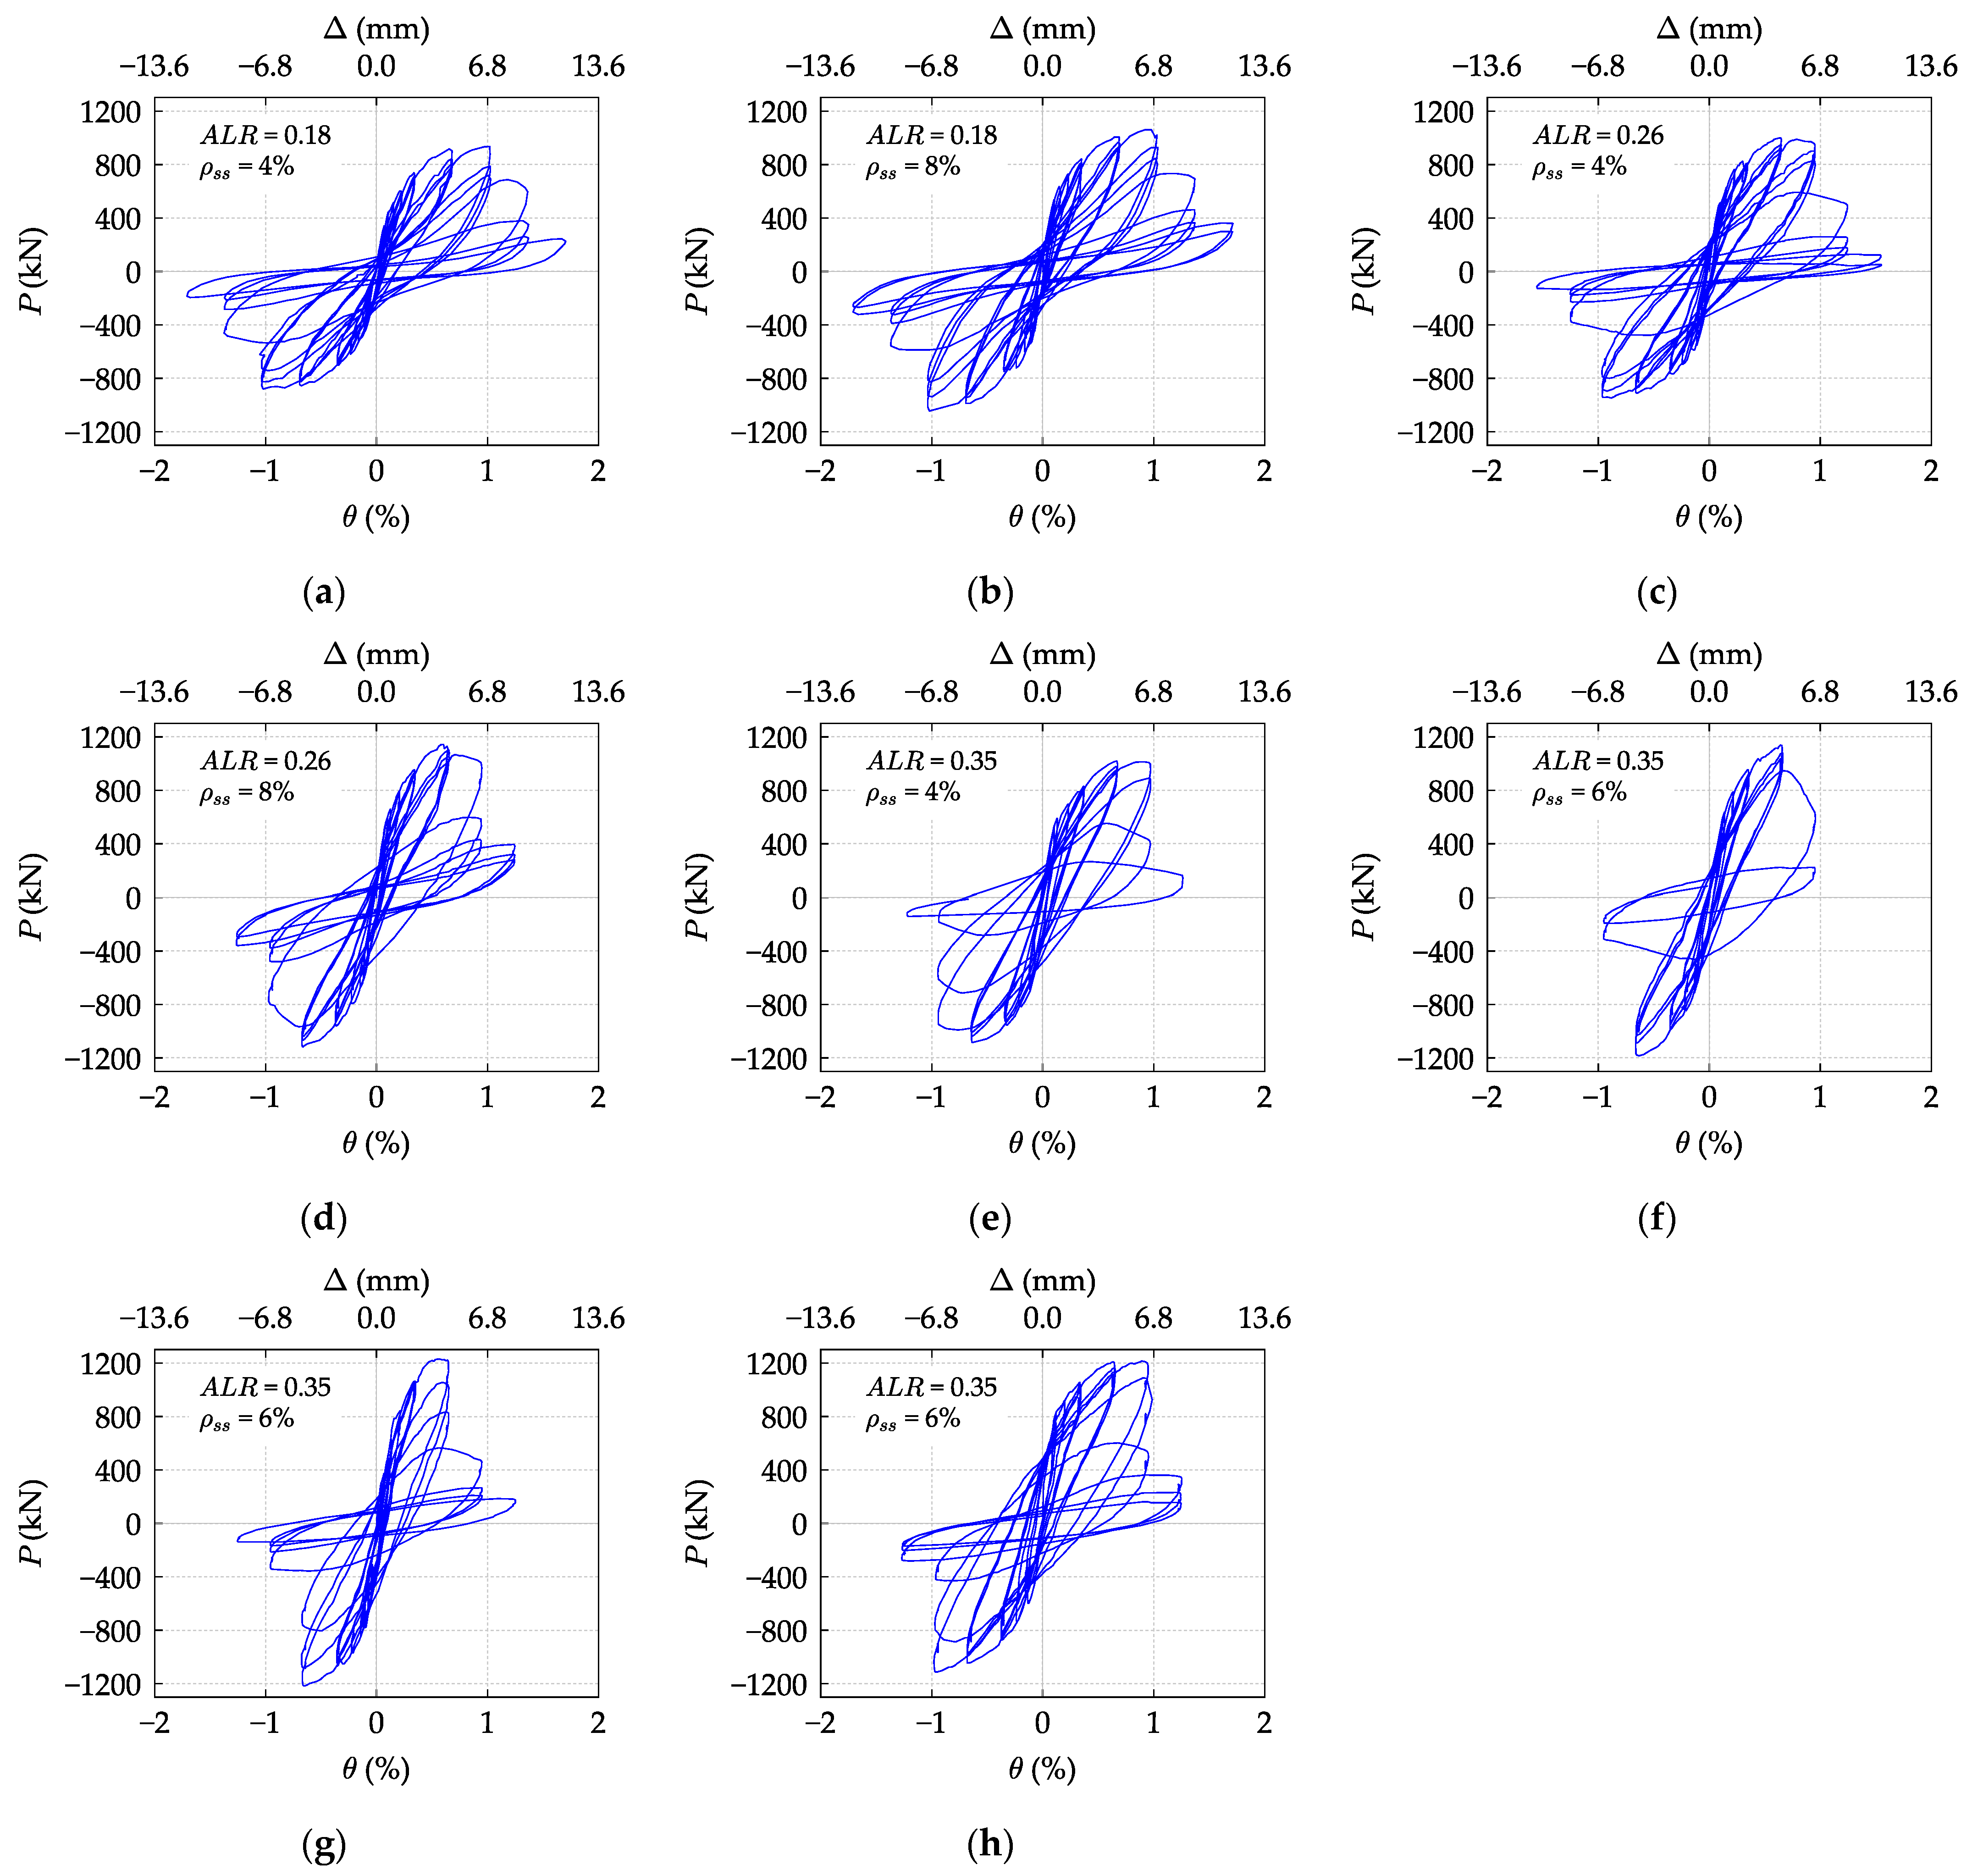
3.2. Hysteretic Response Curves

The load-deformation hysteresis curves, as depicted in Figure 9, can intuitively demonstrate the seismic behavior of the SRC specimens. All the hysteresis loops showed no significant pinch phenomenon. However, most of the loops were relatively narrow, indicating that the energy dissipation capacity of structural steel was not fully exhibited. Before the yielding of the specimens, the loading and unloading curves almost overlapped, indicating that the damage extent was slight. In the pre-peak stages, the residual deformation was small, while it continuously became larger in the post-peak stages. At the same time, the strength deteriorated significantly within the three cycles of the same drift level after the peak strength.

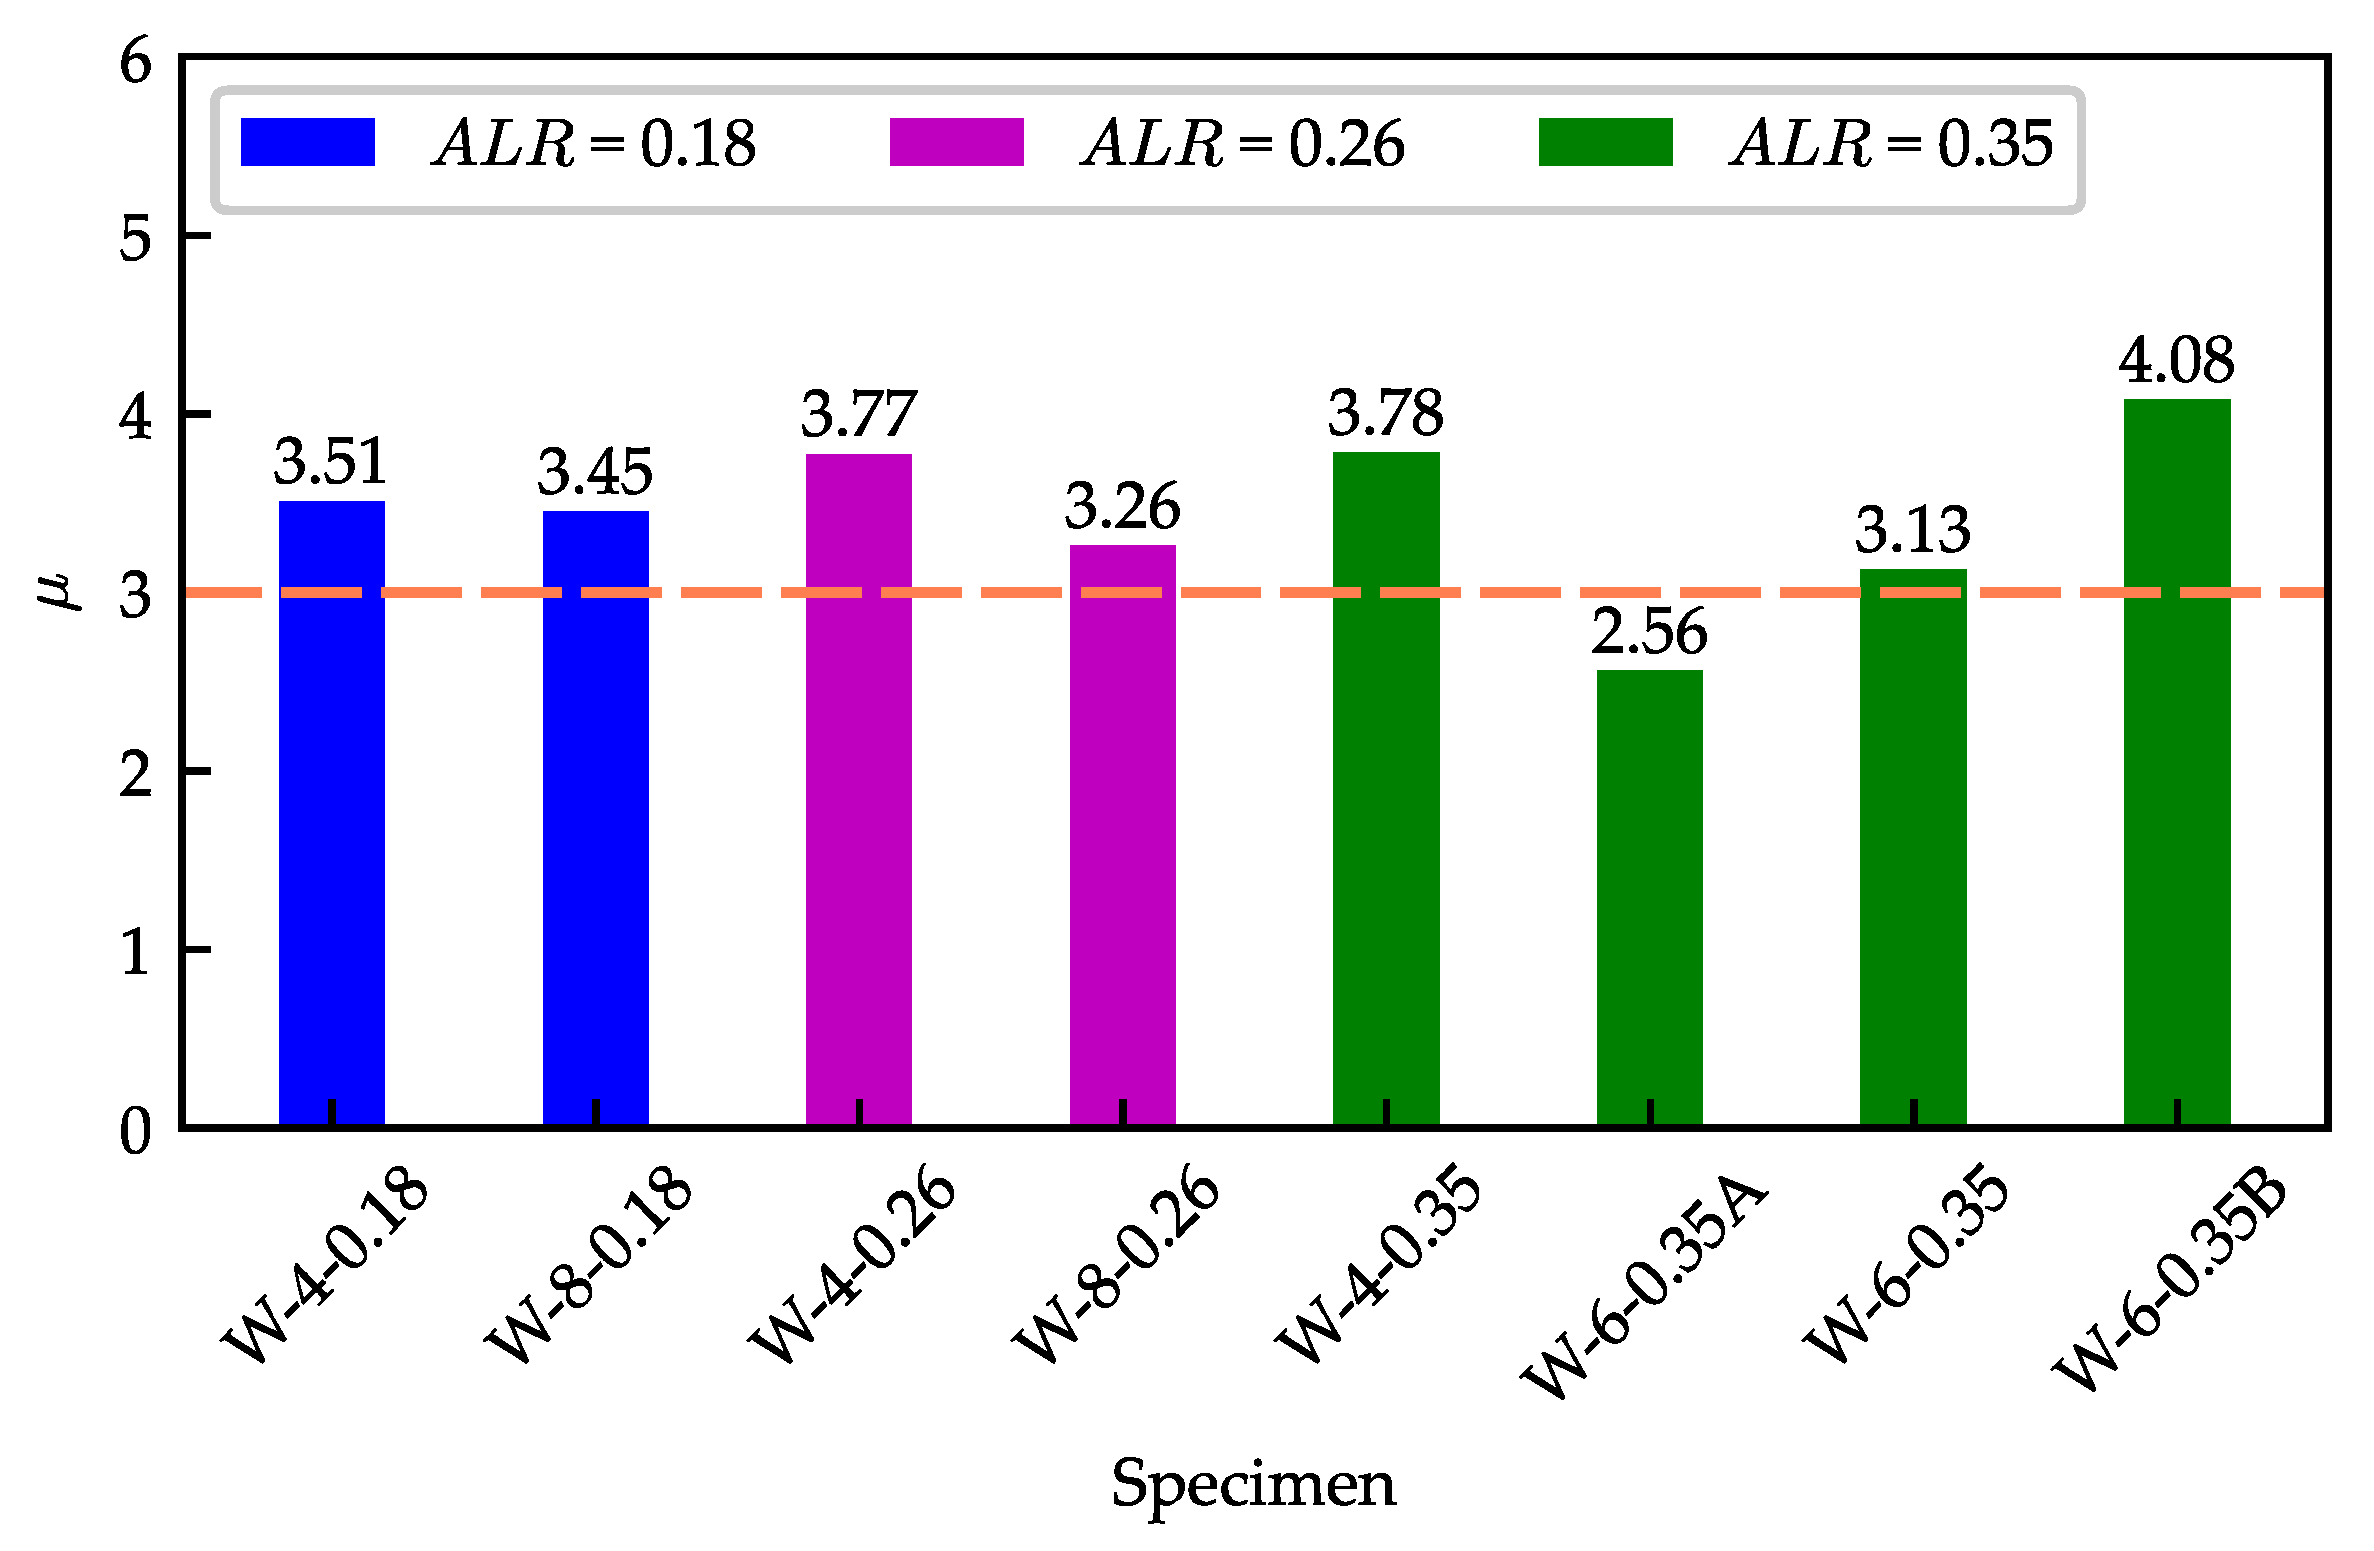
3.3. Strength and Ductility Coefficient

The specimen backbone envelopes, as shown in Figure 10, were generated by connecting the peak points of the first cycle at each displacement amplitude. The points of initial cracking, equivalent yielding (calculated as the Park’s method [22]), peak strength, and shear failure (a 20% loss in lateral strength) are illustrated in Figure 10 and tabulated in Table 4. Similar drift ratios of initial cracking and equivalent yielding were observed from the backbone envelope curves. The most significant difference among the curves was that a higher ALR accelerated the degradation of lateral strength in the post-peak segment and reduced the deformation capacity of the specimens.
A comparison of the average peak strength of positive and negative loading directions for the specimens is shown in Figure 11. Under the same ALR, a higher steel ratio resulted in higher lateral strength. Improvements of 15.99% and 16.10% were observed when ρ s s increased from 4% to 8% for specimens with ALRs of 0.18 and 0.26, respectively. For specimens with an ALR of 0.35, the lateral strength increased 16.37% when ρ s s increased from 4% to 6%.
Additionally, a higher ALR resulted in higher lateral shear strength. The lateral strength increased 15.88% when ALR increased from 0.18 to 0.35 for specimens with a ρ s s of 4%. A rise of 7.41% was observed when ALR increased from 0.18 to 0.26 for specimens with a ρ s s of 8%. However, no noticeable effect of horizontal reinforcement ratio on shear strength was recorded, as specimens W-6-0.35A and W-6-0.35B had almost the same shear strength while the horizontal reinforcement ratio of specimen W-6-0.35B became double. This phenomenon is consistent with the conclusion drawn by Paulay [23].
The ductility assessment of the SRC shear walls is performed using the displacement ductility coefficient μ, which is calculated by Equation (2)
μ = Δ u Δ y = θ u θ y
where Δ y   ( θ y ) is the yield displacement (drift ratio) which is determined using the method proposed by Park [22]; and Δ u ( θ u ) is the ultimate displacement (drift ratio) corresponding to a 20% reduction in lateral strength.
The average ductility coefficient of the positive and negative loading directions is shown in Figure 12. With the increase in steel ratio ρ s s , the ductility coefficient decreased. This is because the shear strength deteriorated more rapidly once the peak strength was attained for specimens with higher ρ s s , as shown in Figure 10. Larger ρ s h was clearly beneficial to the ductility coefficient. With ρ s h increased from 0.25% to 0.50%, the ductility coefficient increased from 2.56 to 4.08. Except for specimen W-6-0.35A, of which ρ s h was reduced to 0.25%, all the other specimens developed a ductility coefficient greater than 3.0. This implies that squat SRC shear walls with high ALRs still possess ductile deformation capacity if ρ s h is at least 0.35%.

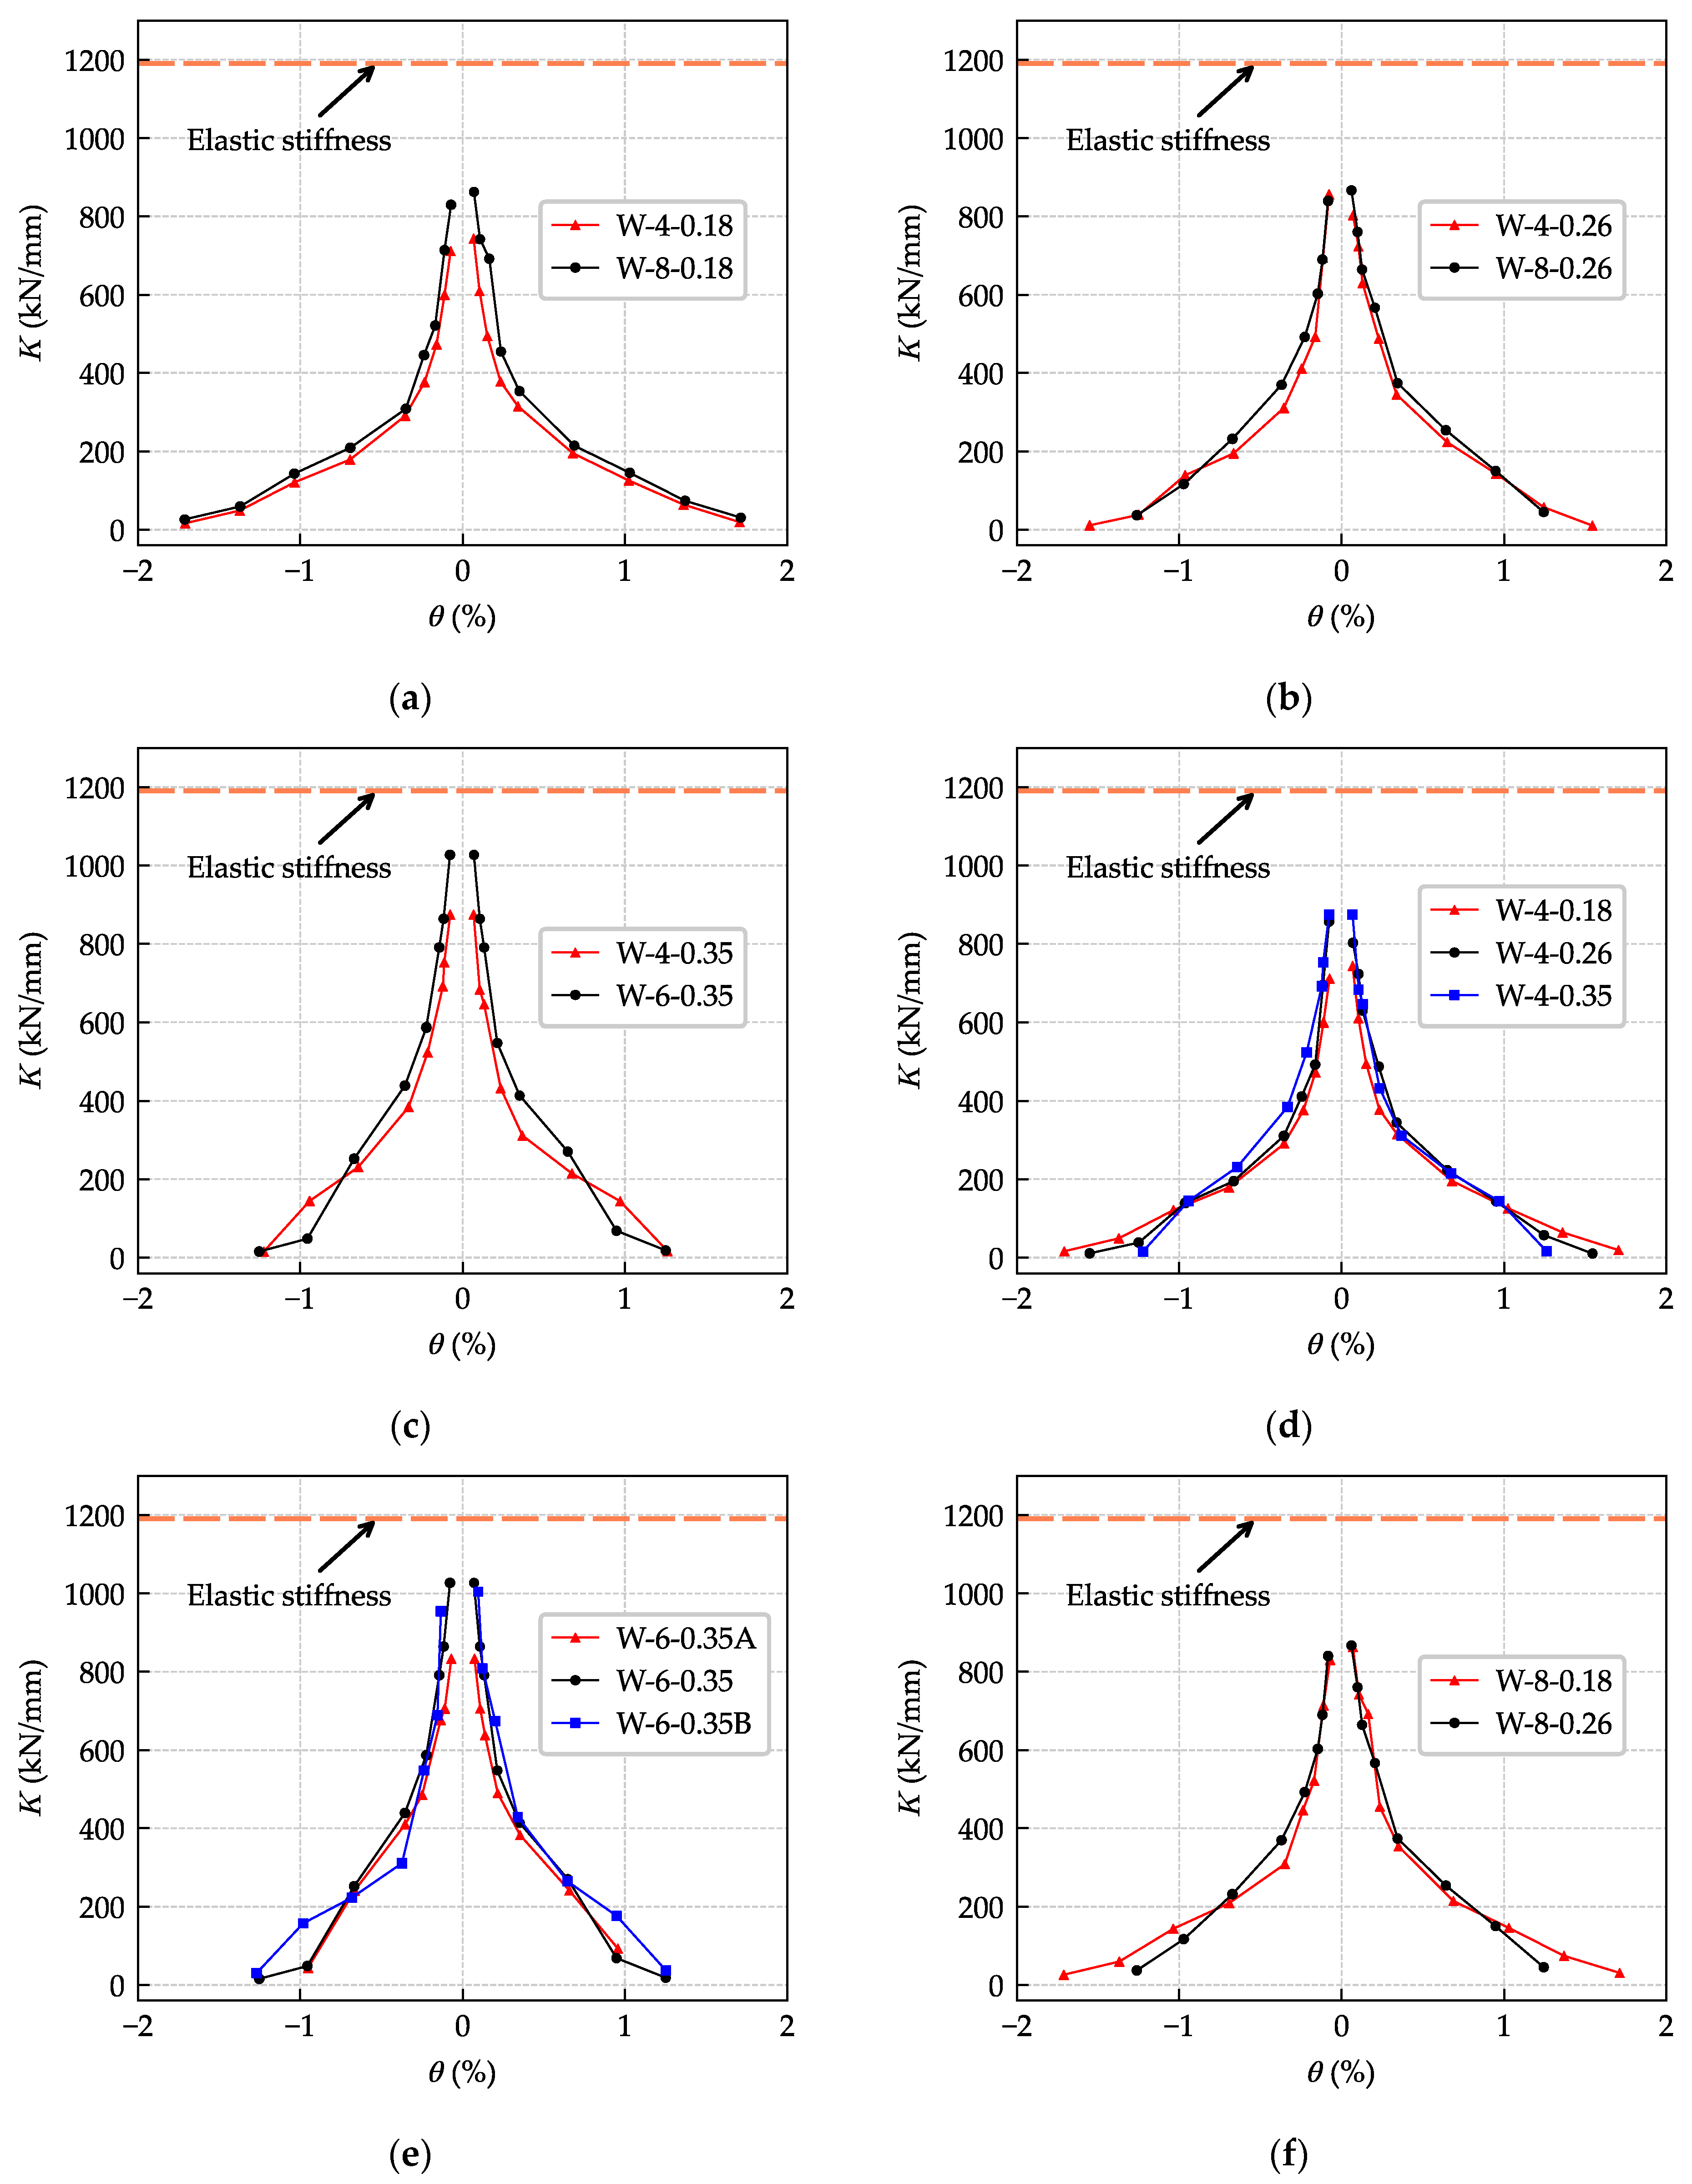
3.4. Stiffness Degradation

Secant stiffness was adopted to evaluate the stiffness degradation of the SRC wall specimens during cyclic loading. Secant stiffness K i was calculated using Equation (3),
K i = P i Δ i
where Δ i and P i   are the loading displacement and the corresponding lateral load of the first cycle at the i th displacement level, respectively.
Figure 13 depicts the variation curves between the secant stiffness and the drift ratio. Generally, the measured initial secant stiffness increased with the increase in the steel ratio and the ALR. Horizontal reinforcement ratio also had a significant effect on the initial stiffness. For specimen W-6-0.6A, of which the ρ s h was only 0.25%, the initial stiffness was significantly smaller than specimens W-6-0.6 and W-6-0.6B. This can be attributed to the greater amount of shrinkage micro-cracks formed during the curing period [24], since the ρ s h was smaller. With the increasing drift level, the stiffness degradation was almost the same for all the specimens when the drift ratio was smaller than 0.3%, approximately equal to the yield drifts. After that, the stiffness degradation became gentler. At the failure stage, the lateral secant stiffness was only 10~30 kN/mm, less than 5% of the measured initial secant stiffness.
The dashed line in Figure 13 denotes the average elastic lateral stiffness (1191.5 kN/mm) of the tested SRC walls with the three different steel ratios [21]. The elastic stiffness K e of the SRC walls was calculated as
K e = 1 ( H 3 3 E I + μ H G A )
E I = E c I c + E a I a
G A = G c A c + G a A a
where H is the height of the shear wall; E c and E a are the modulus of elasticity of the concrete and steel shapes, respectively; G c and G a are the shear modulus of elasticity of the concrete and steel shapes, respectively; I c and I a are the moment of inertia of the concrete section and the steel shapes about the elastic neutral axis of the wall section, respectively; and μ is the nonuniform factor of shear stress distribution, taken as 1.2.
As seen in Figure 13, the measured initial stiffness was smaller than the calculated elastic lateral stiffness. The average ratio of the measured initial stiffness to the calculated elastic lateral stiffness was 0.74, and the coefficient of variation was 0.10. Actually, the shrinkage micro-cracks formed during the curing period [24] and the tiny cracks that occurred under the lateral load caused the measured initial stiffness to be smaller than the calculated elastic lateral stiffness. Since micro-cracks are common in SRC components, this paper recommends a reduction factor of 0.74 for the calculation of the initial lateral stiffness of squat SRC walls using Equations (4)–(6).

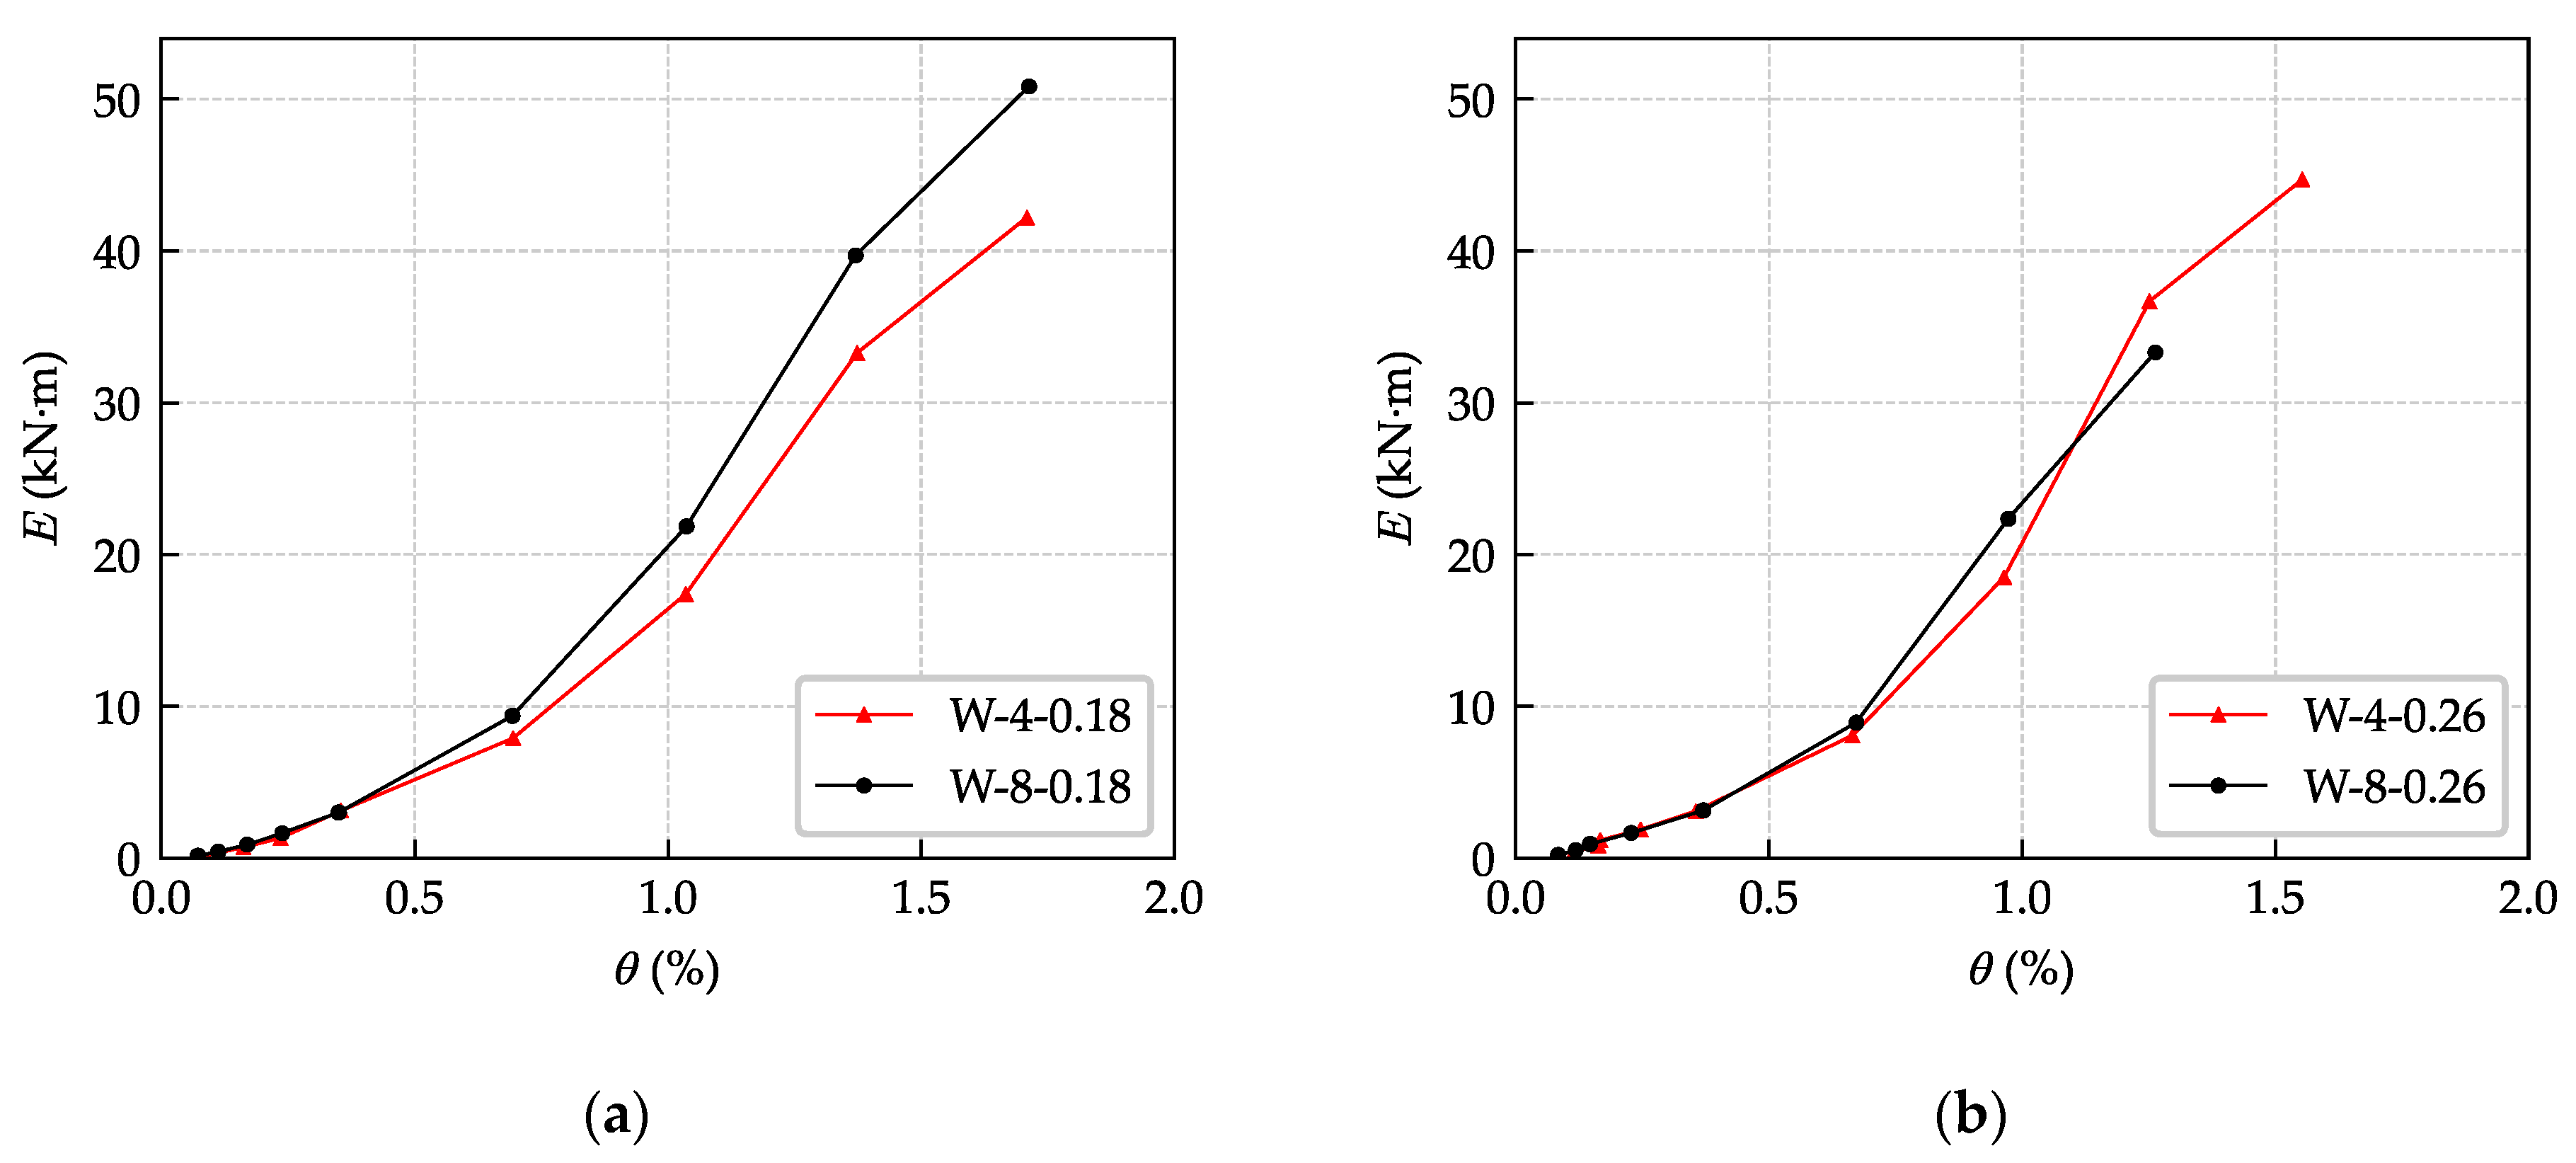
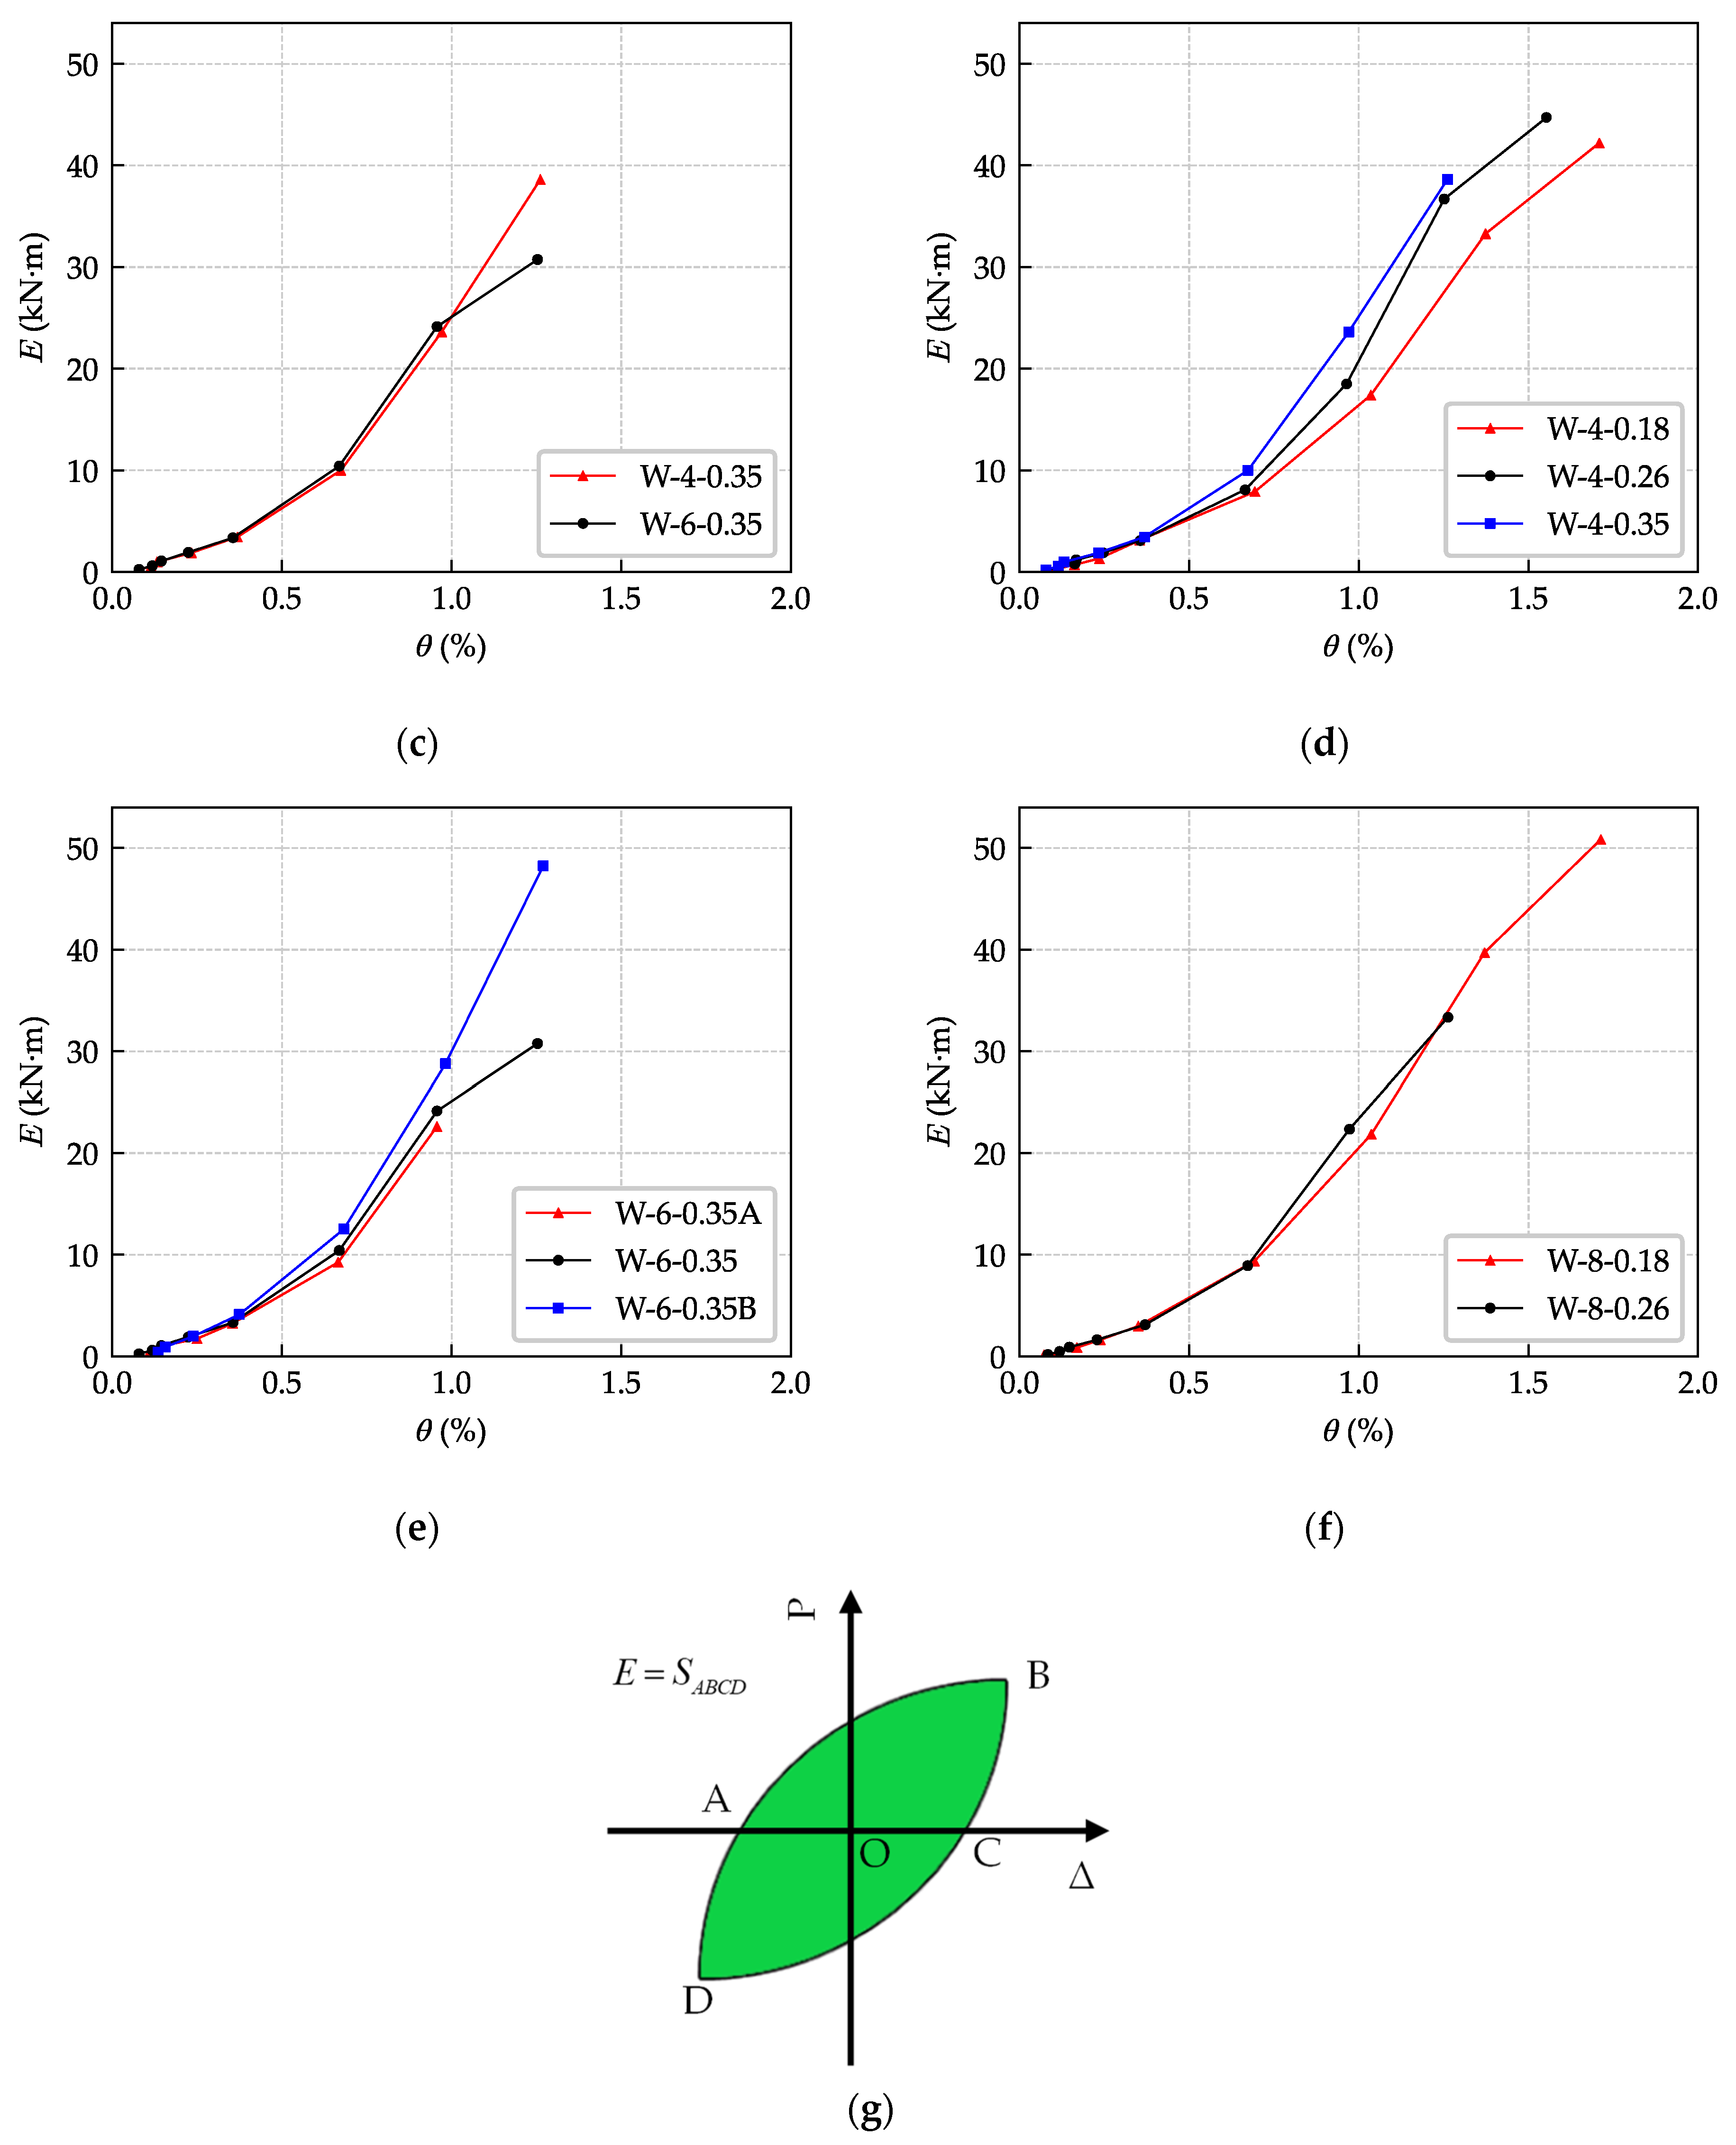
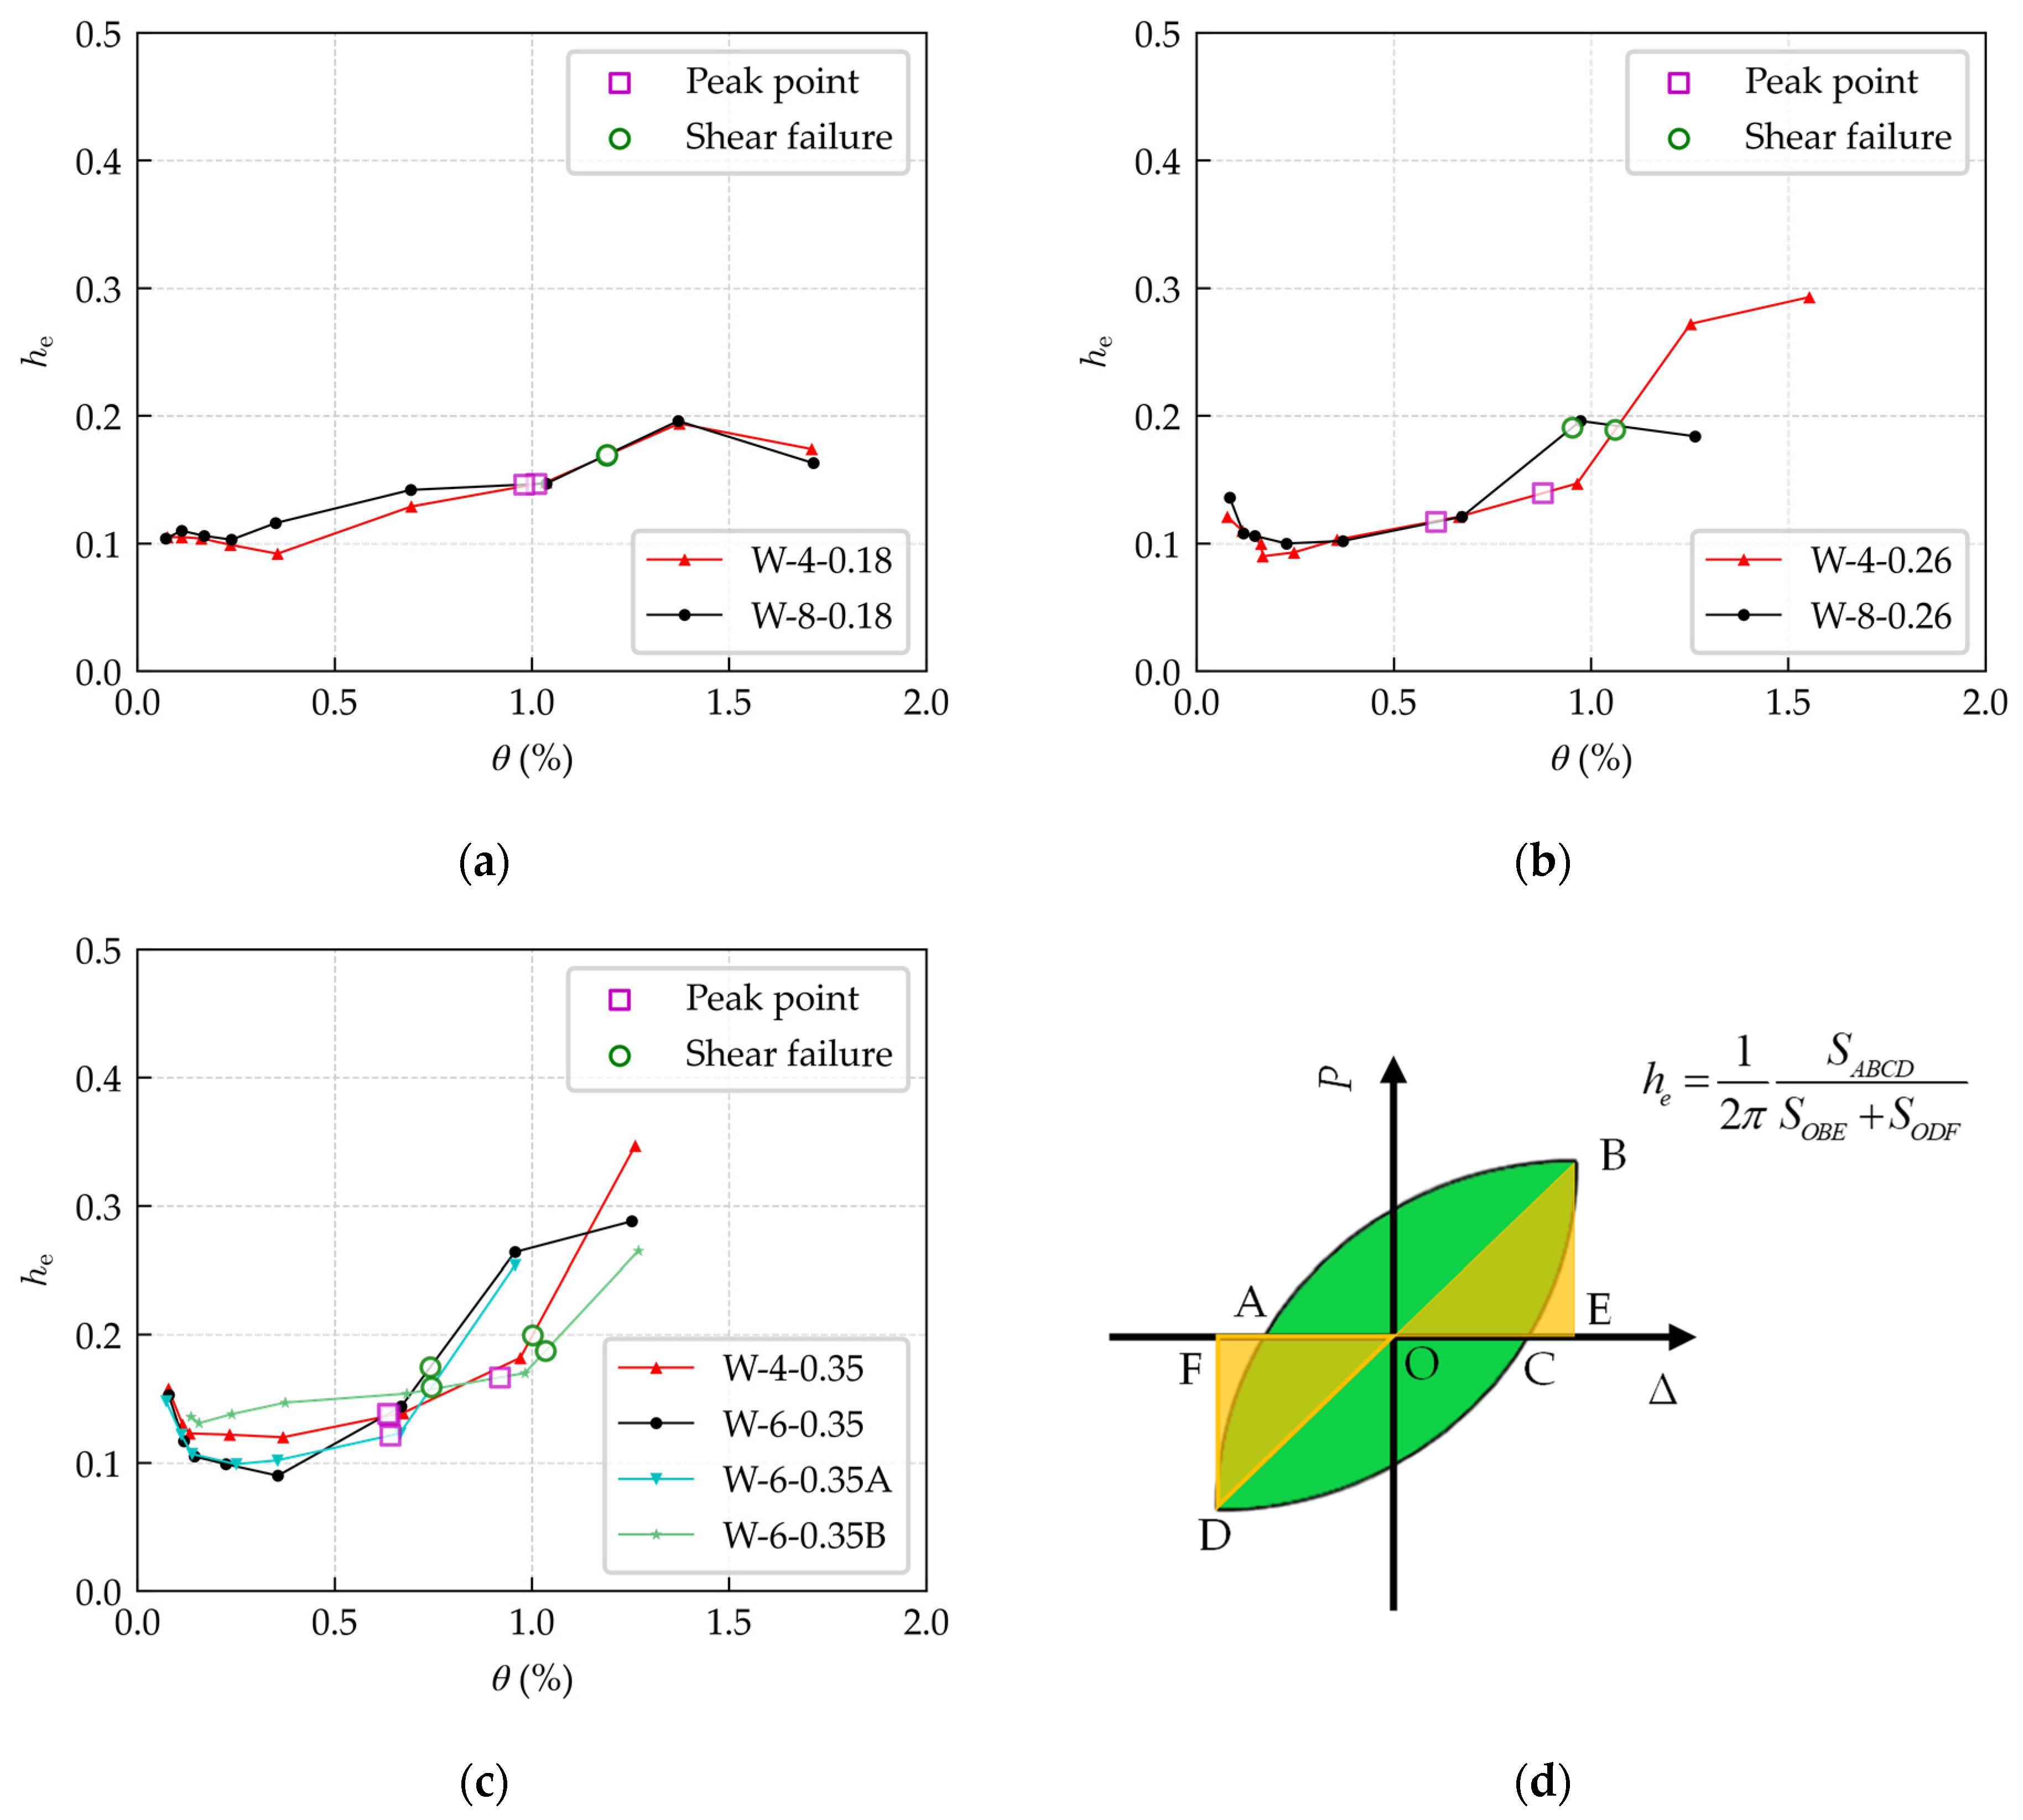
3.5. Energy Dissipation Capacity

Under earthquake action, the energy absorbed by structures is dissipated mainly through the plastic deformation of the components. Thus, the energy dissipation capacity of the components is essential to the seismic performance of structures. The cumulative dissipated energy E and the equivalent viscous damping coefficient h e were calculated to demonstrate the energy dissipation capacity of the SRC shear walls. The cumulative dissipated energy E is defined as the summation of the area enclosed by each hysteretic loop. The equivalent viscous damping coefficient h e is defined as the ratio of the energy dissipated in a hysteretic loop to the energy dissipated in an elastic stage of the cycle [25]. As shown in Figure 14, a larger structural steel ratio increased the total dissipated energy when the ALR was 0.18, while an inverse relationship was observed when ALRs were 0.26 and 0.35. An increase in ALR reduced the total dissipated energy, as seen in Figure 14d,f. It is noted that more horizontal reinforcements led to rapid growth in the energy dissipation capacity. When ρ s h increased from 0.25% to 0.50%, the total dissipated energy also became double (from 23 kN·m to 48 kN·m).
Figure 15 depicts the variation curves between the equivalent viscous damping coefficients h e and the drift ratio θ . Generally, h e increased gradually with the increase in the loading drift level. It is shown that a larger ALR resulted in a larger initial h e , which is calculated from the first loading loop. The initial h e was 0.11, 0.13, and 0.15, on average, for specimens with ALRs of 0.18, 0.26, and 0.35, respectively. The curves became steeper after peak shear capacity was attained. What is interesting is that h e significantly decreased after the shear failure for specimens W-4-0.18, W-8-0.18, and W-8-0.26, while this phenomenon did not occur in specimens with a higher ALR, i.e., 0.35. A greater horizontal distributed reinforcement ratio also enhanced h e , as seen from Figure 15c.

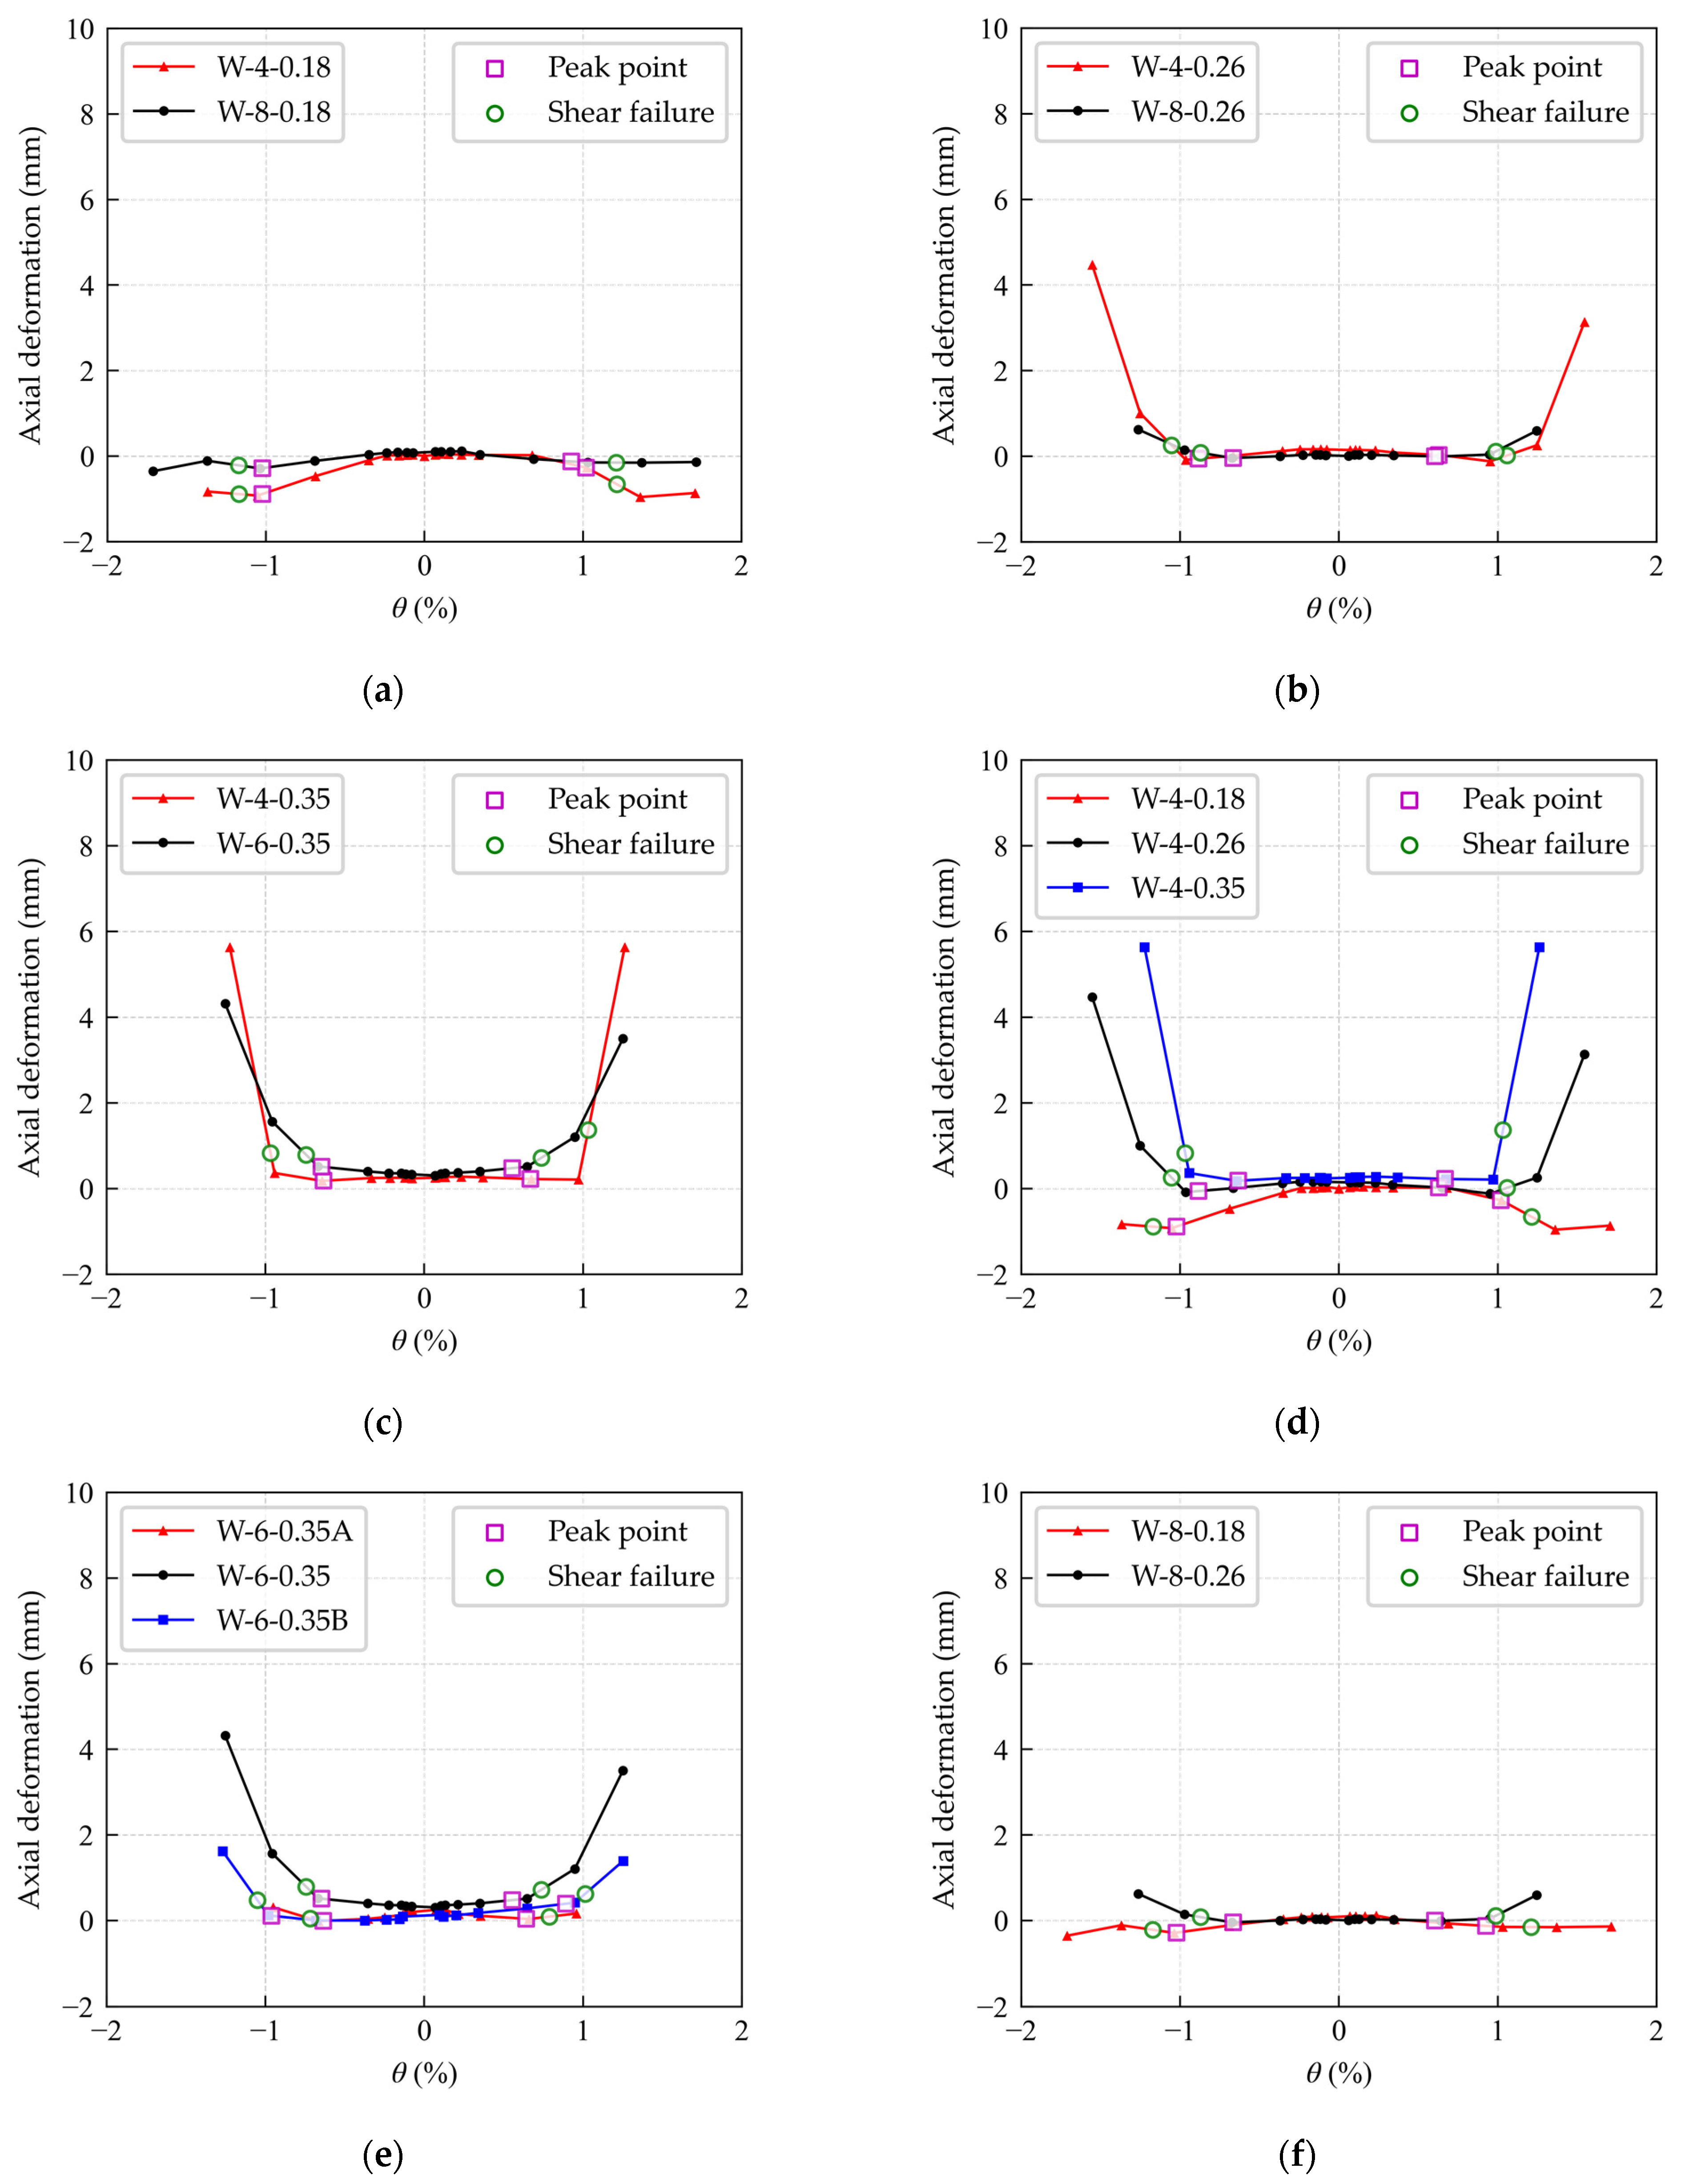
3.6. Axial Deformation
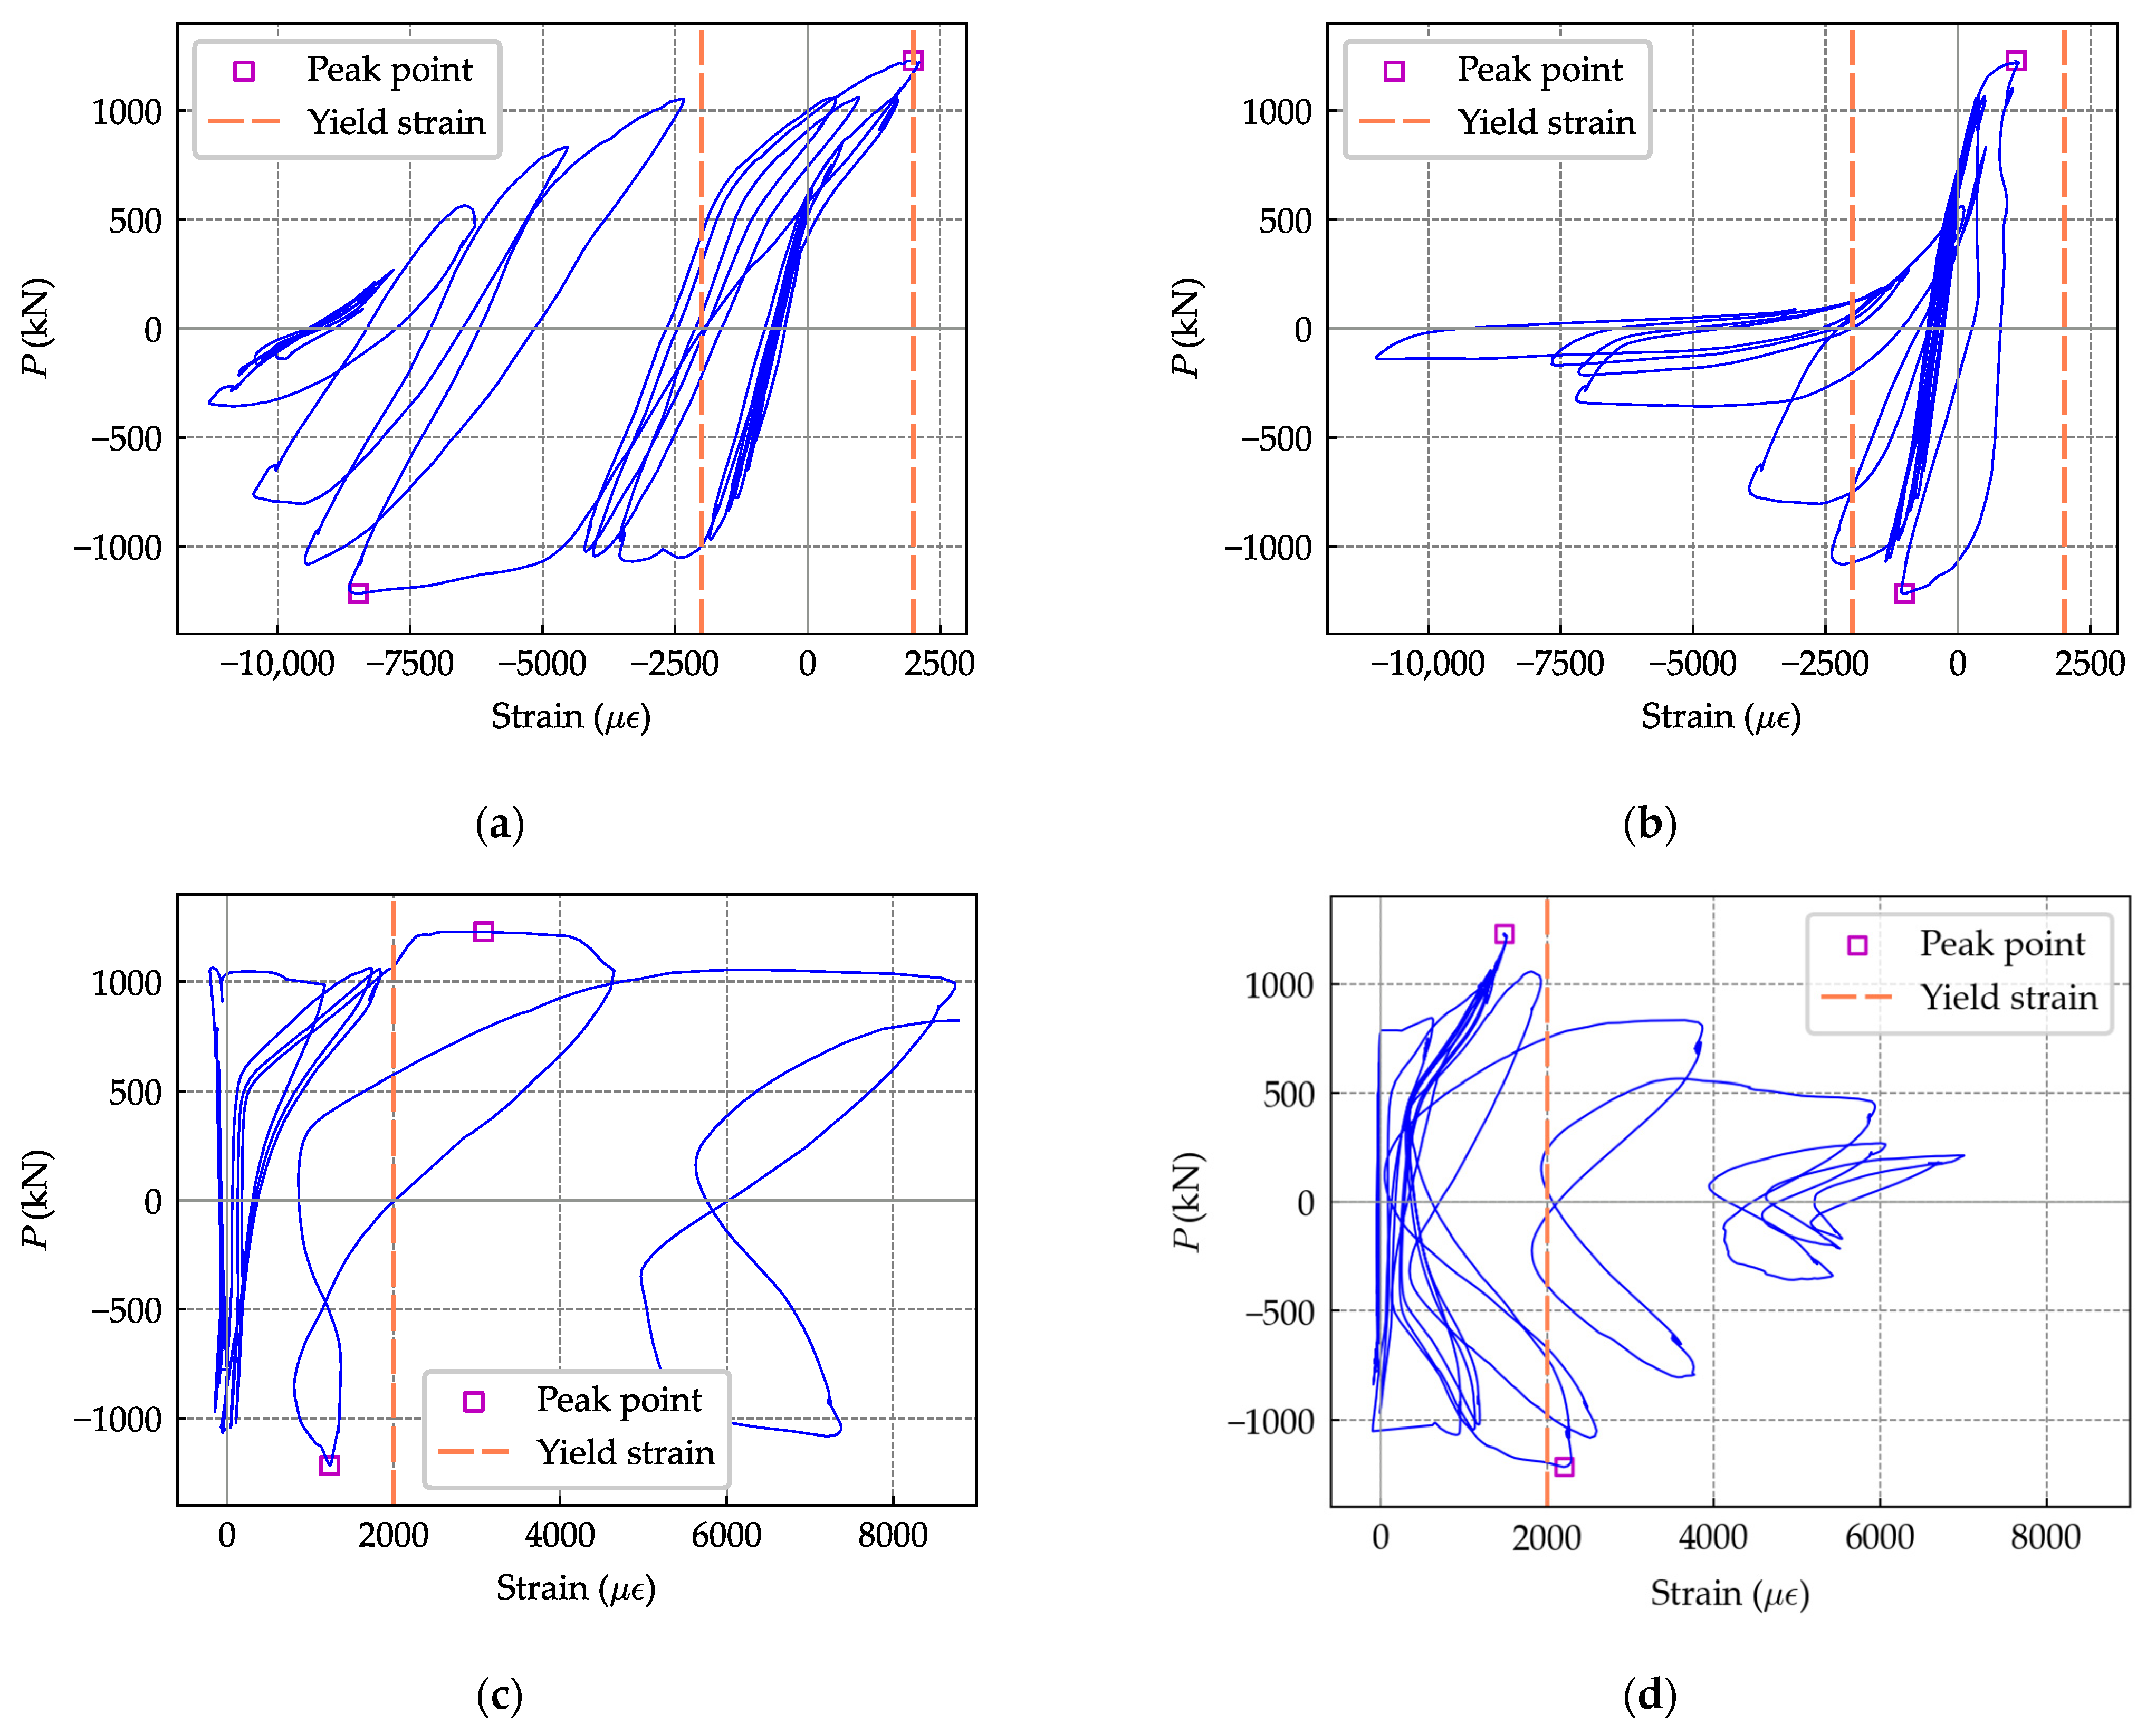
The axial deformation was taken from the average value of LVDTs 3 and 4 when the specimens were unloading and reverse loading to the zero displacements for each imposed drift level. It should be noted that the shear and flexural deformation components included in the total deformation measured by LVDTs 3 and 4 were very small at zero displacements and were reasonably ignored. Figure 16 shows the variation curves of the axial deformation of the specimens versus the imposed drift levels. In Figure 16, positive deformation data represent axial shortening, and negative values represent axial elongation. Specimens W-4-0.18 and W-8-0.18, with a relatively small ALR, had a phenomenon of axial elongation during the loading procedures, as seen from Figure 16a. This is because the tensile plastic strain of the reinforcement and steel cannot be fully recovered, and the tensile cracks cannot be completely closed during unloading and reversed loading.
On the contrary, axial shortening deformation was detected in the rest specimens with ALRs of 0.26 and 0.35, as shown in Figure 16b,c,e. It can also be seen that axial shortening deformation increased rapidly after the shear failure for specimens with ALRs of 0.26 and 0.35. The maximum axial shortening deformation of specimen W-4-0.35 is even larger than 5 mm at the final stage. As seen from Figure 16d,f, a higher ALR resulted in a larger specimen axial shortening deformation, whether the steel ratio was 4% or 8%. However, the axial deformation of the specimens with a steel ratio of 8% was smaller than that of the specimens with a steel ratio of 4%. It was observed that the axial shortening deformation of the specimen mainly resulted from the concrete crushing in the shear compression zones, and the buckling deformation of the steel profiles under the combination of compressive and shear stresses. The specimens with a steel ratio of 8% had a smaller axial shortening deformation than specimens with fewer steel ratios since buckling was less likely to occur in thicker steel plates.
Although the maximum axial deformation was larger than 5 mm, axial failure did not happen for all the specimens because the encased boundary elements alone could withstand the axial load. Since the boundary elements can be viewed as encased composite columns, their compressive strength can be estimated from the limit state of flexural buckling, using the equation (I2-2) proposed in AISC 360-16 [26]. This shows that the boundary elements can withstand axial loads of 1980 kN, 2209 kN, and 2477 kN for specimens with steel ratios of 4%, 6%, and 8%, respectively. Dividing the axial bearing capacity of the boundary elements by the maximum axial loads imposed on the specimen leads to safety factors of l.36, 1.45, and 1.50 for specimens with steel ratios of 4%, 6%, and 8%, respectively. Thus, this reasonably explains why no axial failure happened to the specimens even though the web concrete was crushed and the axial load transition was destroyed.
The validity of the encased steel shapes on the axial load capacity of the SRC shear walls can also be verified through a comparison with the conventional RC shear wall test conducted by Looi [7]. As reported by Looi [7], axial collapse took place right after the shear failure (a 20% loss of shear strength) for RC shear wall specimen C30-N-ALR02, which had an ALR of only 0.22. However, no axial collapse occurred for the SRC shear walls tested in this study, of which the ALR was up to 0.35, even though the shear strength deteriorated significantly.

3.7. Strains

The strain evolution curves of the typical specimen W-6-0.35 are shown in Figure 17. Similar strain characteristics were recorded in the tests of other specimens. In Figure 17, the positive and negative values represent strains in tension and compression, respectively. When the peak strength was attained in the positive loading, the longitudinal reinforcement strain (monitored by strain gauge Z5) exceeded yielding slightly, while the tensile strain of the structural steel (monitored by strain gauge F2) was smaller and did not yield. At the peak strength state in the negative loading, the longitudinal reinforcement strain exceeded the compressive yield strain greatly. Although the structural steel did not yield at the negative peak strength, it developed much more rapidly in the following negative loading levels, and greatly exceeded the compressive yield strain soon later. This implies that the structural steel played a more critical role in the post-peak stages. The structural steel did not attain the tensile yielding during the whole test procedure. The significant compressive strains for both the longitudinal reinforcement and the structural steel coincided with the phenomenon of the axial shortening deformation.
The strain of the horizontal reinforcement bars was close to or exceeded the tensile yield strain when the peak strength was attained. As measured by strain gauges SP3 and SP6, the strain of the horizontal reinforcement bars developed rapidly and formed large unrecoverable plastic tensile deformation due to the extension of the diagonal cracks in the post-peak loading cycles. This is consistent with the observation of the rapid deterioration of lateral strength.

4. Strength and Deformation Evaluation

4.1. Shear Strength Evaluation

Two predictive formulas of the shear strength of SRC shear walls are evaluated in this study. The first one is the formula proposed in the Chinese code JGJ 138-2016 [21]. A superimposition method is adopted in JGJ 138-2016 [21] to calculate the shear strength of SRC shear walls. The shear strength of the SRC shear wall is assumed to be contributed by four parts, namely, concrete, the benefit of axial load, horizontal distributed reinforcement, and structural steel. The shear strength formula is shown as Equation (7)
V = 1 λ 0.5 ( 0.4 f t b w h w 0 + 0.1 N A w A ) + 0.8 f y h A s h s h w 0 + 0.32 λ f a A a 1
where λ is the shear span ratio (SSR) and is limited to 1.5–2.2; f t is the design tensile strength of the concrete, f t = 0.395 f c 0.55 ; b w is the thickness of the wall; h w 0 is the effective shear depth; N is the axial load and limited to 0.2 f c b w h w 0 ; A is the gross section area of the wall; A w is the section area of the web, taken as A for rectangular walls;   f y h is the yield strength of the horizontal reinforcement bars; A s h is the total area of the horizontal reinforcement in a spacing of s ; s is the vertical spacing of horizontal reinforcement; A a 1 is the cross-section area of structural steel in the wall boundary of one side; f a is the yield strength of the structural steel.
The formula proposed by Liu et al. [27] is the second one evaluated in this study. Previous studies [23,28] have pointed out that, for squat shear walls, the contribution of vertical distributed reinforcement to the shear strength is significant and should not be ignored. Taking vertical distributed reinforcement into account, Liu et al. [27] proposed a shear strength formula for squat SRC shear walls, based on a regression analysis of test data, as shown in Equation (8).
V = ( T c f c + T h f y h ρ s h + T v f y v ρ l v ) b h w 0 + T N N ( A w A ) + T s f v 1 A a w
where T c , T h , T v , T N , and T s are the contribution coefficients of concrete, horizontal distributed reinforcement, vertical distributed reinforcement, axial load, and structural steel to the shear strength of the wall, respectively; ρ s h is the horizontal distributed reinforcement ratio; ρ l v is the vertical distributed reinforcement ratio; f v 1   is the shear strength of the structural steel, f v 1 = f a / 3 ; A a w is the web or the flange area, which is parallel to the loading direction; and other parameters are the same as defined in previous parts. The contribution coefficients were derived from a regression analysis. It is shown that the coefficients depend on λ . Liu et al. [27] proposed that T c = 0.15 0.05 λ ; T h = 2 λ 1 ; T v = 2 ( 1 λ ) ; T N = 0.12 ; T s is between 0.8–0.9, and is conservatively recommended as 0.8; and λ is limited to 0.5–1.0 for T h and T v .
The above equations were evaluated by the specimens tested in this study. Table 5 shows the shear strengths and their components calculated using Equations (7) and (8). The calculated-experimental strength ratios are shown in Figure 18. It can be seen that Equation (7) extremely underestimated the shear strength of the squat SRC shear walls, with a mean calculated-experimental strength ratio of 0.42 and a standard deviation of 0.03. Equation (8) produced a better prediction of the shear strength for the squat SRC shear walls, though the prediction was also conservative. For Equation (8), the mean calculated-experimental strength ratio was 0.74 and the standard deviation was 0.06.
The improvement of Equation (8) was achieved mainly by the increment of the concrete item V c , as well as the structural steel item V a . For Equation (7), the shear resistance contributed by the concrete item is 132 kN, increasing to 383 kN for Equation (8). The average ratio of V c to the total shear strength V c a l is 29.7% for Equation (7), and 48.3% for Equation (8). The shear resistance contributed by the structural steel item V a is 78~138 kN for Equation (7), and increases to 118~208 kN for Equation (8). As it can be seen, although the contribution of vertical reinforcement was taken into account, it weighed only 2%~2.7% of the total strength. Additionally, the calculated shear strength component of horizontal reinforcement V s h of Equation (8) was approximately equal to that of Equation (7). It is worth noting that the concrete item V c also includes some contributions such as the dowel action of the longitudinal bars and the structural steel. Thus, the concrete item is reasonable to be modified for SRC shear walls and differs from that of Equation (7), which regresses based on the test data of conventional RC walls.
Although the ductility was larger than 3.0 (with an exception of specimen W-6-0.35A), a safety margin should remain for squat SRC shear walls. Thus, the formula proposed by Liu et al. [27], without modifications, was recommended in this study given the limited test data. Furthermore, the formula for the shear strength of squat SRC shear walls may be improved so long as more experimental data are available.

4.2. Deformation Capacity Evaluation

In performance-based seismic design and the assessment of structures, a component should satisfy the acceptance criteria for a given performance level. Six discrete structural performance levels are defined in ASCE 41-17 [29], i.e., immediate occupancy (IO, S-1), damage control (DC, S-2), life safety (LS, S-3), limited safety (LiS, S-4), collapse prevention (CP, S-5), and not considered (NC, S-6). Among the six performance levels, IO, LS, and CP are three key ones. According to Tables 10–20 in ASCE 41-17 [29], the acceptance criteria of performance levels IO, LS, and CP for structural walls controlled by shear are 0.40%, 0.75%, and 1.0%, respectively.
To evaluate whether the deformation capacity of the SRC wall specimens satisfies the acceptance criteria of the ASCE 41-17 [29] provisions, the drift ratio capacity corresponding to each performance level should be derived from the experimental backbone curves first for every specimen. According to the provisions in ASCE 41-17 [29], CP should be determined as the onset of the axial collapse for the secondary component. However, no axial failure or collapse occurred in the test procedure, since the presence of the steel profiles improved the axial bearing capacity of the walls. Thus, the drift ratio at CP was taken conservatively as the maximum drift experienced by the specimens. The drift ratio of performance level LS was still taken as 0.75 times that of CP per ASCE 41-17 [29]. The generated drift capacity for the LS of the test specimens was also conservative. Performance level IO requires negligible permanent drift and accommodates minor cracks, so the drift capacity corresponding to IO was taken approximately as the midway point of the yield drift and the peak drift, according to the observed damage evolution processes. It is worth noting that the shear walls were regarded as the secondary components to determine the above drift capacity, since the internal force will be redistributed in all the structural components in nonlinear analysis procedures. The difference between the primary and secondary components has been exhibited in deformation demands calculated in nonlinear analysis procedures.
In Figure 19, the points corresponding to the drift limits of the three performance levels are marked. The dashed lines denote the acceptance criteria of IO, LS, and CP, respectively. It is shown that the drift capacity of the specimens is larger than the acceptance criteria proposed in ASCE 41-17 [29], with few exceptions. The mean drift capacity of the specimens regarding the IO, LS, and CP are 0.53%, 1.02%, and 1.35%, respectively. The comparison results are expected because the acceptance criteria in ASCE 41-17 [29] are proposed originally for RC shear walls. It is known that SRC shear walls have better deformation capacity than conventional RC walls because the encased steel sections can effectively prevent the wall from collapse, as shown in this study. The acceptance criteria of RC walls were adopted as alternates in this study since there are no reasonable drift limits for SRC shear walls. To promote the evaluation of the SRC shear walls, as well as other types of SRC components, more experimental data are needed to establish deformation acceptance criteria for these composite components.

5. Conclusions

To investigate the seismic behavior of squat SRC shear walls with high axial load ratios, this study performed an experimental program including nine squat SRC shear walls subjected to quasi-static loading. Based on the results of this study, the following key points can be drawn.
  • All the squat SRC shear walls failed in shear. After peak strength, the concrete of the web was crushed, causing the degradation of the lateral strength, the buckling of vertical reinforcement bars, and the redistribution of the axial load to the boundary elements. Axial shortening deformation increased rapidly after the peak strength for specimens with ALRs of 0.26 and 0.35. Although the maximum axial shortening deformation was larger than 5 mm, no axial failure occurred since the wall boundary elements encased with structural steel were capable of maintaining the axial bearing capacity after the web concrete was crushed. Additionally, a steel ratio of at least 6% prevented the steel sections from serious local buckling;
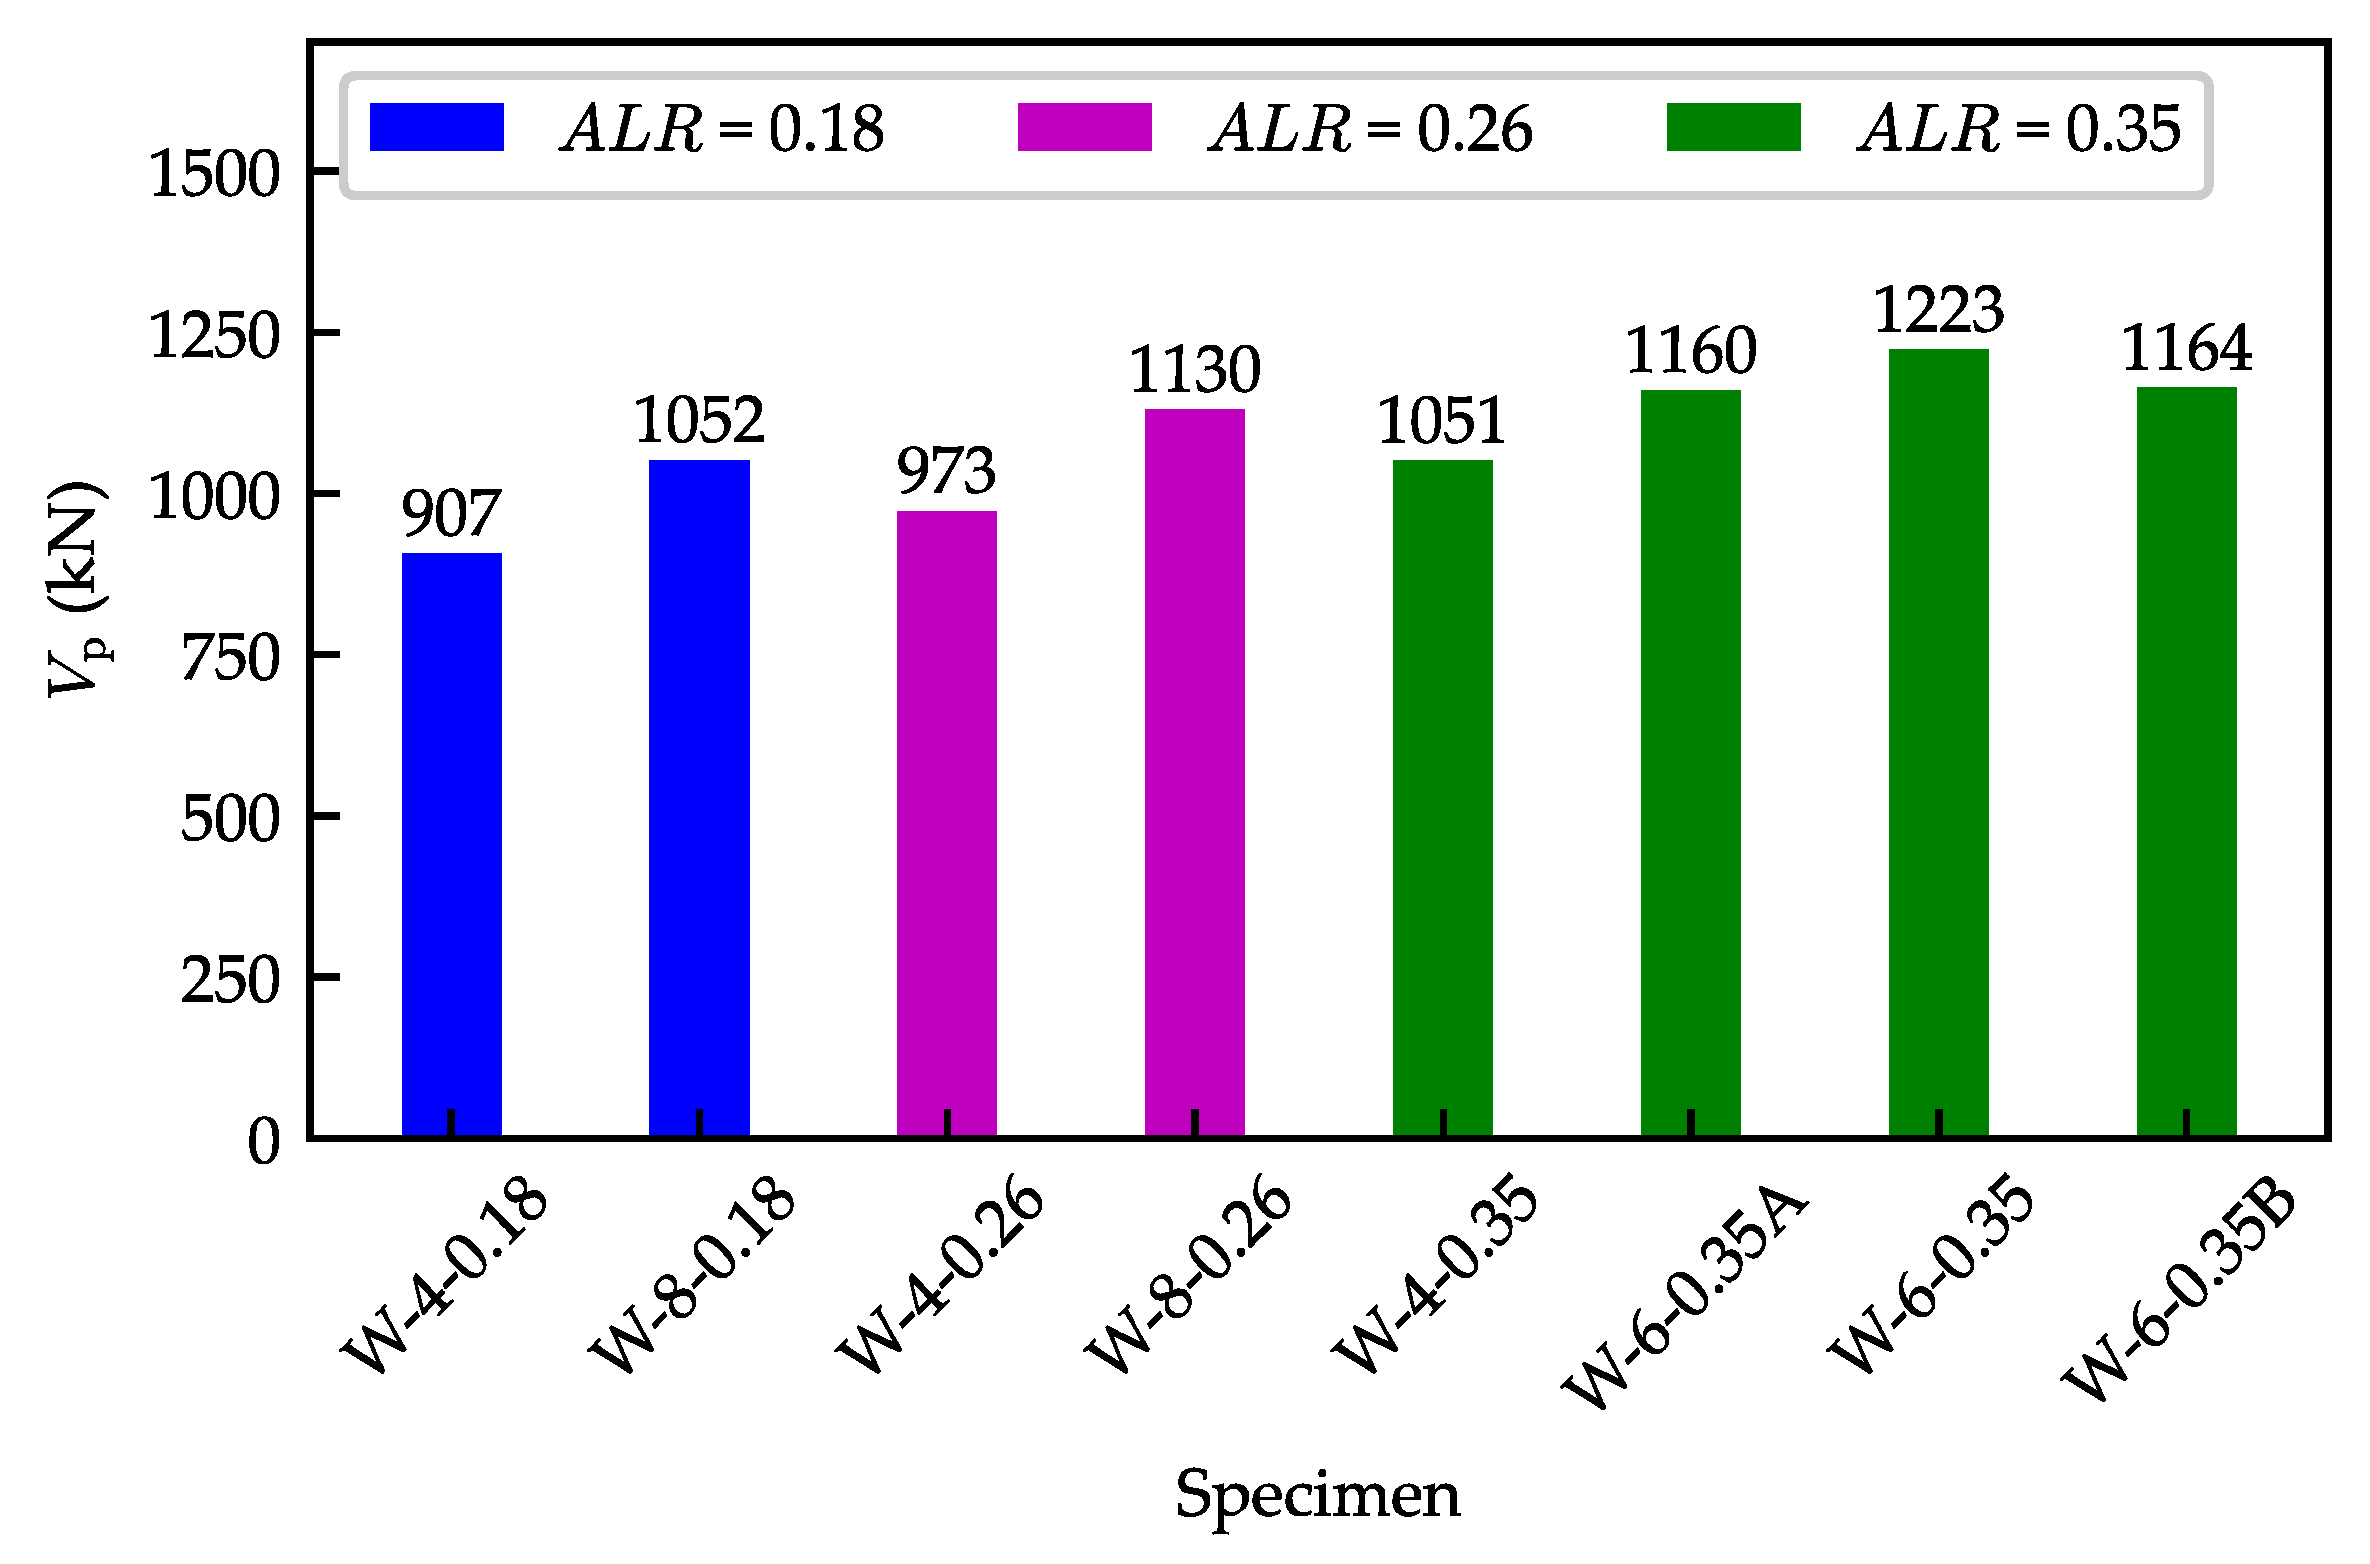
  • Larger steel ratios ρ s s increased the lateral shear strength of the squat SRC shear walls. The improvements were 15.99% and 16.10% when ρ s s increased from 4% to 8% for specimens with ALRs of 0.18 and 0.26, respectively. For specimens with an ALR of 0.35, the lateral strength increased by 16.37% when ρ s s increased from 4% to 6%;
  • The increase in ALR enhanced the shear strength yet reduced the deformation ability of the squat SRC shear walls. The lateral strength increased by 15.88% when ALR increased from 0.18 to 0.35 for specimens with ρ s s = 4%. The increment was 7.41% when ALR increased from 0.18 to 0.26 for specimens with ρ s s = 8%;
  • Larger horizontal reinforcement ratios ρ s h improved the energy dissipation capacity and the ductility of the specimens. To achieve a ductility larger than 3.0, ρ s h should be at least 0.35% for squat SRC shear walls. However, ρ s h had no significant effect on the shear strength;
  • A reduction factor of 0.74 is recommended for the initial lateral stiffness of squat SRC shear walls when calculated by Equations (4)–(6);
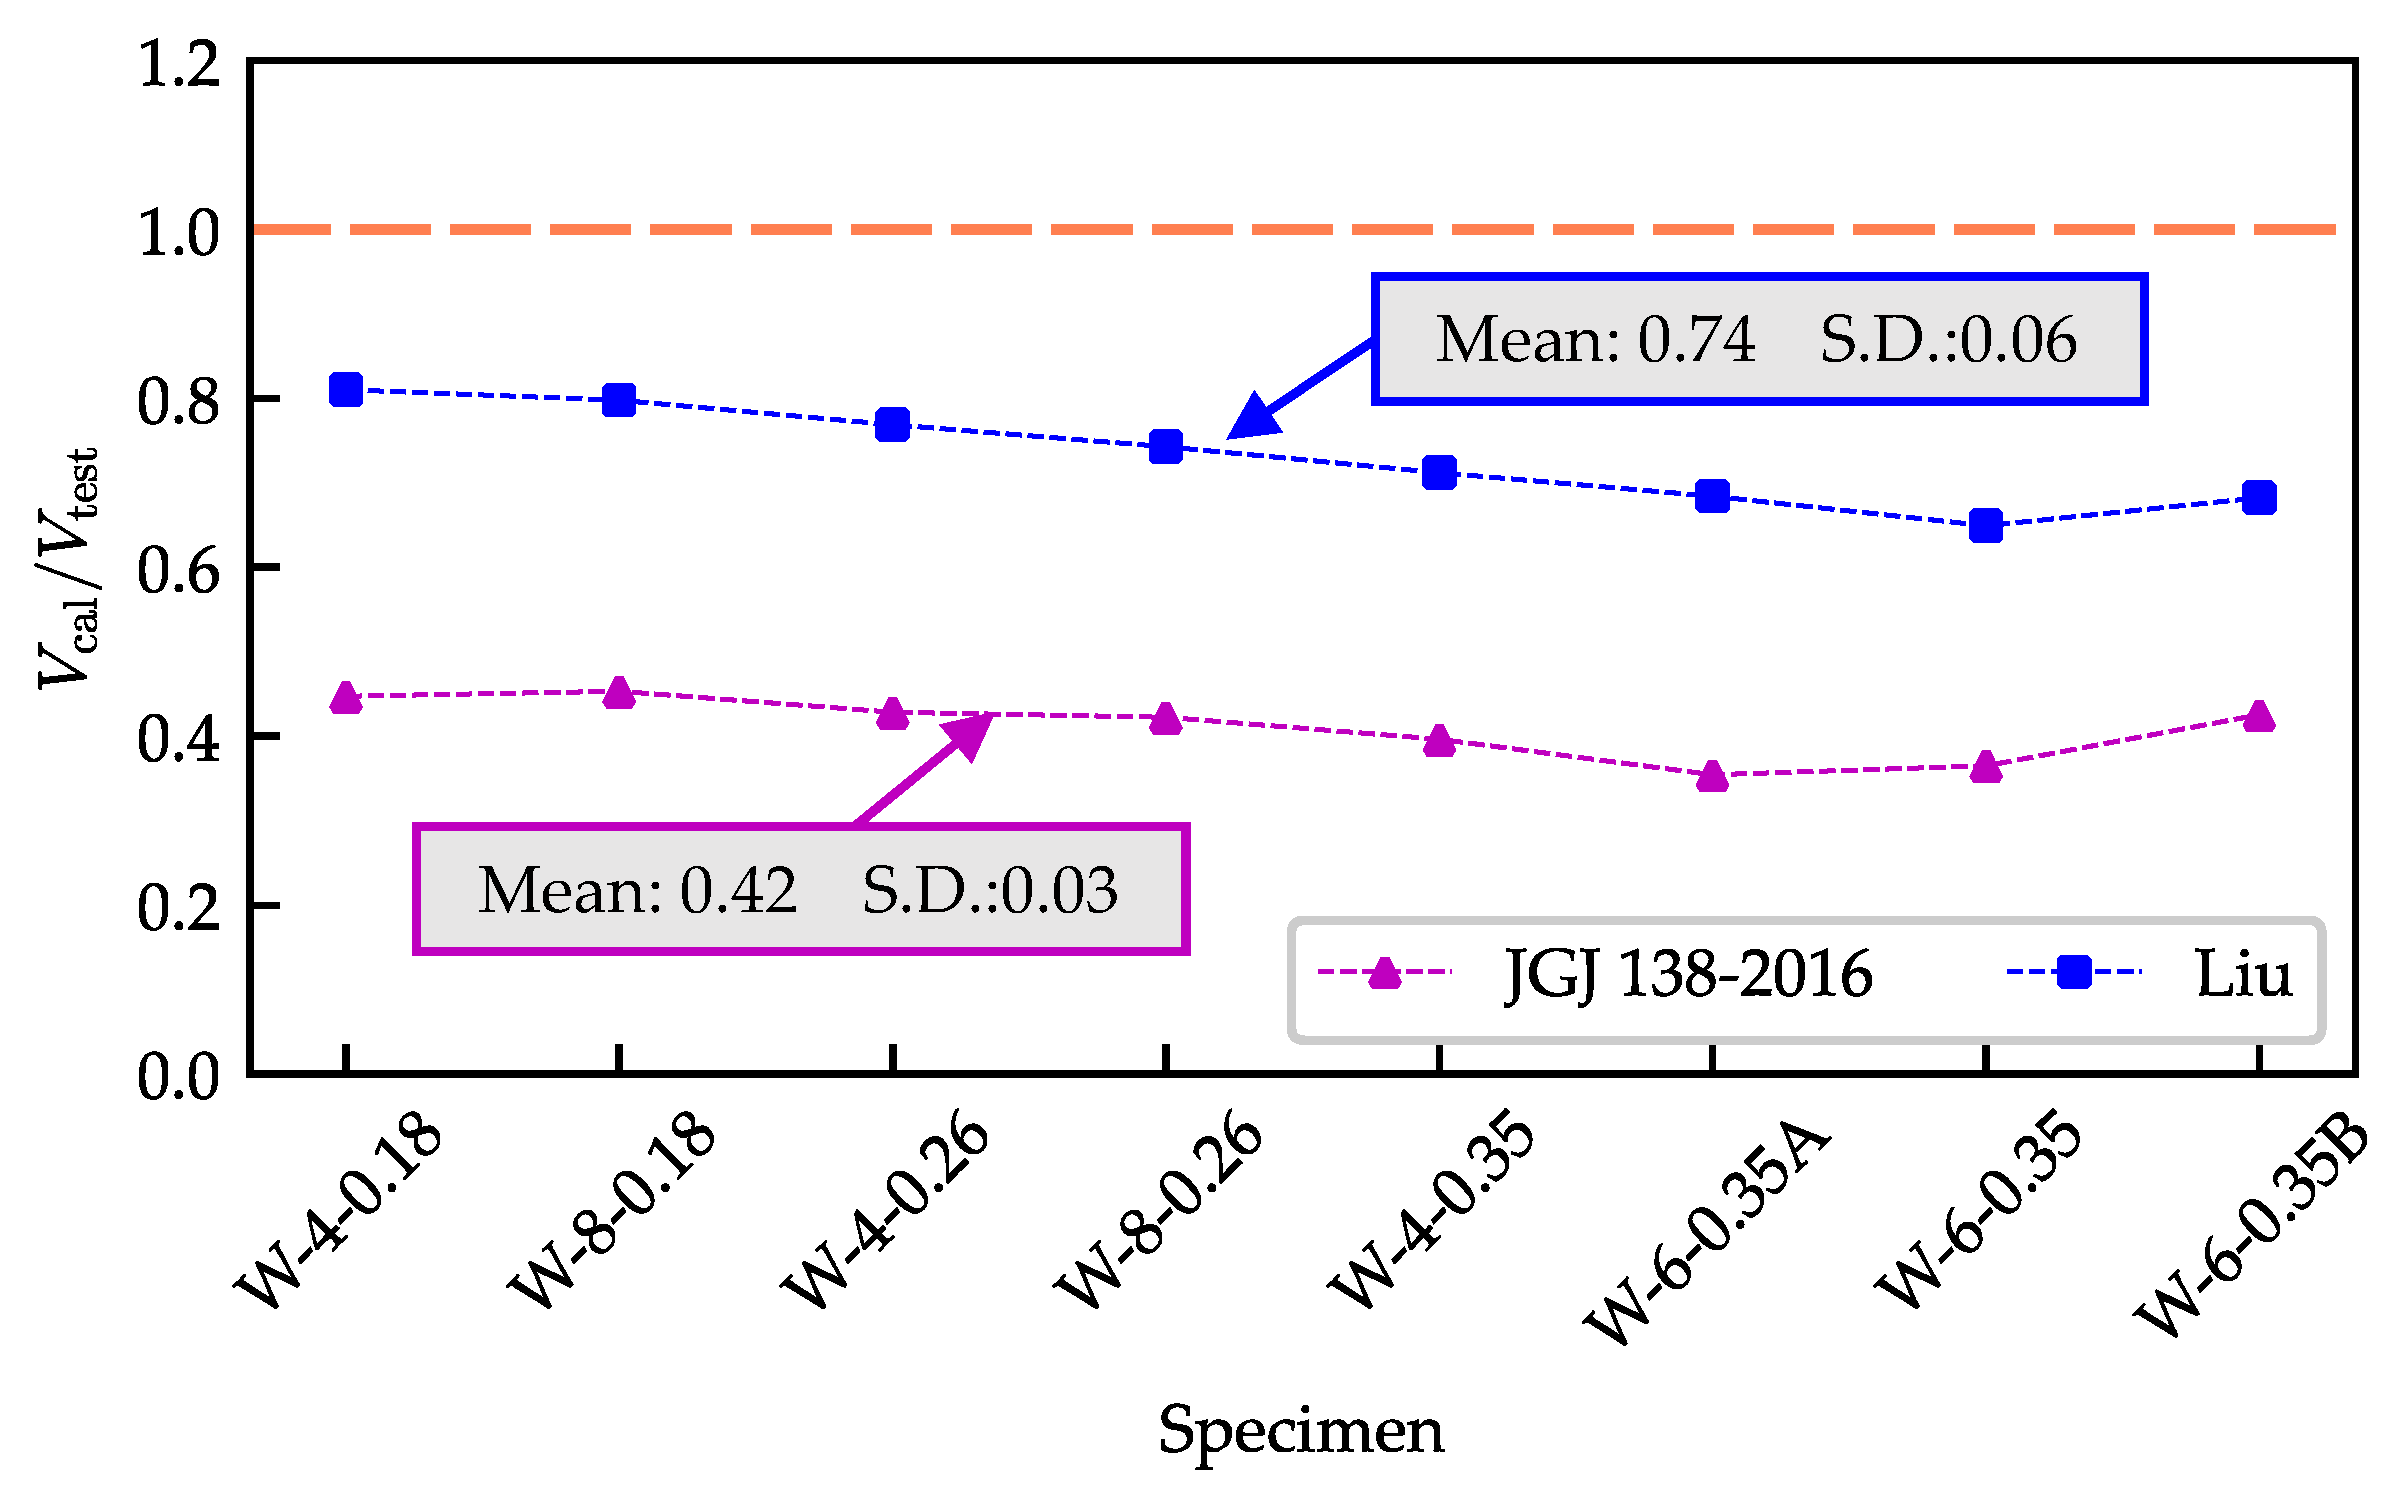
  • The formula proposed in the Chinese code JGJ 138-2016 extremely underestimated the shear strength of the squat SRC shear walls, with a mean calculated-experimental strength ratio of 0.42 and a standard deviation of 0.03. Liu’s formula provided a better but also conservative estimation of the shear strength for the squat SRC shear wall specimens. The mean calculated-experimental strength ratio was 0.74 and the standard deviation was 0.06. This improvement was achieved mainly by the modification of shear resistance provided by the concrete and the structural steel;
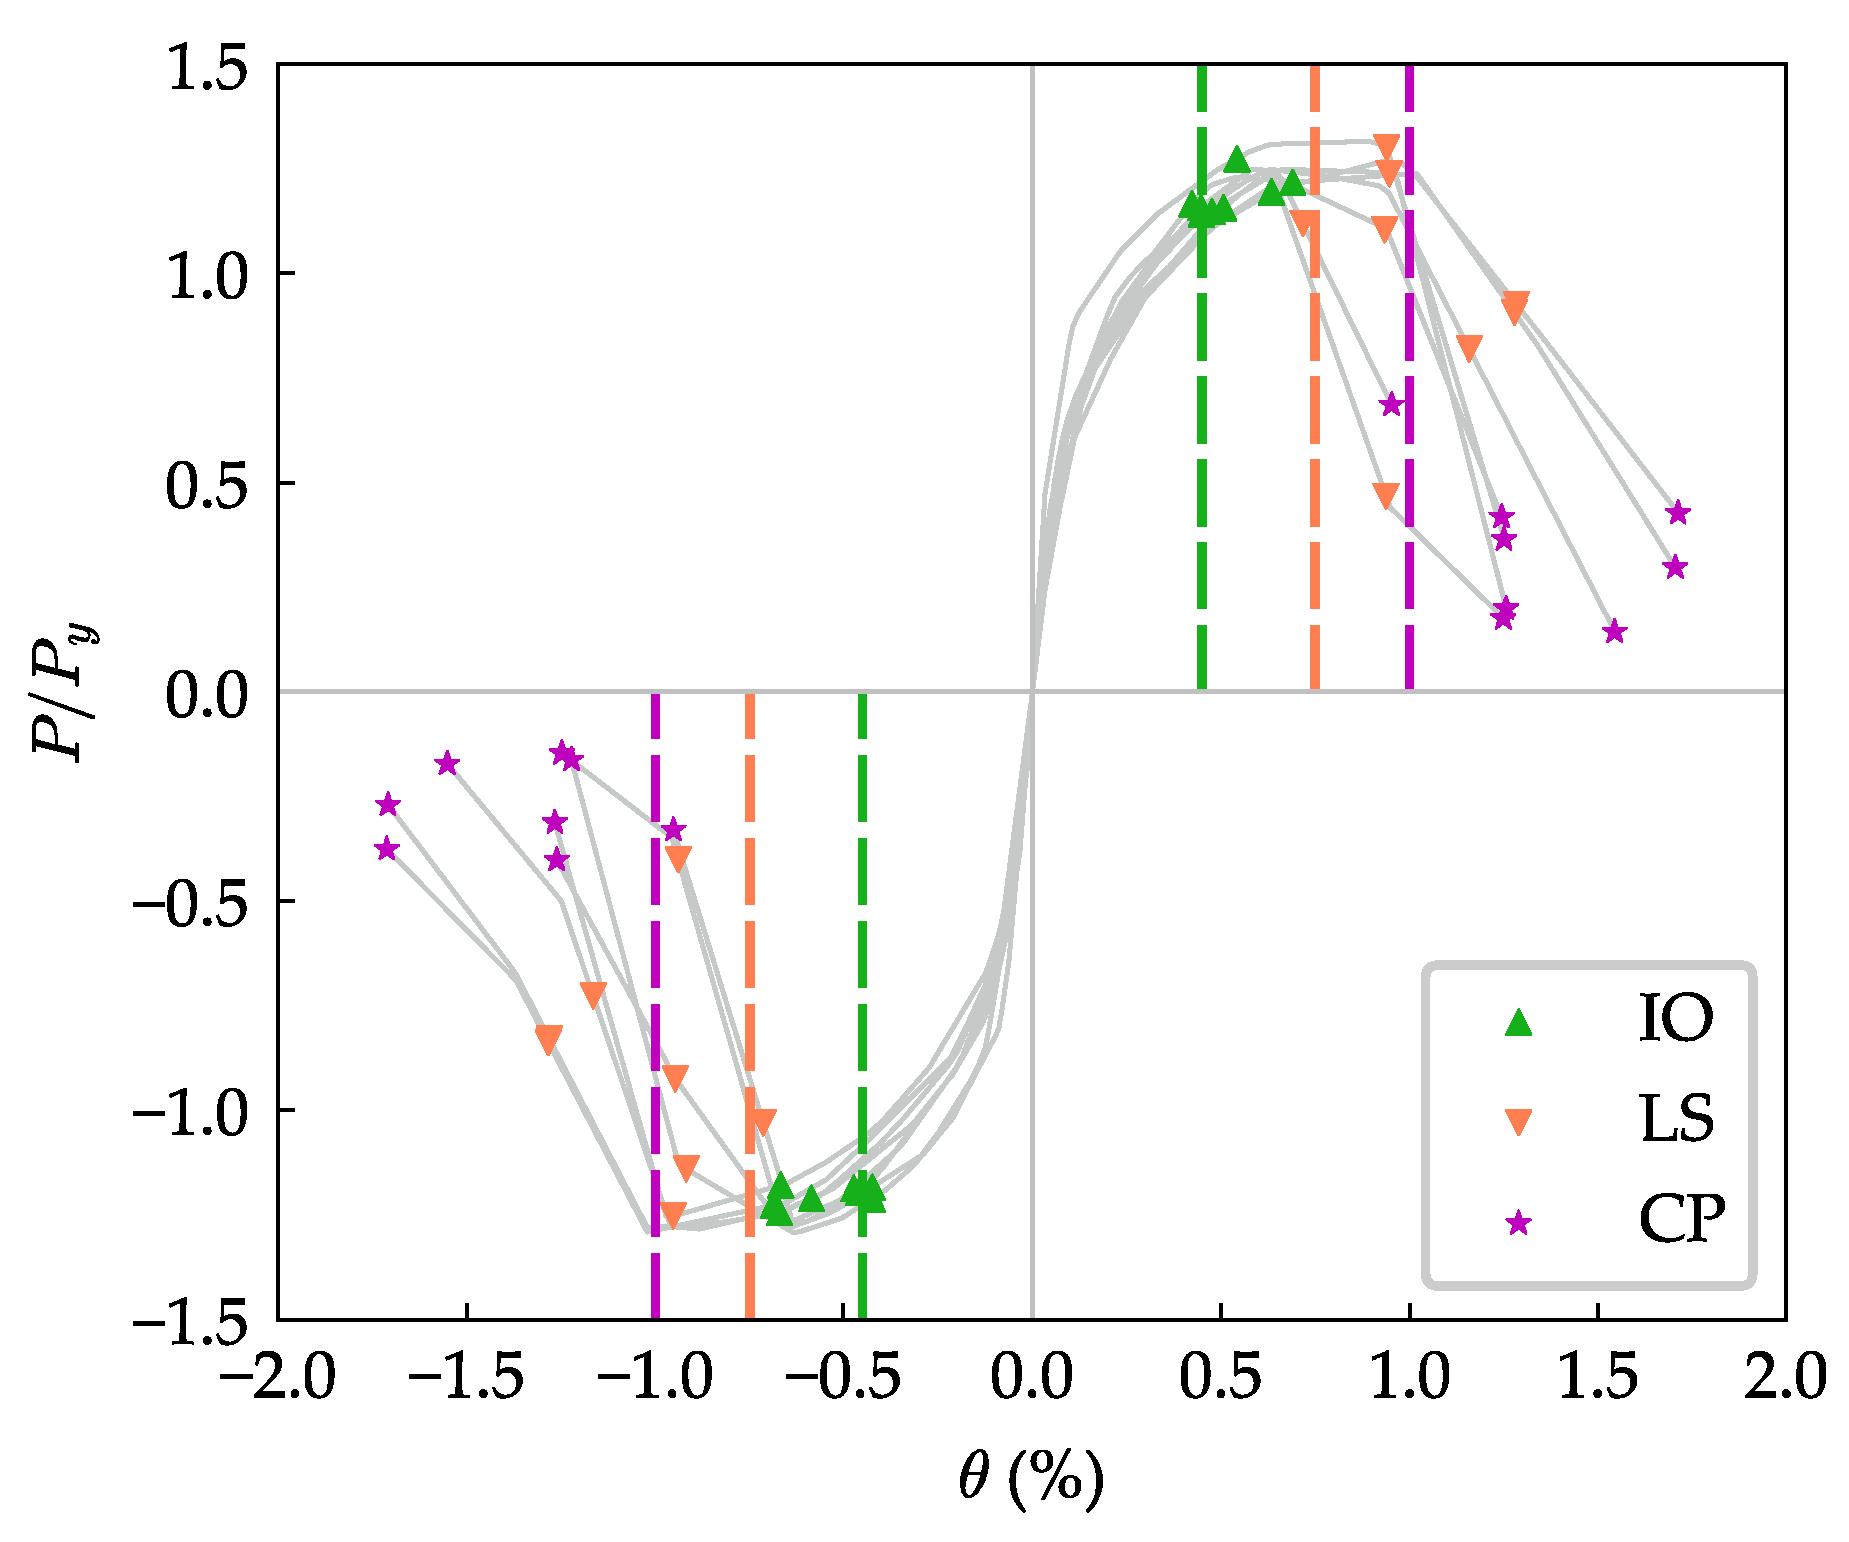
  • The results from this research can be used to establish deformation acceptance criteria for performance levels of squat SRC shear walls in the future, since there are no reasonable drift limits for SRC shear walls.

Author Contributions

Conceptualization, X.H. and L.Z.; methodology, L.Z.; validation, L.Z. and X.C.; formal analysis, L.Z.; investigation, L.Z. and X.C.; resources, X.H.; data curation, X.C.; writing—original draft preparation, L.Z.; writing—review and editing, J.J.; visualization, L.Z. and X.C.; supervision, X.H. and J.J.; project administration, X.H.; funding acquisition, X.H. and J.J. All authors have read and agreed to the published version of the manuscript.

Funding

This research was funded by the National Natural Science Foundation of China (Grant No. 52178483), Key Technologies Research and Development Program of Guangzhou (Grant No. 202103000038) and Natural Science Foundation of Guangdong Province (Grant No. 2020A1515010739).

Institutional Review Board Statement

Not applicable.

Informed Consent Statement

Not applicable.

Data Availability Statement

Not applicable.

Conflicts of Interest

The authors declare no conflict of interest.

References

  1. Paulay, T.; Priestly, M.J.N. Seismic Design of Reinforced Concrete and Masonry Buildings; Wiley: New York, NY, USA, 1992. [Google Scholar]
  2. Pilakoutas, K.; Elnashai, A.S. Cyclic Behavior of RC Cantilever Walls, Part I: Experimental Results. ACI Struct. J. 1995, 92, 271–281. [Google Scholar] [CrossRef]
  3. Salonikios, T.N.; Kappos, A.J.; Tegos, I.A.; Penelis, G.G. Cyclic Load Behavior of Low-Slenderness Reinforced Concrete Walls: Design Basis and Test Results. ACI Struct. J. 1999, 96, 649–660. [Google Scholar] [CrossRef]
  4. Hidalgo, P.A.; Ledezma, C.A.; Jordan, R.M. Seismic Behavior of Squat Reinforced Concrete Shear Walls. Earthq. Spectra 2002, 18, 287–308. [Google Scholar] [CrossRef]
  5. Salonikios, T.N. Shear strength and deformation patterns of R/C walls with aspect ratio 1.0 and 1.5 designed to Eurocode 8 (EC8). Eng. Struct. 2002, 24, 39–49. [Google Scholar] [CrossRef]
  6. Cheng, M.-Y.; Wibowo, L.S.B.; Giduquio, M.B.; Lequesne, R.D. Strength and Deformation of Reinforced Concrete Squat Walls with High-Strength Materials. ACI Struct. J. 2021, 118, 125–137. [Google Scholar] [CrossRef]
  7. Looi, D.T.W.; Su, R.K.L.; Cheng, B.; Tsang, H.H. Effects of axial load on seismic performance of reinforced concrete walls with short shear span. Eng. Struct. 2017, 151, 312–326. [Google Scholar] [CrossRef]
  8. Qian, J.R.; Lu, W.; Fang, E.H. Displacement Ductility-Based Aseismic Design for Shear Walls. J. Build. Struct. 1999, 20, 42–49. (In Chinese) [Google Scholar] [CrossRef]
  9. Telleen, K.; Maffei, J.; Heintz, J.A. Practical lessons for concrete wall design, based on studies of the 2010 Chile earthquake. In Proceedings of the 15th World Conference on Earthquake Engineering, Lisbon, Portugal, 24–28 September 2012. [Google Scholar]
  10. Wei, Y.; Qian, J.R.; Zhao, Z.Z.; Cai, Y.Y.; Yu, Y.Q.; Shen, L. Lateral Loading Experiment of SRC Low Shear Walls with High Axial Force Ratio. Ind. Constr. 2007, 37, 76–79. (In Chinese) [Google Scholar]
  11. Qian, J.R.; Wei, Y.; Zhao, Z.Z.; Cai, Y.Y.; Yu, Y.Q.; Shen, L. Experimental study on seismic behavior of SRC shear walls with high axial force ratio. J. Build. Struct. 2008, 29, 43–50. (In Chinese) [Google Scholar] [CrossRef]
  12. Ji, X.D.; Sun, Y.; Qian, J.R.; Lu, X.Z. Seismic behavior and modeling of steel reinforced concrete (SRC) walls. Earthq. Eng. Struct. Dyn. 2015, 44, 955–972. [Google Scholar] [CrossRef]
  13. Zhou, Y.; Lu, X.L.; Dong, Y.G. Seismic behaviour of composite shear walls with multi-embedded steel sections. Part I: Experiment. Struct. Des. Tall Speéc. Build. 2010, 19, 618–636. [Google Scholar] [CrossRef]
  14. Dan, D.; Fabian, A.; Stoian, V. Nonlinear behavior of composite shear walls with vertical steel encased profiles. Eng. Struct. 2011, 33, 2794–2804. [Google Scholar] [CrossRef]
  15. Dan, D.; Fabian, A.; Stoian, V. Theoretical and experimental study on composite steel–concrete shear walls with vertical steel encased profiles. J. Constr. Steel Res. 2011, 67, 800–813. [Google Scholar] [CrossRef]
  16. Massone, L.M.; Sayre, B.L.; Wallace, J.W. Load–Deformation responses of slender structural steel reinforced concrete walls. Eng. Struct. 2017, 140, 77–88. [Google Scholar] [CrossRef]
  17. Ma, K.-Z.; Ma, Y.-D.; Liang, X.-W. Seismic Behavior of Steel Reinforced High-Strength Concrete Composite Walls. J. Earthq. Eng. 2020, 24, 1290–1310. [Google Scholar] [CrossRef]
  18. Liao, F.-Y.; Han, L.-H.; Tao, Z. Performance of reinforced concrete shear walls with steel reinforced concrete boundary columns. Eng. Struct. 2012, 44, 186–209. [Google Scholar] [CrossRef]
  19. Todea, V.; Dan, D.; Stoian, V.; Florut, S.-C.; Popescu, D.-A. Seismic behaviour of composite steel-concrete shear walls with central openings. ce/papers 2021, 4, 1844–1848. [Google Scholar] [CrossRef]
  20. Wu, Y.; Kang, D.; Gao, L.; Su, Y.; Yang, Y. Seismic Behavior of Bolted Endplate Connection Between Steel Reinforced Concrete (SRC) Wall and SRC Beam for Use in High-Rise Buildings. Int. J. Civ. Eng. 2018, 16, 1561–1572. [Google Scholar] [CrossRef]
  21. JGJ 138-2016; Code for Design of Composite Structures. China Architecture & Building Press: Beijing, China, 2016.
  22. Park, R. Evaluation of ductility of structures and structural assemblages from laboratory testing. Bull. N. Z. Soc. Earthq. Eng. 1989, 22, 155–166. [Google Scholar] [CrossRef]
  23. Paulay, T.; Priestley, M.J.N.; Synge, A.J. Ductility in Earthquake Resisting Squat Shearwalls. ACI J. Proc. 1982, 79, 257–269. [Google Scholar] [CrossRef]
  24. Lopes, M.S. Experimental shear-dominated response of RC walls. Part II: Discussion of results and design implications. Eng. Struct. 2001, 23, 564–574. [Google Scholar] [CrossRef]
  25. Pan, G.-B.; Cai, J.; He, A.; Chen, Q.-J.; Zuo, Z.-L.; He, B.-Q.; Tang, X.-L.; Wu, H.-W. An experimental study of the seismic behaviour of precast concrete shear walls with bolted-plate connections. Eng. Struct. 2021, 248, 113203. [Google Scholar] [CrossRef]
  26. ANSI/AISC 360-16; Specification for Structural Steel Building. American Institute of Steel Construction: Chicago, IL, USA, 2016.
  27. Liu, H.; Lan, Z.J.; Pang, T.H.; Meng, Z.P.; Liu, A.L.; Wen, F. Test and Analysis on Seismic Behavior of Low-Rise Steel-Encased Reinforced Concrete Shear Walls. Ind. Constr. 1997, 27, 32–36+47. (In Chinese) [Google Scholar]
  28. Barda, F.; Hanson, J.M.; Corley, W. Shear strength of low-rise walls with boundary elements. Int. Concr. Abstr. Portal 2011, 21, 149–202. [Google Scholar]
  29. ASCE/SEI 41-17; Seismic Evaluation and Retrofit of Existing Buildings. American Society of Civil Engineers: Reston, VI, USA, 2017. [CrossRef]
Figure 1. Specimen size and section reinforcement: (a) front and side views of the specimens; (b) cross-section.
Buildings 12 01238 g001
Figure 2. Structural steel sections and the arrangement of studs.
Buildings 12 01238 g002
Figure 3. Test setup.
Buildings 12 01238 g003
Figure 4. Loading protocol.
Buildings 12 01238 g004
Figure 5. Arrangement of strain gauges.
Buildings 12 01238 g005
Figure 6. Crack distribution at the state of peak lateral strength: (a) W-4-0.18; (b) W-8-0.18; (c) W-4-0.26; (d) W-8-0.26; (e) W-4-0.35; (f) W-6-0.35A; (g) W-6-0.35; and (h) W-6-0.35B.
Buildings 12 01238 g006
Figure 7. Failure stage of the specimens: (a) W-4-0.18; (b) W-8-0.18; (c) W-4-0.26; (d) W-8-0.26; (e) W-4-0.35; (f) W-6-0.35A; (g) W-6-0.35; and (h) W-6-0.35B.
Buildings 12 01238 g007
Figure 8. Buckling patterns of the steel sections of the specimens. (The red circles indicate the locations of apparent buckling.)
Buildings 12 01238 g008
Figure 9. Hysteretic responses of the test specimens: (a) W-4-0.18; (b) W-8-0.18; (c) W-4-0.26; (d) W-8-0.26; (e) W-4-0.35; (f) W-6-0.35A; (g) W-6-0.35; and (h) W-6-0.35B.
Buildings 12 01238 g009
Figure 10. Backbone envelopes of test specimens: (a) ALR = 0.18; (b) ALR = 0.26; (c) ALR = 0.35; (d) ρ s s = 4%; (e) ρ s s = 6%; and (f) ρ s s = 8%.
Buildings 12 01238 g010
Figure 11. Shear strength of the test specimens.
Buildings 12 01238 g011
Figure 12. Ductility coefficient of the test specimens.
Buildings 12 01238 g012
Figure 13. Relation curves of average secant stiffness versus drift ratio of specimens: (a) ALR = 0.18; (b) ALR = 0.26; (c) ALR = 0.35; (d) ρ s s = 4%; (e) ρ s s = 6%; and (f) ρ s s = 8%.
Buildings 12 01238 g013
Figure 14. Cumulative energy dissipation: (a) ALR = 0.18; (b) ALR = 0.26; (c) ALR = 0.35; (d) ρ s s = 4%; (e) ρ s s = 6%; (f) ρ s s = 8%; and (g) the diagram of the loop energy E.
Buildings 12 01238 g014aBuildings 12 01238 g014b
Figure 15. Equivalent viscous damping coefficients of the specimens: (a) ALR = 0.18; (b) ALR = 0.26; (c) ALR = 0.35; and (d) the diagram of equivalent viscous damping coefficients h e .
Buildings 12 01238 g015
Figure 16. Axial deformation of the specimens versus the imposed drift levels: (a) ALR = 0.18; (b) ALR = 0.26; (c) ALR = 0.35; (d) ρ s s = 4%; (e) ρ s s = 6%; and (f) ρ s s = 8%.
Buildings 12 01238 g016
Figure 17. Strain history curves of specimen W-6-0.35: (a) Z5; (b) F2; (c) SP3; and (d) SP6.
Buildings 12 01238 g017
Figure 18. Comparison of the calculated and observed shear strength.
Buildings 12 01238 g018
Figure 19. Deformation capacity evaluation of the specimens.
Buildings 12 01238 g019
Table 1. Details of test specimens.
No.NameSSRN (kN)ALRSteel
Shape
A a
(cm2)
ρ s s
(%)
Horizontal
Reinforcement
ρ s h
(%)
1W-4-0.180.87320.18Cross-section 117.764C6@1250.35
2W-8-0.180.88250.18Cross-section 335.288C6@1250.35
3W-4-0.260.810920.26Cross-section 117.764C6@1250.35
4W-8-0.260.812370.26Cross-section 335.288C6@1250.35
5W-4-0.350.814520.35Cross-section 117.764C6@1250.35
6W-6-0.35A0.815230.35Cross-section 226.646C6@1750.25
7W-6-0.350.815230.35Cross-section 226.646C6@1250.35
8W-6-0.35B0.815230.35Cross-section 226.646C6@900.50
9W-8-0.350.816500.35Cross-section 335.288C6@1250.35
Table 2. Mechanical properties of reinforcement bars.
Diameter (mm)Grade f y   ( MPa ) f u   ( MPa )
6HRB400440.0697.0
8HRB400413.4618.1
10HRB400458.0698.0
Table 3. Mechanical properties of structural steel.
Thickness (mm)Grade f a y   ( MPa ) f a u   ( MPa )
4Q345411.8545.6
6Q345381.0526.8
8Q345367.7509.5
Table 4. Load and drift ratio at cracking, yielding, peak, and ultimate points.
No.NameLoading
Direction
F c
(kN)
F y
(kN)
F p
(kN)
F u
(kN)
θ c
(%)
θ y
(%)
θ p
(%)
θ u
(%)
1W-4-0.18+3437549347470.120.361.021.21
3666888807030.130.321.021.17
2W-8-0.18+41583710618480.120.340.931.21
44580910448340.130.351.021.17
3W-4-0.26+43480210017990.120.270.631.06
4497379477550.140.290.881.05
4W-8-0.26+43391511439130.110.290.600.99
49787711188940.150.280.670.87
5W-4-0.35+34881510188110.120.350.671.03
48984010858670.140.210.630.97
6W-6-0.35A+51391811389100.190.310.640.79
64292911839460.200.280.640.72
7W-6-0.35+373100012309830.120.290.550.74
65095012169700.140.200.650.74
8W-6-0.35B+45092312159720.120.190.891.01
50088711138900.120.370.961.05
Table 5. Calculated shear strengths and their components. (kN).
Name V t e s t JGJ 138-2016 [21]Liu [27]
V c V s h V N V a V c a l V c V s h V s v V N V a V c a l
W-4-0.1890713212373784063831192491118735
W-8-0.1810521321238413847738311924105208840
W-4-0.26974132123847841738311924105118749
W-8-0.2611301321238413847738311924105208840
W-4-0.351051132123847841738311924105118749
W-6-0.35A116113288841084123838524105163760
W-6-0.3512231321238410844738311924105163794
W-6-0.35B11641321708410849438317124105163846
Publisher’s Note: MDPI stays neutral with regard to jurisdictional claims in published maps and institutional affiliations.

