Article

A Modified Surgical Face Mask to Improve Protection and Wearing Comfort

1
Tianjin Key Laboratory of Indoor Air Environmental Quality Control, School of Environmental Science and Engineering, Tianjin University, Tianjin 300072, China
2
School of Civil Engineering, Dalian University of Technology, Dalian 116024, China
*
Author to whom correspondence should be addressed.
Buildings 2022, 12(5), 663; https://doi.org/10.3390/buildings12050663
Submission received: 12 April 2022 / Revised: 13 May 2022 / Accepted: 14 May 2022 / Published: 17 May 2022

Abstract

:
Wearing face masks is essential for reducing infection during the COVID-19 pandemic. However, ordinary surgical face masks can provide only moderate protection. The N95 face masks should provide sufficient protection but may impose complaints about breathing difficulty or even impair respiratory health. This investigation proposed a novel face mask modified from the surgical face mask to improve both protection and comfort. The filter material of the surgical face mask was covered and sealed on a cardboard support frame but with openings for air permeating through. The modified face masks were worn by a test subject for measuring the air contents inside the face masks. The protection performance was evaluated by the overall PM1 filtration efficiency. The concentrations of CO2, O2, N2, and water vapor were adopted to evaluate the breathing comfort. The performance of the proposed face mask was compared with the market-available surgical and N95 face masks. In addition, CFD modeling was adopted to investigate the dynamic air exchange of the face mask with respiration and the surrounding air. Impacts of the air sampling tube positions on the measurement results were also examined. The results revealed that the overall PM1 filtration efficiency of the modified face mask could reach 96.2%, which was much higher than that of the surgical face mask and only slightly lower than the N95 face mask. As compared with the N95 face mask, the modified mask reduced the respiratory flow resistance and the concentrations of CO2 and water vapor and thus increased the O2 content and breathing comfort.

1. Introduction

The COVID-19 pandemic has not ended yet. Wearing face masks appropriately can minimize the transmission of SARS-Cov-2 through droplets and aerosols [1,2,3], and reduce both the virus shedding and inhalation exposure [4,5]. According to the WHO guideline [6], face masks, social distancing, hand hygiene, and ventilation are essential to decrease the COIVD-19 infection. However, face masks are not completely accepted due to the hindrance to eating, drinking, and talking, and the possibly resulting breathing difficulties [7], etc.
The protection provided by face masks is not 100%. The main reason for the protection failure is the leakage. The mask leakage consists of two routes: through the filter material and through the clearance between the mask and the face. The particles, especially those with diameters close to 0.3 μm, can even penetrate the filter material of the N95 face masks [8]. The total leakage rate of a face mask is closely related to its shape and type. Due to the relatively loose fitting of the surgical masks [9], the measured leakage rate may be as high as 48.5% to 70.8% [10]. Another study [11] showed the measured average leakage rate of the surgical masks was approximately 35%. In contrast, the total leakage rate of the cup-type N95 face masks was much smaller and ranged from 0.3% to 15% [10,11]. Note that the filter material of both the surgical and the N95 face masks have a quite high particle filtration efficiency [12]. The leakage is mostly contributed by the clearance between the face mask and the face.
In addition to providing protection, the face masks should also be comfortable enough. The thermal and humidity feeling and the breathing difficulty are among the most concerning factors to impact the wearing rate of face masks. The so-called dead space was formed while wearing a face mask, in which the relatively high-temperature air, water vapor, and CO2 accumulated inside. Wearing a surgical mask would provide thermal insulation and thus could reduce the neutral temperature by 1.5 °C [13]. The humidity ratio within a face mask reached as high as 20 g/kg [11], which was much higher than the comfortable humidity ratio of 10 g/kg (corresponding to 25 °C and 50% relative humidity). The volume ratio of CO2 inside a surgical face mask was measured to be approximately 2.2% [11]. Such a high CO2 concentration exceeded the design standard of 0.1% in indoor environments. The high CO2 content expels the O2 and results in the O2 deficit [14]. Wearing face masks also increases respiratory resistance. According to [15], wearing N95 face masks increased the inhalation resistance by 26% and the exhalation resistance by 22%, respectively. The high filtration efficiency of the N95 face mask corresponds to a greater flow resistance to the air permeation. Consequently, some sensitive people may have more complaints about the breathing difficulty in the N95 face masks than in the surgical face masks [16].
There have been many investigations to improve the protection and wearing comfort of face masks. Some investigations [17,18,19] adopted nanomaterial as the filter to reduce the flow resistance while maintaining a high filtration efficiency. New designs were also proposed by adding ventilation [11,20] or cooling units [21] to enhance the oxygen supply and improve the wearing comfort. A small fan blowing the filtered air into the face mask maintained the average CO2 concentration of approximately 1% and reduced the temperature in the dead space by approximately 2 °C [20]. A ventilated face mask with additional HEPA filtered air supplied into a face mask not only improved the wearing comfort but also greatly reduced the inward leakage [11]. A face mask with a thermoelectric and ventilation unit reduced the temperature and relative humidity in the mask by 3.5 °C and 50%, respectively [21].
The above review revealed that the protection of a surgical face mask may not be enough, while wearing an N95 face mask may impose breathing difficulty. The face mask designs adopting nanomaterials may not be inexpensive. On the other hand, the face masks with ventilation or cooling unit are too complicated. This investigation examined the airflow of face masks and then proposed a novel mask with better protection and comfort performance, simpler structure, and lower cost. The novel mask was modified from a surgical face mask by adopting the support and the sealing frame to enhance the airtightness between the face mask and the face. The filtration efficiency, dead space, concentrations of CO2, O2, N2, and water vapor, and respiratory flow resistance were measured and compared with the surgical face mask and the N95 face mask on the market.

2. Research Methods

This section first illustrates the design of the modified face mask, and then the experimental methods for evaluating the filtration performance and wearing comfort of the modified mask. In addition, the CFD modeling to help understand the air exchange of the face mask and verify the effectiveness of air sampling is also presented.

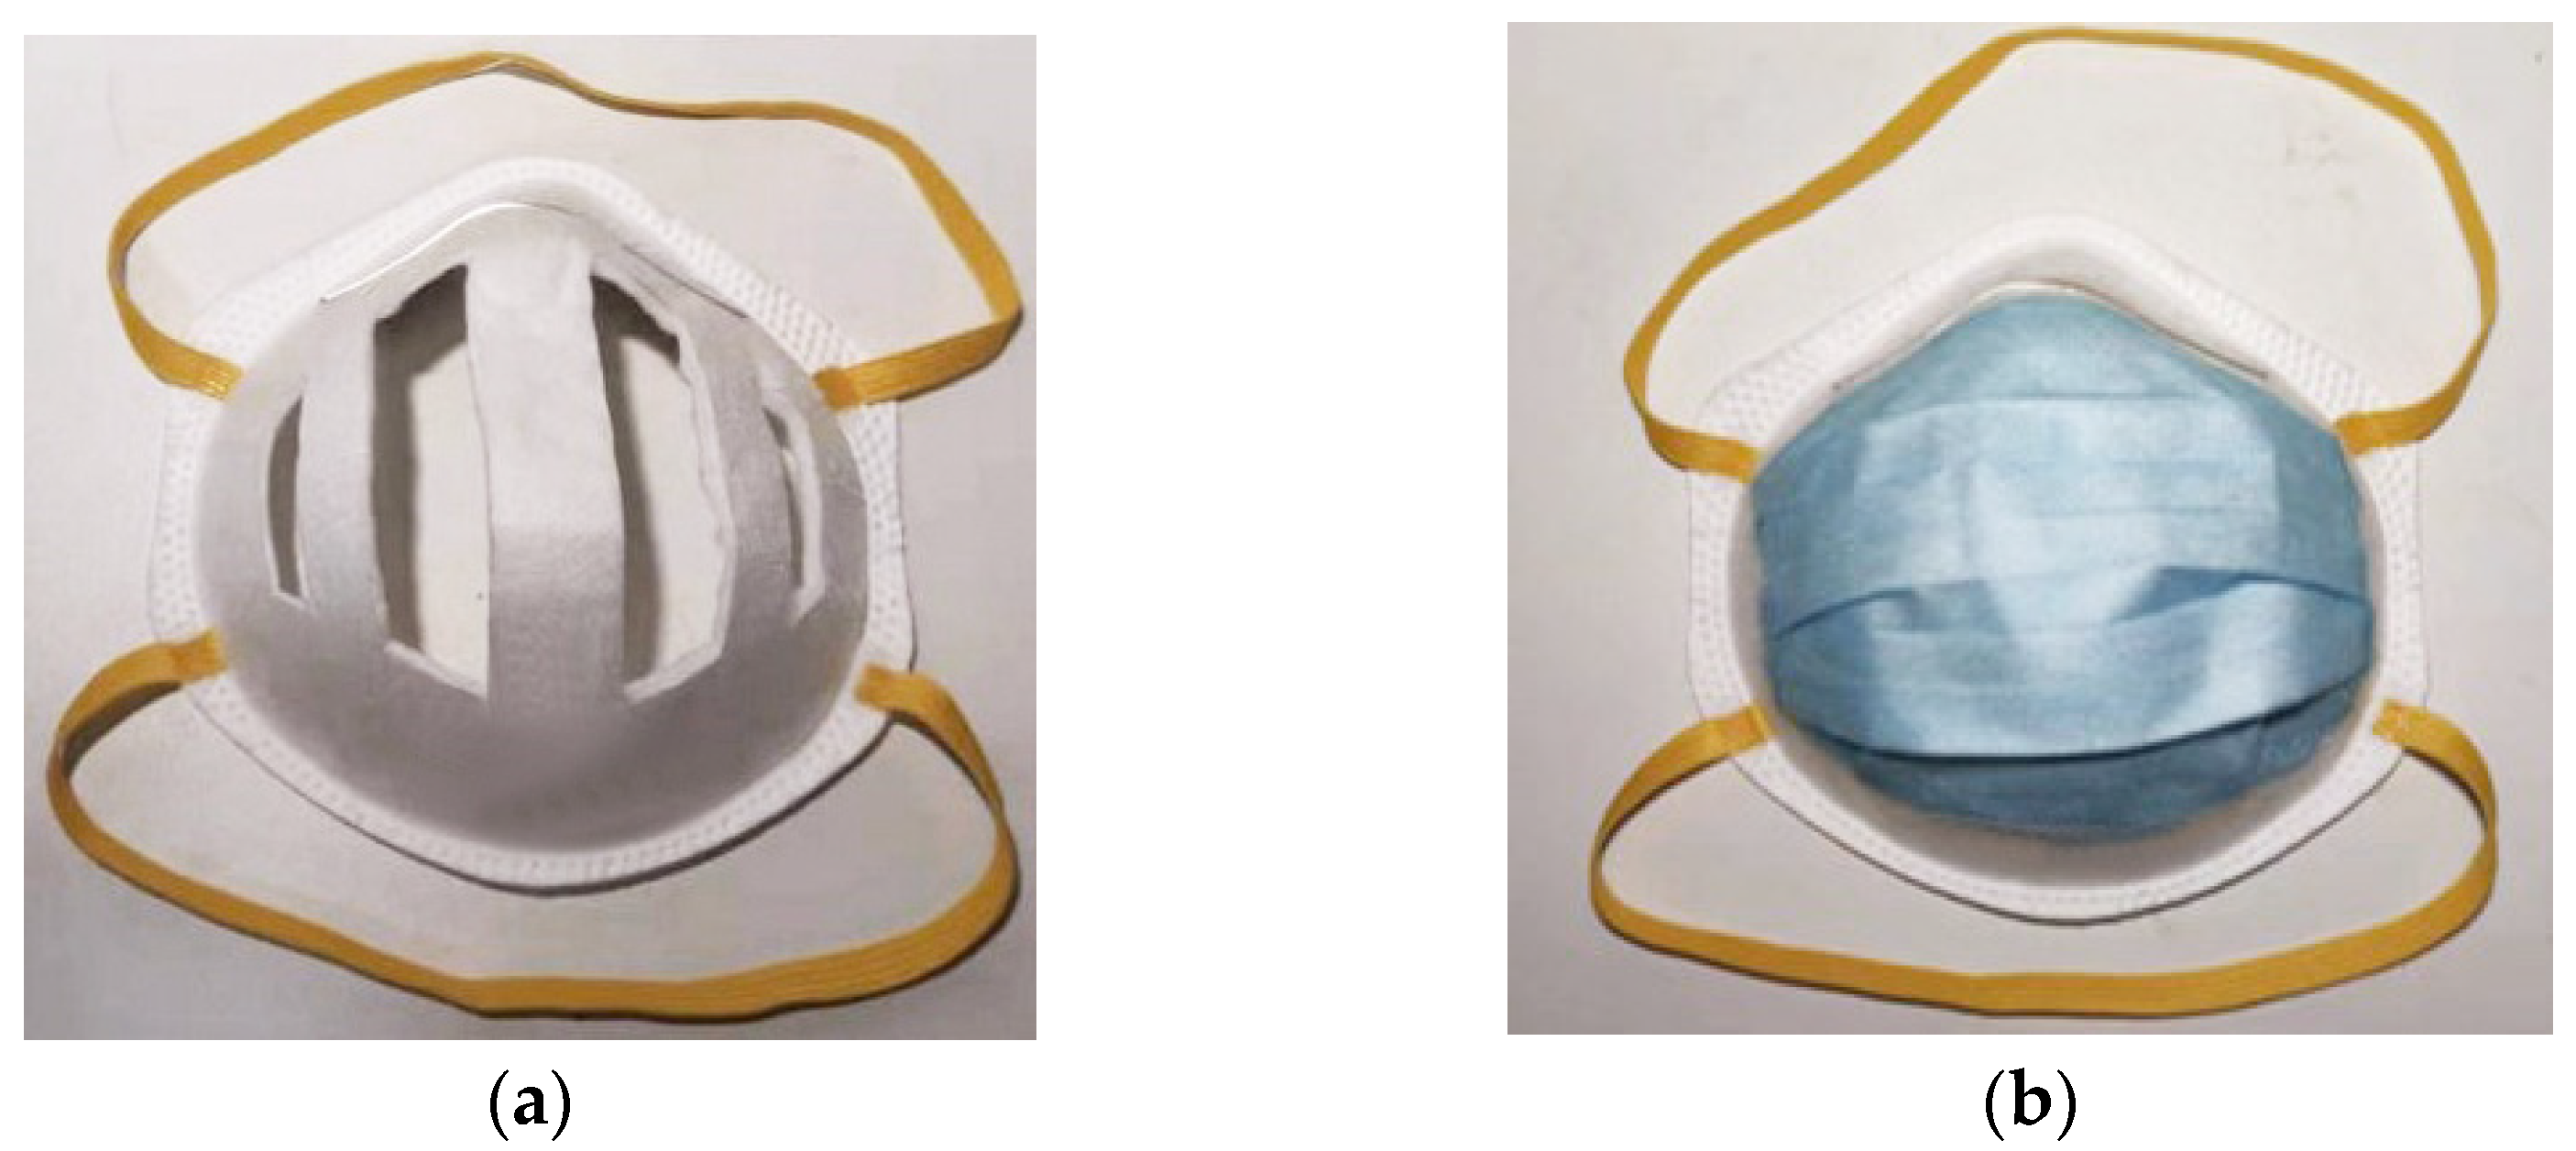
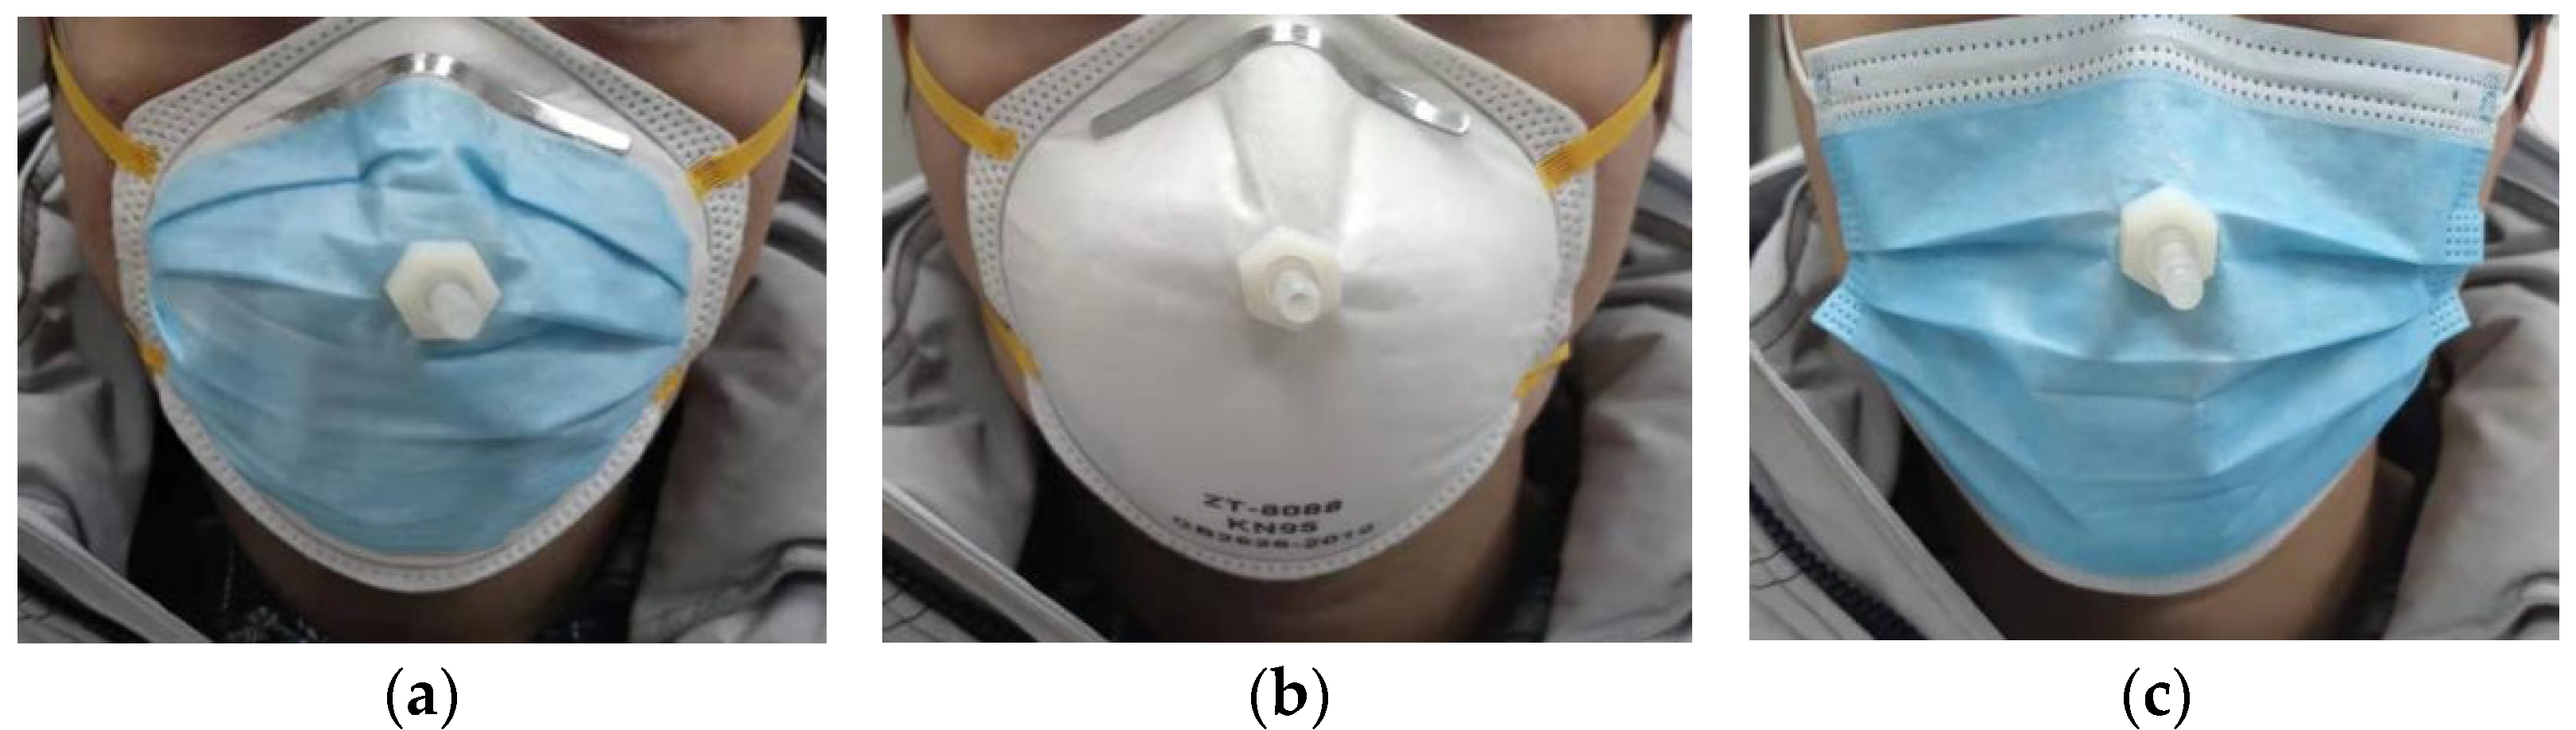
2.1. Modified Face Mask and Measurement of Air Contents Inside

Figure 1a shows the cup-shaped, cardboard frame to support the filter material of the modified headwear face mask. Two elastic straps are mounted to the frame to ensure the airtightness of the mask with the wearer’s face. The filter is against the frame and well-sealed together. The filter material is identical to that used for the ordinary surgical face mask. The filter has three layers: the outer waterproof layer, the middle melt-blown filter, and the inner absorbent layer. Figure 1b shows the appearance of a modified face mask.
To evaluate the performance of modified masks, the modified face mask was worn by an adult test subject. The air inside the face mask was drawn for the content analysis. As shown in Figure 2a, an air sampling tube was installed on the face mask to extract the air from the face mask. The sampling tube was nearly in the center of the face mask, i.e., in direct front of the mouth. Considering the complicated breathing cycles, the positioning of the sampling tube may have some impacts on the sampled air contents. The impacts of air sampling positions on the measurement results were addressed in the next section on CFD modeling. This investigation compared the performance of the modified face mask with the N95 face mask and the surgical face mask, as shown in Figure 2b,c. The inner diameter of the air sampling tube was 4 mm.
The analyzed contents of the air inside face masks included PM1, O2, N2, CO2, and water vapor. Figure 3 shows the principles of the measurement test. The particle monitor had a sampling flow rate of 3 L/min. The sampling flow rate of the O2 concentration monitor and CO2 concentration monitor was 0.5 L/min and 1.8 L/min, respectively. The positive pressure in the mixing tube was always maintained to prevent the ambient air from leaking into the tube for measuring. The air sampling tube and the particle monitor were heated to above 35 °C to avoid the water vapor condensation. Otherwise, the particle monitor would overmeasure the particle concentration.
The PM1 concentration was measured by a particle monitor (Type: 8533; TSI, Minneapolis, MN, USA). The particle monitor had a resolution of 0.001 mg/m3 and accuracy of ±5%. The concentrations of O2 and CO2, and the air temperature and relative humidity were also monitored continuously. The O2 concentration monitor (Type: XP-3180; Cosmos, Tokyo, Japan) had a resolution of 0.1% and an accuracy of 0.3%. The resolution of the CO2 concentration monitor (Type: 1412; Innova, Ballerup, Denmark) was 1 ppb, and the repeatability was 1%. The resolution of the temperature and relative humidity meter (Type: HMT333; Vaisala, Finland) was 0.1 °C and 0.1% RH, respectively, and the accuracy was ±0.2 °C and ±1% RH (0–90% RH) or ±1.7% RH (90–100% RH), respectively.
In addition, a gas chromatography (Type: 7890B; Agilent, Santa Clara, CA, USA) was used for analyzing the N2 content. The repeatability of the gas chromatography was 1%. The N2 concentration was not measured online but with a gas sampling bag heated to above 35 °C. The sampled air was extracted from the air mixing tube shown in Figure 3. The N2 concentration in the gas used for calibration was 85.06%. The gas for calibration contained 14.90% O2 and 0.04% CO2, which could also be used for measuring the concentrations of O2 and CO2. However, due to their low concentrations, the measured CO2 and O2 concentrations might have certain errors, the results were shown only for reference.
The test subject was a healthy adult female, 160 cm in height and 46 kg in weight. During the tests, the subject sat still and breathed normally. The three types of face masks were tested under the same indoor conditions. The concentration of PM1, air temperature, and absolute humidity in the laboratory was 36 μg/m3, 22 °C, and 4.79 g/kg, respectively. The concentrations of O2 and CO2 in the laboratory were 21.0% and 0.05%, respectively. All of the tests were repeated five times and each test lasted four minutes.
The protection performance of face masks was evaluated by the efficiency to filtrate the PM1. The filtration efficiency of PM1 was defined as [11]:
E = 1 c FM c A ,
where E is the filtration efficiency in terms of PM1 concentrations after wearing masks, cA is the PM1 concentration in the ambient air, μg/m3; and cFM is the PM1 concentration inside the face mask, μg/m3.

2.2. Measurement of Dead Space and Respiratory Resistance

In addition to the measurement of air contents with a test subject, the dead space and respiratory resistance were also measured, respectively. The dead space of a face mask is defined as the volume of re-inhaled air from the previous breath, which is generally expressed by the concentration of the re-inhaled CO2. The dead space of a face mask is generally required to be less than 1% [22]. A large dead space means that the volume of air entering the mask without participating in breathing is large. Consequently, the O2 concentration inside the mask will be low. A test instrument (Type: ZR-1230; Junray, Tsingtao, China) to measure the dead space was adopted, whose resolution was 0.1% with an accuracy of ±5%. The breathing rate of the dummy for measuring the dead space was 20 times/min, and the tidal volume was 1.5 L. Surely the dead space may vary with the breathing rate. However, this investigation adopted the above specific test conditions to compare the performance of different faces masks. During the test, the CO2 concentration of the exhaled air by the dummy was 1.78%, and each test lasted for one minute. The test environment was well ventilated, and a fan was placed in front of the dummy to prevent the exhaled air from accumulating.
Steady exhalation resistance and inhalation resistance of the three masks were also analyzed. The respiratory resistance was measured by a specific test instrument (Type: ZR-1211; Junray, Tsingtao, China). The resolution of the respiratory resistance was 1 Pa, and the maximum error was ±2 Pa. During tests, the standard respiratory flow rate of 85 L/min was adopted. Each test lasted for 30 s. No additional sealing was implemented between the face mask and the dummy’s head, to account for the possible air leakage when wearing face masks. According to the NIOSH [23,24], the maximum exhalation and inhalation resistances for the N95 face mask were 245.1 Pa and 343.2 Pa, respectively under a constant flow rate of 85 L/min.

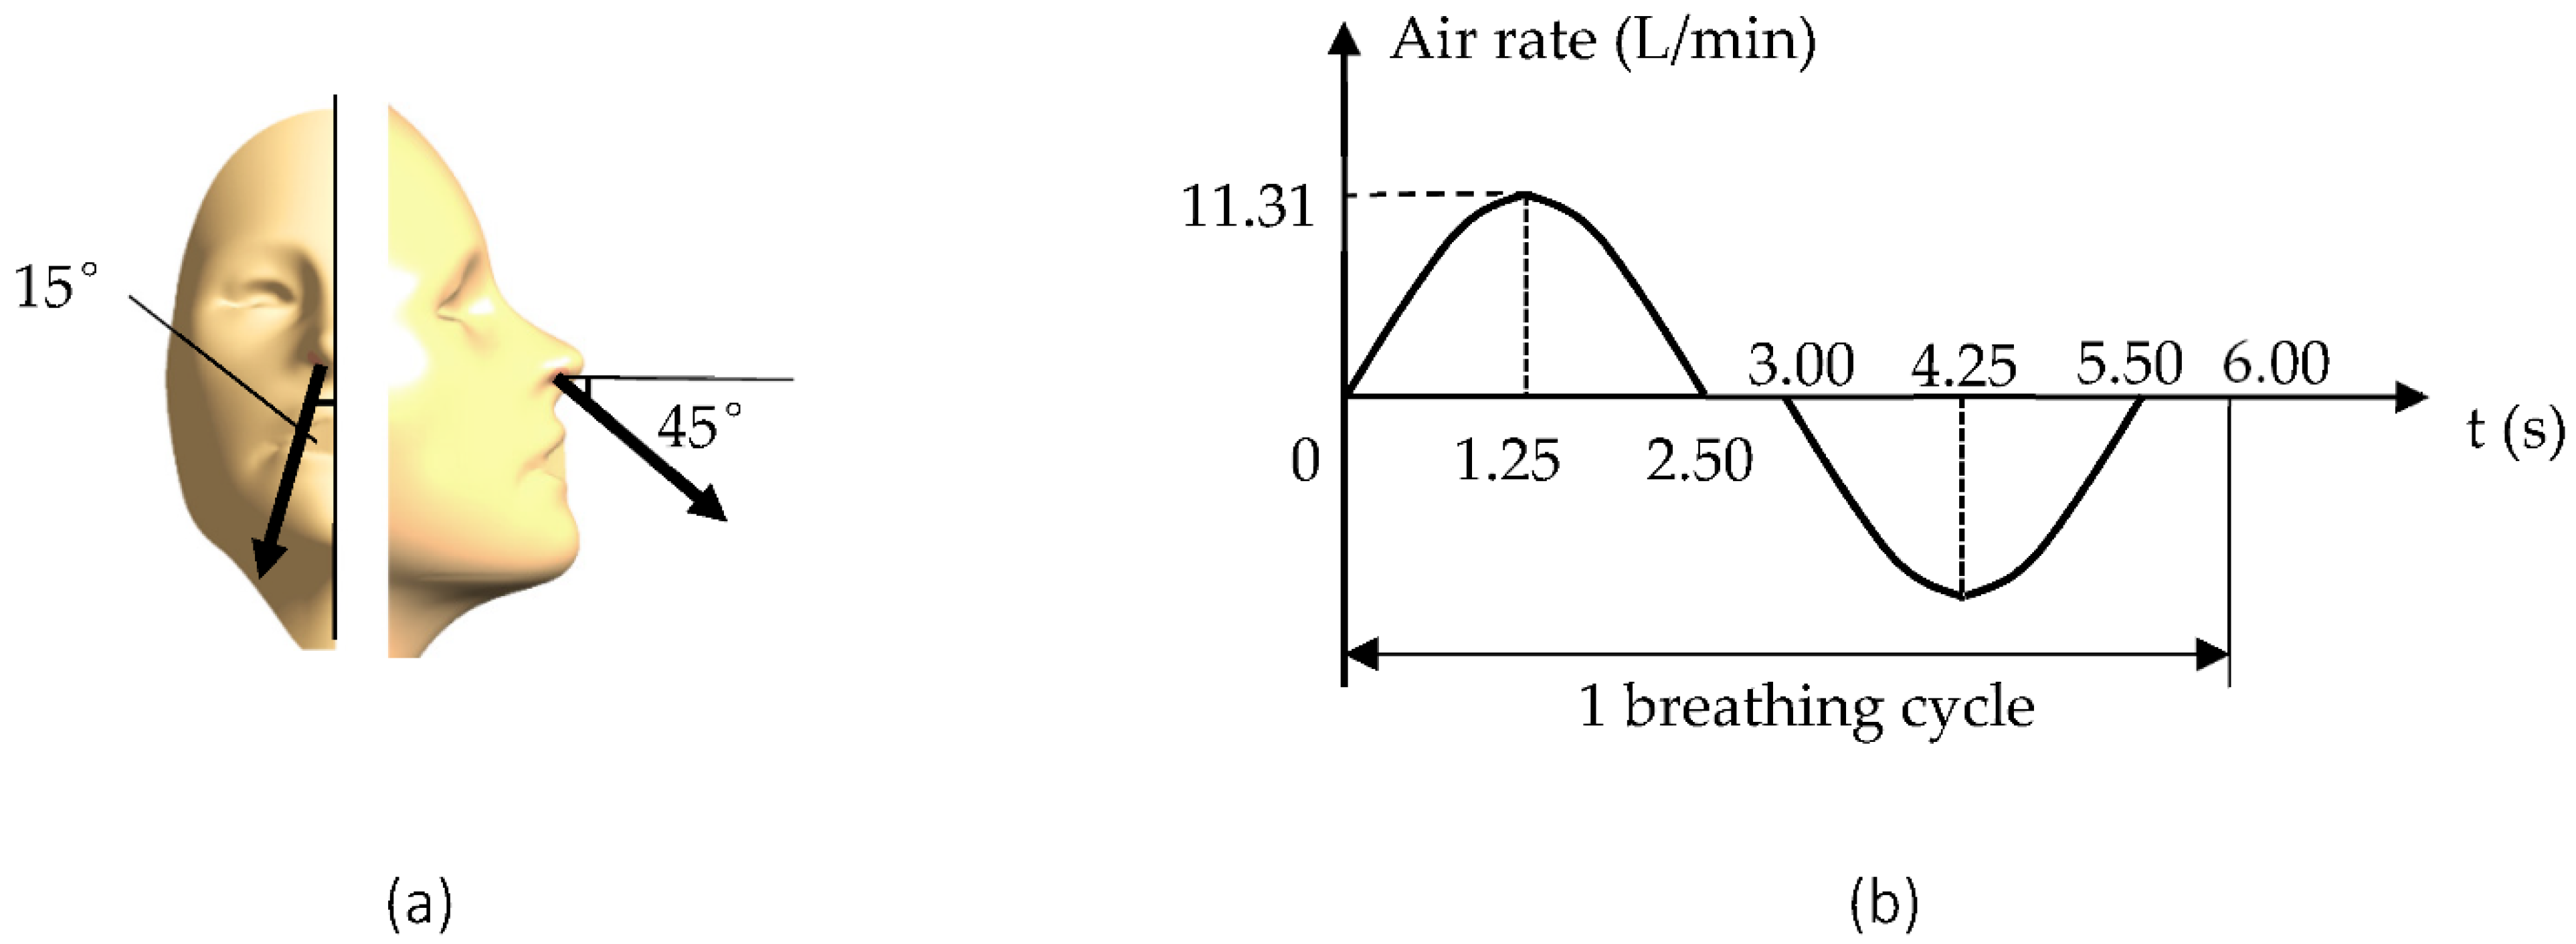
2.3. CFD Modeling of Dynamic Air Exchange and Air Sampling to a Face Mask

The respiratory flows inside the face masks are very complicated. The internal air inside the face masks may not be well mixed. To understand the dynamic air exchange and evaluate how the air sampling tube position affects the sampled air contents, this study conducted CFD modeling of the flow and air contents inside face masks. The face masks with no sampling and the sampling tubes at three different positions on the masks were studied. Transient simulations of flow and CO2 concentration distributions inside an N95 mask were carried out.
For simplicity, a half geometric model was created for a fully symmetric situation, as shown in Figure 4a. The dimensions of the solution domain were 150 mm × 160 mm × 240 mm. Both the nose and mouth were covered by a face mask for an adult female. The diameter of the nostril opening was 9 mm. The diameter of the sampling tube was 4 mm. The mask was a simplified N95 type with a thickness of 2.7 mm. There was an average gap clearance of 2 mm between the mask and the human face. Figure 4b shows four different cases in this study, including no sampling, upper sampling, central sampling, and lower sampling.
Table 1 summarizes the major boundary conditions for CFD modeling. It assumes that the gentle air at a speed of 0.05 m/s, a temperature of 22 °C, and a CO2 concentration of 0.05%, blew to the face. The above parameters of the air were identical to those monitored in the laboratory. The dynamic respiratory flow was considered and the directions of the exhaled air are shown in Figure 5a. According to the literature [25], the profile of human respiration was approximately sinusoidal, with a breathing time-period of 6 s at rest. There was an interval of 0.5 s between each inhalation and exhalation. The maximum respiratory flow rate was 22.62 L/min. This study dealt with only half of the geometric model, so the maximum respiratory flow was 11.31 L/min. For simplicity, the respiratory profile was simplified into:
R ( t ) = 11.31 sin ( 0.4 π t )   L / min
where R was the respiratory flow rate, L/min; t was time, s. There was a slight difference in the breathing profiles presented by Equation (2) and that is shown in Figure 5b. More details on human respiration can be found in our previous study [25]. The temperature of the exhaled air was 33 °C and the CO2 concentration was 4.20%.
The flow rate of the air sampling was half that in the measurement, 1.5 L/min. The face mask was set as a porous medium with a porosity of 0.88 Appendix A [26], and the gap clearance between the mask and the face was also treated as a porous medium with a porosity of 0.99.
ICEM was adopted to create the geometry and generate tetrahedral grids therein. The total grid numbers were 1,174,271, 1,197,131, 1,195,498, and 1,196,047 for cases of no sampling, upper sampling, central sampling, and lower sampling, respectively. The minimum grid cell size was 0.1 cm at the nostril opening. A size function was utilized to gradually increase the grid size at a rate of 1.5. The Fluent (Version 19.0) software was adopted to solve the thermo-flow and CO2 concentration. The CO2 concentration was calculated as a passive scalar variable. The RNG k-ε model was used to resolve the turbulence. The Boussinesq hypothesis was utilized to approximate the thermal buoyancy. The PRESTO! discrete scheme was adopted for the pressure term discretization. The discrete scheme of the remaining variables was the second-order upwind scheme. The pressure and velocity were coupled by the SIMPLE algorithm. The time step size was set to 0.05 s. Once the relative residuals of all of the solution variables were lower than 1 × 10⁻⁴, the results were judged to be convergent. The validation of the CFD modeling is provided in Appendix A.

3. Results

In this section, CFD modeling results on the dynamic air exchange of the face mask and impacts of different positions of air sampling tubes to the measurement are presented first, followed by the measured face mask performance in terms of particle filtration, air contents, dead space, and respiratory flow resistance.

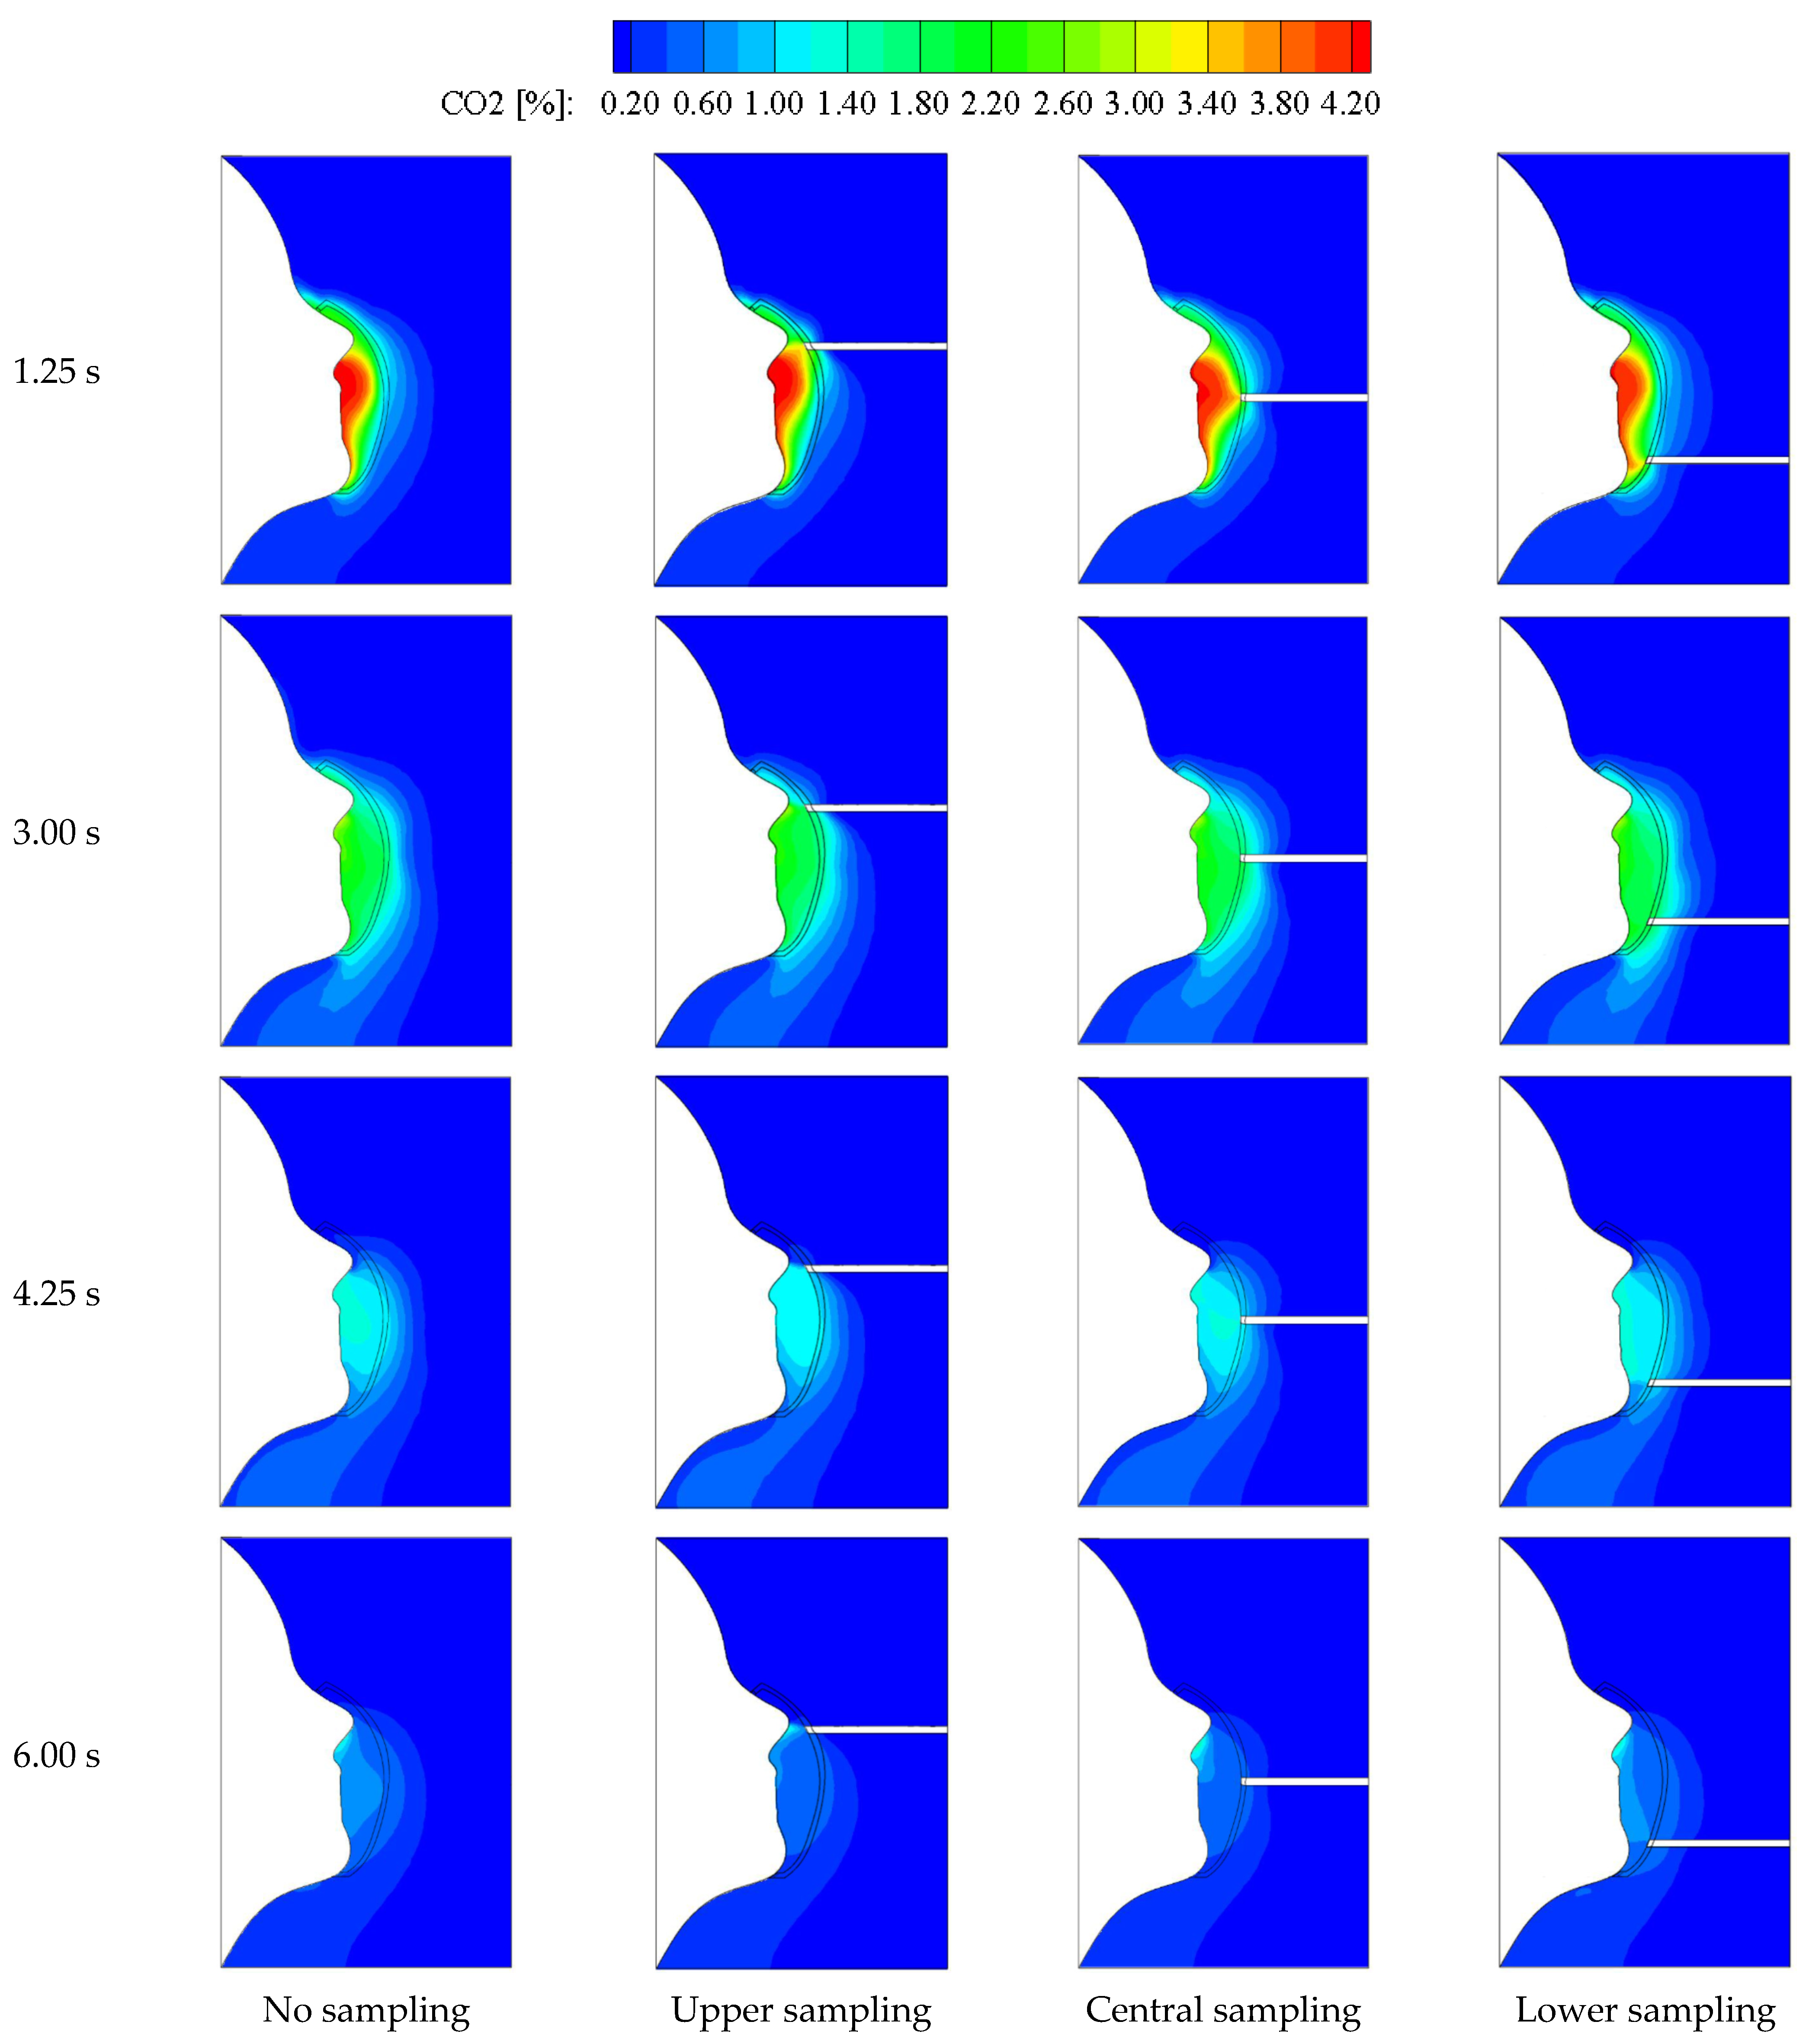
3.1. Dynamic Air Exchange and Air Sampling of the N95 Face Mask

Table 2 presents the time-average flow rates into and out of the mask by CFD simulation. The mask filter and gap clearance were treated as two different porous zones. Therefore, the airflow rates through the mask filter and gap clearance could be monitored simultaneously. A total of three breathing cycles were simulated for 18 s. In Table 2, QF,in is the filter-in permeating flow rate through the mask filter; QL,in is the leak-in flow rate from the gap clearance; QF,out is the filter-out permeating flow rate through the filter; QL,out is the leak-out flow rate through the gap clearance. For the case of no sampling, the net flow rate into and out of the mask was zero, i.e., (QF,in + QL,in) equaled to (QF,out + QL,out). For the remaining three cases with air sampling, (QF,in + QL,in) minus (QF,out + QL,out) was 1.5 L/min, which was the air sampling flow rate. It can be seen that the air sampling led to an increase in both the inward leakage and the filter-in permeating flow. In contrast, the air sampling led to a decrease in both the outward leakage and the filter-out permeating flow. The solved exchange flow rates did not rely on the air sampling location. This was because the mass conservation was imposed and the air sampling did not alter much the air exchange paths. Note that the continuous air sampling had changed both the inward and outward leakage rates as compared with the case without air sampling.
Figure 6 shows distributions of CO2 concentration in the symmetric section for different cases in one breathing cycle. It can be seen that the CO2 concentrations changed dramatically over time. At t = 1.25 s with a peak exhalation speed, the CO2 concentrations inside the face mask were highly nonuniform. The highest CO2 concentration was near the mouth, while the concentration near the mask was lower. The air sampling extracted a small part of air with a higher CO2 concentration to the sampling tube. At t = 3 s when the inhalation started, the CO2 concentrations were quite uniform regardless of the air sampling. At t = 4.25 s with a peak inhalation speed, the high CO2 concentrations were concentrated near the mouth. At t = 6 s when a breathing cycle ended, the CO2 concentrations were the lowest among the four different time slots presented in Figure 6. The air sampling also extracted a very small part of air with a relatively high CO2 concentration to the sampling tube.
Table 3 summarizes the time-averaged CO2 concentrations by CFD simulation in both the sampling air tube and the face mask for a breathing cycle. The first row is the face-averaged value in a cross-section of the sampling air tube, and the second row is the volume-averaged concentration inside the mask. It can be seen that the CO2 concentrations in the sampling tube were significantly higher than the concentration in the face mask. The sampled CO2 concentration for the central sampling position was the highest because the tube was closer to the mouth. Note that as compared with the case without air sampling, the air sampling decreased the average CO2 concentrations inside the mask regardless of the air sampling positions. This was because the air sampling increased the inward leakage flow into the mask, which diluted the CO2. On the other hand, the air sampling extracted the relatively high-concentration CO2 into the air sampling tube.
The CFD modeling revealed that the continuous air sampling inevitably increased the inward leakage rate into the face mask. The sampling also resulted in an enrichment of the contents of the exhaled air as compared with those inside the face mask. The central sampling could better indicate the inhaled air parameters so that the sampling was adopted in the subsequent measurement practices.

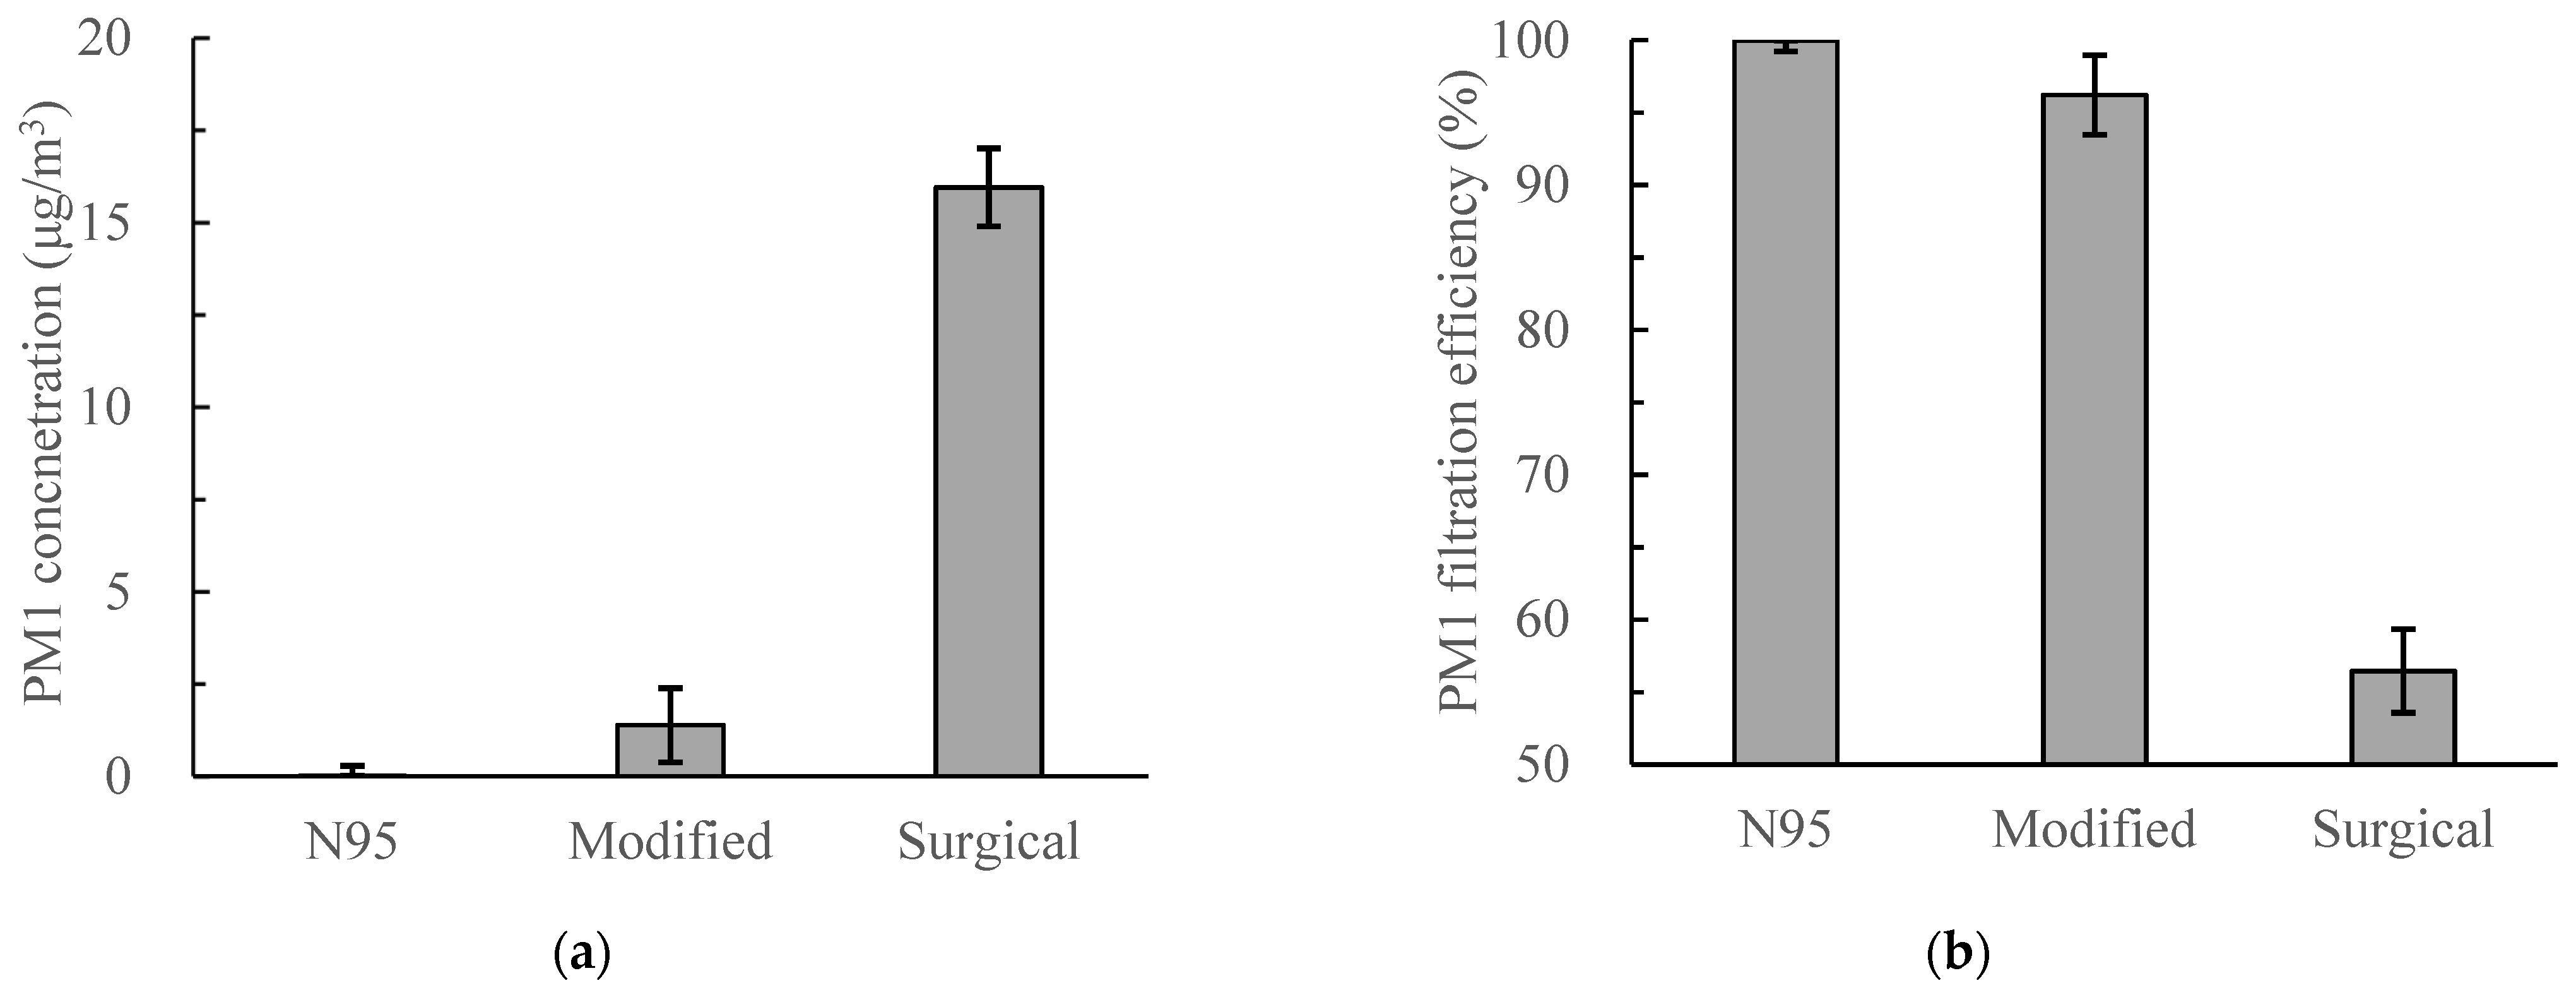
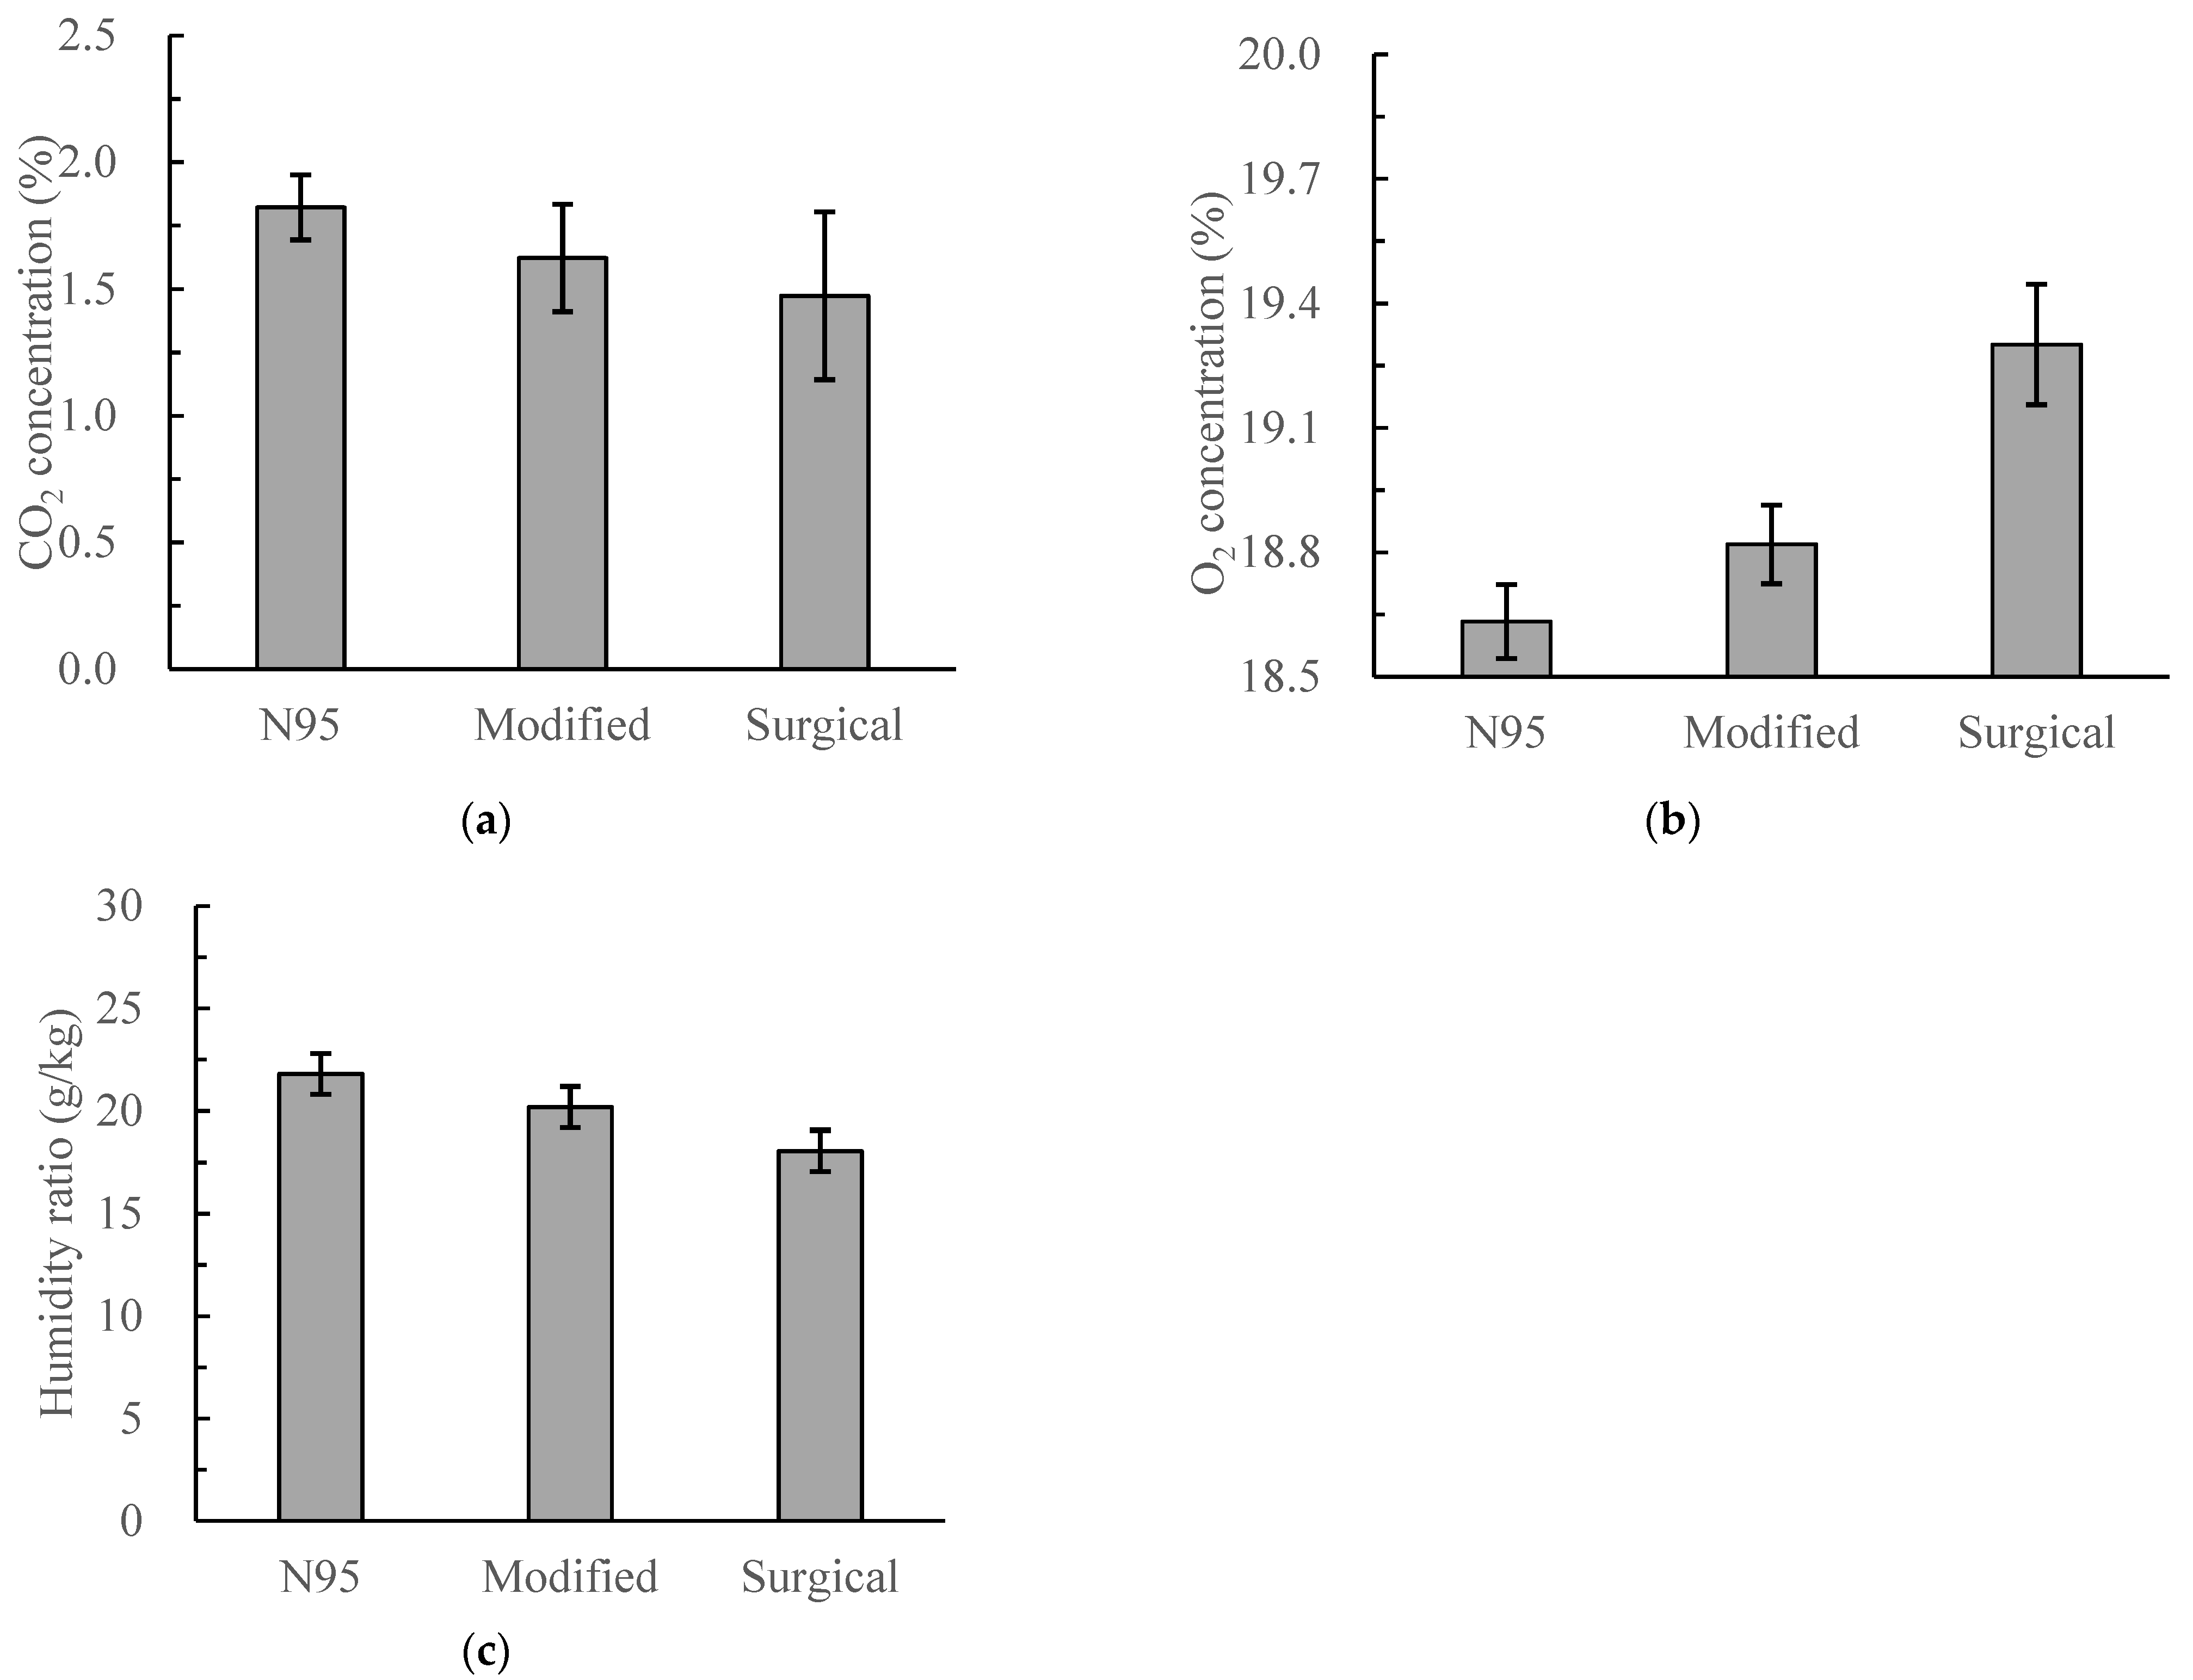
3.2. Measured Particle Filtration Efficiency and Air Contents

Figure 7a shows the mass concentration of PM1 inside the three face masks. Both the average concentrations and the standard deviations of five repetitive measurements are presented. The average PM1 concentration inside the N95 mask was 0.013 μg/m3, due to the high-efficiency filter of the N95 mask and the excellent airtightness between the face mask and the face. The average PM1 concentration in the modified face mask was approximately 1 μg/m3, which was much lower than that in the surgical mask of 16 μg/m3. Figure 7b shows the overall filtration efficiency of the three masks, which were 99.96%, 96.21%, and 56.45% sequentially for the N95, modified, and surgical face masks, respectively. The modified mask had an overall filtration efficiency slightly lower than the N95 mask but much higher than that of the surgical face mask. This indicated the substantial improvement in protection for the modified mask due to better airtightness.
Figure 8a,b presents the measured CO2 and O2 concentrations in the sampled air for the three masks. The CO2 and O2 concentrations in the background air were 0.05% and 21.0%, respectively. The CO2 concentration in the N95 mask, the modified mask, and the surgical mask were 1.82%, 1.62%, and 1.47%, sequentially and respectively. The O2 concentrations inside these three masks were 18.63%, 18.82%, and 19.30%, respectively. It can be seen that the CO2 concentrations in the masks were much higher than that in the background air, and the O2 concentrations were lower. The CO2 concentration inside the modified mask was significantly lower than that of the N95 mask, and the O2 concentration inside the modified mask was slightly higher. As compared with the N95 face mask, the modified mask would enhance the oxygen supply concentration and thus would decrease the complaint of breathing difficulty.
Figure 8c shows the measured humidity ratios of the sampled air. The average humidity ratios inside the N95 mask, the modified mask, and the surgical mask were 21.80 g/kg, 20.18 g/kg, and 18.06 g/kg, sequentially and respectively. The humidity ratios in the three mask types were much higher than that of the background air with 4.79 g/kg. However, the humidity ratio in the modified mask was slightly lower than that of the N95 mask, which might reduce the hot-humid complaint somehow.
Table 4 summarizes the N2, CO2, and O2 concentrations inside the three face masks measured by the gas chromatography. The N2 concentrations in the three masks were approximately 76%, which was lower than the N2 concentration of 78% in the atmosphere. This was because the exhaled air contained a significant amount of water vapor, which expelled the N2 and hence reduced its share in the air. The O2 concentration in the modified mask was higher than that of the N95 mask but lower than that of the surgical face mask. It was thus not surprising that the CO2 concentration of the modified face mask was lower than that of the N95 mask but higher than that of the surgical mask. The presented results in Table 4 were in consistent with the previous continuous monitoring results.

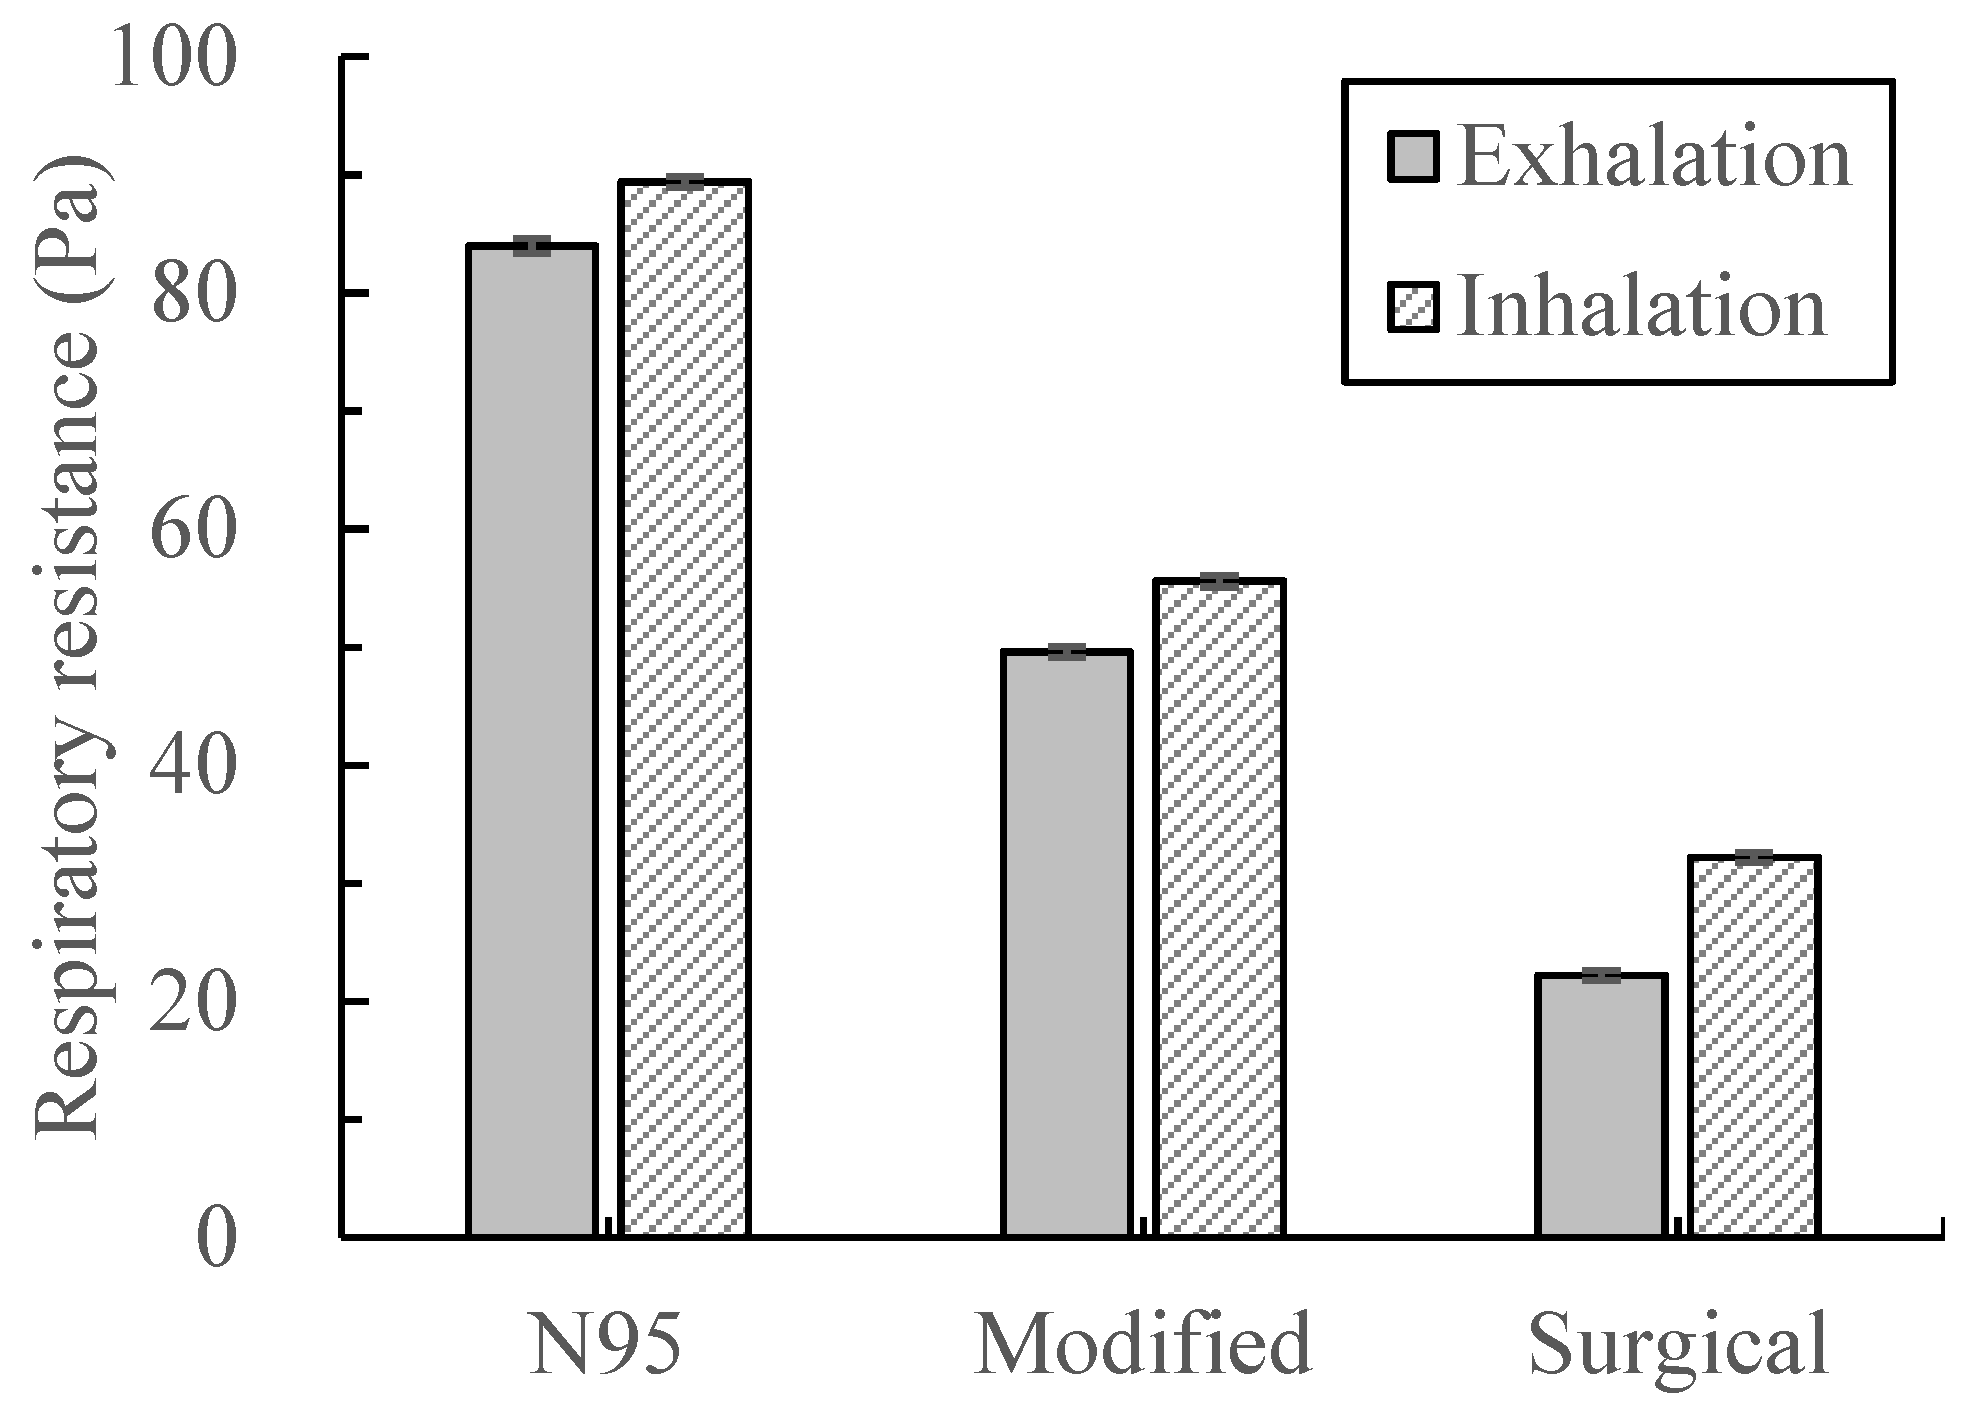
3.3. Measured Dead Space and Respiratory Flow Resistance

Figure 9 shows the measured dead space when wearing the three different face masks to the dummy’s head of the test instrument. During the test, the CO2 concentration of the exhaled air from the instrument was 1.78%. The dead space of the three face masks was 0.71%, 0.50%, and 0.09%, respectively. The dead space of the modified mask was reduced by 29.58% as compared with that of the N95 mask, indicating that the air that did not participate in breathing when wearing the modified mask was much less than that when wearing the N95 mask. Consequently, the breathing comfort of wearing the modified mask would be greatly enhanced as compared with that of wearing the N95 mask.
Figure 10 shows the measured steady exhalation and inhalation resistance of the three face masks. Under the test flow rate of 85 L/min, the exhalation resistance of the N95 mask, modified mask, and surgical mask was 84 Pa, 49 Pa, and 22.2 Pa, sequentially and respectively. In addition, the inhalation resistance was 89.4 Pa, 55.6 Pa, and 32.2 Pa, respectively. The inhalation resistances were greater than the exhalation resistances due to the better airtightness of the face masks with the face when inhalation. Both the exhalation and inhalation resistances decreased from the N95 mask to the modified mask and then to the surgical mask. The exhalation resistance of the modified mask was 41.67% lower than that of the N95 mask, and the inhalation resistance was 37.81% lower. As compared with wearing the N95 masks, wearing the modified masks would make breathing more easily.

4. Discussion

In this study, the air inside face masks was sampled and measured. When measuring the PM1, O2, CO2, temperature, and relative humidity, the air inside the masks was continuously sampled for four minutes. Only the time-average values were reported in this study. Note that the minimum time interval to measure a concentration of PM1, O2, and CO2 was 1 s, 3 s, and 40 s, respectively. The time interval to measure a concentration of CO2 was longer than a time-period of a breathing cycle. Thus, the measured concentrations of CO2 could not well indicate the time-varying concentrations as shown in Figure 6 using CFD modeling.
When measuring the N2 concentration, the air was collected in a gas sampling bag and then sent to the gas chromatography for analysis. Due to the small volume of the gas sampling bag, the sampling time was 3 s, which was also shorter than a breathing cycle. Note that the human breathing process was dynamic, which made the gas sampling involve randomness. In addition, the gases adopted for calibration in gas chromatography had low CO2 and O2 concentrations. This might result in an error in the reported CO2 and O2 concentrations by the gas chromatography. Therefore, there were certain differences in the concentrations reported by the continuous monitoring and the measurement by the gas chromatography. Nevertheless, either measurement method attested the generally excellent performance of the modified face mask.
When a mask is worn by a subject, the test results can be affected by many factors, such as the way that the masks are worn, the head size, the elastic strings or straps, etc. This study tried to ensure that all of the face masks were worn in the same way by the test subject. Further studies could recruit more test subjects of both genders, different ages, races, body weights, etc. The face masks can also be evaluated more comprehensively by conducting both objective measurements and subjective questionnaires.
The concentrations in air sampling tubes should not be identical to the average concentrations inside the masks. Note that the average concentrations inside the face masks are also not equivalent to the concentrations inhaled by a person. It can be found through CFD simulation that the air mixing condition inside the mask was highly nonuniform in space and varied with time. The highest CO2 concentration was near the mouth. The sampling tube in the center of the face mask could better represent the inhaled air status. However, any air sampling method might inevitably result in modification of the original conditions inside the face masks when without air sampling. Further study may adopt a breathing simulator and measure the inhaled air in the lung.

5. Conclusions

A modified surgical face mask with better protection and wearing comfort was proposed. Measurements were conducted to evaluate the overall PM1 filtration efficiency, and concentrations of CO2, O2, N2, and water vapor. The performance of the proposed face mask was compared with the market-available surgical and N95 face masks. In addition, CFD modeling was adopted to understand the dynamic air exchange of the face mask with respiration and the surrounding air. Impacts of the air sampling tube positions on the measurements were also addressed. The following conclusions can be drawn:
  • As compared with the surgical face masks, the airtightness and protective performance of the modified masks were greatly enhanced. The overall PM1 filtration efficiency of the face mask reached 96.21%, which was much higher than that of the surgical face mask and only slightly lower than the N95 face mask.
  • As compared with the N95 face mask, the modified mask reduced both the concentrations of CO2 and water vapor and increased the concentration of O2. Both the steady exhalation and inhalation resistances were reduced by 41.67% and 37.81%, respectively, against the N95 face mask. The modified face mask could thus improve the breathing comfort.
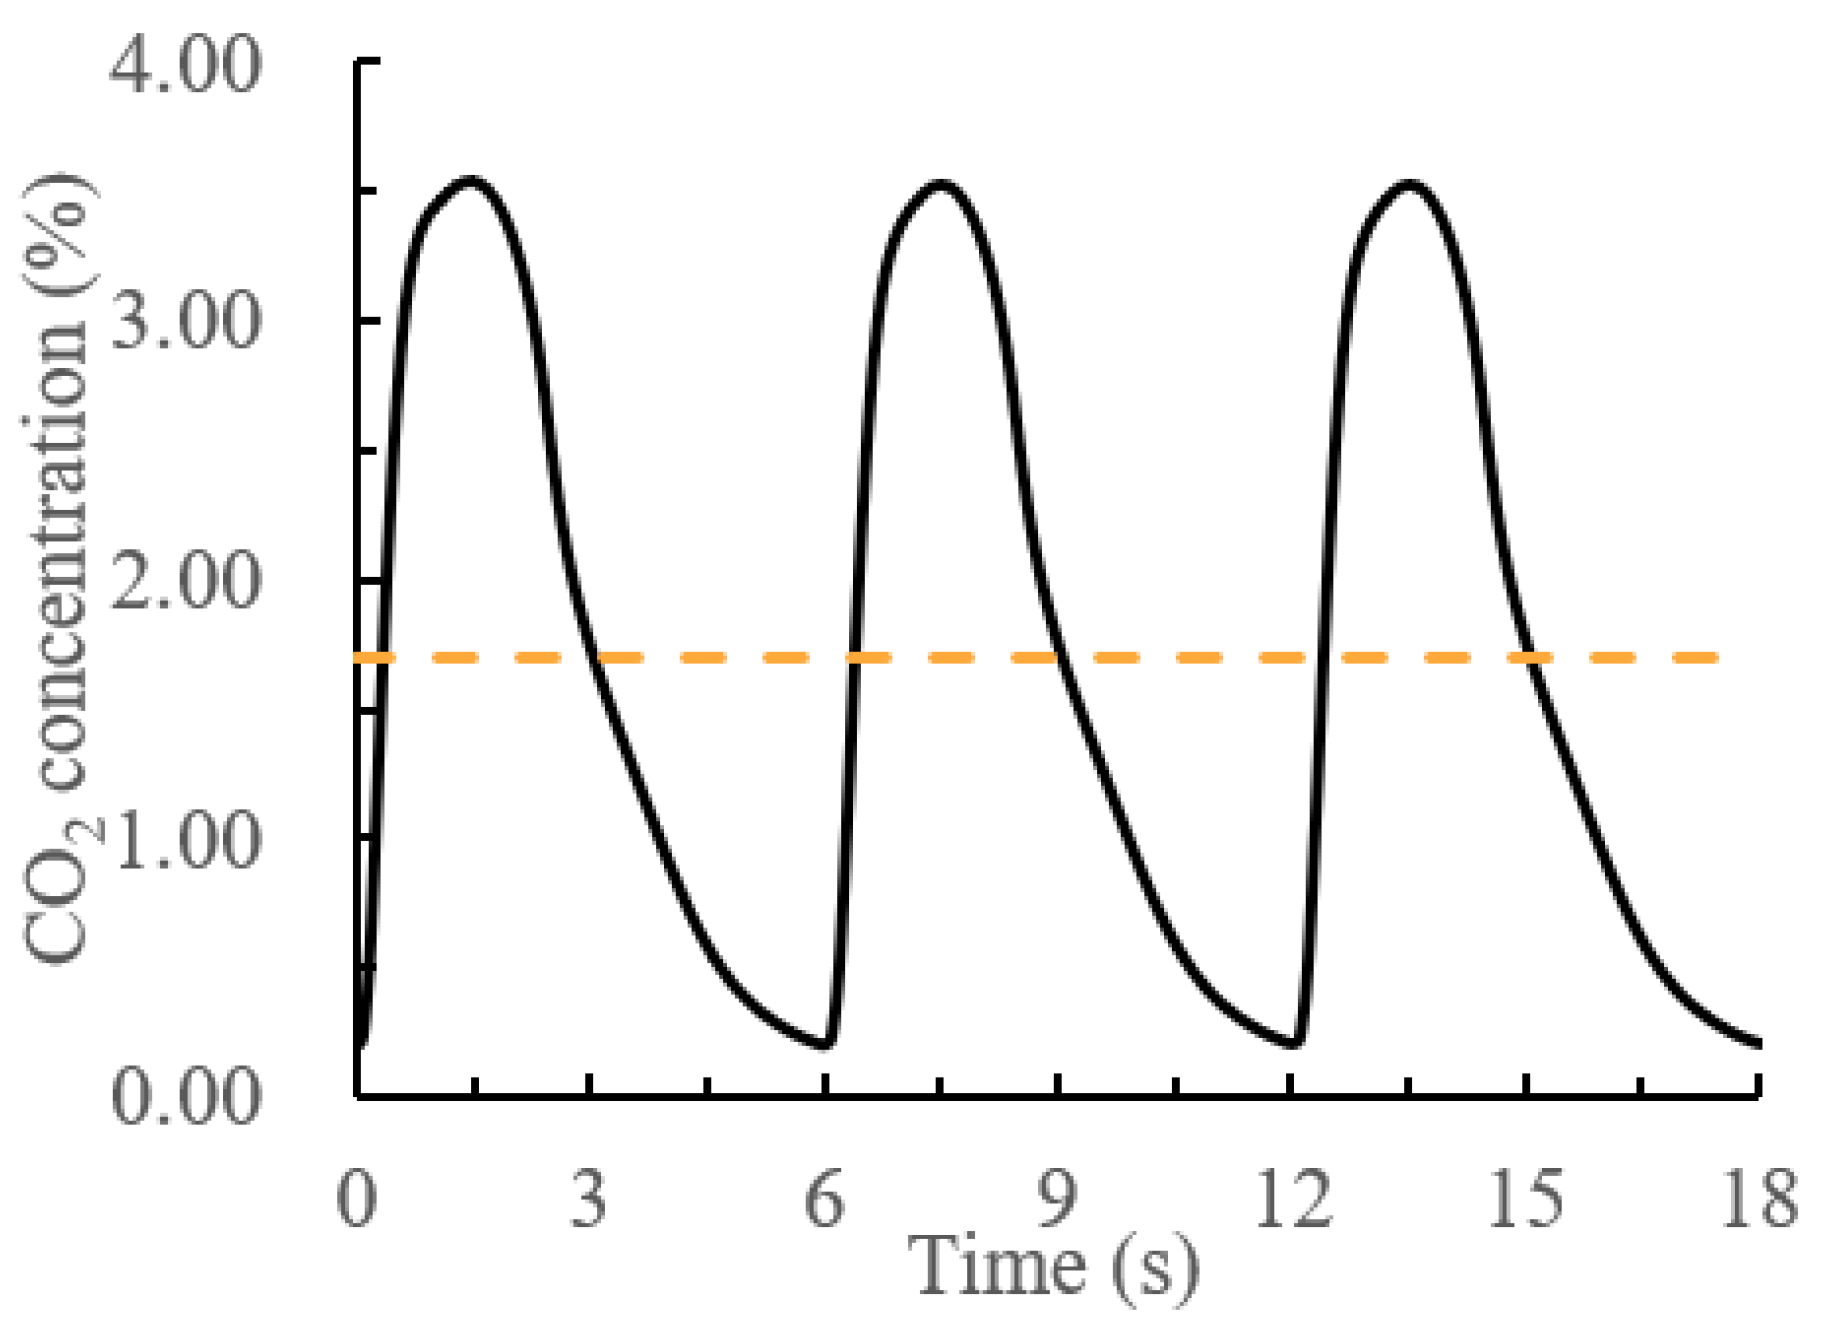
  • Air sampling increased the inward leakage of the face mask. The air mixing condition inside the face mask was highly nonuniform and varied with time. The highest CO2 concentration was near the mouth. The central sampling could better indicate the inhaled air status.

Author Contributions

Conceptualization, T.Z. (Tengfei (Tim) Zhang); Investigation, T.Z. (Tinglu Zhang); Methodology, T.Z. (Tengfei (Tim) Zhang) and S.L.; Project administration, T.Z. (Tengfei (Tim) Zhang); Validation, T.Z. (Tinglu Zhang); Visualization, T.Z. (Tinglu Zhang); Writing—original draft, T.Z. (Tinglu Zhang); Writing—review & editing, T.Z. (Tengfei (Tim) Zhang) and S.L. All authors have read and agreed to the published version of the manuscript.

Funding

The research was supported by the National Natural Science Foundation of China through Grant No. 51978450 and No. 52108084.

Institutional Review Board Statement

Not applicable.

Informed Consent Statement

Not applicable.

Data Availability Statement

Not applicable.

Conflicts of Interest

The authors declare no conflict of interest.

Appendix A. Validation of CFD Modeling

The CFD simulation results should be validated by comparing them with experiment data. In this study, the air inside the modified face masks was sampled and measured. The sampling air tube was in the center of the masks. When wearing an N95 mask, the measured average CO2 concentration was 1.82% for five repetitive tests. The sampled CO2 concentrations for the central sampling case by CFD are shown in Figure A1. Three breathing cycles were considered, and the CO2 concentration averaged in a cross-section of the sampling tube is presented. With dynamic exhalation and inhalation, the CO2 concentration first increased and then decreased. The time-average CO2 concentration was 1.70% as shown by the dashed orange line. The CFD simulated concentration was 6.59% smaller than the measured concentration. The settings of the rest CFD modeling cases were the same as those in the central sampling case. Thus, we concluded that our CFD simulation was reliable.
Figure A1. CFD simulated CO2 concentration at the sampling tube of the central sampling case, where the solid black line represents the dynamic CO2 concentration and the dashed orange line illustrates the time-average CO2 concentration of 1.70%.
Buildings 12 00663 g0a1

References

  1. Law, R.C.K.; Lai, J.H.K.; Edwards, D.J.; Hou, H. COVID-19: Research Directions for Non-Clinical Aerosol-Generating Facilities in the Built Environment. Buildings 2021, 11, 282. [Google Scholar] [CrossRef]
  2. Leung, N.H.L.; Chu, D.K.W.; Shiu, E.Y.C.; Chan, K.H.; McDevitt, J.J.; Hau, B.J.P.; Yen, H.L.; Li, Y.; Ip, D.K.M.; Peiris, J.S.M.; et al. Respiratory virus shedding in exhaled breath and efficacy of face masks. Nat. Med. 2020, 26, 676–680. [Google Scholar] [CrossRef] [PubMed] [Green Version]
  3. Arumuru, V.; Pasa, J.; Samantaray, S.S. Experimental visualization of sneezing and efficacy of face masks and shields. Phys. Fluids 2020, 32, 115129. [Google Scholar] [CrossRef] [PubMed]
  4. Cheng, Y.; Ma, N.; Witt, C.; Rapp, S.; Wild, P.S.; Andreae, M.O.; Poschl, U.; Su, H. Face masks effectively limit the probability of SARS-CoV-2 transmission. Science 2021, 372, 1439–1443. [Google Scholar] [CrossRef] [PubMed]
  5. Dbouk, T.; Drikakis, D. On respiratory droplets and face masks. Phys. Fluids 2020, 32, 063303. [Google Scholar] [CrossRef]
  6. WHO. Mask Use in the Context of COVID-19, Interim Guidance; WHO: Geneva, Switzerland, 2020. [Google Scholar]
  7. Cheok, G.J.W.; Gatot, C.; Sim, C.H.S.; Ng, Y.H.; Tay, K.X.K.; Howe, T.S.; Koh, J.S.B. Appropriate attitude promotes mask wearing in spite of a significant experience of varying discomfort. Infect. Dis. Health 2021, 26, 145–151. [Google Scholar] [CrossRef]
  8. Drewnick, F.; Pikmann, J.; Fachinger, F.; Moormann, L.; Sprang, F.; Borrmann, S. Aerosol filtration efficiency of household materials for homemade face masks: Influence of material properties, particle size, particle electrical charge, face velocity, and leaks. Aerosol. Sci. Technol. 2020, 55, 63–79. [Google Scholar] [CrossRef]
  9. Dhivyadharshini, J.S.J.; Brundha, M.P. composition and uses of N95 masks-a review. Eur. J. Mol. Clin. Med. 2020, 7, 1529–1540. [Google Scholar]
  10. Sato, J.; Yamawaki, Y.; Ito, M.; Endo, M.; Tanaka, R.; Shino, M. Measurement of the leak rate of masks used for anticancer drug handling using a mask fitting tester. J. Oncol. Pharm. Pract. 2020, 26, 1318–1323. [Google Scholar] [CrossRef]
  11. Huo, S.; Zhang, T.T. Ventilation of ordinary face masks. Build. Environ. 2021, 205, 108261. [Google Scholar] [CrossRef]
  12. Akhtar, J.; Garcia, A.L.; Saenz, L.; Kuravi, S.; Shu, F.; Kota, K. Can face masks offer protection from airborne sneeze and cough droplets in close-up, face-to-face human interactions?—A quantitative study. Phys. Fluids 2020, 32, 127112. [Google Scholar] [CrossRef]
  13. Zhang, R.; Liu, J.; Zhang, L.; Lin, J.; Wu, Q. The distorted power of medical surgical masks for changing the human thermal psychology of indoor personnel in summer. Indoor Air 2021, 31, 1645–1656. [Google Scholar] [CrossRef] [PubMed]
  14. Sinkule, E.J.; Powell, J.B.; Goss, F.L. Evaluation of N95 respirator use with a surgical mask cover: Effects on breathing resistance and inhaled carbon dioxide. Ann. Occup. Hyg. 2013, 57, 384–398. [Google Scholar]
  15. Lee, H.P.; Wang, D.Y. Objective assessment of increase in breathing resistance of N95 respirators on human subjects. Ann. Occup. Hyg. 2011, 55, 917–921. [Google Scholar] [PubMed] [Green Version]
  16. Tcharkhtchi, A.; Abbasnezhad, N.; Seydani, M.Z.; Zirak, N.; Farzaneh, S.; Shirinbayan, M. An overview of filtration efficiency through the masks: Mechanisms of the aerosols penetration. Bioact. Mater. 2021, 6, 106–122. [Google Scholar] [CrossRef]
  17. Choi, S.; Jeon, H.; Jang, M.; Kim, H.; Shin, G.; Koo, J.M.; Lee, M.; Sung, H.K.; Eom, Y.; Yang, H.S.; et al. Biodegradable, Efficient, and Breathable Multi-Use Face Mask Filter. Adv. Sci. 2021, 8, 2003155. [Google Scholar] [CrossRef]
  18. Li, X.; Gong, Y. Design of Polymeric Nanofiber Gauze Mask to Prevent Inhaling PM2.5 Particles from Haze Pollution. J. Chem. 2015, 2015, 460392. [Google Scholar] [CrossRef]
  19. Wang, N.; Cai, M.; Yang, X.; Yang, Y. Electret nanofibrous membrane with enhanced filtration performance and wearing comfortability for face mask. J. Colloid Interface Sci. 2018, 530, 695–703. [Google Scholar] [CrossRef] [PubMed]
  20. Zhang, X.; Li, H.; Shen, S.; Rao, Y.; Chen, F. An Improved FFR Design with a Ventilation Fan: CFD Simulation and Validation. PLoS ONE 2016, 11, e0159848. [Google Scholar] [CrossRef] [PubMed]
  21. Suen, W.S.; Huang, G.; Kang, Z.; Gu, Y.; Fan, J.; Shou, D. Development of wearable air-conditioned mask for personal thermal management. Build. Environ. 2021, 205, 108236. [Google Scholar] [CrossRef]
  22. Morris, L.A. Dead Space and Inhaled Carbon Dioxide Levels in Respiratory Protective Equipment; HSE Contract Research Report No. 27; Health and Safety Executive: London, UK, 1991.
  23. NIOSH. Determination of Exhalation Resistance. 2019. Available online: https://www.cdc.gov/niosh/npptl/stps/pdfs/TEB-APR-STP-0003-508.pdf (accessed on 27 March 2022).
  24. NIOSH. Determination of Inhalation Resistance. 2019. Available online: https://www.cdc.gov/niosh/npptl/stps/pdfs/TEB-APR-STP-0007-508.pdf (accessed on 27 March 2022).
  25. Zhang, T.T.; Yin, S.; Wang, S. Quantify impacted scope of human expired air under different head postures and varying exhalation rates. Build. Environ. 2011, 46, 1928–1936. [Google Scholar] [CrossRef] [PubMed]
  26. Zhang, X.; Li, H.; Shen, S.; Cai, M. Investigation of the flow-field in the upper respiratory system when wearing N95 filtering facepiece respirator. J. Occup. Environ. Hyg. 2016, 13, 372–382. [Google Scholar] [CrossRef] [PubMed]
Figure 1. The modified face mask: (a) the mask frame, (b) the appearance of a modified mask.
Buildings 12 00663 g001
Figure 2. Three face masks for measurement tests: (a) modified face mask, (b) N95 face mask (c) surgical face mask.
Buildings 12 00663 g002
Figure 3. Experimental test scheme, 1—test subject, 2—face mask, 3—particle monitor, 4—air mixing tube, 5—O2 concentration monitor, 6—temperature, and relative humidity meter, 7—CO2 concentration monitor.
Buildings 12 00663 g003
Figure 4. Geometry model of a female adult wearing an N95 mask: (a) overview of the model, (b) modeling cases with different air sampling positions.
Buildings 12 00663 g004
Figure 5. The boundary condition for dynamic respiratory flow: (a) exhaled air directions, (b) respiratory flow rate profile.
Buildings 12 00663 g005
Figure 6. CO2 concentration distribution in the symmetric section of the head in one breath cycle for different cases of air sampling.
Buildings 12 00663 g006
Figure 7. Comparison of the overall PM1 filtration efficiency among three face masks, where error bars represent the standard deviation of five repetitive measurements: (a) measured PM1 concentrations inside face masks (background PM1 concentration: 36 μg/m3), (b) overall filtration efficiency.
Buildings 12 00663 g007
Figure 8. Concentrations of major air contents in the sampled air from three face masks: (a) CO2 (background concentration: 0.05%), (b) O2 (background concentration: 21.0%), and (c) humidity ratio (background value: 4.79 g/kg).
Buildings 12 00663 g008
Figure 9. Dead space of three face masks (exhaled CO2 concentration: 1.78%).
Buildings 12 00663 g009
Figure 10. Steady exhalation and inhalation flow resistances of three face masks.
Buildings 12 00663 g010
Table 1. Boundary conditions in CFD modeling.
ItemSetting
Nostril openingVelocity-inlet (profile shown as Figure 5); 33 °C; CO2: 4.20%
Air sampling tube openingVelocity-inlet, 3.98 m/s
Face skinWall, 32 °C
Right domain boundaryVelocity-inlet, 0.05 m/s; 22 °C; CO2: 0.05%
Other domain boundaries
(except for the symmetric boundary)
Pressure-outlet, backflow air temperature: 22 °C
Face maskPorous media, porosity: 0.88
Leakage clearancePorous media, porosity: 0.99
Table 2. CFD simulated exchanged air flow rates.
No SamplingUpper SamplingCentral SamplingLower Sampling
QF,in, L/min2.5133.2053.2053.205
QL,in, L/min0.4880.6230.6230.623
QF,out, L/min2.5101.9531.9531.953
QL,out, L/min0.4840.3740.3750.374
Inward leakage rate16.26%20.78%20.76%20.78%
Outward leakage rate16.13%12.47%12.49%12.48%
Table 3. Time-average CO2 concentrations for different air sampling positions.
No SamplingUpper SamplingCentral SamplingLower Sampling
csampling-1.37%1.70%1.51%
cmask1.20%1.14%1.16%1.15%
Table 4. N2, CO2, and O2 concentrations inside three face masks measured by a gas chromatography.
N2CO2O2
N9576.58%2.71%17.08%
Modified76.89%2.22%18.05%
Surgical76.96%1.64%18.81%
Publisher’s Note: MDPI stays neutral with regard to jurisdictional claims in published maps and institutional affiliations.

