
Human Close Contact Behavior-Based Interventions for COVID-19 Transmission


Abstract
:1. Introduction
2. Methods
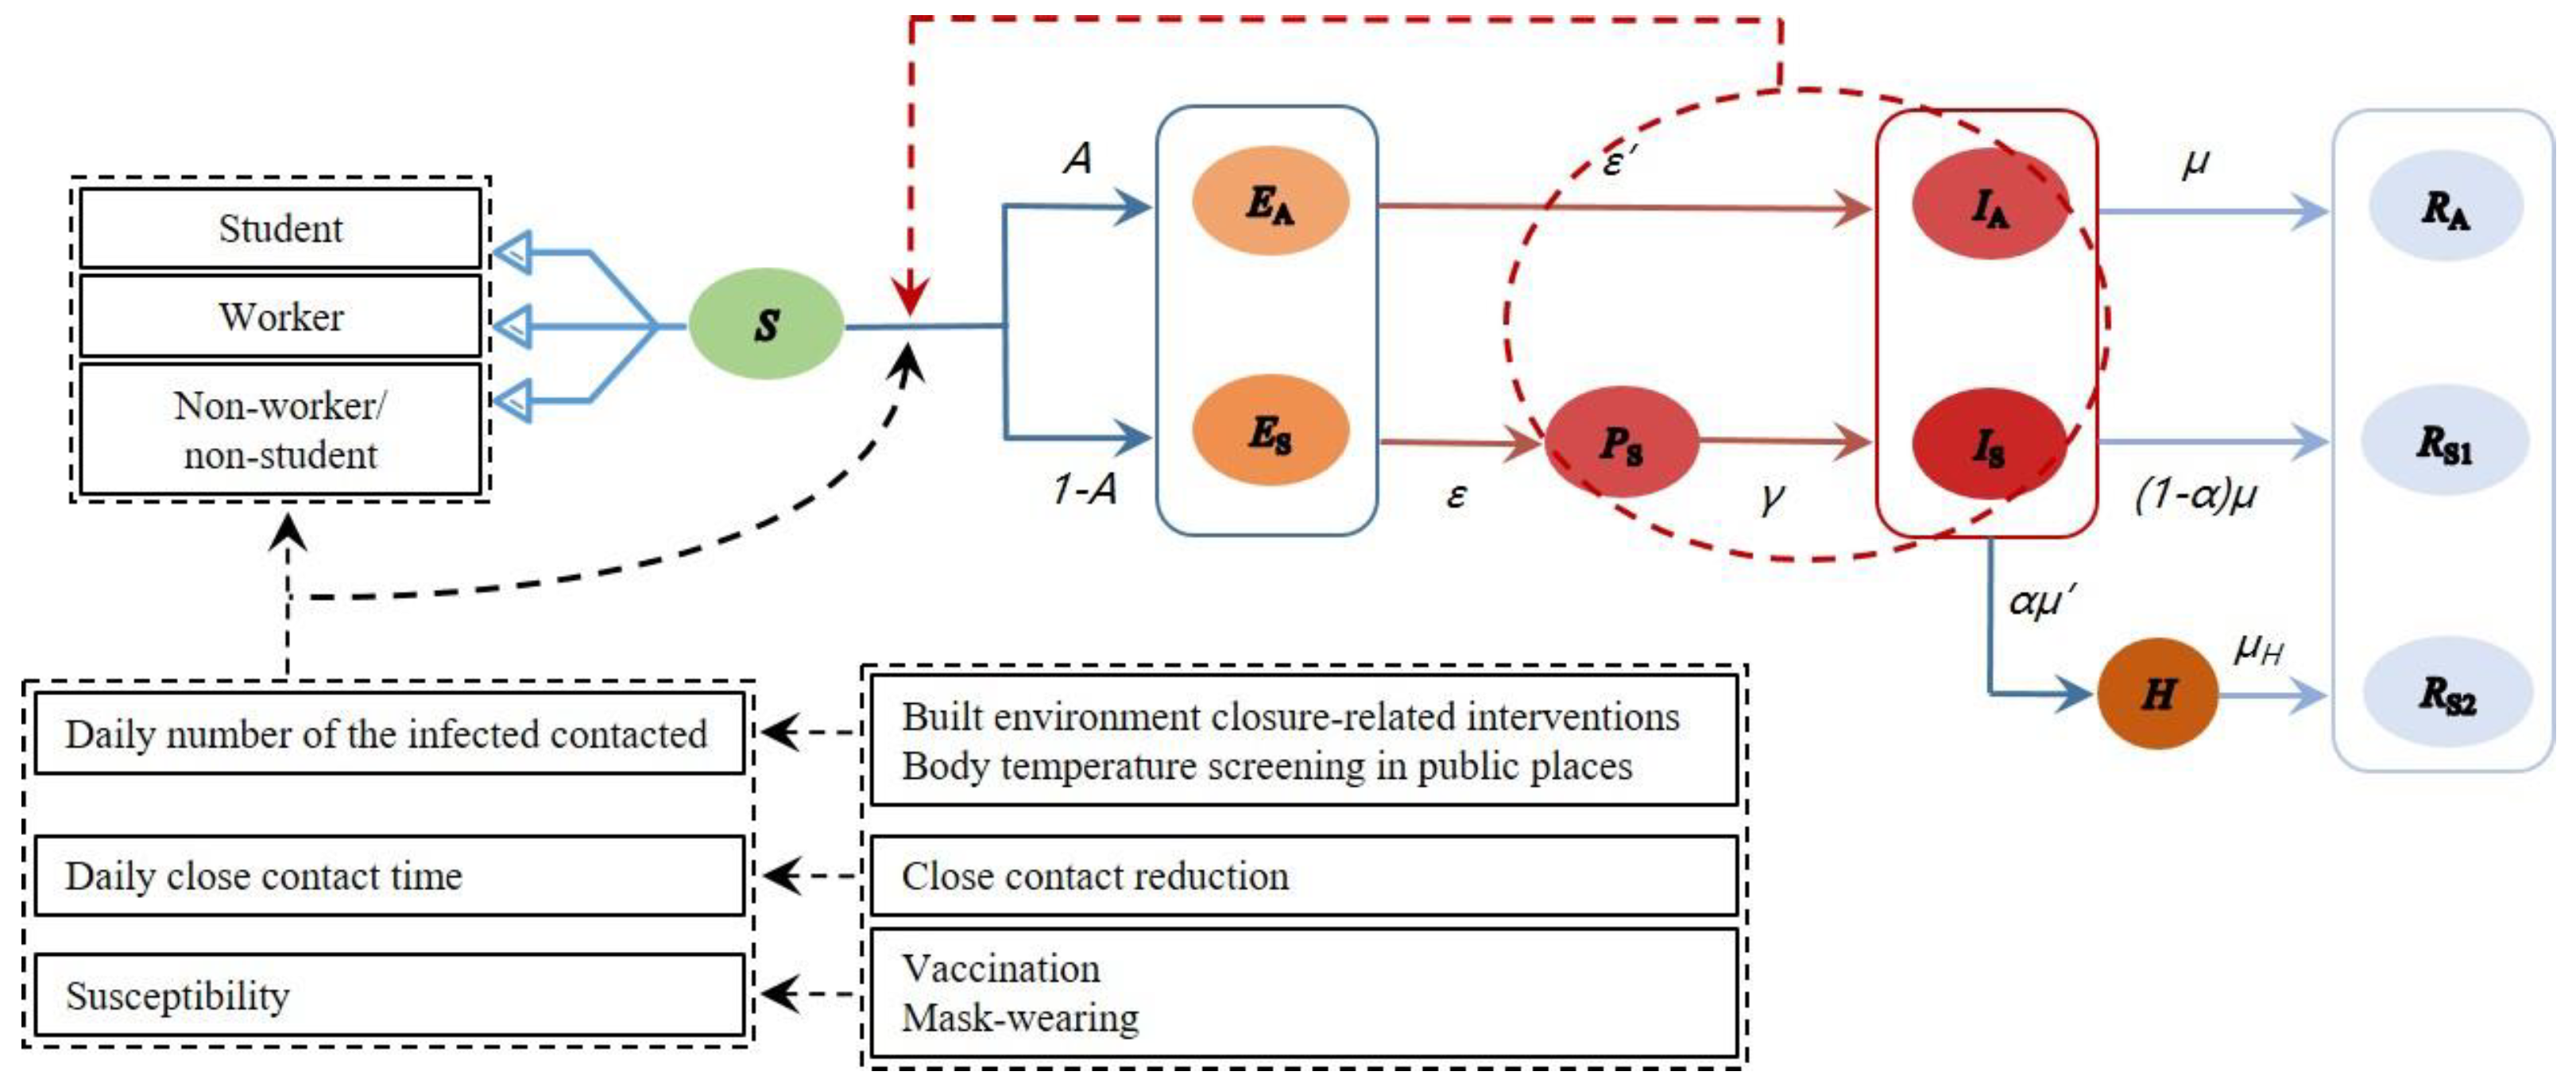
2.1. Model Establishment
2.2. Data Collection and Parameter Setting

| Type | Parameters | Value | Ref. | ||
|---|---|---|---|---|---|
| Student | Worker | Non-Worker/Non-Student | |||
| Population distribution | 14.6% | 63.5% | 21.9% | [28] | |
| Daily number of closely contacted people (m) | School | 8.3 | - | - | [27] |
| Workplace | - | 7.5 | - | ||
| Supermarket | 1.5 | 2.1 | 2.1 | ||
| Public transport | 2.5 | 2.5 | 1.5 | ||
| Shopping center | 2.0 | 1.9 | 2.6 | ||
| Restaurant | 3.4 | 1.7 | 1.1 | ||
| Home | 3.2 | 1.7 | 0.8 | ||
| Close contact rate 1 (CR, %) | School | 64 | - | - | [27] |
| Workplace | - | 55 | - | ||
| Supermarket | 28 | 26 | 22 | ||
| Public transport | 32 | 25 | 17 | ||
| Shopping center | 37 | 17 | 19 | ||
| Restaurant | 47 | 39 | 29 | ||
| Home | 62 | 57 | 31 | ||
| Type | Parameters | Value | Ref. |
|---|---|---|---|
| The initial setting of the population with different statuses | N | 7,500,000 | [8] |
| S(0) | 7,499,999 | Assumed | |
| E(0) | 0 | Assumed | |
| I(0) | 1 (IA = 0.25; Is = 0.75) | Assumed | |
| R(0) | 0 | Assumed | |
| Coefficients in the improved SEIR model | A | 1/4 | [29] |
| 1/3 | [30] | ||
| 1/5 | [30] | ||
| 1/2 | [30] | ||
| 45.0% | Assumed 1 | ||
| 2/5 | [22] | ||
| 1/2 | Assumed 2 | ||
| 1/8 | [31] | ||
| Intervention-related data | Mask filtration efficiency 3 | 64.3% | [32] |
| Vaccine effectiveness 4 | 67.0% | [33] | |
| Probability of fever in the infected | 46.7% | [34] | |
| Correctness of body temperature screening | 86.0% | [13] | |
| Sensitivity of NAT 5 | 84.8% | [35] |
2.3. Model Scenarios
2.3.1. Parameter Setting
2.3.2. Case Study
3. Results
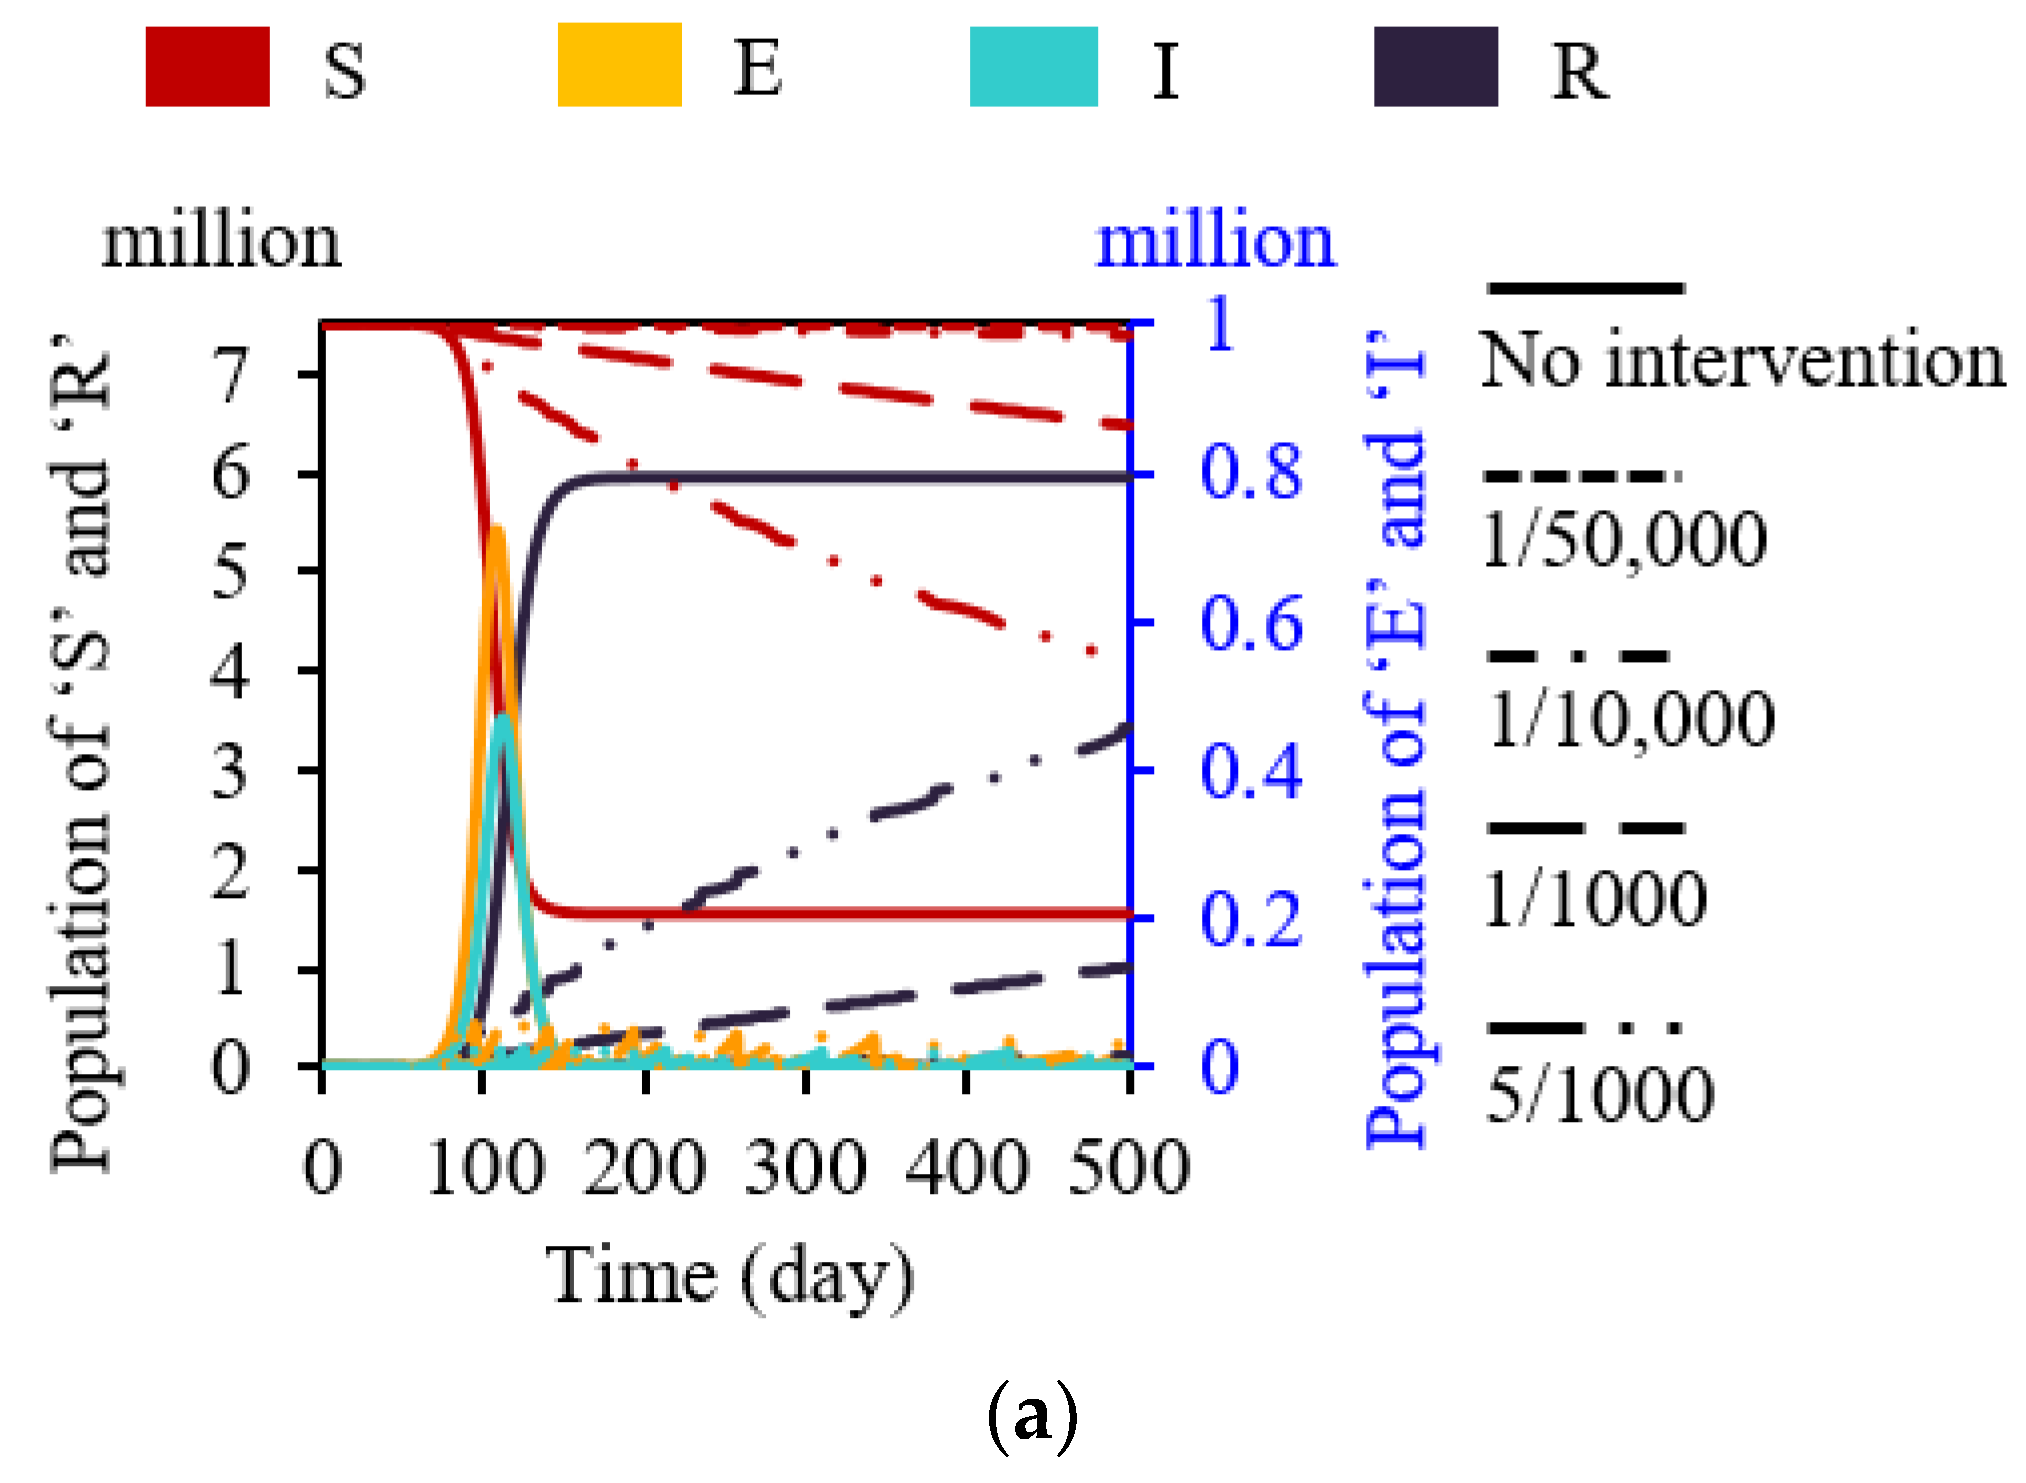
3.1. Basic Results
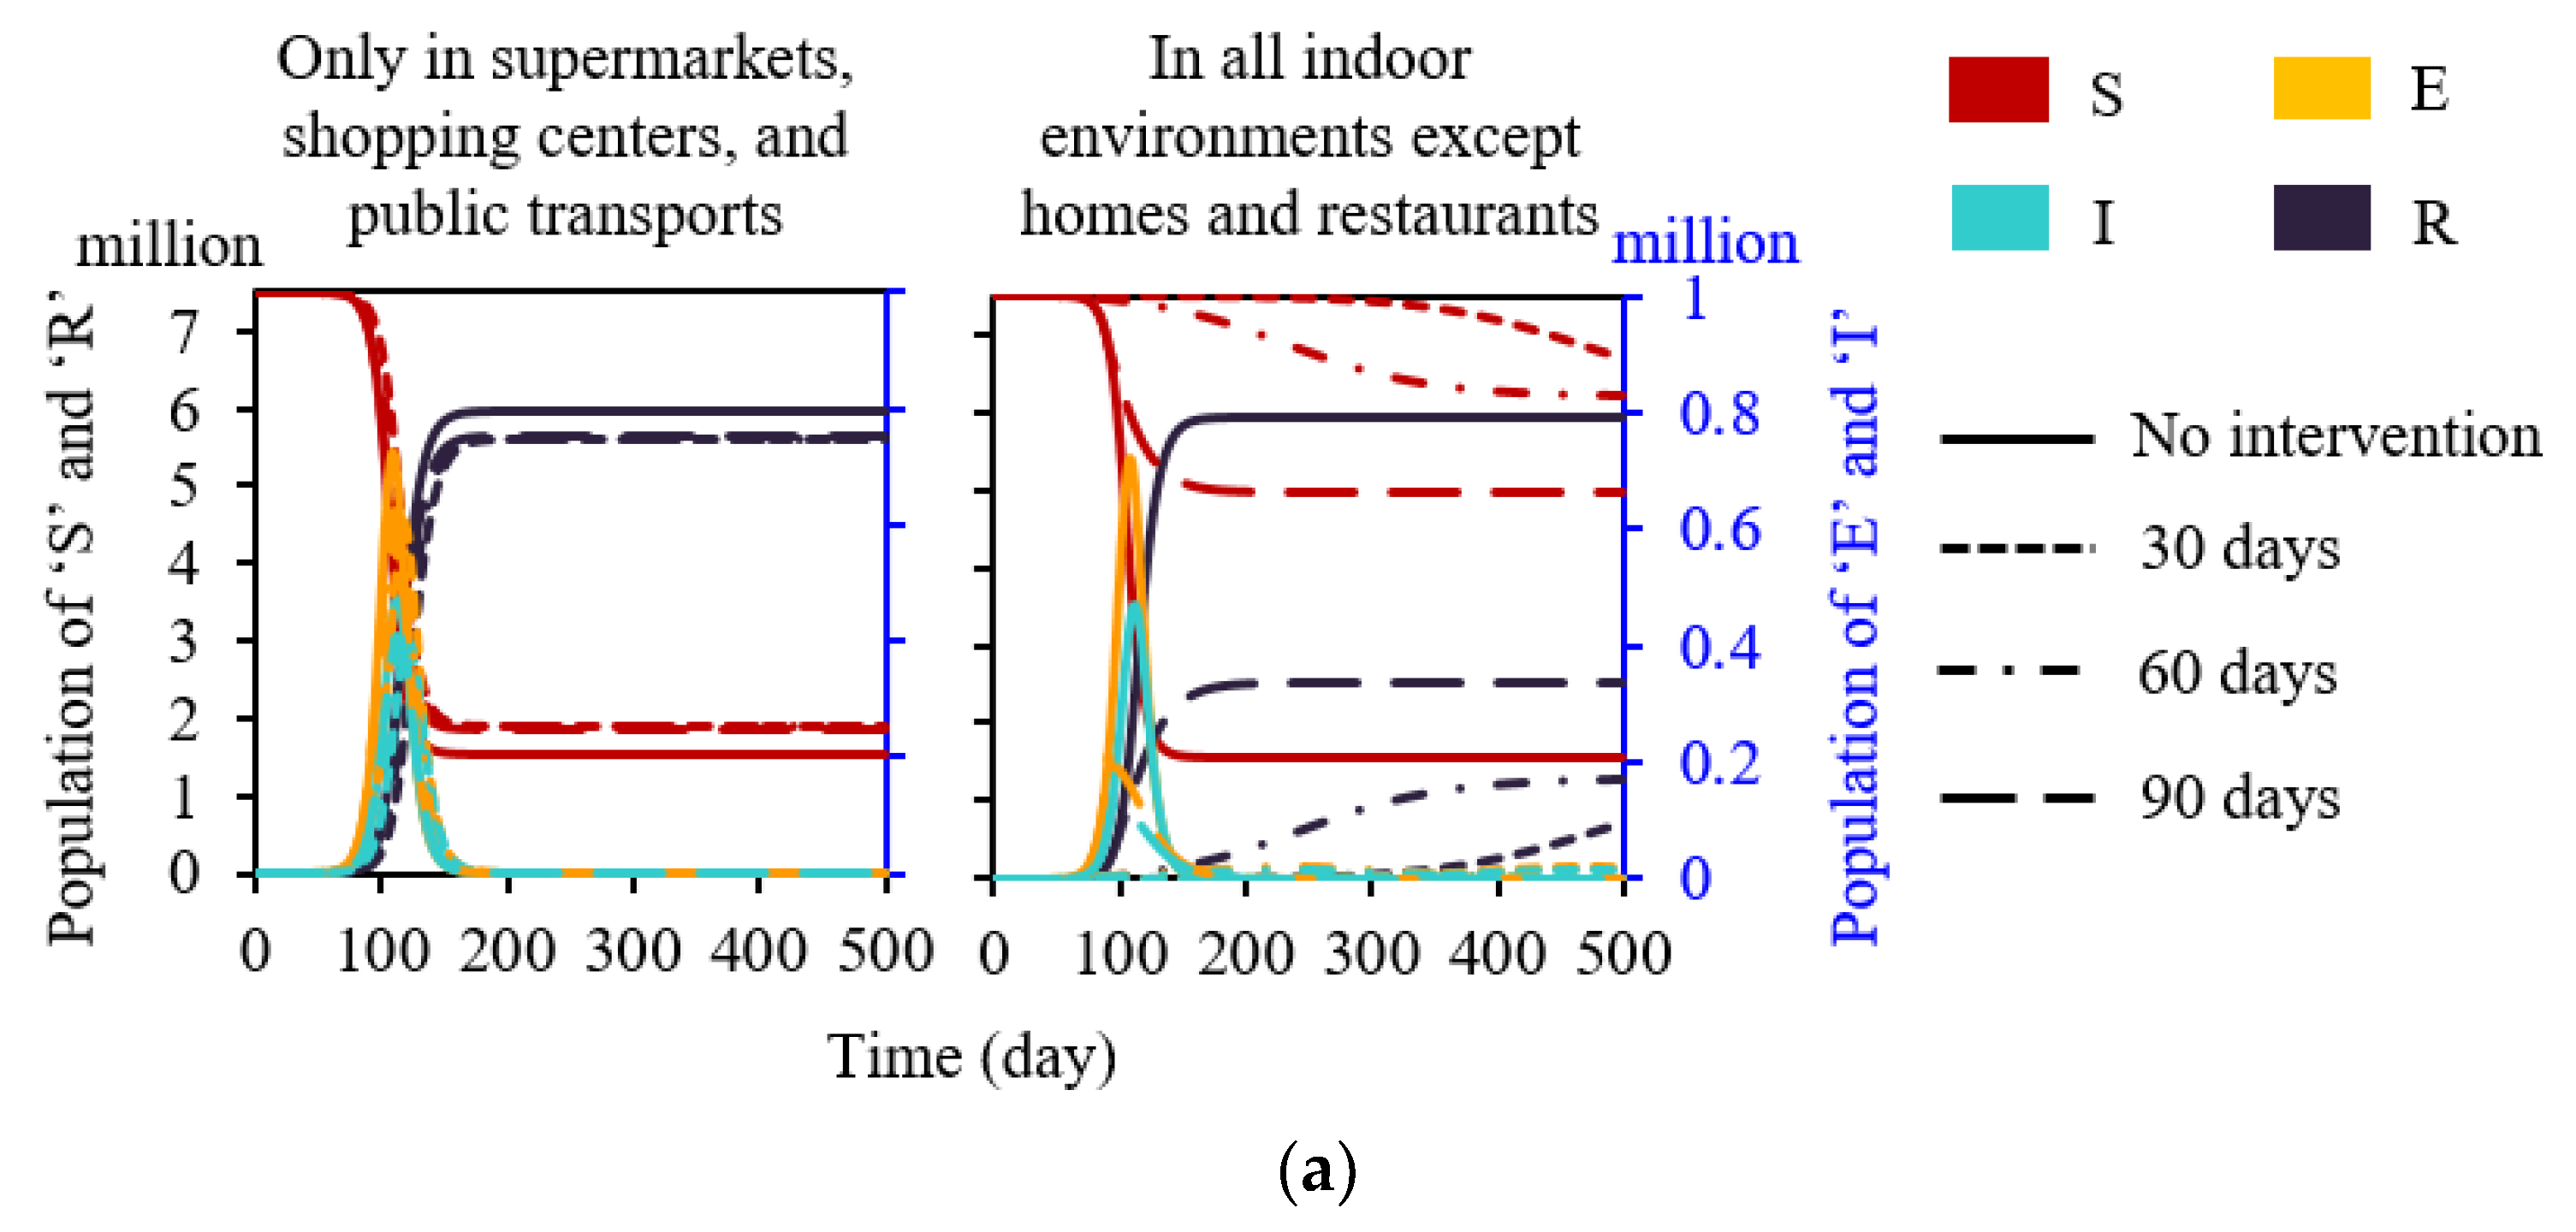
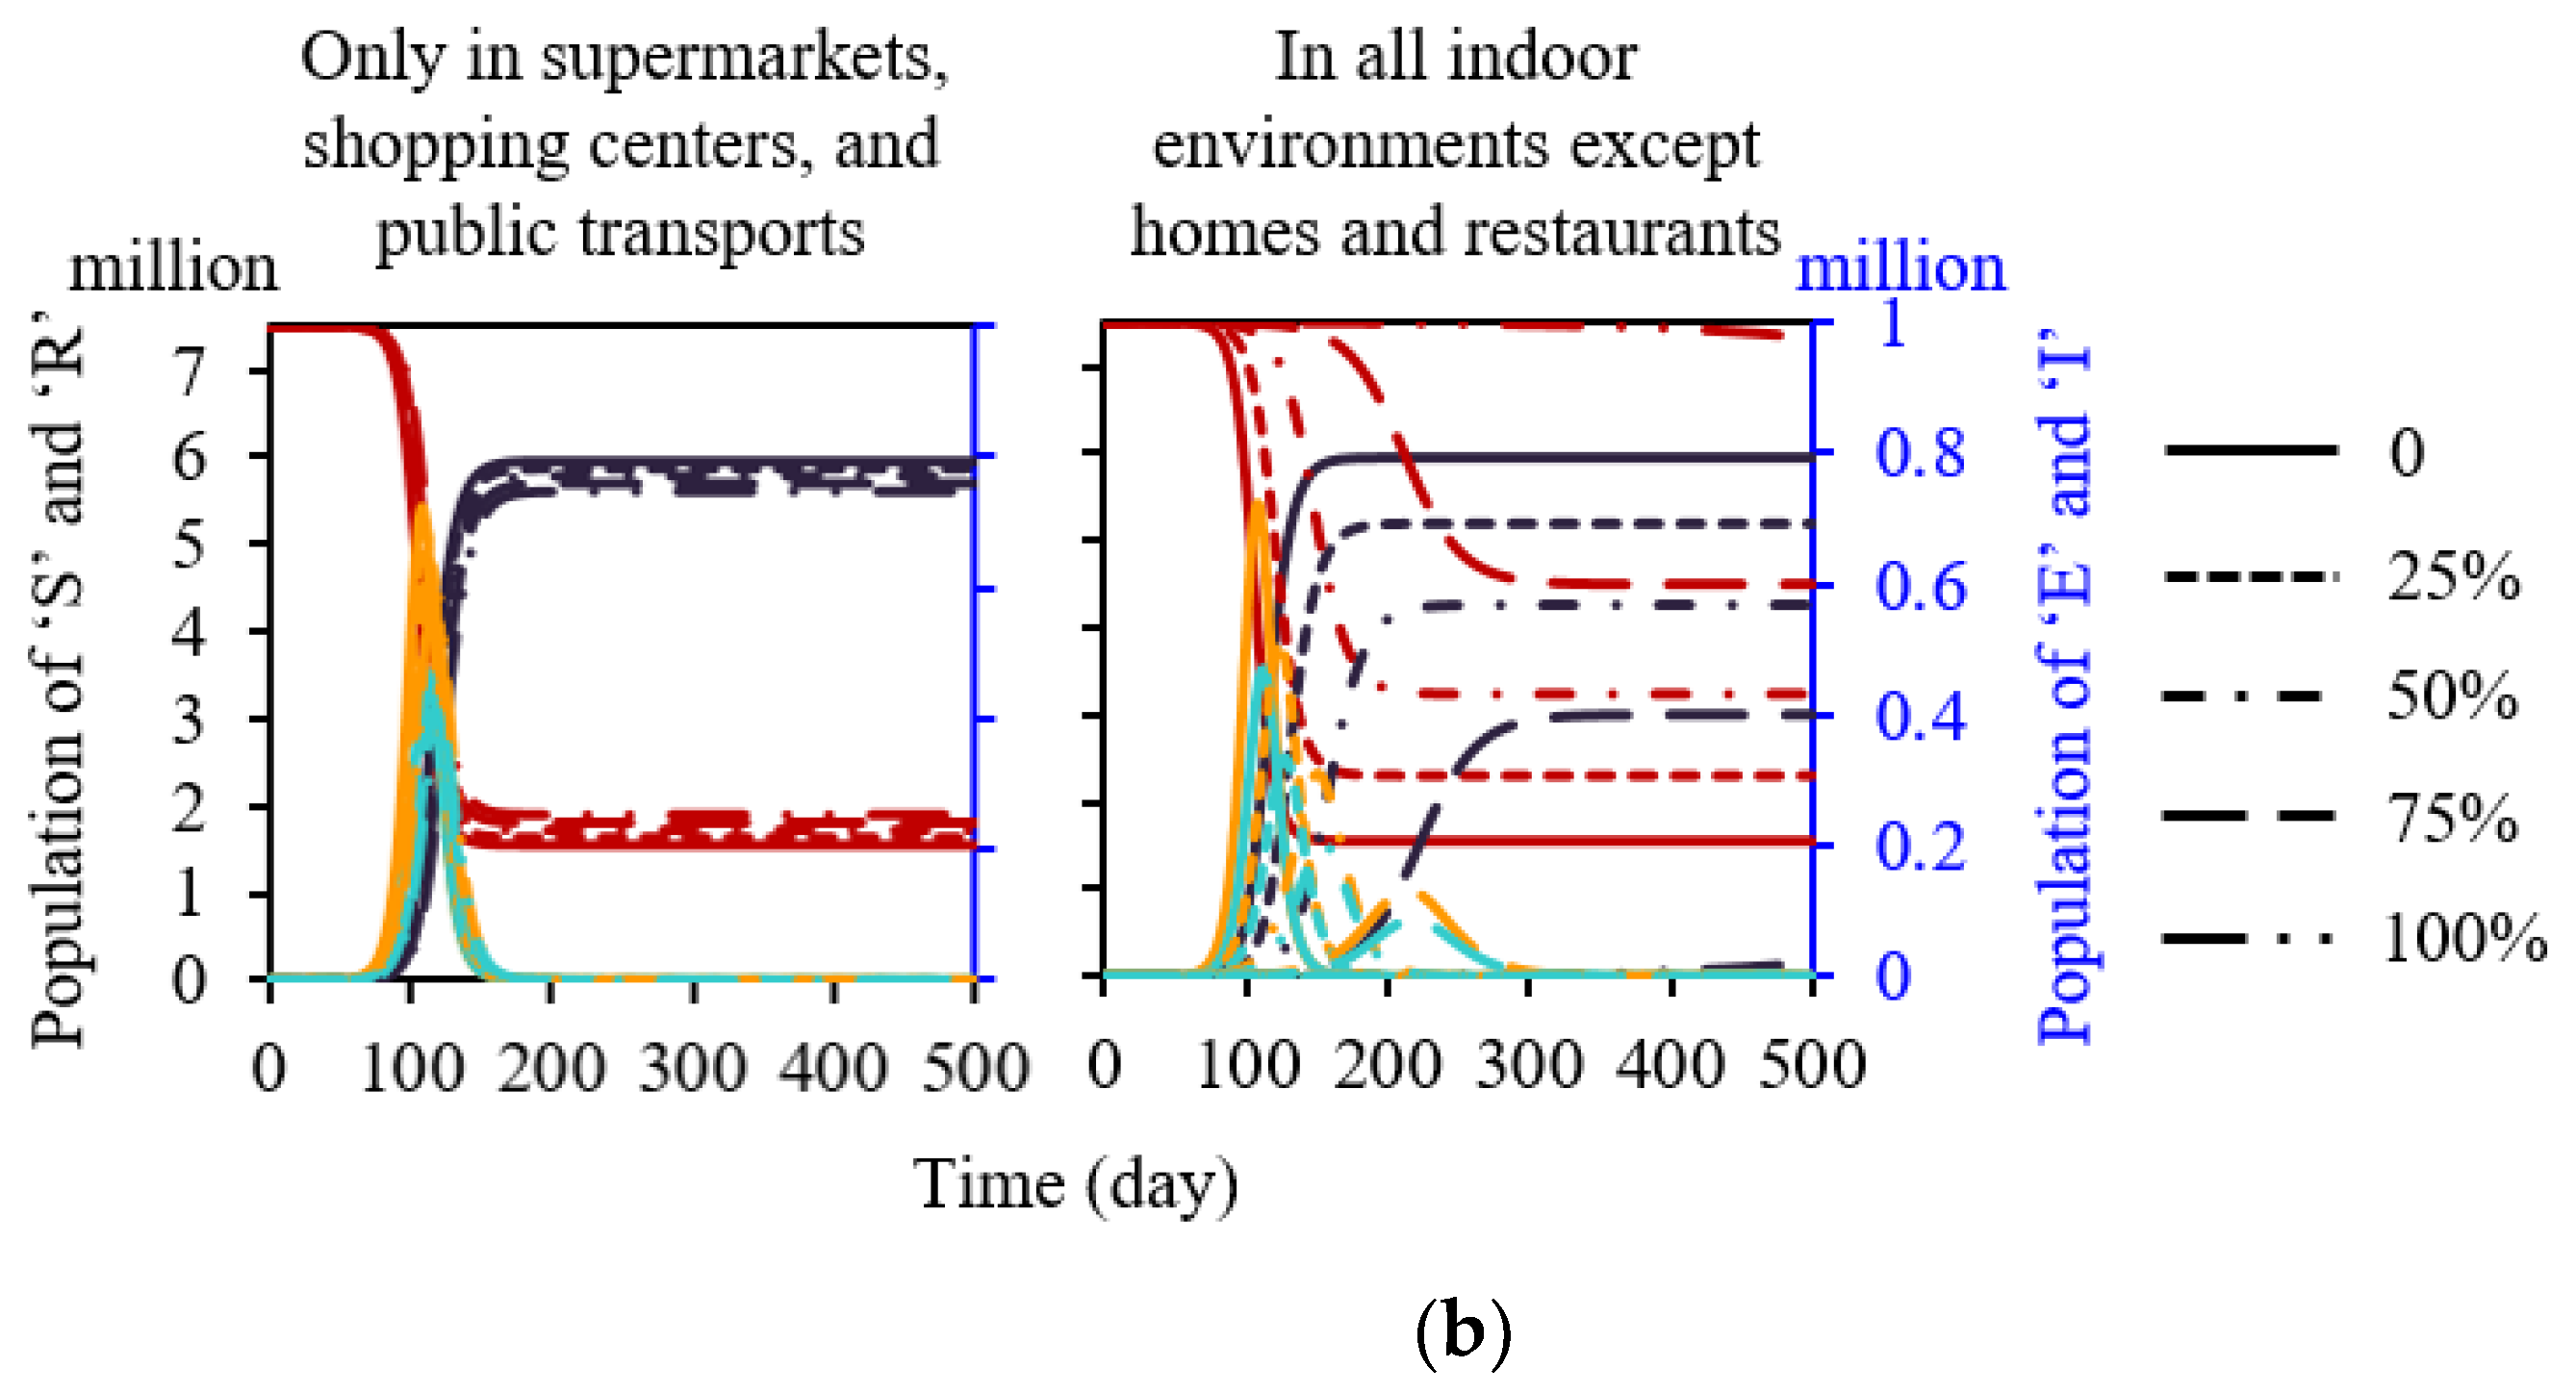
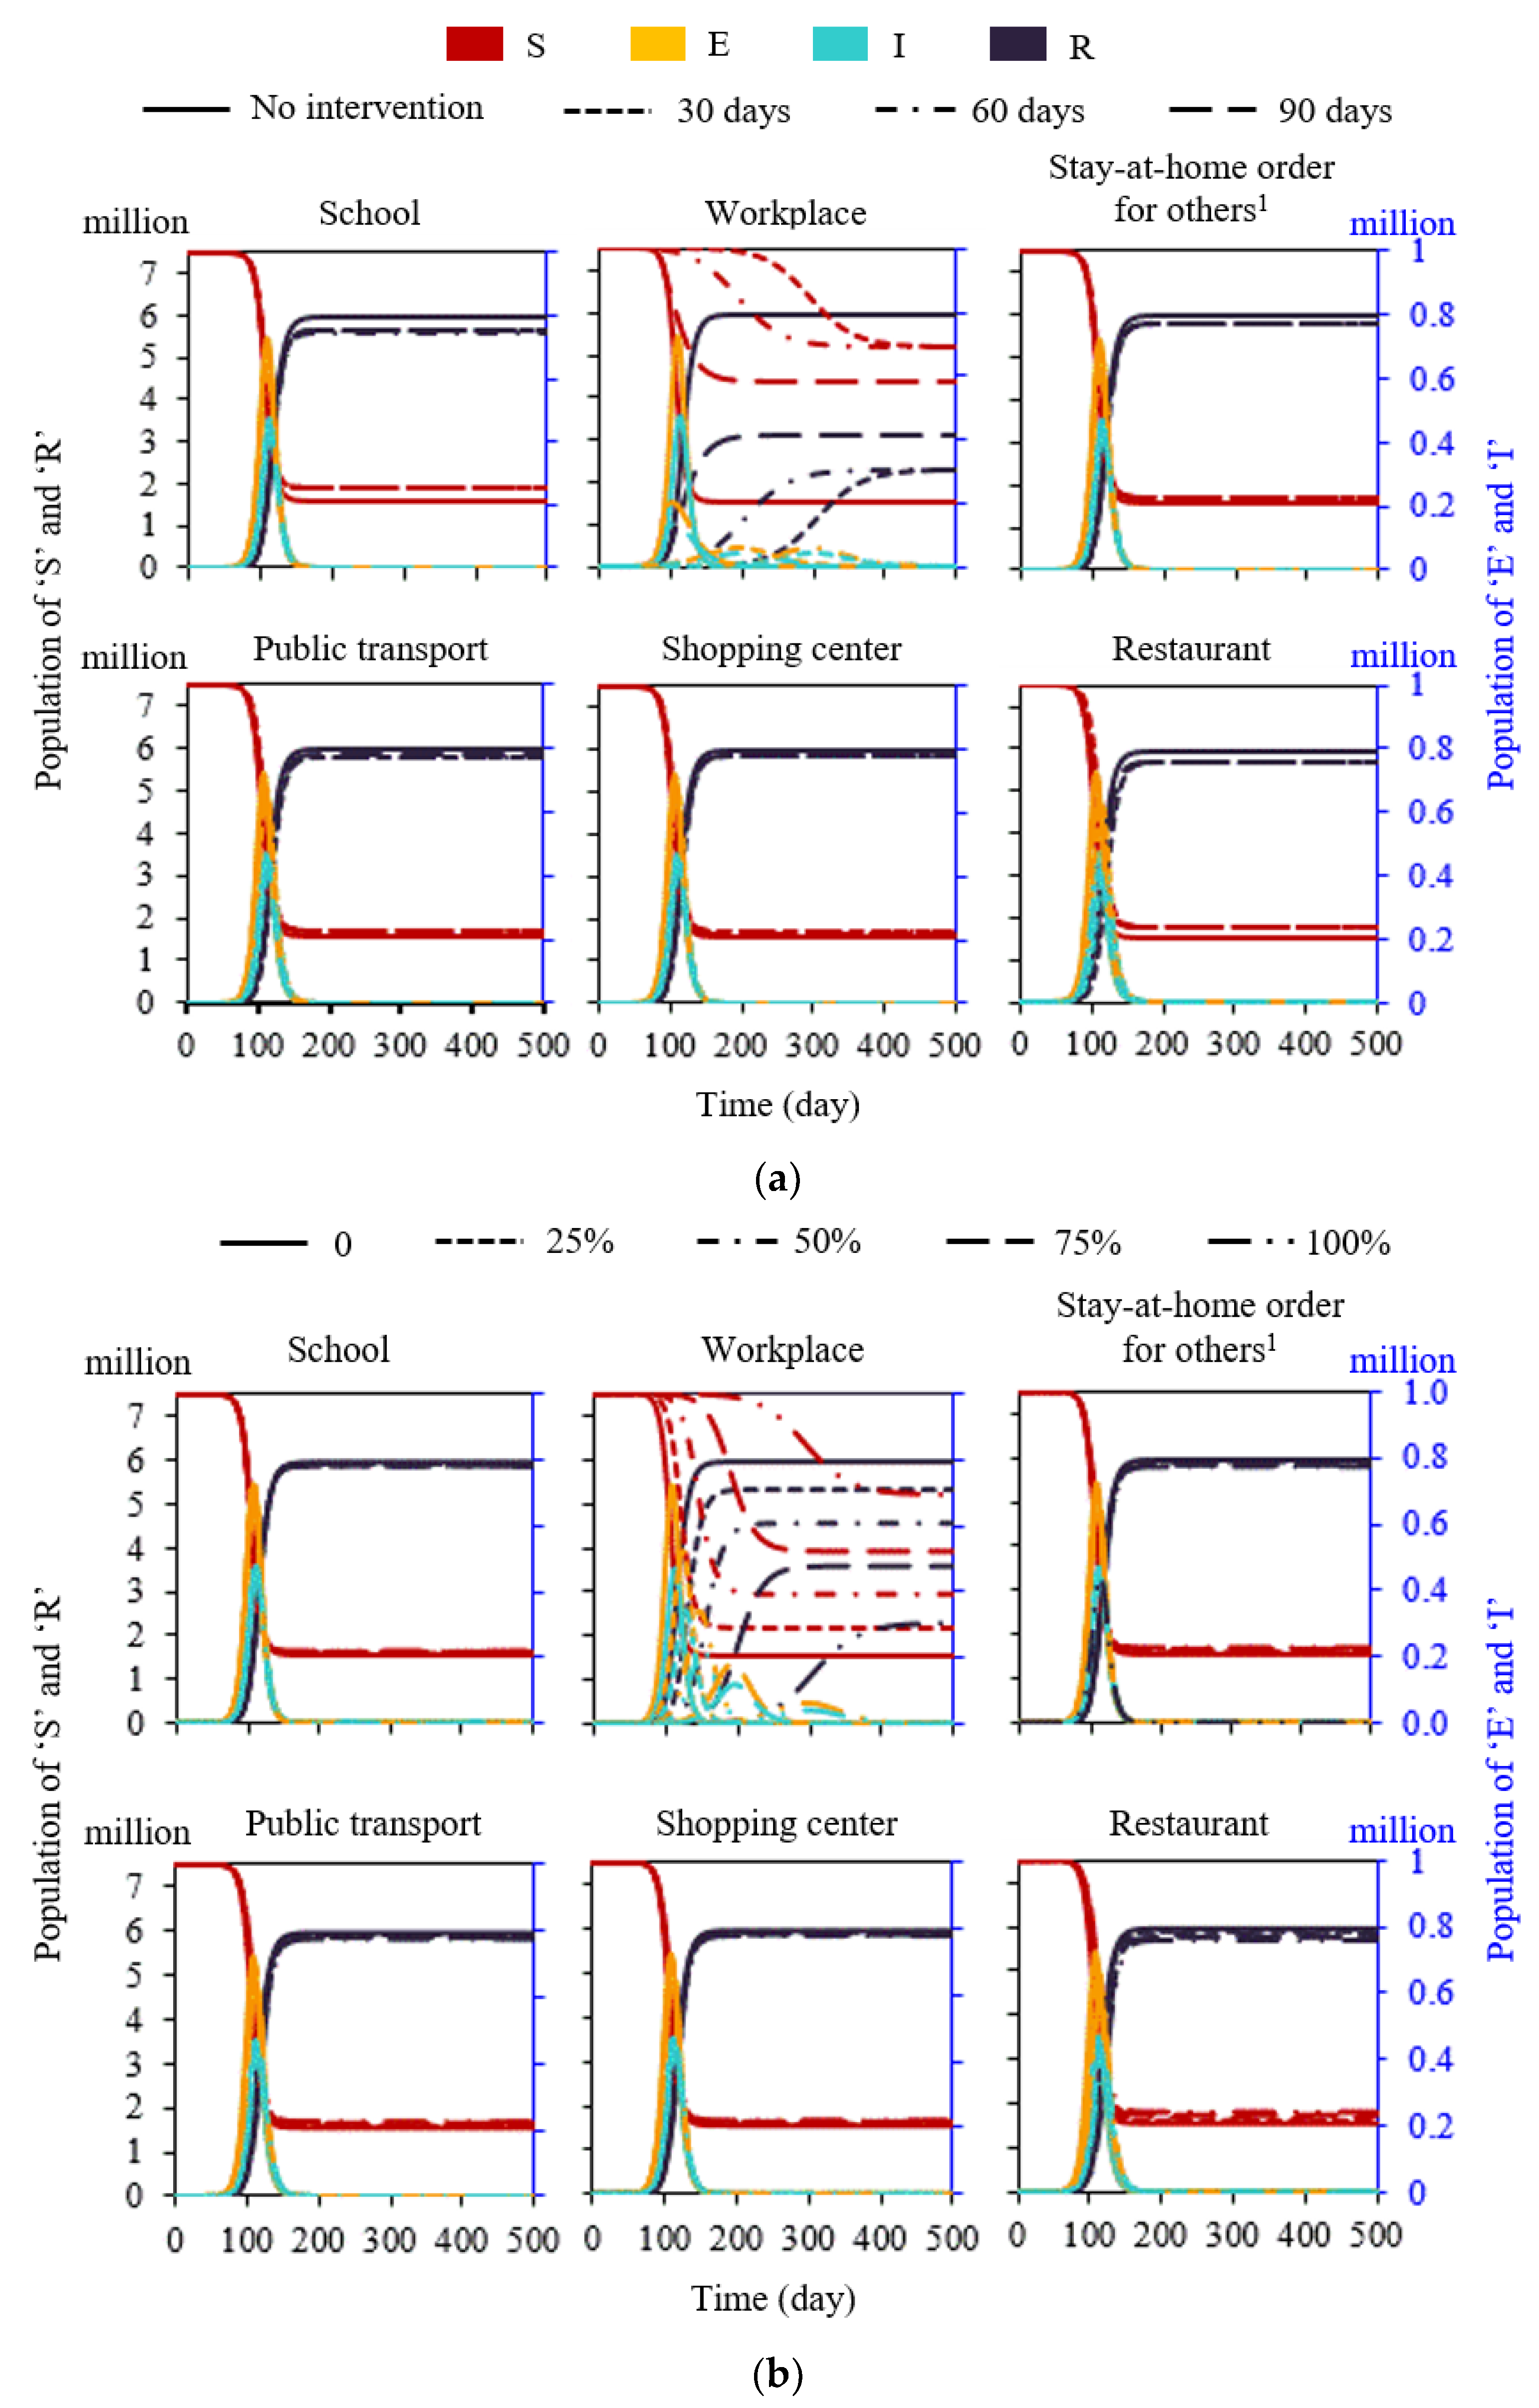
3.2. Built Environment Closure-Related Interventions
3.3. Mask-Wearing
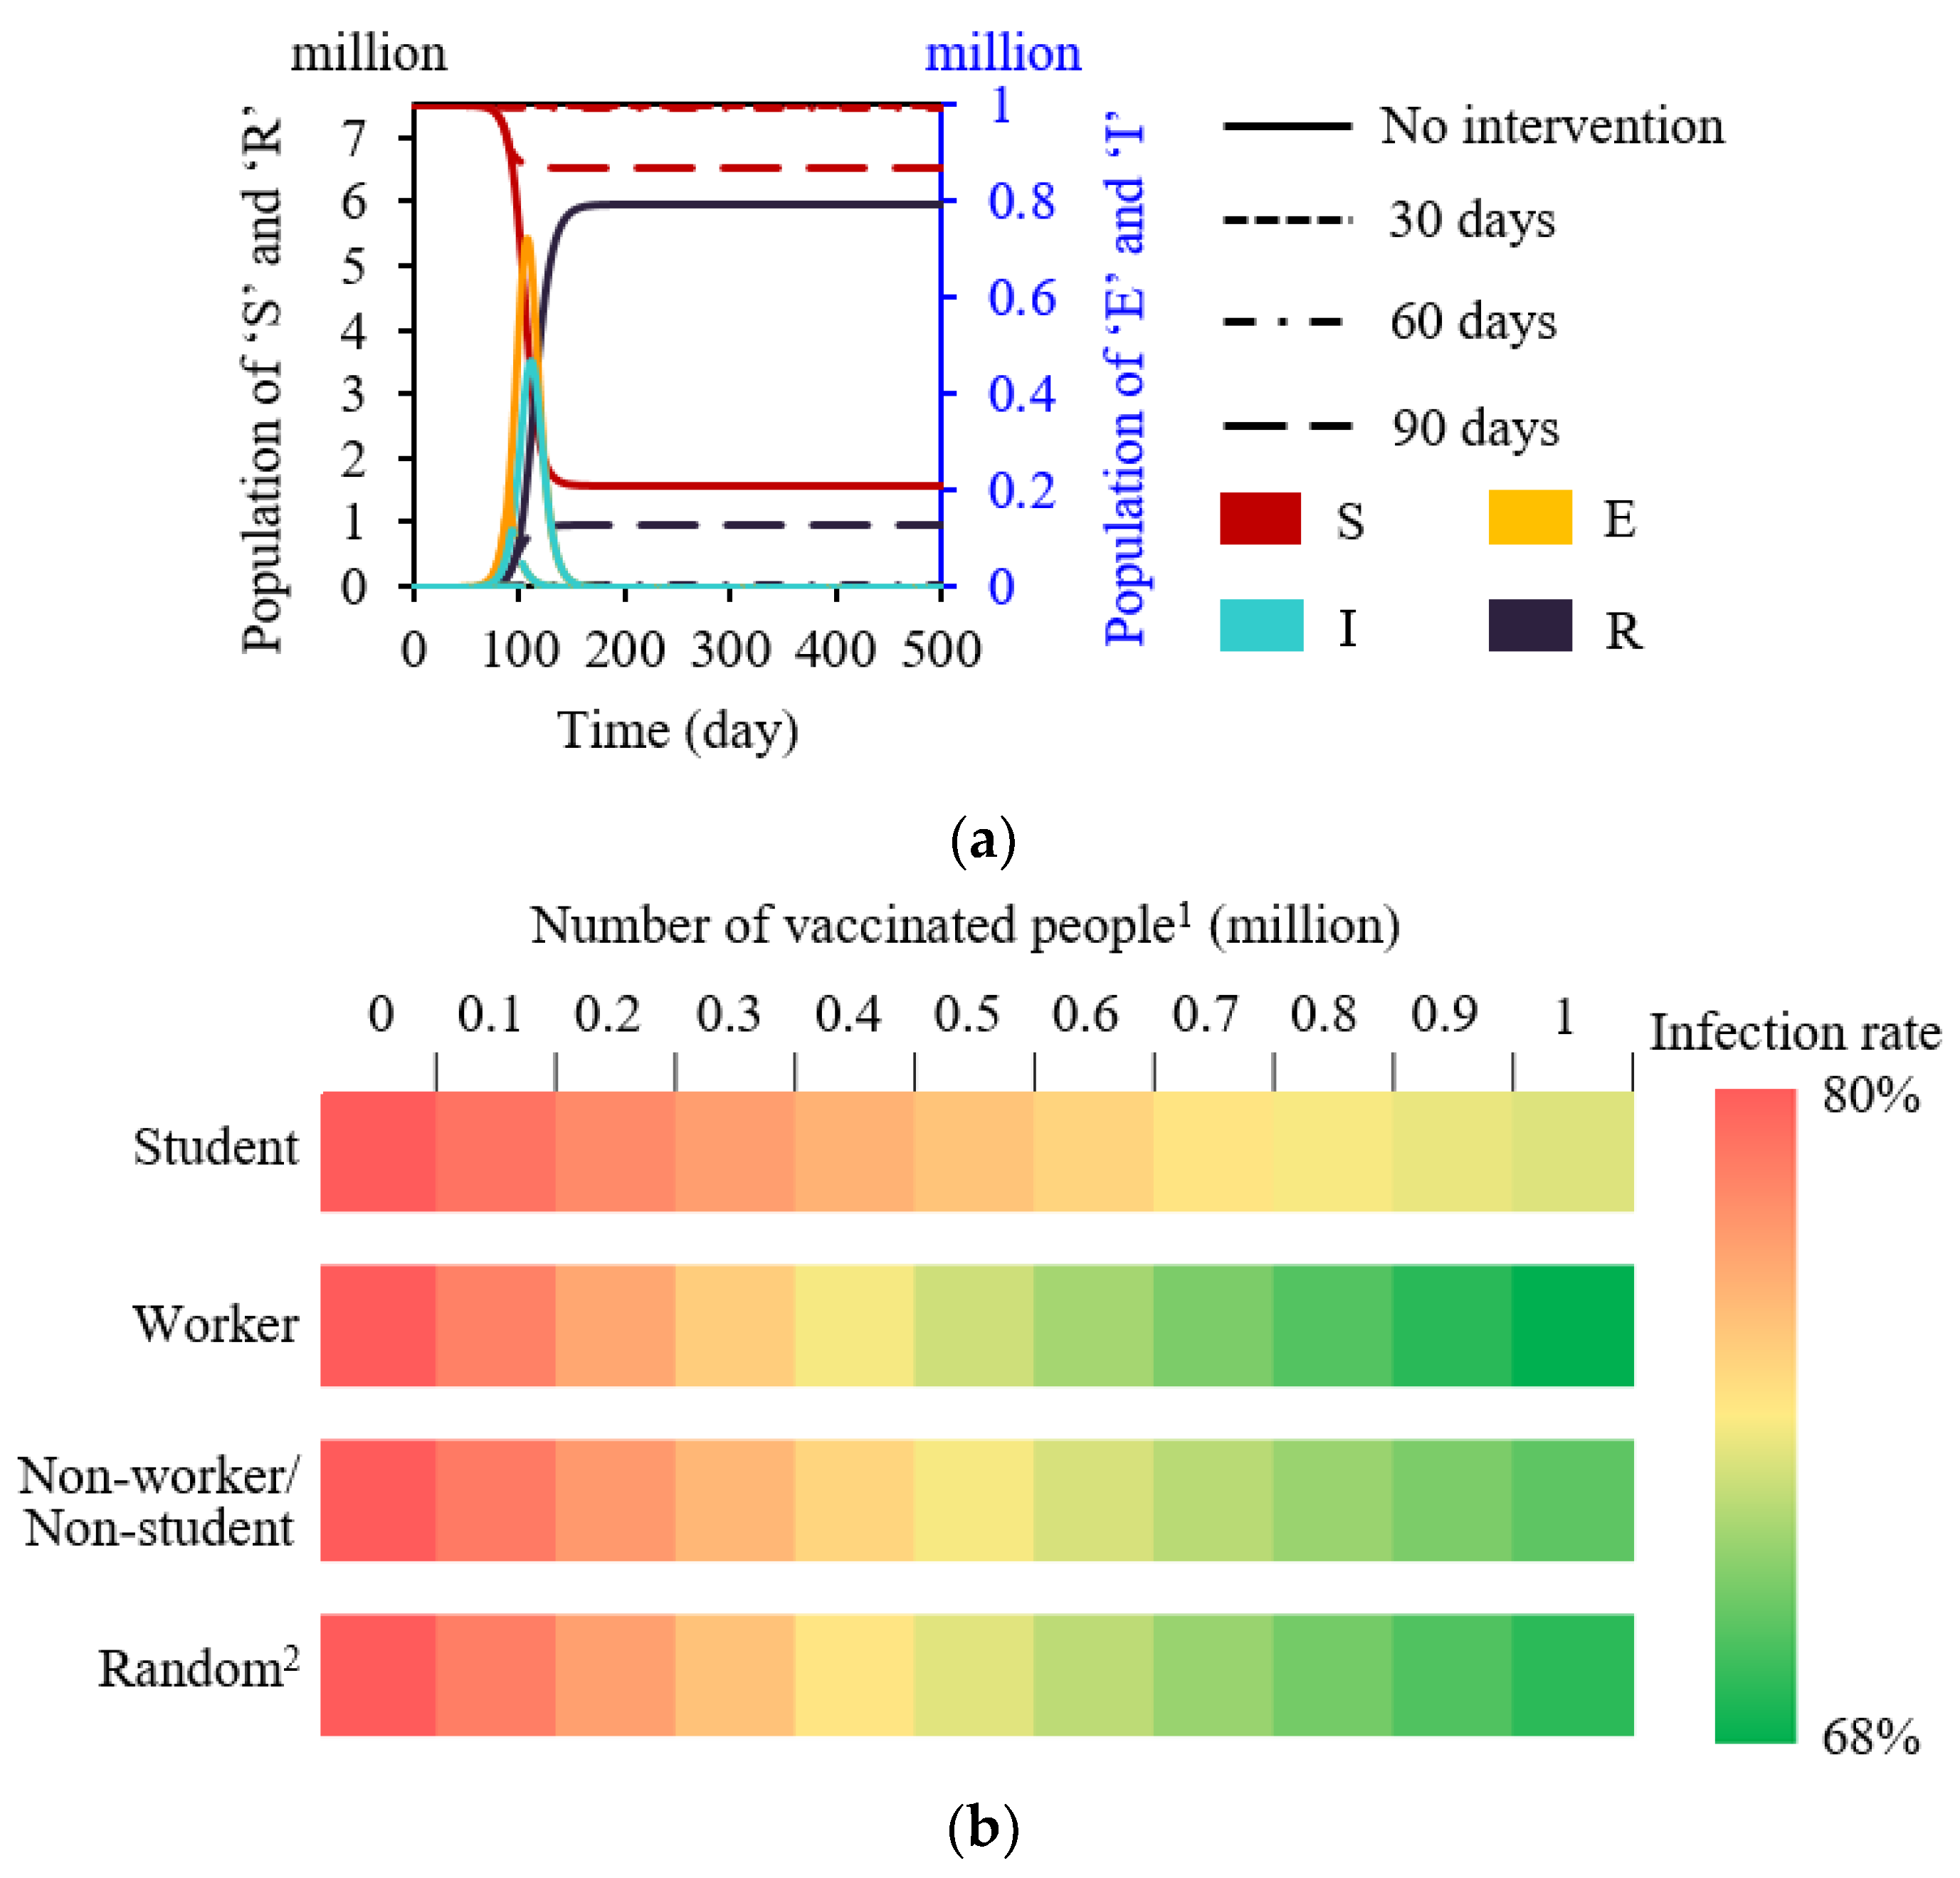
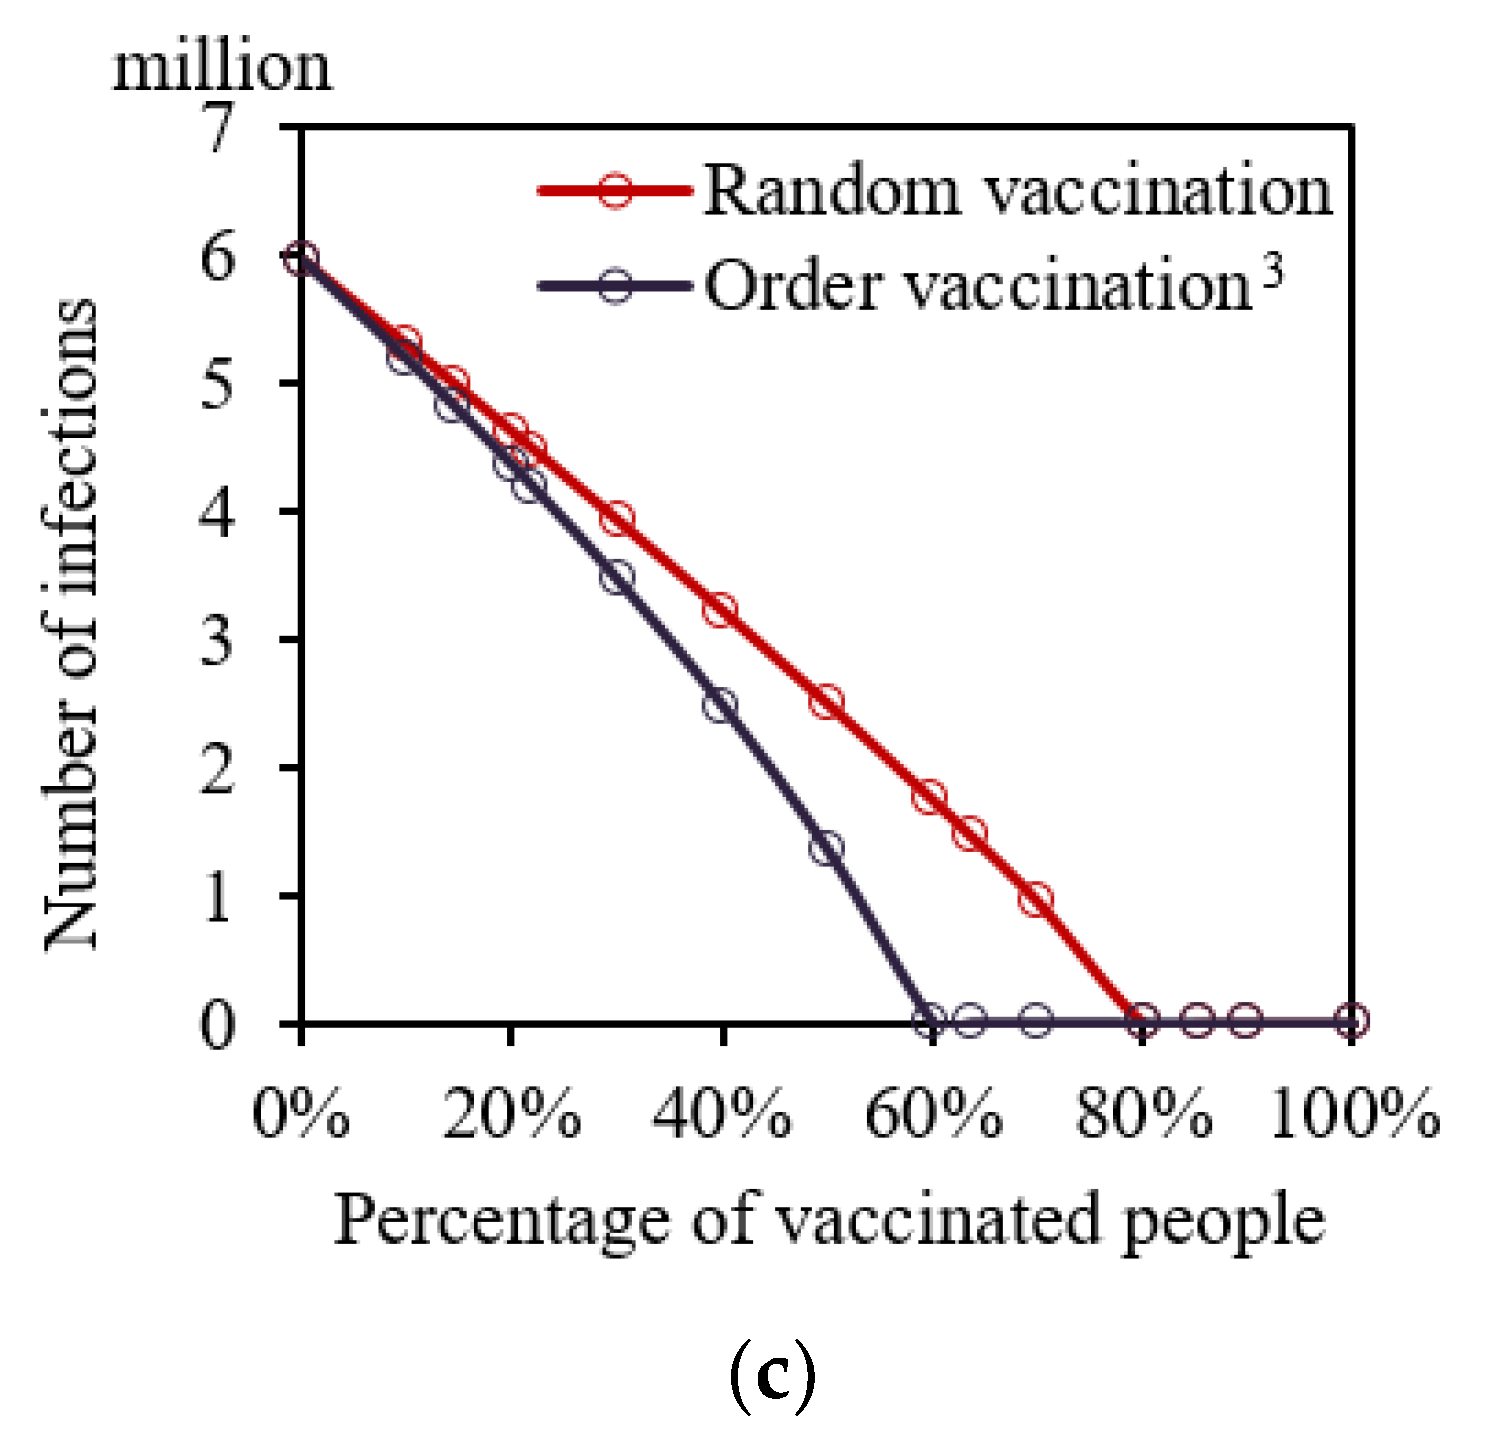
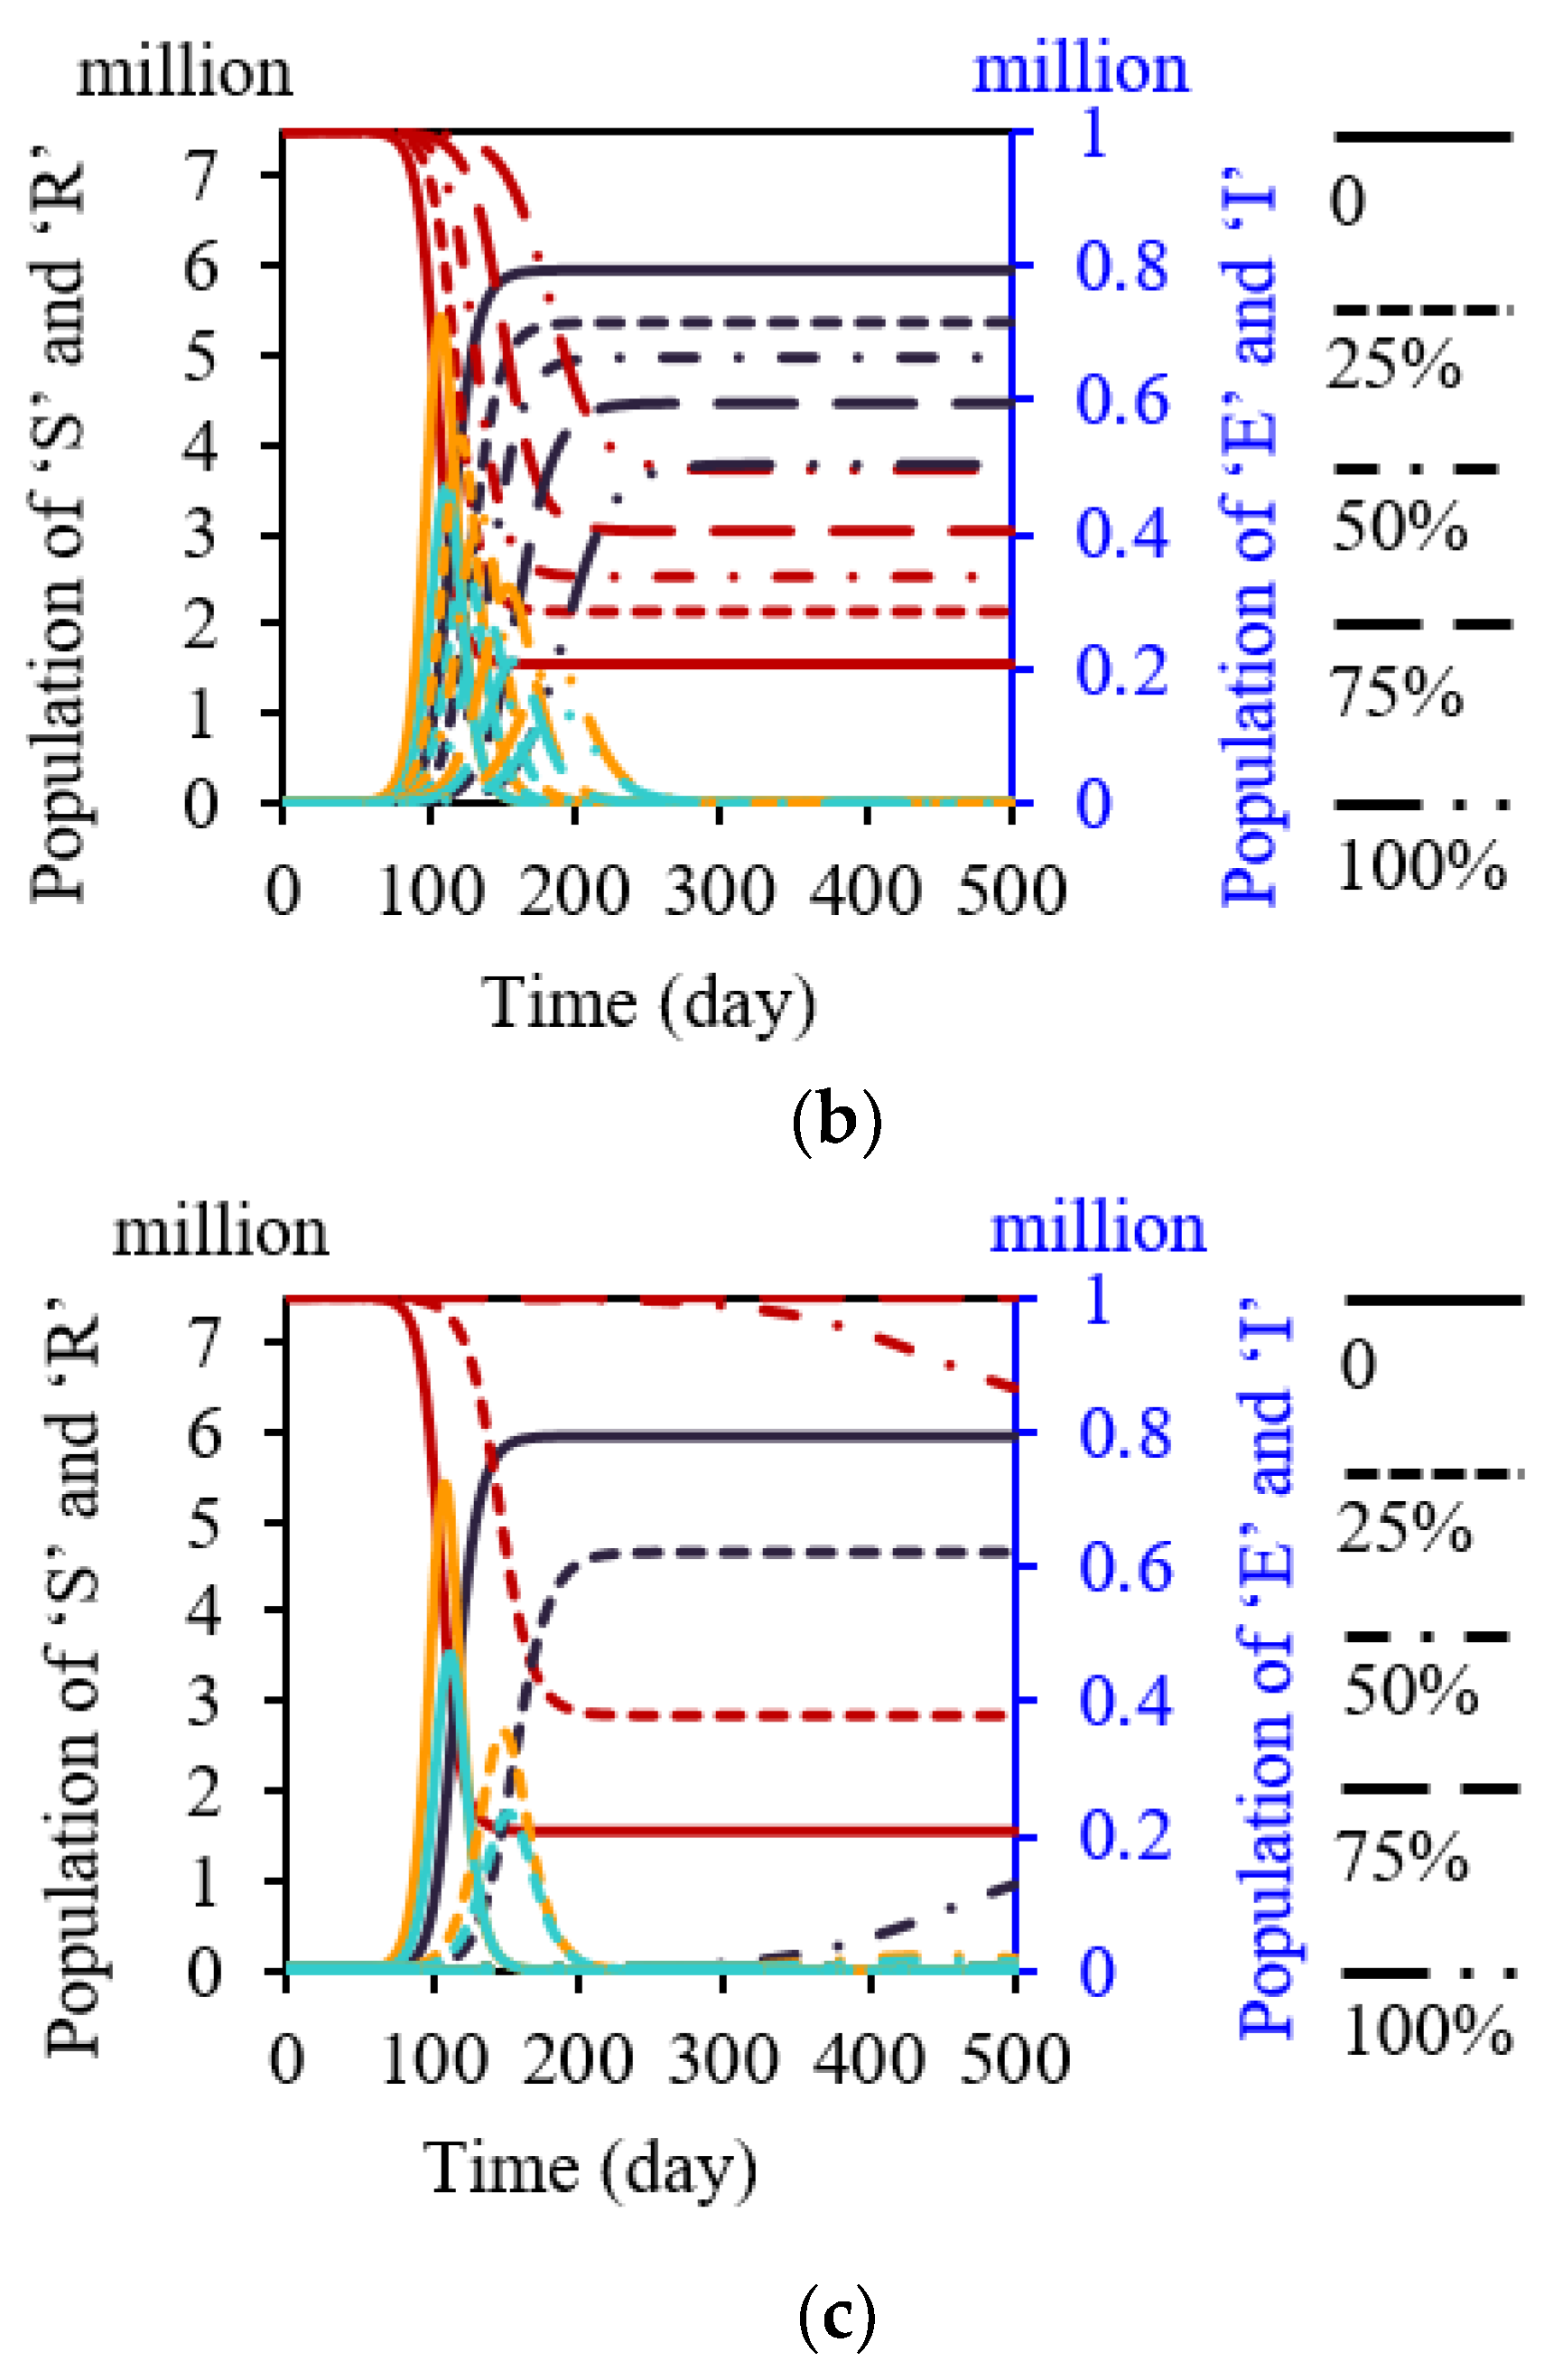
3.4. Vaccination
3.5. Other Single Interventions
3.6. Combined Interventions
4. Discussion
4.1. Built Environment Closure-Related Interventions
4.2. Other Single Interventions
4.3. Combined Interventions
5. Conclusions
- The infection risk (one-hour close contact with an infected person) of students, workers, and non-students/workers was 3.1%, 8.7%, and 13.6%, respectively.
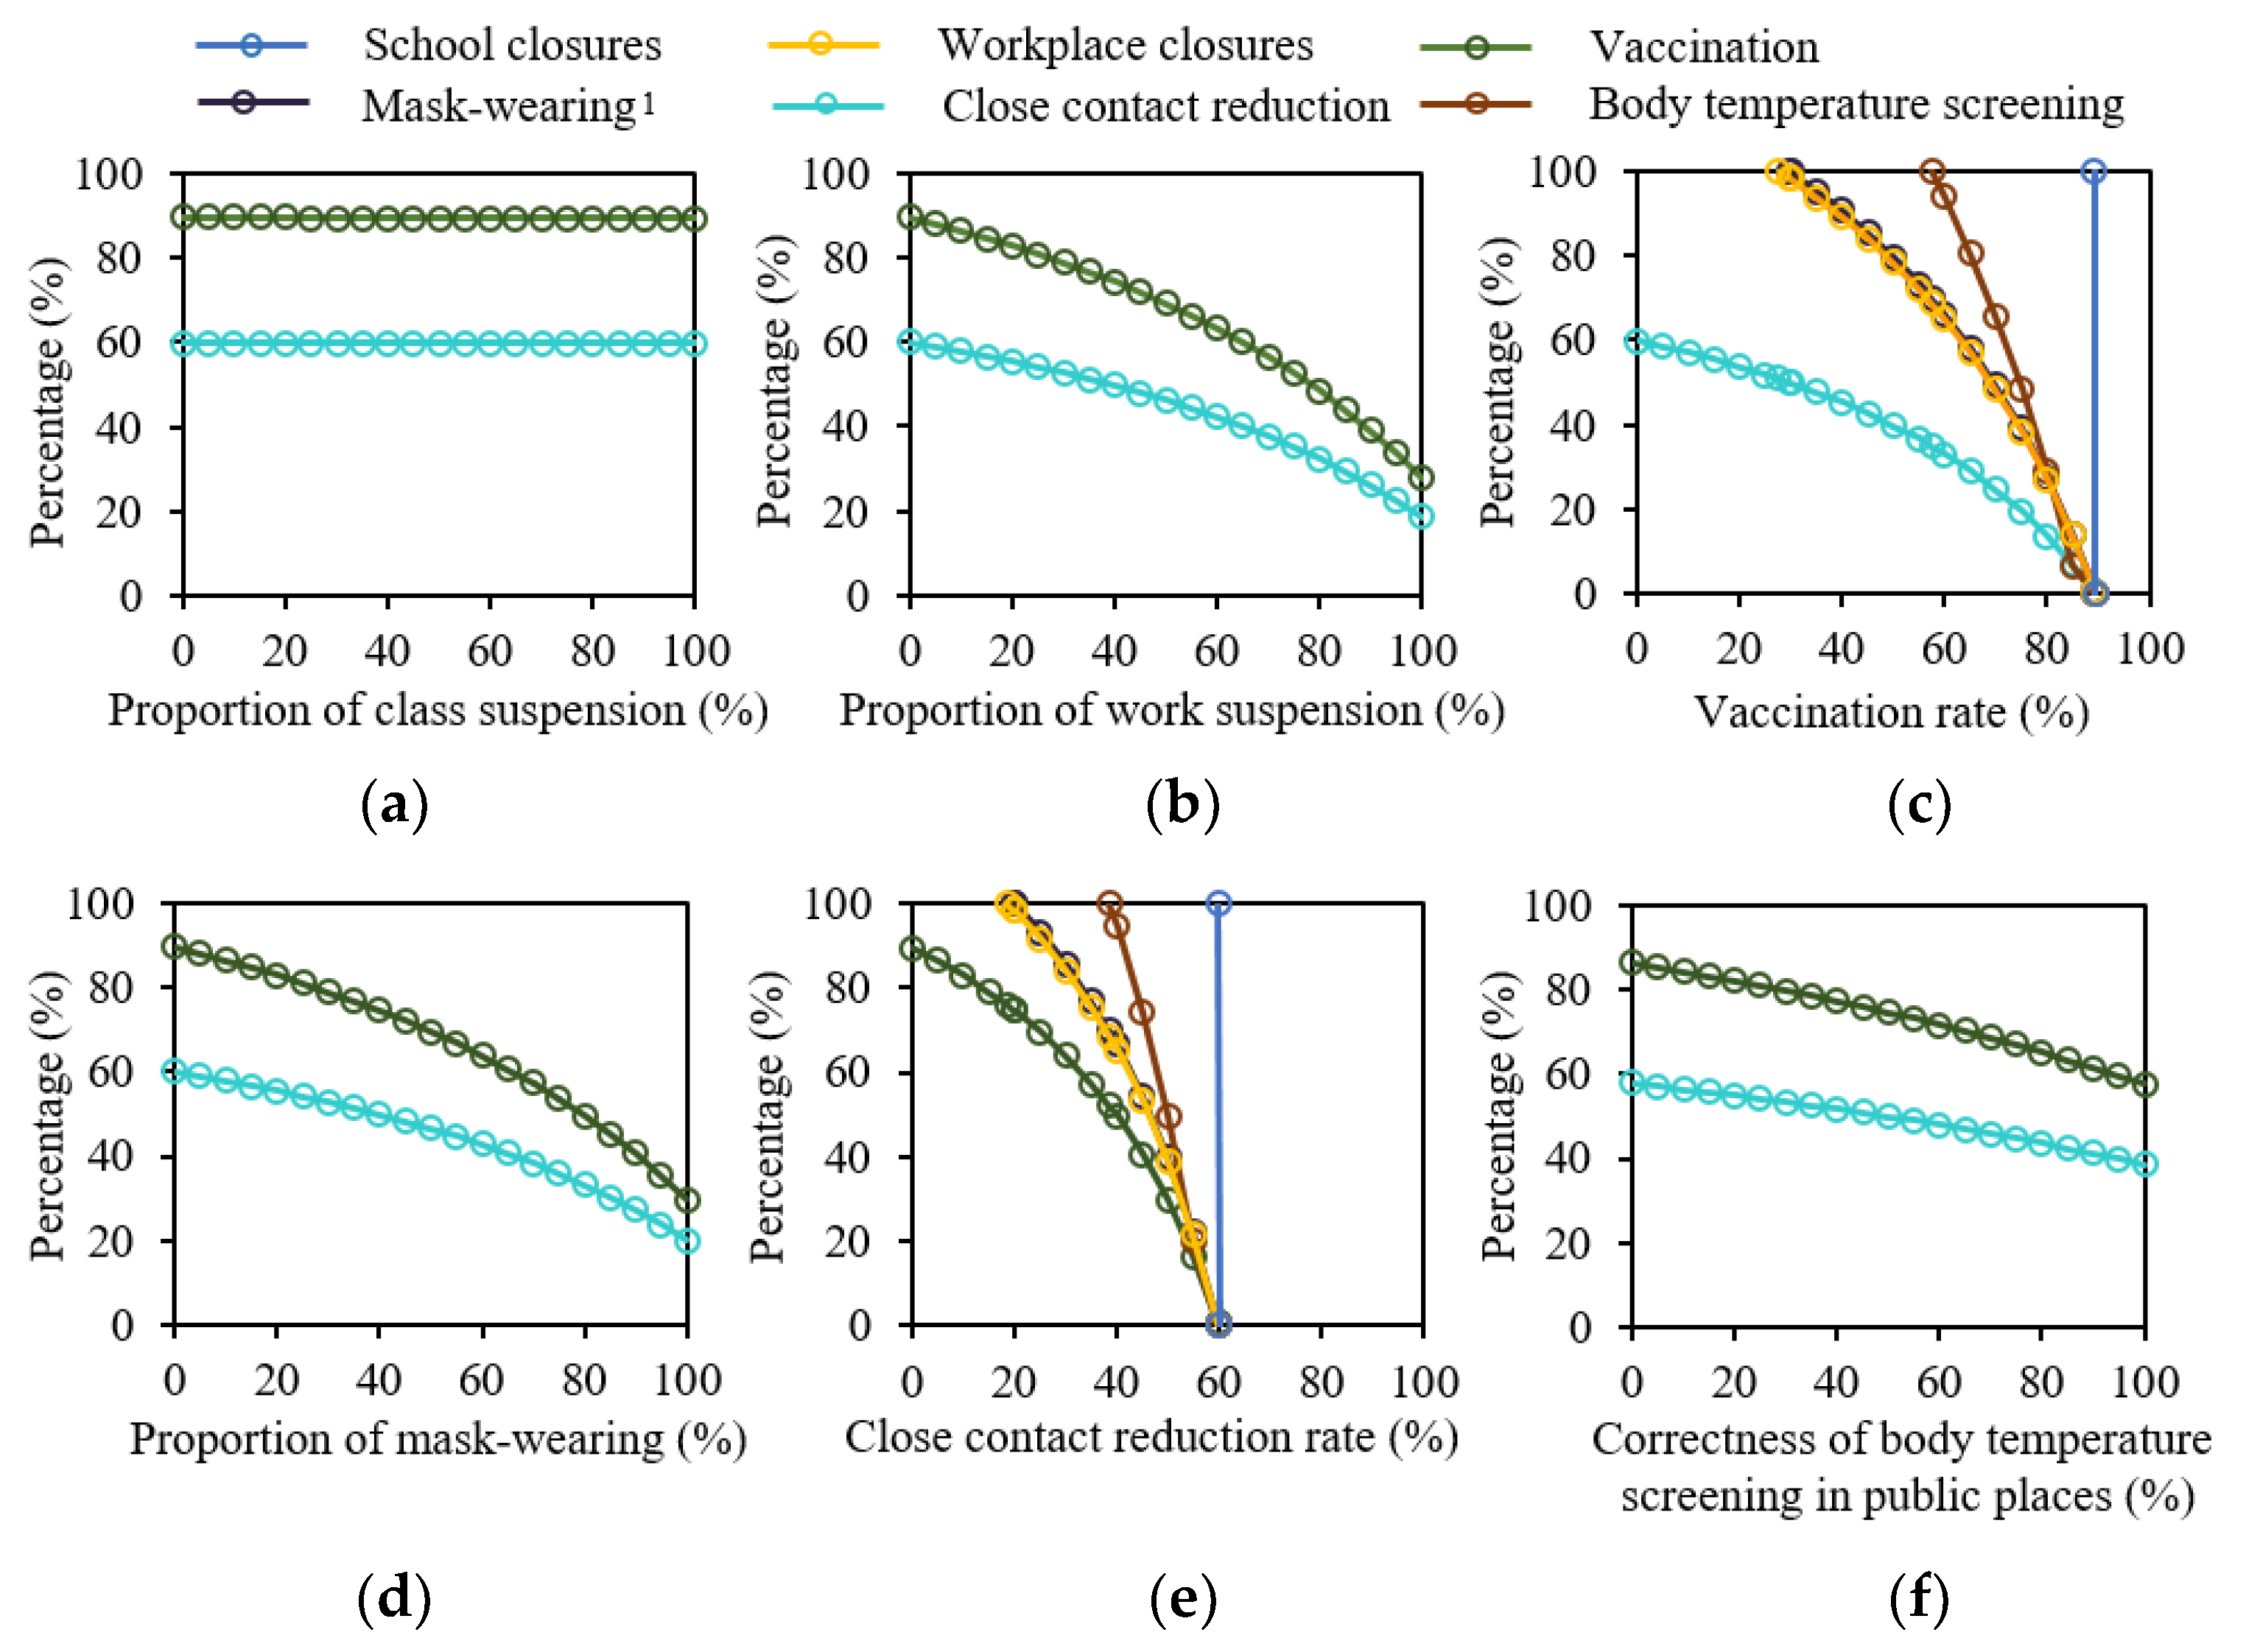
- Workplace closures were more effective for COVID-19 control among built environment closure-related interventions, on average reducing total infections by 56.8% compared with no intervention.
- Mask-wearing in workplaces and schools was much more effective than in shopping centers and public transport.
- Workers should be prioritized for vaccination, followed by non-workers/non-students and students.
- Close contact reduction was a better intervention, followed by vaccination, mask-wearing, workplace closures, body temperature screening in public places, school closures, restaurant closures, stay-at-home orders for non-workers/non-students, public transport closures, and shopping center closures.
- When the close contact reduction rate was 59.9% or the vaccination rate reached 89.5%, R0 was equal to 1, which was the critical point at which the COVID-19 pandemic would not break out.
Supplementary Materials
Author Contributions
Funding
Institutional Review Board Statement
Informed Consent Statement
Data Availability Statement
Conflicts of Interest
References
- Coronavirus (COVID-19) Dashboard: Situation by Region, Country Territory Area, World Health Organization. Available online: https://covid19.who.int/table/ (accessed on 29 January 2022).
- OECD. Global Outlook on Financing for Sustainable Development 2021; Organisation for Economic Co-operation and Development: Paris, France, 2020. [Google Scholar]
- Law, R.; Lai, J.; Edwards, D.J.; Hou, H.Y. COVID-19: Research Directions for Non-Clinical Aerosol-Generating Facilities in the Built Environment. Buildings 2021, 11, 282. [Google Scholar] [CrossRef]
- Wan, J.Y.; Wei, J.J.; Lin, Y.T.; Zhang, T.F. Numerical Investigation of Bioaerosol Transport in a Compact Lavatory. Buildings 2021, 11, 526. [Google Scholar] [CrossRef]
- Chen, W.; Zhang, N.; Wei, J.; Yen, H.; Li, Y. Short-range airborne route dominates exposure of respiratory infection during close contact. Build. Environ. 2020, 176, 106859. [Google Scholar] [CrossRef]
- Zhai, Z.Q.; Li, H.; Bahl, R.; Trace, K. Application of Portable Air Purifiers for Mitigating COVID-19 in Large Public Spaces. Buildings 2021, 11, 329. [Google Scholar] [CrossRef]
- Qian, H.; Miao, T.; Liu, L.; Zheng, X.; Luo, D.; Li, Y. Indoor transmission of SARS-CoV-2. Indoor Air 2021, 31, 639–645. [Google Scholar] [CrossRef]
- Yamey, G.; Walensky, R.P. COVID-19: Re-opening universities is high risk. BMJ 2020, 370, 3365. [Google Scholar] [CrossRef]
- Zhang, N.; Chen, X.; Jia, W.; Jin, T.; Xiao, S.; Chen, W.; Hang, J.; Ou, C.; Lei, H.; Qian, H.; et al. Evidence for lack of transmission by close contact and surface touch in a restaurant outbreak of COVID-19. J. Infect. 2021, 83, 207–216. [Google Scholar] [CrossRef]
- Wu, W.S.; Li, Y.G.; Wei, Z.F.; Zhou, P.H.; Lyu, L.K.; Zhang, G.P.; Zhao, Y.; He, H.Y.; Li, X.Y.; Gao, L.; et al. Investigation and analysis on characteristics of a cluster of COVID-19 associated with exposure in a department store in Tianjin. Chin. J. Epidemiol. 2020, 41, 489–493. [Google Scholar]
- Zhang, N.; Chan, P.-T.J.; Jia, W.; Dung, C.-H.; Zhao, P.; Lei, H.; Su, B.; Xue, P.; Zhang, W.; Xie, J.; et al. Analysis of efficacy of intervention strategies for COVID-19 transmission: A case study of Hong Kong. Environ. Int. 2021, 156, 106723. [Google Scholar] [CrossRef]
- Chen, Y.; Fang, C. Combined interventions to suppress R0 and border quarantine to contain COVID-19 in Taiwan. J. Formos. Med. Assoc. 2021, 120, 903–905. [Google Scholar] [CrossRef]
- Koo, J.R.; Cook, A.R.; Park, M.; Sun, Y.; Sun, H.; Lim, J.T.; Tam, C.; Dickens, B.L. Interventions to mitigate early spread of SARS-CoV-2 in Singapore: A modelling study. Lancet Infect. Dis. 2020, 20, 678–688. [Google Scholar] [CrossRef] [Green Version]
- Mendez-Brito, A.; El, B.C.; Pozo-Martin, F. Systematic review of empirical studies comparing the effectiveness of non-pharmaceutical interventions against COVID-19. J. Infect. 2021, 83, 281–293. [Google Scholar] [CrossRef] [PubMed]
- Pozo-Martin, F.; Weishaar, H.; Cristea, F.; Hanefeld, J.; Bahr, T.; Schaade, L.; El Bcheraoui, C. The impact of non-pharmaceutical interventions on COVID-19 epidemic growth in the 37 OECD member states. Eur. J. Epidemiol. 2021, 36, 629–640. [Google Scholar]
- Quilty, B.J.; Clifford, S.; Flasche, S.; Eggo, R.M.; Cmmid, N.W.G.; Cmmid, N.W.G. Effectiveness of airport screening at detecting travellers infected with novel coronavirus (2019-nCoV). Eurosurveillance 2020, 25, 1. [Google Scholar] [CrossRef] [PubMed]
- Olanrewaju, A.; Abdulaziz, A.; Preece, C.N.; Shobowale, K. Evaluation of measures to prevent the spread of COVID-19 on the construction sites. Clean. Eng. Technol. 2021, 5, 100277. [Google Scholar] [CrossRef]
- China Encourages Voluntary COVID-19 Vaccination: Official. Available online: http://en.people.cn/n3/2021/0410/c90000-9837712.html (accessed on 29 January 2022).
- Iran Allocates Funds to Import COVID-19 Vaccines; Kuwait Starts National Vaccination Campaign. Available online: http://en.people.cn/n3/2020/1225/c90000-9802937.html (accessed on 29 January 2022).
- How COVID-19 Has Impacted Global Construction Markets—RLB|Asia. 2022. Available online: https://www.rlb.com/asia/insight/how-covid-19-has-impacted-global-construction-markets/ (accessed on 29 January 2022).
- Ihme, C.F.T. Modeling COVID-19 scenarios for the United States. Nat. Med. 2021, 27, 94–105. [Google Scholar]
- Aleta, A.; Martín-Corral, D.; Piontti, A.P.; Ajelli, M.; Litvinova, M.; Chinazzi, M.; Dean, N.E.; Halloran, M.E.; Longini, I.M., Jr.; Merler, S.; et al. Modelling the impact of testing, contact tracing and household quarantine on second waves of COVID-19. Nat. Hum. Behav. 2020, 4, 964–971. [Google Scholar] [CrossRef]
- Yang, Z.; Zeng, Z.; Wang, K.; Wong, S.-S.; Liang, W.; Zanin, M.; Liu, P.; Cao, X.; Gao, Z.; Mai, Z.; et al. Modified SEIR and AI prediction of the epidemics trend of COVID-19 in China under public health interventions. J. Thorac. Dis. 2020, 12, 165–174. [Google Scholar] [CrossRef]
- Zhang, J.; Litvinova, M.; Liang, Y.; Wang, Y.; Wang, W.; Zhao, S.; Wu, Q.; Merler, S.; Viboud, C.; Vespignani, A.; et al. Changes in contact patterns shape the dynamics of the COVID-19 outbreak in China. Science 2020, 368, 1481–1486. [Google Scholar] [CrossRef]
- Jing, Q.-L.; Liu, M.-J.; Zhang, Z.-B.; Fang, L.-Q.; Yuan, J.; Zhang, A.-R.; E Dean, N.; Luo, L.; Ma, M.-M.; Longini, I.; et al. Household secondary attack rate of COVID-19 and associated determinants in Guangzhou, China: A retrospective cohort study. Lancet Infect. Dis. 2020, 20, 1141–1150. [Google Scholar] [CrossRef]
- GOV.HK. COVID-19 Thematic Website—Together, We Fight the Virus—Home. Available online: https://www.coronavirus.gov.hk/eng/index.html#Updates_on_COVID-19_Situation (accessed on 29 January 2022).
- Zhang, N.; Jia, W.; Lei, H.; Wang, P.; Zhao, P.; Guo, Y.; Dung, C.-H.; Bu, Z.; Xue, P.; Xie, J.; et al. Effects of human behaviour changes during the COVID-19 pandemic on influenza spread in Hong Kong. Clin. Infect. Dis. 2021, 73, 1142–1150. [Google Scholar] [CrossRef] [PubMed]
- Snapshot of Hong Kong. Available online: https://www.censtatd.gov.hk/en/scode460.html (accessed on 29 January 2022).
- Nishiura, H.; Kobayashi, T.; Miyama, T.; Suzuki, A.; Jung, S.-M.; Hayashi, K.; Kinoshita, R.; Yang, Y.; Yuan, B.; Akhmetzhanov, A.R.; et al. Estimation of the asymptomatic ratio of novel coronavirus infections (COVID-19). Int. J. Infect. Dis. 2020, 94, 154–155. [Google Scholar] [CrossRef] [PubMed]
- Backer, J.A.; Klinkenberg, D.; Wallinga, J. Incubation period of 2019 novel coronavirus (2019-nCoV) infections among travellers from Wuhan, China, 20–28 January 2020. Eurosurveillance 2020, 25, 2000062. [Google Scholar] [CrossRef] [Green Version]
- Verity, R.; Okell, L.C.; Dorigatti, I.; Winskill, P.; Whittaker, C.; Imai, N.; Cuomo-Dannenburg, G.; Thompson, H.; Walker, P.G.T.; Fu, H.; et al. Estimates of the severity of coronavirus disease 2019: A model-based analysis. Lancet Infect. Dis. 2020, 20, 669–677. [Google Scholar] [CrossRef]
- Milton, D.K.; Fabian, M.P.; Cowling, B.J.; Grantham, M.L.; Mcdevitt, J.J. Influenza virus aerosols in human exhaled breath: Particle size, culturability, and effect of surgical masks. PLoS Pathog. 2013, 9, e1003205. [Google Scholar] [CrossRef] [PubMed] [Green Version]
- Why Is There a Big Difference in Phase Three of Sinovac Vaccine? Available online: https://baijiahao.baidu.com/s?id=1693342268153415934&wfr=spider&for=pc (accessed on 29 January 2022).
- Buckner, F.S.; McCulloch, D.J.; Atluri, V.; Blain, M.; A McGuffin, S.; Nalla, A.K.; Huang, M.-L.; Greninger, A.L.; Jerome, K.R.; A Cohen, S.; et al. Clinical Features and Outcomes of 105 Hospitalized Patients With COVID-19 in Seattle, Washington. Clin. Infect. Dis. 2020, 71, 2167–2173. [Google Scholar] [CrossRef] [PubMed]
- Butler-Laporte, G.; Lawandi, A.; Schiller, I.; Yao, M.; Dendukuri, N.; McDonald, E.G.; Lee, T.C. Comparison of Saliva and Nasopharyngeal Swab Nucleic Acid Amplification Testing for Detection of SARS-CoV-2. JAMA Intern. Med. 2021, 181, 353. [Google Scholar] [CrossRef] [PubMed]
- GOV.HK. About the Vaccines. Available online: https://www.covidvaccine.gov.hk/en/vaccine (accessed on 29 January 2022).
- Dreher, N.; Spiera, Z.; Mcauley, F.M.; Kuohn, L.; Durbin, J.R.; Marayati, N.F.; Ali, M.; Li, A.Y.; Hannah, T.C.; Gometz, A.; et al. Policy Interventions, Social Distancing, and SARS-CoV-2 Transmission in the United States: A Retrospective State-level Analysis. Am. J. Med. Sci. 2021, 361, 575–584. [Google Scholar] [CrossRef] [PubMed]
- Wibbens, P.D.; Koo, W.W.; Mcgahan, A.M. Which COVID policies are most effective? A Bayesian analysis of COVID-19 by jurisdiction. PLoS ONE 2020, 15, e244177. [Google Scholar] [CrossRef]
- Population Estimates. Available online: https://www.censtatd.gov.hk/en/scode150.html (accessed on 29 January 2022).
- Fong, M.W.; Gao, H.; Wong, J.Y.; Xiao, J.; Shiu, E.Y.; Ryu, S.; Cowling, B.J. Nonpharmaceutical Measures for Pandemic Influenza in Nonhealthcare Settings—Social Distancing Measures. Emerg. Infect. Dis. 2020, 26, 976. [Google Scholar] [CrossRef]
- Rebmann, T.; Elliott, M.; Swick, Z.; Reddick, D. US School Morbidity and Mortality, Mandatory Vaccination, Institution Closure, and Interventions Implemented During the 2009 Influenza A H1N1 Pandemic. Biosecur. Bioterror. 2013, 11, 41–48. [Google Scholar] [CrossRef] [PubMed]
- Prem, K.; Liu, Y.; Russell, T.W.; Kucharski, A.J.; Eggo, R.M.; Davies, N.; Centre, F.T.M.M.; Jit, M.; Klepac, P. The effect of control strategies to reduce social mixing on outcomes of the COVID-19 epidemic in Wuhan, China: A modelling study. Lancet Public Health 2020, 5, e261–e270. [Google Scholar] [CrossRef] [Green Version]
- Huang, C.; Liu, X.; Sun, S.; Li, S.C.; Deng, M.; He, G.; Zhang, H.; Wang, C.; Zhou, Y.; Zhao, Y.; et al. Insights into the transmission of respiratory infectious diseases through empirical human contact networks. Sci. Rep. 2016, 6, 31484. [Google Scholar] [CrossRef] [PubMed]
- Lei, H.; Xu, X.; Xiao, S.; Wu, X.; Shu, Y. Household transmission of COVID-19-a systematic review and meta-analysis. J. Infect. 2020, 81, 979–997. [Google Scholar] [CrossRef]
- Zhang, H.; Su, Y.; Xu, S.; Chen, G.; Li, C.; Jiang, R.; Liu, R.; Ge, S.; Zhang, J.; Xia, N.; et al. Asymptomatic and Symptomatic Severe Acute Respiratory Syndrome Coronavirus 2 (SARS-CoV-2) Infections in Close Contacts of Coronavirus Disease 2019 (COVID-19) Patients: A Seroepidemiological Study. Clin. Infect. Dis. 2021, 73, 553–554. [Google Scholar] [CrossRef]
- Hou, Y.J.; Okuda, K.; Edwards, C.E.; Martinez, D.R.; Asakura, T.; Dinnon, K.H.; Kato, T.; Lee, R.E.; Yount, B.L.; Mascenik, T.M.; et al. SARS-CoV-2 Reverse Genetics Reveals a Variable Infection Gradient in the Respiratory Tract. Cell 2020, 182, 429–446. [Google Scholar] [CrossRef]
- Advice on the Use of Masks in the Context of COVID-19 | United Nations in Ethiopia, United Nations. Available online: https://ethiopia.un.org/en/48687-advice-use-masks-context-covid-19 (accessed on 29 January 2022).
- Zhang, R.; Li, Y.; Zhang, A.L.; Wang, Y.; Molina, M.J. Identifying airborne transmission as the dominant route for the spread of COVID-19. Proc. Natl. Acad. Sci. USA 2020, 117, 14857. [Google Scholar] [CrossRef]
- Russell, F.M.; Greenwood, B. Who should be prioritised for COVID-19 vaccination? Hum. Vaccines Immunother. 2021, 17, 1317–1321. [Google Scholar] [CrossRef]
- Yang, J.; Zheng, W.; Shi, H.; Yan, X.; Dong, K.; You, Q.; Zhong, G.; Gong, H.; Chen, Z.; Jit, M.; et al. Who should be prioritized for COVID-19 vaccination in China? A descriptive study. BMC Med. 2021, 19, 45. [Google Scholar] [CrossRef]
- Priority Groups for Coronavirus (COVID-19) Vaccination: Advice from the JCVI. 30 December 2020. Available online: https://www.gov.uk/government/publications/priority-groups-for-coronavirus-covid-19-vaccination-advice-from-the-jcvi-30-december-2020#history (accessed on 29 January 2022).
- Soiza, R.L.; Scicluna, C.; Thomson, E.C. Efficacy and safety of COVID-19 vaccines in older people. Age Ageing 2021, 50, 279–283. [Google Scholar] [CrossRef]
- Kiang, M.V.; Chin, E.T.; Huynh, B.Q.; Chapman, L.A.C.; Rodríguez-Barraquer, I.; Greenhouse, B.; Rutherford, G.W.; Bibbins-Domingo, K.; Havlir, D.; Basu, S.; et al. Routine asymptomatic testing strategies for airline travel during the COVID-19 pandemic: A simulation study. Lancet Infect. Dis. 2021, 21, 929–938. [Google Scholar] [CrossRef]
- Guan, W.J.; Ni, Z.Y.; Hu, Y.; Liang, W.H.; Zhong, N.S. Clinical Characteristics of Coronavirus Disease 2019 in China. J. Integr. Med. 2020, 328, 1708–1720. [Google Scholar] [CrossRef] [PubMed]
- Advice for the Public. Available online: https://www.who.int/emergencies/diseases/novel-coronavirus-2019/advice-for-public (accessed on 29 January 2022).
- Yan, Y.; Bayham, J.; Richter, A.; Fenichel, E.P. Risk compensation and face mask mandates during the COVID-19 pandemic. Sci. Rep. 2021, 11, 3174. [Google Scholar] [CrossRef] [PubMed]
- Various Measures to Facilitate the Elderly to Receive the COVID-19 Vaccine. Available online: https://www.news.gov.hk/chi/2021/08/20210801/20210801_122654_948.html (accessed on 29 January 2022).
- Nationwide COVID Fight Proves Effective. Available online: http://english.www.gov.cn/statecouncil/ministries/202108/14/content_WS61171650c6d0df57f98de6d7.html (accessed on 29 January 2022).
- Director-General’s Ppening Remarks at the Special Session of the World Health Assembly—29 November 2021, World Health Organization. Available online: https://www.who.int/director-general/speeches/detail/who-director-general-s-opening-remarks-at-the-special-session-of-the-world-health-assembly---29-november-2021 (accessed on 29 January 2022).
- Prata, D.N.; Rodrigues, W.; Bermejo, P.H. Temperature significantly changes COVID-19 transmission in (sub)tropical cities of Brazil. Sci. Total Environ. 2020, 729, 138862. [Google Scholar] [CrossRef] [PubMed]
- Mecenas, P.; Bastos, R.T.R.M.; Vallinoto, A.C.R.; Normando, D. Effects of temperature and humidity on the spread of COVID-19: A systematic review. PLoS ONE 2020, 15, e0238339. [Google Scholar] [CrossRef]
- Aboubakr, H.A.; Sharafeldin, T.A.; Goyal, S.M. Stability of SARS-CoV-2 and other coronaviruses in the environment and on common touch surfaces and the influence of climatic conditions: A review. Transbound. Emerg. Dis. 2021, 68, 296–312. [Google Scholar] [CrossRef]
- Mossong, J.; Hens, N.; Jit, M.; Beutels, P.; Auranen, K.; Mikolajczyk, R.; Massari, M.; Salmaso, S.; Tomba, G.S.; Wallinga, J.; et al. Social contacts and mixing patterns relevant to the spread of infectious diseases. PLoS Med. 2008, 5, e74. [Google Scholar] [CrossRef]
- Ubaru, S.; Horesh, L.; Cohen, G. Dynamic graph and polynomial chaos based models for contact tracing data analysis and optimal testing prescription. J. Biomed. Inform. 2021, 122, 103901. [Google Scholar] [CrossRef]
- Li, J.; Long, X.; Zhu, C.; Wang, R.; Hu, S.; Wang, T.; Li, J.; Lin, Z.; Xiong, N. Management of a Parkinson’s disease patient with severe COVID-19 pneumonia. Ther. Adv. Chronic Dis. 2020, 11, 2040622320949423. [Google Scholar] [CrossRef]


Publisher’s Note: MDPI stays neutral with regard to jurisdictional claims in published maps and institutional affiliations. |
© 2022 by the authors. Licensee MDPI, Basel, Switzerland. This article is an open access article distributed under the terms and conditions of the Creative Commons Attribution (CC BY) license (https://creativecommons.org/licenses/by/4.0/).
Share and Cite
Miao, D.; Zhang, N. Human Close Contact Behavior-Based Interventions for COVID-19 Transmission. Buildings 2022, 12, 365. https://doi.org/10.3390/buildings12030365
Miao D, Zhang N. Human Close Contact Behavior-Based Interventions for COVID-19 Transmission. Buildings. 2022; 12(3):365. https://doi.org/10.3390/buildings12030365
Chicago/Turabian StyleMiao, Doudou, and Nan Zhang. 2022. "Human Close Contact Behavior-Based Interventions for COVID-19 Transmission" Buildings 12, no. 3: 365. https://doi.org/10.3390/buildings12030365
APA StyleMiao, D., & Zhang, N. (2022). Human Close Contact Behavior-Based Interventions for COVID-19 Transmission. Buildings, 12(3), 365. https://doi.org/10.3390/buildings12030365