Article

Interactive Effects of Admixtures on the Compressive Strength Development of Portland Cement Mortars

State Key Laboratory of Coastal and Offshore Engineering, School of Civil Engineering, Dalian University of Technology, Dalian 116024, China
*
Author to whom correspondence should be addressed.
Buildings 2022, 12(4), 422; https://doi.org/10.3390/buildings12040422
Submission received: 4 March 2022 / Revised: 21 March 2022 / Accepted: 30 March 2022 / Published: 31 March 2022
(This article belongs to the Section Building Materials, and Repair & Renovation)

Abstract

:
The interaction effects of four chlorine-free admixtures such as calcium formate (CF), triethanolamine, (TEA), triisopropanolamine (TIPA), and sodium sulfate (SS) on the compressive strength development of Portland cement mortars were investigated based on the design of experiment (DoE). The results showed that both the addition of CF and SS contributed significantly to the strength of cement mortars at early curing age. However, the interaction of CF and SS could hinder their respective positive effect on the strength of cement at 1 d. At later curing ages, CF was still beneficial in improving the late strength of cement, but SS had a negative effect on the strength of cement at 28 d. A negative effect of TIPA on the strength of cement was found at 3 d. However, the positive interactive effect of TIPA and CF was sufficient to offset the negative effect of TIPA on the strength of mortars at 3 d if the dosage of CF exceeded 2%. In addition, TEA had a positive influence on 7 d strength until a turning point was reached and the optimum dosage of TEA was approximately 0.013%.

1. Introduction

Portland cement has been the most widely used cementitious material in the building construction industry for a long time [1,2,3]. Many chemical admixtures have been developed in the cement industry to improve the mechanical quality and workability of Portland cement and concrete during the past decades [4,5,6].
Calcium formate (CF), as a kind of chloride-free chemical admixture, was commonly employed to improve the early mechanical strength of cement mortar/concrete. The addition of CF is beneficial to advance the initial setting period and final setting period of cement mortars [7]. CF, although not as effective as chloride in enhancing the early strength of concrete, can satisfactorily improve the early strength without corroding the reinforcement at room temperature [4] and a low temperature of 5 °C [8]. However, Ben found that CF can aggravate the linear expansion of ordinary cement paste, increase the porosity of pastes significantly and disturb the formation of C-S-H, which increases the risk of chloride erosion resistance inside cement mortars [9]. Heikal [7] identified that CF can accelerate the formation of ettringite in the hydration process of cement. In addition, CF was also proven to cause the formation of gismondine (which contributes to the strength of cement) in the early hydration process of cement [10].
Triethanolamine (TEA) and triisopropanolamine (TIPA) are common organic grinding admixtures used in the cement manufacturing process which can minimize agglomeration in the ball mill. The effects of TEA and TIPA on the hydration and properties of the Portland cement were studied by many researchers [11,12,13]. Generally, the amount of TEA added is less than 0.05% and it acts as the accelerator with the addition of 0.02% [14]. TIPA can enhance the mechanical characteristics of Portland cement by accelerating ferrite phase hydration [13]. TIPA is not significantly adsorbed on the cement grains, but it complexes the iron in solution, limiting the development of a reaction product layer and encouraging iron transit into solution [15]. TIAP is beneficial for strength enhancement at later curing ages. Sandberg evaluated 10 cements containing 0.2% TIPA and found that the average strength enhancement of mortar was roughly 10% at 28 d [16]. Zhang also found that the addition of TIPA is attributed to the promotion of cement hydration and the pozzolanic reaction of clay brick powder (CBP) which can provide efficient compensation to the drawback of the incorporation of CBP [17].
Sodium sulfate (SS, Na2SO4), as one of the most extensively used sulfate chemical early strength admixtures, is well-recognized for its lower cost and less harmful environmental burden [18,19]. Many researchers have illustrated that SS could react with Ca(OH)2 generated by cement hydration to form calcium sulfate at a high degree of dispersion [20]. The calcium sulfate particles will then react with tricalcium aluminate, creating ettringite crystals, which promotes the creation of the framework of cement pastes and significantly enhances the strength of cement pastes at early curing ages. In addition, consumption of CH by sodium sulfate promotes silicate (C3S and C2S) hydration, which is conducive to the early strength of cement pastes [21].
Currently, most of the admixtures used in the industry contain multiple chemical components. However, previous studies have mainly focused on exploring the effects of single chemical additives on the modification of cement properties, and the research on the interaction effects of CF, TEA, TIPA and SS is still scarce. Therefore, the purpose of this study was to investigate the interaction effects of CF, TEA, TIPA and SS on the strength development of cement pastes to provide a basis for the research and development of composite admixtures. A design of experimental method was used to model the behavior of the above four chemical admixtures and quantify their possible interactions. Furthermore, Pareto charts [22] and contour plots [23] were presented to demonstrate the interaction of these admixtures at different curing ages.

2. Materials and Methods

2.1. Materials and Sample Preparation

The Portland cement (P.O 52.5R) and ISO standard sand from a cement manufacturer in Dalian city, China were selected. The chemical composition of cement used in this study is presented in Table 1. The chemical additives (CF, TEA, TIPA and SS) were provided by Aladdin Industrial Corporation, Shanghai, China (effective concentration of 98%).
According to the Chinese standard GB/T17671 [24], three test specimens were made for each batch with 450 ± 2 g of P.O 52.5R cement (the standard value of compressive strength of cement mortar for 28 d is over 52.5 MPa), 1350 ± 5 g of ISO standard sand (natural quartz sea sand with SiO2 content >96%) and 225 ± 1 g of water. The size of each specimen was 40 mm × 40 mm × 160 mm. The chemical additives were diluted into mixing water for cement mortar preparation. All the specimens were cured for 24 h in a wet curing environment at 25 ± 1 °C and 95 ± 2% RH. Then, the specimens were put in deionized water for curing 3 d, 7 d and 28 d. After the different curing days above, the hardened specimens were taken out from water for a further compressive strength test.

2.2. Central Composite Face-Centered Design (CCFD)

CCFD (a kind of DOE) is an effective statistical strategy for planning the experimental setup and quantifying the variables and response correlation. Many researchers have successfully utilized it to assess the impact of other variables on cement and concrete qualities [25,26,27].
In this study, CCFD was used to set the testing combination of CF (corresponding factors, x1), TEA (x2), TEA (x3) and TEA (x4) in order to assess the impact of each chemical additive and any interactions on strength development of Portland cement mortars (response, y). For predicting the response as a function of single factors and their interactions, the compressive strength of cement mortar with different chemical additives was expressed as a quadratic polynomial equation [28]:
y = a 0 + i k a i x i + i k a i i x i 2 + i < j a i j x i x j + e x i , x 2 , , x k
where
y: the predicted response which is the compressive strength of cement mortar;
x: the coded independent variable;
k: the number of independent variables (in this study: k = 4);
ai, aij, aii: the regression coefficients for linear, interaction and quadratic terms;
e: the error which includes experimental error and the Lack-of-Fit error.
The factors (x1~x4) in Equation (1) were coded at ±1 for the factorial points; 0 for the central points. The coded and corresponding actual values of these factors are shown in Table 2. The experimental design matrix for the CCFD and the results of tests are shown in Table 3. According to the results in Table 3, all the coefficients of the models were calculated in Minitab 18 software based on multiple regression analysis technique. In addition, analysis of variance (ANOVA) was used to assess the suitability of each model, statistical significance of each factor and the error in each model. The significance of each term in each model depends on p-value. In this study, the significance level was defined as 0.05. Thus, the items in analysis of variance with p-value higher than 0.05 should be considered insignificant and should be ignored in the regression model. In addition, the t-value of each term in analysis of variance indicates the significance of the coefficients in the regression model which can be used to assess the contribution of each item to the response. The Lack-of-Fit (LoF) is used to assess the fitness of the model. If the p-value of LoF is less than 0.05, there is indication that the model does not sufficiently match the data and that it should be changed.

3. Results and Discussion

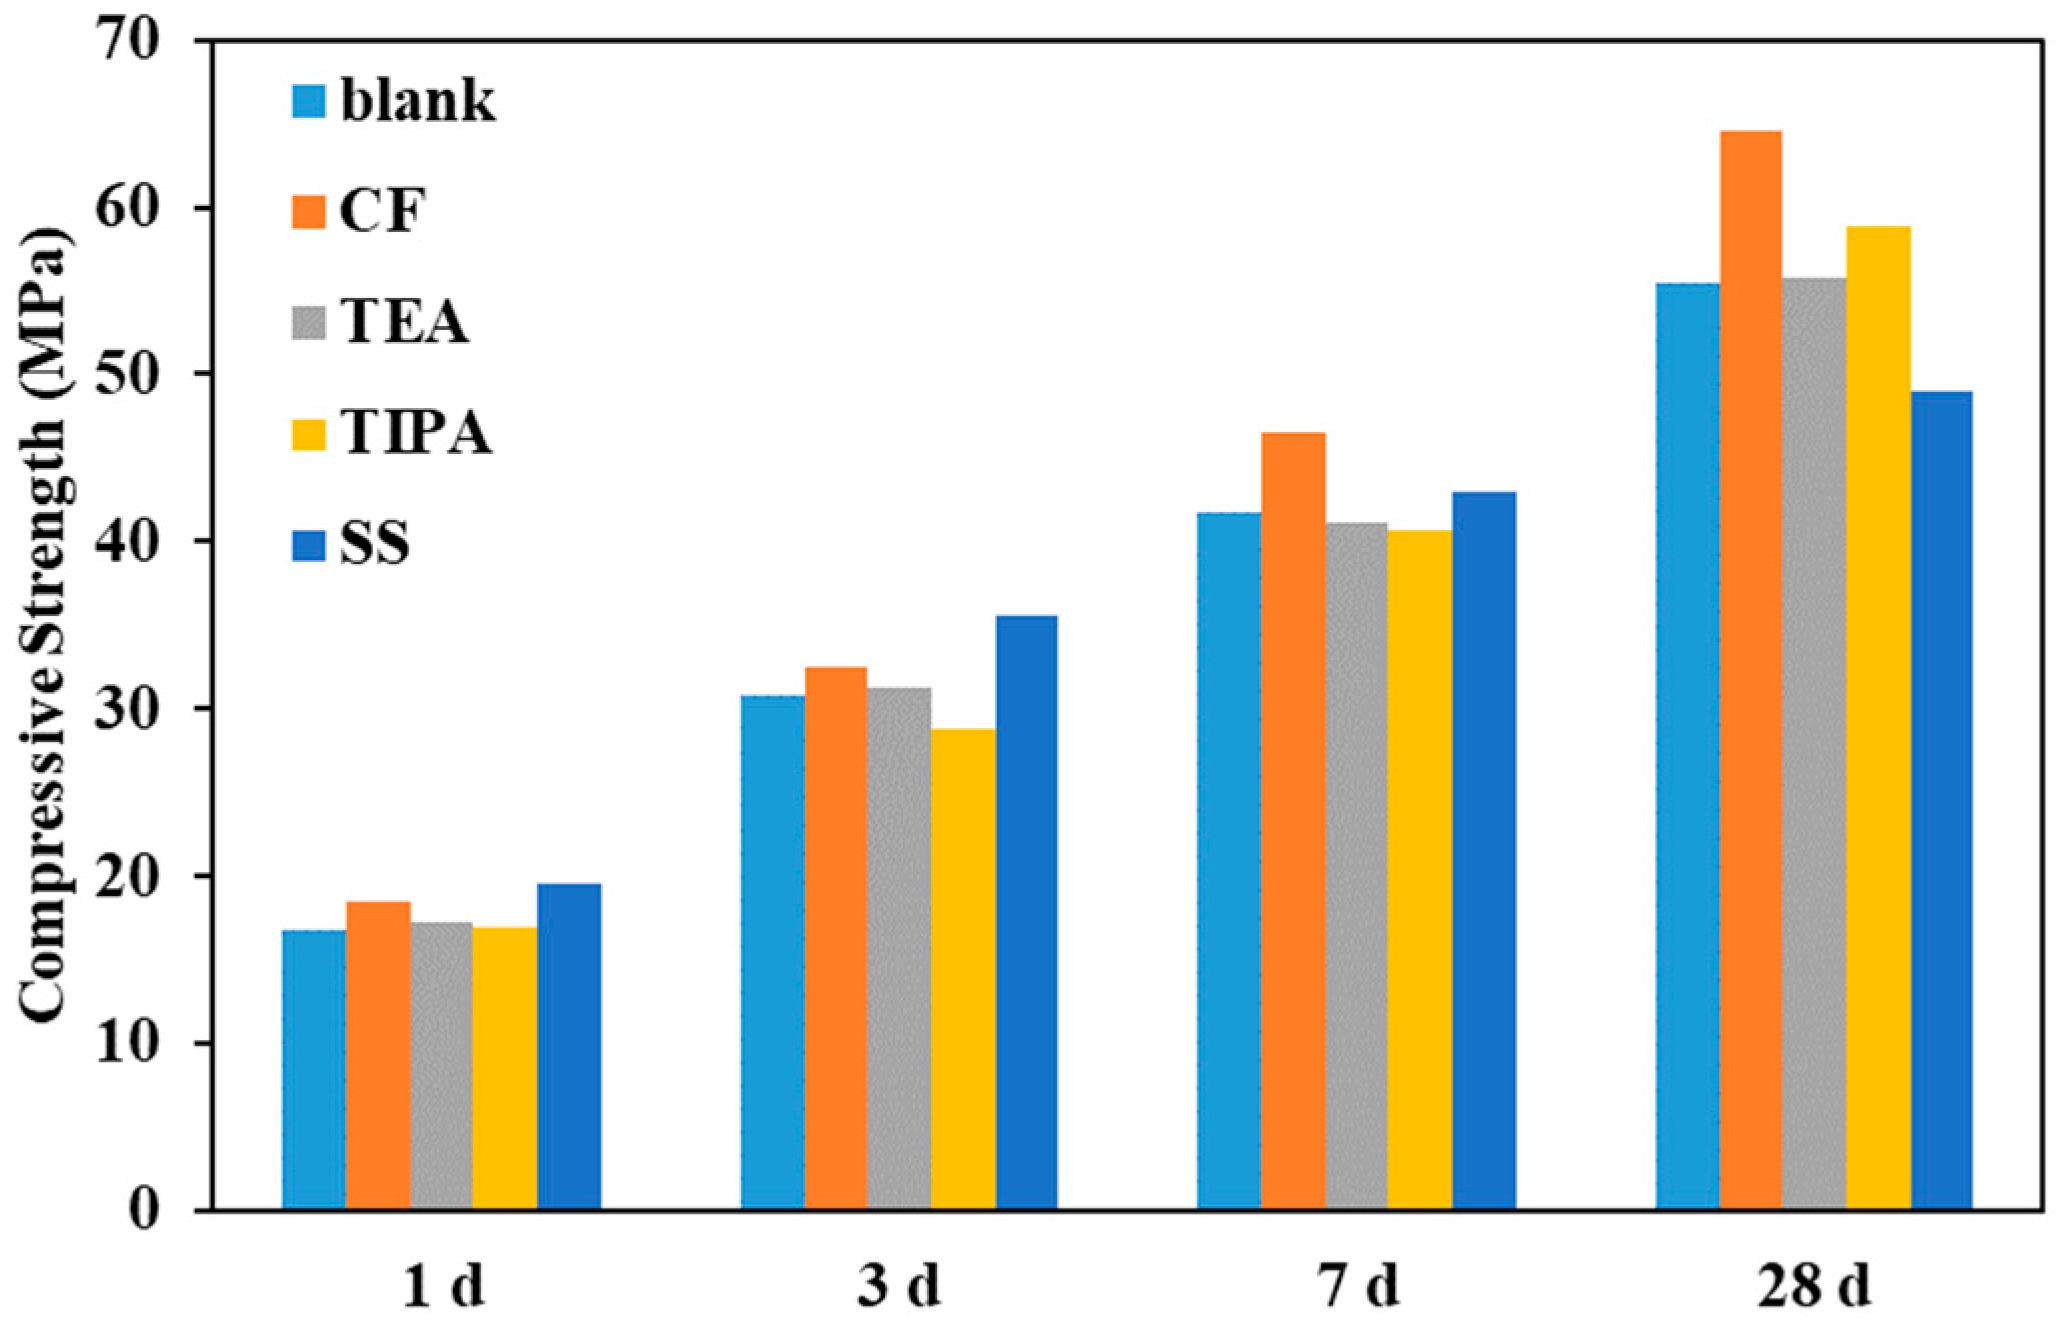
3.1. Effect of Each Admixture Alone on Compressive Strength of Mortars

The results of all the compressive strength tests are shown in Table 4 and the effect of each chemical additive (CF, TEA, TIPA and NS) on the strength development of Portland cement mortars is first discussed in Figure 1. With the addition of CF, the strength of mortars was improved at all the curing days. The strength enhancement at 1 d, 7 d and 28 d (10.8%, 11.5% and 16.6%, respectively) was more significant than that at 3 d (5.5%) in the mortar with CF mixed only. The addition of TEA had little effect on the strength of mortars, and the strength was only increased by 3% at 1 d. With the addition of 0.05% TIPA only, the strength of the specimen was increased by 1.2% and 6.3% at 1 d and 28 d, respectively, but it was not conducive to strength at 3 d and 7 d. In addition, it can be seen in Table 4 that the strength enhancement of mortars by adding SS alone was 17.4%, 15.6%, 2.9% and −11.6% at 1 d, 3 d, 7 d and 28 d, respectively. Obviously, the incorporation of SS could significantly improve the early strength of cement, but it was detrimental to the strength at later curing age (28 d).

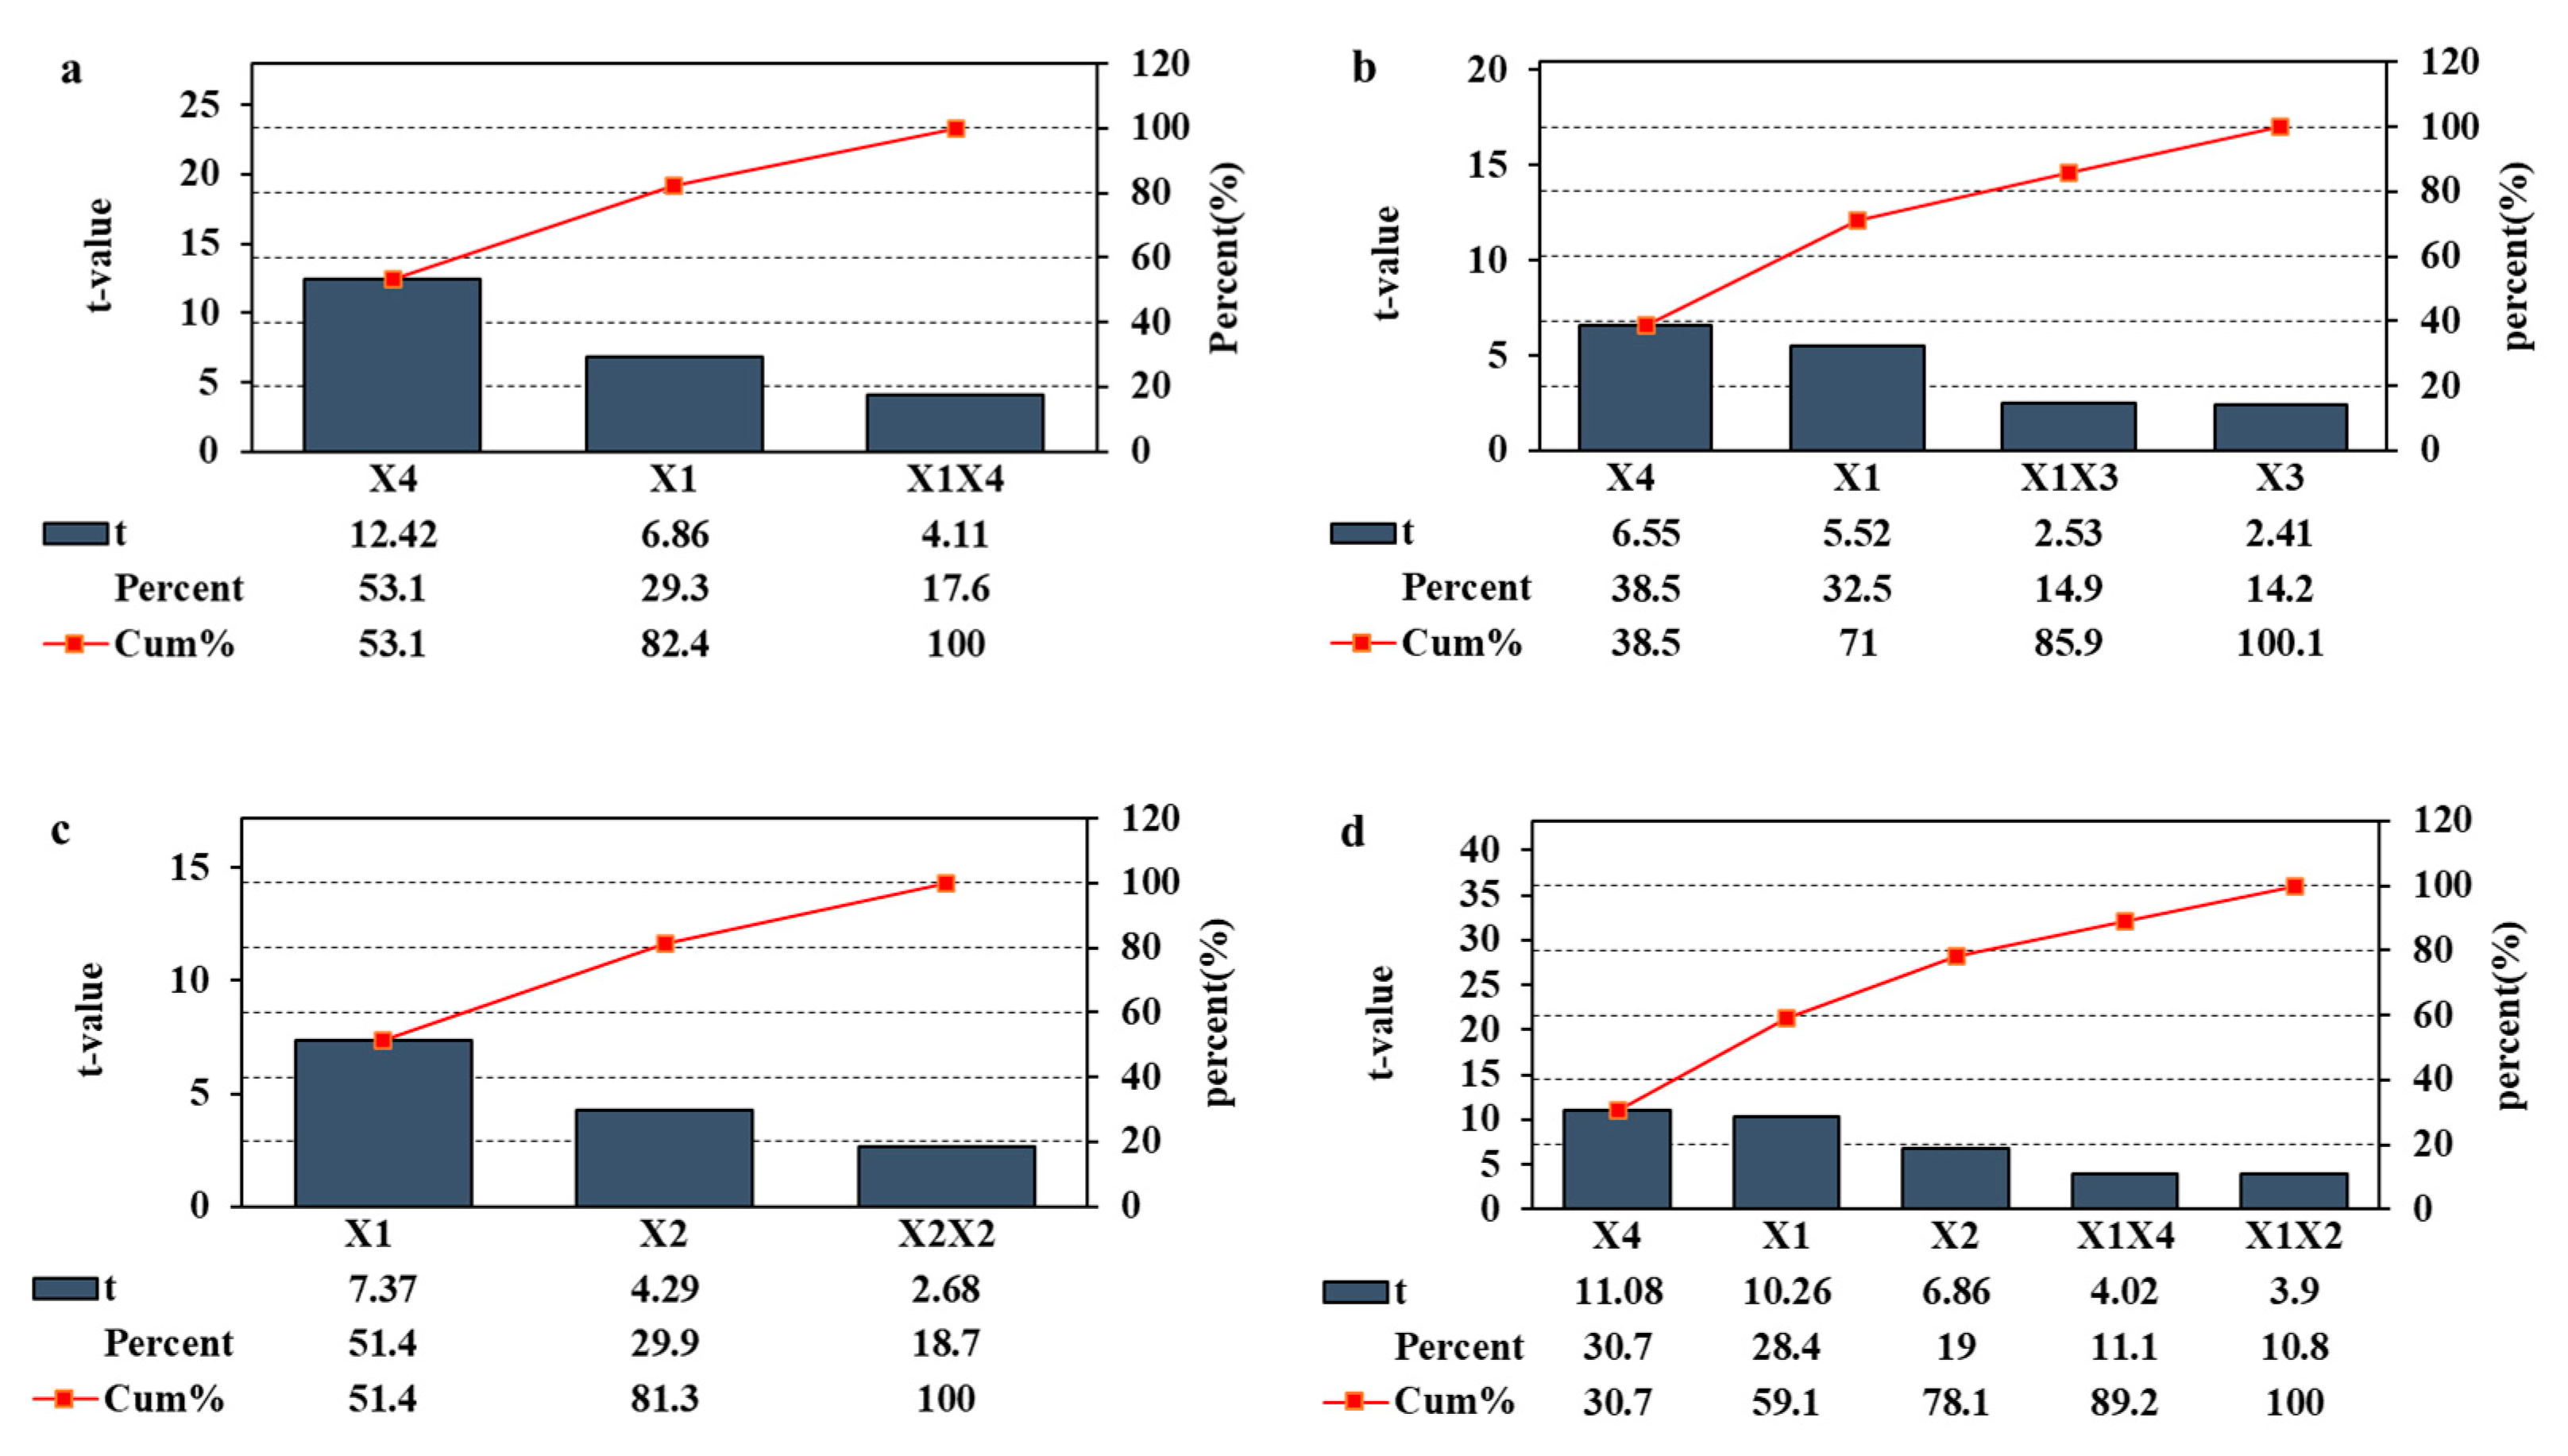
3.2. Statistical Model for Assessing the Interactive Effects of Chemical Admixtures

The interactive effect of CF, TEA, TIPA and SS on the strength development of Portland cement pastes was evaluated based on CCFD and the ANOVA of the models, and the results of analysis of variance are shown in Table 4. The following equations were used to express the mathematical models for the strength of Portland cement mortar, with different additives expressed by the Equations (2)–(5):
y 1 d = 16.830 + 0.772 x 1 + 1.156 x 4 0.300 x 1 x 4
y 3 d = 30.889 + 0.799 x 1 57.4 x 3 + 1.844 x 4 + 30.3 x 1 x 3
y 7 d = 41.728 + 2.606 x 1 + 56.2 x 2 2336 x 2 2
y 28 d = 57.840 + 3.046 x 1 32.7 x 2 4.609 x 4 49.8 x 1 x 2 + 1.281 x 1 x 4
Some items such as x2x3, x2x4, x3x4, x12, x32 and x42 are not shown in Table 4 and Equations (2)–(5), which means these items (p-values are all over 0.05) are not significant statistically. As shown in Table 4, all the LoF values are greater than 0.05, indicating that the models are satisfied. The p-values of all items are less than 0.05, indicating that they have a significant influence.
The efficiency of each item in increasing or decreasing the strength of cement mortars was represented by using the absolute t-value of the significant items, as shown in Figure 2. Only the addition of CF and SS had a significant effect on the strength at 1 d among the four chemical additives. As shown in Figure 2a, the effectiveness of SS accounts for 53.1% while the strength enhancement coming from CF accounts for 29.3%, which means that SS is predominant for the strength increase at 1 d. Furthermore, a negative interactive effect between SS and LS can be seen for 1 d strength, which means the dual admixture of SS and CF has a certain hindering effect on its effectiveness in accelerating cement hardening at 1 d (effectiveness of the interactions accounts for 17.6%). At 3 d curing age, the addition of CF and SS still contributed to the strength enhancement of mortars. The effectiveness of SS and CF accounts for 38.5% and 32.5%, respectively. In addition, a positive effect of TIPA (effectiveness accounts for 14.2%) and a negative interactive effect between TIPA and CF (effectiveness accounts for 14.9%) were found at 3 d. Moreover, SS had no interactions with other chemicals, which is only conducive to 3 d strength improvement in a linear way. The square term appeared at 7 d. The effectiveness of CF accounts for 51.4% and the contribution of TEA to the 7 d strength accounts for 48.6% (TEA + TEA2) as shown in Figure 2c, which means that TEA has an important effect on the strength of mortars at 7 d. As the curing age increased, the strength model became more complex at 28 d. Effectiveness of SS, CF and TEA accounts for 30.7%, 28.4% and 19.0%, respectively. Effectiveness of the interactions between CF versus SS and CF versus TEA accounts for 11.1% and 10.8%, respectively, which are lower than that of single chemical at 28 d.

3.3. Interactive Effect of Chemical Admixtures on Compressive Strength of Mortars

Some items have negative coefficients (such as x1x4 in Equation (2), x3 in Equation (3), x22 in Equation (4), x2x4 and x1x2 in Equation (5)). However, this does not imply that these elements will have a detrimental influence on mortar strength development. This is because these coefficients can only be computed by closely fitting the model provided in Equation (1). In other words, the coefficients have no bearing on how the related factors behave. They are used to forecast the result when each item is held constant at a specific value. In Figure 3, Figure 4, Figure 5 and Figure 6, contour plots displayed as a function of two items at a time were used to further demonstrate the behaviors of the factors.

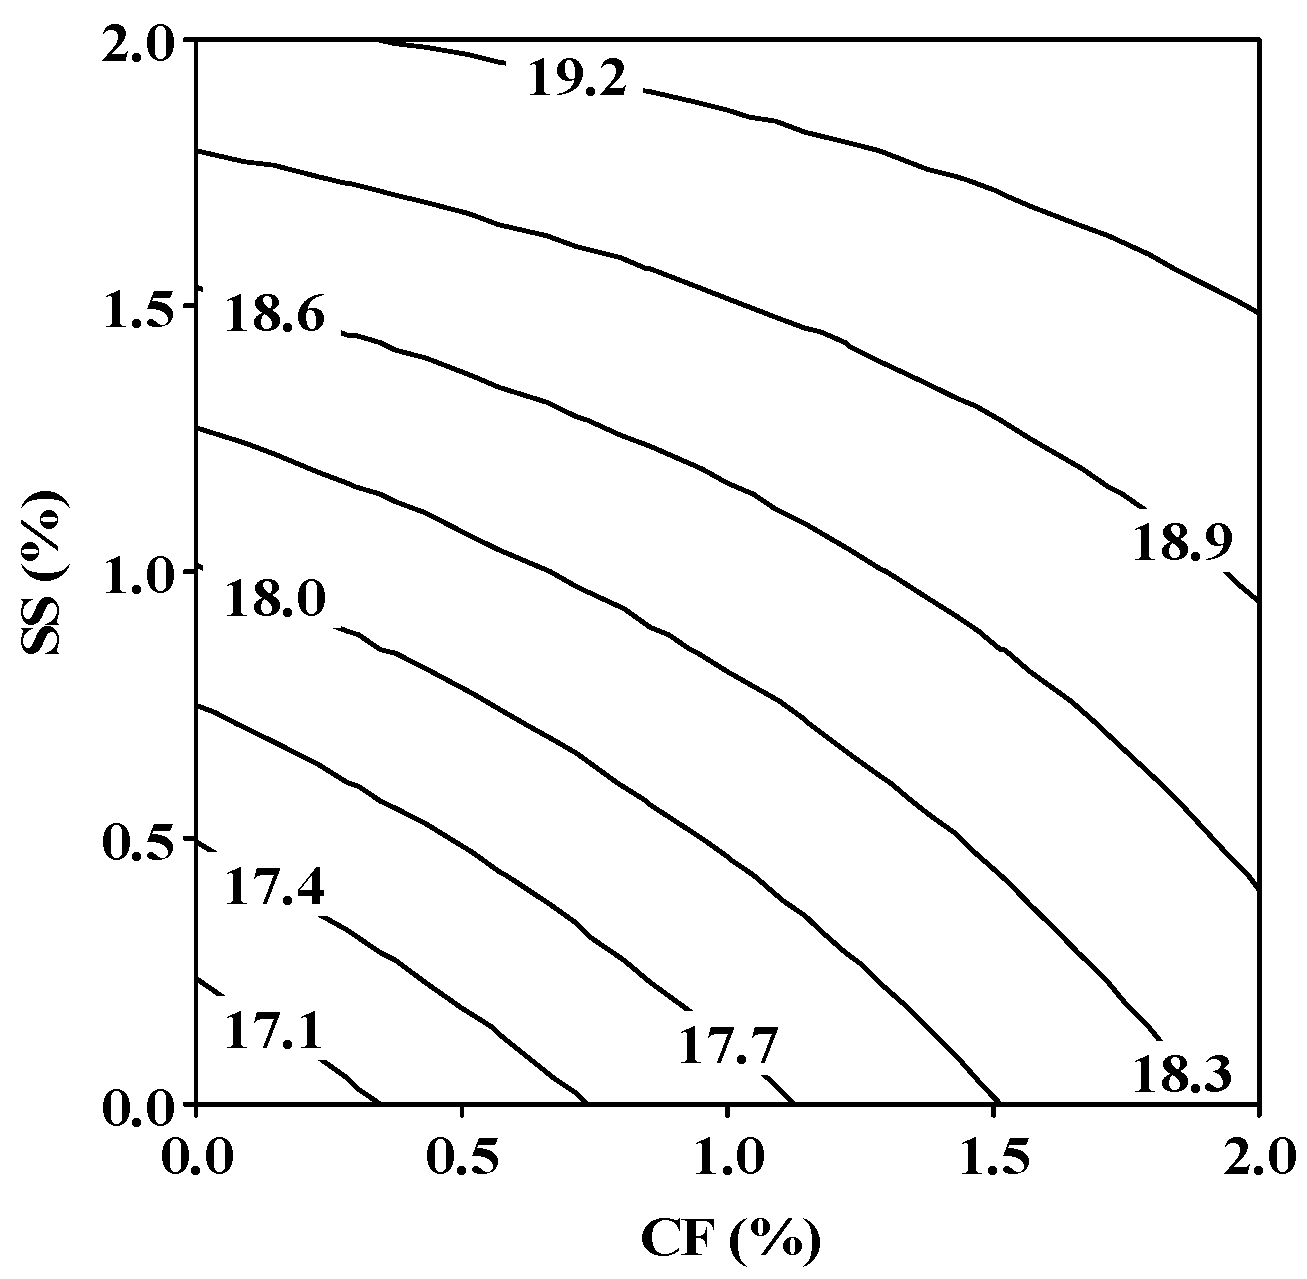
3.3.1. Interactive Effect of Chemical Admixtures on 1 d Strength

As statistical effects of TEA or TIPA on 1 d compressive strength were not found in Equation (2), just the contour of CF versus SS is shown in Figure 3. The distribution of the strength contour line illustrates the linear and interactive correlation between CF and SS.
The coefficients of x1x4 are negative in Equation (2), which means the interaction of SS and CF has a negative effect on the strength of mortar at 1 d. The reaction between SS and Ca(OH)2 generated by cement hydration will produce NaOH and gypsum, which can accelerate the consumption of Ca(OH)2 and further accelerate the silicate reaction and aluminate reaction [21]. However, when CF and SS are mixed into concrete, they will react with each other to form sodium formate and gypsum, which hinders the consumption of Ca(OH)2 by SS and thus reduces the effectiveness of SS in improving the early strength of concrete. In addition, the formation of gismondine is the major reason why CF accelerates the early hardening of cement [10]. Gismondine can be precipitated from the reaction of silicate with the released aluminate or AH3 and the formation of gismondine usually requires the material system to have a relatively high concentration of aluminate [29,30]. However, the addition of SS will accelerate the aluminate reaction and reduce the aluminate concentration which decreases the formation of gismondine and thus affects the early acceleration of CF on concrete.
Although the interaction of CF and SS will hinder their positive effect on the strength at early age, the 1 d strength of cement mortar was still increased with the increasing content of both CF and SS as shown in Figure 3. In addition, the gradation along axis SS (x4) is stronger than that along axis CF (x1), indicating that SS contributed more to the strength enhancement at 1 d. Obviously, if the dosages of CF and SS are all 2%, the 1 d strength of the cement mortar calculated according to the 1 d model (Equation (2)) is maximum (the 1 d strength calculation is 19.5 MPa) while the actual strength value tested was 19.7 MPa, with an error of 1.0%.

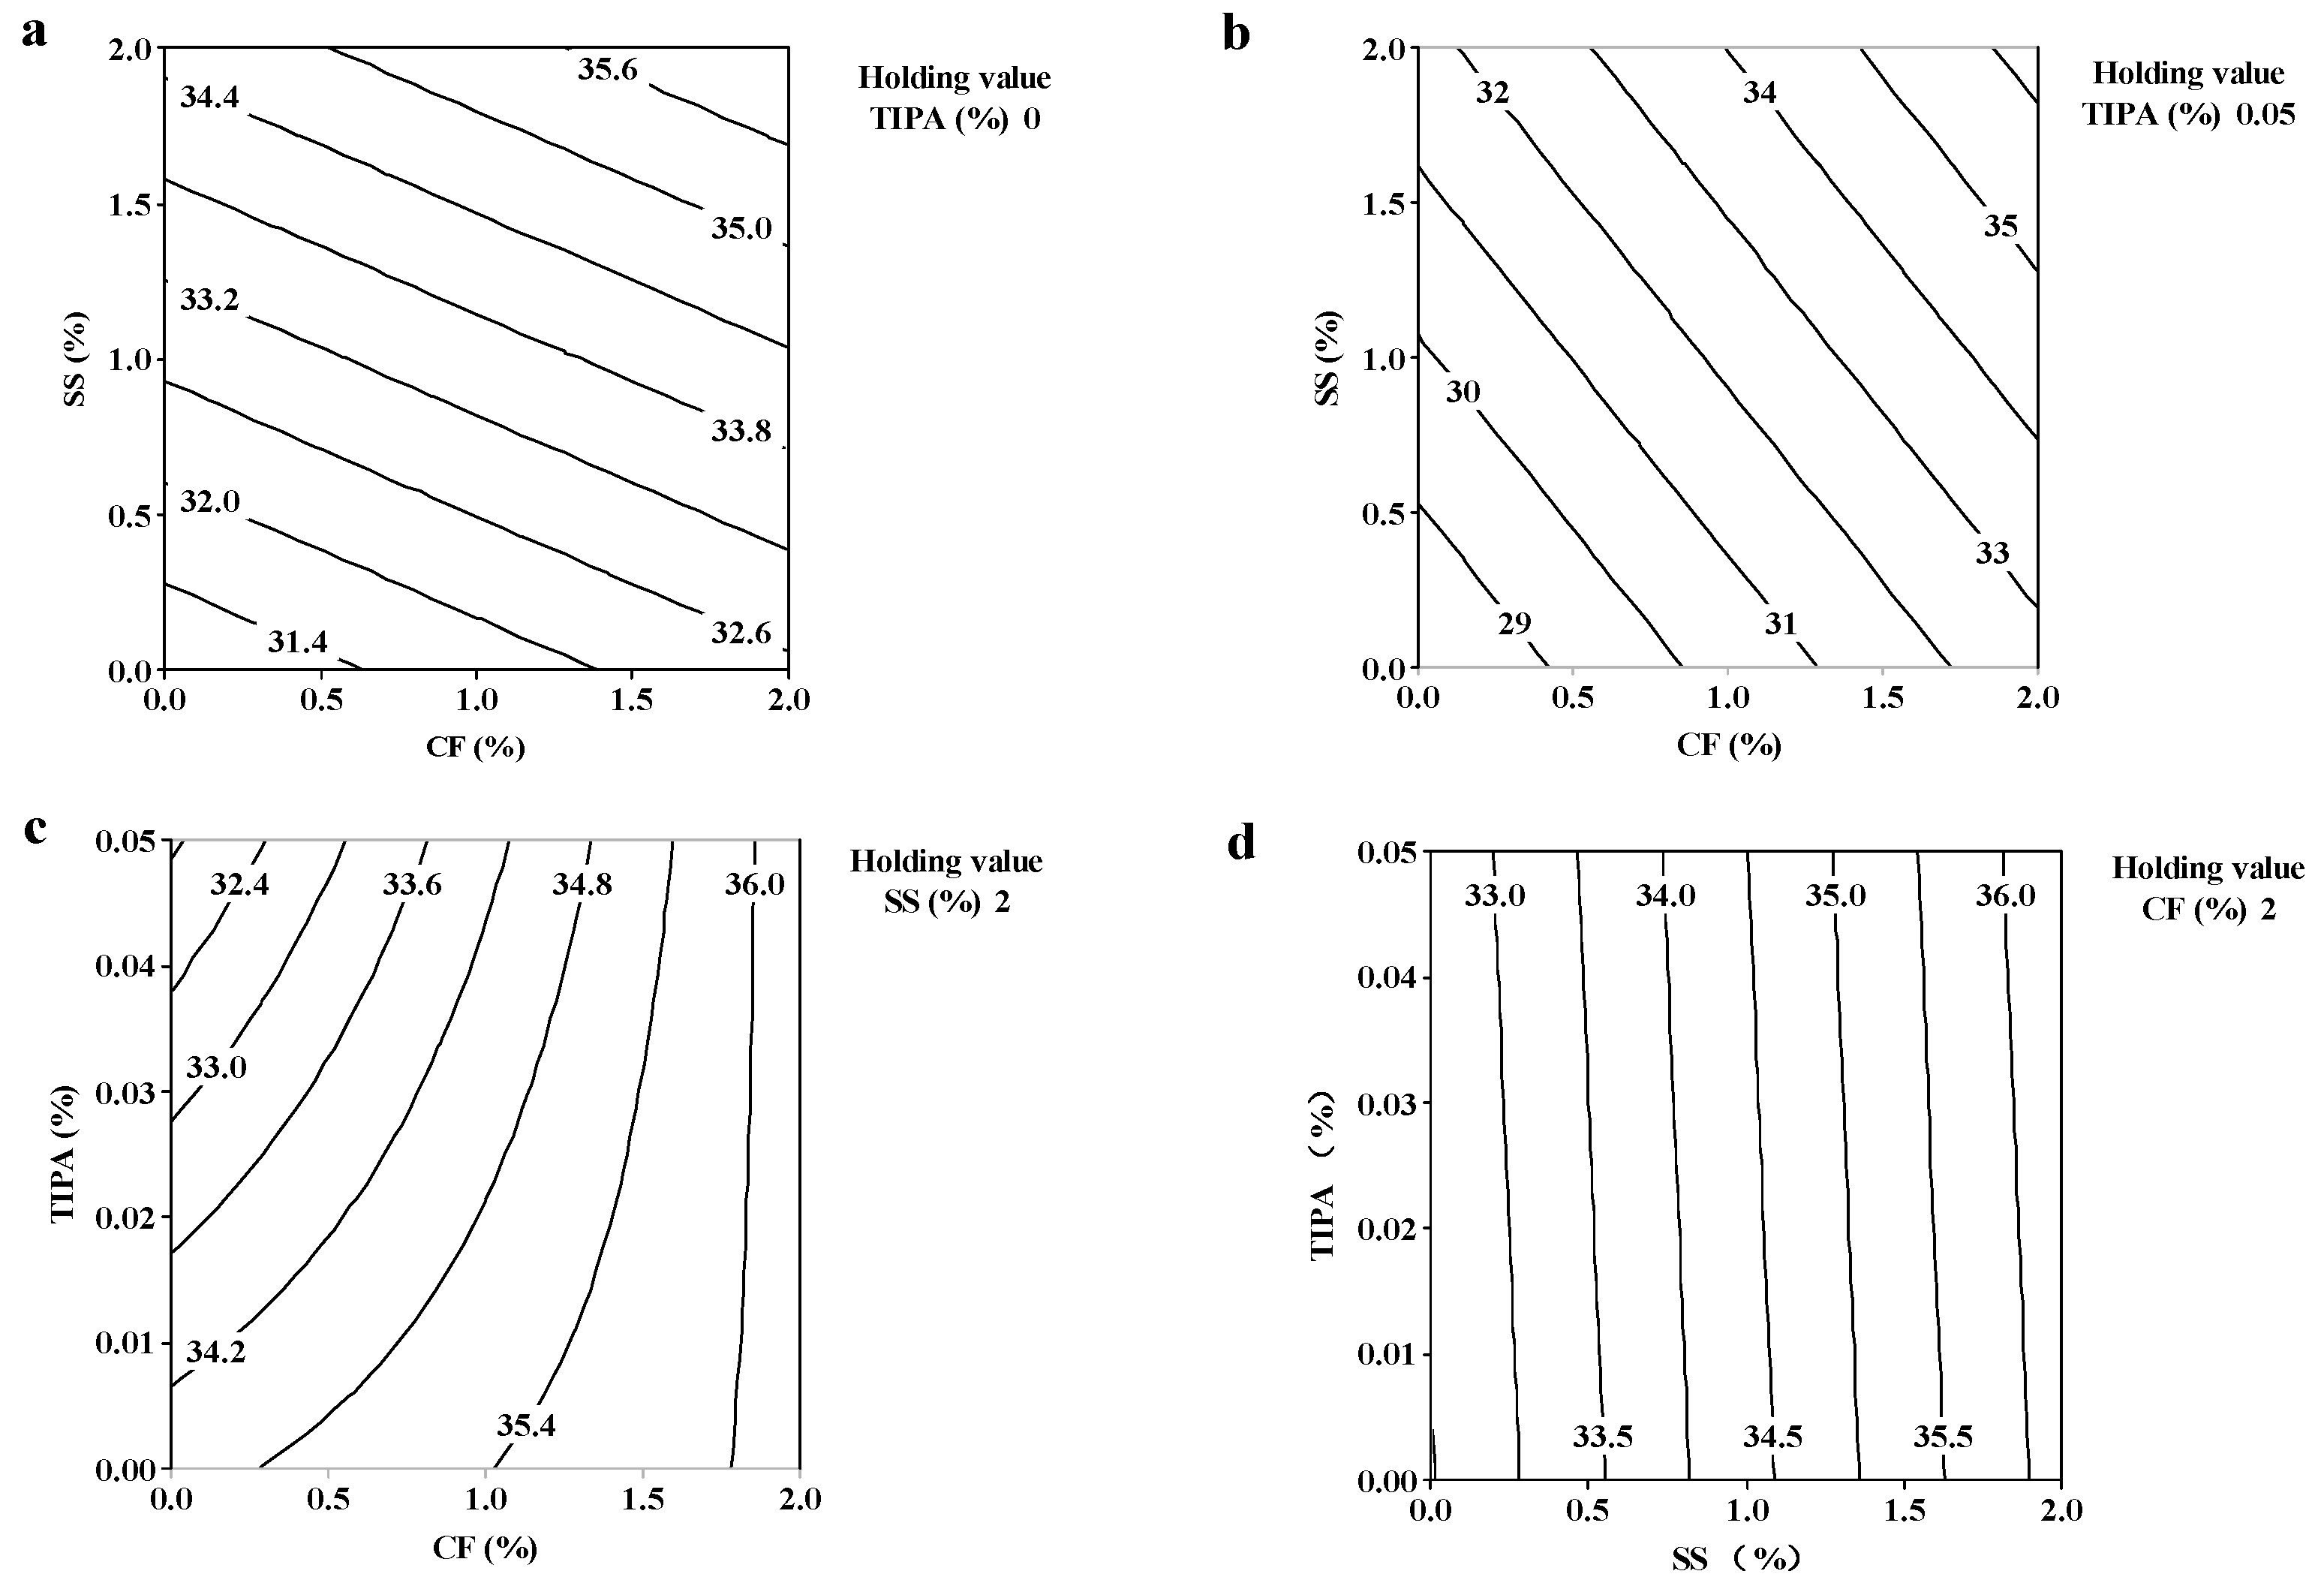
3.3.2. Interactive Effect of Chemical Admixtures on 3 d Strength

The behaviors of CF, TIPA and SS related to the strength development of mortars at 3 d are presented in Figure 4. According to Figure 4a,b, it is obvious that the 3 d strength of mortar will be enhanced with the increased addition of CF (x1) and SS (x4), whether TIPA is added. As shown in Figure 4c, obviously, the less CF is added, the greater the influence of TEA on strength development of mortars at 3 d. If CF is not added, the 3 d strength of mortars will be decreased significantly with the increase of TEA content. However, when the high level of CF (2%) is added, there is almost no effect of TIPA on the 3 d strength of mortars, which is also presented in Figure 4d. It is obvious that, if the dosage of CF exceeds 2%, the positive interaction effect of TIPA and CF is sufficient to offset the negative effect of TIPA on the strength of mortars at 3 d. According to Figure 4 and Equation (3), the maximum compressive strength of the cement mortar calculated based on the 3 d strength model is 36.2 MPa, while the actual strength value tested was 35.5 MPa, with an error of 1.9%.

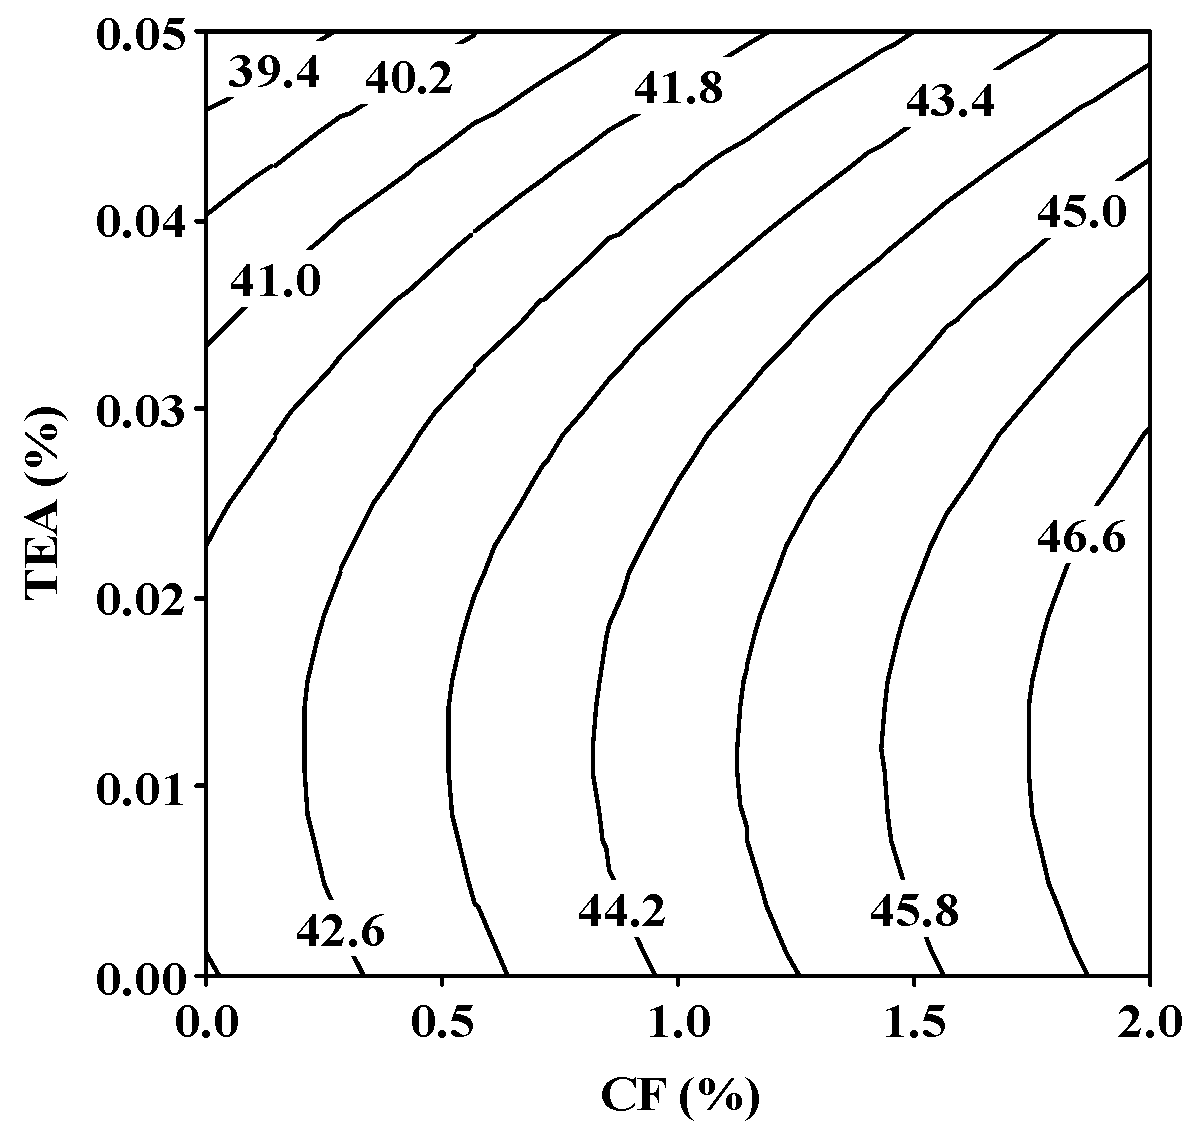
3.3.3. Interactive Effect of Chemical Admixtures on 7 d Strength

According to the 7 d strength model (Equation 4), the coefficient on x2 (TEA) was positive and the coefficient on x32 was negative, implying that TEA had a positive influence on 7 d strength until a turning point was reached. The behaviors of CF and TEA on the strength of mortar at 7 d are illustrated in Figure 5. It can be seen that the 7 d strength of mortars increased with the increasing dosage of CF addition. In addition, TEA appears to have an ideal dosage (approximately 0.013%); increasing TEA below the optimum dosage has a positive effect on compressive strength enhancement; increasing TEA above the optimum dosage has a negative effect on compressive strength enhancement. According to Figure 5 and Equation (4), the maximum compressive strength of the cement mortar calculated based on the 7 d strength model is 47.3 MPa.

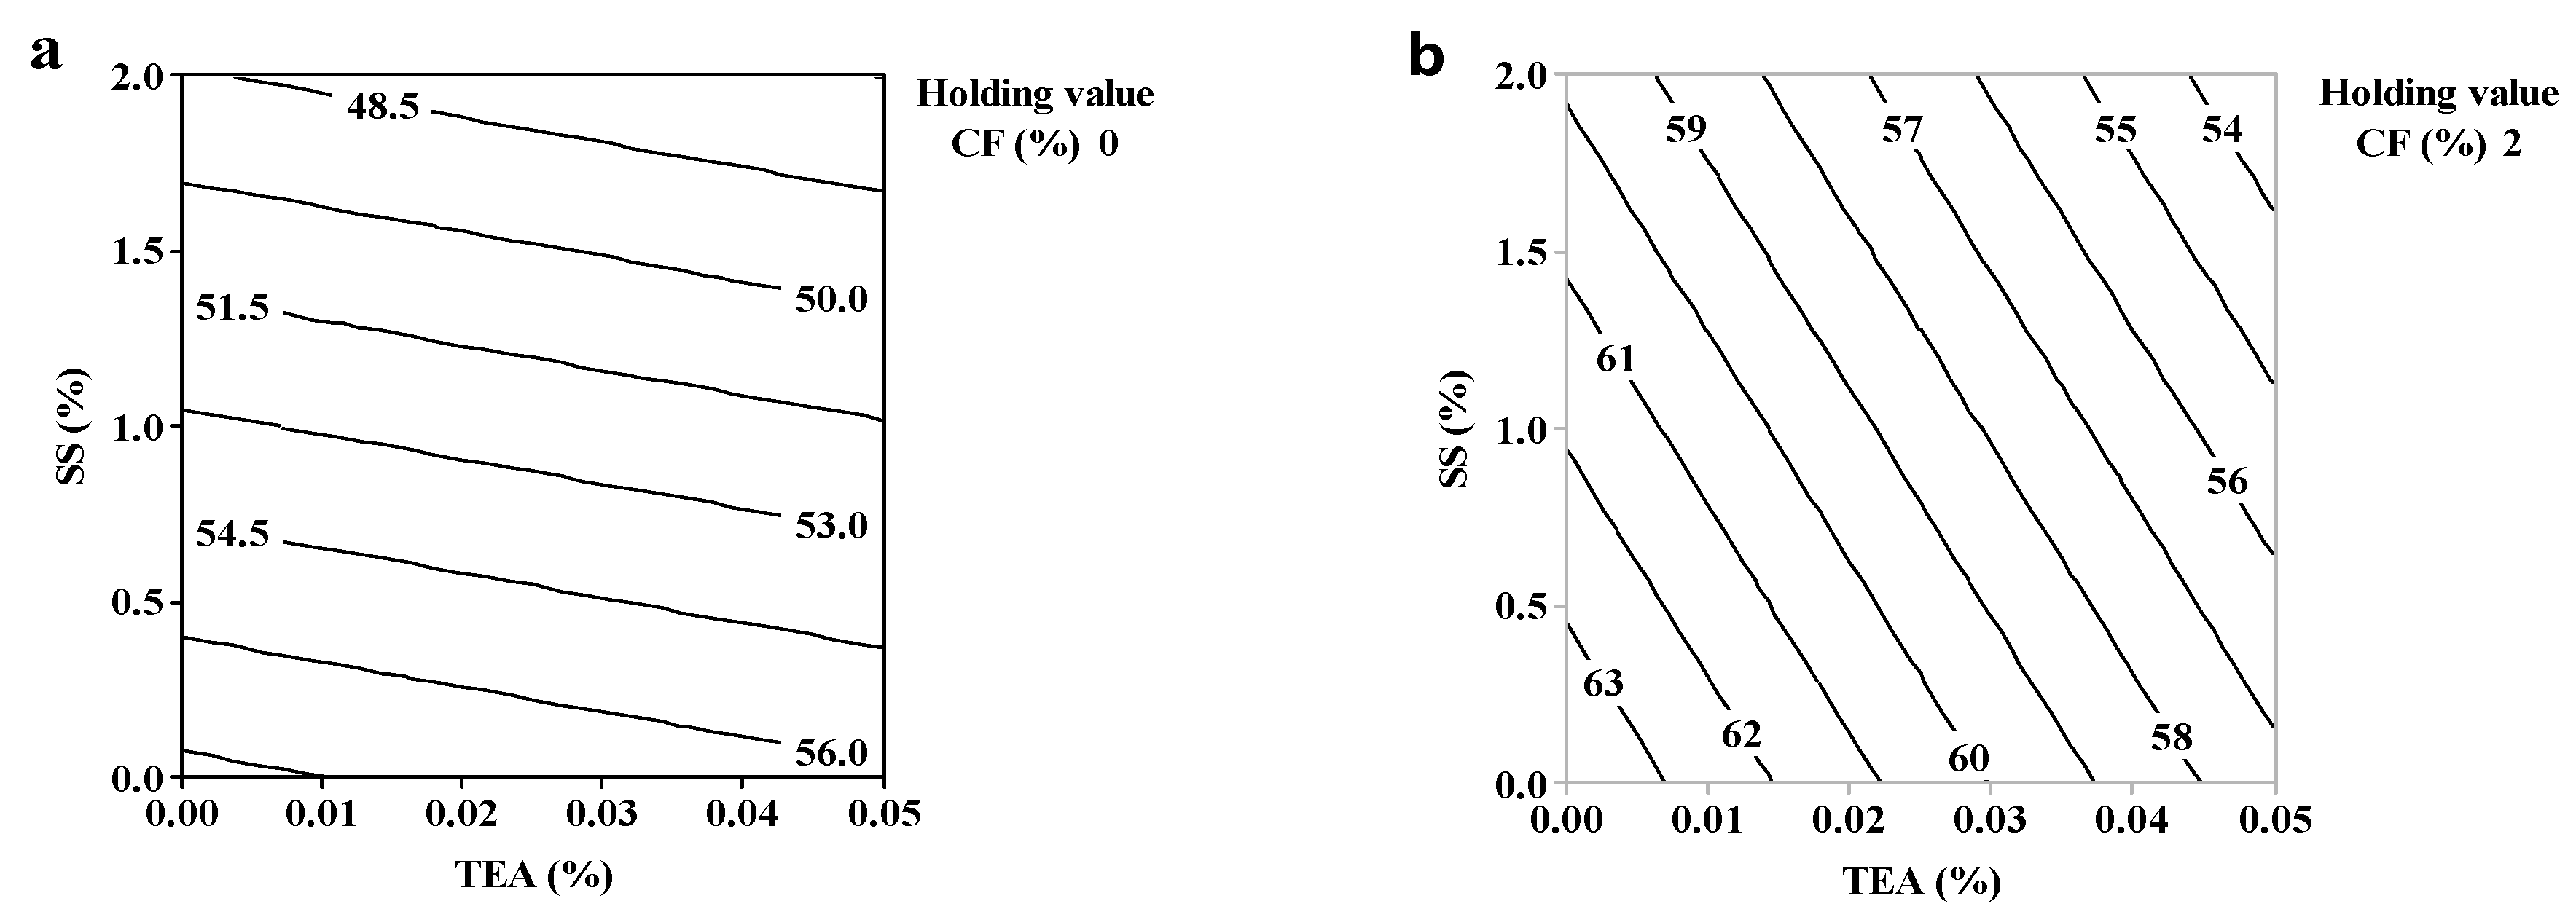
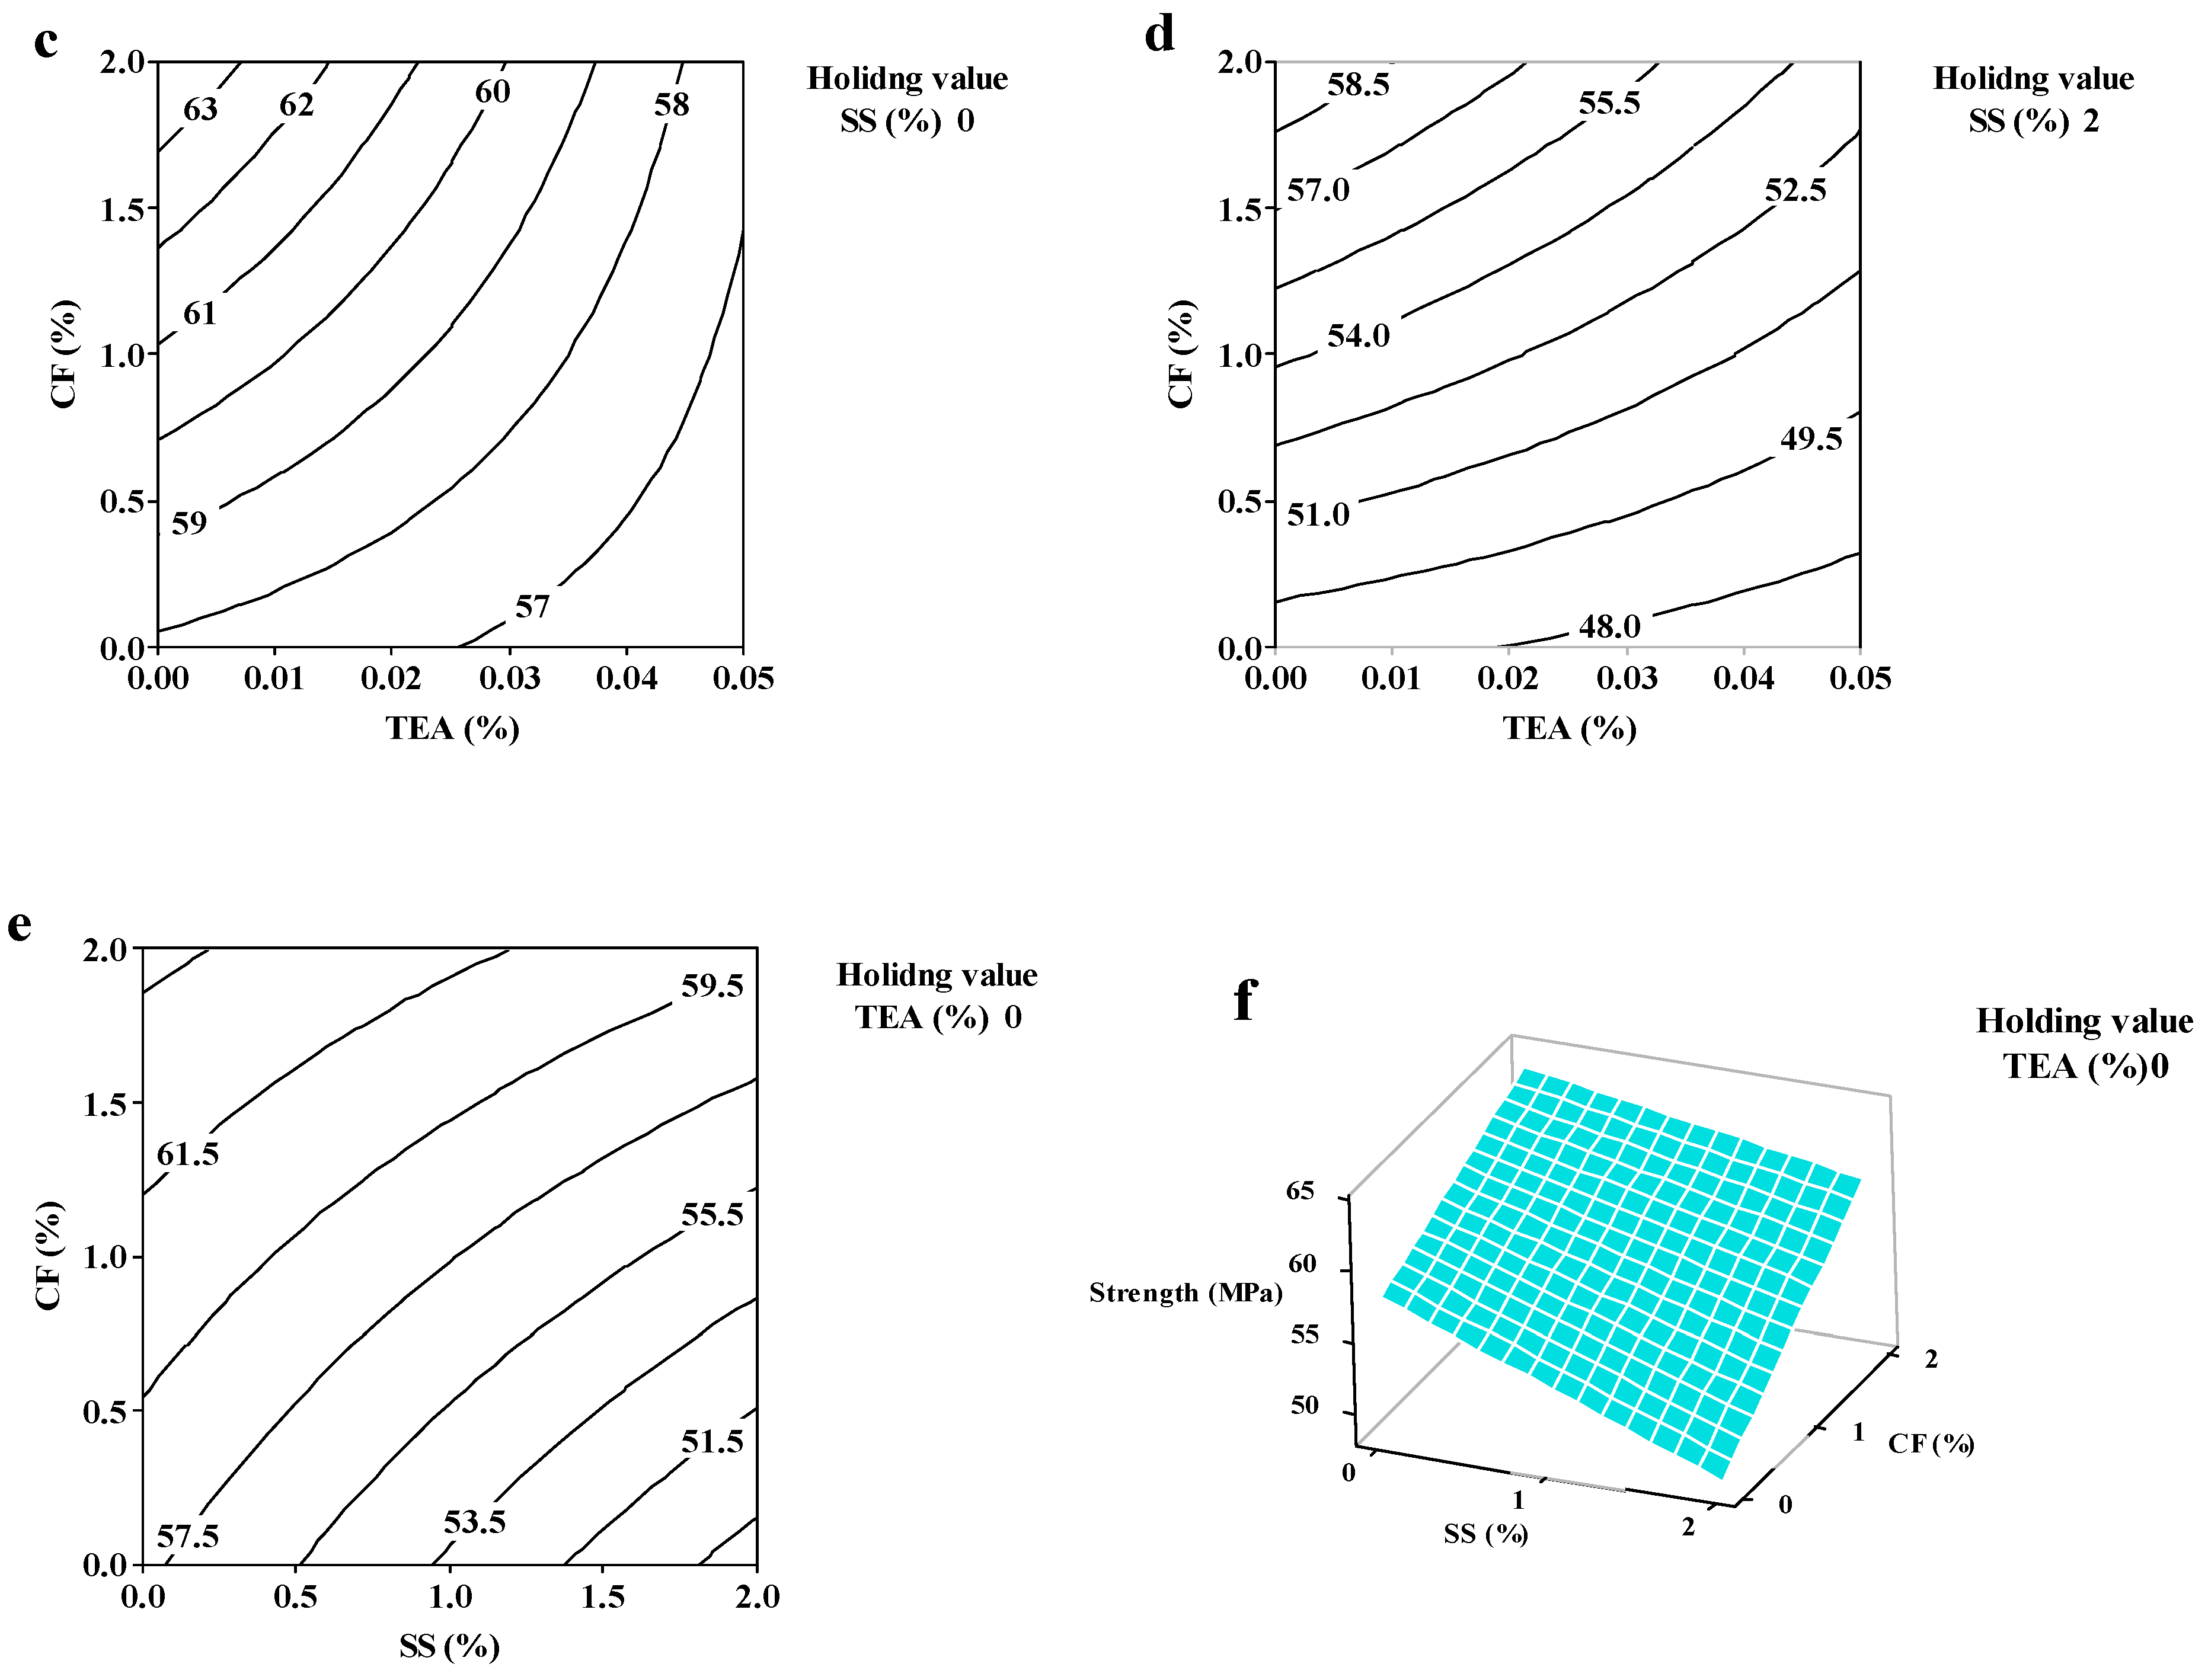
3.3.4. Interactive Effect of Chemical Admixtures on 28 d Strength

The simulation results of compressive strength at 28 d are shown in Figure 6. The holding encoded values of CF (x1 in Figure 6a,b) are low level (−1) and high level (+1). In Figure 6c,d, the holding encoded values of SS (x4) are the same as those of CF. It can be easily seen that the 28 d compressive strength decreased with the increasing dosage of TEA. Furthermore, as shown in Figure 6a,b, the negative effect of TEA on the 28 d strength in the presence of high dosage of CF was stronger than that in low dosage of CF. Combined with Equation (5), it is obvious that TEA itself has a negative effect on the strength of mortar and TEA will also hinder the positive effect of CF on the strength of mortar at 28 d. The behaviors of CF and SS without TEA are presented in Figure 6e. It can be seen from Equation (5) that the interaction between SS and CF is beneficial to the 28 d compressive strength. However, according to Figure 6e, the addition of SS reduces the overall 28 d strength of mortars even at a high dosage presence of CF. According to Figure 6f and Equation (5), the maximum compressive strength of the cement mortar at 28 d calculated based on the 28 d strength model is 63.7 MPa, while the actual strength value tested was 64.6 MPa, with an error of 1.7%.

4. Conclusions

In this paper, the effects of CF, TEA, TIPA and SS on the strength development of cement mortars were studied. In addition, the interaction effects of the above four chemical admixtures were discussed based on CCFD. Through the investigation, the following conclusions can be drawn.
(1)
The addition of CF could enhance the compressive strength of Portland cement mortars at all the curing days. SS contributed significantly to the compressive strength of mortars at early ages of curing (1 d and 3 d) but was not noticeable or even detrimental to concrete strength at the later ages. TIPA could improve the strength development at 1 d but had almost no impact at other curing days. TEA had a positive impact on 1 d and 28 d strength but had no noticeable or even had a small detrimental impact on 3 d and 7 d strength.
(2)
As the 1 d strength model shows, only CF and SS had a significant effect on the compressive strength of mortar at 1 d. Although the interaction of CF and SS would hinder their respective positive effect on the strength of mortars, the 1 d strength of cement mortar still increased with the increasing content of both CF and SS.
(3)
There was a negative effect of TIPA and a positive interactive effect between TIPA and CF on the compressive strength at 3 d. If the dosage of CF exceeded 2%, the positive interactive effect of TIPA and CF was sufficient to offset the negative effect of TIPA on the strength of mortars at 3 d.
(4)
The effects of SS and TIPA disappeared at 7 d and the effect of TEA and square term (TEA2) appeared in the quadratic 7 d strength model. TIPA had a positive influence on 7 d strength until a turning point was reached, and the optimum dosage was approximately 0.013%.
(5)
The 28 d strength model indicated that the interactive effects of CF with TEA and SS occurred. TEA itself and the interaction between TEA and CF both had negative effects on the strength of mortar at 28 d. In addition, SS itself had a significant negative effect on the 28 d strength. Thus, although SS could strengthen the effect of CF, the 28 d strength enhancement only depended on the dosage of CF.
As a conclusion, the CCFD employed in this work to study the interaction effects of CF, TEA, TIPA and SS may offer a new perspective on the research and development of composite admixtures.

Author Contributions

Conceptualization, J.J.; methodology, J.J.; formal analysis, J.J.; investigation, J.J.; data curation, J.J. and Y.W.; writing-Original draft preparation, J.J. and Y.W.; writing-Review & Editing, Y.W. All authors have read and agreed to the published version of the manuscript.

Funding

This study was funded by National Key R&D Program of China (2018YFC1505302) and Foundation for High-Level Talent Innovation Support Program of Dalian (2019RD05).

Institutional Review Board Statement

Not applicable.

Informed Consent Statement

Not applicable.

Conflicts of Interest

We declare that there is no conflict of interest in this study.

References

  1. Igliński, B.; Buczkowski, R. Development of Cement Industry in Poland—History, Current State, Ecological Aspects. A Review. J. Clean. Prod. 2017, 141, 702–720. [Google Scholar] [CrossRef]
  2. Xu, D.; Cui, Y.; Li, H.; Yang, K.; Xu, W.; Chen, Y. On the Future of Chinese Cement Industry. Cem. Concr. Res. 2015, 78, 2–13. [Google Scholar] [CrossRef]
  3. Scrivener, K.; Ouzia, A.; Juilland, P.; Mohamed, A.K. Advances in Understanding Cement Hydration Mechanisms. Cem. Concr. Res. 2019, 124, 105823. [Google Scholar] [CrossRef]
  4. Dodson, V.H. Concrete Admixture; Springer Science & Business Media: Berlin, Germany, 2013. [Google Scholar]
  5. Wang, D.; Shi, C.; Wu, Z.; Xiao, J.; Huang, Z.; Fang, Z. A Review on Ultra High Performance Concrete: Part II. Hydration, Microstructure and Properties. Constr. Build. Mater. 2015, 96, 368–377. [Google Scholar] [CrossRef]
  6. Dorn, T.; Blask, O.; Stephan, D. Acceleration of Cement Hydration—A Review of the Working Mechanisms, Effects on Setting Time, and Compressive Strength Development of Accelerating Admixtures. Constr. Build. Mater. 2022, 323, 126554. [Google Scholar] [CrossRef]
  7. Heikal, M. Effect of Calcium Formate as an Accelerator on the Physicochemical and Mechanical Properties of Pozzolanic Cement Pastes. Cem. Concr. Res. 2004, 34, 1051–1056. [Google Scholar] [CrossRef]
  8. Zhang, F.; Bai, Y.; Cai, Y. Effect of Calcium Formate on Early Hydration of Cement at 5 °C. Cailiao Daobao/Mater. Rep. 2021, 35, 1–8. Available online: http://www.mater-rep.com/EN/10.11896/cldb.20020138 (accessed on 29 March 2022).
  9. Ben, X.; Jiang, L.; Guo, M.Z.; Meng, Y.; Chen, L.; Jin, W.; Wang, F. Chloride Erosion Resistance of Calcium Formate Incorporated Cement Mortar under Chloride Attack. Constr. Build. Mater. 2022, 314, 125611. [Google Scholar] [CrossRef]
  10. Wang, Y.; Jia, J.; Cao, Q.; Gao, X. Effect of Calcium Formate on the Compressive Strength, and Hydration Process of Cement Composite Containing Fly Ash and Slag. J. Build. Eng. 2022, 50, 104133. [Google Scholar] [CrossRef]
  11. Here, Z.; Olmez, H. The Influence of Ethanolamines on the Hydration and Mechanical Properties of Portland Cement. Cem. Concr. Res. 1996, 26, 701–705. [Google Scholar] [CrossRef]
  12. Here, Z.; Olmez, H. The Influence of Ethanolamines on the Surface Properties of Portland Cement Pastes. Cem. Concr. Res. 1997, 27, 805–809. [Google Scholar] [CrossRef]
  13. Gartner, E.; Myers, D. Influence of Tertiary Alkanolamines on Portland Cement Hydration. J. Am. Ceram. Soc. 1993, 76, 1521–1530. [Google Scholar] [CrossRef]
  14. Dodson, V.H. Concrete Admixture; Van Nostrand Reinhold: New York, NY, USA, 1990. [Google Scholar]
  15. Taylor, H.F.W. Cement Chemistry; Thomas Telford: London, UK, 1997. [Google Scholar]
  16. Sandberg, P.J.; Doncaster, F. On the Mechanism of Strength Enhancement of Cement Paste and Mortar with Triisopropanolamine. Cem. Concr. Res. 2004, 34, 973–976. [Google Scholar] [CrossRef]
  17. Zhang, T.; Sun, Z.; Yang, H.; Ji, Y.; Yan, Z. Enhancement of Triisopropanolamine on the Compressive Strength Development of Cement Paste Incorporated with High Content of Wasted Clay Brick Powder and Its Working Mechanism. Constr. Build. Mater. 2021, 302, 124052. [Google Scholar] [CrossRef]
  18. Wang, L.; Hou, D.; Shang, H.; Zhao, T. Molecular Dynamics Study on the Tri-Calcium Silicate Hydration in Sodium Sulfate Solution: Interface Structure, Dynamics and Dissolution Mechanism. Constr. Build. Mater. 2018, 170, 402–417. [Google Scholar] [CrossRef]
  19. Ma, C.; Zhao, B.; Wang, L.; Long, G.; Xie, Y. Clean and Low-Alkalinity One-Part Geopolymeric Cement: Effects of Sodium Sulfate on Microstructure and Properties. J. Clean. Prod. 2020, 252, 119279. [Google Scholar] [CrossRef]
  20. Tan, H.; Deng, X.; He, X.; Zhang, J.; Zhang, X.; Su, Y.; Yang, J. Compressive Strength and Hydration Process of Wet-Grinded Granulated Blast-Furnace Slag Activated by Sodium Sulfate and Sodium Carbonate. Cem. Concr. Compos. 2019, 97, 387–398. [Google Scholar] [CrossRef]
  21. Zhao, Y.; Qiu, J.; Zhang, S.; Guo, Z.; Ma, Z.; Sun, X.; Xing, J. Effect of Sodium Sulfate on the Hydration and Mechanical Properties of Lime-Slag Based Eco-Friendly Binders. Constr. Build. Mater. 2020, 250, 118603. [Google Scholar] [CrossRef]
  22. Chakchouk, A.; Trifi, L.; Samet, B.; Bouaziz, S. Formulation of Blended Cement: Effect of Process Variables on Clay Pozzolanic Activity. Constr. Build. Mater. 2009, 23, 1365–1373. [Google Scholar] [CrossRef]
  23. Huang, H.; Shen, X.; Zheng, J. Modeling, Analysis of Interaction Effects of Several Chemical Additives on the Strength Development of Silicate Cement. Constr. Build. Mater. 2010, 24, 1937–1943. [Google Scholar] [CrossRef]
  24. Pareto Chart. Available online: http://en.wikipedia.org/wiki/Pareto_chart (accessed on 30 January 2022).
  25. Contour Plot. Available online: http://en.wikipedia.org/wiki/Contour_line (accessed on 2 March 2022).
  26. GB/T 17671, Test Method of Cement Mortar Strength (ISO Method), China. 1999. Available online: http://std.samr.gov.cn/gb/search/gbDetailed?id=71F772D798CCD3A7E05397BE0A0AB82A (accessed on 31 May 2021).
  27. Shi, Z. Effects of Triisopropanol Amine, Sodium Chloride and Limestone on the Compressive Strength and Hydration of Portland Cement. Constr. Build. Mater. 2016, 125, 210–218. [Google Scholar] [CrossRef]
  28. Kamoun, A.; Samet, B.; Bouaziz, J.; Châabouni, M. Application of a Rotatable Orthogonal Central Composite Design to the Optimization of the Formulation and Utilization of an Useful Plasticizer for Cement. Analusis 1999, 27, 91–96. [Google Scholar] [CrossRef]
  29. Tang, S.W.; Cai, X.H.; He, Z.; Shao, H.Y.; Li, Z.J.; Chen, E. Hydration Process of Fly Ash Blended Cement Pastes by Impedance Measurement. Constr. Build. Mater. 2016, 113, 939–950. [Google Scholar] [CrossRef]
  30. Zhu, J.; Li, Z.; Yang, R.; Zhang, Y. Organic Additive Implantation onto Cement Hydration Products. J. Wuhan Univ. Technol. Mater. Sci. Ed. 2014, 29, 527–533. [Google Scholar] [CrossRef]
Figure 1. Effect of each admixture on the compressive strength of mortars (the content of each admixture refers to the high level in Table 3).
Buildings 12 00422 g001
Figure 2. Pareto chart for the effectiveness of admixtures contributing to the strength development of mortars at different curing ages: (a) at 1 d, (b) at 3 d, (c) at 7 d, (d) at 28 d.
Buildings 12 00422 g002
Figure 3. Effect of CF and SS on the 1 d strength of cement mortars.
Buildings 12 00422 g003
Figure 4. Effect of CF, TIPA and SS on the 3 d strength of cement mortars: (a) CF vs. SS (no TIPA), (b) CF vs. SS (0.05% TIPA), (c) CF vs. TIPA, (d) SS vs. TIPA.
Buildings 12 00422 g004
Figure 5. Effect of CF and TEA on the 7 d strength of cement mortars.
Buildings 12 00422 g005
Figure 6. Effect of CF, TEA and SS on the 28 d strength of cement mortars: (a) SS vs. TEA (no CF), (b) SS vs. TEA (2% CF), (c) CF vs. TEA (no SS), (d) CF vs. TEA (2% SS), (e) CF vs. SS (2D contour plot), (f) CF vs. SS (3D contour plot).
Buildings 12 00422 g006aBuildings 12 00422 g006b
Table 1. The chemical composition of P.O 52.5R cement (wt.%).
CompoundCaOSiO2Al2O3Fe2O3MgOSO3Loss
wt.%65.7422.354.613.622.080.321.28
Table 2. Actual contents and coded numbers of admixtures.
AdmixtureSymbolLow LevelIntermediate LevelHigh Level
CodedActual (%)CodedActual (%)CodedActual (%)
CFx1−100112
TEAx200.0250.05
TIPAx300.0250.05
Na2SO4x4012
Table 3. The design matrix of CCFD and compressive strength of cement mortars.
Chemical Additives (Coded Number)Compressive Strengths (MPa)
Standard No.Run NoCF (x1)TEA (x1)TIPA (x1)SS (x1)1 d3 d7 d28 d
291000018.534.246.156.5
12−1−1−1−116.730.844.856.4
23−1−1−1119.634.943.049.0
154111−118.232.444.556.0
55−11−1−116.830.643.955.7
276000018.933.444.655.9
1271−11119.339.053.057.8
7811−1−118.232.046.556.5
179000−117.230.343.359.8
1010−1−11118.833.442.948.6
3011000019.231.043.554.8
2812000018.831.344.854.0
1613111119.236.443.554.0
1414−111118.931.337.844.2
81511−1119.236.044.253.7
1316−111−116.529.439.556.7
4171−1−1119.734.848.560.1
1918−100017.630.943.354.4
231900−1018.234.742.253.8
2620000018.432.442.556.7
3211−1−1−118.931.846.664.6
622−11−111933.536.747.8
2223010018.832.341.254.8
3124000018.631.343.454.3
21250−10018.231.041.458.4
1826000119.435.744.752.2
2027100019.135.446.859.8
928−1−11−116.929.240.758.9
2429001018.733.345.856.2
11301−11−118.335.344.864.4
2531000018.632.245.754.7
Table 4. ANOVA of the final CCFD models for compressive strength of mortars.
1 d Strength3 d Strength7 d Strength28 d Strength
TermCoef.tpTermCoef.tpTermCoef.tpTermCoef.tp
Const.16.830351.650Const.30.889153.040Const.41.728106.470Const.57.84242.450
x10.7726.860x10.7995.520x12.6067.370x13.04610.260
x41.15612.420x3−57.4−2.410.024x256.24.290x2−32.7−6.860
x1x4−0.3−4.110x41.8446.550x2x2−2336−2.680.013x4−4.609−11.080
x1x330.32.530.018 x1x41.2814.020
x1x2−49.8−3.90.001
LoF 0.199LoF 0.794LoF 0.5LoF 0.322
R2 88.99%R2 76.69%R2 74.75%R2 92.46%
Linear 0Linear 0Linear 0Linear 0
Square 0Square 0Square 0.013Square 0
Interaction 0Interaction 0.018Interaction 0Interaction 0
Publisher’s Note: MDPI stays neutral with regard to jurisdictional claims in published maps and institutional affiliations.

