Abstract
Metrics are instrumental in design assessments. Solar performance metrics help designers to evaluate solar access in cities. Metrics should be used early in the urban planning stages in order to enable sustainable urban development with greater access to solar energy. Currently, solar assessments at this design stage are limited in practice; established methods or routines are lacking, and so are suitable metrics. This paper reviews the relevant literature to provide a critical overview of solar metrics commonly used in building performance assessments. The review defines key metric formulation principles—valuation, time constraint, and normalisation—which should be considered when designing a performance indicator. A new taxonomy of solar performance metrics is provided. Metric definitions, suitability, and limitations are discussed. The findings highlight the need for reliable, low-complexity metrics and adequate methods for early solar assessments for urban planning.
1. Introduction
Sustainable buildings should employ solar strategies to reduce the use of primary energy and to produce renewable energy on site. The European directive 210/31/EU on energy performance of buildings [1] requires all new buildings to be nearly zero-energy buildings (nZEB)—namely, exhibiting high energy performance with increased contribution in locally sourced renewable energy. Adequate solar access in urban environments supports energy-efficient strategies which are instrumental in achieving nZEB [2]. Sunlight affects key aspects of the building performance—heating, cooling, lighting, and on-site energy production. Balancing the benefits (reduced energy use for heating and lighting, electricity generation) with adverse effects of sunlight (urban heat island, increased need for cooling) is a difficult task for architects and urban planners [3].
Decisions made in the early stages of building life are most impactful [4]. Solar access is defined at the level of urban planning when street layouts and building masses are shaped. At this design stage, often called massing [5], the building form and spatial layout constitute the only design variables [6], since there is limited knowledge about more sophisticated building properties, while the climate and built context are given. Hence, the task of planning new neighbourhoods with high performance and quality objectives meets several challenges, among which appropriate assessment methods and informed selection of suitable metrics are imperative [7,8,9,10].
Several metrics and performance indicators exist to quantify, describe, and assess an urban design, but there is no consensus yet as to which metrics are the most appropriate in solar access evaluations and which could be used as performance indicators in the urban planning stages. Furthermore, the metrics and respective thresholds applied in legislation seem inconsistent [11]. In Europe, there is no standard dedicated to solar access in urban planning; the daylighting provisions included in the EN 17037 standard [12] are the closest yet to solar access stipulation, but they focus primarily on the conditions indoors, hence require more advanced design inputs, which are unknown at the urban planning stage. At this level, little is known about the floor layouts of buildings, thus the European daylighting standard appears inadequate for early design phases. Nault et al. [13] conducted the first comprehensive review of early design evaluation metrics and indicated that there is a need to further explore the potential of simple and computationally light metrics as performance indicators. Because of limited expertise and high computational load, solar design assessments are sporadically performed in the urban planning practice [14,15]. Thus, many researchers have advocated easy, efficient, and comprehensible evaluation metrics for the early planning stages; metrics that must prove adequate for the size of urban area and the limited level of detail with few established design parameters [13,16,17,18].
This paper presents an overview and a critical assessment of solar design metrics for urban planning applications. A new taxonomy of solar urban design metrics is proposed. It can assist practitioners and researchers in the selection of metrics for solar design assessments.
The goal of this review is to systemise the knowledge on how metrics can be constructed, formulated, and presented to effectively communicate design evaluation results. Metrics which are formulated in a systematic way and whose relation to the performance is validated might ultimately become performance indicators.
This review stands as a part of a larger research on solar access in neighbourhoods. International experts of the International Energy Agency (IEA) Solar Heating and Cooling (SHC) Task 63 “Solar Neighbourhood Planning” [10] collaborate with local urban planners in effort to find suitable solar design methods. The main goal of this review is to compile the state-of-the-art knowledge on metrics used in solar assessments of urban designs. The present paper focuses predominantly on metrics used in the northern latitudes, while the wider research targets the local Swedish context.
2. Method
A review of literature was conducted using an integrative narrative-based approach [19]. Scopus was the selected database for citation searches as it contains an extensive catalogue of indexed peer-reviewed publications and provides a broad coverage in relevant disciplines [20].
The search keywords and concepts used in citation searching are presented in Table 1. Each concept consists of synonymous keywords. Initially, a narrow search, aiming for low recall and high precision, was conducted to find the most relevant publications that could be used and to help further formulate a more complete search query. It included only the underlined keywords from concepts 1 and 2 from Table 1. Then, a refined search query was developed using relevant keywords and synonyms forming concepts 1–3, which were based on the reviewed citations retrieved by the initial search. The first listed word in each concept is the main keyword for that concept, and the rest are inclusive synonyms, which were added to the string with a Boolean operator ‘OR’. The query excluded ‘power plant’ to cull articles related to large scale energy generation. The search was limited to peer-reviewed journal articles and returned the total of 135 documents of which 40% were deemed relevant. Papers focusing on the following areas were excluded: (i) systems and technologies; (ii) materials and/or building components; (iii) driven by country-specific regulations; (iv) aspects other than solar access and solar performance, for instance, socioeconomic issues.

Table 1.
Concepts and keywords that were used in a citation search query string in Scopus. The first item of each concept (in bold) is the main keyword, followed by its synonyms and similar keywords. The underlined keywords were used in the initial database scoping.
The final collection of articles for the review included shortlisted publications from the conducted database searches supplemented by additional selection of relevant articles found through backwards and forwards citation searching. The starting point was the shortlisted article collection, and the citation library grew in a snowballing process. Furthermore, in order to place the review of metrics for urban solar assessments into a legislative context, examples of regulations for solar access in urban planning focussing on the Swedish context are also discussed in this paper. For this purpose, additional information available in grey literature and legislative documents was retrieved by direct searches via a web browser search engine.
3. Results
The first three subsections (Section 3.1. Use of metrics; Section 3.2. Formulation of metrics; Section 3.3. Taxonomy) consist of a general overview on the construction and types of metrics for design assessment purposes. The fourth subsection (Section 3.4) presents a more detailed report on the types of metrics used for assessing urban designs. Several metrics were further discussed to review their suitability, and validity.
3.1. Use of Metrics
Metrics can be classified in respect to their functions, presentation methods, and characteristics (Figure 1).
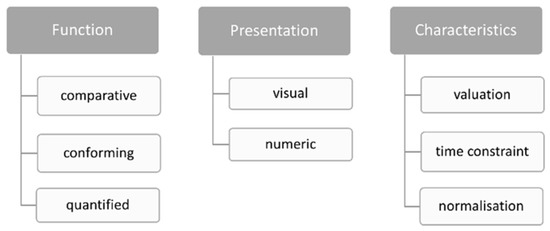
Figure 1.
Identification of metric functions, presentation methods, and characteristics.
Metrics were found to fulfil one of three functions, which are here categorised as:
- Comparative;
- Conforming;
- Quantified.
The comparative function is used to evaluate multiple design proposals aiming to find the option with the best score of a selected metric. Comparative metrics can benefit from normalisation, as this enables fair numeric comparisons between different designs and projects. For instance, a radiation total can be divided over the usable building floor area to provide a normalised value and a comparative function.
The conforming function requires that a metric of a given design meets a certain threshold; for that, it is not only crucial to know which metrics can be used to assess a neighbourhood design, but also what benchmarks should be applied to reach certain solar performance criteria. Conforming function may be obtained by using performance benchmarks, which pertain to, e.g., the economic feasibility of a solution. An example of that can be a planned implementation of active solar systems on building surfaces. Surfaces that receive less radiation than a given feasibility threshold would be rejected. Such a metric would typically be expressed as area quantity or a fraction of the total area.
Lastly, the quantified function may be used when it is imperative to know the absolute value of simulated parameters, for example, the total roof irradiation for a photovoltaic (PV) system. For a quantified function, the metric might be given as a total incident radiation for a given analysed surface.
Furthermore, we identify two distinct ways of presentation that are frequently used to convey the results of metric-based analyses (Figure 1):
- Visual;
- Numeric.
In visual assessments, the results are typically communicated using some graphical aids. Examples could be printouts with spatial grid-based images containing model geometry with resulting metrics presented in a numeric form or as a coloured hatch. Such visualisations usually include a legend and a suitable colour scheme. The respective 3D model must be presented in a carefully chosen view; for instance, top view may be good for showing results on the ground surface, but a perspective view may be suitable to display facades. In the numeric method, the design receives one number for a given metric or indicator. Floor Area Ratio (FAR) is an example of a purely numeric indicator because it provides a single record for a given design variant, and the results cannot be presented spatially. The opposite example of a purely visual metric is the sun path diagram [21]. Yet, most metrics can be presented using either of these methods. The advantages of the visual assessment method include better spatial understanding of the solar access potential and the ability to spot critical areas that may need improvement. On the other hand, a numeric analysis can be advantageous as it is easier to apply design criteria thresholds and to compare different designs. However, potential numerical metrics for early design urban planning must prove to be valid predictors of solar access for the final design, which is currently not the case [13,22,23].
3.2. Formulation of Metrics
The characteristics of metrics identified in Figure 1 are further explored in this section (Figure 2). Metrics are characterised by the way in which they are valuated, which time constraint is considered in calculations, and which method of normalisation that is used, if any. The metric characteristics should thus be viewed as prescribed metric formulation principles. A non-exhaustive list of examples of the metric characteristics can be found in Figure 2. One or more characteristics can be relevant, e.g., valuation can be based on the mean value principle and also be given a criterion threshold.
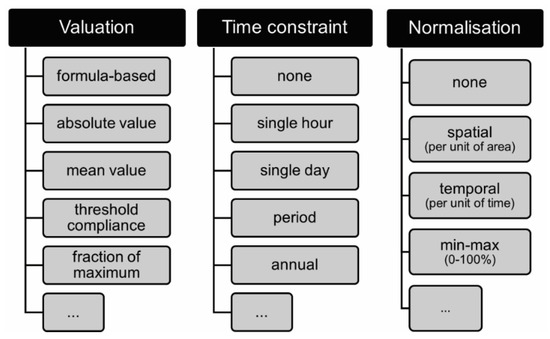
Figure 2.
The three metric characteristics that should constitute the metric formulation principles, including commonly found examples.
A design metric is not just simply a result of steady-state calculations or time-based simulations; it is rather created based on the resulting data and by informed decisions, applying the aforementioned formulation principles that are shown in Figure 2. In that sense, there may be many metrics that convey the same information but in different ways.
For example, data received from an annual solar radiation simulation on building surfaces typically consists of a list of cumulative radiation values—one for each grid point—which is given in kWh per square meter surface area of the analysed geometry (Figure 3A), and which can be presented in a visual form (Figure 3B). The first choice concerns the time constraint, and sometimes it must be made even before the simulation begins. The simulation in this example (Figure 3) returned cumulative values for the entire simulation year, so the preselected time constraint was set to annual. However, the simulation could have been set to return cumulative values for only a selected period of time, or it could return a list of hourly irradiation values for every hour of the analysis period per each analysis grid point. The next choice is related to the post-processing of the data. In order to quantify surface irradiation with a metric, depending on the purpose of the analysis, i.e., what kind of information the metric is intended to convey, it may be desired to formulate the result as a mean value for the whole analysed geometry given in kWh/m2 [24] as shown in Figure 3C; or as a total, using for instance a special formula with a variety of assigned design factors or reduction factors [25], as shown in Figure 3D. Formulas, such as the one in the example, may be used to compensate for a low level of detail in the model and to provide a more accurate result. As a matter of fact, a metric based on radiation simulations does not necessarily need to have an energy unit. For instance, performance thresholds can be applied to consider only the parts of a surface that receive the desired amount of radiation [26]. A numeric metric can thus be formulated as a percentage of the entire surface area that meets or exceeds an irradiation threshold cumulatively over one year, or visualised using the model, as seen in Figure 3E. In such a case, the metric valuation is based on threshold compliance, with min-max normalisation applied to the area, and the time constraint of the whole simulation year.
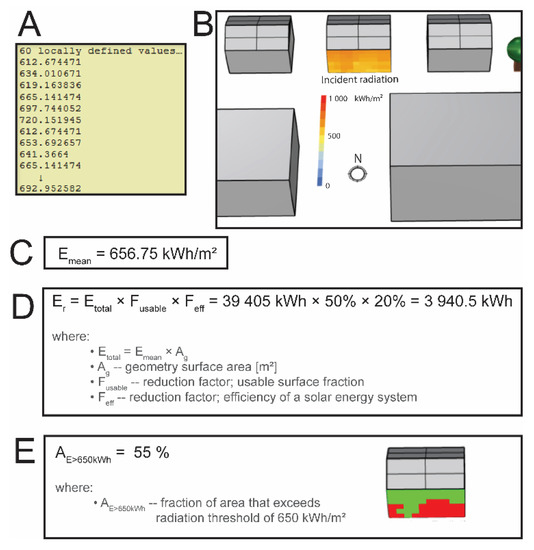
Figure 3.
Example of creating different metrics from the same annual solar radiation simulation data. The model was drawn in Rhinoceros [27], and the simulation was performed with Ladybug 1.3.0 [28]. (A) list of values for every analysis grid point resulting from the annual solar radiation computation; (B) visual presentation of solar radiation metric; (C) radiation metric computed as an average; (D) radiation metric based on a formula; (E) normalised radiation metric based on threshold compliance.
Using the principles of metric formulation in a purposeful way can ensure effective communication of analysis results. Metrics must have the ability to capture the quality and performance potential of a design, but they also have a certain design assessment function: comparative, conforming, or quantifying. The way a metric is constructed, using the formulation principles of valuation, time constraint, and normalisation, must match the intended communicative function of the metric. For example, average values and spatial normalisation methods enable straightforward comparisons between different designs and projects, whereas the metric valuation and normalisation method presented in Figure 3E is appropriate for the conforming function. The quantifying function, on the other hand, is often used as a purely technical outcome that may help to calculate system performance, but it does not directly communicate design quality. The selection of time constraint usually concerns the kind of design consequence the metric is supposed to communicate. For example, a common strategy is to use a reference day or a period that can help assess the yearly extremes, e.g., solstices. Annual metrics are usually adopted to provide an overall view on the solar performance using a typical meteorological year [29].
3.3. Taxonomy
When an evaluation metric is acknowledged and validated in terms of its good correlation to the performance, it becomes a performance indicator. Some metrics may be used to merely characterise a design, for example, FAR which communicates built density of a design. However, the metric must prove that it corelates well with the performance goal (for example, high façade irradiation) to become a performance indicator. Usually, it is the higher complexity metrics, such as a climate-based heating demand, which are used as performance indicators. The simpler metrics lack validation to be recognised as performance indicators because their use comes with higher risk of uncertainty and inaccuracy [13]. Studies about energy systems in district applications tend to use key performance indicators (KPIs) to evaluate and select best system proposals [30,31]. In a study of open spaces in cities, the mean ground sky view factor (SVF) was applied as an environmental performance indicator [32]. Another study looked at implications of urban density and used façade area with sky exposure factor between 20% and 40% as a performance indicator which was normalised by gross floor area [33]. Chen and Norford [6] used five performance indicators, including solar, ventilation, and connectivity potential. All five performance indicators were normalised by the gross floor area of the massing designs. Another optimisation study considering energy and daylight performance of neighbourhood typologies used load match index and spatial daylight autonomy as performance indicators and applied respective benchmarks in design evaluations [34]. Previous applications show that metrics used as performance indicators are typically formulated using a normalisation technique and valuated based on performance thresholds.
Building on a previous review by Nault et al. [13] and considering the complexity of data inputs, four main classes of metrics are identified:
- Geometrical (G);
- Latitudinal (L);
- External climatic (EC);
- Internal climatic (IC).
From the conducted literature review on metrics used in urban planning assessments and critical analysis thereof, the most common solar performance metrics were identified and grouped into metric categories. The results are presented in Table 2.
Table 2.
Taxonomy of metrics in solar urban design. Metrics were divided in classes: G, L, EC, and IC. Each class consists of metric groups (underlined) and includes a few commonly used metrics that are further discussed in this paper. Other metrics exist but are used less frequently.
Groups of metrics were developed based on metric input information such as the simulation type and other parametrical similarities of the metrics, whereas the classes distinction (i.e., the four main metric categories) was based on the overall complexity of the site and climate input information. Site and climate inputs indicate information such as building geometry details, location, sun path, annual solar radiation, and other specific climate-related factors. Each higher metric class builds on information input of the previous class; thus, the complexity increases.
Typically, the level of detail of the modelled geometry would have to increase for the higher complexity metric classes, but there are exceptions. For example, daylight factor (DF) is a relatively simple G metric that does not need climate nor location information; however, it requires high level of detail in modelling of the façade and window elements, and of the interior spaces, including the information about surface reflectance [35]. Conversely, energy use can be simulated for a very basic geometry model, as many inputs are typically simplified anyway [36]. In this case, the geometry level of detail does not need to be sophisticated, but there is an added input complexity in the additional operational information that is required, including operational schedules and internal loads.
3.4. Description and Critical Analysis of Selected Metrics
In this section, selected metrics of the four classes (see Table 1), which were frequently used in research according to the conducted literature review, are presented and discussed.
3.4.1. Geometrical Metrics
G metrics are calculated using information about the urban and site layout and form, without any location-specific information such as latitude or climate. They are sun-less, meaning they do not account for insolation, radiation, or local sunpath; hence, they have been used for a variety of urban design purposes and not only for solar access analysis. G metrics are, furthermore, isotropic, which means that for a given design they will remain the same regardless of orientation and geographical location. Consequently, the time constraint attribute does not apply to these metrics.
Some G metrics, such as VSC, SVF, or DF, have been grouped as ‘View of the sky dome’ metrics (see Table 2) because their calculations are based on the spatial relation of the geometry to the open sky, and for that, they use a digital model of a standardised sky dome. The sky dome is divided into several sky patches, the number of which depends on the selected sky density. The commonly used sky subdivisions are the low resolution Tregenza sky [37] and higher resolution divisions based on the continuous sky concept [35] including the Reinhart model [38]. The division of the sky dome enables time-efficient simulations. VSC and DF metrics use the standard CIE overcast sky [39]. The luminance distribution of the standard CIE overcast sky model is such that the zenith sky patch gives three times the illuminance level at the horizon [40]; this sky represents the worst-case scenario, and it is hardly found in reality. The SVF metric uses a special weighing function for sky patches instead of the overcast sky model and assigns more weight to sky patches closer to the zenith, according to the projection of the sky view onto a plane [41]. The weights of the sky patches for SVF calculations are isotropic but change with altitude.
The European daylighting standard (EN 17037) states three-fold compliance criteria for levels of view out quality, one of which is associated with morphological spacing and massing, namely the outside distance of view [12]. In a dense urban setting, neighbouring buildings might restrict the view distance from a window. The standard recommends three view distance thresholds: 6 m for minimum, 20 m for maximum, and 50 m for high view out level. This morphological constraint can be applied in the urban planning stages, and although it is not strictly a metric, it can be viewed as an important geometrical restriction that should be considered early in the design. The remaining two criteria, however, come at later stages of the design process, as they refer to the layers of the view and the view width which are inherently reliant on the exact window placement and room layout.
- FAR
Floor Area Ratio (FAR), illustrated in Figure 4a, is a G metric expressing compactness or urban density as a ratio of gross floor area of buildings to their site area [42]. It has also been called floor space index [43] or plot ratio [44]. It has been widely used as a measure of density in various urban studies [26,33,34,45,46,47]. Figure 4b displays some possible variations in building shape and height for two example values of FAR.
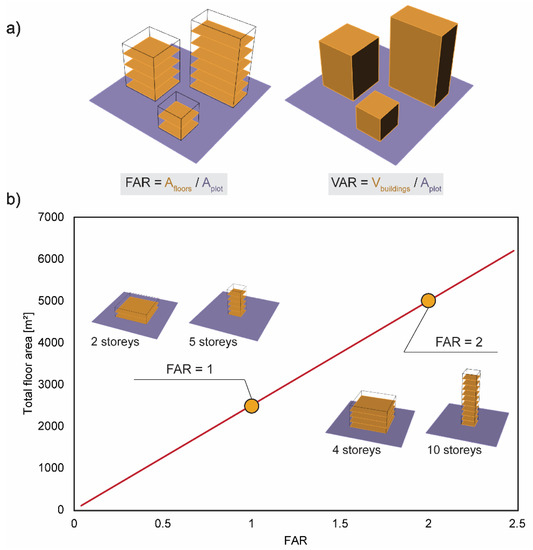
Figure 4.
(a) Visualization of two twin morphological metrics, FAR and VAR, and their calculation methods. (b) Relationship between FAR and total floor area for an assumed plot size 50 × 50 m2. The graph contains examples of single building forms that can be created on the plot to abide by FAR equal to 1 and 2.
Many studies investigated FAR performance correlations. The relationship of FAR to daylight penetration in neighbourhoods was found to be strongly negative in respect to vertical daylight factor, also known as vertical sky component (VSC) [48]. Due to possible variations in site coverage and building heights and forms, the same FAR of multiples designs received different level of solar availability, varying up to 30% [49], which may indicate that FAR is not a good standalone metric to be used as a performance indicator. There is, however, an indication of strong correlation between FAR and solar potential [24]. FAR has also been widely used in studies about microclimate [50,51,52]. It has been seen to correlate well with food self-sufficiency measures in cities [44]. In urban planning practice, there are some cities that use FAR as a control variable to regulate maximum density and prevent congestion [53,54]. The relevance of FAR in performance assessments has been acknowledged in research, which implies a good potential for future application, possibly in conjunction with other metrics.
- VAR
Volume Area Ratio (VAR) is a morphological G metric that is very similar to FAR. It is a ratio of the volume of buildings to the site area (Figure 4a). The VAR metric has also been known as a built urban density measure [16,55,56]. Studies showed that VAR has good association with indoor daylight availability [56], and that it correlates with irradiation levels on facades [55]. Morganti et al. demonstrated that VAR correlated with solar performance, understood as cloudless annual irradiation of facades, with level of R2 = 0.53 [43]. There is an indication that the VAR metric has a promising potential as an early-stage design indicator in urban assessments [24]. Its function as a control value or density recommendation is still debatable, because if we assume a fixed VAR but modify other morphological parameters (i.e., shape), a better solar performance can be achieved [55]. Its potential use in conjunction with other metrics should be further investigated.
- S/V ratio
Surface-to volume (S/V) ratio has been used in research as a measure of building compactness [57,58,59]. It may also be called building aspect ratio [43]. The metric was originally introduced as an inverse (V/S) [60]. Example values of the metric can be found in Figure 5. For high compactness levels, smaller values of the metric are desired, while large values express low compactness. The S/V ratio metric showed low correlation with PV-generated electricity from building envelope and with energy use [18]. A common implication of the S/V ratio metric for the building design performance is the reduced heat loss from the building envelope the higher the compactness. However, the S/V ratio is never used as a lone performance indicator, because if the sole design objective would be to maximise compactness, then a significant loss of daylight and sunlight indoors would occur [59]. It can be seen in Figure 5 that bigger volumes with larger edge dimensions yield lower S/V values, i.e., higher compactness, as the centre of gravity of the forms moves further away from their external boundaries.
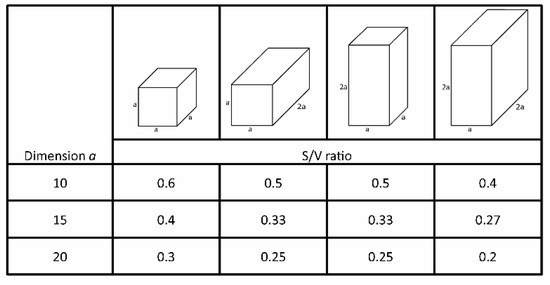
Figure 5.
Exemplary values of surface to volume (S/V) ratio for different building shapes and sizes.
Ratti et al. [59] advocated the use of a passive to non-passive zone ratio instead of the S/V ratio, where a passive zone is the floor area immediately next to the external building perimeter, equal (in buffer thickness) to twice the ceiling height; and the non-passive zone is the remaining inner floor area of the building. A passive zone is assumed to have a possibility to be passively daylit and ventilated, making it more energy efficient. The proposed zone ratio remains in conflict with the compactness advantage as understood by the S/V ratio metric.
As demonstrated, building compactness in terms of S/V ratio may not be effective in urban planning studies. Instead, what might be interesting, especially in terms of solar access optimisation, could be to look at the relation between the exposed surface area and site area, following the concept of FAR and VAR metrics. Chiatzipoulka et al. [55] used a metric called ‘complexity’, which expressed the ratio of total façade surface area to the gross site area. It was shown to have a negative impact on solar availability. However, it should be noted that the metric representing solar availability lacked normalisation per used floor area, and because of that, the effect might have been inflated. Suitable morphological metrics involving external surface area should be further explored as they can potentially bring valuable of information to the early-stage urban design assessments.
- H/W ratio
Building height to open space width (H/W) ratio [46,61] or its inverse [57] have been used in studies of urban form, particularly of urban canyon, and its influence on energy consumption and/or solar potential. It can also be called aspect ratio, for instance, when it refers to courtyard spaces [62]. It is a widely used metric in courtyard microclimate studies [63,64,65]. Notably, the studies focussing on microclimate advocate for higher H/W [65], whereas those that looked at façade solar potential support lower values for increased solar access [46]. Evidently, there is a conflict between the two objectives. The H/W metric has been also linked with indoor daylighting; DeKay [54] demonstrated a relationship between the H/W metric and DF which suggested that the H/W ratio of 0.6 can lead to a mean DF of 3%, and H/W = 1.5 gives a DF average of 1%. However, the findings were limited to urban canyon design typologies and certain test room dimensions. While the H/W metric is easily applied in studies of courtyard and street canyons, it has lower applicability in studies of hybrid and more complex urban districts. It is because the metric is only two-dimensional and assumes that the buildings are of the same height. It may be sufficient for analysis of a single building, but it falls short in application in larger neighbourhoods.
- OSR
Open Space Ratio (OSR) is a G metric that expresses a ratio of site open space area (excluding footprints) to gross floor area [66]. OSR has been seen in urban morphology research investigating the impact of urban typology on solar potential [67], energy use [26], and microclimate [50]. This metric could be a relevant substitute for H/W ratio metric in urban studies of larger areas, as it combines the ratio of outside area and building morphology, and is three-dimensional. It has also an added meaning; in residential neighbourhood analysis, it communicates how much of outdoor public space is available for residents and occupants per unit of indoor floor area.
- SVF
Sky View Factor (SVF) measures, at a given point on a horizontal surface, the ‘fraction of the overlying hemisphere occupied by sky’ [68]. An open flat field has a SVF equal to 100%. SVF can be obtained using simulation software where the hemisphere or the sky dome is usually divided into a number of sky patches. There are a few methods of calculating the SVF, assuming different weights of the sky patches [41,69]. A common method is the cosine-weighted SVF definition [33], in which the sky patches closer to the zenith have more weight than those closer to the horizon.
Studies have indicated relevance of SVF in urban design evaluations. A correlation of R2 = 0.79 to solar availability on facades was demonstrated in a study which simulated solar radiation assuming cloudless annual conditions [43]. Findings from another study concurred that SVF correlates well with solar irradiation of facades, especially considering only the diffuse solar radiation component that showed a nearly perfectly linear correlation to SVF [16]. Furthermore, SVF has shown to have a significant effect on urban microclimate and has been closely associated with urban heat intensity (UHI) [70,71,72]. In fact, the SVF metric originated from urban climatology studies [68]. The connection of SVF to daylight, sunlight, and microclimate is evident, which suggests that it has a high potential for urban planning applications. For the metric to become a reliable indicator of urban design performance, further investigation into SVF and suitable benchmarks is necessary.
- VSC
Vertical Sky Component (VSC) is a simple G metric that is calculated for a vertical façade surface and is used to predict the daylight penetration indoors, without having to introduce information about the interior layout and properties. It is calculated at a single point on a façade as a ratio of illuminance that arrives at the given point to the total illuminance received by an unobstructed horizontal surface, assuming the CIE overcast sky conditions and no reflections [73].
Good correlation between VSC and DF has been demonstrated [74]. VSC is given as a predictor of daylight in Building Research Establishment (BRE) daylighting guide [73]. Bournas [56] studied VSC among some geometric attributes that may affect indoor daylighting scores and found that VSC had a significant effect on compliance to the reviewed daylighting criteria. The correlation between VSC and DF is perhaps unsurprising since both metrics are in fact geometry-based; they both use the CIE overcast sky model, except that VSC measure stops at the façade level and thus does not account for window properties and internal layout. Due to the lack of model complexity required, VSC could be a prospective choice for early design assessments with focus on daylighting.
- DF
Daylight factor (DF) is a measure that expresses a ratio of illuminance at a point located on a horizontal plane indoors to the total illuminance of an unobstructed horizontal plane located outside, assuming the CIE overcast sky [75]. When it forms a metric, it is often presented as an average DF per room, or as a point value for a standardised control point location within a room [76]. Both metrics (average DF and point DF) require knowledge about window placement on facades, window properties (e.g., transmittance), internal layout (room boundaries), and surface reflectances. Although site and climate inputs for the DF metric calculation are relatively simple, the complexity of aforementioned input information, which is typically unknown in the urban planning stages, implies that the metric might not be suitable for early design assessments. A relevant substitute metric for the early-stage assessments might be the VSC metric, as it was seen to correlate well with DF [56,74].
3.4.2. Latitudinal Metrics
L metrics are created from the information about the site geometry and the position of the sun in the sky due to the latitude location, and thus, they typically reflect the solar access aspects of a design. Building orientation matters for L metrics, and it is imperative for passive solar design [77]. The metrics remain relatively simple, as clouds and radiation are neglected. The calculation is based on the spatial relation between urban geometry and solar vectors, which represent the direction of the solar rays when the sun is up, assuming a theoretical cloudless sky condition. The analysis checks if selected sun vectors are intercepted by an obstruction before they reach a given point in the analysed geometry grid. Solar vectors are calculated based on a geographical reference. The conditions governing sun positions and sun vectors are perpetual; this type of information is not subject to temporal modifications or external influence, e.g., climate change.
Calculating solar access in a 3D modelling space has multiple analysis purposes. The simulation of direct sunlight hours group of L metrics can be used to determine building masses with the solar envelope method [78,79]. It has been used in estimation of solar energy potential [80]. Architects often use point-in-time shadow plots to visually assess shadowing and solar access of an urban area [4].
The time constraint of L metrics is usually either a certain period or a selected reference date. According to the BRE guide, the so-called ‘shadow plots’, which can result from L metric calculations, should be performed for 21 March—spring equinox [73]. Equinoxes are special in a way that the daytime duration is the same everywhere on Earth (12 h), which makes this reference date suitable for design comparisons across the globe. Equinoxes also give an averaged solar access information for a given location, as the date falls exactly in between the two winter and summer extremes: the solstices. However, 8 February, 21 February, and 21 December have also been used as standard reference dates in previous research [81]. Some of these dates also appear in many of the present solar access regulations [11].
- Shading mask
Shading mask is a visual type of metric that is presented on a stereographic projection of a sky dome and the local sunpath—commonly known as the sunpath diagram [82]. Shading mask is drawn for a single point looking upward. The sky dome projection is shaded by surrounding obstructions, which are projected onto the image in a fisheye perspective. Thus, shading masks have also been known as fisheye catchments [83]. They can be either generated using a computer 3D model or captured directly on site. The sunpath lines that are covered by obstructions in a shading mask image represent the times in a year when solar access to the analysis point is restricted. This method is commonly used to display shading of a single point located on the ground or on the façade [12,21].
The shading mask metric is advantageous in being able to display shading over the entire year, but the downside is that it is carried out only for a single point. Multiple shading masks for different points on an analysis surface can be combined into a single multishading mask [84,85], which provides the benefit of assessing shading of the whole area in the whole year. It indicates which times of the year the space can be overlit or overshaded and is computed by superimposing shading masks taken from many points on the analysis grid.
Stereographic sunpath projections have also been used as sunlight availability protractors [82,86]. They display probabilities of sunshine marked on the sunpath as average sunlight duration. However, because the metric provides probability of sun shining at certain times in a year, it involves climate-dependent data and therefore, should be considered an EC metric.
- APS
Area of Permanent Shadow (APS) is a metric that was first introduced in an older version of the BRE guide: ‘Site layout planning for daylight and sunlight: a guide to good practice’ [87]. The recommendation stated the following ‘It is suggested that, for it to appear adequately sunlit throughout the year, no more than two-fifths and preferably no more than a quarter of any garden or amenity area should be prevented by buildings from receiving any sun at all on 21 March’. Naturally, the term ‘permanent’ refers to areas that are completely shaded during the entire winter season (from equinox to equinox). It proved problematic in application because points which receive only minutes of sunlight can still comply, yet are not sufficiently sunlit. Therefore, the recommendation was removed from the following and latest version of the guide, and instead of APS, BRE now suggests using a threshold of two hours of direct sunlight on ground (see ‘Two-hour area’).
An example analysis of the APS metric in an enclosed square courtyard ground surface (Figure 5) reveals an intrinsic relationship: for a given building geometry, the value assumed by the metric is different depending on the orientation of the courtyard building, and follows an exponential function shown in Figure 6, as APS45° = (APS0°)2. It occurs because solar access to a courtyard, which is here expressed by APS area, is dictated by the highest position of the sun on the reference day, i.e., solar altitude at noon. Concurrently, it was found that the orientation of the same courtyard geometry does not affect cumulative solar radiation received by the facades of the courtyard. It is, therefore, indeed questionable whether the metric is adequate for quantifying solar access. Moreover, the metric has not been found in scientific literature.
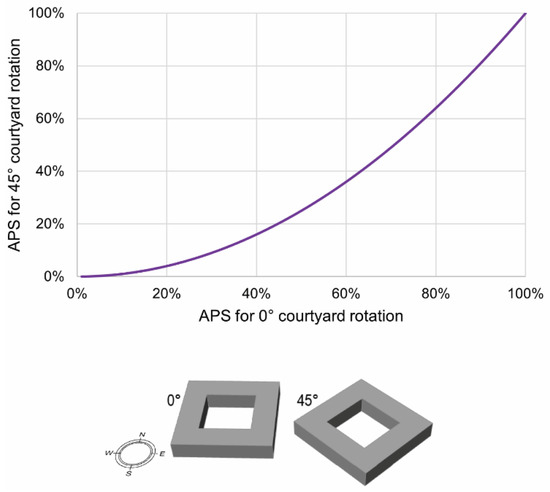
Figure 6.
The graph presents a universal relationship between the values of the area of permanent shadow (APS) metric depending on the orientation of a square closed building courtyard. The 0° orientation has facades facing the cardinal directions.
- Two-hour area (ground)
The latest edition of the BRE guide ‘Site layout planning for daylight and sunlight: a guide to good practice’ recommends that ‘at least half of a garden or amenity area should receive at least two hours of sunlight on 21 March’ [73]. The metric is based on threshold compliance, and the results are normalised by min-max fraction of the analysis area that complies. BRE advise to draw a two-hour sun contour on the analysed surface for further visual examination. The metric is based on a single reference day, the spring equinox, which consists of twelve sun vectors in an hourly-based computer simulation. The metric has not been found in scientific literature. In general, little attention has been paid so far to the evaluation of cloudless direct sunlight access on ground surfaces.
- Sunlight exposure (façade)
Façade sunlight exposure quantifies the connectedness of building apertures to the sunpath, and when formulated into a metric, it may, for example, express information about the proportion of the façade area that receives certain duration of cloudless direct sunlight on an approved reference day. Such a measure is used in the Swedish and European daylighting standard SS EN 17037 [12] under the recommendation for exposure to sunlight in dwellings. The stipulation reads that at least one habitable room in a dwelling should receive a minimum of 1.5 h of direct sunlight (assuming cloudless sky) on any one date between 1 February and 21 March. It suggests that the European authorities issuing the directive considered sunlight important for ensuring pleasant indoor quality of dwellings.
Indeed, there are multiple benefits of sunlight, including positive impact on health [88], wellbeing [89,90], and hygiene [91]. Residents have indicated therapeutic benefits of sunlight as the most liked effects of sunlight [92].
There are also adverse effects of sunlight to consider, namely glare and overheating [93]. Negative effects of sunlight indoors can be accounted for by the metric called Annual Sunlight Exposure [94], which expresses a percentage of analysed indoor area that receives over 1000 lux for more than 250 h in a simulation year. However, ASE is rather an IC metric as it involves full climate-based annual simulations and requires internal modelling and thus is less suitable for urban planning purposes (see Section 3.4.4).
3.4.3. External Climatic Metrics
Adding on to the information about the geometry and location, EC metrics also use information provided in a local weather data file. It is typically carried out in a simple and selective way, hence their distinction from more advanced IC metrics that often use multiple weather parameters at a time. EC metrics are also limited to external assessment of surfaces and conditions, whereas the IC metrics describe the performance from a more complex indoor perspective. EC metrics assume simplified weather data, boiling it down to a model or to an equation, whereas IC metrics use a time-based (typically hourly) simulation. Thus, the computations of IC metrics are much more sophisticated and require late design variables, such as system schedules or material properties. Furthermore, weather parameters used for EC metrics can be translated into simple climate models, e.g., a cumulative radiance sky model, where every patch of the sky dome is assigned a cumulative radiance value from a given period of time [95]. Weather parameters can be also used in a static formula, like in the calculation of maximum urban heat island (UHI) temperatures [96].
- APSH
Annual Probable Sunlight Hours (APSH) is a metric used to evaluate the sunlight availability of a façade surface at a single point. It was used in the BRE guide [73] and the British code of practice [97]. APSH checks for availability of sunlight considering the average cloudiness of the local climate. The 1999 BRE guide [98] introduced a graphical method of calculating the APSH involving the use of sunlight availability indicators. An indicator was marked with 100 points, each representing 1% of annual probable sun. The sunshine duration values could be obtained from a reference book [99]. Calculation and graphical interpretation methods were introduced. The number of unobstructed dots on the sunlight indicator make up the percentage score for the APSH metric. The method of calculating and plotting the sunlight availability indicator was originally manual; however, an automated APSH calculation method has been developed as a plugin for SketchUp [100]. The British code [97] recommends that a window surface receives at least a quarter of all APSH, and that at least 5% fall on the geometry during the winter months (21/9–21/3).
- UHI
Urban heat intensity (UHI) is a metric that pertains to the unwanted effect of abundant sunlight access and overheating of urban spaces (known as the urban heat island effect). The UHI equation (Equation (1)) derived by Theeuwes et al. [96] calculates the severity of temperature increase in an urban space in relation to the rural area with a zero-level increase using (i) view of the sky dome G-metric—SVF, (ii) vegetation coverage of the area—veg, (iii) selected weather parameters—Mrural. The meteorological rural weather variable (Mrural) is calculated using parameters from a simulation weather data file: wind velocity, solar radiation, and air temperature.
UHImax = Mrural × (2 − SVF − veg)
In the UHI equation, only SVF and vegetation coverage can be modified by means of design, as site-specific climate cannot be altered. SVF accounts for the ability of an area to undergo radiative cooling, and it can only really be manipulated in the planning (massing) stages of new developments. Vegetation coverage is equally important in heat dissipation of urban spaces because of the cooling benefit in transpiration of foliage. Unlike SVF, vegetation fraction of an area can be increased at a later stage of development, for instance by dedicating more urban spaces to greenery or by turning regular roof finishes into green roofs.
Urban microclimate is affected by urban heat island effect, which can be exacerbated by urban morphology. Microclimate analysis using simulations can be complicated and time-consuming. The UHI metric enables a quick and simple method to assess overheating issues in an urban area and to perform initial design assessments.
- Solar irradiation
Irradiance appears to be the most common type of information used to quantify solar access in built environments. It has been widely used in solar potential research [25,83,101,102,103] and in validations of other simpler metrics [16,24,45,55]. It is a reliable measure of solar potential because it connects to real time-based climate; yet it does not require complex simulations nor is it computationally intensive. The computation ceases at the external surface layer of the built environment, therefore in the taxonomy (Table 2), irradiation-based metrics fall under the EC metric class.
Irradiance is a measure of solar radiation flux coming directly from the sun beams and indirectly as diffused light on the sky dome. It is implemented in solar radiation simulations using solar information from a weather data file. When a surface is exposed to irradiance over a period of time, then the geometry receives certain amount of irradiation. Prior to simulations of surface irradiation, a computer-based sky model must be generated. It contains either hourly or cumulative period-based values of irradiance (W/m2) or radiation (J/m2), which are then used to compute the solar radiation amount that reaches a given analysis point in a 3D model. Cumulative radiative sky models contain for each of the sky dome points (sky patches) an aggregate solar radiation energy value for the entire analysis period. The use of such models in simulations can save computational power and reduce simulation time. Furthermore, it is imperative to set a desired level of computational accuracy for modelling and for radiance simulations. It is done by adjusting various simulation settings such as sky model division, number of ambient bounces, or surface grid resolution. Normally, the models are created from climate data which includes realistic values with a mix of sunny, intermediate, and cloudy skies. However, it is possible to assume artificial sky conditions such as the cloudless sky [43]. Though, a metric based on such initial conditions would be closer in principle to the G- or L-metric class.
Metrics formulated from solar radiation simulations have a good suitability and usability in evaluations driven by solar design objectives, as irradiation is directly linked to solar performance aspects. This is especially true in the case of estimating solar energy potential for on-site electricity generation [104,105]. For this purpose, performance thresholds are often used, which have to do with financial feasibility aspects of solar installations. Commonly used target values for annual irradiation are 600 kWh/m2 [16,106] or 800 kWh/m2 [13,17,24] for facades, and 1000 kWh/m2 [17,24,34,107] for roofs. The benchmark values tend to be lower for solar thermal applications [13,17]. Furthermore, reduction factors can be applied to account for window-to-wall ratio or fenestration design (e.g., balconies) when precise information about surface elements is unknown or insufficient [25].
Surface irradiation results can be presented directly in a visual form, but to form a numeric metric, the results must be transformed using the aforementioned formulation principles: normalisation, time constraint, and valuation. There are infinite ways of presenting and formulating the results depending on the purpose, which can be for instance: passive solar heating [24,108], active solar systems [109,110,111], urban heat island [112], or food and energy self-sufficiency [44]. The previous example in Figure 3 illustrates some possible ways of constructing an irradiance-based metric. The challenge of the analyst lies in the selection of suitable formulation characteristics to generate the metric which should communicate the simulation results adequately to the design evaluation aims. Spatial normalisation is a common strategic choice in irradiance-based metric formulation [3,6,26]. It has the advantage of making the metric comparable across different designs and projects. Additionally, normalising the irradiance by the living space floor area gives a metric a better communicative power, with the potential of expressing self-sufficiency.
3.4.4. Internal Climatic Metrics
IC metrics often serve as performance indicators as they pertain directly to the quantifiable design objectives or criteria used in energy, daylighting, and comfort assessments. There is certainly a direct link between the performance and the IC simulated metrics due to their level of simulation complexity and realism of expression. However, they may not be suitable for early design stages as they require much more sophisticated inputs than the simpler metrics presented in this paper [13]. The latter do not require the design to reach a high level of external and internal modelling detail, and instead stop at the exterior level of buildings.
IC metrics are computationally demanding; therefore, they often come into design considerations late in the development process. Moreover, they require the input of internal layouts and other scheduled or non-scheduled inputs that have a great impact on the IC metrics but are not yet established during the massing stages, whereas the context-dependent solar access is. It is usually after the massing stages are concluded and the context geometries are established that the internal layouts undergo further planning.
4. Discussion
This review proposed a taxonomy with four classes of solar performance metrics in urban planning. Amongst those, the internal climatic (IC) metrics may not be suited for urban planning stages despite their accuracy in performance assessments. As an example, we can look at the Swedish Planning and Building Act [113], which regulates the detailed development plan (DDP). Swedish municipalities are responsible for producing such a DDP, which contains initial massing of future developments and is setting spatial constraints for urban areas. In the plan, a municipality must determine the extent and function of public spaces and of planned neighbourhoods (including building footprints and roof shapes). They may also state the planned proportion and size of the apartments. To ensure good solar access in the massing stages within the scope of a DDP, decisions should be informed and driven by solar performance assessments. The DDP, however, does not provide enough internal geometry information and other building properties needed for complex performance assessments using IC metrics; yet, the DDP may provide sufficient geometry constraints to calculate the less complex metrics pertaining to the solar access of the neighbourhood areas, allowing to make early urban planning inferences. The present review showed that for that purpose, the lower complexity metrics appear to be more appropriate.
Such metric(s) are not yet available, although efforts are being made. For instance, a new aperture-based daylight modelling approach was recently proposed [114]. Instead of assessing metrics calculated for internal building grid, the method looks at the size of building apertures. This simple geometrical information provides an understanding of the connection between the building interior and the view out (sky, ground, and obstructions), linking the G metrics to the IC ones. While the approach is of great interest, its validation is still missing.
Urban planners have a limited expertise in solar evaluations and lack relevant methods, tools, and indicators [14,22]; thus, they urgently need reliable, yet simple methods that can be integrated into their planning routines. Urban planners have also shown a preference for visual methods of metrics presentation and expressed the need for simple evaluation techniques that would yield fast and accurate results.
However, it is important to mark that there is no clear indication of adaptable metrics which could be applied consistently in assessments of different neighbourhood typologies. For example, there is an important distinction between neighbourhoods comprising of low-rise and/or high-rise buildings. Many types of neighbourhoods are potentially possible [115], and different geometric variations may yield deviating results. The scope of this paper, however, is not limited to a specific neighbourhood type, size, or density; the presented solar metrics can be applied to any kind of urban design. Nonetheless, this review advocates further validation of solar performance metrics using multiple design patterns. Previous studies have typically used one of two methods to evaluate performance metrics with respect to different densities and urban typologies: assuming artificial design cases [26,49,67], or using real case studies [6,24,55].
This review showed that efforts had been made to establish simple solar metrics as urban planning phase performance indicators; however, consistent methods and prescribed indicators for solar performance evaluations at the urban planning level are still lacking. Despite promising correlations to complex IC metrics, simple metric benchmarks have not yet been defined. It is also not clear how the simpler metrics correlate with each other. Future research should focus on this knowledge gap and aim at expanding the understanding of suitable solar metrics as well as demonstrating their application methods in solar evaluations of urban designs. This knowledge will further assist urban planners in their efforts and might also promote regulatory consensus in solar access legislation.
5. Conclusions
In this paper, a review of metrics used in solar performance assessments in the urban planning and early design stages was presented. Aiming to systematise the knowledge on metrics, we identified and discussed:
- The main assessment functions of metrics (comparative, conforming, and quantified);
- The metric formulation principles (valuation, time constraint, and normalisation);
- The presentation methods (visual and numeric) with examples;
- The metric taxonomy, containing classes (G, L, EC, and IC) and groups of metrics;
- Popular metrics used for solar urban planning assessment purposes.
The information provided here can be further used by practitioners and researchers alike as the review offers guidelines on the use of metrics in design evaluations. It was indicated that using the principles of metric formulation in a purposeful and appropriate way can ensure effective communication of analysis results.
Systematically formulated metrics, which have been validated in relation to performance, may be used with confidence as KPIs. The review showed that performance indicators are typically formulated using a normalisation technique and valuated based on performance thresholds. Potentially, multiple metrics might be aggregated to form a single performance index using bespoke weighing factors. However, such methodology should be applied cautiously as reducing the data to one index hides important information, which can weaken comprehension. To increase reliability of metric-based assessment methods, potential metrics must be validated and further studied. Indeed, there is a need to find ways of incorporating simple numeric metrics as well as visual display methods into early design assessments.
Future work should aim to fill this gap in order to increase the confidence in the use of metrics for design evaluations. It is imperative to unveil the relationship between various complexity metrics and to analyse the feasibility and consequences of using the lower complexity metrics for decision making purposes in the urban planning stages. Building on the present research, future work should aim to (a) evaluate solar metrics for neighbourhood assessments to increase understanding about their role and correlations; (b) establish metric thresholds and solar performance criteria; (c) establish workflows and assessment method for solar access evaluations in early planning stages.
Author Contributions
Conceptualization, A.C., J.K., N.G. and M.W.; methodology, A.C., J.K., N.G. and M.W.; formal analysis, A.C.; investigation, A.C.; writing—original draft preparation, A.C.; writing—review and editing, J.K., N.G. and M.W.; visualization, A.C.; supervision, J.K., N.G. and M.W.; project administration, J.K. and M.W.; funding acquisition, J.K. and M.W. All authors have read and agreed to the published version of the manuscript.
Funding
This research was funded by the Swedish Energy Agency (Energimyndigheten)—grant number 49518-1.
Conflicts of Interest
The authors declare no conflict of interest.
References
- European Union. Directive 2010/31/EU of the European Parliament and of the Council of 19 May 2010 on the Energy Performance of Buildings; European Union: Brussels, Belgium, 2010. [Google Scholar]
- Bucking, S.; Zmeureanu, R.; Athienitis, A. A methodology for identifying the influence of design variations on building energy performance. J. Build. Perform. Simul. 2013, 7, 411–426. [Google Scholar] [CrossRef]
- Kanters, J.; Wall, M. The impact of urban design decisions on net zero energy solar buildings in Sweden. Urban Plan. Transp. Res. 2014, 2, 312–332. [Google Scholar] [CrossRef]
- Lechner, N. Heating, Cooling, Lighting: Sustainable Design Methods for Architects, 4th ed.; John Wiley & Sons: Hoboken, NJ, USA, 2015. [Google Scholar]
- Building and Construction Authority. Building Planning and Massing; The Centre for Sustainable Buildings and Construction, Building and Construction Authority: Singapore, 2010.
- Chen, K.W.; Norford, L. Evaluating Urban Forms for Comparison Studies in the Massing Design Stage. Sustainability 2017, 9, 987. [Google Scholar] [CrossRef]
- Delsante, I. Urban environment quality assessment using a methodology and set of indicators for medium-density neighbourhoods: A comparative case study of Lodi and Genoa. Ambiente Construído 2016, 16, 7–22. [Google Scholar] [CrossRef][Green Version]
- Garau, C.; Pavan, V.M. Evaluating Urban Quality: Indicators and Assessment Tools for Smart Sustainable Cities. Sustainability 2018, 10, 575. [Google Scholar] [CrossRef]
- IEA SHC Task 51. Solar Energy in Urban Planning. Approaches, Methods and Tools for Solar Energy in Urban Planning; IEA SHC Task 51: Karachi, Pakistan, 2018. [Google Scholar] [CrossRef]
- Wall, M.; Hachem-Vermette, C.; Vettorato, D.; Croce, S.; Kanters, J.; Florio, P. SHC Task 63: Solar Neighbourhood Planning, Annex Plan. Available online: https://task63.iea-shc.org/supporting-documents (accessed on 13 December 2021).
- De Luca, F.; Dogan, T. A novel solar envelope method based on solar ordinances for urban planning. Build. Simul. 2019, 12, 817–834. [Google Scholar] [CrossRef]
- SS-EN 17037:2018; Daylight in Buildings. Swedish Standards Institute: Stockholm, Sweden, 2018.
- Nault, E.; Peronato, G.; Rey, E.; Andersen, M. Review and critical analysis of early-design phase evaluation metrics for the solar potential of neighborhood designs. Build. Environ. 2015, 92, 679–691. [Google Scholar] [CrossRef]
- Kanters, J.; Wall, M. Experiences from the urban planning process of a solar neighbourhood in Malmö, Sweden. Urban Plan. Transp. Res. 2018, 6, 54–80. [Google Scholar] [CrossRef]
- Kanters, J.; Horvat, M.; Dubois, M.C. Tools and methods used by architects for solar design. Energy Build. 2014, 68, 721–731. [Google Scholar] [CrossRef]
- Chatzipoulka, C.; Compagnon, R.; Kämpf, J.; Nikolopoulou, M. Sky view factor as predictor of solar availability on building façades. Sol. Energy 2018, 170, 1026–1038. [Google Scholar] [CrossRef]
- Compagnon, R. Solar and daylight availability in the urban fabric. Energy Build. 2004, 36, 321–328. [Google Scholar] [CrossRef]
- Natanian, J.; Wortmann, T. Simplified evaluation metrics for generative energy-driven urban design: A morphological study of residential blocks in Tel Aviv. Energy Build. 2021, 240, 110916. [Google Scholar] [CrossRef]
- Snyder, H. Literature review as a research methodology: An overview and guidelines. J. Bus. Res. 2019, 104, 333–339. [Google Scholar] [CrossRef]
- Elsevier. Scopus Content Coverage Guide. Available online: https://www.elsevier.com/__data/assets/pdf_file/0007/69451/Scopus_ContentCoverage_Guide_WEB.pdf (accessed on 7 February 2022).
- Littlefair, P.J.; Santamouris, M.; Alvarez, S.; Dupagne, A.; Hall, D.; Teller, J.; Coronel, J.F.; Papanikolaou, N. Environmental Site Layout Planning: Solar Access, Microclimate and Passive Cooling in Urban Areas; Building Research Establishment: London, UK, 2000; Volume 380, p. 151. [Google Scholar]
- Kanters, J.; Gentile, N.; Bernardo, R. Planning for solar access in Sweden: Routines, metrics, and tools. Urban Plan. Transp. Res. 2021, 9, 347–368. [Google Scholar] [CrossRef]
- Nault, E.; Moonen, P.; Rey, E.; Andersen, M. Predictive models for assessing the passive solar and daylight potential of neighborhood designs: A comparative proof-of-concept study. Build. Environ. 2017, 116, 1–16. [Google Scholar] [CrossRef]
- Mohajeri, N.; Upadhyay, G.; Gudmundsson, A.; Assouline, D.; Kämpf, J.; Scartezzini, J.-L. Effects of urban compactness on solar energy potential. Renew. Energy 2016, 93, 469–482. [Google Scholar] [CrossRef]
- Lobaccaro, G.; Lisowska, M.M.; Saretta, E.; Bonomo, P.; Frontini, F. A Methodological Analysis Approach to Assess Solar Energy Potential at the Neighborhood Scale. Energies 2019, 12, 3554. [Google Scholar] [CrossRef]
- Zhang, J.; Xu, L.; Shabunko, V.; Tay, S.E.R.; Sun, H.; Lau, S.S.Y.; Reindl, T. Impact of urban block typology on building solar potential and energy use efficiency in tropical high-density city. Appl. Energy 2019, 240, 513–533. [Google Scholar] [CrossRef]
- Robert McNeel and Associates. Rhinoceros 3D, Version 7. Available online: https://www.rhino3d.com/ (accessed on 6 December 2021).
- Ladybug Tools. Ladybug Tools | Home Page. Available online: https://www.ladybug.tools/ (accessed on 11 October 2021).
- Wilcox, S.; Marion, W. Users Manual for TMY3 Data Sets; Technical Report NREL/TP-581-43156; National Renewable Energy Laboratory: Golden, CO, USA, 2008.
- Prabatha, T.; Hager, J.; Carneiro, B.; Hewage, K.; Sadiq, R. Analyzing energy options for small-scale off-grid communities: A Canadian case study. J. Clean. Prod. 2020, 249, 119320. [Google Scholar] [CrossRef]
- Li, Y.; O’Donnell, J.; García-Castro, R.; Vega-Sánchez, S. Identifying stakeholders and key performance indicators for district and building energy performance analysis. Energy Build. 2017, 155, 1–15. [Google Scholar] [CrossRef]
- Chatzipoulka, C.; Nikolopoulou, M. Urban geometry, SVF and insolation of open spaces: London and Paris. Build. Res. Inf. 2018, 46, 881–898. [Google Scholar] [CrossRef]
- Zhang, J.; Heng, C.K.; Malone-Lee, L.C.; Hii, D.J.C.; Janssen, P.; Leung, K.S.; Tan, B.K. Evaluating environmental implications of density: A comparative case study on the relationship between density, urban block typology and sky exposure. Autom. Constr. 2012, 22, 90–101. [Google Scholar] [CrossRef]
- Natanian, J.; Aleksandrowicz, O.; Auer, T. A parametric approach to optimizing urban form, energy balance and environmental quality: The case of Mediterranean districts. Appl. Energy 2019, 254, 113637. [Google Scholar] [CrossRef]
- Mardaljevic, J. Daylight Simulation: Validation, Sky Models and Daylight Coefficients, Loughborough University. Available online: /articles/thesis/Daylight_simulation_validation_sky_models_and_daylight_coefficients/9460817/1 (accessed on 22 February 2021).
- Baker, C.; Goel, S.; Wang, N.; Rosenberg, M.; Wolf, D.; Henderson, P. A simplified energy modeling approach for buildings. In Proceedings of the ASHRAE and IBPSA-USA Building Simulation Conference, Chicago, IL, USA, 26–28 September 2018; pp. 53–59. [Google Scholar]
- Tregenza, P.R. Subdivision of the sky hemisphere for luminance measurements. Light. Res. Technol. 1987, 19, 13–14. [Google Scholar] [CrossRef]
- Subramaniam, S.; Mistrick, R. A More Accurate Approach for calculating Illuminance with Daylight Coefficients. In Proceedings of the Illuminating Engineering Society Annual Conference 2017, Portland, OR, USA, 8–10 August 2017; Available online: http://sarith.in/papers/2017-IES.pdf (accessed on 15 November 2021).
- ISO-15469:2004 (E)/CIE S 011/E:2003; Spatial Distribution of Daylight–CIE Standard General Sky. ISO-CIE: Geneve, Switzerland, 2004.
- Darula, S.; Kittler, R. Standard sky calculations for daylighting design and energy performance purposes. Fiz. Budowli Teor. Prakt. 2009, 4, 23–28. [Google Scholar]
- Johnson, T.G.; Watson, I.D. The Determination of View-Factors in Urban Canyons. J. Clim. Appl. Meteorol. 1984, 23, 329–335. [Google Scholar] [CrossRef]
- Metropolitan Council. Calculating Floor Area Ratio—Local Planning Handbook; Metropolitan Council: Saint Paul, MN, USA, 2015.
- Morganti, M.; Salvati, A.; Coch, H.; Cecere, C. Urban morphology indicators for solar energy analysis. Energy Procedia 2017, 134, 807–814. [Google Scholar] [CrossRef]
- Tablada, A.; Zhao, X. Sunlight availability and potential food and energy self-sufficiency in tropical generic residential districts. Sol. Energy 2016, 139, 757–769. [Google Scholar] [CrossRef]
- Wu, Z.; Ren, Y.; Chen, L. Evaluating Urban Geometry Impacts on Incident Solar Radiation on Building Envelopes. Environ. Model. Assess. 2021, 26, 113–123. [Google Scholar] [CrossRef]
- Curreli, A.; Roura, H.C. Urban layout and façade solar potential: A case study in the Mediterranean Region. Arch. City Environ. 2013, 7, 117–132. [Google Scholar] [CrossRef]
- Chokhachian, A.; Perini, K.; Giulini, S.; Auer, T. Urban performance and density: Generative study on interdependencies of urban form and environmental measures. Sustain. Cities Soc. 2020, 53, 101952. [Google Scholar] [CrossRef]
- Šprah, N.; Košir, M. Daylight Provision Requirements According to EN 17037 as a Restriction for Sustainable Urban Planning of Residential Developments. Sustainability 2019, 12, 315. [Google Scholar] [CrossRef]
- Lee, K.S.; Lee, J.W. Feasibility study on the relation between housing density and solar accessibility and potential uses. Renew. Energy 2016, 85, 749–758. [Google Scholar] [CrossRef]
- Wei, R.; Song, D.; Wong, N.H.; Martin, M. Impact of Urban Morphology Parameters on Microclimate. Procedia Eng. 2016, 169, 142–149. [Google Scholar] [CrossRef]
- Yahia, M.W.; Johansson, E.; Thorsson, S.; Lindberg, F.; Rasmussen, M.I. Effect of urban design on microclimate and thermal comfort outdoors in warm-humid Dar es Salaam, Tanzania. Int. J. Biometeorol. 2018, 62, 373–385. [Google Scholar] [CrossRef]
- Maiullari, D.; Esch, M.P.-V.; Van Timmeren, A. A Quantitative Morphological Method for Mapping Local Climate Types. Urban Plan. 2021, 6, 240–257. [Google Scholar] [CrossRef]
- Joshi, K.K.; Kono, T. Optimization of floor area ratio regulation in a growing city. Reg. Sci. Urban Econ. 2009, 39, 502–511. [Google Scholar] [CrossRef]
- DeKay, M. A comparative review of daylight planning tools and a rule-of-thumb for street width to building height ratio. In Proceedings of the 17th National Passive Solar Conference, Cocoa Beach, FL, USA, 15–18 June 1992; Available online: https://www.academia.edu/908120/a_comparative_review_of_daylight_planning_tools_and_a_rule_of_thumb_for_street_width_to_building_height_ratio (accessed on 18 November 2021).
- Chatzipoulka, C.; Compagnon, R.; Nikolopoulou, M. Urban geometry and solar availability on façades and ground of real urban forms: Using London as a case study. Sol. Energy 2016, 138, 53–66. [Google Scholar] [CrossRef]
- Bournas, I. Daylight compliance of residential spaces: Comparison of different performance criteria and association with room geometry and urban density. Build. Environ. 2020, 185, 107276. [Google Scholar] [CrossRef]
- Vartholomaios, A. A parametric sensitivity analysis of the influence of urban form on domestic energy consumption for heating and cooling in a Mediterranean city. Sustain. Cities Soc. 2017, 28, 135–145. [Google Scholar] [CrossRef]
- Ko, Y. Urban Form and Residential Energy Use: A Review of Design Principles and Research Findings. J. Plan. Lit. 2013, 28, 327–351. [Google Scholar] [CrossRef]
- Ratti, C.; Baker, N.; Steemers, K. Energy consumption and urban texture. Energy Build. 2005, 37, 762–776. [Google Scholar] [CrossRef]
- Knowles, R.L. The solar envelope: Its meaning for energy and buildings. Energy Build. 2003, 35, 15–25. [Google Scholar] [CrossRef]
- Mangan, S.D.; Oral, G.K.; Kocagil, I.E.; Sozen, I. The impact of urban form on building energy and cost efficiency in temperate-humid zones. J. Build. Eng. 2021, 33, 101626. [Google Scholar] [CrossRef]
- Forouzandeh, A.; Richter, T. Accurate prediction of heating energy demand of courtyard’s surrounding envelopes using temperature correction factor. Energy Build. 2019, 193, 49–68. [Google Scholar] [CrossRef]
- Martinelli, L.; Matzarakis, A. Influence of height/width proportions on the thermal comfort of courtyard typology for Italian climate zones. Sustain. Cities Soc. 2017, 29, 97–106. [Google Scholar] [CrossRef]
- Nasrollahi, N.; Hatami, M.; Khastar, S.R.; Taleghani, M. Numerical evaluation of thermal comfort in traditional courtyards to develop new microclimate design in a hot and dry climate. Sustain. Cities Soc. 2017, 35, 449–467. [Google Scholar] [CrossRef]
- Rodríguez-Algeciras, J.; Tablada, A.; Chaos-Yeras, M.; De la Paz, G.; Matzarakis, A. Influence of aspect ratio and orientation on large courtyard thermal conditions in the historical centre of Camagüey-Cuba. Renew. Energy 2018, 125, 840–856. [Google Scholar] [CrossRef]
- Berghauser-Pont, M.; Haupt, P.A. The Spacemate: Density and the typomorphology of the urban fabric. In Urbanism Laboratory for Cities and Regions; IOS Press: Amsterdam, The Netherlands, 2007; pp. 11–26. [Google Scholar]
- Zhu, D.; Song, D.; Shi, J.; Fang, J.; Zhou, Y. The Effect of Morphology on Solar Potential of High-Density Residential Area: A Case Study of Shanghai. Energies 2020, 13, 2215. [Google Scholar] [CrossRef]
- Oke, T.R. Canyon geometry and the nocturnal urban heat island: Comparison of scale model and field observations. J. Clim. 1980, 1, 237–254. [Google Scholar] [CrossRef]
- Brown, M.J.; Grimmond, S.; Ratti, C. Comparison of Methodologies for Computing Sky View Factor in Urban Environments; Los Alamos National Lab: Los Alamos, NM, USA, 2001.
- Dirksen, M.; Ronda, R.; Theeuwes, N.; Pagani, G. Sky view factor calculations and its application in urban heat island studies. Urban Clim. 2019, 30, 100498. [Google Scholar] [CrossRef]
- Hämmerle, M.; Gál, T.; Unger, J.; Matzarakis, A. Comparison of models calculating the sky view factor used for urban climate investigations. Theor. Appl. Climatol. 2011, 105, 521–527. [Google Scholar] [CrossRef]
- Lau, K.K.-L.; Lindberg, F.; Rayner, D.; Thorsson, S. The effect of urban geometry on mean radiant temperature under future climate change: A study of three European cities. Int. J. Biometeorol. 2014, 59, 799–814. [Google Scholar] [CrossRef]
- Littlefair, P. Site Layout Planning for Daylight and Sunlight: A Guide to Good Practice (BR 209); Building Research Establishment: Watford, UK, 2011. [Google Scholar]
- Olina, A.; Zaimi, N. Daylight Prediction Based on VSC-DF Relation: A Guideline for Daylight in Urban Planning. Master’s Thesis, Lund University, Lund, Sweden, 2018. [Google Scholar]
- Moon, P.; Spencer, D.E. Illumination form a non-uniform sky. Illum. Eng. 1942, 37, 707–726. [Google Scholar]
- Bournas, I.; Dubois, M.-C. Daylight regulation compliance of existing multi-family apartment blocks in Sweden. Build. Environ. 2019, 150, 254–265. [Google Scholar] [CrossRef]
- Morrissey, J.; Moore, T.; Horne, R. Affordable passive solar design in a temperate climate: An experiment in residential building orientation. Renew. Energy 2011, 36, 568–577. [Google Scholar] [CrossRef]
- Capeluto, I.G.; Yezioro, A.; Shaviv, E. Climatic aspects in urban design-a case study. Build. Environ. 2003, 38, 827–835. [Google Scholar] [CrossRef]
- Capeluto, I.G.; Plotnikov, B. A method for the generation of climate-based, context-dependent parametric solar envelopes. Arch. Sci. Rev. 2017, 60, 395–407. [Google Scholar] [CrossRef]
- Yousuf, M.U.; Siddiqui, M.; Rehman, N.U. Solar energy potential estimation by calculating sun illumination hours and sky view factor on building rooftops using digital elevation model. J. Renew. Sustain. Energy 2018, 10, 13703. [Google Scholar] [CrossRef]
- Grandjean, E.; Gilgen, A. Environmental Factors in Urban Planning; Taylor & Francis: London, UK, 1976. [Google Scholar]
- Littlefair, P. Passive solar urban design: Ensuring the penetration of solar energy into the city. Renew. Sustain. Energy Rev. 1998, 2, 303–326. [Google Scholar] [CrossRef]
- Desthieux, G.; Carneiro, C.; Camponovo, R.; Ineichen, P.; Morello, E.; Boulmier, A.; Abdennadher, N.; Dervey, S.; Ellert, C. Solar Energy Potential Assessment on Rooftops and Facades in Large Built Environments Based on LiDAR Data, Image Processing, and Cloud Computing. Methodological Background, Application, and Validation in Geneva (Solar Cadaster). Front. Built Environ. 2018, 4, 14. [Google Scholar] [CrossRef]
- Compagnon, R.; Goyette-Pernot, J. Multishading masks: A new method for assessing solar penetration in open spaces. In Proceedings of the PLEA2013—29th Conference, Sustainable Architecture for a Renewable Future, Munich, Germany, 10–12 September 2013. [Google Scholar]
- Compagnon, R.; Chatzipoulka, C. A Simple Tool for Assessing Solar and Daylight Access in Urban Canyons. In Proceedings of the EuroSun 2018, International Solar Energy Society, Freiburg, Germany, 10–13 September 2018; pp. 1–8. [Google Scholar] [CrossRef]
- Ne’Eman, E.; Light, W.; Hopkinson, R. Recommendations for the admission and control of sunlight in buildings. Build. Environ. 1976, 11, 91–101. [Google Scholar] [CrossRef]
- Littlefair, P. Site Layout Planning for Daylight and Sunlight: A Guide to Good Practice; Building Research Establishment: Watford, UK, 1991. [Google Scholar]
- Holick, M.F. Sunlight and vitamin D for bone health and prevention of autoimmune diseases, cancers, and cardiovascular disease. Am. J. Clin. Nutr. 2004, 80, 1678S–1688S. [Google Scholar] [CrossRef] [PubMed]
- Bilu, C.; Einat, H.; Zimmet, P.; Vishnevskia-Dai, V.; Kronfeld-Schor, N. Beneficial effects of daytime high-intensity light exposure on daily rhythms, metabolic state and affect. Sci. Rep. 2020, 10, 19782. [Google Scholar] [CrossRef] [PubMed]
- Rosenthal, N.E.; Sack, D.A.; Gillin, J.C.; Lewy, A.J.; Goodwin, F.K.; Davenport, Y.; Mueller, P.S.; Newsome, D.A.; Wehr, T.A. Seasonal Affective Disorder: A Description of the Syndrome and Preliminary Findings with Light Therapy. Arch. Gen. Psychiatry 1984, 41, 72–80. [Google Scholar] [CrossRef]
- Fahimipour, A.K.; Hartmann, E.M.; Siemens, A.; Kline, J.; Levin, D.A.; Wilson, H.; Betancourt-Román, C.M.; Brown, G.Z.; Fretz, M.; Northcutt, D.; et al. Daylight exposure modulates bacterial communities associated with household dust. Microbiome 2018, 6, 175. [Google Scholar] [CrossRef]
- Ne’Eman, E.; Craddock, J.; Hopkinson, R. Sunlight requirements in buildings—I. Social survey. Build. Environ. 1976, 11, 217–238. [Google Scholar] [CrossRef]
- Czachura, A. Integrated Daylight and Energy Evaluation of Passive Solar Shadings in a Nordic Climate. In Proceedings of the 13th International Conference on Solar Energy for Buildings and Industry, Online, 1–3 September 2020; pp. 32–40. [Google Scholar]
- Illuminating Engineering Society. IES LM-83-12 Approved Method: IES Spatial Daylight Autonomy (sDA) and Annual Sunlight Exposure (ASE); Illuminating Engineering Society: New York, NY, USA, 2012. [Google Scholar]
- Robinson, D.; Stone, A. Irradiation modelling made simple: The cumulative sky approach and its applications. In Proceedings of the 21st PLEA Conference, Eindhoven, The Netherlands, 19–21 September 2004; pp. 19–22. [Google Scholar]
- Theeuwes, N.E.; Steeneveld, G.-J.; Ronda, R.J.; Holtslag, B. A diagnostic equation for the daily maximum urban heat island effect for cities in northwestern Europe. Int. J. Clim. 2017, 37, 443–454. [Google Scholar] [CrossRef]
- BSI. Lighting for Buildings. Code of Practice for Daylighting. BS 8206-2:2008—BSI British Standards, London. Available online: https://shop.bsigroup.com/ProductDetail/?pid=000000000030157088 (accessed on 17 May 2021).
- Littlefair, P.; Aizlewood, M. Calculating Access to Skylight, Sunlight and Solar Radiation on Obstructed Sites in Europe; Construction Research Communications; Building Research Establishment: Watford, UK, 1999. [Google Scholar]
- Palz, W.; Greif, J. European Solar Radiation Atlas: Solar Radiation on Horizontal and Inclined Surfaces, 3rd ed.; Springer: Berlin/Heidelberg, Germany, 2016. [Google Scholar]
- Annual Probable Sun Hours. Available online: https://deluminaelab.com/docs/dl-light/en/apsh.html (accessed on 3 December 2021).
- Liao, W.; Heo, Y.; Xu, S. Simplified vector-based model tailored for urban-scale prediction of solar irradiance. Sol. Energy 2019, 183, 566–586. [Google Scholar] [CrossRef]
- Sarralde, J.J.; Quinn, D.J.; Wiesmann, D.; Steemers, K. Solar energy and urban morphology: Scenarios for increasing the renewable energy potential of neighbourhoods in London. Renew. Energy 2015, 73, 10–17. [Google Scholar] [CrossRef]
- Freitas, S.; Catita, C.; Redweik, P.; Brito, M. Modelling solar potential in the urban environment: State-of-the-art review. Renew. Sustain. Energy Rev. 2015, 41, 915–931. [Google Scholar] [CrossRef]
- Lukač, N.; Seme, S.; Žlaus, D.; Štumberger, G.; Žalik, B. Buildings roofs photovoltaic potential assessment based on LiDAR (Light Detection and Ranging) data. Energy 2014, 66, 598–609. [Google Scholar] [CrossRef]
- Cronemberger, J.; Martin, M.E.C.; Sanchez, S.V. Assessing the solar irradiation potential for solar photovoltaic applications in buildings at low latitudes—Making the case for Brazil. Energy Build. 2012, 55, 264–272. [Google Scholar] [CrossRef]
- Saretta, E.; Bonomo, P.; Frontini, F. A calculation method for the BIPV potential of Swiss façades at LOD2.5 in urban areas: A case from Ticino region. Sol. Energy 2020, 195, 150–165. [Google Scholar] [CrossRef]
- Naboni, E.; Natanian, J.; Brizzi, G.; Florio, P.; Chokhachian, A.; Galanos, T.; Rastogi, P. A digital workflow to quantify regenerative urban design in the context of a changing climate. Renew. Sustain. Energy Rev. 2019, 113, 109255. [Google Scholar] [CrossRef]
- Zirnhelt, H.E.; Richman, R.C. The potential energy savings from residential passive solar design in Canada. Energy Build. 2015, 103, 224–237. [Google Scholar] [CrossRef]
- Lobaccaro, G.; Carlucci, S.; Croce, S.; Paparella, R.; Finocchiaro, L. Boosting solar accessibility and potential of urban districts in the Nordic climate: A case study in Trondheim. Sol. Energy 2017, 149, 347–369. [Google Scholar] [CrossRef]
- Huang, Z.; Mendis, T.; Xu, S. Urban solar utilization potential mapping via deep learning technology: A case study of Wuhan, China. Appl. Energy 2019, 250, 283–291. [Google Scholar] [CrossRef]
- Peronato, G.; Rastogi, P.; Rey, E.; Andersen, M. A toolkit for multi-scale mapping of the solar energy-generation potential of buildings in urban environments under uncertainty. Sol. Energy 2018, 173, 861–874. [Google Scholar] [CrossRef]
- Terjung, W.H.; Louie, S.S.-F. Solar Radiation and Urban Heat Islands. Ann. Assoc. Am. Geogr. 1973, 63, 181–207. [Google Scholar] [CrossRef]
- Boverket. Planning and Building Act (2010:900) Planning and Building Ordinance (2011:338); Swedish National Board of Housing, Building and Planning; Boverket: Karlskrona, Sweden, 2018. [Google Scholar]
- Mardaljevic, J. The implementation of natural lighting for human health from a planning perspective. Light. Res. Technol. 2021, 53, 489–513. [Google Scholar] [CrossRef]
- Mehaffy, M.W.; Kryazheva, Y.; Rudd, A.; Salingaros, N.A. A New Pattern Language for Growing Regions: Places, Networks, Processes; Sustasis Press: Portland, OR, USA, 2019. [Google Scholar]


Publisher’s Note: MDPI stays neutral with regard to jurisdictional claims in published maps and institutional affiliations. |
© 2022 by the authors. Licensee MDPI, Basel, Switzerland. This article is an open access article distributed under the terms and conditions of the Creative Commons Attribution (CC BY) license (https://creativecommons.org/licenses/by/4.0/).