Abstract
Indoor thermal conditions can be highly influenced through building envelopes by outdoor conditions, especially climatic parameters. While a lot of attention has been paid to the thermal performance in core zones in buildings, other zones, such as perimeters, experience significant heat loss and gain through building envelopes. Focusing on the energy and thermal performance in perimeter zones, the present study performed an energy simulation to find the most susceptible building orientation in an office building in South Korea regarding the cooling loads during the summer. Through field measurements, the solar radiation impact on the thermal performance in the perimeter zones was practically investigated. To reduce the cooling loads in the perimeter zones, an air barrier system was utilized. As a result, the biggest amount of heat was observed in the perimeter zones facing the west façade in the winter, according to the measurements. While the highest temperature was observed at the internal surface of the windows, the temperature in the perimeter and core zones was stably maintained. The heat that occurred through the west façade was reduced by the air barrier system by removing the vertical thermal stratification using the fan-powered unit in the system.
1. Introduction
Worldwide, buildings account for about 30% of the total energy consumption, accompanied by a significant increase in CO2 emissions [1,2,3]. In the near future, it is expected that the energy consumed by buildings will increase rapidly and become a concern to building stakeholders [4,5,6]. As reported by Dong et al. [7], energy consumption in buildings can be influenced by building systems and remarkably improved as building energy efficiency is improved. Therefore, it is important to improve the energy efficiency of building systems. In South Korea, the “Energy Statistics Handbook in 2020” provided by the Korea Energy Agency reported that about one-third of the total energy consumption was used for building operations [8]. The Korean government also made a significant effort to improve building energy efficiency in order to reduce building energy consumptions. For example, the renewable energy policy has been developed to achieve the goal of producing 20% of the total electricity by implementing green technologies by 2030 [9,10,11]. As can be seen, a lot of attention has also been paid to the improvement of building energy efficiency.
Among building energy efficiency measures, several design strategies could be considered, such as passive and active design solutions. For passive design strategies, building envelopes systems can play an important role in energy consumption reduction, as well as thermal comfort for occupants [12]. For example, architectural design parameters, such as windows-to-wall ratios and building shapes, as well as the thermal parameters of building materials, are considered for passive design solutions [12]. In addition, advanced or well-designed mechanical systems can offer an opportunity for the better control of thermal comfort and energy saving [13]. According to the review by Wu and Skye, the energy efficiency measures from passive design solutions are considered first [14]. The passive design solutions mainly include the thermal properties and airtightness of building envelopes, including walls, exterior windows, and roofs. These technologies can include advanced insulation materials for building envelopes, window systems, and external and internal shadings [15,16,17,18].
Generally, building envelopes can be highly influenced by outdoor conditions, especially climatic parameters. During the summer and winter, significant heat loss and heat gain can occur through the building envelopes [19,20,21]. Thus, it is important to handle these peaks in building envelopes effectively to reduce building energy consumption. To minimize the peak load [22], building energy modeling is used to assess the energy and thermal performance of building envelope systems. In the process of the analysis for various design parameters, it is important to note that thermal performance through solar gain or heat loss can have different behaviors by zoning [23]. Zones can be divided by building and purpose. For example, two zones can be created largely in office buildings: one for the core and the other for the perimeter. While a core zone is windowless, a perimeter zone is exposed to outdoor climates through windows [24]. The thermal performance in the perimeter zone can be susceptible to outdoor conditions [25]. The problem of poor thermal performance in perimeter zones was reported by Zhang et al. [26]. They pointed out that direct solar radiation exposure and ankle draft in the perimeter zones can have a significant impact on indoor thermal sensation. Zhang et al. pointed out the importance of the thermal situation in perimeter zones regarding the total building energy consumption [24]. In their study, thermochromic smart windows were installed to control both thermal and energy performances in perimeter zones. Thus, thermal performance, especially heat gain and loss in perimeter zones, is heavily influenced by the outdoor climatic conditions, building orientation, and so on. In the study by Konis, heavy exterior shading devices were installed to control solar loads in order to improve the occupants’ thermal comfort, as well as reduce cooling loads in perimeter zones [27]. Shen and Tzempelikos also performed an analysis on the daylighting of perimeter zones by adding automated shading [28]. In the case of the study performed by Kapsis et al., semi-transparent photovoltaic window systems were equipped to reduce cooling loads while improving daylighting performance for perimeter office areas [22]. The visual performance in perimeter zones was also investigated by Sadeghi et al. [29]. By conducting visual preference votes and other field surveys, they analyzed occupants’ perceptions and satisfaction with the visual environment in perimeter zones. Kontadakis et al. also studied the impact of advanced daylighting systems utilizing direct beam radiation for increasing usable daylighting areas in perimeter zones [30]. To improve visual comfort in perimeter office areas, Kunwar et al. applied roller shades and lighting equipment [31].
According to the study by J. Gamero-Salinas et al., thermal performance in the perimeter can have a significant impact on the whole indoor thermal comfort in buildings, especially in commercial buildings [32]. Romero et al. also pointed out the importance of the thermal performance of building materials in the perimeters that can cause thermal bridges [33]. In addition, Huang et al. discussed that finding the right type of HVAC system for providing thermal comfort in the core and perimeters is challenging because the relationship between zone and outdoor temperature is quite complex [34]. Thus, poor building design parameters can harm the thermal comfort in the perimeters, as well as in core zones [26,35]. While most studies have focused on the investigation of energy and thermal performance for whole buildings or the design parameters of building envelopes, a few studies have focused on the performance in perimeter zones. Specifically, most of those studies put an emphasis on the daylighting performance in perimeter zones. Since the desired building energy efficiency can be achieved by a full understanding of the interactions among climatic conditions and building operation parameters, the present study used an energy simulation tool to calculate cooling loads through windows for each orientation to find the building orientation causing the maximum solar gain. Moreover, the thermal impact on building envelopes by solar radiation was analyzed through field measurements. Furthermore, the effectiveness of an air barrier system in building envelopes for removing the heat caused by solar radiation was analyzed.
2. The Air Barrier System by Utilizing the Underfloor Air Distribution System
For the present study, a simple mechanical air barrier system was used to remove accumulated heat in the perimeter zones in an office building, which was introduced by a study by Cho et al. [36]. In the selected building, an underfloor air distribution system was installed, which has become the most attractive HVAC system for commercial buildings, especially office buildings, due to the advantages compared to conventional air distribution systems [37]. According to the study by Schiavon et al., underfloor air distribution is an innovative way of conditioning thermal behaviors in perimeter zones [38]. In their study, vertical thermal stratifications created by using linear bar grills and VAV directional diffusers from the underfloor air distribution systems improved the energy and thermal performances in perimeter zones. In addition, the airflow pattern created by a swirl diffuser from the underfloor air distribution system was investigated by Yau et al. and Taheri et al. [39,40]. They proved that the airflow can be significantly affected by the design of diffusers. This idea was also raised by the investigation performed by Zhang et al. [41]. To investigate the impact of underfloor air distribution on reducing energy consumptions, Alajmi et al. compared the effectiveness of the underfloor air distribution system with the conventional systems [42]. The result of their study showed that the HVAC demands were decreased by utilizing the underfloor air distribution system. The effectiveness of this system in reducing energy consumption was also proven in the study by Xue and Chen [43]. In addition to what was shown in the study by Ali and Wid, this way of distributing air under the floor can reduce the sensible load effectively, as well as ensure indoor air quality by mixing the outside air with occupants. According to the recent study for the underfloor air distribution system, vertical airflow provided by this system can offer the desired thermal comfort and IAQ conditions by removing the undesired draft [44]. This was also pointed out by the recent study by Maria et al. [45].
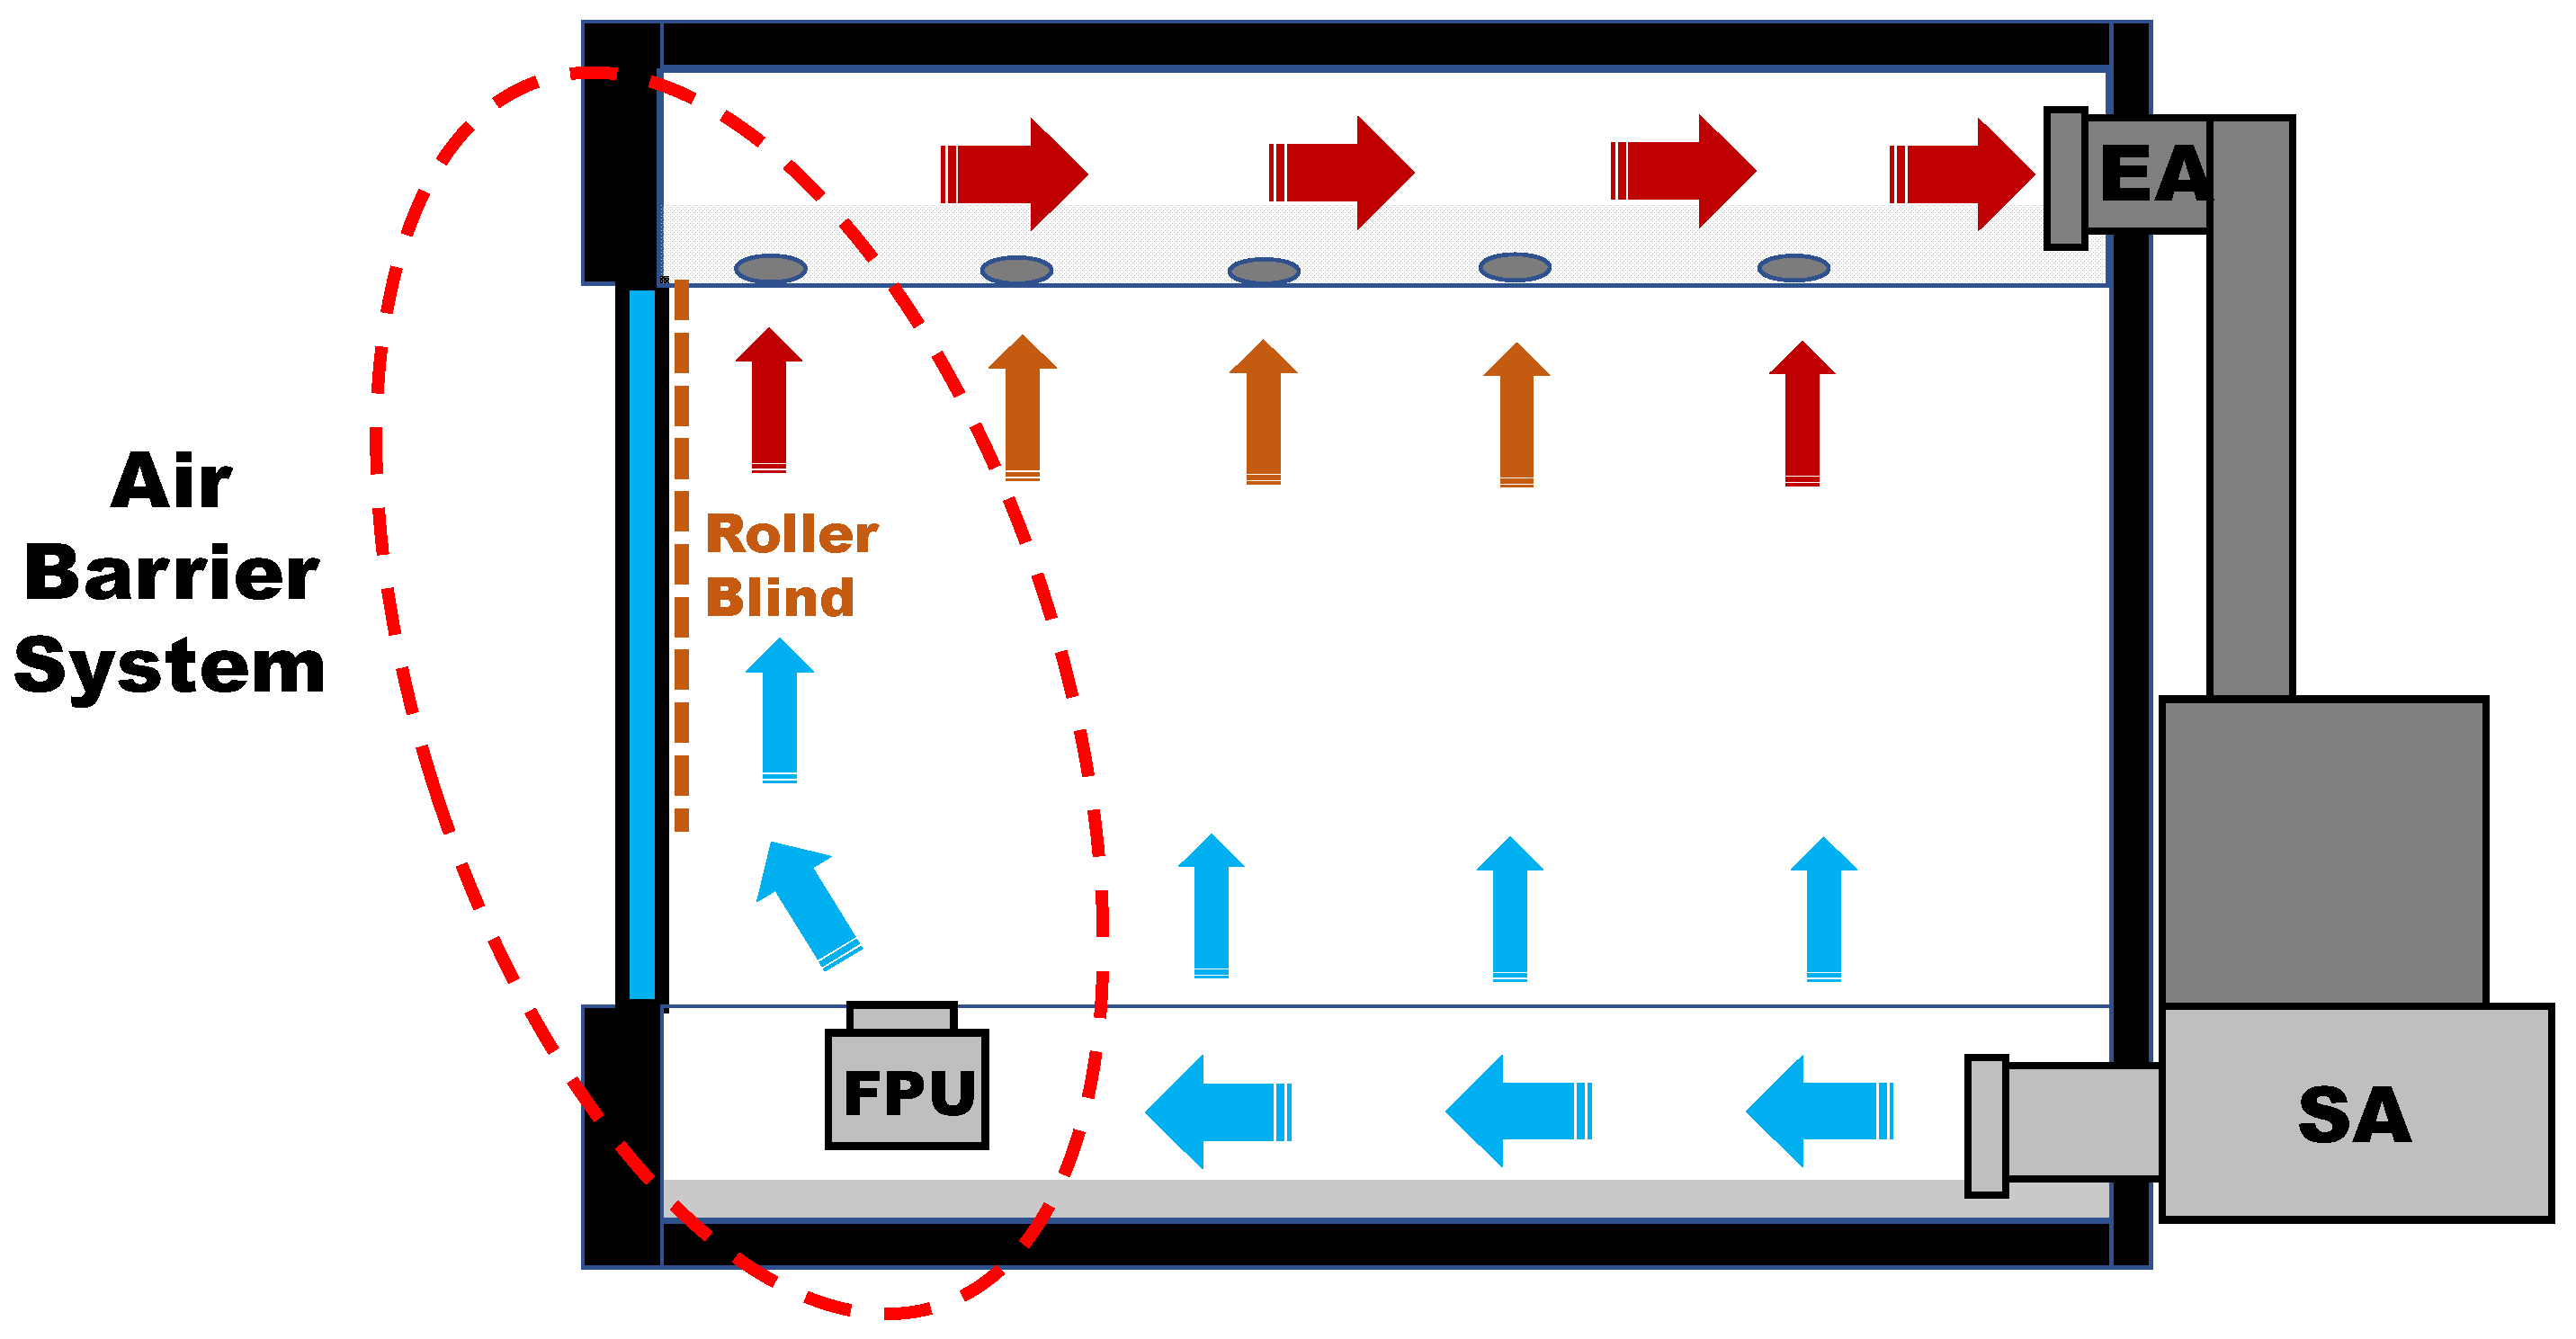
As is shown above, the airflow can create a vertical thermal stratification, and this can be used to reduce cooling loads in perimeter zones. By utilizing the vertical airflow provided by the underfloor air distribution system, this system can handle the loads for some space without needing any further payments for installations (Figure 1). Since the airflow rates and patterns can be significantly affected by diffusers and other variables, a fan-powered unit (FPU) was installed in the underfloor air distribution system, which plays a role as a blast fan in the air barrier system. This vertical airflow, headed by an FPU, creates vertical thermal stratification. Another important piece of equipment is the roller blind. This plays an important role as an internal shading device, as well as an internal layer of window systems. By utilizing an exhaust vent, a “push-pull” method is created to transfer a volume of air from the underfloor air distribution system to the HVAC systems.

Figure 1.
Air barrier system with the underfloor air distribution system.
3. Materials and Methods
For the present study, an office building in South Korea was selected in order to investigate the thermal performance in its perimeter zones. By utilizing an energy simulation, the impact of solar radiation on the cooling load was calculated to find the building orientation that caused the maximum cooling load through the glazing façade. Based on the simulation result, the field measurements were conducted in the selected office building to figure out how the thermal behaviors in the perimeters were related to the outdoor conditions. In addition, the cooling load reduction by an HVAC system was observed.
3.1. Building Selection
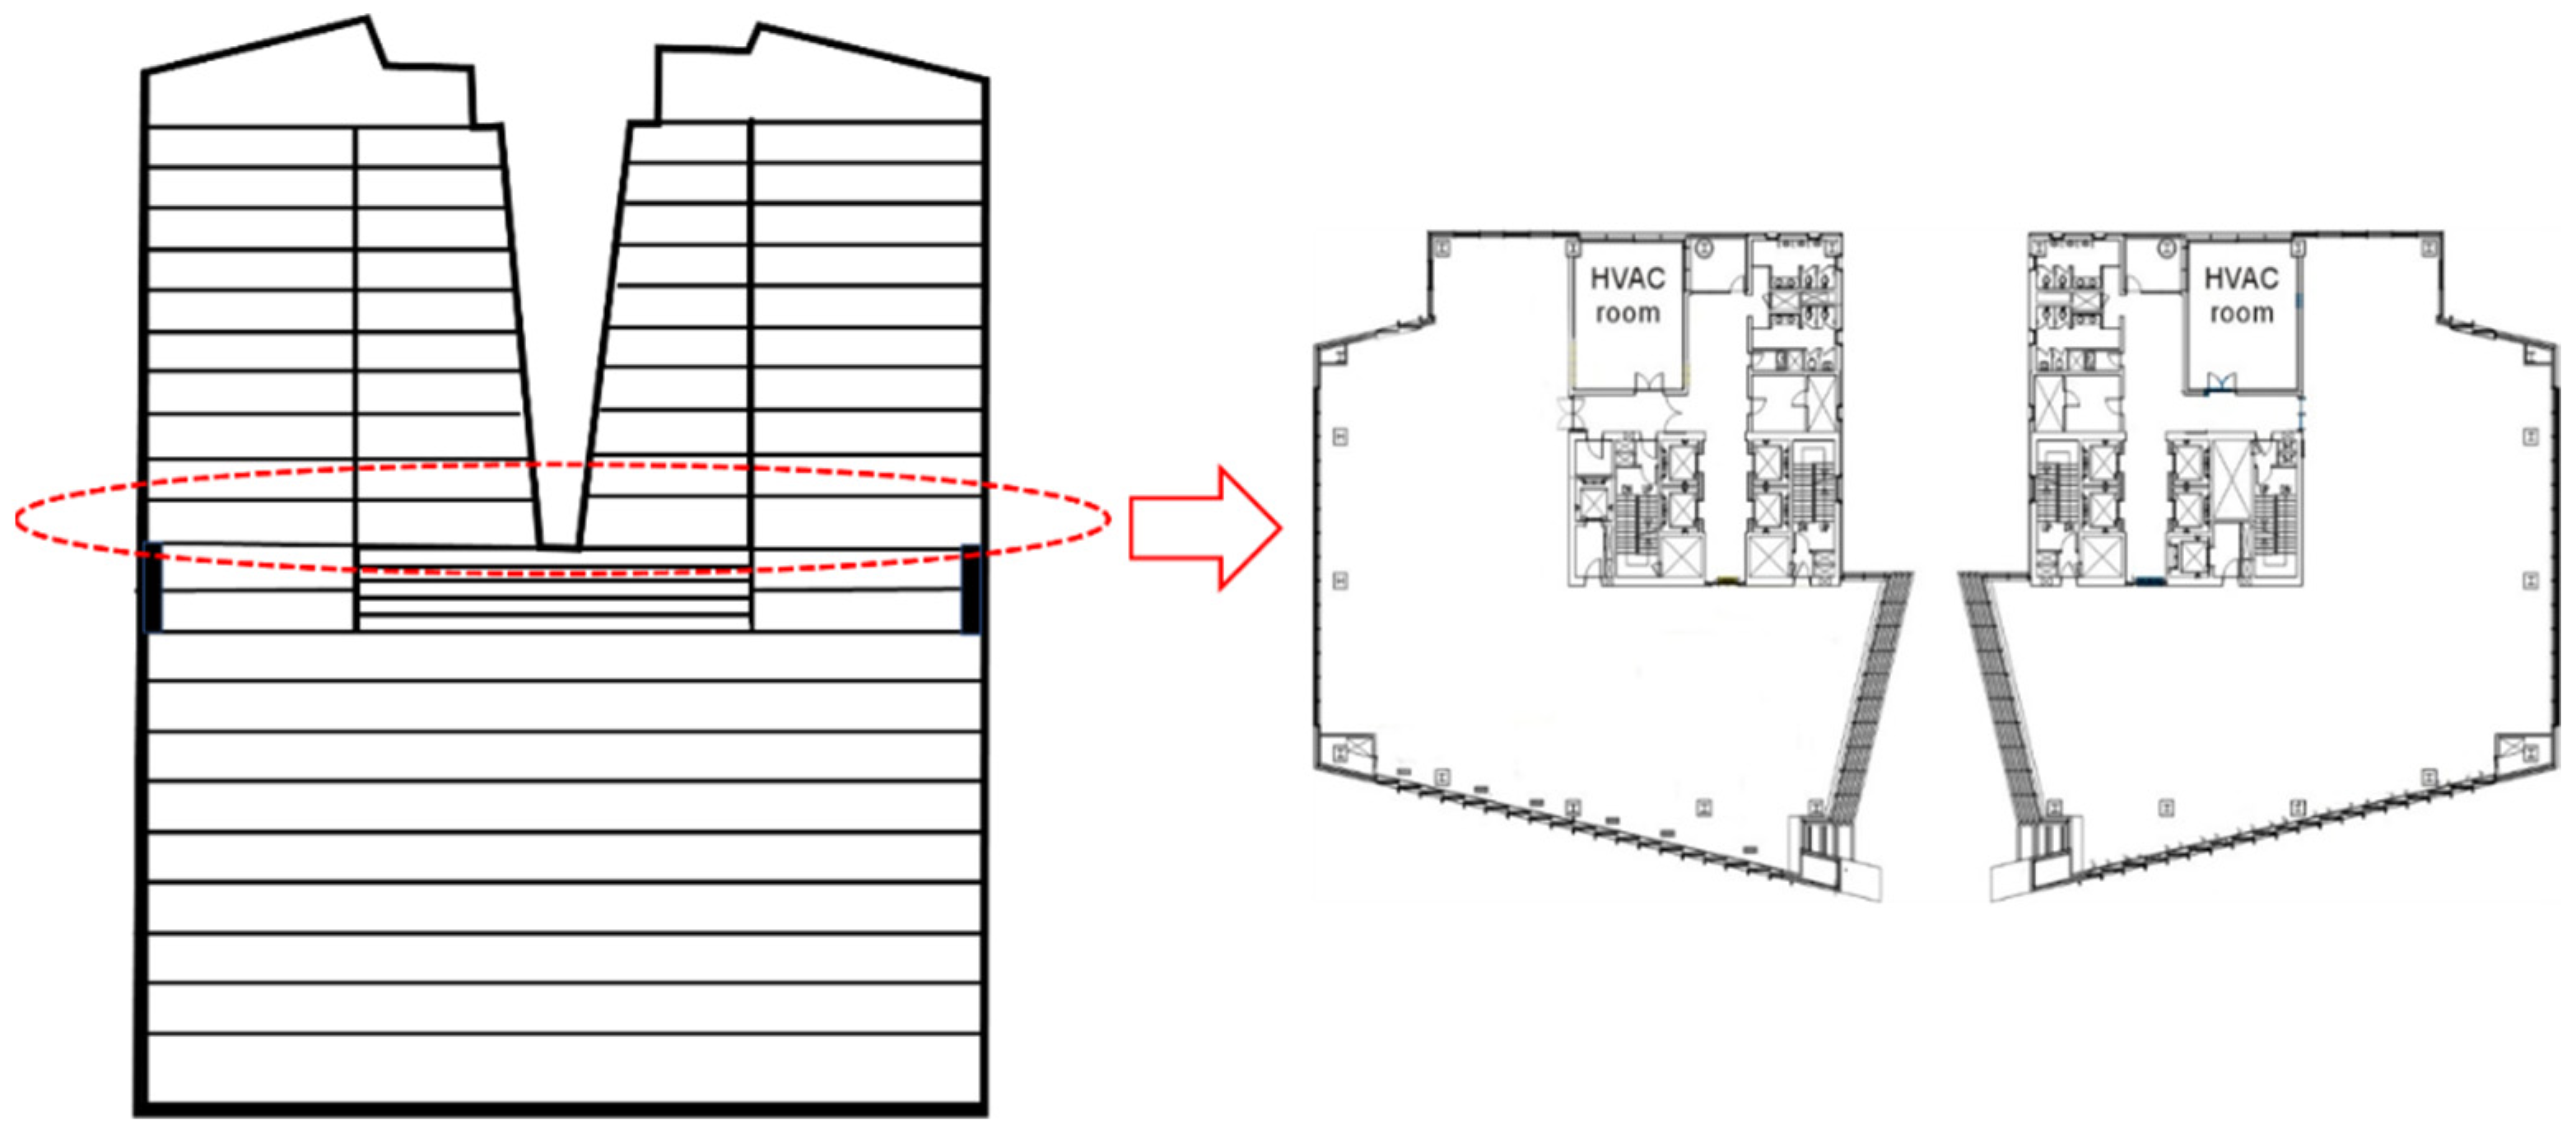
As mentioned earlier, the present study investigated the thermal performance in the perimeter zones due to solar radiation. For the methodology, the office building was chosen, which is located in Seoul, South Korea. The office building was built in 2007, and the gross floor area is 72,718 m2. The design characteristics of the building are as follows: it has 21 floors above ground and 7 floors below, and the main façade faces the west and is covered by glass. Figure 2 presents the main façade of the office building, and the specific information is available in Table 1. In addition, Figure 3 shows the cross-section and a plan of the 10th floor of the building.
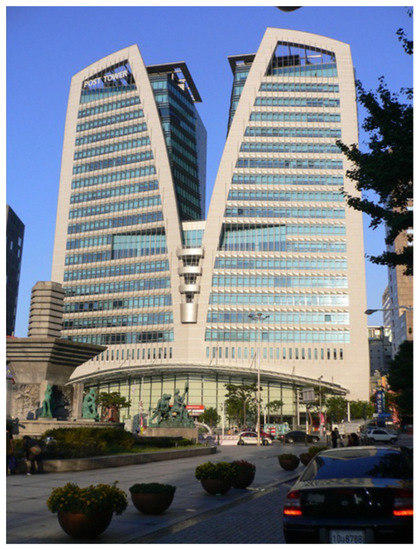
Figure 2.
The main façade of the office building.

Table 1.
The office building description.
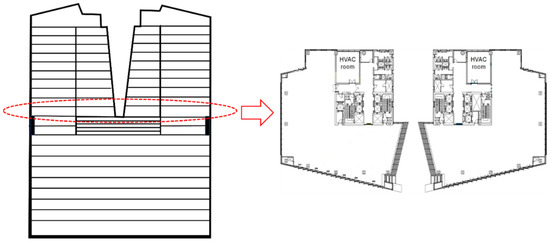
Figure 3.
A cross-section and a plan of the 10th floor.
3.2. Energy Simulation
To find out the impact of solar radiation on the cooling load, the energy consumption was calculated by using IES VE software, which enables to conduct a whole building energy simulation [46]. The building model was created by using Sketchup, and the cooling load through the windows for each orientation was calculated by the VE-Apache module in IES VE software. The simulation was performed during the summer period (from May to September), and the internal heat gains were set based on the ASHRAE Standard [47]. The building model is presented in Figure 4, and the other details for the building energy simulation are below (Table 2 and Table 3). Since the reference building is located in Seoul, South Korea, the weather data of Seoul was used for the energy simulation. Specifically, Seoul is located at 37°34′ latitude and 126°98′ longitude, and its air temperature ranges from −13 °C to 33.4 °C [48]. By using the coefficient of variation of the root mean squared error (CV(RMSE)) provided by ASHRAE Guideline 14, the monthly energy consumption of the reference office building was compared with the energy simulation to validate the simulation results [49]. The models were declared to be calibrated if they produced CV(RMSE)s within ±15% with monthly energy data.
where Mi is the energy consumption of the office building, while Si is the monthly energy consumption according to the energy simulation. n is the period, and Mavg is the average for the energy consumption of the office building.
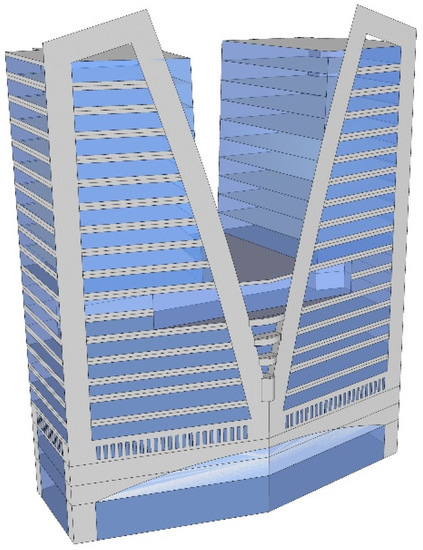
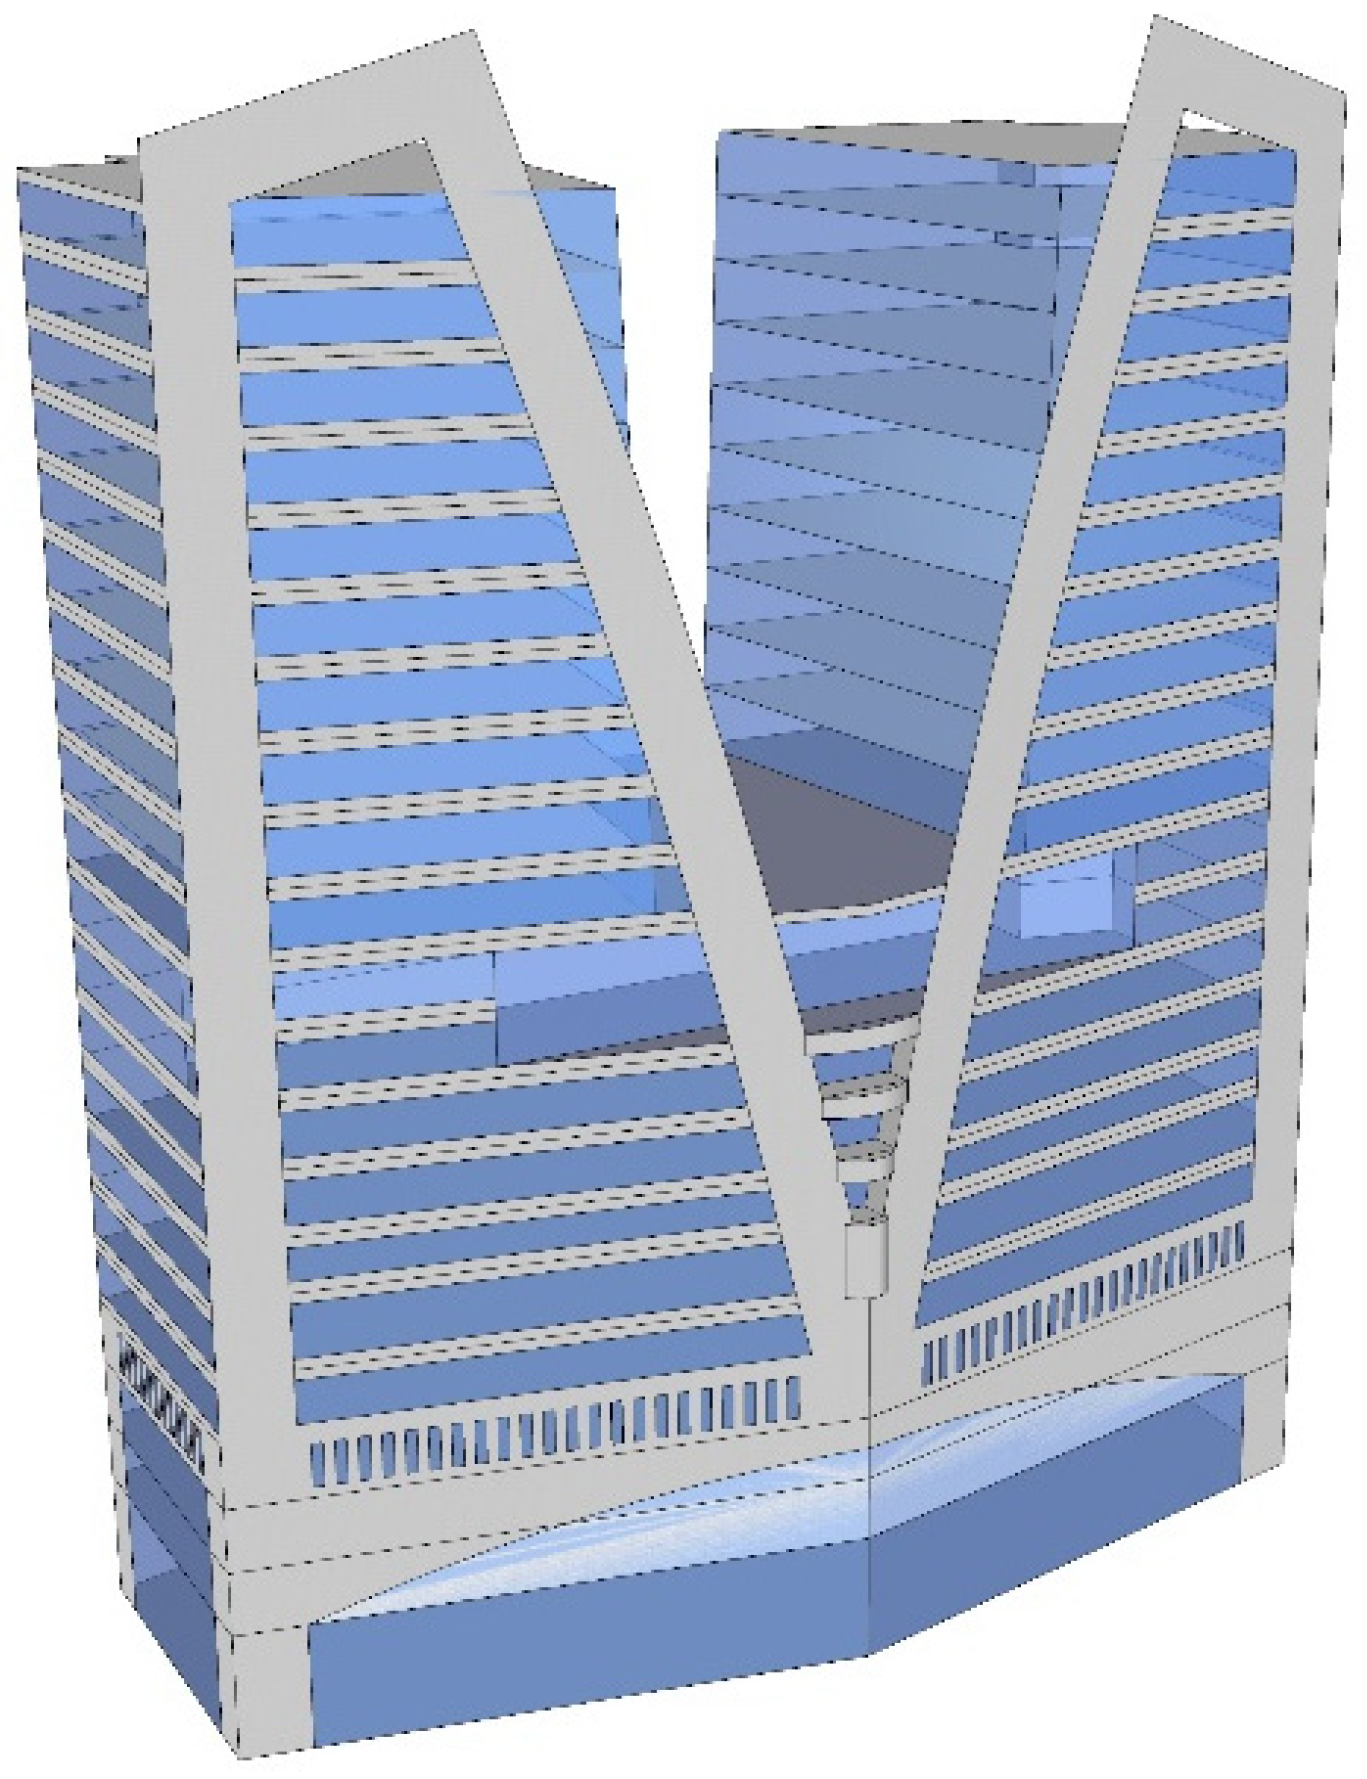
Figure 4.
The building model for the energy simulation.
Table 2.
Specifications for the energy simulation.
Table 3.
Specifications for the window systems.
4. Results
4.1. The Comparison between the Energy Simulation and the Monthly Energy Consumption
To validate the energy simulation, the monthly energy consumption of the reference office building was compared with the energy prediction by the simulation. The total energy consumption of the office building was about 123,400 kWh, while there was about a 4% decrease in the energy use predicted by the energy simulation. As shown in Figure 5 and Table 4, the largest difference was observed in October. Since the results were within the acceptable range, the results predicted by the simulation met the requirement by ASHRAE Guideline 14 [49].
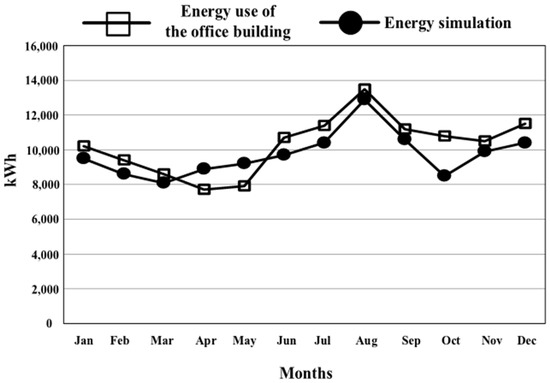
Figure 5.
Energy consumption comparison between the reference office building and the energy simulation.
Table 4.
The monthly energy consumption comparison.
4.2. The Analysis of Cooling Loads by Solar Radiation
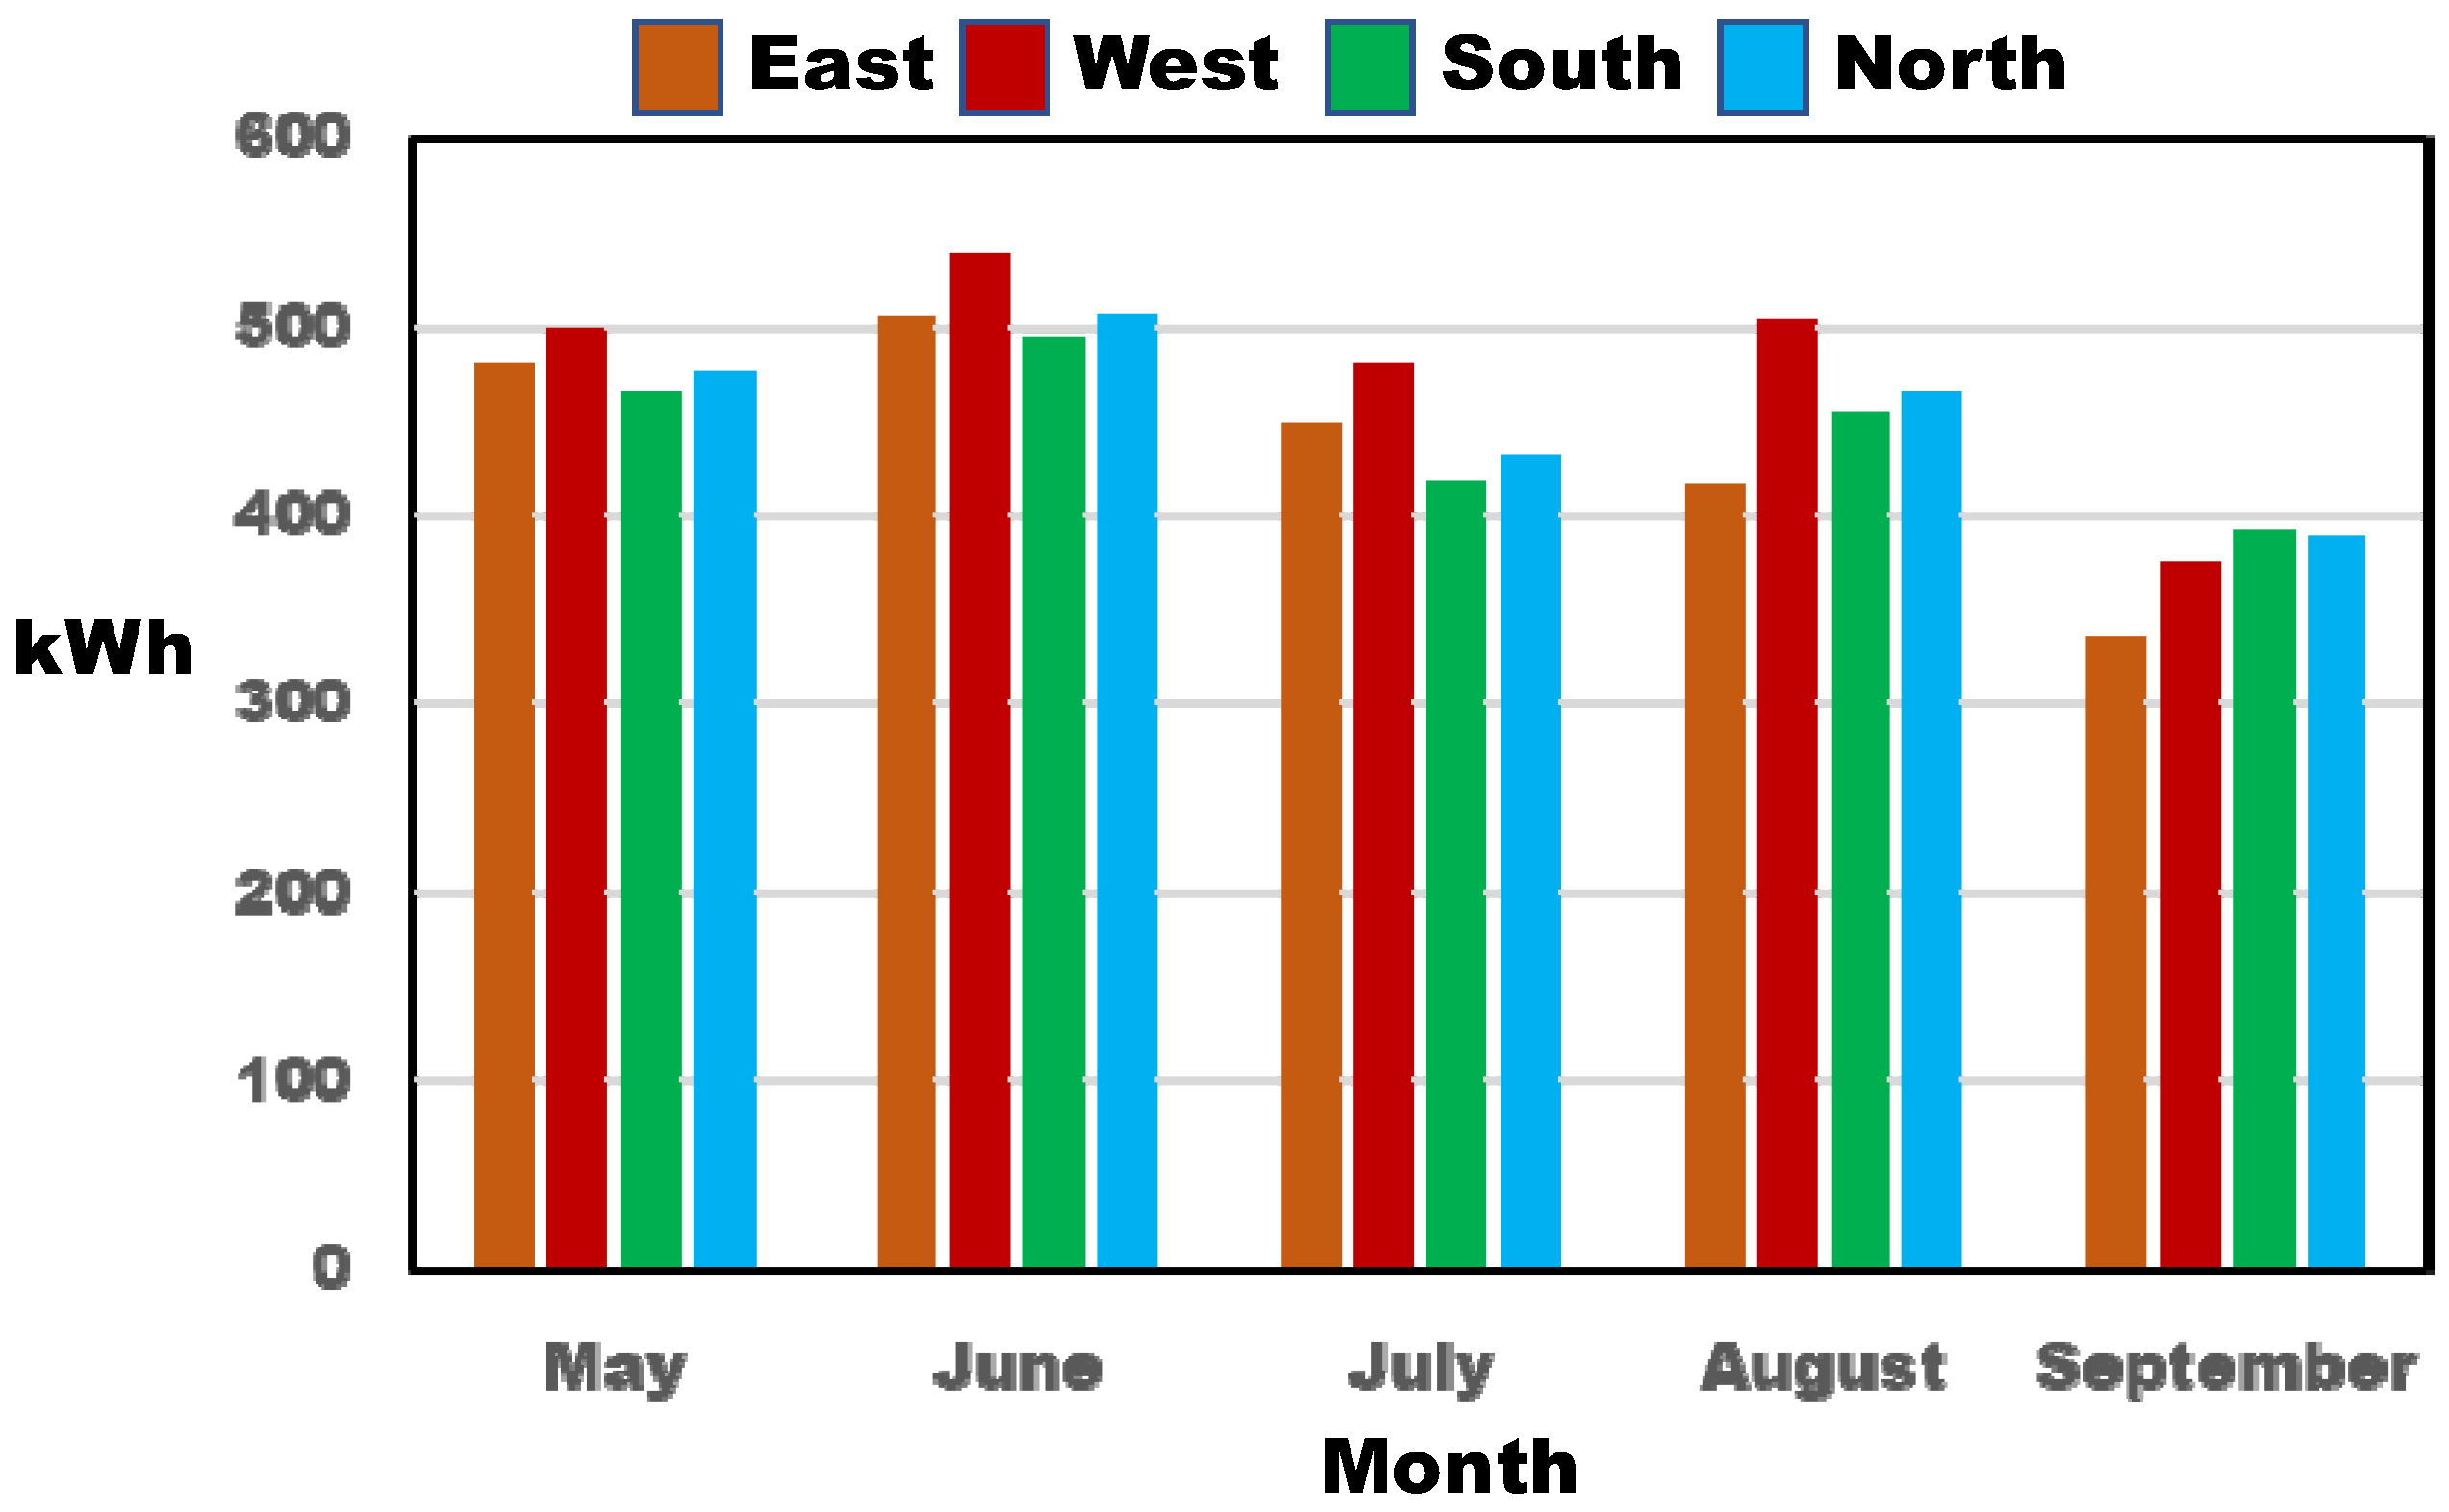
After the validation of the energy simulation by using IES VE software, the energy consumption of the reference office building by orientations was calculated. Figure 6 and Table 5 show the cooling loads by different building orientations from May to September. As can be shown, the biggest cooling load was observed when the building faced west, while the minimum cooling load was calculated when the main façade faced south. Since South Korea is in the northern hemisphere, the admitted solar radiation is minimized. Oppositely, the admitted solar radiation is maximized with the west building orientation, caused by a low angle of the sun. In addition, when the building faces west, the cooling load is worsened in the summer more than in the winter due to longer days in the summer. Moreover, all the cooling loads on the graph decreased rapidly in September. It can be seen that solar radiation is reduced by seasonal change.
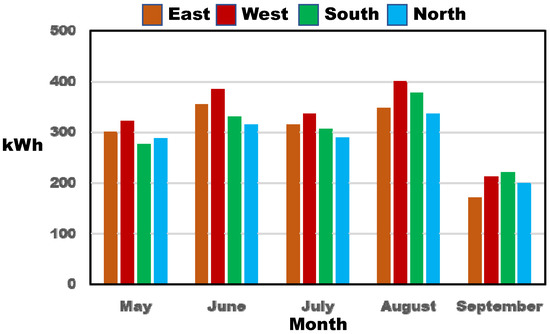
Figure 6.
Cooling loads per building orientation during the summer.
Table 5.
The cooling loads during the summer by building orientation.
In addition, the solar radiation for each building orientation was compared, as presented in Table 6. As shown in Figure 7, a similar trend was observed with the cooling loads for building orientations. The solar radiation admitted from the west was the biggest due to the longest sun exposure in the afternoon. Thus, the glazed façade facing west can be susceptible to solar radiation during the summer, as well as cause the largest cooling loads.
Table 6.
Solar radiation during the summer by building orientation.

Figure 7.
Solar radiation by building orientation during the summer.
4.3. Field Measurements
Previously, the west façade caused the largest cooling loads during the summer. To figure out how the sunlight has an impact on thermal behaviors in the perimeter zones, a thermal parameter, such as temperature, was measured. In addition, the effectiveness of the HVAC system was investigated to observe how to remove the loads caused by solar radiation.
4.4. HVAC System for Reducing the Loads
For the office building, a variable air volume (VAV) underfloor air distribution system was used to provide appropriate airflow to control thermal behaviors in the perimeter zones, as shown in Figure 1. To reduce the loads through the windows at the west façade due to solar radiation, the air barrier system was employed. The air barrier system used supply air provided by the underfloor air distribution system. The airflow headed to the interior of the west façade through the roller blind. The setpoint temperatures for the summer and winter were 26 °C and 22 °C, respectively. The relative humidity for the summer and winter was set as 50%. The components of the air barrier system installed in the selected building are presented in Figure 8.
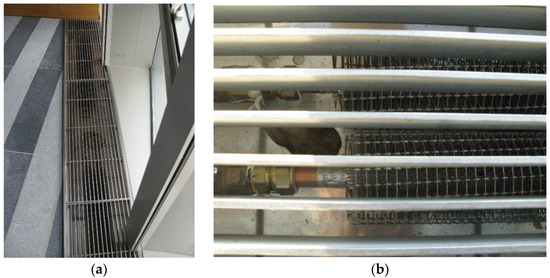
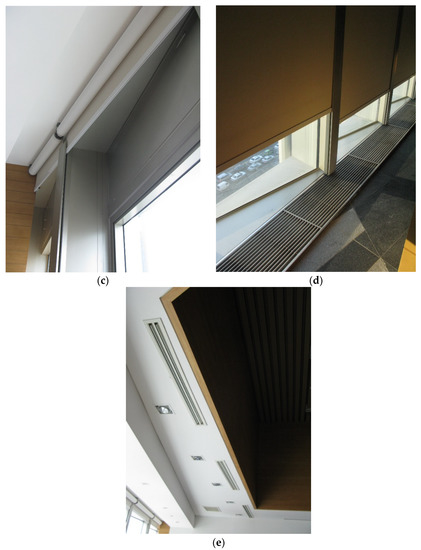
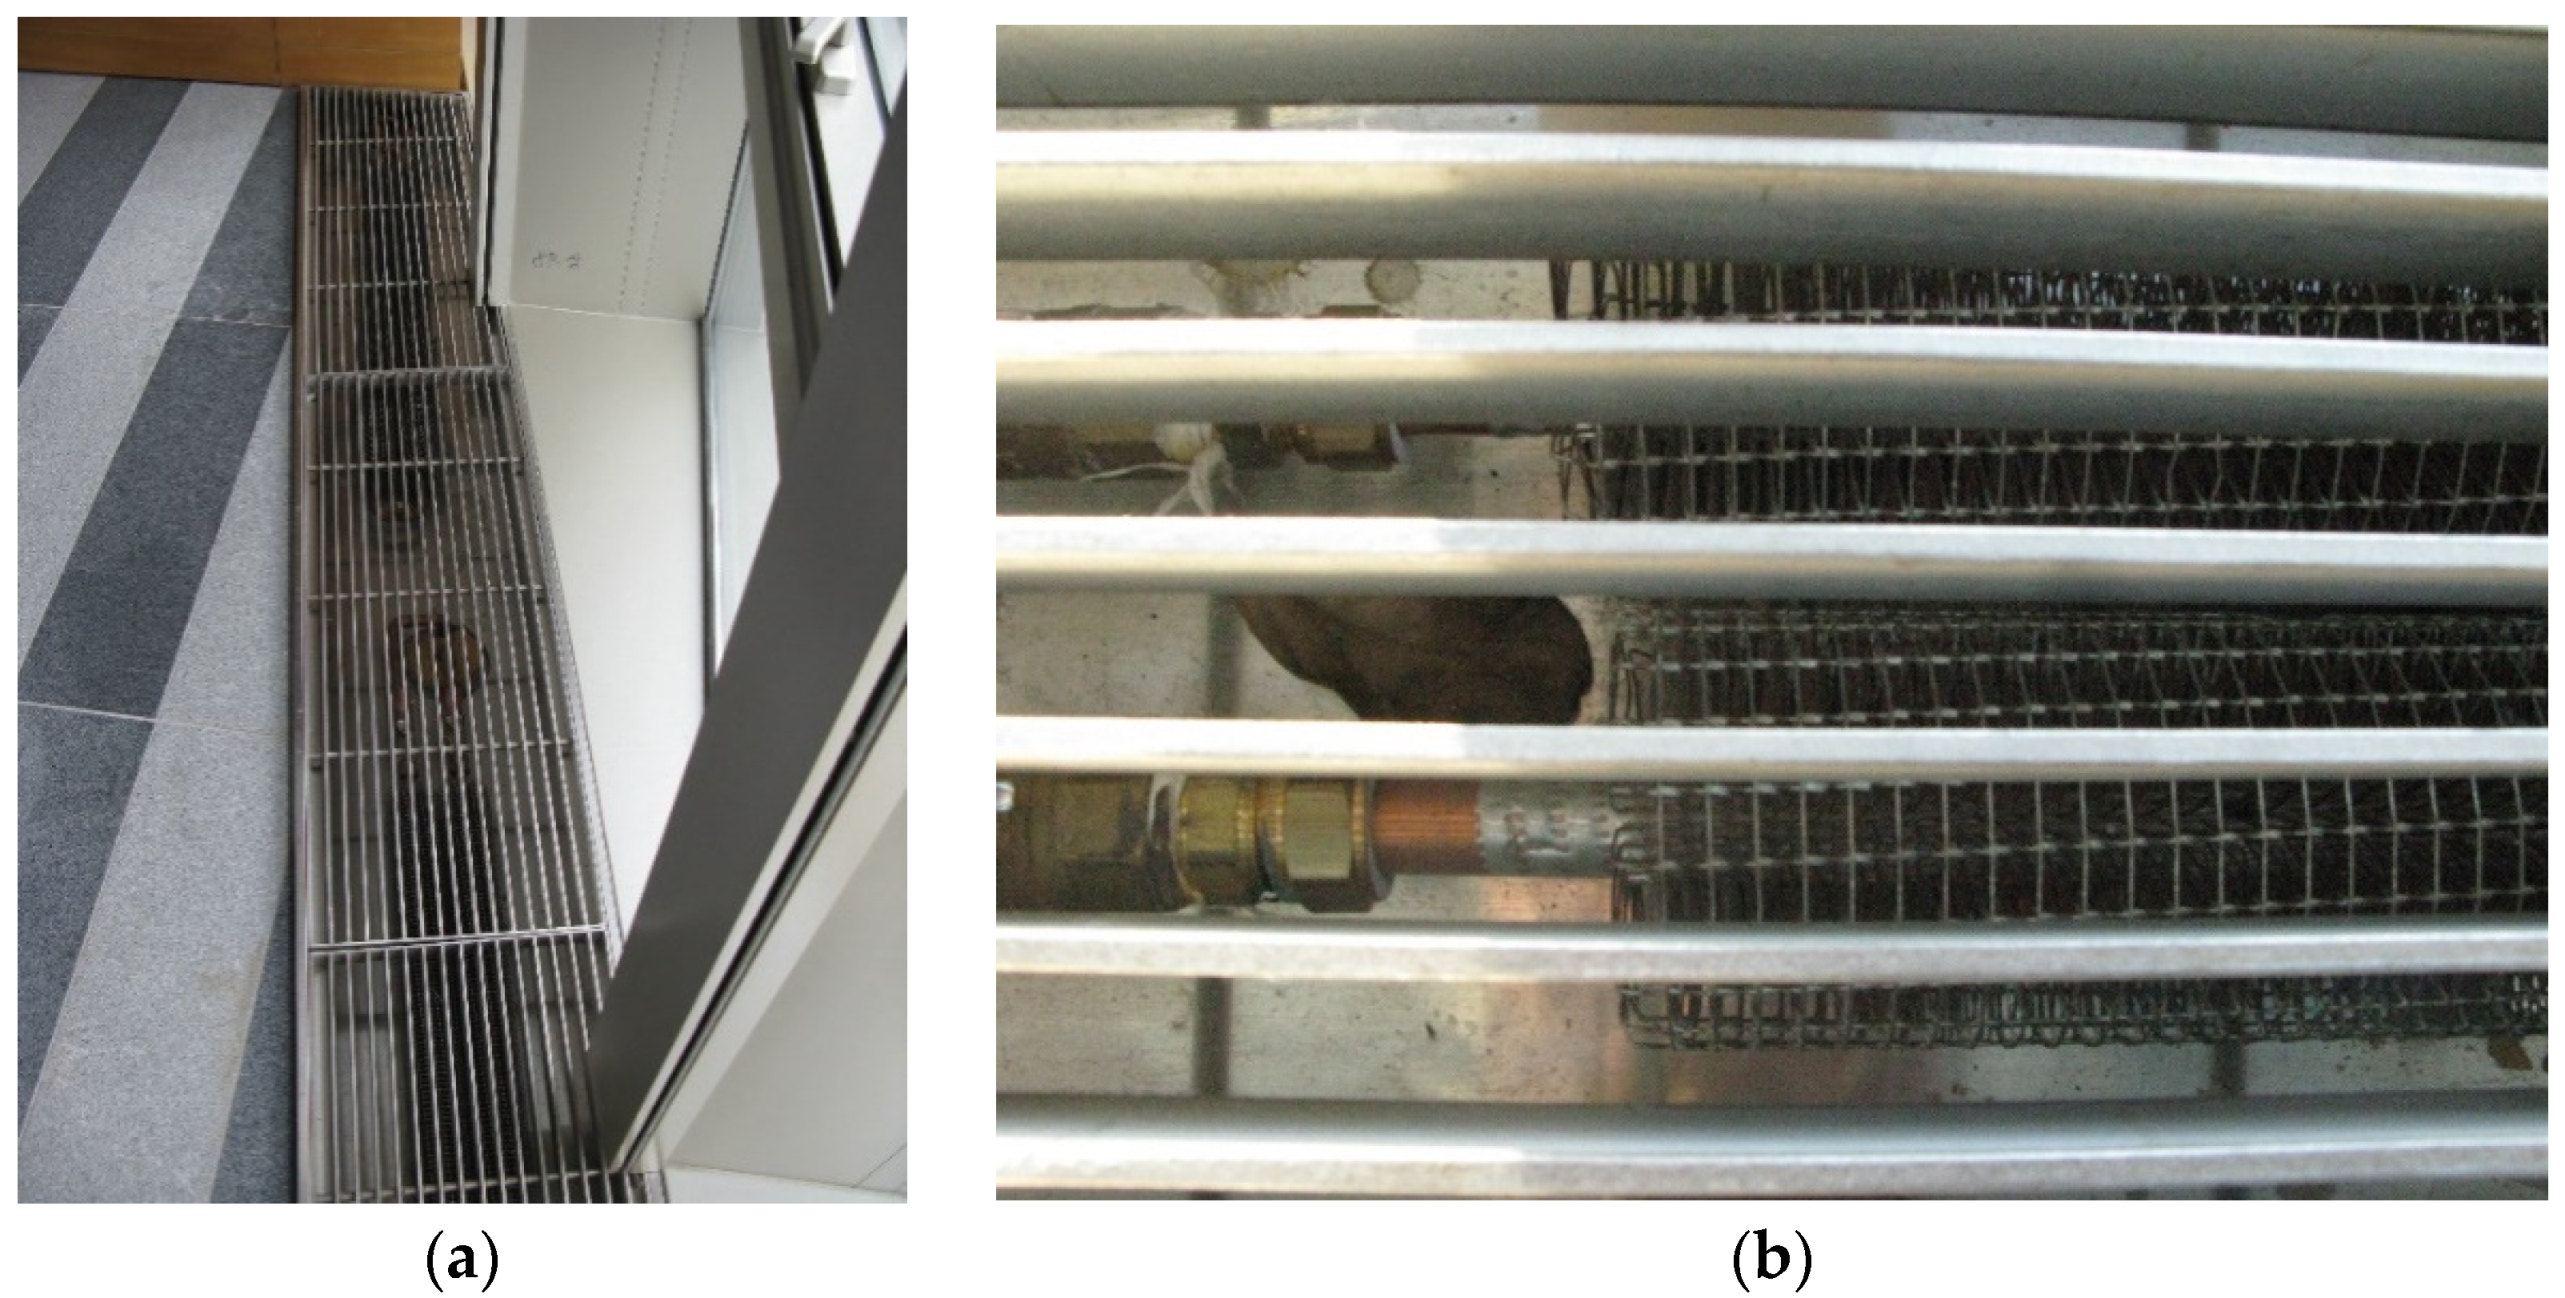
Figure 8.
The components of the air barrier system: (a) the underfloor air distribution system; (b) D FPU in the underfloor air distribution system; (c) roller blind: open; (d) roller blind: closed; (e) EA vents in the ceiling.
4.5. Measurements for Thermal Performance in the Perimeter Zone
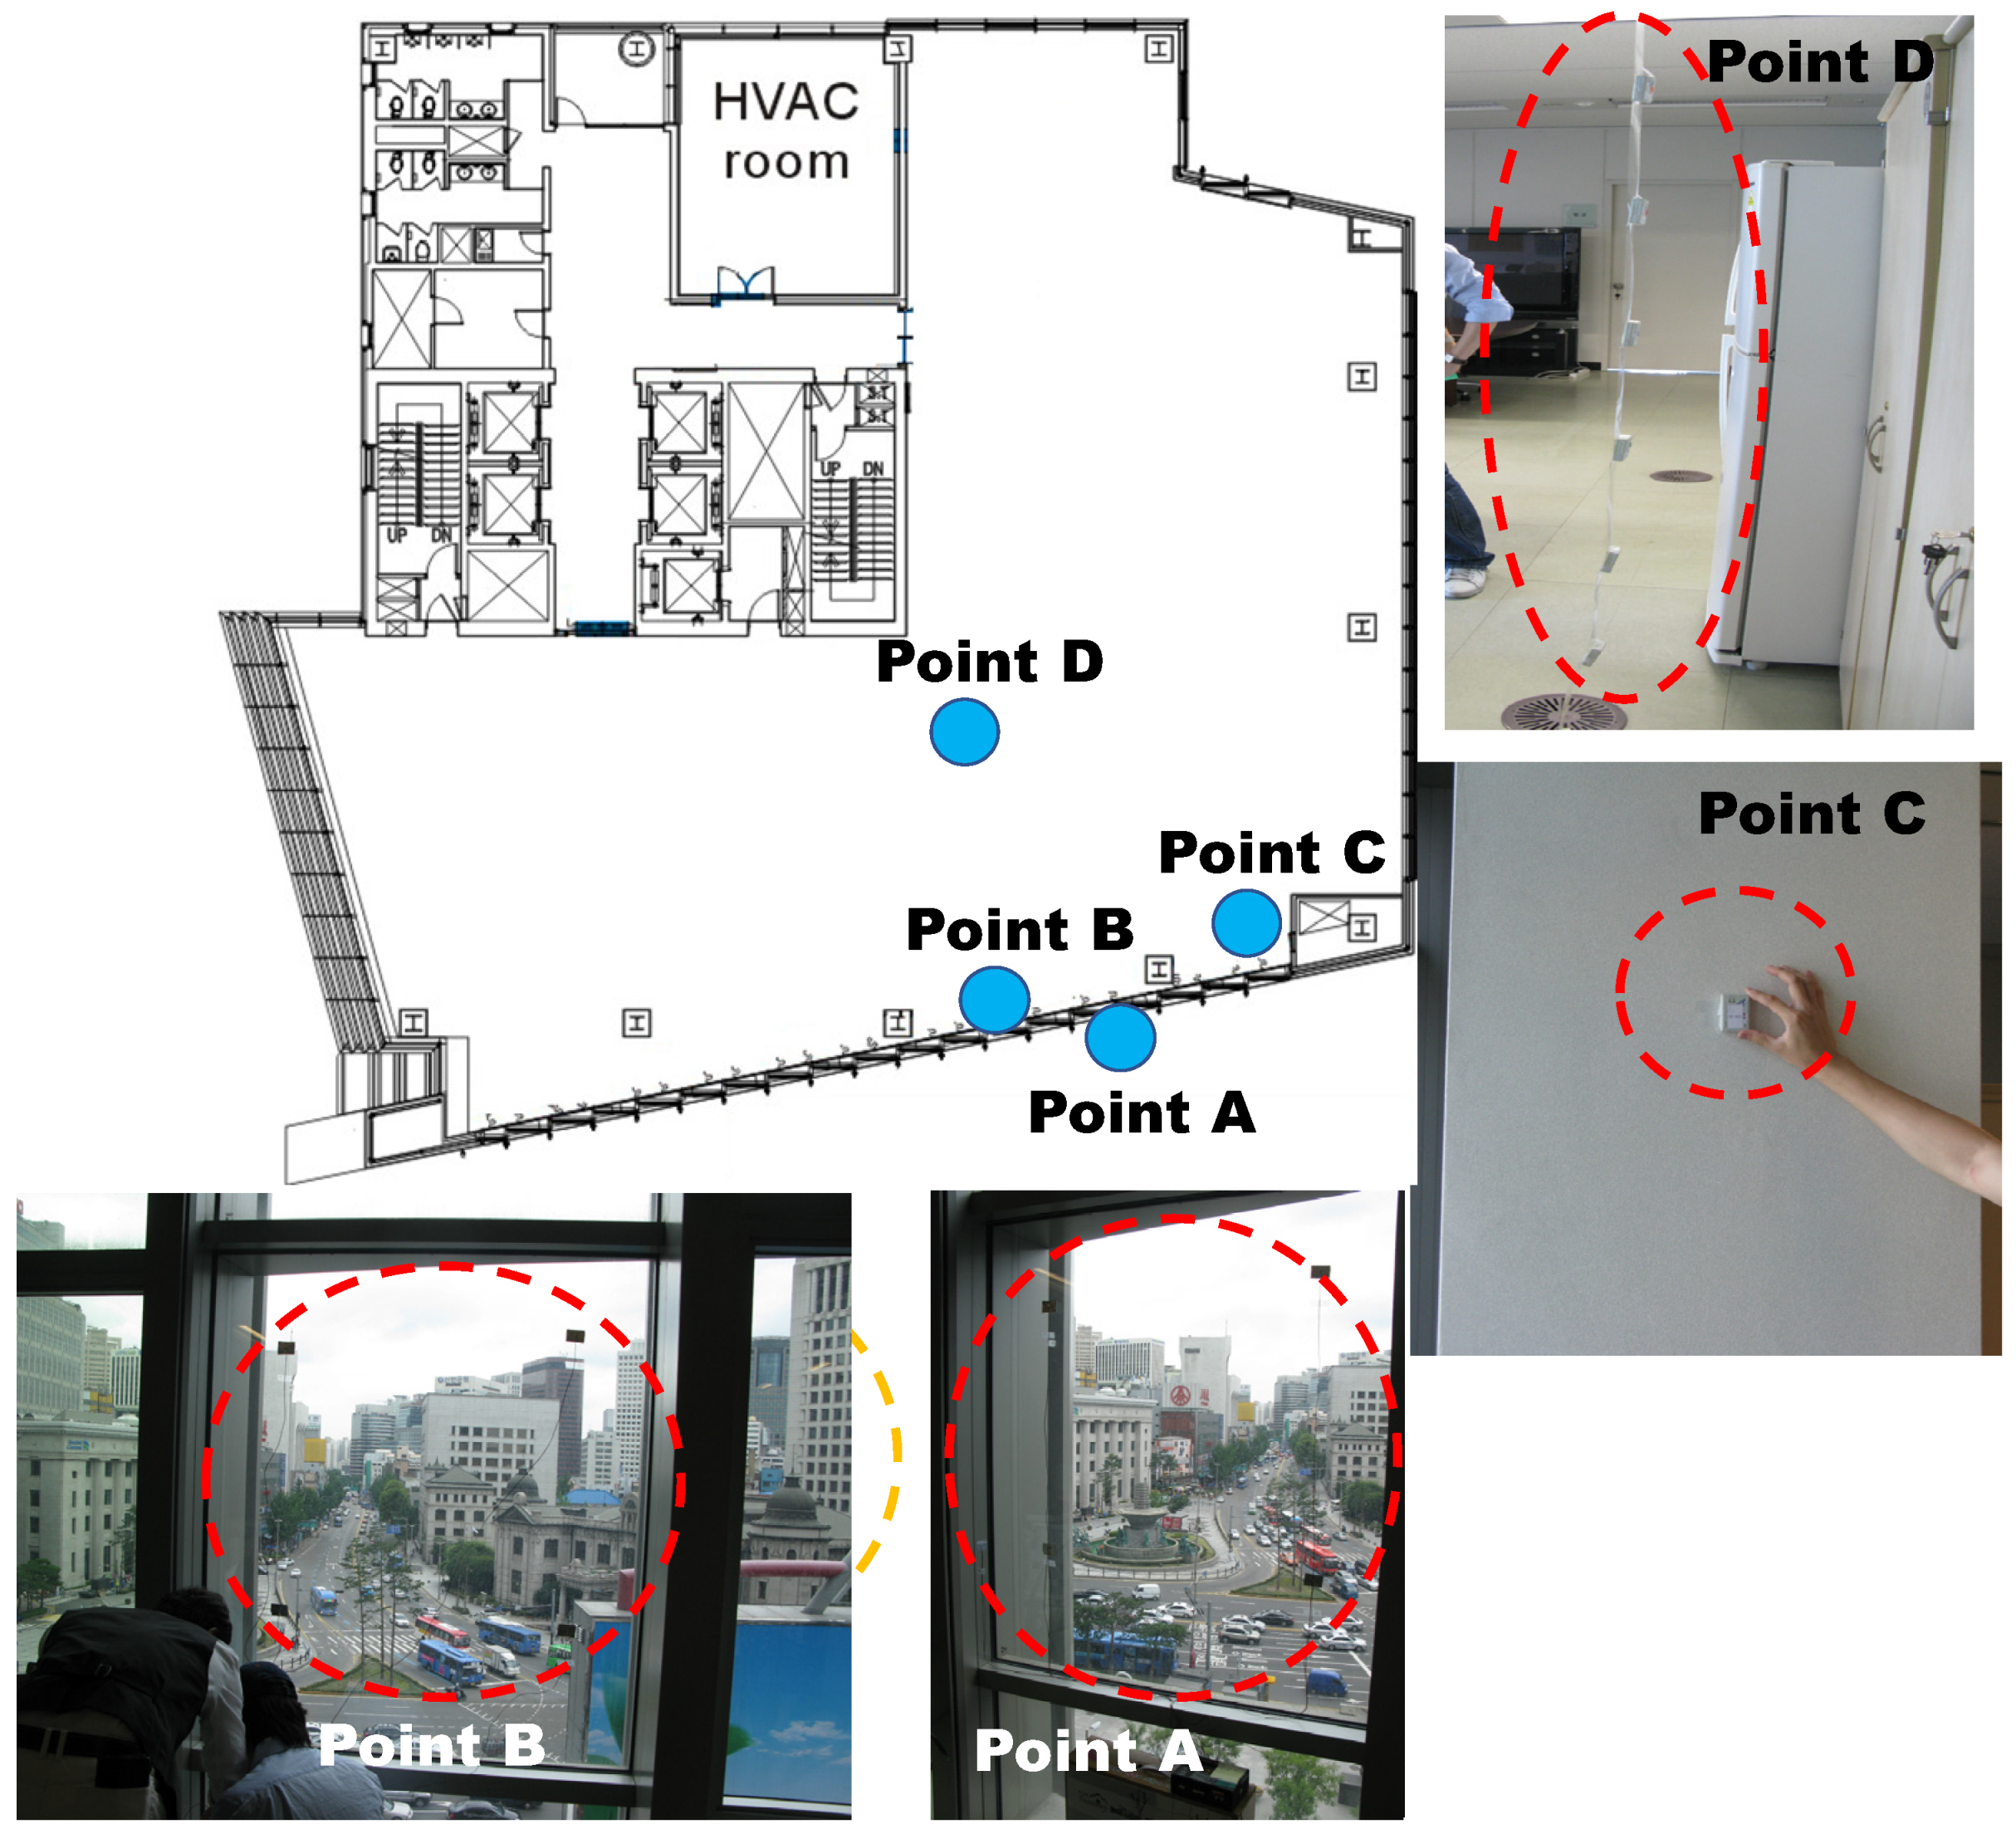
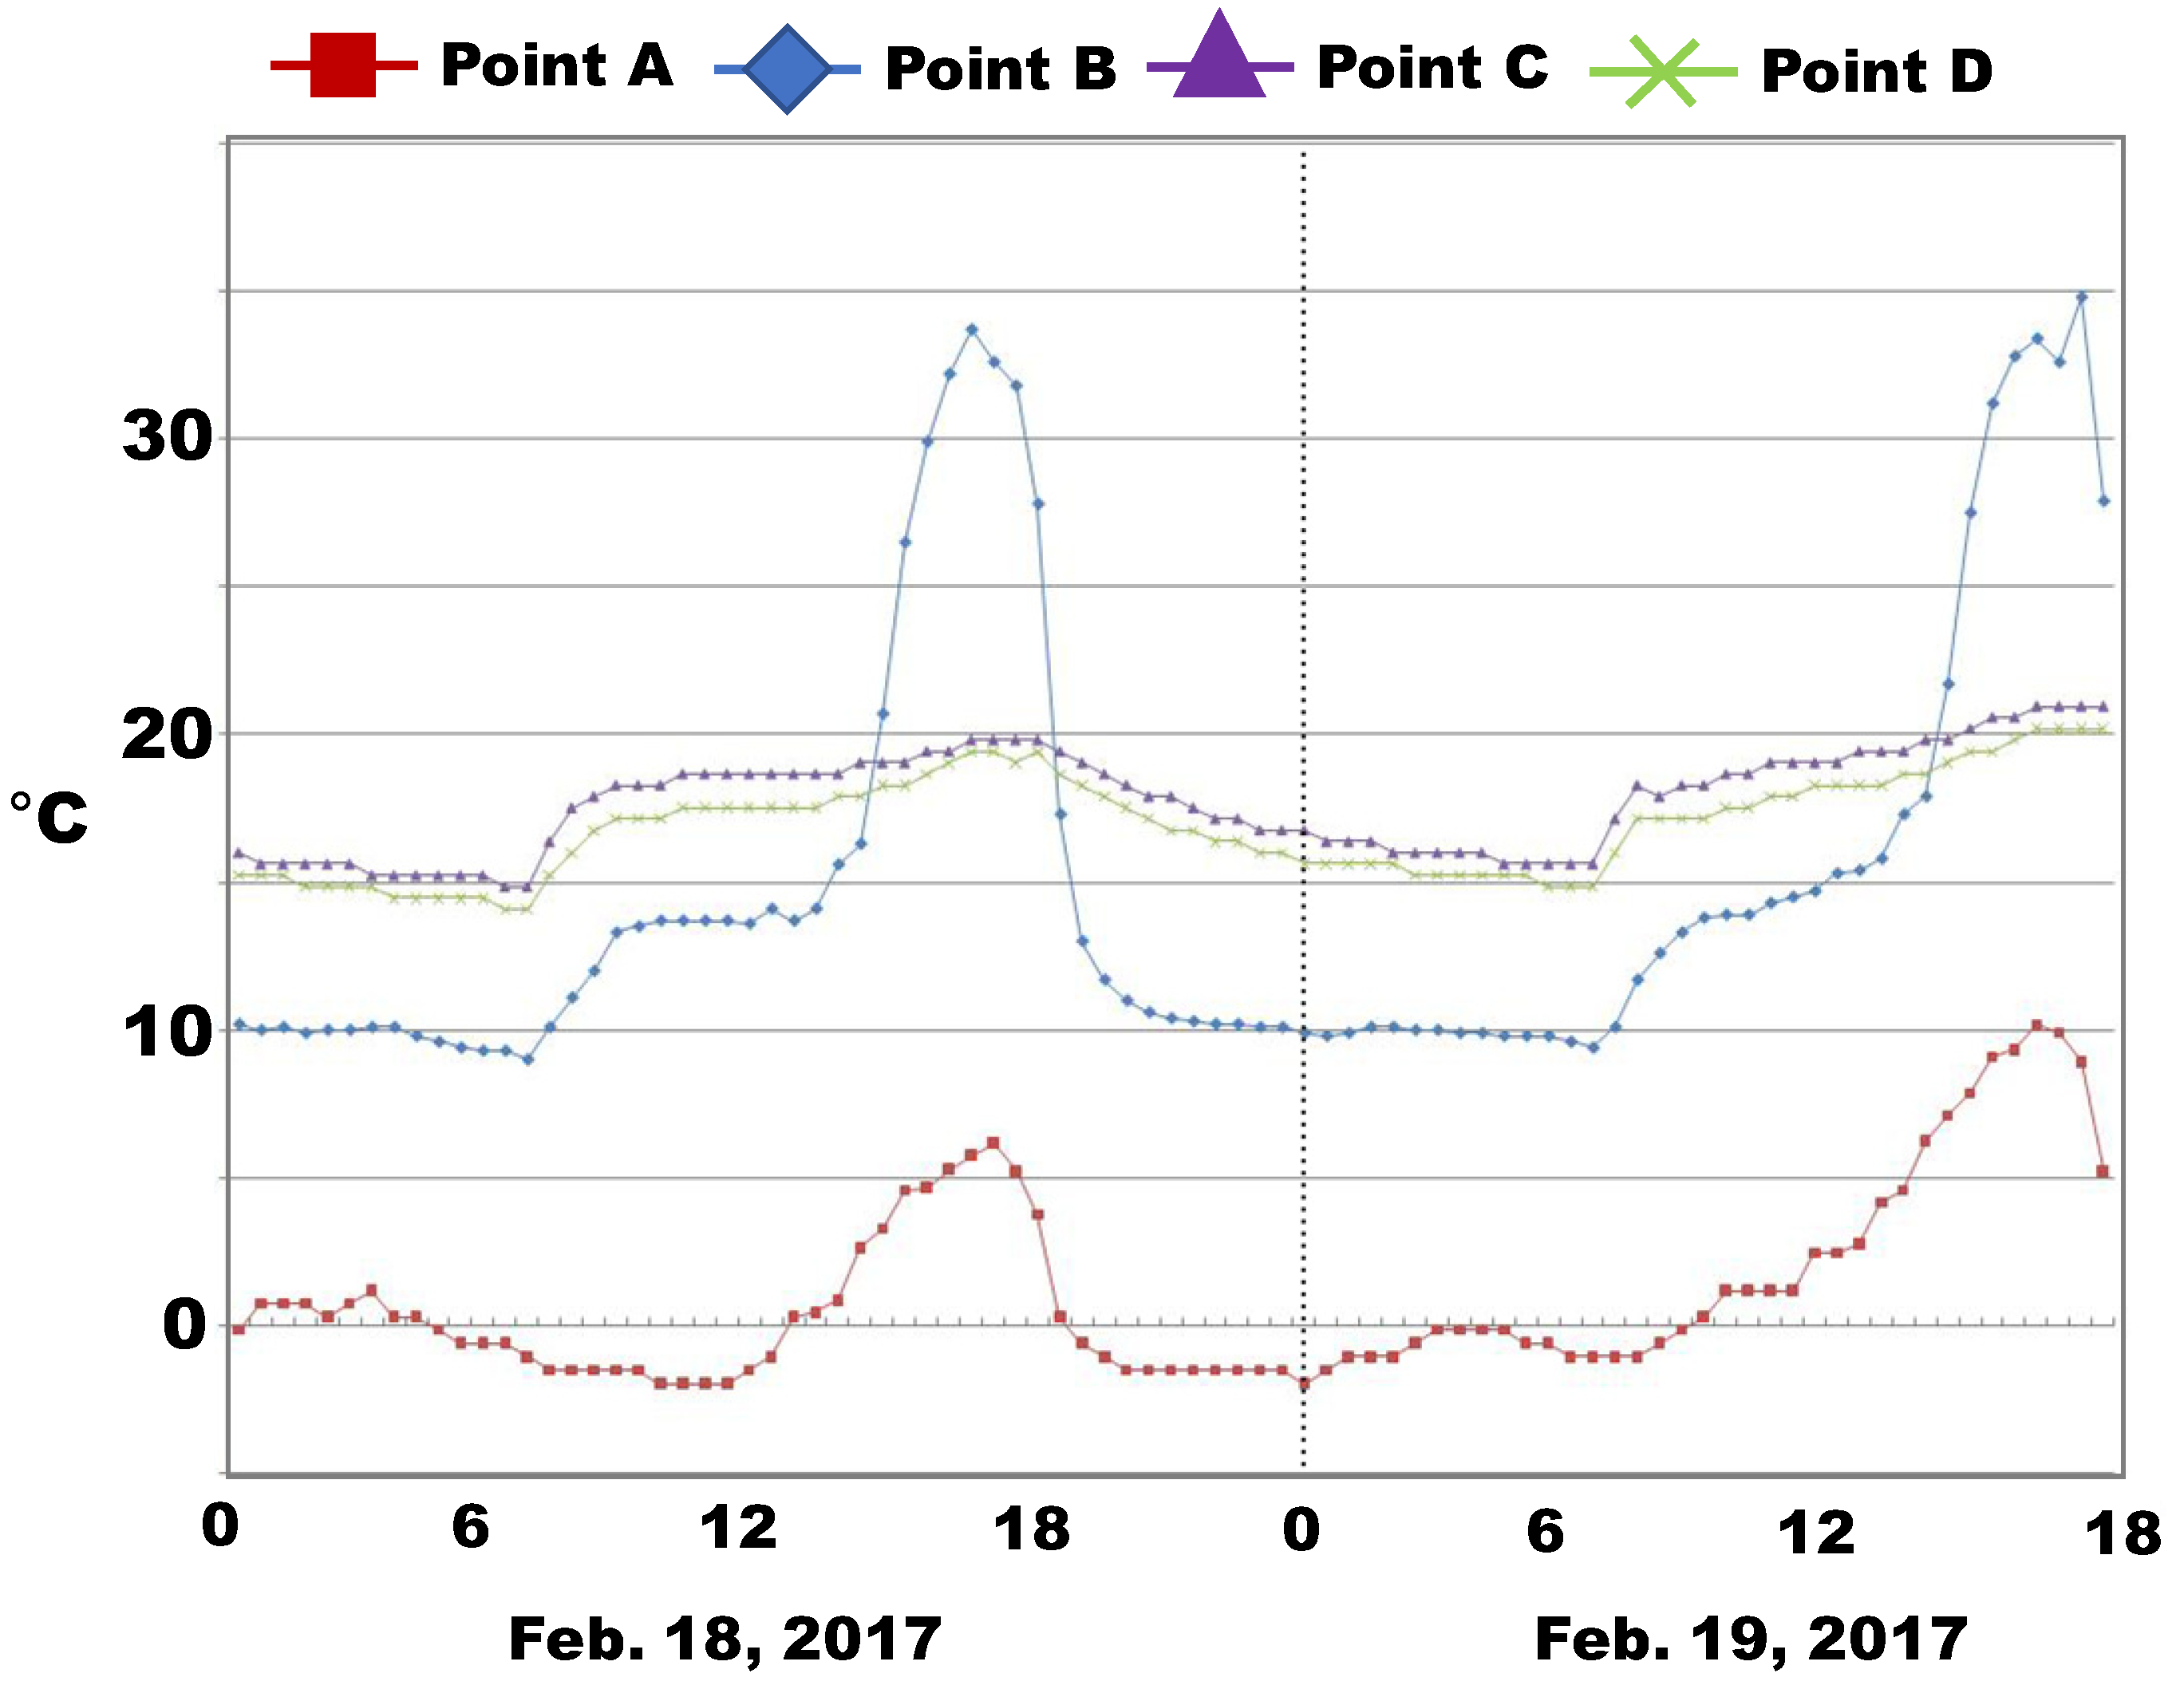
The present study performed measurements to find out the thermal performance in the perimeter zone. On the 5th and 10th floor, four points were selected for the measurements, as shown in Figure 9. Sensors were located at Point A and B, which were the exterior and interior surfaces of the window, respectively. The other two sensors were attached at Point C (the interior wall) and Point D (the middle of the office space). For the measurements, K-type thermocouples and Hobo were used, and the specifications of the equipment are presented in Table 7. The measurements were performed for 56 h (18–19 February 2017), and the data were recorded every 30 min.
Figure 9.
Measurement locations.
Table 7.
The specifications of the equipment.
4.6. The Analysis of the Measurement Results
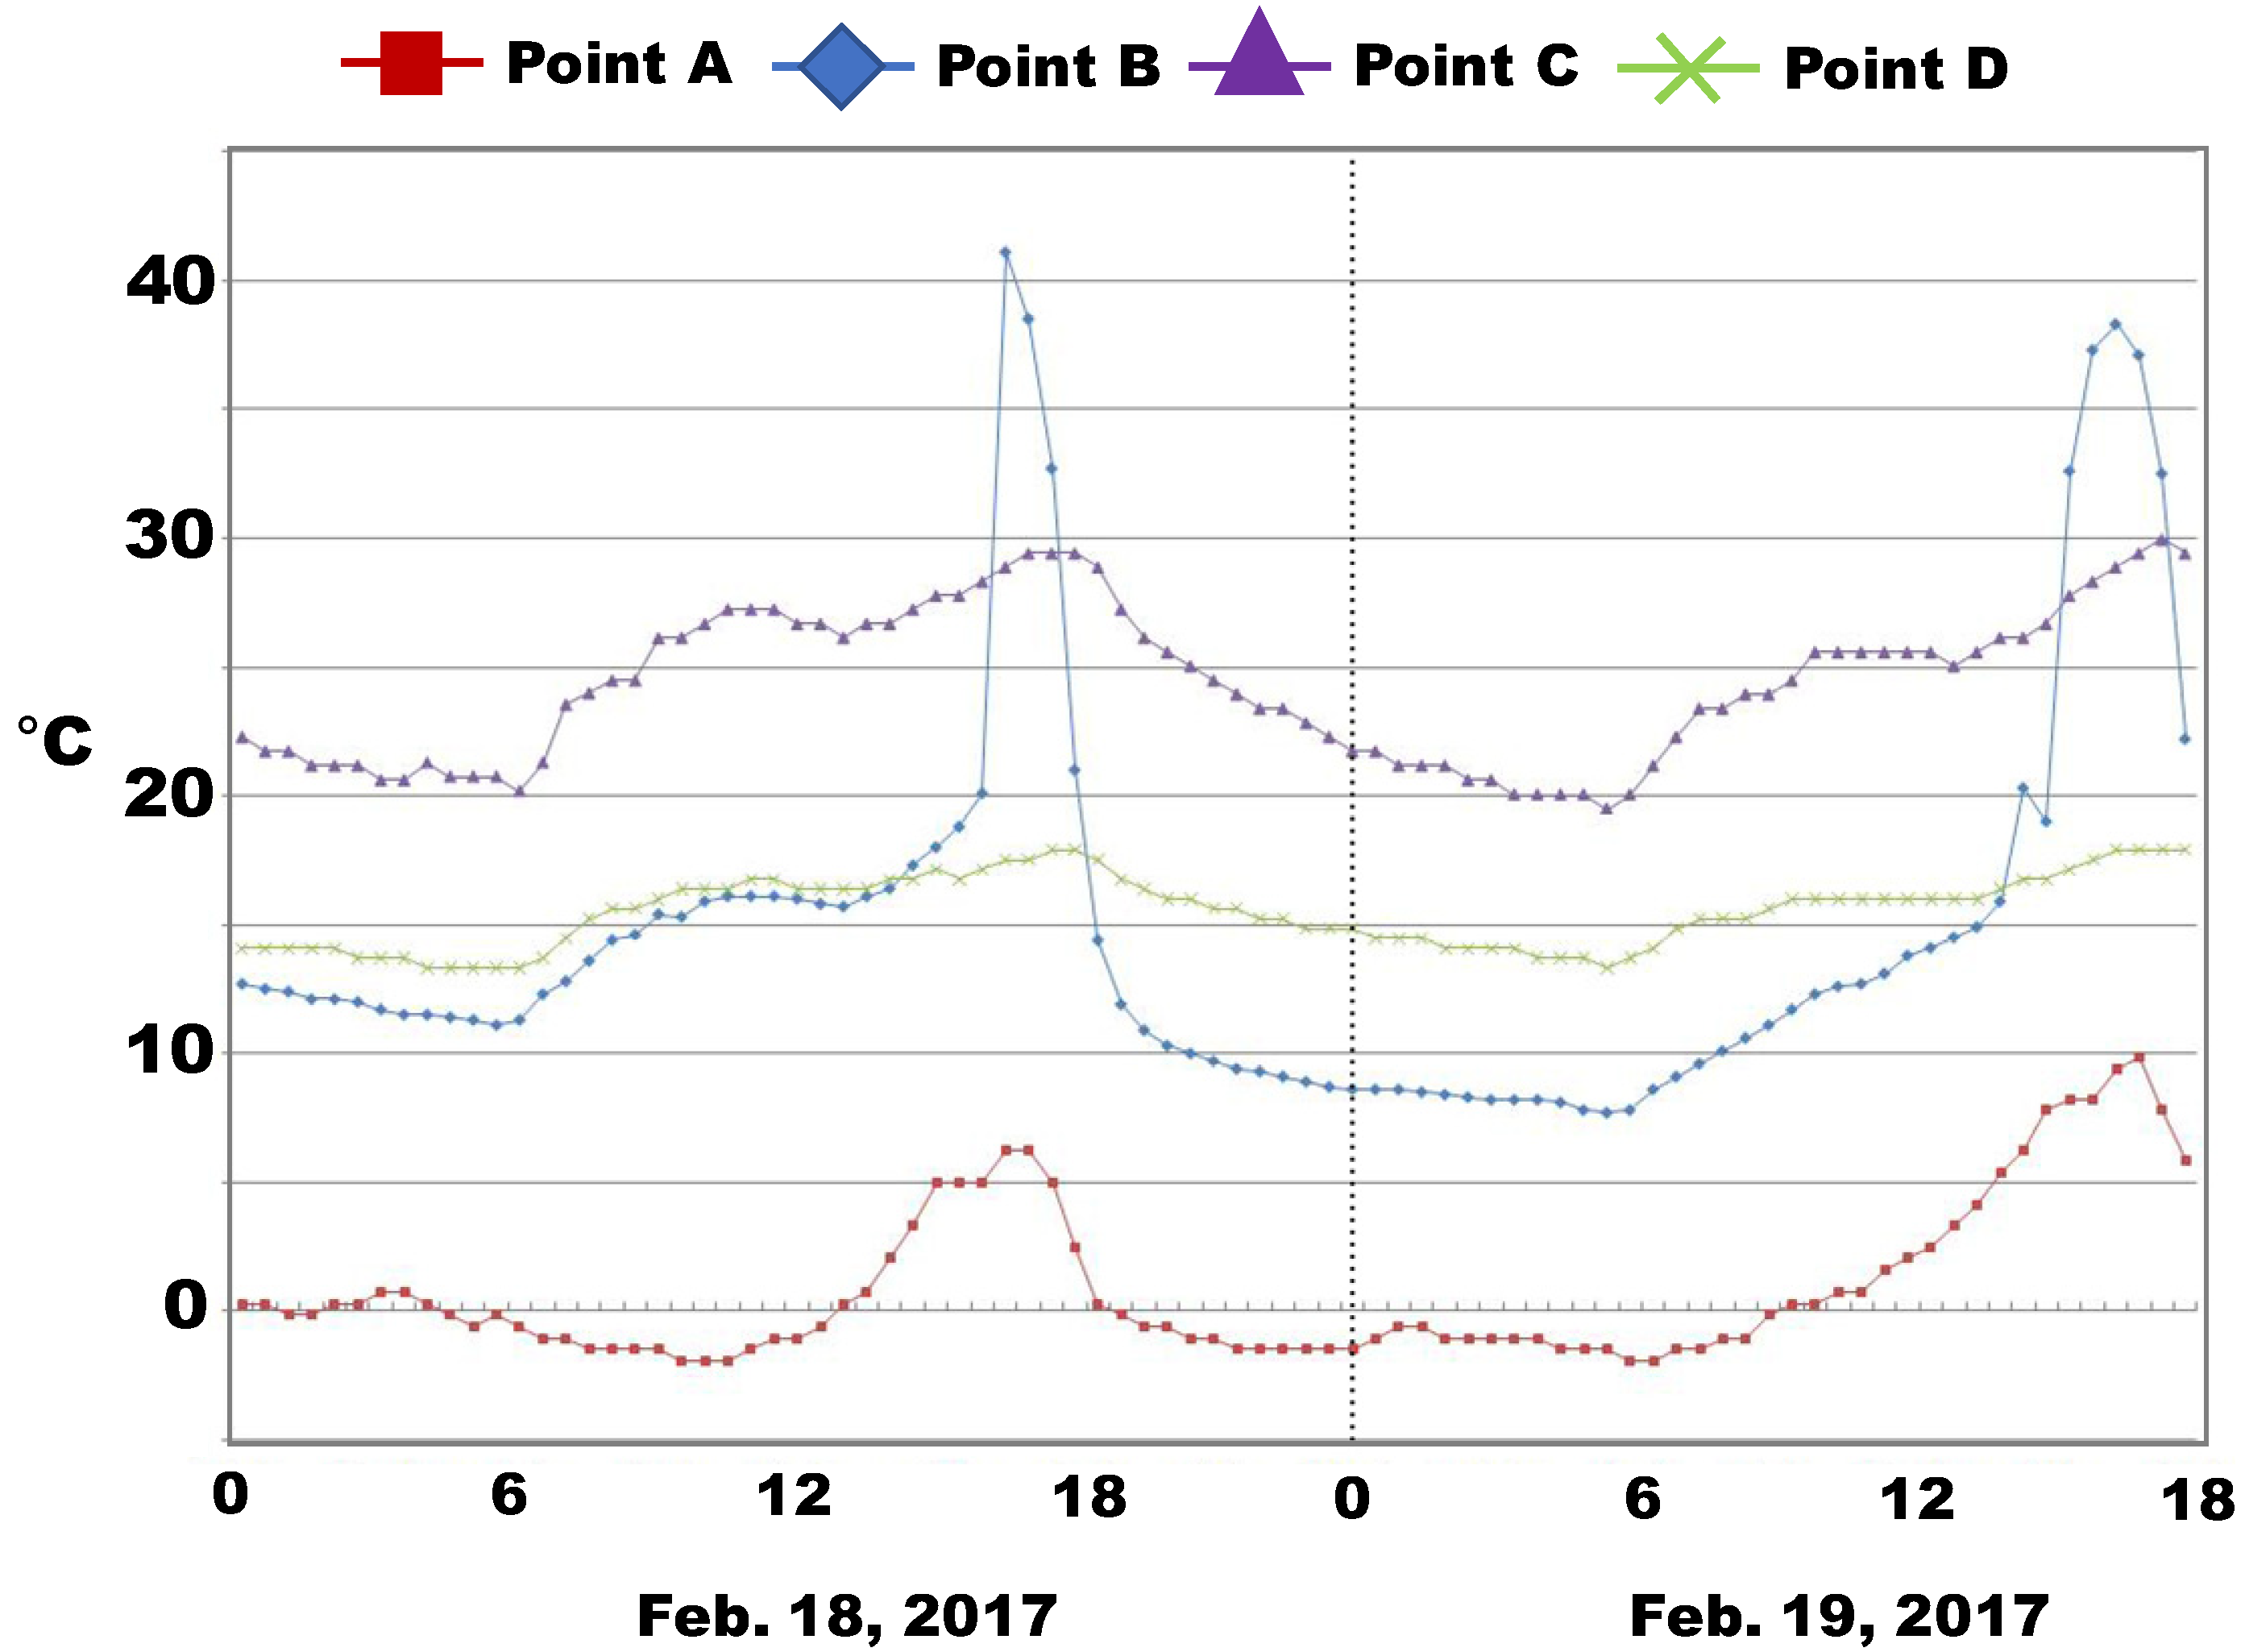
The measurement results are shown in Figure 10 and Figure 11. In Figure 10, the biggest temperature (about 35 °C) on the 5th floor was observed at the interior surface of the glass during 3 PM–6 PM due to the maximum exposure of the sun to the west façade. In addition, a similar trend was observed in the temperatures of Point C and Point D. The temperature difference between these two points was about 1 °C–2 °C, and the temperature at Point C was higher than that at Point D. It can be seen that heat from solar radiation increased indoor temperatures. In the case of the temperature distributions on the 10th floor (Figure 11), similar temperature trends to the temperature distributions on the 5th floor were shown. However, the temperature at the interior surface was higher than that of the 5th floor, at about 40 °C. This was caused by direct sunlight, because there were no neighboring buildings higher than the 10th floor. This also affected the temperature increase in the perimeter zones on the 10th floor, which was about 5 °C higher than that of the 5th floor.
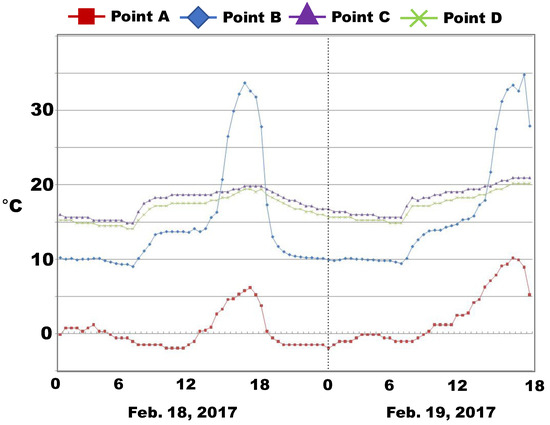
Figure 10.
Measurement results at the 5th floor.
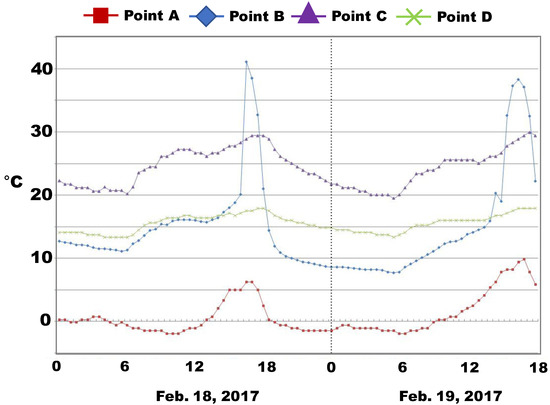
Figure 11.
Measurement results at the 10th floor.
5. Discussion
As shown in the simulation results, the biggest cooling load was observed in the perimeter zones through the west façade during the summer. Thus, it requires the largest cooling load to maintain thermal comfort in these spaces. This was also pointed out by the study by Fabiana et al. [50]. They applied green facades to reduce cooling loads. According to the study by Shanshan et al., the highest air temperature was observed near the west-facing façade [51]. To reduce the accumulated heat effectively, they applied various façade design variables. While most studies focused on façade design variables, shadings, and others, the present study employed a simple air barrier system. As introduced earlier, this system utilizes the airflow provided by the existing HVAC systems. Thus, it can be used effectively for reducing cooling loads in existing buildings. Regarding the measurement results, the temperatures in the perimeter and core zones (Point C and D) were more stable than the temperature of the interior surface of the windows. It can be seen that the airflow provided by the air barrier system effectively reduces peak loads caused by solar radiation. Since the measurements were performed during the winter, more effective ways of reducing the cooling loads during the summer are required, such as additional shading devices. Moreover, the present work was performed for the climate conditions in South Korea, in which the temperatures of the summer and the winter generally reach 35 °C–40 °C and −15 °C–0 °C, respectively. While there is a difference in temperatures, the outcome of the study can be helpful for the design of perimeter zones in the international context, except for deserts and subtropical climates regarding the cooling loads.
Regarding energy modeling, energy simulation results can be influenced by different thermal zonings. In the study by Shin and Haberl, they applied new thermal zoning strategies for heating- and cooling-dominant climates [25,35,52]. Based on the recommendations of this study, it is required to consider this point to assess cooling and heating strategies by clustering and analyzing thermal zone profiles.
Another important point is the design of the diffusers from the underfloor air distribution system. As mentioned in previous studies, the airflow rates and patterns are important in creating vertical thermal stratifications for reducing cooling loads in perimeter zones in office buildings. These airflow rates and patterns can be varied by the design of diffusers. For the present study, an FPU unit was employed to lead the airflow to the windows. For further study, the impact on airflow rates created by various designs of diffusers needs to be investigated. Once the effectiveness of reducing cooling loads by the design of diffusers is verified, the energy for an FPU unit can be saved.
6. Conclusions
Focusing on the thermal and energy performances in perimeter zones, the present study found out the most susceptible building orientation regarding the cooling loads during the summer by using an energy simulation tool. In addition, the solar radiation impact on the thermal performance in the perimeter zones was practically investigated through field measurements. To reduce the cooling loads in the perimeter zones, an air barrier system was utilized. The outcomes of the study were as follows:
- Among building orientations, the biggest cooling load was observed in the perimeter zones facing the west façade through the windows during the summer and winter through the energy simulation and field measurements;
- According to the measurement results, the highest temperature was observed at the internal surface of the windows during the winter, and the peak temperatures were 35 °C and 40 °C on the fifth and tenth floors, respectively. For the perimeter and core zones, the temperature was stably maintained on these two floors. The average temperatures for the perimeter zones and the average temperatures were about 19 °C and 25 °C on the fifth and tenth floors, respectively;
- The heat generated by the sun on the west façade during the winter was effectively reduced by the air barrier system. However, more effective ways of reducing the cooling loads during the summer are required.
Further study is required to investigate the impact on reducing cooling loads in perimeter zones by utilizing the combined design strategies of active systems and façade design variables. In addition, the effectiveness of design variables of diffusers in underfloor air distribution systems needs to be investigated.
Author Contributions
Conceptualization, methodology and resources, T.L.; Investigation and project administration, W.-S.Y.; Software, formal analysis, validation, writing-original draft preparation, writing—review and editing and visualization, D.-D.K. All authors have read and agreed to the published version of the manuscript.
Funding
This research received no external funding.
Institutional Review Board Statement
Not applicable.
Informed Consent Statement
Not applicable.
Data Availability Statement
Not applicable.
Conflicts of Interest
The authors declare no conflict of interest.
References
- Oh, M.; Jang, K.M.; Kim, Y. Empirical analysis of building energy consumption and urban form in a large city: A case of seoul, south korea. Energy Build. 2021, 245, 111046. [Google Scholar] [CrossRef]
- Lei, L.; Chen, W.; Wu, B.; Chen, C.; Liu, W. A building energy consumption prediction model based on rough set theory and deep learning algorithms. Energy Build. 2021, 240, 110886. [Google Scholar] [CrossRef]
- Pi, Z.X.; Li, X.H.; Ding, Y.M.; Zhao, M.; Liu, Z.X. Demand response scheduling algorithm of the economic energy consumption in buildings for considering comfortable working time and user target price. Energy Build. 2021, 250, 111252. [Google Scholar] [CrossRef]
- Braulio-Gonzalo, M.; Bovea, M.D.; Jorge-Ortiz, A.; Juan, P. Contribution of households’ occupant profile in predictions of energy consumption in residential buildings: A statistical approach from mediterranean survey data. Energy Build. 2021, 241, 110939. [Google Scholar] [CrossRef]
- Ding, Y.; Fan, L.; Liu, X. Analysis of feature matrix in machine learning algorithms to predict energy consumption of public buildings. Energy Build. 2021, 249, 111208. [Google Scholar] [CrossRef]
- Li, L.; Wang, Y.; Wang, M.; Hu, W.; Sun, Y. Impacts of multiple factors on energy consumption of aging residential buildings based on a system dynamics model–taking northwest china as an example. J. Build. Eng. 2021, 44, 102595. [Google Scholar] [CrossRef]
- Dong, Z.; Liu, J.; Liu, B.; Li, K.; Li, X. Hourly energy consumption prediction of an office building based on ensemble learning and energy consumption pattern classification. Energy Build. 2021, 241, 110929. [Google Scholar] [CrossRef]
- Agency, K.E. Energy Statistics Handbook. 2020. Available online: https://www.Energy.Or.Kr/web/kem_home_new/new_main.Asp (accessed on 20 August 2021).
- Motie. Renewable Energy 3020 Implementation Plan, Seoul, Korea. 2017. Available online: Http://www.Motie.Go.Kr/motiee/presse/press2/bbs/bbsview.Do?Bbs_seq_n=159996&bbs_cd_n=81 (accessed on 20 August 2021).
- Yoon, J.-H.; Sim, K.-H. Why is south korea’s renewable energy policy failing? A qualitative evaluation. Energy Policy 2015, 86, 369–379. [Google Scholar] [CrossRef]
- Kim, C. A review of the deployment programs, impact, and barriers of renewable energy policies in korea. Renew. Sustain. Energy Rev. 2021, 144, 110870. [Google Scholar] [CrossRef]
- Abdou, N.; El Mghouchi, Y.; Hamdaoui, S.; El Asri, N.; Mouqallid, M. Multi-objective optimization of passive energy efficiency measures for net-zero energy building in morocco. Build. Environ. 2021, 204, 108141. [Google Scholar] [CrossRef]
- Suh, H.S.; Kim, D.D. Energy performance assessment towards nearly zero energy community buildings in south korea. Sustain. Cities Soc. 2019, 44, 488–498. [Google Scholar] [CrossRef]
- Wu, W.; Skye, H.M. Residential net-zero energy buildings: Review and perspective. Renew. Sustain. Energy Rev. 2021, 142, 110859. [Google Scholar] [CrossRef] [PubMed]
- Qu, K.; Chen, X.; Wang, Y.; Calautit, J.; Riffat, S.; Cui, X. Comprehensive energy, economic and thermal comfort assessments for the passive energy retrofit of historical buildings-a case study of a late nineteenth-century victorian house renovation in the uk. Energy 2021, 220, 119646. [Google Scholar] [CrossRef]
- Stritih, U.; Tyagi, V.V.; Stropnik, R.; Paksoy, H.; Haghighat, F.; Joybari, M.M. Integration of passive pcm technologies for net-zero energy buildings. Sustain. Cities Soc. 2018, 41, 286–295. [Google Scholar] [CrossRef]
- Wang, Z.; Qiao, Y.; Liu, Y.; Bao, J.; Gao, Q.; Chen, J.; Yao, H.; Yang, L. Thermal storage performance of building envelopes for nearly-zero energy buildings during cooling season in western china: An experimental study. Build. Environ. 2021, 194, 107709. [Google Scholar] [CrossRef]
- O’Donovan, A.; Murphy, M.D.; O’Sullivan, P.D. Passive control strategies for cooling a non-residential nearly zero energy office: Simulated comfort resilience now and in the future. Energy Build. 2021, 231, 110607. [Google Scholar] [CrossRef]
- Ge, H.; Baba, F. Effect of dynamic modeling of thermal bridges on the energy performance of residential buildings with high thermal mass for cold climates. Sustain. Cities Soc. 2017, 34, 250–263. [Google Scholar] [CrossRef]
- Ge, H.; Baba, F. Dynamic effect of thermal bridges on the energy performance of a low-rise residential building. Energy Build. 2015, 105, 106–118. [Google Scholar] [CrossRef]
- Berggren, B.; Wall, M. Calculation of thermal bridges in (nordic) building envelopes–risk of performance failure due to inconsistent use of methodology. Energy Build. 2013, 65, 331–339. [Google Scholar] [CrossRef]
- Kapsis, K.; Dermardiros, V.; Athienitis, A.K. Daylight performance of perimeter office façades utilizing semi-transparent photovoltaic windows: A simulation study. Energy Procedia 2015, 78, 334–339. [Google Scholar] [CrossRef] [Green Version]
- Yohanis, Y.G.; Norton, B. A comparison of the analysis of the useful net solar gain for space heating, zone-by-zone and for a whole-building. Renew. Energy 2000, 19, 435–442. [Google Scholar] [CrossRef]
- Zhang, Y.; Tennakoon, T.; Chan, Y.H.; Chan, K.C.; Fu, S.C.; Tso, C.Y.; Yu, K.M.; Huang, B.L.; Yao, S.H.; Qiu, H.H.; et al. Energy consumption modelling of a passive hybrid system for office buildings in different climates. Energy 2022, 239, 121914. [Google Scholar] [CrossRef]
- Darwazeh, D.; Duquette, J.; Gunay, B. Virtual metering of heat supplied by zone-level perimeter heaters: An investigation with three inverse modelling approaches. Energy Build. 2021, 240, 110867. [Google Scholar] [CrossRef]
- Zhang, S.; Fine, J.P.; Touchie, M.F.; O’Brien, W. A simulation framework for predicting occupant thermal sensation in perimeter zones of buildings considering direct solar radiation and ankle draft. Build. Environ. 2020, 183, 107096. [Google Scholar] [CrossRef]
- Konis, K. Evaluating daylighting effectiveness and occupant visual comfort in a side-lit open-plan office building in san francisco, california. Build. Environ. 2013, 59, 662–677. [Google Scholar] [CrossRef] [Green Version]
- Shen, H.; Tzempelikos, A. Sensitivity analysis on daylighting and energy performance of perimeter offices with automated shading. Build. Environ. 2013, 59, 303–314. [Google Scholar] [CrossRef]
- Sadeghi, S.A.; Lee, S.; Karava, P.; Bilionis, I.; Tzempelikos, A. Bayesian classification and inference of occupant visual preferences in daylit perimeter private offices. Energy Build. 2018, 166, 505–524. [Google Scholar] [CrossRef]
- Kontadakis, A.; Tsangrassoulis, A.; Doulos, L.; Topalis, F. An active sunlight redirection system for daylight enhancement beyond the perimeter zone. Build. Environ. 2017, 113, 267–279. [Google Scholar] [CrossRef]
- Kunwar, N.; Cetin, K.S.; Passe, U.; Zhou, X.; Li, Y. Full-scale experimental testing of integrated dynamically-operated roller shades and lighting in perimeter office spaces. Sol. Energy 2019, 186, 17–28. [Google Scholar] [CrossRef]
- Gamero-Salinas, J.; Kishnani, N.; Monge-Barrio, A.; López-Fidalgo, J.; Sánchez-Ostiz, A. Evaluation of thermal comfort and building form attributes in different semi-outdoor environments in a high-density tropical setting. Build. Environ. 2021, 205, 108255. [Google Scholar] [CrossRef]
- Romero, M.J.; Aguilar, F.; Vicente, P.G. Analysis of design improvements for thermal bridges formed by double-brick façades and intermediate slabs for nzeb residential buildings in spain. J. Build. Eng. 2021, 44, 103270. [Google Scholar] [CrossRef]
- Huang, S.; Katipamula, S.; Lutes, R. Experimental investigation on thermal inertia characterization of commercial buildings for demand response. Energy Build. 2021, 252, 111384. [Google Scholar] [CrossRef]
- Shin, M.; Haberl, J.S. A procedure for automating thermal zoning for building energy simulation. J. Build. Eng. 2022, 46, 103780. [Google Scholar] [CrossRef]
- Cho, J.-K.; Shin, S.-J.; Cha, J.-H.; Sung, J.-H.; Hong, M.-H. The simplified air barrier system in the perimeter area of building. In Proceedings of the Society of Air-Conditioning and Refrigerating Engineers of Korea (SAREK), Chuncheon, Korea, 25–27 June 2008; pp. 906–911. [Google Scholar]
- Alajmi, A.; El-Amer, W. Saving energy by using underfloor-air-distribution (ufad) system in commercial buildings. Energy Convers. Manag. 2010, 51, 1637–1642. [Google Scholar] [CrossRef]
- Schiavon, S.; Webster, T.; Dickerhoff, D.; Bauman, F. Stratification prediction model for perimeter zone ufad diffusers based on laboratory testing with solar simulator. Energy Build. 2014, 82, 786–794. [Google Scholar] [CrossRef] [Green Version]
- Yau, Y.H.; Poh, K.S.; Badarudin, A. A numerical airflow pattern study of a floor swirl diffuser for ufad system. Energy Build. 2018, 158, 525–535. [Google Scholar] [CrossRef]
- Taheri, M.; Zolfaghari, S.A.; Afzalian, M.; Hassanzadeh, H. The influence of air inlet angle in swirl diffusers of ufad system on distribution and deposition of indoor particles. Build. Environ. 2021, 191, 107613. [Google Scholar] [CrossRef]
- Zhang, K.; Zhang, X.; Li, S. Simplified model for desired airflow rate in underfloor air distribution (ufad) systems. Appl. Therm. Eng. 2016, 93, 244–250. [Google Scholar] [CrossRef]
- Alajmi, A.F.; Abou-Ziyan, H.Z.; El-Amer, W. Energy analysis of under-floor air distribution (ufad) system: An office building case study. Energy Convers. Manag. 2013, 73, 78–85. [Google Scholar] [CrossRef]
- Xue, Y.; Chen, Q. Influence of floor plenum on energy performance of buildings with ufad systems. Energy Build. 2014, 79, 74–83. [Google Scholar] [CrossRef]
- Shokrollahi, S.; Hadavi, M.; Heidarinejad, G.; Pasdarshahri, H. Multi-objective optimization of underfloor air distribution (ufad) systems performance in a densely occupied environment: A combination of numerical simulation and taguchi algorithm. J. Build. Eng. 2020, 32, 101495. [Google Scholar] [CrossRef]
- Varas-Muriel, M.J.; Fort, R.; Gómez-Heras, M. Assessment of an underfloor heating system in a restored chapel: Balancing thermal comfort and historic heritage conservation. Energy Build. 2021, 251, 111361. [Google Scholar] [CrossRef]
- Ies Ve. Available online: Https://www.Iesve.Com/software/virtual-environment (accessed on 20 August 2021).
- Ashrae. Thermal Environmental Conditions for Human Occupancy. 2017. Available online: https://doi.Org/10.1007/s11926-011-0203-9 (accessed on 4 September 2021).
- Kim, S.; Zirkelbach, D.; Künzel, H.M.; Lee, J.-H.; Choi, J. Development of test reference year using iso 15927-4 and the influence of climatic parameters on building energy performance. Build. Environ. 2017, 114, 374–386. [Google Scholar] [CrossRef]
- American Society of Heating, Refrigerating and Air Conditioning Engineers. ASHRAE Guideline 14-2002, Measurement of Energy and Demand Savings—Measurement of Energy, Demand and Water Savings; American Society of Heating, Refrigerating and Air Conditioning Engineers: Atlanta, GA, USA, 2002. [Google Scholar]
- Convertino, F.; Vox, G.; Schettini, E. Evaluation of the cooling effect provided by a green façade as nature-based system for buildings. Build. Environ. 2021, 203, 108099. [Google Scholar] [CrossRef]
- Tong, S.; Wen, J.; Wong, N.H.; Tan, E. Impact of façade design on indoor air temperatures and cooling loads in residential buildings in the tropical climate. Energy Build. 2021, 243, 110972. [Google Scholar] [CrossRef]
- Al-Saadi, S.N. Pragmatic retrofitting strategies for improving thermal, energy, and economic performance of an institutional building in a cooling-dominated climate. J. Build. Eng. 2021, 44, 103326. [Google Scholar] [CrossRef]


Publisher’s Note: MDPI stays neutral with regard to jurisdictional claims in published maps and institutional affiliations. |
© 2022 by the authors. Licensee MDPI, Basel, Switzerland. This article is an open access article distributed under the terms and conditions of the Creative Commons Attribution (CC BY) license (https://creativecommons.org/licenses/by/4.0/).