Article

The Identification, Development, and Evaluation of BIM-ARDM: A BIM-Based AR Defect Management System for Construction Inspections

Australian Research Centre for Interactive and Virtual Environments, University of South Australia, Adelaide, SA 5095, Australia
*
Author to whom correspondence should be addressed.
Buildings 2022, 12(2), 140; https://doi.org/10.3390/buildings12020140
Submission received: 24 December 2021 / Revised: 5 January 2022 / Accepted: 24 January 2022 / Published: 28 January 2022
(This article belongs to the Special Issue Buildings: 10th Anniversary)

Abstract

:
This article presents our findings from a three-stage research project, which consists of the identification, development, and evaluation of a defect management Augmented Reality (AR) prototype that incorporates Building Information Modelling (BIM) technologies. Within the first stage, we conducted a workshop with four construction-industry representatives to capture their opinions and perceptions of the potentials and barriers associated with the integration of BIM and AR in the construction industry. The workshop findings led us to the second stage, which consisted of the development of an on-site BIM-based AR defect management (BIM-ARDM) system for construction inspections. Finally, a study was conducted to evaluate BIM-ARDM in comparison to the current paper-based defect management inspection approach employed on construction sites. The findings from the study revealed BIM-ARDM significantly outperformed current approaches in terms of usability, workload, performance, completion time, identifying defects, locating building elements, and assisting the user with the inspection task.

1. Introduction

Within the last decade, Building Information Modelling (BIM) has received increased attention from the academic community with a trend towards integrating BIM within the architectural design process (Figure 1). BIM improves the quality of the documentation produced, enabling the BIM model to be leveraged throughout the construction-project life-cycle. Due to the comprehensive data provided by BIM models, advanced visualisation tools such as Augmented Reality (AR) and Virtual Reality (VR) have been recognized as effective media to visualise and interact with BIM data. AR is defined as a tool that combines the real and virtual worlds by superimposing virtual content onto the physical world. Using this concept, researchers have explored the integration of AR with BIM models in the construction-project life-cycle. Some common examples include Safety and Training [1,2], Risk Management [3,4], Architectural Design [5,6,7], Facilities Management [8,9], Education and Learning [10,11], and Building Performance Simulation [12,13].
In this article, we present our findings from a three-stage research project consisting of the identification, development, and evaluation of a BIM-based AR defect management (BIM-ARDM) system for conducting on-site construction inspections. In the first stage, we identified and examined the current uses, barriers, and potential uses for the integration of immersive AR and BIM within the Architecture, Engineering, and Construction (AEC) industries. This was achieved by conducting a workshop consisting of focus-group interviews with four construction-industry representatives, each with varying roles and levels of experience working in the construction industry.
The findings from this workshop led us to the second stage, which consisted of the development of an on-site defect management BIM-ARDM prototype. The technical implementation was designed to address the concerns and potential features highlighted by the industry representatives during the focus-group interviews. In the subsequent third stage, we conducted a pilot study with 11 participants to evaluate the experimental BIM-ARDM system by comparing it to the current defect management techniques employed in the construction industry.
Currently, digital technologies have not been adequately adopted in the construction industry, and their potential is yet to be fully exploited. Current construction processes such as conducting defect management inspections on buildings remain relatively traditional and primarily consist of extracting analogue drawings and building information data from BIM models and printing them as paper-based documents to use during the on-site construction inspection. Due to the level of detail required for construction personnel to sufficiently conduct defect management inspections, a significant amount of paper-based documents are generally required on-site. Whilst conducting the inspection, analogue drawings of the architectural model are used as a reference by the inspector to compare how elements, such as a light switch or door, compare to the architectural plans.
Identifying construction defects from printed drawings can be challenging and requires extensive training to precisely read the 2D drawings and understand their spatial location in the physical space. During the inspection, building-defect data are managed by writing inspections notes onto a paper-based or digital checklist. Due to the conventional approach for conducting on-site inspections involving a highly manual component, this process could potentially lead to errors, mistakes, or loss of data occurring before, during, and after the inspection takes place. Additionally, the conventional method for defect management inspections requires a significant amount of time allocated to set up the inspection and summarize post-inspection data. This was demonstrated in a recent study by Ma et al. [14] that illustrated the inspection process using conventional approaches that required almost double the time to plan the inspection (40 min), summarize results (50 min), and communicate (20 min) in comparison to performing the actual construction-site defect management inspection (60 min).
To improve productivity, and minimise unnecessary delays and reworks caused by misinterpretation of plans, and drawings and imprecise information transfer from three-dimensional to two-dimensional environments, an improved information-exchange medium is required.
We believe a more effective approach could be achieved by leveraging the visualisation capabilities of AR to directly link the BIM model with the physical construction site allowing the BIM model location and specification data to be shown in-situ to enhance a construction personnel’s spatial awareness and understanding of the architectural design. This process also enables inspection data to be digitally recorded during the inspection and linked directly back to the BIM model, which we believe can further mitigate data loss, mistakes, and discrepancies that could potentially occur by having workers manually inputting data from paper-based documents into digital systems.
The specific contributions of this study are:
  • Identification and categorization of current uses, potentials uses, and barriers for BIM and AR integration within the construction industry.
  • An improved AR system for identifying construction defects during an on-site construction inspection.
  • A set of novel AR visualisations, and features to improve defect management inspection performance.
  • A Revit plugin to autonomously link data recorded during the construction inspection back to the original BIM model.
  • Data analysis software to evaluate and assess construction inspection performance through eye-tracking, and head-tracking data linked to a four-dimensional visualisation.
In the remainder of this article, we explore and summarize the findings from previous works that have integrated AR technologies and BIM to conduct on-site construction inspections. We also identify and discuss the current technological challenges associated with the integration of AR and BIM within the AEC industries. We present our interview results from a workshop highlighting the current uses, potential uses, and barriers associated with integrating BIM and AR within the construction industry. Next, we present a summary of an experimental BIM-ARDM system that details the implementation and design decisions involved in the development of the software. We then present our findings from a pilot study of the proposed BIM-ARDM which demonstrates significant results for the usability, workload, performance, completion time, locating building elements, identifying defects, and preferences in comparison to a traditional paper-based approach. We conclude the study with a discussion of the limitations of our BIM-ARDM prototype and some final remarks.

2. Background

In this section, we explore and summarize the implementations and findings from previous works that explore the usage of AR and BIM to conduct on-site construction inspections. Subsequently, we identify and discuss two common technological and software limitations that inhibit the current optimum usage of AR within the AEC industries.

2.1. AR Supporting BIM for Construction Inspections

Shin and Dunston [15] stated two issues needed to be addressed before AR technology could become prevalent in the AEC industries: limitations of AR technology (e.g., tracking) and identifying applicable areas within the construction industry that AR could be used for. The researchers identified eight tasks where AR could benefit the construction industry: layout, excavation, positioning, inspection, coordination, supervision, commenting, and strategising. The following year Shin and Dunston [16] presented ARCam: an AR-based prototype aimed at improving the performance of steel-column inspections. The hardware consisted of a mounted stationary video camera attached to a HiBall-3100 tracking system. Inspectors observed virtual content superimposed onto the physical steel columns through a traditional touch-screen display. A study with sixteen graduate civil engineering students was conducted to compare ARCam with conventional methods for steel-column inspections. The findings demonstrated that ARCam required less task load based on the NASA-Task-Load-Index results [17] and was a more intuitive mode of operation for conducting the inspection task. However, conventional methods outperformed ARCam in regards to inspection precision and performance. The authors concluded the graphical appearance of the virtual model, tracking, and calibration set up all required improvements to improve the feasibility of ARCam.
In recent years, researchers have utilized more modern immersive AR displays for construction-based inspections. Portalés et al. [18] developed an AR tablet-based on-site inspection tool that incorporated visualisations to superimpose virtual content onto prefabricated buildings. Similarly, García-Pereira et al. [19] presented an annotation-based tablet AR inspection tool for prefabricated buildings. The system consisted of a visualisation that allowed inspectors to change the transparency of the virtual building model by manipulating the value of a virtual slider. Various types of annotations were also incorporated into the system including text-based annotations, photographic annotations, and 2D-drawing annotations. A study with 11 participants that had previous experience in construction-based inspections was conducted to test the various functions in the system. Participants were tasked to calibrate the virtual model, change the transparency of the virtual model, revisit a pre-existing annotation, make two new annotations, revisit one of their own annotations, and delete an annotation. The results from the study showed that the usability of the system received an 81.36 (excellent) ranking based on the System Usability Scale (SUS) [20]. A Likert-based ranking (1 strongly disagree to 5 strongly agree) revealed participants believed the presented system could reduce the inspection time (mean = 4.18), improve documentation during the inspection process (mean = 4.09), be suitable for real work environments (mean = 4.45), and be valuable for documenting the geometry of elements during inspections (mean = 4.73).
Feng et al. [21] used the HoloLens to develop an AR-based inspection tool that superimposed BIM models onto a physical construction site. The researchers utilized an AR-based interface allowing inspectors to check off construction elements within a virtual holographic checklist. Park et al. [22] proposed a conceptual proactive construction defect management framework that integrated BIM, AR, and data-collection methods to improve upon the conventional manual construction-inspection processes. The proposed framework presents a solution to address each of the three stages required in a typical knowledge-management process: 1. capture, 2. retrieval, and 3. reuse. The presented solutions consisted of (1) a proposed data-collection template to improve the quality of data captured during the inspection, (2) a defect domain ontology for improved retrieval and access of defect data, and (3) an AR-based system that incorporates image-matching techniques to overcome the conventional manual construction-inspection practices. The following year Kwon and Park et al. [23] presented two AR-based prototypes to conduct defect management inspections both remotely and on-site. The remote system consisted of having an on-site worker take a picture of the physical element, which is relayed into a server. The 2D image is then run through an image-matching system to identify the corresponding virtual element to compare the differences between the physical and virtual elements. The on-site defect management system consisted of a mobile-based AR application that superimposed virtual building models onto the physical building using a marker-based tracking technique. Zhou et al. [24] developed an AR system to inspect segment displacement during tunnel construction. Th eresults from a case study comparing the proposed AR system to conventional methods demonstrated that the AR system can reduce the total duration of the inspection. Furthermore, participants claimed the AR system was more intuitive and overall a more-effective approach to diagnose segment displacement in comparison to conventional methods. Other works have proposed the usage of an IFC-based framework to improve the interoperability of equipment used to conduct self-inspections of buildings [25].
Other prototypes that do not directly support AR, but that demonstrated potential benefits for construction inspections, were presented by Ma et al. [14]. The authors proposed a non-immersive collaborative tablet-based quality-management inspection application that integrated BIM models and indoor positioning. The system was tested by having a construction manager conduct an on-site inspection using both the proposed tablet-based system and a traditional paper-based system. The results revealed that the construction manager spent approximately 30% more time using the proposed tablet-based system for conducting the actual on-site inspection. However, taking into consideration other factors associated with the entire inspection process (i.e., inspection-task planning, inspection results summarizing, and communication), the researchers concluded the system could save approximately 50% of the time for the entire inspection process. The results from this test were shown to seven construction site engineers to gather qualitative feedback on the system. The engineers stated the ability to avoid manually entering inspection data from paper records into computers, maintain the latest inspection progress from the BIM model, adhere to inspection standards, and improve stakeholder communication as the key advantages of the proposed tablet system.

2.2. Current Challenges

Based on our previous literature review of AR supporting BIM for construction inspections and the results from our workshop, we identified two common technical limitations that we believe require improvements before BIM-based AR technologies can be adopted from research into the construction industry. Firstly, before developing a BIM-based AR tool, a workflow is required to transfer the BIM model from a BIM-based CAD platform (e.g., Revit) into an AR-supported software development kit (SDK) or game engine (e.g., Unity or Unreal) without loss of BIM metadata. Once this has been achieved, a tracking technique is then required to superimpose the virtual BIM model onto the physical construction site at a one-to-one mapping whilst the user navigates through the environment.

2.2.1. Integrating BIM Models from CAD Platforms to Game Engines and SDKs

The lack of interoperability to communicate BIM data across different platforms has been one of the primary technical barriers associated with the development of BIM-based AR/VR prototypes built off SDKs or game engines. Currently, the Industry Foundation Class (IFC) remains the most widely adopted approach for transferring BIM models across platforms. IFC is defined by BuildingSMART as a data model that “can define physical components of buildings, manufactured products, mechanical/electrical systems, structural analysis models, energy analysis models, cost breakdowns, work schedules, and more” [26]. This process allows partial metadata associated with the BIM model to be saved within a single file format, which can be exported and imported across BIM-based CAD platforms that provide native IFC support. However, game engines, such as Unity, do not provide native support for IFCs, and third-party libraries [27,28,29] have been released to parse and import IFC models into game engines. The primary limitation associated with IFC is that only specific metadata associated with the BIM model are maintained that can result in a significant loss of BIM metadata when exporting from the native CAD format (e.g., rvt file format) to IFC.
However, recently, the Unity Development team released Unity Reflect: A software package that creates a natural uni-directional linkage between a CAD platform (Revit) and the Unity game engine (https://unity.com/products/unity-reflect, accessed on 20 December 2021). Although, future work is still required to achieve a natural bi-directional exchange of BIM data between CAD platforms and game engines.

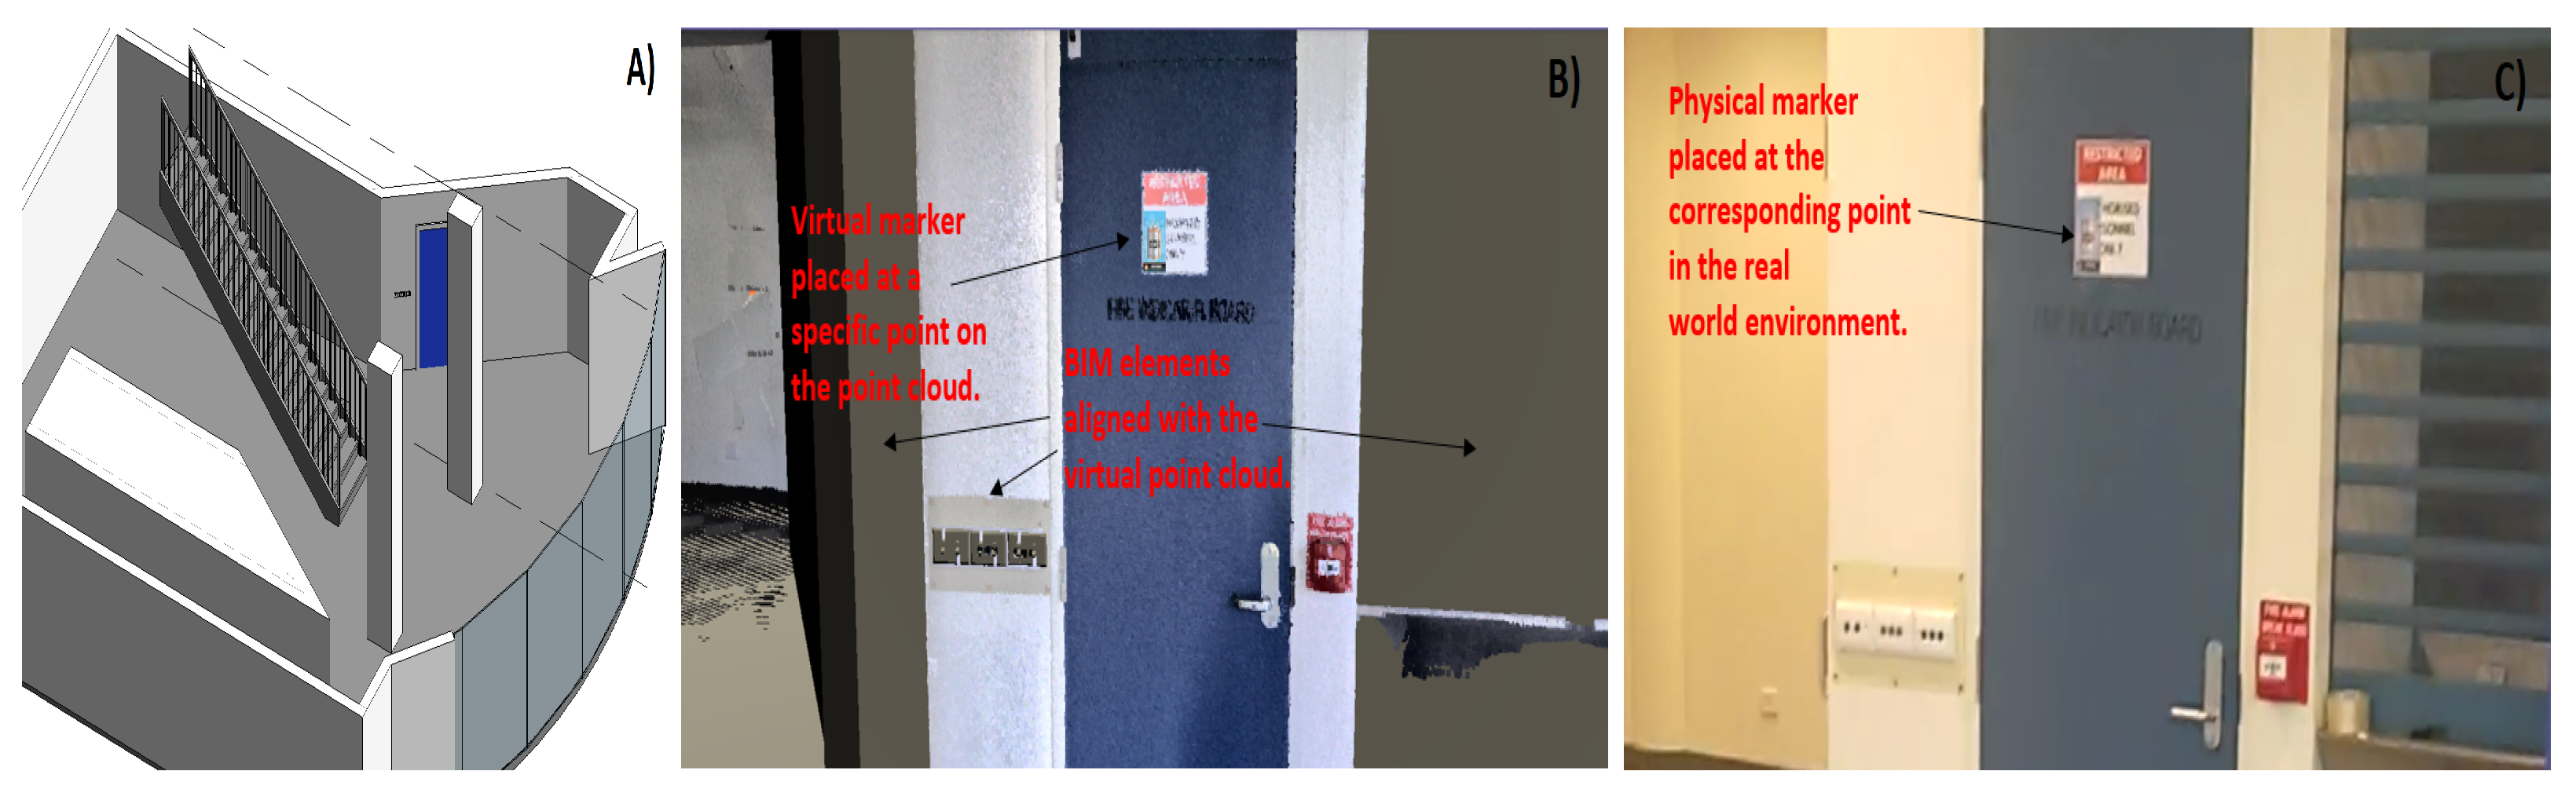
2.2.2. Tracking and Registration

The tracking accuracy associated with the alignment of virtual holographic models onto the physical world remains one of the prominent ongoing research fields within the AR research community. Typically, AR tracking techniques [30] are camera-based, and they are defined through two categorizations: marker-based [31] and marker-less tracking [32,33]. Marker-based tracking methods rely on tracking the position of physical markers (e.g., Vuforia [34] frame targets, image targets, QR codes, or ARToolKit markers [35]) to achieve an alignment between the virtual world and the real world. Although marker-based tracking techniques yield a more-precise tracking accuracy than marker-less techniques, specific limitations associated with marker-based techniques make it difficult to employ within a real-world construction site. Firstly, the most obvious limitation is that physical markers are required for the tracking to be achieved. As a result, various physical markers would be needed to be set up on the physical construction site, which would be tedious. Furthermore, the placement of these physical markers would have to match the exact position of corresponding virtual markers on the BIM model at a one-to-one mapping. This means a point cloud or spatial map of the construction site would be required as a reference to ensure the virtual building model is precisely placed at the corresponding position of the real-world construction site.
Alternatively, marker-less tracking techniques rely strictly on the depth sensors and cameras built into the AR hardware to simultaneously map and localize the virtual world in real time. Although currently tracking performance is sacrificed when using marker-less tracking techniques, as AR hardware and tracking algorithms continue to advance, marker-less tracking techniques for on-site construction inspections will become more feasible. Research by Kopsida and Brilakis [36] explored three AR tracking techniques that would be suitable for on-site construction inspections: model-based, marker-less using monocular SLAM, and marker-less using Red-Green-Blue—Depth (RGB-D) devices. The researchers concluded that using the built-in RGB-D depth-sensors of devices such as the Microsoft Kinect and Google Project Tango was the most feasible out of the three marker-less tracking solutions for on-site construction-inspection accuracy. Recent works by Hübner et al. [37] have further validated this claim by demonstrating the accuracy of RGB-D sensors built into the Microsoft Hololens 1 Head-Mounted Display (HMD), which were capable of tracking within a two-centimetre accuracy in indoor environments.

3. Workshop

A workshop was conducted to facilitate focus-group interviews with four construction-industry representatives in attendance, each with different roles and levels of experience working within the construction industries. All participants were active professionals with multiple years of prior experience working in the construction industry. Each participant was selected from different construction companies to represent a range of practices in the construction sector including sole trader, small to medium enterprises, and larger practices. The specific roles and expertise of each participant are displayed in Table 1. Due to the data collected in the focus-group interviews being entirely qualitative, with the workshop process involving demonstrations and open discussions, the number of participants selected to take part in the workshop was purposefully kept to a smaller scale. The primary goal of this workshop was to capture the participants’ opinions and perceptions regarding the potentials and barriers associated with the integration of BIM and AR within the construction industry. Specifically, the workshop explored the following research questions:
  • What is the current adoption related to the integration of BIM and AR within the construction industry?
  • What are the barriers associated with integrating BIM and AR within the construction industry?
  • What potential scenarios across the entire construction-project life-cycle could BIM and AR be integrated for?

3.1. Procedure

The workshop process consisted of presentations, interactive demonstrations, focus-group interviews, and discussions. The presentations and demonstrations were conducted prior to the interviews and discussions to familiarise participants with AR and VR technologies and to showcase some of the potential scenarios the technology could be applied to within the construction industry. The VR demonstration consisted of a first-person walk-through visualisation of a virtual BIM model. Participants were able to interact with virtual elements within the building to display the BIM metadata properties associated with each element (e.g., manufacturer, cost, material, name, etc.). The AR demonstration utilized the see-through mixed reality HMD Microsoft Hololens 1, which allowed participants to visualise a virtual scaled-down BIM model. Participants were able to rescale the BIM model using the "air tap gesture" through a two-dimensional UI attached to the model. Participants were also able to interact with the BIM model by enabling and disabling specific components and rooms within the building by toggling components on and off in the UI.
Focus-group interviews were the main instrument used to collect data during the workshop. The data collected from this workshop were analysed using a content analysis [38] approach. This process enabled us to make replicable and valid inferences from texts to the contexts of their use. A three-step methodology was employed to analyse the collected data. Firstly, data were converted from an audio recording to a transcript and were organised based on time stamps. Next, the data were coded by segmenting sentences or paragraphs into categories and labelling those categories with a term associated with the actual language of the participants. This included finding frequencies of occurring ideas (or events) in the data relevant to the research questions. Subsequently, three key themes were identified from the analysis: current uses of using BIM and AR, barriers of using BIM and AR, and scenarios and future directions for using BIM and AR.

3.2. Current Uses of BIM and AR

Despite all workshop participants having limited prior experience using AR technologies, all participants had a sufficient understanding of AR. All participants stated that the technology had not been incorporated within any of their current or previous companies. However, multiple participants stated their companies were actively utilizing VR as a walk-through visualisation tool within the design phase of their projects to “bring clients in and do a bit of a walk-through”.
Although participants stated there are limited current uses of AR within the construction industry, Figure 1 demonstrates that a comprehensive amount of research has previously been conducted on the integration of AR and BIM technologies and is continually rising each year. Furthermore, the literature has also demonstrated that a significant amount of research has been conducted on the integration of AR across a range of AEC disciplines [39,40,41]. Due to the substantial amount of AR research conducted in AEC, and the limited adoption of AR within the AEC sectors, it is evident that a clear gap exists between the research and industry. The broader impact of AR on AEC projects is not well understood. Further discussions with AEC experts to understand the current barriers surrounding BIM and AR, and to identify applicable areas for the integration of AR and BIM in the AEC industries, are required to bridge the gap between the research and practice.

3.3. Current Barriers Surrounding BIM and AR

Before AR technology can be applied to the construction industry, it is necessary to identify the current barriers inhibiting the optimum usage of AR in construction. In this section, we explore non-technical aspects from the perspective of experts within the construction industry that need to be overcome before AR and BIM can become prevalent within the construction industry. The specific barriers identified by participants that we discuss include (1) maturity and reliability, (2) accessibility, (3) standards and data exchange, and (4) stakeholder perception and organisational culture.

3.3.1. Maturity and Reliability

Participants described the lack of maturity and reliability associated with current AR technologies as one of the leading factors for why their companies had yet to adopt AR technologies. One participant stated that “we still don’t see huge benefits in jumping into AR at the moment until the technology matures a little bit more”. We believe that the accessibility and tracking limitations associated with AR technologies are factors that directly correlate with the advancement of the maturity and reliability of future AR technologies.

3.3.2. Accessibility and Cost

Due to the pricing and limited AR devices available, it is difficult and expensive to acquire a high-end AR display. Currently, the Hololens II is marketed at USD 3500 (https://www.microsoft.com/en-us/hololens/buy, accessed on 20 December 2021) (Table 2), and due to the cost of hardware and resources, prices of high-end AR HMDs will likely remain expensive in the future. As a result, accessibility of the technology was stated by the participants as a major barrier for the adoption of AR within the construction industry. One participant suggested using a tablet or smartphone as the primary display to make AR more accessible: “so you are not carrying a whole bunch of devices. That is where I sort of see an easy way of marketing (AR)”.
Participants stated that the costs associated with designing and maintaining BIM models was another hurdle as to why BIM has not become fully adopted within construction companies. Participants pointed out that this issue is especially prevalent for smaller projects with a lower budget; one participant stated: “You’ve got to sort of work out something to try and bring smaller projects into using it”.

3.3.3. Standards and Data Exchange

Interoperability and lack of support provided to exchange BIM data across different platforms is another key barrier associated with the adoption of BIM and AR technologies. One participant stated, “the models coming through are actually being dumbed down and all the data is stripped out of them”. Although IFC was introduced as a standardized data model to exchange BIM data across platforms, only a limited portion of meta-data associated with the BIM are maintained when exporting to IFC. The participant further commented: “We have seen an increase in people sharing models in IFC rather than native Revit or Techno or whatever else. That’s great as you get some geometry with it, but you’ve lost a whole heap of data”.
Finally, the other challenges are related to the highly fragmented and inconsistent capabilities across hardware platforms and operating systems. There is an imbalance in the projects within the construction industry itself with architects, services, and structural industries still using basic CAD and 2D media. The level of inconsistencies in the platforms used by different industries including architects, consultants, and construction professionals affect the level of accuracy through the supply chain. One participant stated, “we’re getting jobs where we still get CAD and 2D drawings”.

3.3.4. Stakeholder Perception and Organisational Culture

Stakeholder perception and organisational culture also pose challenges for the integration of AR and BIM technologies within the construction industry. This was highlighted by a participant who claimed “the major holdup to the advancement and development (of AR in construction) is not the technology, it is actually the people and processes”. Most of the construction industry is still very traditional and is quite reluctant to adopt new technology, especially related to the usage of BIM and AR. One participant stated “there are negative perceptions created when using new technology,” and “people really have to build the confidence before they take the next step”.
One participant also commented on the architectural designers’ reluctance to design and develop BIM models: “The payoff for (BIM) is for the person in front. This means the driver either has to be the end user clients that are going to see a potential payoff if the entire tool chain is using BIM to its full extent”. As a solution to the aforementioned issue, one participant commented: “I think the only way to push the clientele to drive BIM through the process is to make it an industry standard”.

3.4. Potential and Future Directions for Using BIM and AR

AR systems provide fast and easy access to information through a three-dimensional medium that creates huge opportunities and potential for the adoption of AR in a range of construction disciplines. Some of the potential uses of AR in construction mentioned by participants were as follows: (1) quality assurance and defect management inspections, (2) safety inductions and training, (3) risk management, (4) facilities management, and (5) building performance simulation.

3.4.1. Quality Assurance and Defect Management Inspections

Using AR to conduct quality assurance or defect management inspections was one particular area of interest mentioned by multiple participants throughout the workshop. Some of the comments from the participants included the following: (1) “I see (AR) as particularly valuable at this stage in terms of reviewing things before you install ceilings before you clad walls or things where you actually should be doing your QA checks”; (2) ”If you have an AR environment (where) you can go into the room so you don’t necessarily need 100% accuracy of measurement, you are not actually constructing but you just have to do a building review—’Are all the elements that should be in this room actually installed? Can I sign off’?”; and (3) “Just doing QA work is a really good use (for AR) and there is no reason why you can’t do that right now”.

3.4.2. Safety Inductions and Training

Participants also described the possibilities of using AR to train construction workers on the safety implications associated with the construction site: “the only (way) we would potentially use (AR) is probably safety and design upfront. Walking around (a BIM) and as you’re going through the safety and design review phase looking at certain areas that you potentially might have some concerns”. The benefit of using AR for safety and training is that users can simulate, share, and exchange valuable information without any physical medium. A participant further stated “I think one of the uses for (AR) is safety induction because you want to familiarise some person with the safety of the site, the egress paths, where areas are restricted. There’s no reason why all that information can’t be contained within a model which then could be used in a training environment to familiarise someone with the building very quickly”. One participant also stated the following negative aspect of using AR for safety and training: “I think it’s very difficult to replace a real-life situation with a virtual situation, you might be able to visualise it but to get all other interaction that you would have on a construction site, and all the other safety factors you got to be aware of, I still think it is not quite there”.

3.4.3. Risk Management

Similarly, participants identified risk management as another area of interest for the integration of AR and BIM. Participants described developing a potential AR application which “provides live visualisation of a building along with the associated high-risk areas, and exclusion zones, and the ability to manage risks and report them”. Linking geolocation coordinates and the project schedule to the BIM could be further integrated to provide four-dimensional visualisations of the BIM model [42].

3.4.4. Facilities Management

Facilities management was described by participants as “a major driver for AR, it comes into great usage for AR”. The ability to use AR for see-through objects and to visualise occluded elements was referenced many times throughout the workshop as a potentially valuable use of the technology. One participant described the following scenario: “if you can walk into a building and look up at the ceiling and you know what’s above it, you can point at the ceiling and go: where is the air-conditioning unit for this room?” Previous research such as ARWindow has demonstrated an optimistic outlook to adopt AR technologies within facilities management (FM) from the perspective of industrial facility managers [43].

3.4.5. Building Performance Simulation and Visualisation

Using the immersive three-dimensional qualities of AR to simulate and assess the performance of building design features was also described as one of the potential uses for AR within the construction industry. One of the participants stated, “say acoustically you have to meet certain acoustic requirements, if you could integrate something that spread out certain sound levels in a room there definitely is a benefit”.

3.5. Potential Features

Throughout the workshop, participants highlighted several features when describing their optimal AR applications for construction. Specifically, participants mentioned the following: (1) visualisation and sequencing, (2) UI design and user-friendliness, and (3) accessibility as important features when developing an AR-based construction application.

3.5.1. Visualisation and Sequencing

Participants described the ability to visualise sequences and the ability to “pull apart a model and put it back together” to develop a better understanding of “what you need to go in first” as a potential feature for an AR system. Similarly, another participant stated: “in terms of interaction, turning things on and off (in the BIM) so people can deconstruct and reconstruct the building as many times as they want until they get it right and say OK this is the way I want to do it”. The ability to sequence components is demonstrated in commercial AR-based construction applications such as Gamma AR (https://gamma-ar.com/, accessed on 20 December 2021) and Trimble Connect (https://connect.trimble.com/, accessed on 20 December 2021). Colour-coding virtual building elements, and visualising occluded elements, was also a feature demonstrated by BIM Holoview (http://www.bimholoview.com/, accessed on 20 December 2021).

3.5.2. UI Design and User-Friendliness

The user-friendliness of the technology was a continuous theme throughout the workshop. Participants were asked to describe their optimal AR applications, and participants responded that it “has to be really simple to use”, with an intuitive UI design. Furthermore, it should be a “really easy process, so you can wander around a site, point an iPad in a direction, and it knows exactly where they are and shows them what they should be seeing. You actually take the human element out of it”.

3.5.3. Accessibility

Integrating AR with existing BIM-based CAD platforms can also make AR more attractive and accessible to construction companies. One participant stated “you get someone comfortable in one platform and then the next job they go to its working on a different platform and what they are able to do one they are not able to do (in the other). It just brings frustration for people”. However, due to the lack of development tools, support, and flexibility provided by BIM-based CAD platforms, developers tend to utilize SDKs and game engines such as Unreal (https://www.unrealengine.com/, accessed on 20 December 2021) or Unity (https://unity.com/, accessed on 20 December 2021) for AR software development. Participants also discussed the potential of using AR to access everything needed during a construction task within a single compact device. When referring to an AR inspection application, one participant commented “if you’ve got everything in your iPad you can then actually start using checklists and whatever else you need in one device so you (don’t need to) carry a whole bunch of devices”.

3.6. Summary

A summary of the potential future applications proposed by the workshop respondents is as below:
A1.
Using AR technologies to conduct on-site quality assurance and defect management inspections on a construction site.
A2.
The ability to use AR technologies to visualise BIM models and go through the safety and design review phase and identify which areas on the construction site may have some potential safety concerns.
A3.
An AR-based learning/educational/training risk-management application designed to familiarise a person with the safety requirements and hazards associated with the construction site.
A4.
A facilities-management-focused AR application that allows facility managers to visualise obstructed or invisible objects within a physical building.
A5.
An AR-based building performance simulation and analysis tool that provides the user feedback on whether a room in the building meets specific performance requirements (e.g., acoustics).
Throughout the workshop, the participants also proposed several potential features when describing their optimal AR applications. We categorized and summarized the potential features highlighted by workshop participants into four categorizations: visualisations, interface, tracking, and data exchange.
Visualisations
F1.
Using AR to visualise occluded objects (e.g., wiring, pipes) on a construction site.
F2.
Sequencing a BIM model into specific components to insert things, and having a UI providing visual feedback on the insertion process.
F3.
Representing data using three-dimensional visualisations as opposed to traditional two-dimensional architectural analogue drawings.
F4.
Design the AR application to be highly interactive. Users should have the ability to visualise the building and turn specific components on and off.
Interface
F5.
Ensuring the general user-friendliness of the AR application and UI is a priority. It needs to be very simple and easy to use for a non-technical user.
F6.
Having checklists and other documents required for a construction task to be all accessible within a single device.
F7.
An integration of the AR system with existing BIM platforms to improve accessibility.
Tracking
F8.
An improved AR tracking system that is very simple to use and setup.
F9.
Linking AR to digital point survey type accuracy for improved tracking.
Data Exchange
F10.
A system or workflow capable of maintaining BIM data when exchanging BIM data across platforms to avoid loss of data.
In the remainder of this article, we explore the implementation of A1. Using AR to conduct on-site construction inspections from the above-listed potential applications. We also present the implementation of several features integrated within the system highlighted by participants from the list of potential features. Specifically, we address all the listed potential features (F1–F9) in the BIM-ARDM system with the exception of F10 due to the scope of the development.
The decision-making process, which led to the selection of an AR-based defect management application from the above list of potential applications identified by workshop participants, was based on the following factors. Firstly, we narrowed down the primary potential applications that received the most optimistic responses amongst the workshop participants. We then consulted with AEC experts from both the research and industrial sectors to discuss which of the potential applications AR could have the most significant impact. Finally, a discussion amongst the researchers who have an extensive background working with AR technologies determined that implementing an AR-based defect management application would be feasible to develop as the first step for adopting the results of the focus-group interviews to advance AR development and adoption in AEC.

4. BIM-ARDM System Development

Current industry approaches for identifying defects on a construction site are still relatively manual and require construction inspectors to make estimations based on paper-based, two-dimensional plans and analogue drawings. Higher-tier AEC firms have begun integrating tablet-based application such as Aconex Field (https://help.aconex.com/aconex/our-main-application/using-aconex/field, accessed on 20 December 2021) into their project workflow. These applications are designed to improve the data-management process by having inspectors input data directly into a UI containing digital checklists as they conduct their inspections. Additionally, the quality of inspection data captured during on-site inspections still requires inspectors to interpret two-dimensional plans and analogue drawings to make estimations on whether elements were built correctly. Furthermore, these tools only provide the capability of storing inspection data into independent databases and information-management systems separate from the BIM model. As an alternative to the conventional inspection systems, researchers have proposed the usage of AR technology to superimpose the virtual BIM model onto the physical construction site. However, from the previous work highlighted in Section 2.1, we identified the following drawbacks of previous AR systems, which are specifically addressed in the BIM-ARDM system:
  • All AR implementations that incorporated HMDs used a holographic interface to input and record data (e.g., checklists). We describe in Section 4.2.1 why we believe this design consideration would not be suitable on a real-world construction site.
  • No AR systems were proven to perform more effectively than conventional approaches for conducting on-site construction inspections.
  • Limited AR features and visualisations were integrated to support the inspector with their on-site inspection performance.
  • No AR systems were tested on a real-world construction project.
  • No AR systems were capable of storing inspection data back to the original BIM model.
  • No systems were capable of quantitatively assessing or evaluating the on-site inspection performance.
Based on the aforementioned issues and potential features previously highlighted by workshop participants in Section 3, we designed and developed an on-site BIM-ARDM system for construction defect management inspections. The primary goal during the development phase was to develop a prototype that improved upon the conventional paper-based methods that utilizes two-dimensional plans and analogue drawings to conduct defect management inspections. Our approach for achieving this was to leverage the visualisation capabilities provided by AR technologies (Microsoft HoloLens 2) to visualise the three-dimensional BIM model superimposed at a one-to-one mapping over the physical construction site (Figure 2).
Our system also incorporates a handheld tablet-based interface that connects directly to the HoloLens 2 through a customized TCP/IP network architecture allowing a two-way transmission of data between the two devices. The handheld tablet-based application contains a dynamically produced checklist providing inspectors with an interface to directly input inspection data into.
In this section, we provide a complete overview of the BIM-ARDM prototype and present the four major components involved in the development of the overall BIM-ARDM system.

4.1. Implementation

The BIM-ARDM system was developed to run off a specific set of hardware and software components. For the hardware, the see-through AR head-mounted display Microsoft HoloLens 2 was used to show the virtual BIM model on the physical construction site. Additionally, a Samsung Galaxy S6 Lite tablet was used in-synch with the HoloLens 2 to provide inspectors with a tablet-based UI to input inspection data and control the various visualisations and features integrated within the BIM-ARDM system.
In terms of the software, all software components in the BIM-ARDM system were developed entirely in the C# programming language. The AR and playback analysis applications were built with the Unity 3D Game Engine. The Revit Plugin was developed with the Revit API. The Unity libraries we used to develop the AR application consisted of the Mixed-Reality Toolkit (MRTK) (github.com/Microsoft/MixedRealityToolkit-Unity/releases, accessed on 20 December 2021) for HoloLens 2 integration, Vuforia (https://developer.vuforia.com/, accessed on 20 December 2021) to integrate a marker-based tracking solution for coordinate space calibration, and the 3D User Interaction Toolkit (3DUITK) (github.com/WearableComputerLab/VRInteractionToolkit, accessed on 20 December 2021) [44] to integrate a “Bendcast” visualisation [45] to aid users in locating elements. An overview of the various components used in the AR application is presented in Figure 3A.

4.2. BIM-ARDM System Overview

The BIM-ARDM system is comprised of four major components. The first component is a tablet-based application designed to handle two primary functions: (1) input and data collection, which consists of an easy-to-use checklist interface allowing inspectors to input and collect specific inspection data whilst they conduct their on-site inspection and (2) controlling the various AR visualisations and features integrated into the system. The second component is an AR-based application running off the HoloLens 2 HMD, which allows the inspector to experience the immersive three-dimensional visualisations integrated into the system. The AR-based application and tablet-based application are directly connected through a TCP/IP network protocol. The third component is a Revit plugin that synchronizes data automatically collected during the inspection back to the original Revit model. The fourth component is a post-inspection data-analysis tool designed to evaluate and assess the inspection performance of the inspector through eye-tracking and head-tracking data collected during the inspection. A diagram showing how the four major components within the BIM-ARDM system interact is presented in Figure 3B.

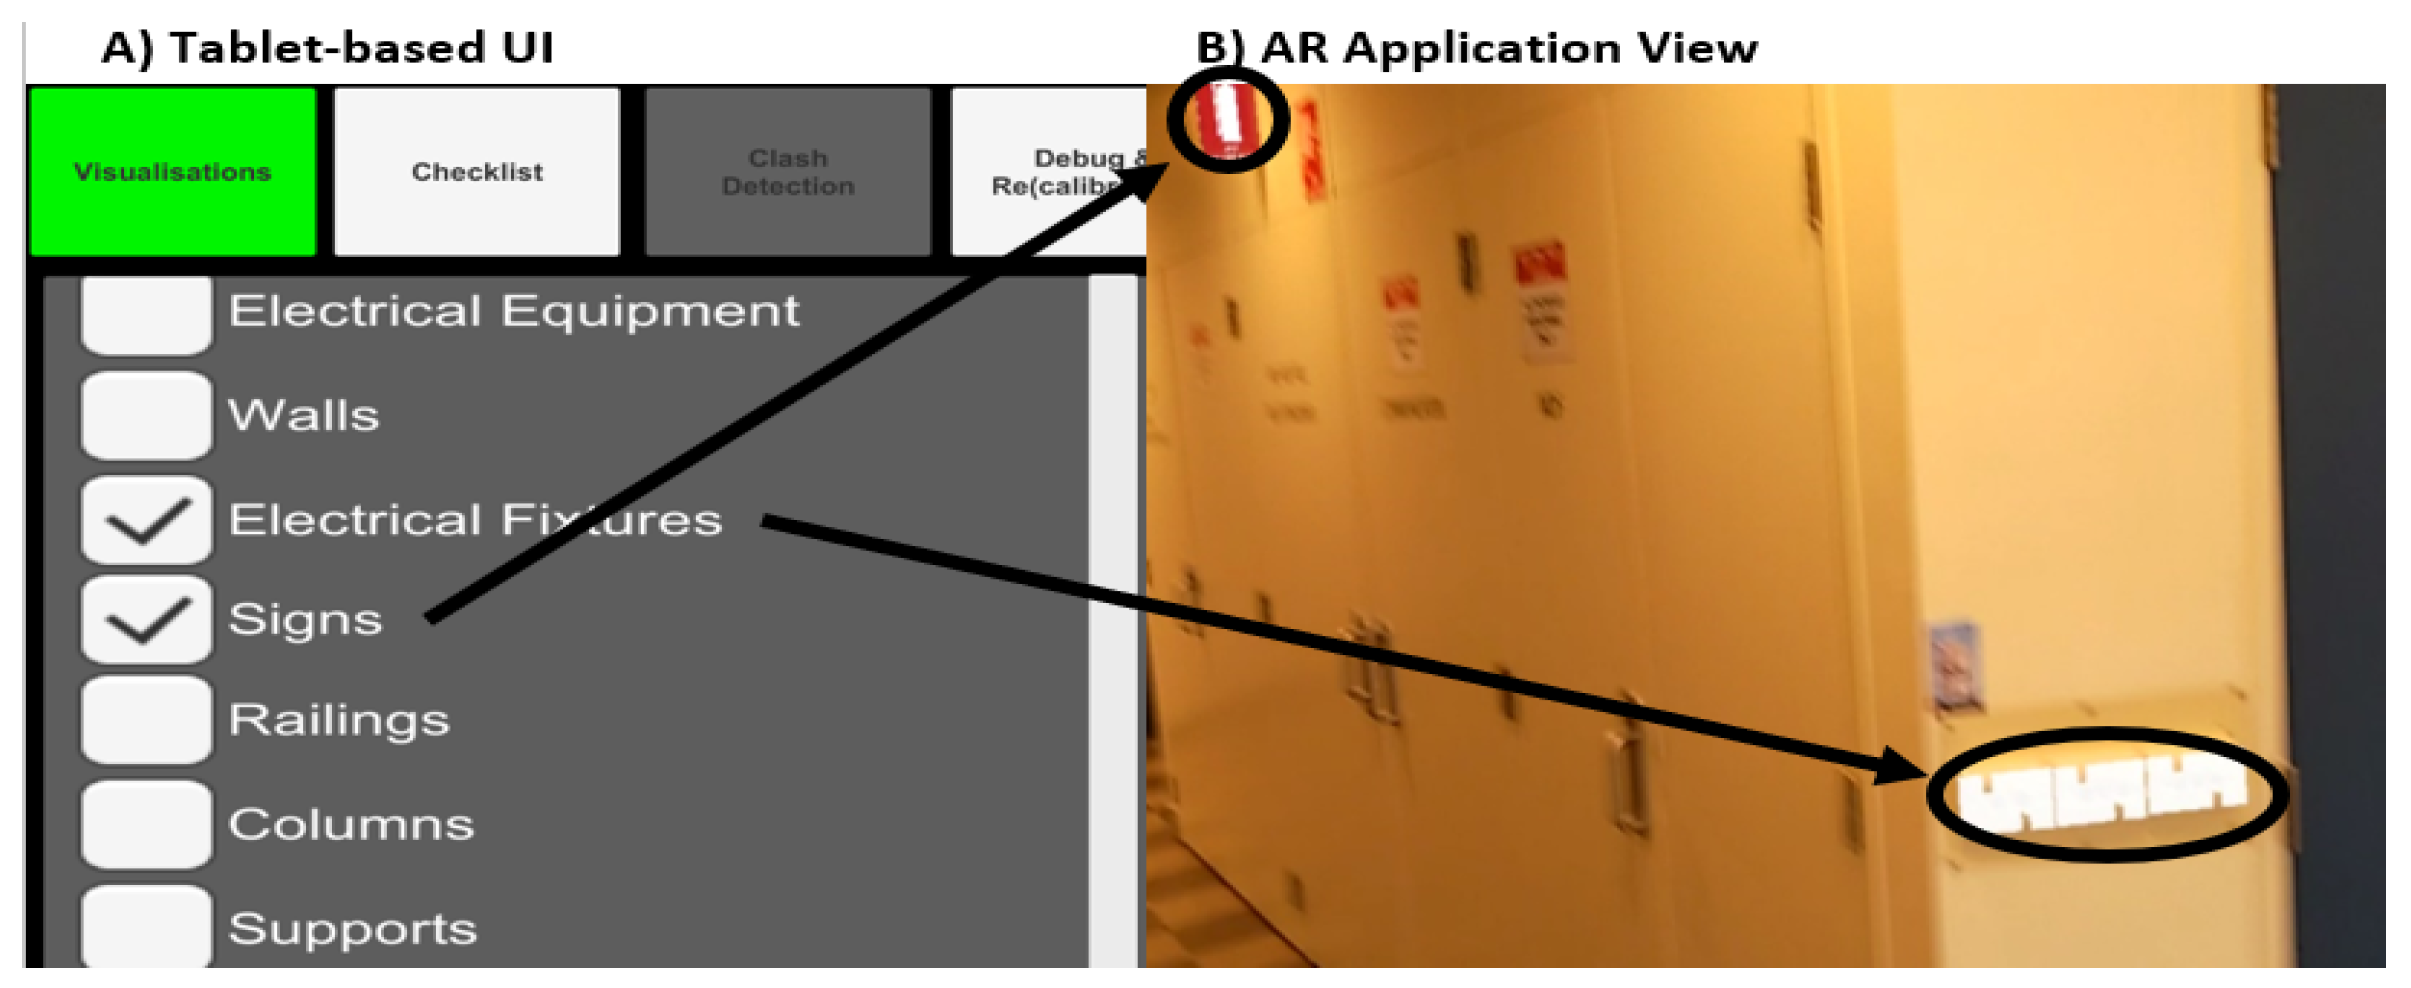
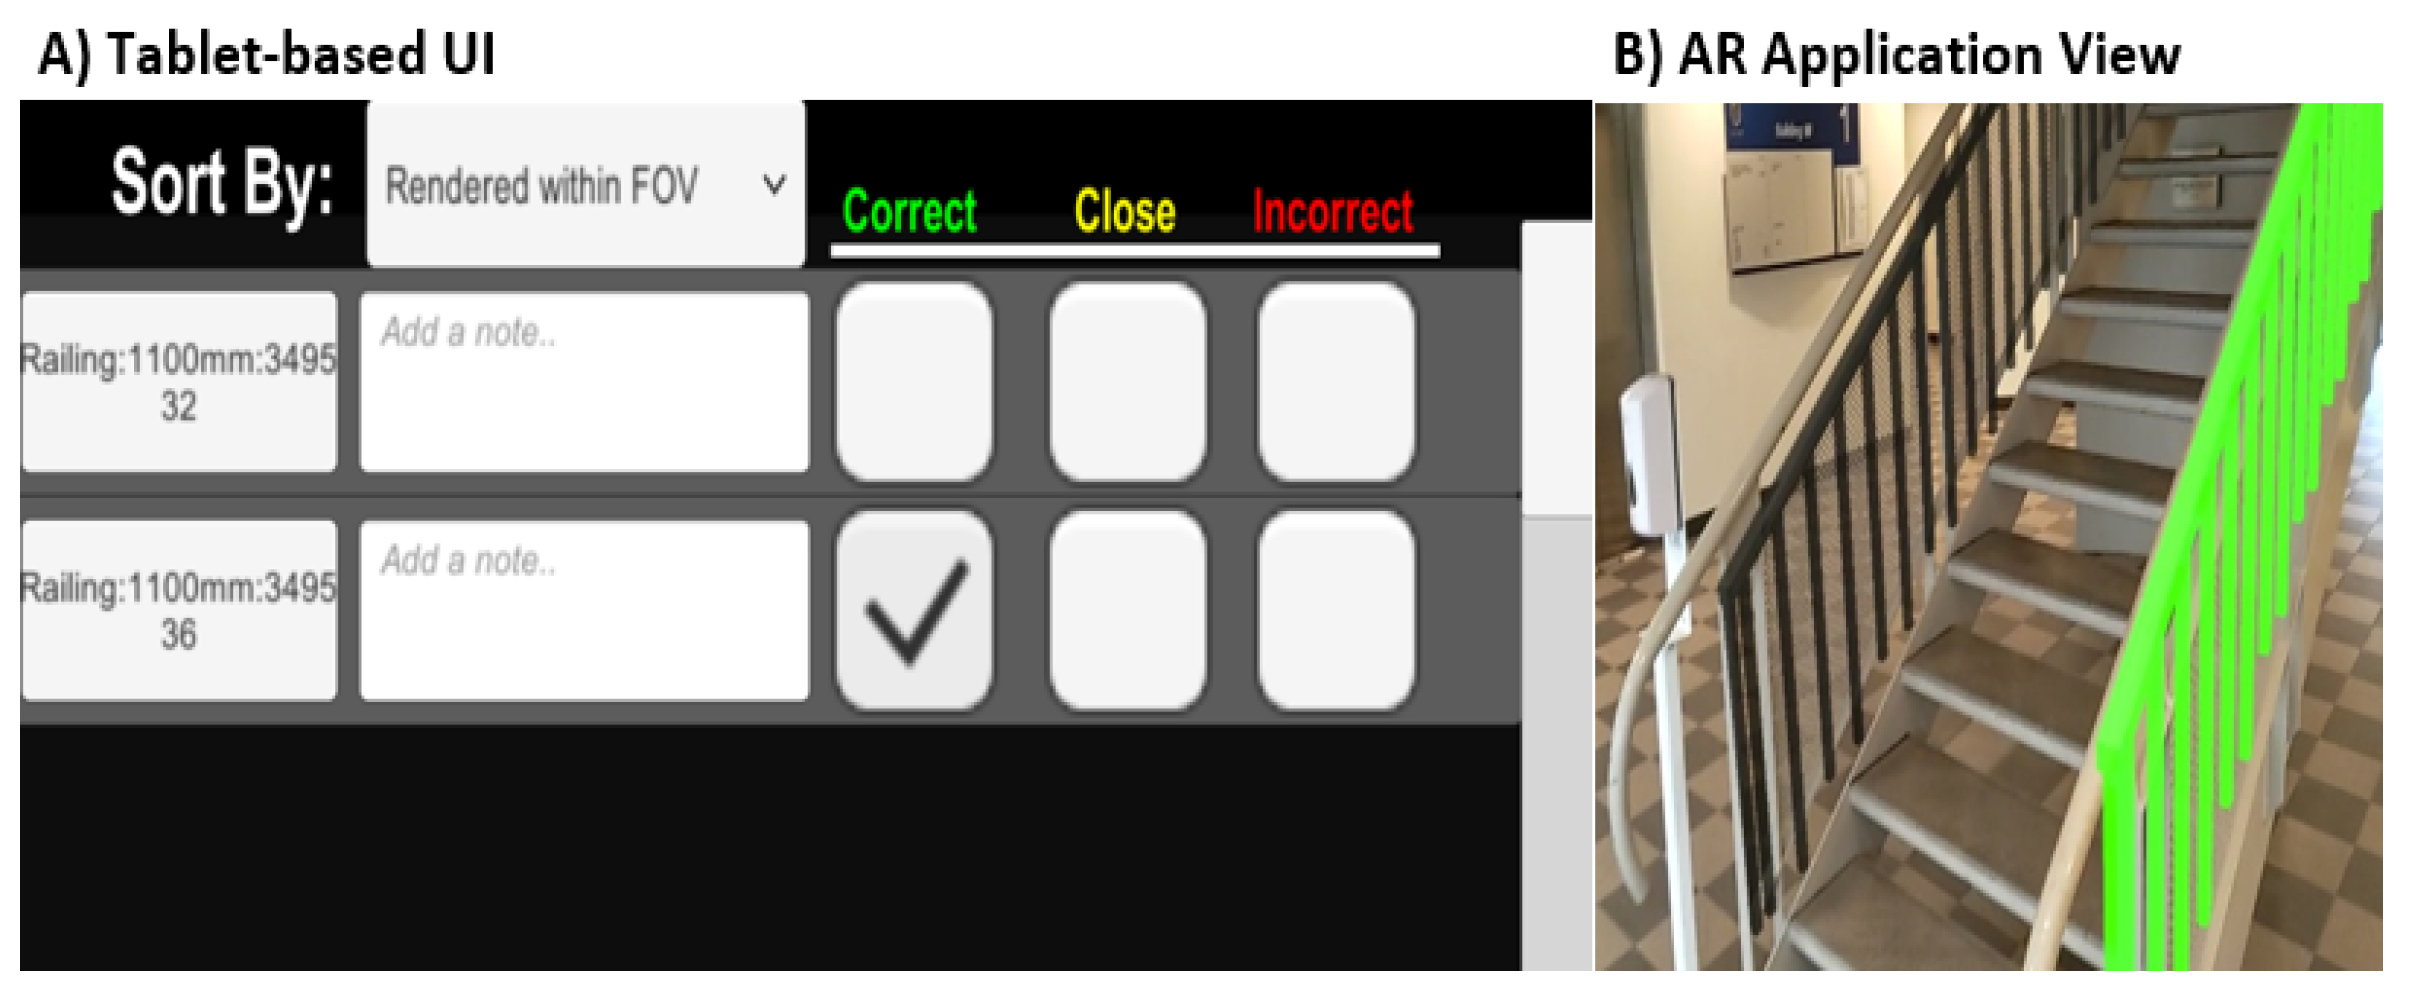
4.2.1. Tablet-Based Application

The development of an intuitive and easy-to-use UI for inputting checklist data was one of the primary design considerations during the development of the BIM-ARDM system. It was evident, based on participants’ responses during the workshop, that practical AR-based applications in AEC must be simple, easy to use, and have an intuitive UI for construction personnel to operate (F5). Participants also commented on the importance of having checklist and other documents required for a construction inspection to be accessible within a single device (F6). As a result, we aimed to design a complete UI that contained the functional requirements required to perform a defect management inspection (F6) whilst still maintaining a simple and easy-to-use UI design (F5).
Initially, we explored using an AR-based holographic UI that utilized a combination of gestures and audio commands as user input. However, based on our informal observations, we felt a non-tactile UI would lack intuitiveness and user-friendliness when operating the UI due to the complex nature of the UI design. Furthermore, the likelihood of false positives occurring when using a gesture-based interface would likely contribute to increased errors occurring whilst the inspector conducts their inspections. We also discussed the potential of using a speech-based input system; however, due to construction sites being relatively noisy environments, we concluded that a speech-based input system would not be suitable for a real-world construction site.
We concluded that a tablet-based interface that could seamlessly communicate data with the HoloLens II was the most viable and user-friendly approach for inspectors to operate on a real-world construction site. To achieve this, we developed a TCP/IP network architecture where a local server is hosted off the Android tablet, and the HoloLens II connects to the local server as a client. This allowed us to create a bi-directional communication, allowing us to synchronously transmit commands and data between both devices.
The tablet-based application consists of three primary interfaces that allow the inspector to operate the BIM-ARDM system. The first interface, “Visualisations” (Figure 4A) enables the inspector to control (turn on/off) and configure the different visualisations integrated into the AR-based system. The second interface, “Checklist” (Figure 4B) allows the inspector to input inspection data, and the third interface, “Diagnostics and Calibration” (Figure 4C) is used to setup the calibration of the AR system and display diagnostic feedback associated with the tablet-based and AR-based applications.
Visualisations: The visualisation interface (Figure 4A) acts as a control panel for the visualisations, allowing the inspector to control and configure two AR visualisations, categorizing elements and rendering the distance. The interface also controls some additional AR features including toggling the visibility of the BIM model and enabling/disabling the generated AR spatial mapping mesh.
Checklist: The checklist interface (Figure 4B) provides the inspector with a UI to input inspection data into whilst they conduct their construction inspection. Upon loading the application, each element in the BIM model is generated within the checklist interface, and the inspector can assign each element to one of the following three values:
  • Correct (no defect): The construction is correct, contains no defects, and is correctly aligning with the virtual element. In the pilot study, we defined this as a less-than-5 cm drift between the virtual and physical elements.
  • Close (minor defect): The construction slightly differs from the virtual element. In the pilot study, we define this as a 5 cm-to-50 cm drift between the virtual and physical elements.
  • Incorrect (major defect): The construction significantly differs from the virtual element. In the pilot study, we defined this as a greater-than-or-equal-to-50 cm drift between the virtual and physical elements.
Upon assigning the element to one of the three above-listed values in the checklist, the corresponding holographic element within the AR environment will update its colour. Within the checklist interface, each element also contains a text-box area where inspectors can input any additional comments related to the inspection of each element.
The checklist interface also consists of a built-in sorting option feature that allows the inspector to sort elements based on the following categorizations:
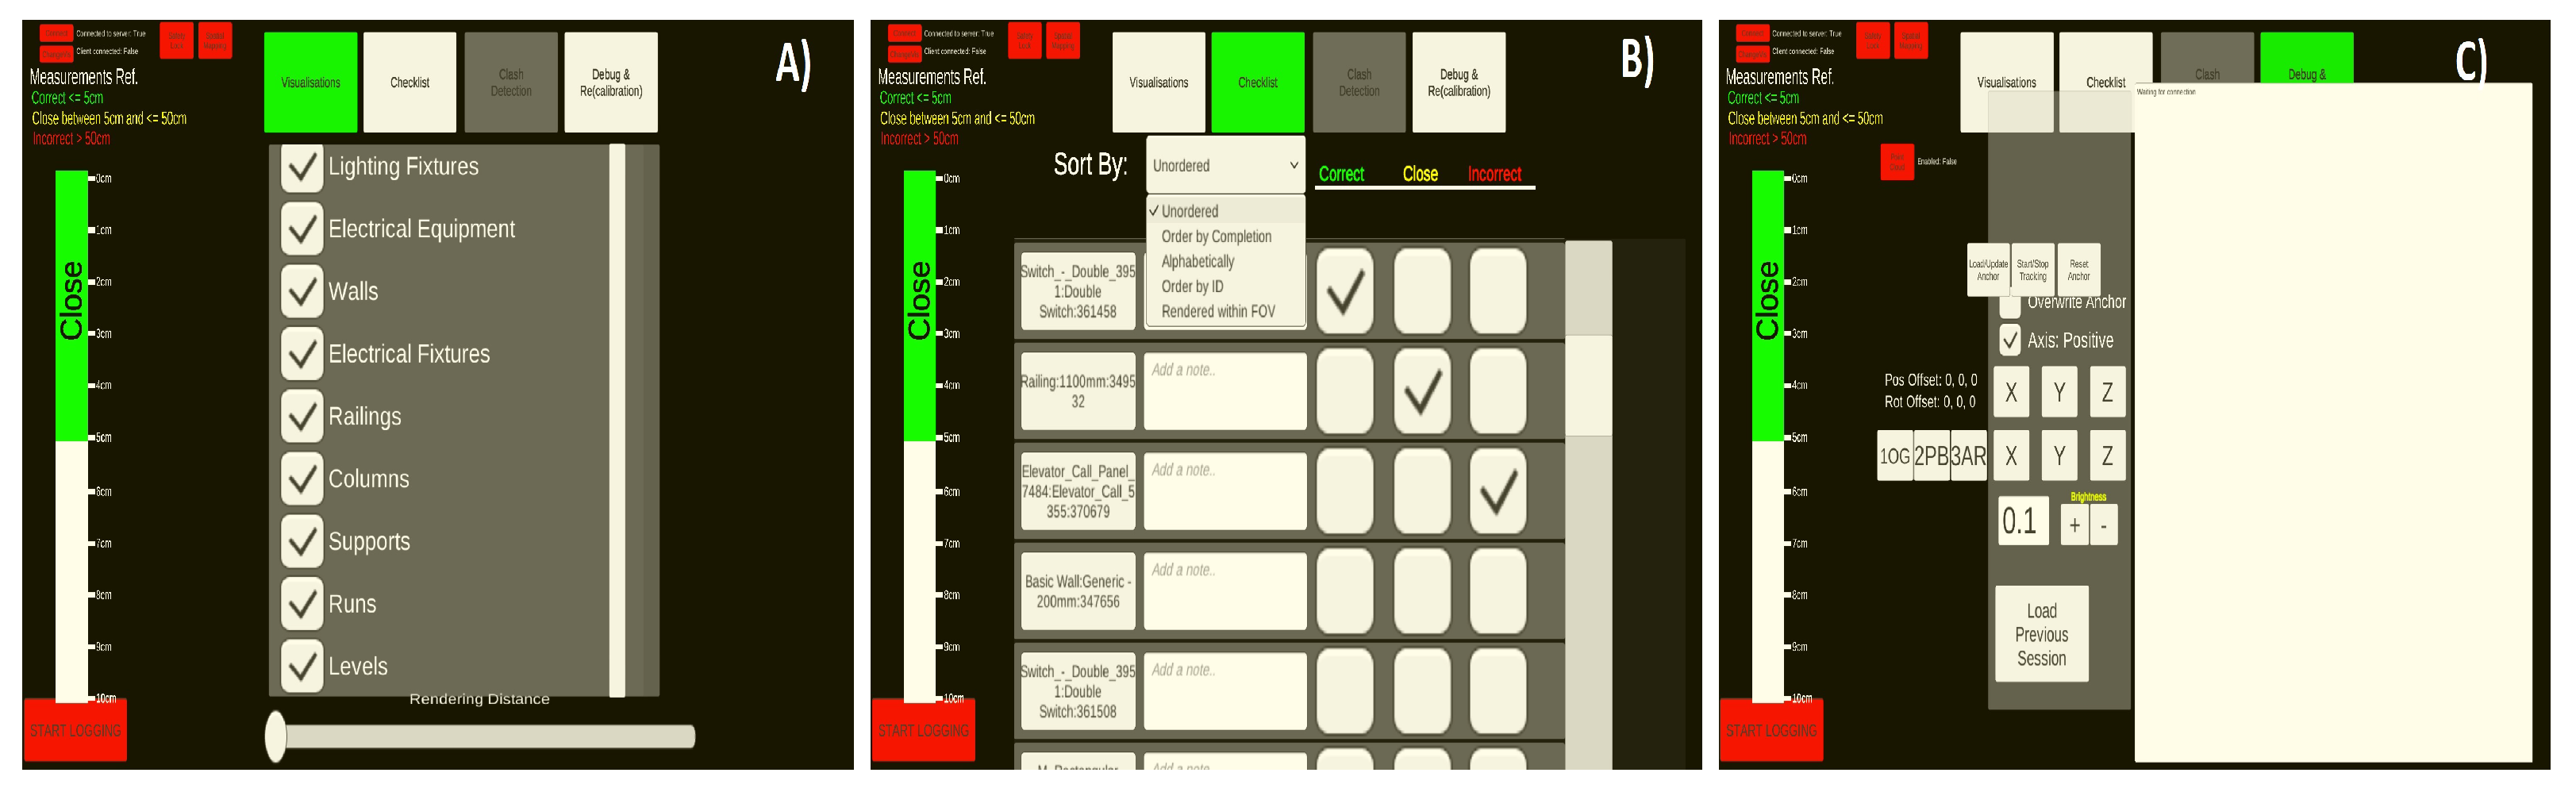
  • Unordered: Displays elements in their default, randomly generated order.
  • Sort by completion: Sorts elements that are currently unassigned before elements that have been assigned.
  • Alphabetical order: Sorts elements by alphabetical order.
  • Sort by ID: Sorts elements numerically based on their Revit models unique ID.
  • Rendered within field of view (FOV): Only displays checklist elements that are actively being rendered within the inspector’s FOV.
The system also provides the capability for inspectors to capture images of individual elements by selecting an element within the checklist UI and pressing the capture-image button. Images are captured through the HoloLens 2’s built-in camera and stored within the HoloLens 2 internal storage system. Subsequently, checklist data inputted into the tablet application during the inspection are autonomously logged to a .csv file, which is also stored within the HoloLens 2 internal storage system. We also integrated support to load previous .csv files within the AR-based application, which allows inspectors to load their previous inspection sessions. Finally, a Revit plugin was developed to import all data recorded in the BIM-ARDM system back to the original Revit model.
Diagnostics and Calibration: The diagnostics and calibration interface (Figure 4C) was designed to support two primary functions. Firstly, if a potential issue emerges whilst operating the BIM-ARDM system, this interface allows the inspector to determine the problem that caused the issue to occur. This is achieved by having a console UI that displays the various debug statements outputted by the BIM-ARDM system. Secondly, the menu contains a set of buttons that allow the inspector to setup and configure the tracking calibration process.

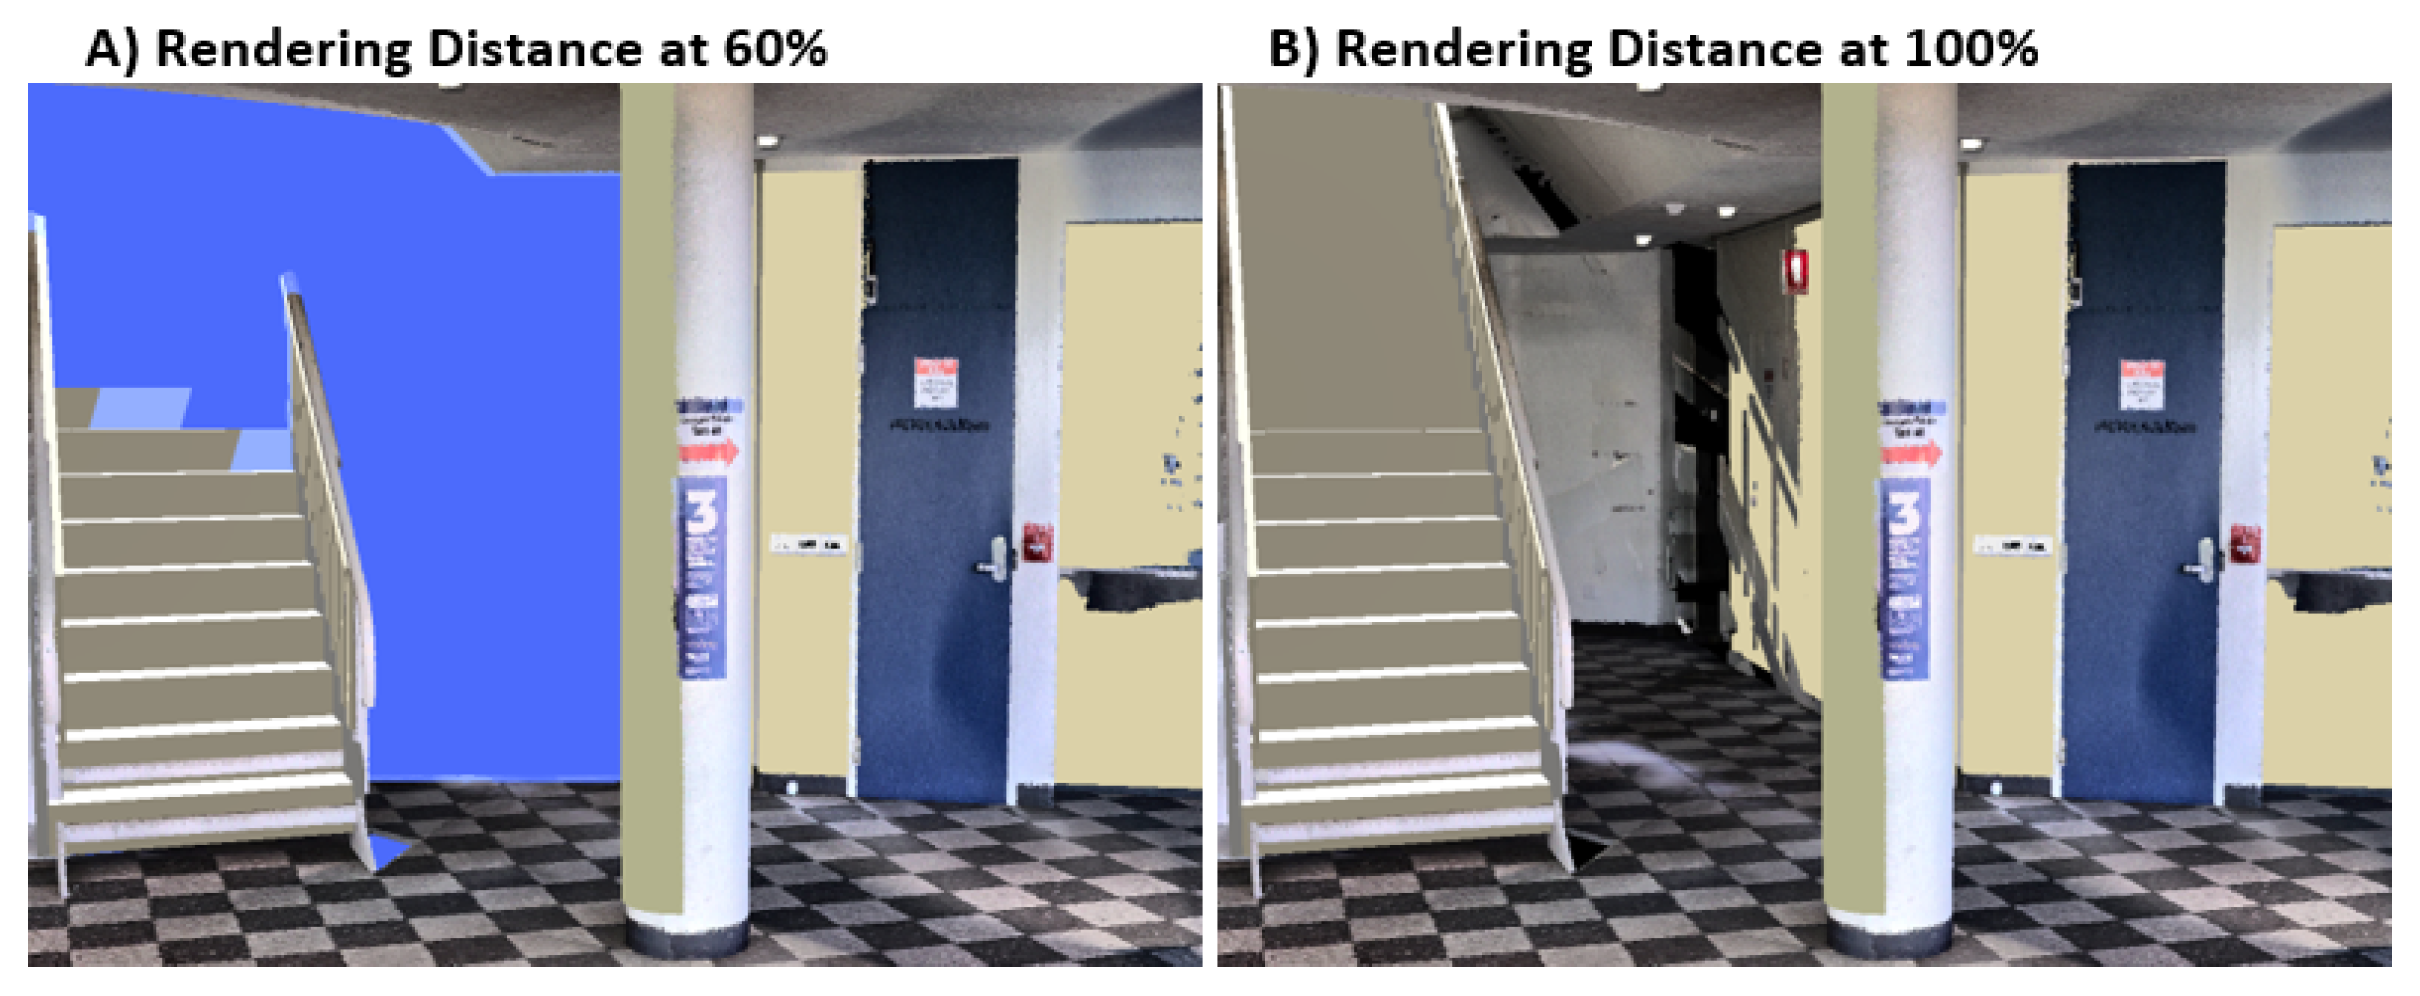
4.2.2. AR-Based Application
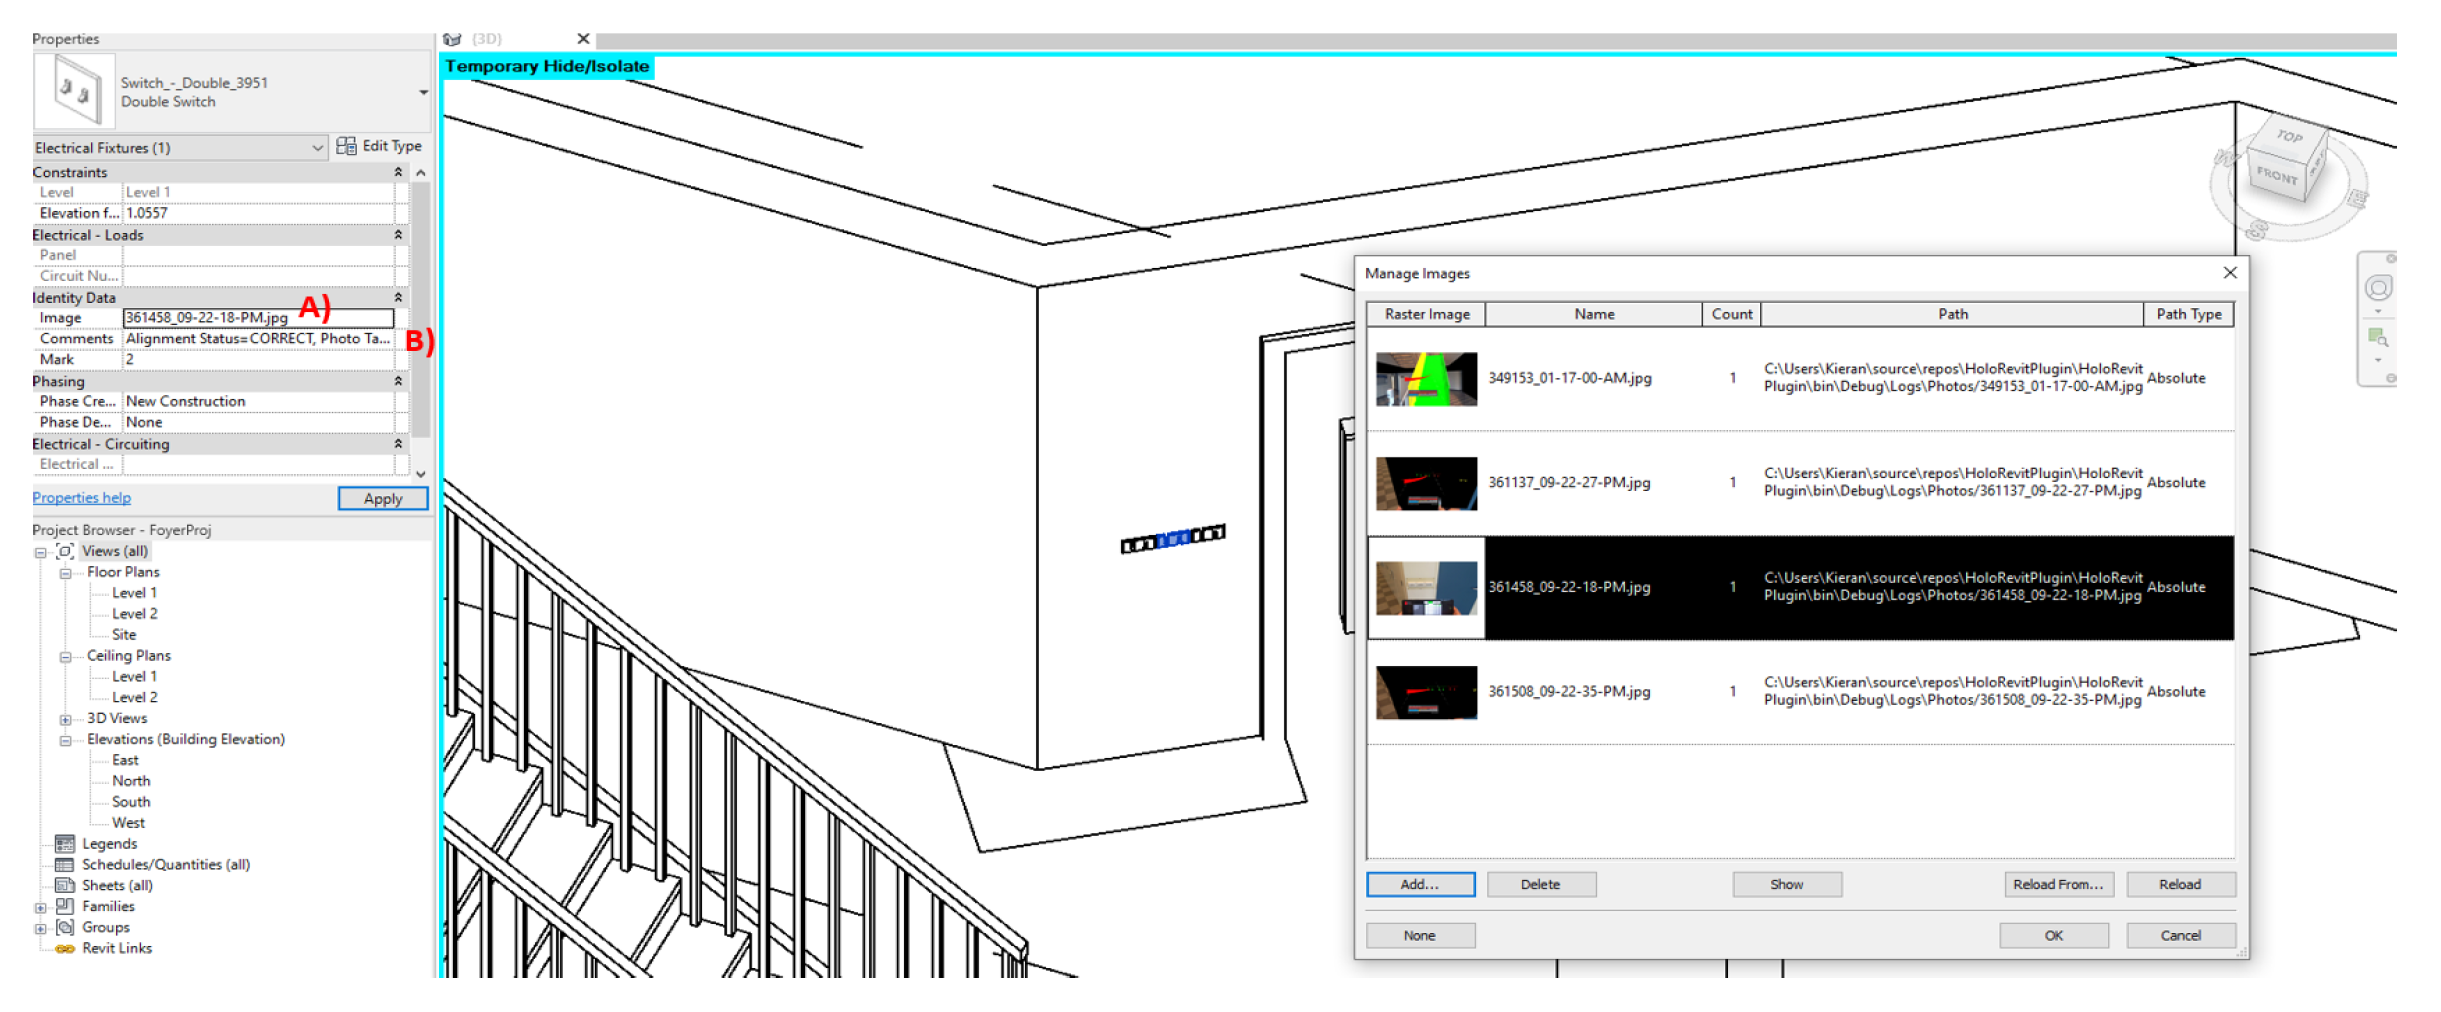
The AR-based application is comprised of two primary functions. The first function is the visualisations and features that we developed to support inspectors with their on-site construction inspection performance. The second function is the developed tracking and calibration system that is used to superimpose the BIM model onto the real-world construction site at a one-to-one mapping.
Visualisations and Features: User-friendliness (F5) and interactivity (F4) were two features mentioned by several participants throughout the workshop. Participants also encouraged representing data through three-dimensional visualisations as opposed to traditional two-dimensional analogue drawings (F3). To achieve this, we developed a set of five three-dimensional visualisations designed to assist the inspector with conducting their inspection. The developed AR visualisations can be controlled and configured by the inspector directly through the tablet-based application. The specific visualisations were (1) the ability to visualise specific elements based on their categorizations (F2 and F4), (2) controlling the camera’s rendering distance to only visualise specific elements within a specified distance from the user, (3) an element location-finder visualisation, (4) an element colour-coded visualisation, and (5) a tool that only displays elements within the checklist UI that are currently being looked at by the inspector. A more-detailed description and overview of the design motivations associated with each of the visualisations is presented below.
1. Categorizing elements: The ability to turn on and off specific elements was a feature highlighted by workshop participants (F4). Due to our system workflow consisting of an IFC-based approach to import BIM models into Unity, partial metadata associated with the BIM are maintained. As a result, unique IDs and categorizations of building elements that are automatically generated in Revit are accessible within the Unity game engine. Using this data, we developed an approach to automatically and dynamically generate a list of categorizations based on the corresponding categories associated with each building element. Within the tablet interface, inspectors can toggle on or off different categories to enable or disable the visibility of each AR building element associated with the given category; for example, electrical fixtures or signs as illustrated in Figure 5. Based on our informal observations, we believe this visualisation to be most effective when inspecting complex and dense BIM models. The primary advantage of the visualisation is that it allows the inspector to focus on specific elements and filter out any irrelevant elements to avoid confusion and improve visibility.
2. Rendering distance: A visualisation was also developed that allows the inspector to control the visibility of elements by manipulating the rendering distance of the AR camera. A slider on the tablet UI can be controlled by the inspector to specify the rendering-distance threshold. A transparent holographic box is displayed in the AR environment that provides visual feedback to the inspector of the specified rendering-distance threshold. All elements between the user and the displayed holographic box are visible to the AR user; whereas, elements outside the box are not rendered by the camera (Figure 6).
The visualisation was developed based on two specific design motivations. Firstly, due to our software rendering several non-occluded objects at a time, we believed a function to mitigate the amount of virtual objects being rendered by the camera could significantly improve the visibility of elements within the AR environment. We initially tested this visualisation on a smaller-scale environment with a Revit model containing approximately thirty elements, and based on our informal observations, we did not find the visualisation particularly useful. However, when testing this visualisation on a real-world construction site with more than 2000 elements, we discovered this visualisation had the potential to become more effective as the complexity and density of the BIM model increased. This was demonstrated when it became difficult to focus on specific elements within the scaled-up BIM model due to having several non-occluded virtual elements actively being rendered by the AR camera. Therefore, using the visualisation to only display specific elements closer to the inspector significantly improved the visibility of elements.
The second motivation is that using this feature can significantly increase the frame rate of the AR application, thus improving performance. It became evident when testing the BIM-ARDM prototype on a real-world construction site that required a BIM model with over 2000 virtual elements actively rendered within the AR camera that performance was an issue. However, when using this visualisation, we discovered the performance of the AR application system significantly improved due to the visualisation mitigating the number of elements rendered by the AR camera.
3. Element finder visualisation: A visualisation was also developed to make it easier for inspectors to locate virtual elements whilst conducting their inspection. This visualisation is autonomously enabled within the AR view when the inspector selects a checklist element through the checklist UI. The visualisation consists of a virtual Bezier curve that appears in front of the inspector guiding them to the location of the virtual element that was selected on the checklist (Figure 7).
When testing an early iteration of the system, we found it extremely difficult to locate and identify holographic elements based on their corresponding checklist name. Therefore, the design motivation of this visualisation was to make it easier for an inspector to locate and identify checklist elements. We initially developed a visualisation that would display a virtual arrow in front of the user and point to the direction of the selected element. However, based on our informal observations we found this approach would not be suitable to locate virtual elements within a dense environment where elements are clustered or closely confined. As a result, we re-designed the visualisation to incorporate a bendable ray that would provide a direct path from the position of the inspector to the centre of the selected element.
4. Colour-coded visualisation: During the construction inspection, inspectors can input into the tablet-based checklist interface whether elements were built in the correct (no defect), close (minor defect), or incorrect (major defect) positions. A colour-coding visualisation tool was integrated into the system to autonomously update the colour of the corresponding virtual element once it is checked off the checklist by the inspector. The colour of the virtual element is modified from their default material colour to a green value to represent if the element is correct (i.e., no defect), yellow if close (i.e., minor defect), or red if incorrect (i.e., major defect). The primary motivation of this visualisation is to provide inspectors with visual feedback on what elements have already been inspected within the checklist. We believe this could improve inspection performance as inspectors can easily and efficiently keep track of the elements they have previously checked off during the inspection.
5. Checklist field-of-view (FOV) rendering: The final feature integrated into our BIM-ARDM system was designed to only display elements within the checklist UI that the inspector is currently looking at within the AR application (Figure 8). Based on the size of the BIM model, checklists can potentially produce a large and comprehensive list of elements. Therefore, we believed that as the complexity of the BIM model increased, it would become more difficult for inspectors to identify specific elements from the AR environment within the checklist UI. Furthermore, specific checklist elements may also share the same or similar names due to having multiple copies or variations of the same elements (e.g., windows) within the Revit model. As a result, the motivation of this feature was to develop an approach that would improve the inspector’s ability to identify a specific element within the checklist UI. Based on our informal observations, we believe that this feature achieves this goal by making it significantly easier for an inspector to identify and locate an element within the checklist UI.
Tracking and calibration process: During the workshop, participants stated they require digital surveying-type accuracy (F9) whilst still maintaining a very simple process to setup the tracking (F8). Due to inspectors requiring millimetre-precise tracking accuracy between the virtual BIM model and the physical construction site to obtain accurate results, we prioritized tracking accuracy over developing a user-friendly tracking system. However, we still integrated various features into our tracking system (e.g., spatial anchors and a re-calibration system) to improve the tracking setup process.
Previously, we discussed two common methods to superimpose BIM models onto a physical construction site: marker-based and markerless tracking. To obtain the most-accurate tracking results, we employed a hybrid tracking approach that uses a marker-based tracking technique to initially calibrate the system and subsequently a markerless approach for maintaining the tracking without markers. After the initial calibration was setup, we also assigned anchors to the BIM model to ensure minimal drift occurs whilst the user navigates through the building. Using this process, we could achieve up to a 1 cm accuracy precision, but this was heavily dependent on ensuring that the position of the physical marker was being tracked at the identical position of the corresponding virtual marker in the BIM model as depicted by Figure 9. To improve the simplicity and user-friendliness of our tracking system (F8), a set of additional features were integrated into our tracking system. This includes spatial anchors that allow inspectors to store and load previously calibrated tracking environments so that a one-time calibration is required for each construction site. However, based on our testing, we found anchors to be relatively inconsistent with the HoloLens 2, and it was highly dependent on the spatial mapping accuracy produced by the built-in depth sensors.
To make minor adjustments to the tracking, we also developed an easy-to-use tracking-adjustment system that can be controlled by the inspector directly through the tablet-based application. Simple debugging tools are also available in the tablet-based application to further assist the inspector with the tracking setup process.

4.2.3. Revit Plugin

During the workshop, participants described the importance of maintaining BIM data (F10) and integrating the AR system with existing BIM platforms (F7). Although the BIM-ARDM system was built off the Unity game engine, we developed a Revit plugin to ensure all data collected during the inspection using the BIM-ARDM system can be synchronized back to the original BIM model. The plugin can be executed directly within Revit and automatically parses a .csv file outputted by the BIM-ARDM software. Data are then linked back to the Revit model based on the unique ID of each element. The recorded data consist of two primary categories:
  • The checklist data, which contain data inputted by the user using the tablet interface. These data include whether the element is correct, close (minor defect), or incorrect (major defect), as well as any other additional comments inputted by the inspector.
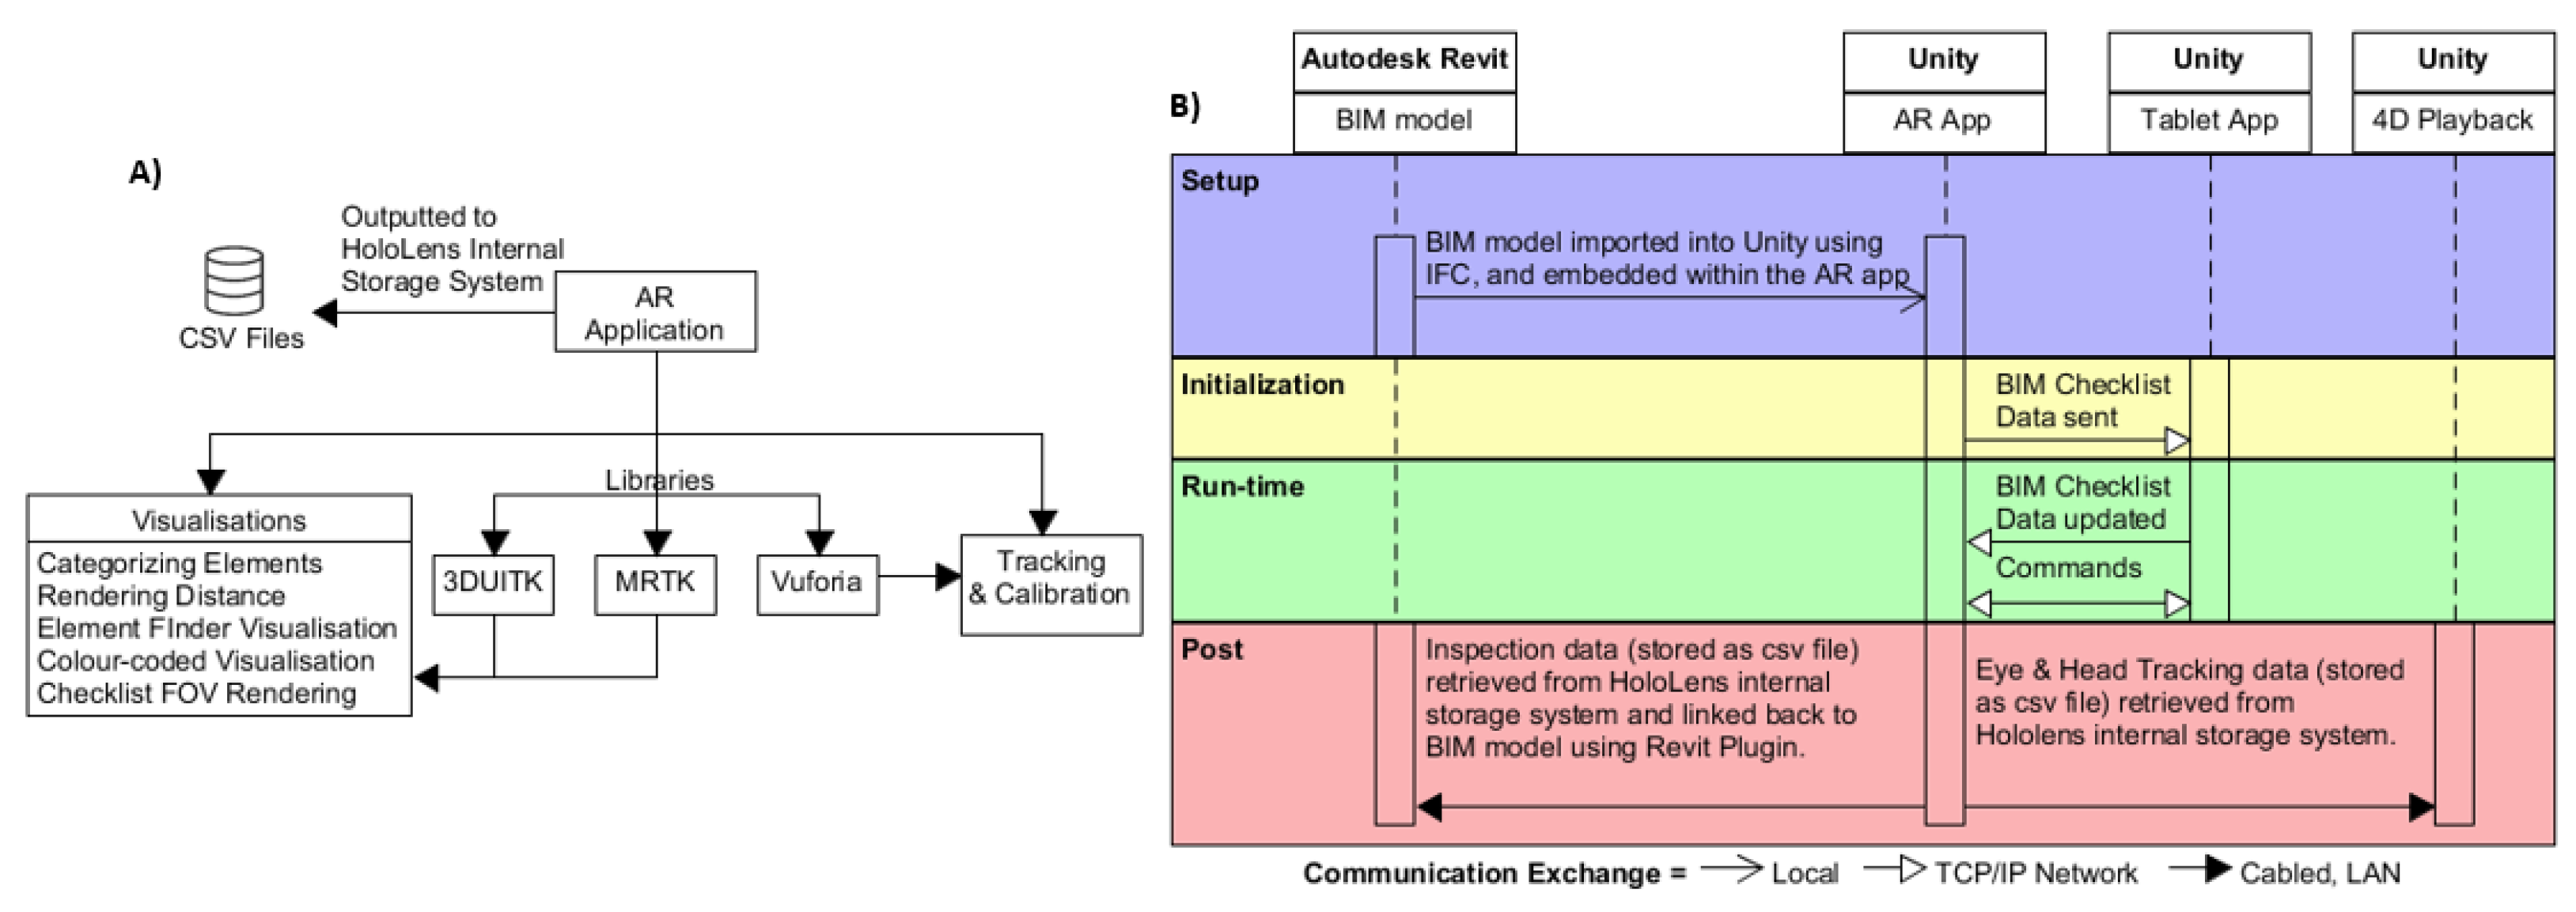
  • Images captured of on-site elements, which are captured through the built-in HoloLens 2 camera and can be captured by selecting a capture image on the tablet-based interface. Running the Revit plugin links each picture taken during the inspection back to each of the corresponding Revit elements and attaches the images to the elements as a raster image parameter as illustrated in Figure 10.

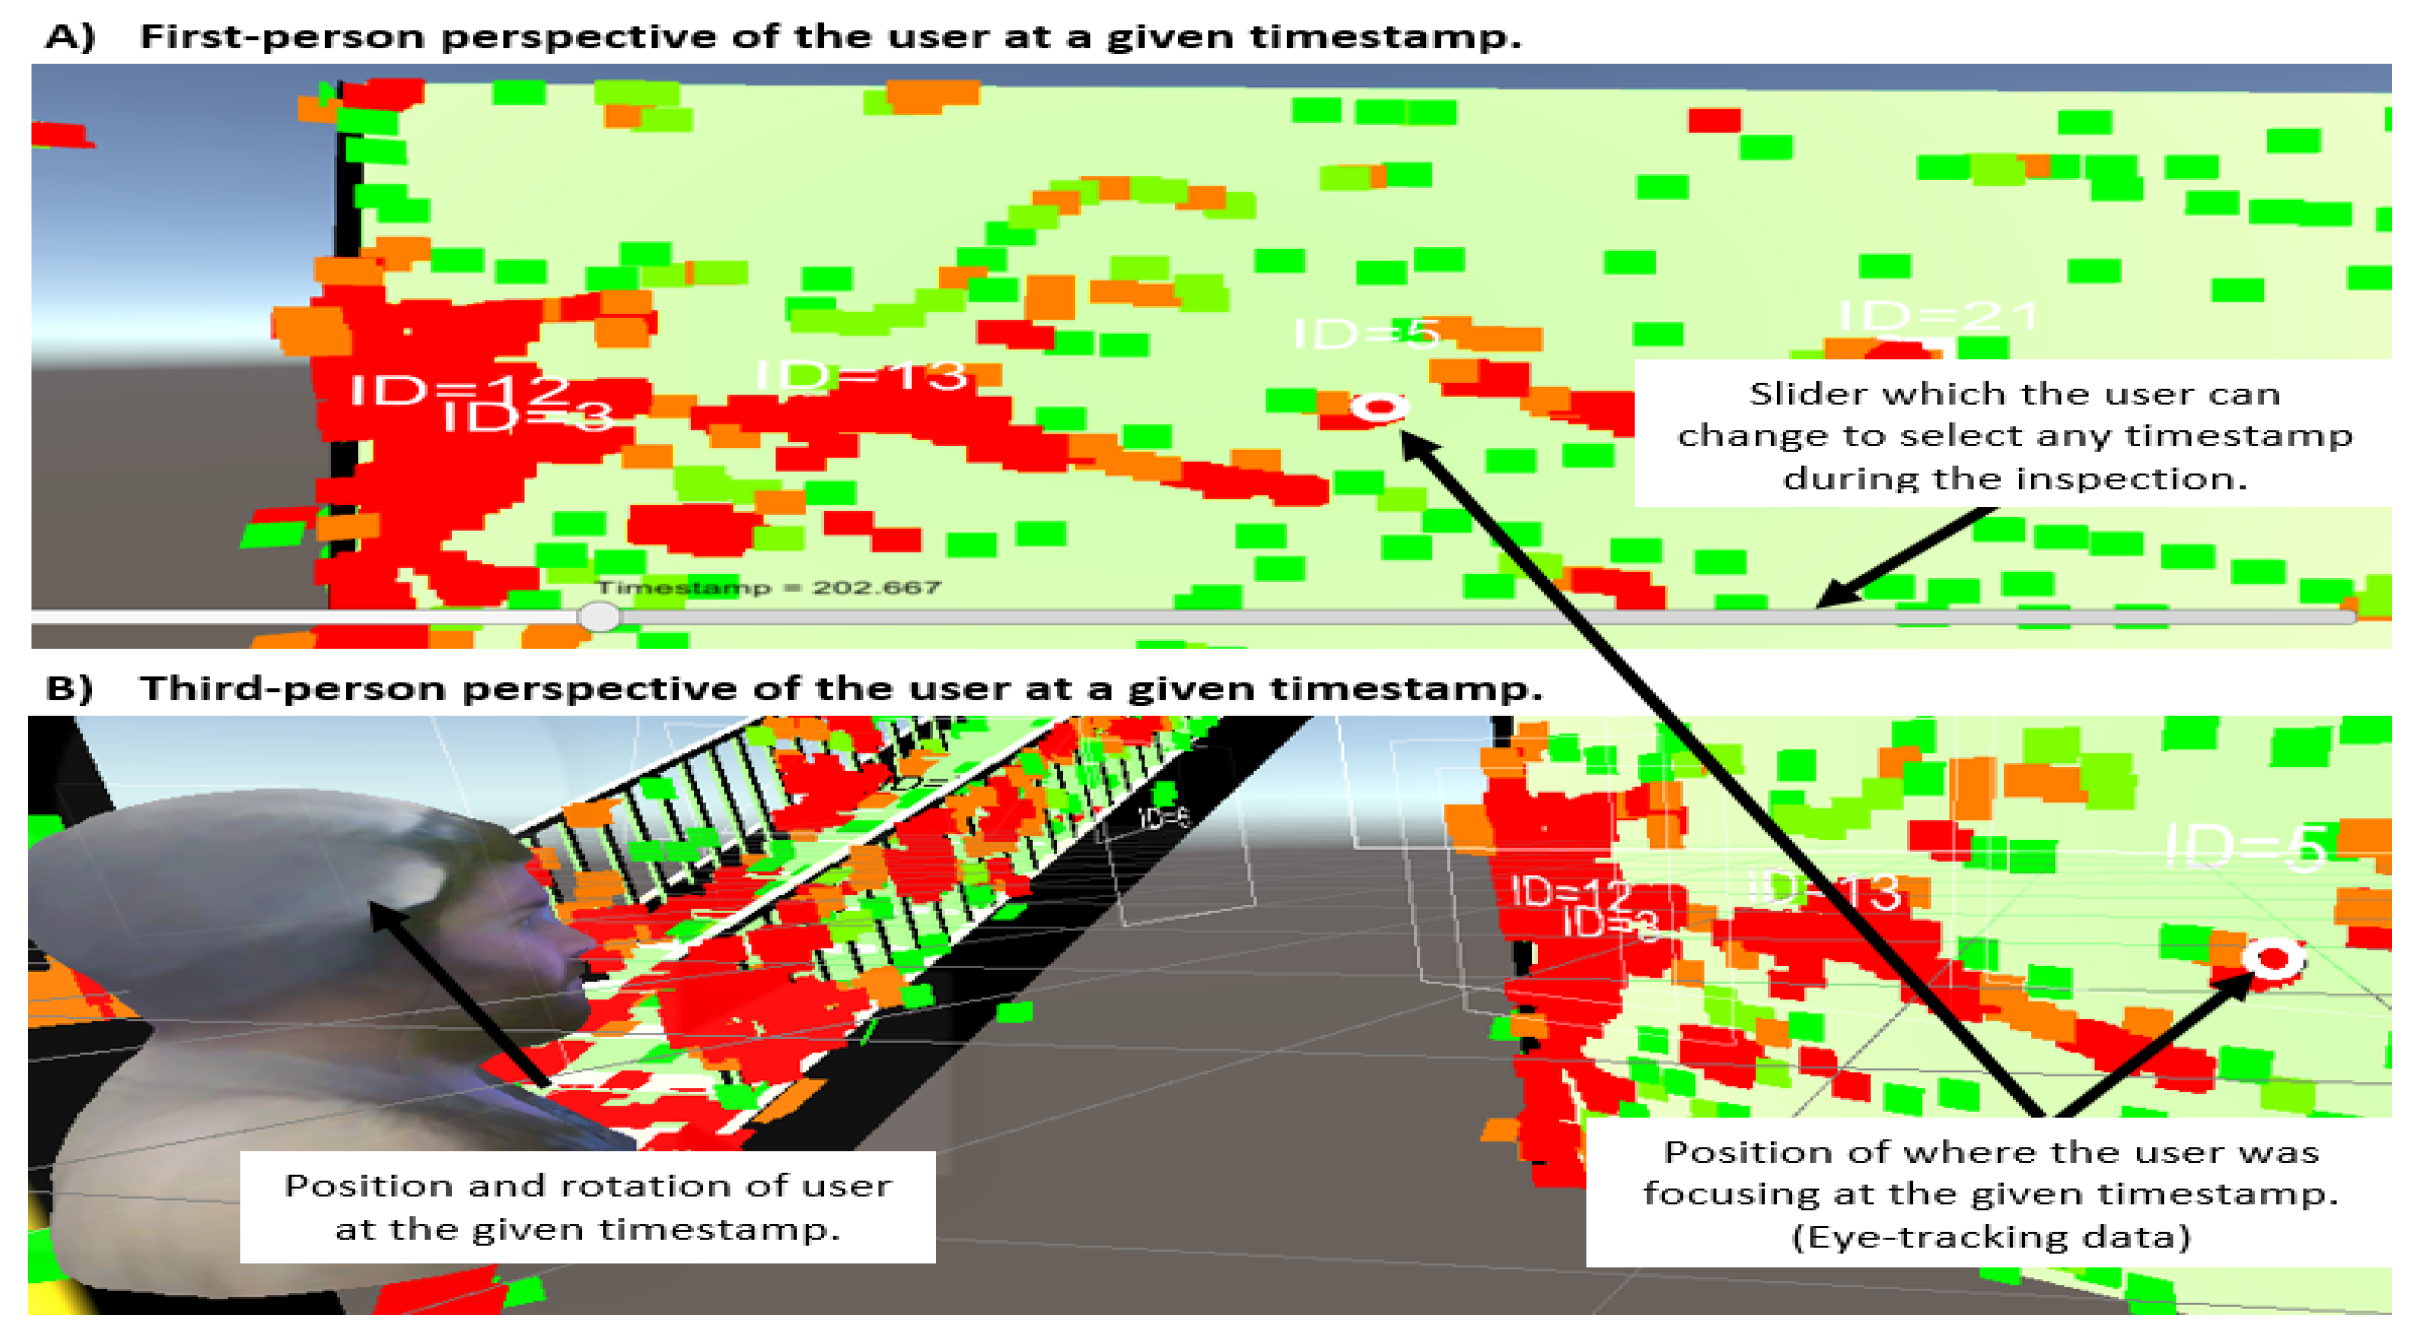
4.2.4. 4D Playback Analysis Tool

We also present an experimental analysis tool built into our system, which aims to monitor the performance quality of the inspector’s defect management inspection. During the inspection, the head position and rotation vectors, converged eye gaze position and rotation vectors of each pupil, calibration data, and associated timestamps (every 0.1 s) are logged and stored within the HoloLens as a .csv file. After the inspection, the playback analysis software then allows users to playback this data as a 4D visualisation, which displays the inspector’s head and eye-gaze location at any time interval throughout the inspection. Additional options are built into the system allowing users to slow down, speed up, play in real-time, or jump between different time intervals using a 2D slider. A heatmap visualisation, which dynamically generates heatmaps at every point that the user looked at on the construction site, was incorporated into the system (Figure 11). A three-colour gradient palette (red, yellow, and green) was used to represent which areas the user was most focused on throughout the inspection. The advantages of this tool are that it allows managers to ensure the inspection has been conducted thoroughly and correctly. Using the playback analysis software, users can identify areas within the BIM model that were potentially neglected based on the inspector’s eye-tracking data.

4.3. System Limitations

The presented BIM-ARDM system consists of two common AR limitations, tracking accuracy and performance.

4.3.1. Tracking Accuracy

Due to defect management inspections requiring millimetre-precision accuracy to ensure the accuracy of inspection data, tracking was one of the primary limitations associated with the system. Although we did not conduct any formal tests or analysis on our tracking accuracy, based on our information observations, we believe the tracking accuracy would generally produce between 1–2 cm. As a result, during our pilot study, participants were instructed to only consider virtual elements greater than 5 cm from the corresponding physical elements as a defect. It also became evident during user-testing that due to depth-perception issues associated with the HoloLens display, the depth of virtual objects would appear to change based on the position and angle of the user.

4.3.2. Performance

Throughout the development of the AR-based system, performance was the primary design consideration during the algorithmic design and implementation of the presented visualisations and features. Due to the HoloLens running as a standalone device, we had to ensure the system would be capable of maintaining a steady frame rate whilst rendering complex geometric building models in addition to several visualisations and features. As a result, our algorithmic implementation of all visualisations and features maintained an O(1) time complexity.
This allowed our implementation to run on very large BIM models consisting of complex geometry. We tested and validated the performance of our BIM-ARDM system on a real-world construction site (Adelaide Festival Plaza (https://armarchitecture.com.au/projects/adelaide-festival-plaza-precinct-masterplan/, accessed on 20 December 2021) that consisted of a complex BIM model containing over 2000 virtual models. The results from this test demonstrated that the system was capable of running at a steady frame rate of 10–15 FPS. However, using the rendering-distance visualisation further improved the system’s frame rate.
Despite these results demonstrating the scalability of the BIM-ARDM system, the performance-design limitation resulted in specific features being cut from the system due to not meeting performance requirements. Future iterations of AR displays will continue to improve their processing capabilities, and, as a result, more performance-demanding visualisations and features will become feasible in the future for standalone AR displays.

5. User Study

A comparability pilot study with 11 participants was conducted to assess the performance of our proposed BIM-ARDM system in comparison to the conventional paper-based defect management techniques currently employed within the construction industry. The 11 participants primarily consisted of researchers from the university. All participants who volunteered to take part in the study had some prior experience using AR technology (45% use AR 1–10 times per month, 27.3% daily, 18.2% 1–10 times per year, and 9.1% weekly). From the selection of 11 participants, 10 participants lacked prior experience in conducting on-site construction inspections within a professional capacity.

5.1. Experimental Design

The experiment comprised of two conditions. The first condition was the conventional approach for conducting defect management inspections, which utilized a three-dimensional perspective and two-dimensional orthographic paper-based drawings of the building model as a reference. The second condition was the experimental BIM-ARDM prototype, which superimposes the virtual building model onto the physical construction site and incorporates several visualisations and features as described in Section 4. The experiment consisted of a within-study design, and the order of conditions varied for each participant to counterbalance data. The different AR visualisations provided in the AR condition could be toggled on and off based on the participant’s preference. However, participants were encouraged to test each visualisation at least once. During each condition, participants were instructed to complete a defect management inspection task that involved identifying and recording on-site construction defects within a building at the university.
The types of defects we focused on during the study was whether the placement (position or rotation) of a physical constructed element matched the position of the corresponding virtual building element. Participants were instructed to categorize defects into three categorizations: correct (i.e., no defect) when the virtual element was less than 5 cm of the constructed element, close (i.e., minor defect) when the virtual element was between 5 cm and 50 cm, and incorrect (i.e., major defect) when the virtual element was greater than or equal to 50 cm from the constructed element. During each condition, participants were required to inspect a total of thirty elements within the building and record whether each element was correct, close, or incorrect into a tablet-based checklist interface (Figure 4). From the thirty elements inspected by participants in each condition, eighteen of the elements were correct (no defects), eight elements were close (minor defects), and four elements were incorrect (major defects). Each condition contained a different set of defects and correctly positioned elements, and these elements were counterbalanced between the two conditions. Despite the paper-based condition relying entirely on using paper-based drawings, participants still wore a HoloLens 2 HMD with a blank display for data-collection purposes and to replicate the environmental conditions of the AR condition.

5.2. Results

A combination of objective and subjective metrics were utilized to capture specific data throughout the experiment. The collected subjective data consisted of a System Usability Scale (SUS) [20], the Paas Mental Effort ranking [46], a combination of shared and specific Likert-scale based questions, and open-ended short-answer questions as illustrated in Table 3. The objective data, which were used to evaluate the participants’ performance consisted of completion time and error rates based on the experimental design.

5.2.1. Usability

The usability for both systems was measured by having participants complete the SUS questionnaire upon completion of each condition. The mean SUS results revealed participants ranked the usability of the paper-based system at 42.04 (grade = F; adjective rating: awful; SD = 19.963), whereas the AR-based system received a mean rating of 81.36 (grade = A; adjective rating: excellent; SD = 9.107). A Wilcoxon Signed rank test verified that participant SUS ratings for the AR system were significantly higher (p < 0.01, r = −0.87) than the paper-based approach.

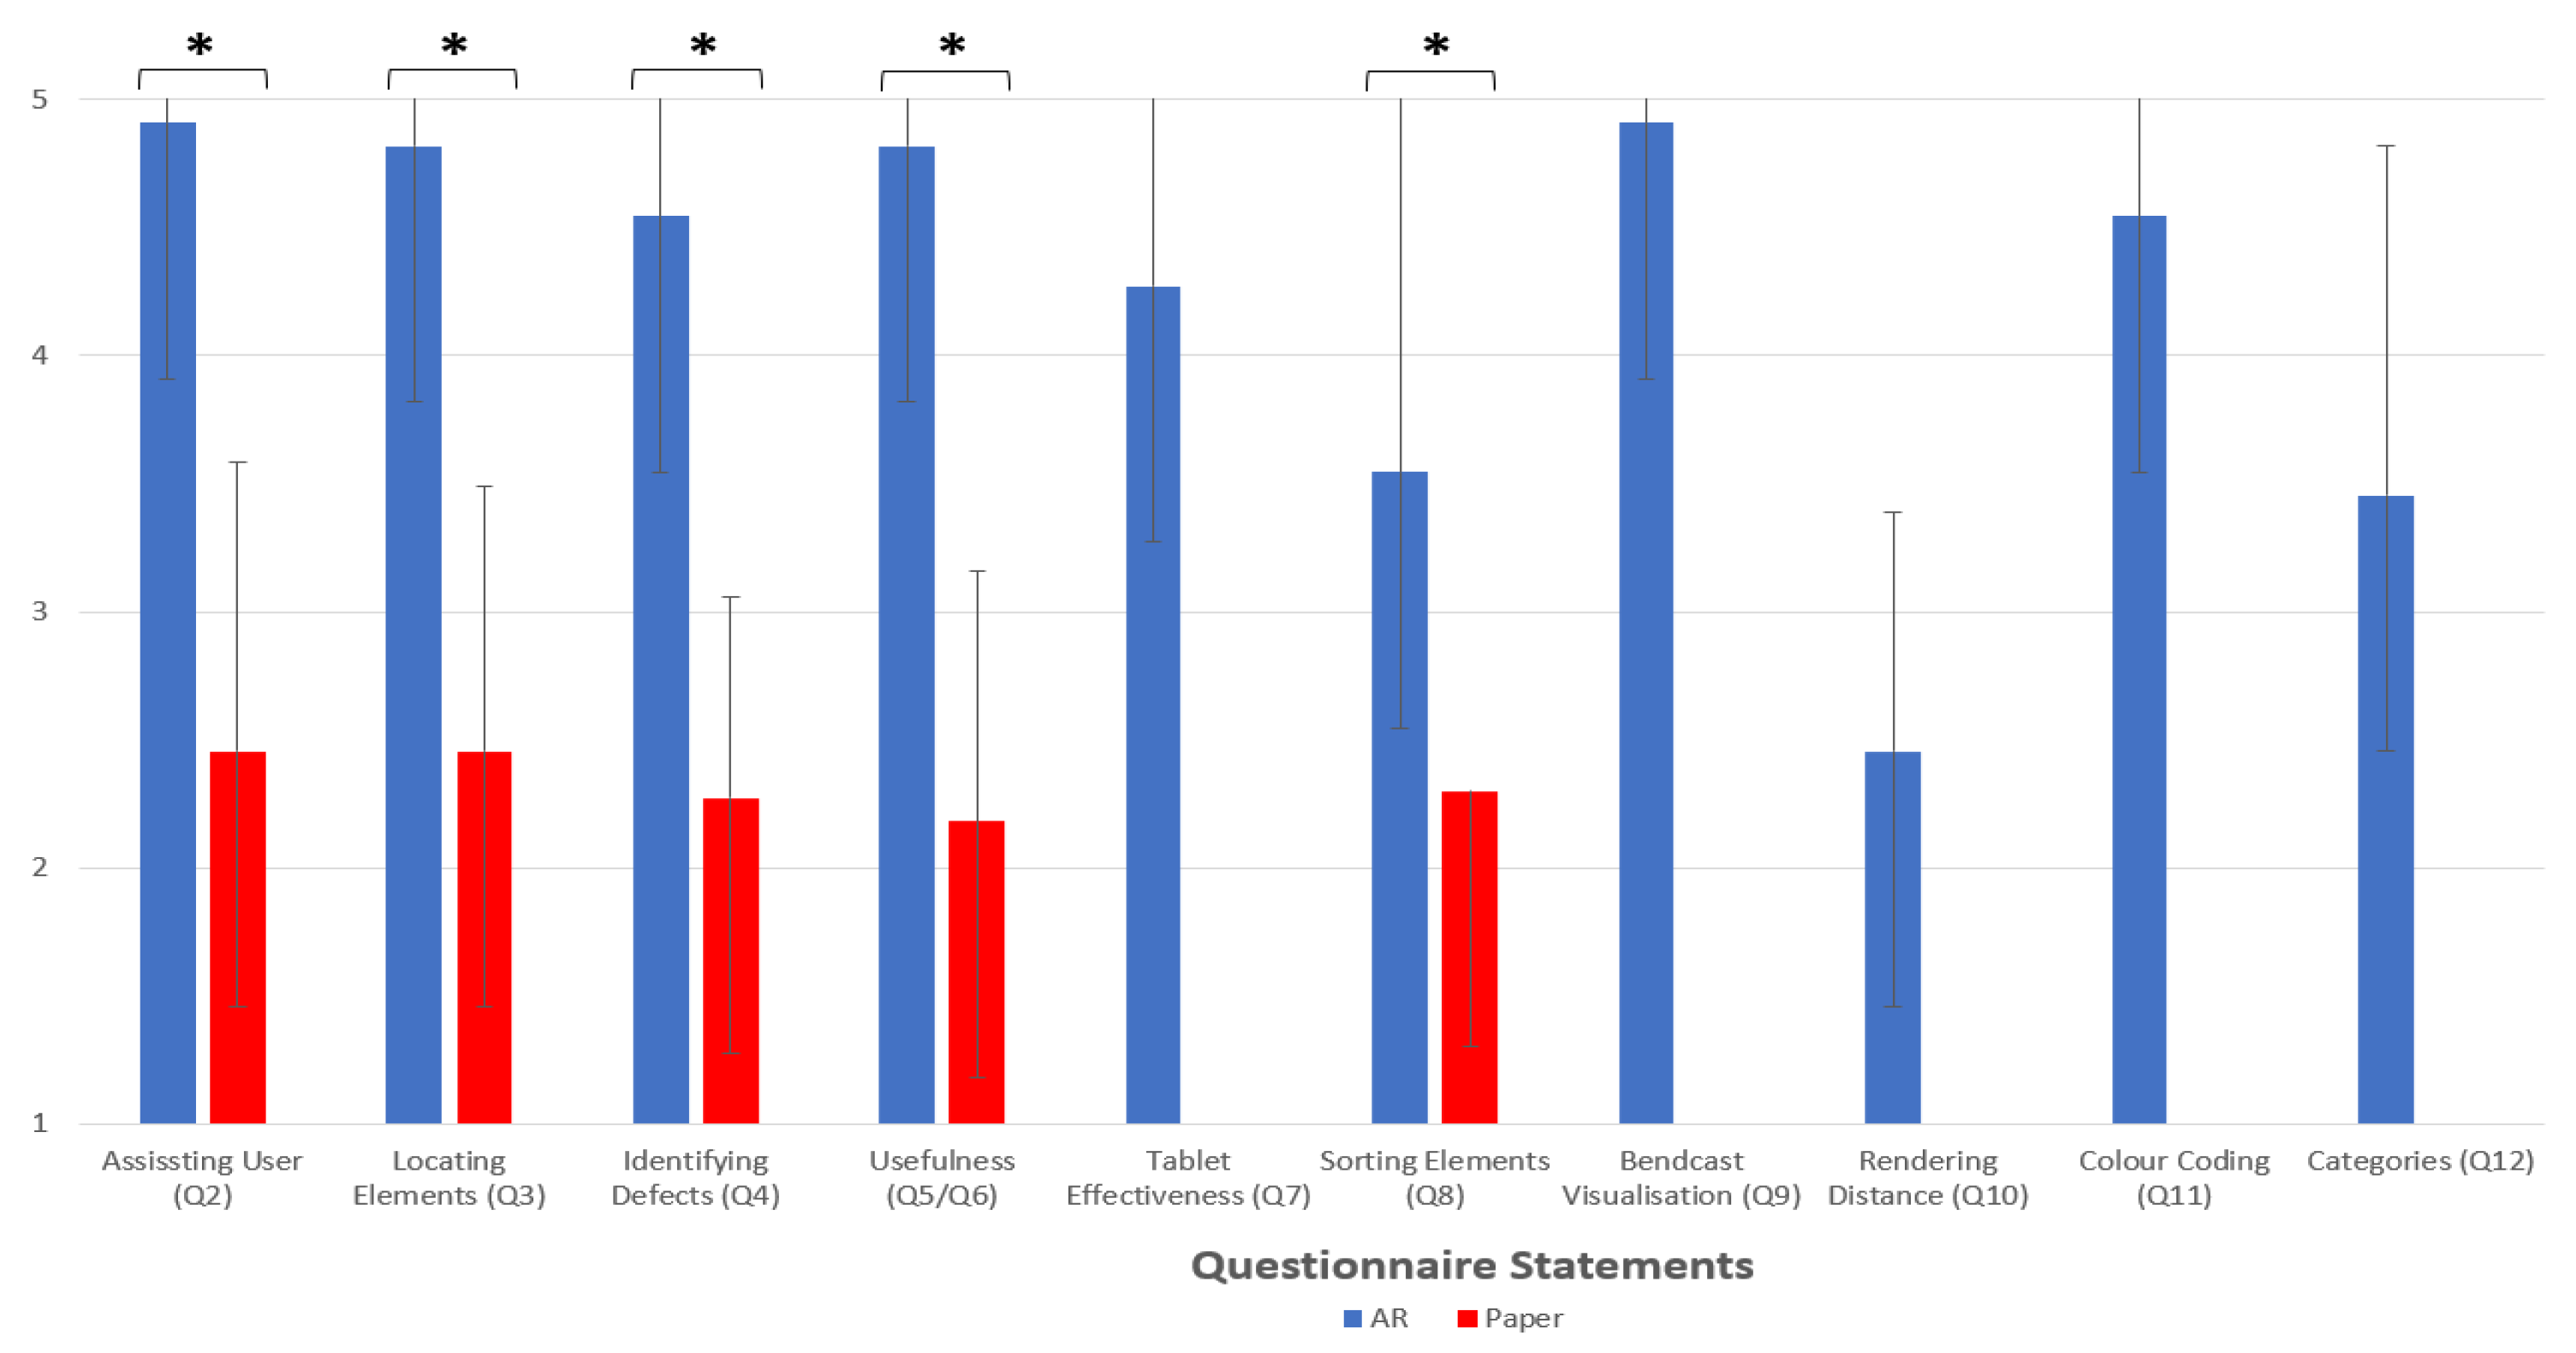
5.2.2. Features and Visualisations

A series of Likert-based (not effective (1) to very effective (5)) questions (Table 3 and Figure 12) were asked to participants to capture their preferred features and visualisations that assisted them with their inspection task performance. For the AR condition, the Bendray (M = 4.909, SD = 0.301) and colour-coding elements (M = 4.545, SD = 0.934) visualisations were ranked among the two most-useful visualisations. Participants also stated the ability to visualise specific elements based on categories (M = 3.454, SD = 1.368) and sort elements (M = 3.545, SD = 1.572) within the checklist (for AR) were effective features. Lastly, the rendering distance visualisation (M = 2.454, SD = 0.934) was ranked as a relatively neutral feature by participants.

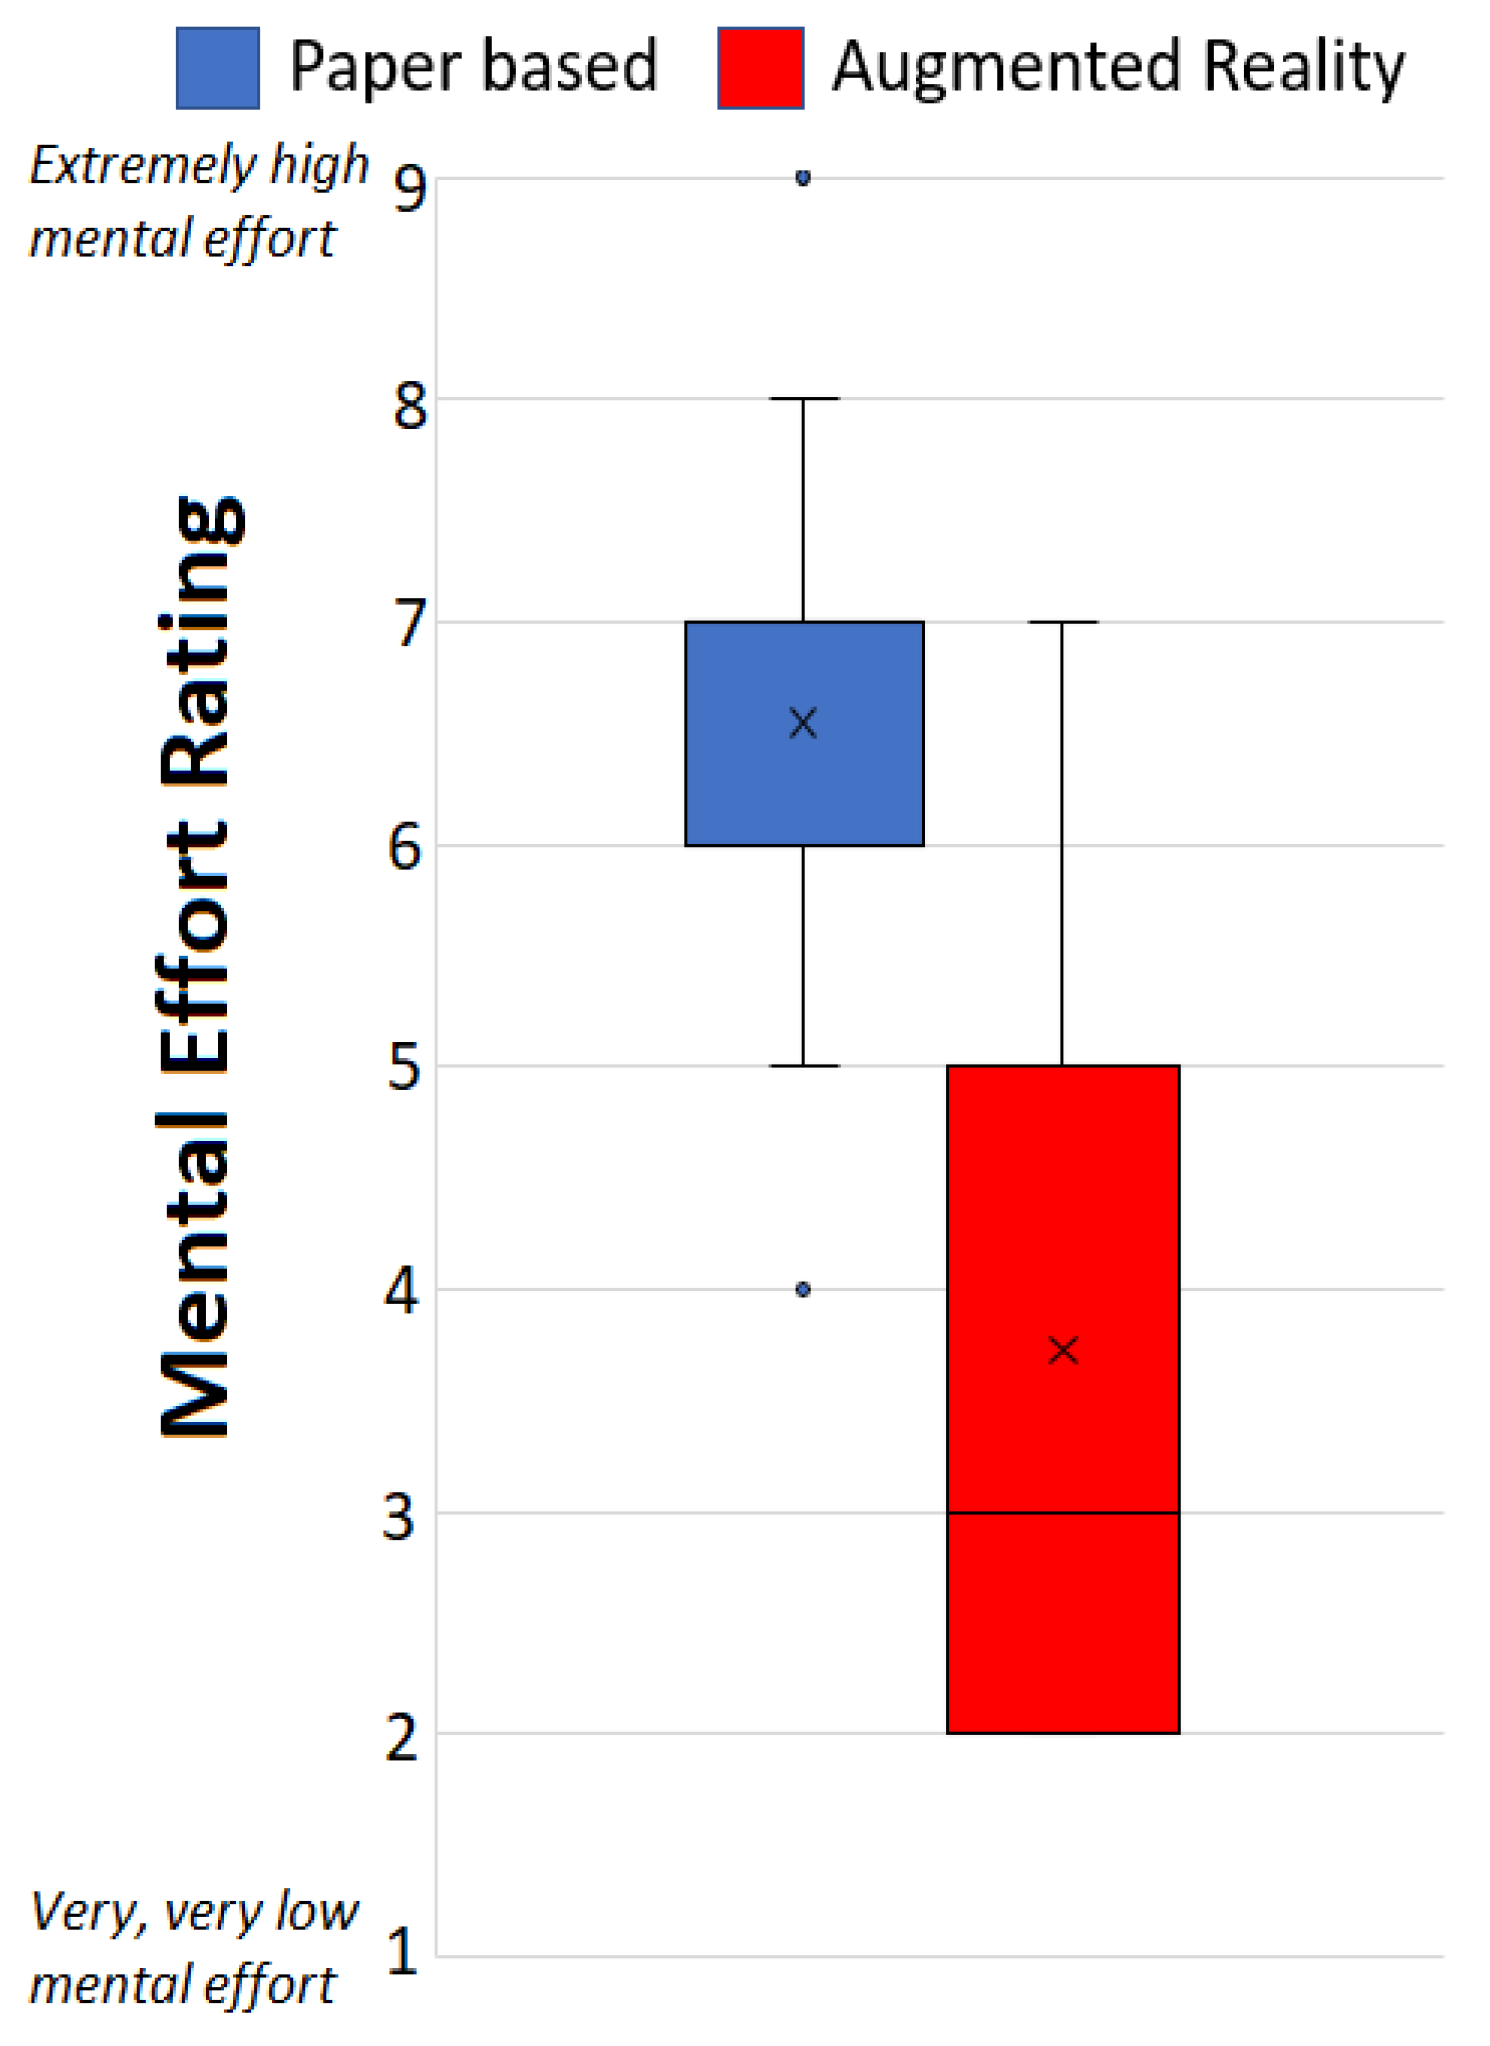
5.2.3. Cognitive Load Scale

The Paas scale was used to measure the cognitive load of participants for conducting on-site inspections for both paper-based and AR conditions. A Wilcoxon Signed rank test revealed participants reported a significantly lower cognitive load (p < 0.01, r = −0.88) was required to complete the task when using the AR-based system (M = 3.72, SD = 1.79) in comparison to the paper-based condition (M = 6.54, SD = 1.36). A graphical comparison of the mental-effort ratings is presented in Figure 13.

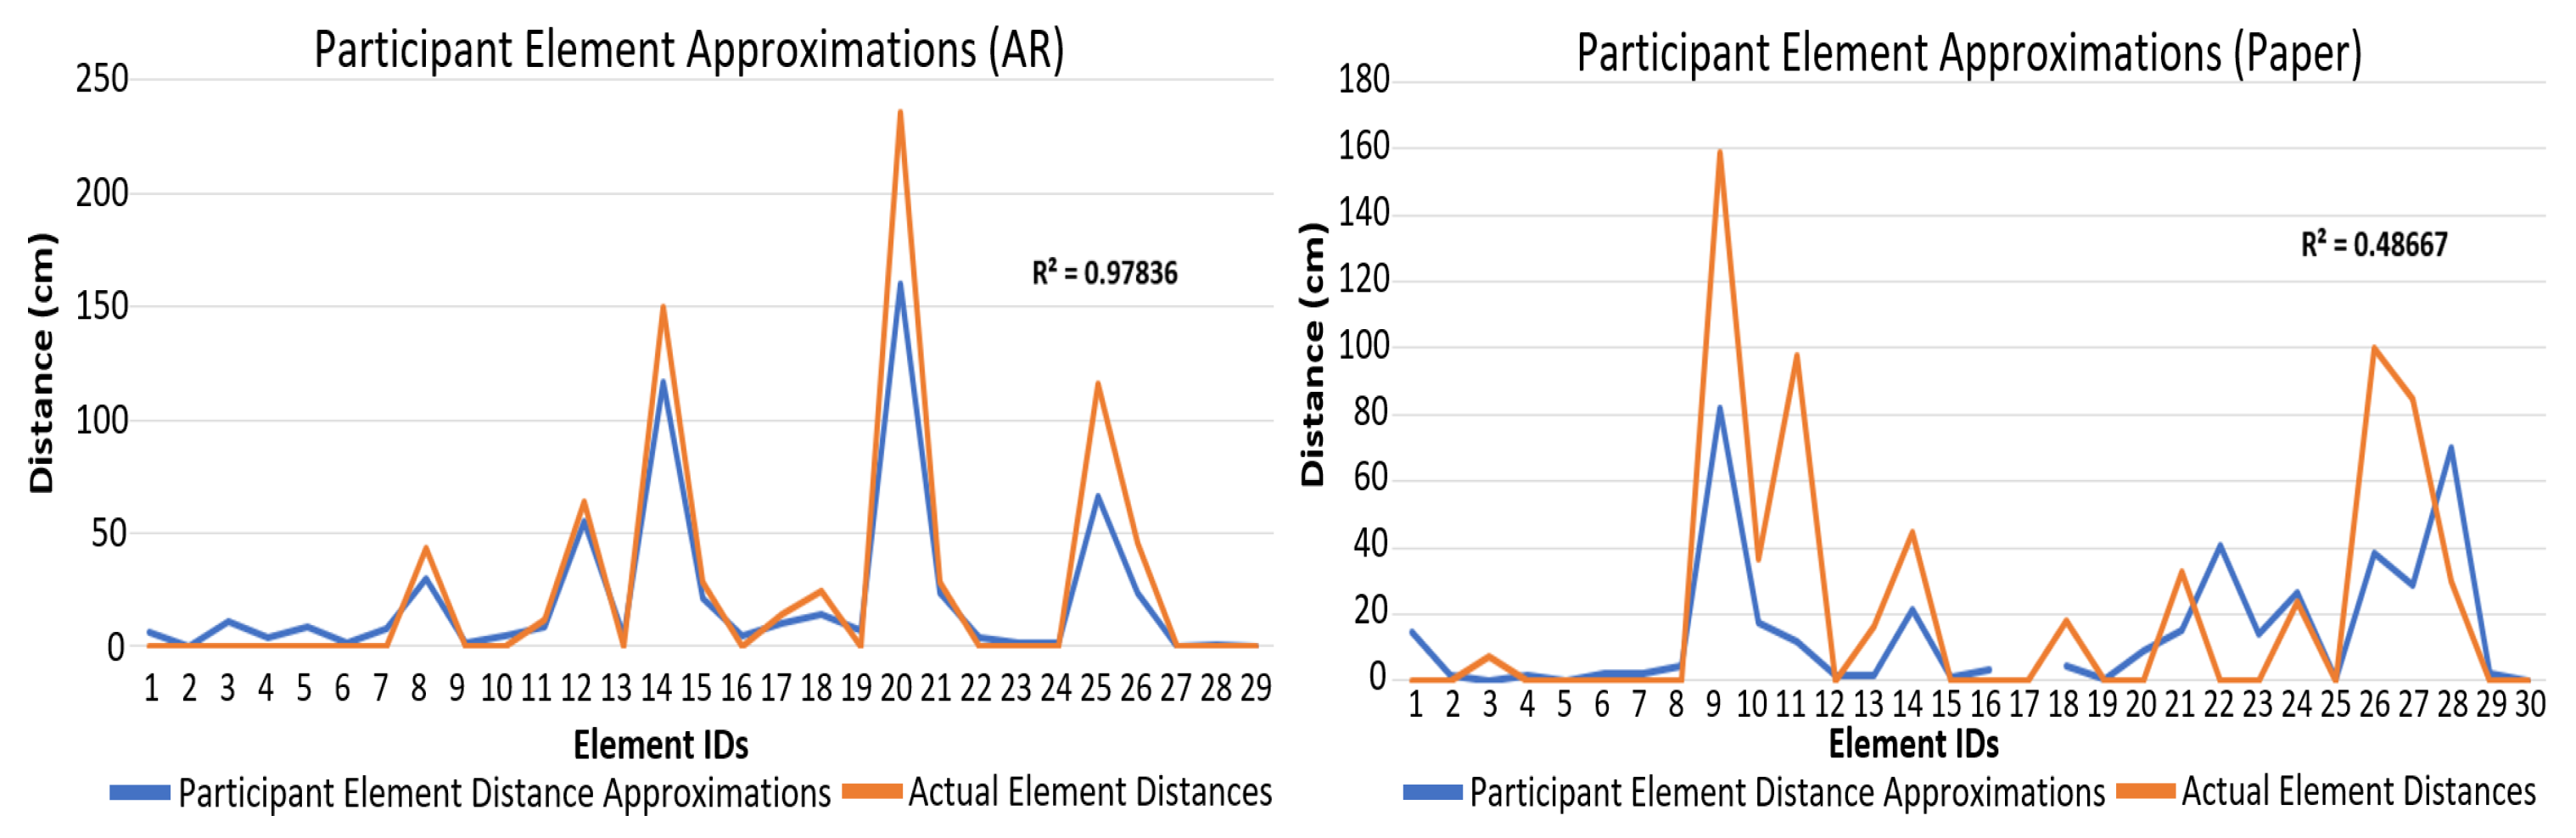
5.2.4. Participant Performance

A paired t-Test determined, on average, that participants completed the inspection task significantly faster (t(10) = −3.06, p = 0.01, r = 0.69) when using the AR-based system (M = 639.6 s, SD = 103.4) in comparison to the paper-based approach (M = 1029.3s, SD = 457).
The overall performance of each participant’s inspection for both conditions was measured by looking at whether the participant was able to correctly identify whether each element was built in the correct (no defect), close (minor defect), or incorrect (major defect) positions. A paired T-Test analysis of the results from the checklist data showed, on average, that participants had a significantly lower error rate (t(10) = −3.05, p = 0.01, r = 0.69) when using the AR-based system (M = 24.7 (82% correct), SD = 2.78) in comparison to the paper-based approach (M = 17.6 (59% correct), SD = 1.9).
A closer examination of participants’ error rates also showed significantly lower error rates for correctly identifying minor defects (t(7) = −10.5, p < 0.01, r = 0.97) using the AR-based system (M = 1.75) in comparison to the paper-based approach (M = 7.75). However, we did not find any significance in error rates for identifying correct (p = 0.49) and major defects (p = 0.1) between AR-based and paper-based conditions.
During the tasks, participants were also asked to input a distance approximation (in centimetres) for how far apart virtual elements that they identified as defects appeared to differ from the corresponding physical-building elements. Results from this data showed a strong correlation (R2 = 0.978) for the participant’s ability to correctly estimate distances of minor and major positional defects when using the AR system. However, results from the paper-based condition revealed that participants performed poorly (R2 = 0.486) when estimating the distances between virtual elements on the architectural paper-based plans with their corresponding physical elements (Figure 14). We were unable to find significance for the mean error distance of the approximations made by participants for correct (p = 0.53) and major defects (p = 0.23) between AR and paper-based approaches. However, we found that participants’ mean error of distance approximations for minor defects were significantly lower (p = 0.02, r = −0.8) when using the AR-based system (M = 22.5 cm, SD = 6.48) in comparison to the paper-based approach (M = 40 cm, SD = 11.16) as illustrated in Table 4.
A further examination into the most commonly misidentified elements by participants using both AR-based and paper-based methods revealed some interesting discrepancies (Table 5). Among the five most commonly misidentified elements by participants whilst using the AR system, four of the elements were correct but were misidentified by participants as minor positional defects. In contrast, the paper-based condition produced the complete opposite results where five of the six most commonly misidentified elements were minor defects but were misidentified by participants as correct elements (i.e., non-defects).

5.2.5. Feedback

Preference: Upon completion of the study, we asked participants to pick which condition was most effective, less likely to make errors, and their overall personal preference. All participants stated the AR condition was more effective in completing the task, and that they were less likely to make mistakes during the task using AR. One participant (9.1%) stated the paper-based condition was their personal preference due to their prior experience conducting construction-site inspections with paper-based plans.
General Feedback: A variety of subjective feedback about the paper-based and AR systems was captured by asking participants what they liked and disliked about each condition. Regarding the paper-based approach, many of the dislikes were about the general difficulty of reading and interpreting plans. When participants were asked what they liked about the paper-based plans, two participants stated that the ability to see the room on the drawings without having to physically walk around it was useful. A full breakdown of participant comments is presented in Table 6.

5.3. Discussion

An exploration into the most-common misidentified elements revealed that, for the AR condition, participants primarily misidentified correct elements as minor defects, whereas, for the paper-based condition, participants most commonly misidentified minor defects as correct elements. We believe the most-likely explanation for participants misidentifying correct elements as minor defects when using the AR system was due to centimetre drifts occurring in the tracking as participants navigated throughout the building. We also noticed that two of the five most commonly misidentified elements for the AR condition were ceiling lights, which were physically placed relatively far apart from the participants. Therefore, due to the physical distance between the participants and virtual lights, we speculate that depth perception most likely contributed to participants misinterpreting correct elements as minor defects. This was also backed up by post-questionnaire comments where one participant stated: “In some cases, the 3D object positions were a bit different in different viewpoints but not much”; another participant stated: “I found it was sometimes difficult for some elements to identify where they should be, especially the lights”; and another participant commented: “Hololens depth can be hard to read”.

6. Conclusions

This article presented the findings of a three-stage research project, which consisted of the identification, development, and evaluation of the BIM-ARDM system for conducting on-site construction inspections. In summary, the research project described in this article achieved the following contributions:
  • Identification and categorization of current uses, potentials uses, and barriers for BIM and AR integration within the construction industry.
  • An improved AR system for identifying construction defects during an on-site construction inspection.
  • A set of novel AR visualisations, and features to improve defect management inspection performance.
  • A Revit plugin to autonomously link data recorded during the construction inspection back to the original BIM model.
  • Data analysis software to evaluate and assess construction inspection performance through eye-tracking, and head-tracking data linked to a four-dimensional visualisation.
The study results showed that the three-dimensional capabilities of the BIM-ARDM system significantly outperformed conventional analogue drawings in terms of the inspection-task performance, the mental workload, the completion time, locating building elements, identifying defects, and assisting the user. Results from the Likert-based questionnaires and qualitative feedback showed participants preferred using the BIM-ARDM system and ranked BIM-ARDM significantly better than conventional approaches.
We believe the current barrier that limits the adoption of our developed BIM-ARDM prototype within the construction industry is the tracking limitations associated with current AR hardware. This will limit the type and scale of defects that can be determined using the BIM-ARDM system. However, tracking is still very much an ongoing research question within the AR research community, and advancements to tracking are continuously developing. Although our BIM-ARDM system is capable of achieving up to 1 cm accuracy, we believe a more-reliable and stable tracking system that could consistently maintain less than a 1 cm accuracy would support the adoption of the BIM-ARDM system within the construction industry.

Author Contributions

Conceptualization, K.W.M., N.G., J.W., R.T.S. and B.H.T.; data curation, K.W.M.; formal analysis, K.W.M. and C.K.; investigation, K.W.M.; methodology, K.W.M.; software, K.W.M.; supervision, N.G., J.W., R.T.S. and B.H.T.; validation, K.W.M.; visualization, K.W.M.; writing—original draft, K.W.M.; writing—review and editing, K.W.M., J.J.O., N.G., J.W., R.T.S. and B.H.T. All authors have read and agreed to the published version of the manuscript.

Funding

This research was funded by he University of South Australia (UniSA) Research Themes Investment Scheme (RTIS) grant (101807).

Institutional Review Board Statement

The studies conducted in this project are approved by the University of South Australia’s Human Research Ethics Protocol (protocol code 203586, 2/5/2021 and protocol code 202527, 8/26/2019).

Informed Consent Statement

Informed consent was obtained from all subjects involved in the studies.

Data Availability Statement

The data presented in this study are available in a non-personally identifiable format on request from the corresponding author.

Acknowledgments

We would like to thank Philippe Naudin from ARM Architecture (https://armarchitecture.com.au/people/philippe-naudin/, accessed on 20 December 2021) for his expertise and assistance during the design of the BIM-ARDM software.

Conflicts of Interest

The authors declare no conflict of interest.

References

  1. Eiris, R.; Gheisari, M.; Esmaeili, B. PARS: Using augmented 360-degree panoramas of reality for construction safety training. Int. J. Environ. Res. Public Health 2018, 15, 2452. [Google Scholar] [CrossRef] [Green Version]
  2. Park, C.S.; Kim, H.J. A framework for construction safety management and visualization system. Autom. Constr. 2013, 33, 95–103. [Google Scholar] [CrossRef]
  3. Albert, A.; Hallowell, M.R.; Kleiner, B.; Chen, A.; Golparvar-Fard, M. Enhancing construction hazard recognition with high-fidelity augmented virtuality. J. Constr. Eng. Manag. 2014, 140, 04014024. [Google Scholar] [CrossRef]
  4. Kim, K.; Kim, H.; Kim, H. Image-based construction hazard avoidance system using augmented reality in wearable device. Autom. Constr. 2017, 83, 390–403. [Google Scholar] [CrossRef]
  5. Carrasco, M.D.O.; Chen, P.H. Application of mixed reality for improving architectural design comprehension effectiveness. Autom. Constr. 2021, 126, 103677. [Google Scholar] [CrossRef]
  6. Ahn, K.; Ko, D.S.; Gim, S.H. A study on the architecture of mixed reality application for architectural design collaboration. In Proceedings of the International Conference on Applied Computing and Information Technology; Springer: Berlin/Heidelberg, Germany, 2018; pp. 48–61. [Google Scholar] [CrossRef]
  7. Walsh, J.A.; Baumeister, J.; Thomas, B.H. Spatial Augmented Reality Visibility and Line-of-Sight Cues for Building Design. In Proceedings of the 27th ACM Symposium on Virtual Reality Software and Technology, Osaka, Japan, 8–10 December 2021; Association for Computing Machinery: New York, NY, USA, 2021. [Google Scholar] [CrossRef]
  8. El Ammari, K.; Hammad, A. Remote interactive collaboration in facilities management using BIM-based mixed reality. Autom. Constr. 2019, 107, 102940. [Google Scholar] [CrossRef]
  9. Ammari, K.E.; Hammad, A. Collaborative BIM-based markerless mixed reality framework for facilities maintenance. In Proceedings of the 2014 International Conference on Computing in Civil and Buidling Engineering, Orlando, FL, USA, 23–25 June 2014; pp. 657–664. [Google Scholar] [CrossRef] [Green Version]
  10. Messadi, T.; Newman, W.E.; Braham, A.; Nutter, D. Immersive learning for sustainable building design and construction practices. J. Civ. Eng. Archit. 2017, 11, 841–852. [Google Scholar] [CrossRef] [Green Version]
  11. Osello, A.; Del Giudice, M.; Guinea, A.M.; Rapetti, N.; Ronzino, A.; Ugliotti, F.; Migliarino, L. Augmented Reality and gamification approach within the DIMMER Project. In Proceedings of the INTED2015 9th International Technology, Education and Development Conference, Madrid, Spain, 2–4 March 2015; pp. 2707–2714. [Google Scholar]
  12. Fukuda, T.; Yokoi, K.; Yabuki, N.; Motamedi, A. An indoor thermal environment design system for renovation using augmented reality. J. Comput. Des. Eng. 2019, 6, 179–188. [Google Scholar] [CrossRef]
  13. May, K.W.; Walsh, J.; Smith, R.T.; Gu, N.; Thomas, B.H. VRGlare: A Virtual Reality Lighting Performance Simulator for real-time Three-Dimensional Glare Simulation and Analysis. In Proceedings of the International Symposium on Automation and Robotics in Construction ISARC, Kitakyushu, Japan, 26–30 October 2020; Volume 37, pp. 32–39. [Google Scholar] [CrossRef]
  14. Ma, Z.; Cai, S.; Mao, N.; Yang, Q.; Feng, J.; Wang, P. Construction quality management based on a collaborative system using BIM and indoor positioning. Autom. Constr. 2018, 92, 35–45. [Google Scholar] [CrossRef]
  15. Shin, D.H.; Dunston, P.S. Identification of application areas for Augmented Reality in industrial construction based on technology suitability. Autom. Constr. 2008, 17, 882–894. [Google Scholar] [CrossRef]
  16. Shin, D.H.; Dunston, P.S. Evaluation of Augmented Reality in steel column inspection. Autom. Constr. 2009, 18, 118–129. [Google Scholar] [CrossRef]
  17. Hart, S.G.; Staveland, L.E. Development of NASA-TLX (Task Load Index): Results of Empirical and Theoretical Research. In Human Mental Workload; Hancock, P.A., Meshkati, N., Eds.; Advances in Psychology; Elsevier: Amsterdam, The Netherlands, 1988; Volume 52, pp. 139–183. [Google Scholar] [CrossRef]
  18. Portalés, C.; Casas, S.; Gimeno, J.; Fernández, M.; Poza, M. From the paper to the tablet: On the design of an AR-based tool for the inspection of pre-fab buildings. Preliminary results of the SIRAE project. Sensors 2018, 18, 1262. [Google Scholar] [CrossRef] [Green Version]
  19. García-Pereira, I.; Portalés, C.; Gimeno, J.; Casas, S. A collaborative augmented reality annotation tool for the inspection of prefabricated buildings. Multimed. Tools Appl. 2019, 79, 6483–6501. [Google Scholar] [CrossRef]
  20. Brooke, J. “SUS-A Quick and Dirty Usability Scale”. Usability Evaluation in Industry; CRC Press: Boca Raton, FL, USA, 1996; ISBN 9780748404605. [Google Scholar]
  21. FENG, C.W.; CHEN, C.W. Using BIM and MR to Improve the Process of Job Site Construction and Inspection. Wit Trans. Built Environ. 2019, 192, 21–32. [Google Scholar] [CrossRef]
  22. Park, C.S.; Lee, D.Y.; Kwon, O.S.; Wang, X. A framework for proactive construction defect management using BIM, augmented reality and ontology-based data collection template. Autom. Constr. 2013, 33, 61–71. [Google Scholar] [CrossRef]
  23. Kwon, O.S.; Park, C.S.; Lim, C.R. A defect management system for reinforced concrete work utilizing BIM, image-matching and augmented reality. Autom. Constr. 2014, 46, 74–81. [Google Scholar] [CrossRef]
  24. Zhou, Y.; Luo, H.; Yang, Y. Implementation of augmented reality for segment displacement inspection during tunneling construction. Autom. Constr. 2017, 82, 112–121. [Google Scholar] [CrossRef]
  25. Hernández, J.L.; Martín Lerones, P.; Bonsma, P.; Van Delft, A.; Deighton, R.; Braun, J.D. An IFC interoperability framework for self-inspection process in buildings. Buildings 2018, 8, 32. [Google Scholar] [CrossRef] [Green Version]
  26. Available online: https://technical.buildingsmart.org/standards/ifc/ (accessed on 20 December 2021).
  27. Available online: https://www.tridify.com/ (accessed on 20 December 2021).
  28. Available online: https://github.com/helpsterTee/Unity-IFCEngine (accessed on 20 December 2021).
  29. Available online: https://www.pixyz-software.com/ (accessed on 20 December 2021).
  30. Marchand, E.; Uchiyama, H.; Spindler, F. Pose estimation for augmented reality: A hands-on survey. IEEE Trans. Vis. Comput. Graph. 2015, 22, 2633–2651. [Google Scholar] [CrossRef] [Green Version]
  31. Wagner, D.; Langlotz, T.; Schmalstieg, D. Robust and unobtrusive marker tracking on mobile phones. In Proceedings of the 2008 7th IEEE/ACM International Symposium on Mixed and Augmented Reality, Washington, DC, USA, 15–18 September 2008; pp. 121–124. [Google Scholar] [CrossRef]
  32. Comport, A.I.; Marchand, E.; Pressigout, M.; Chaumette, F. Real-time markerless tracking for augmented reality: The virtual visual servoing framework. IEEE Trans. Vis. Comput. Graph. 2006, 12, 615–628. [Google Scholar] [CrossRef] [Green Version]
  33. Simon, G.; Fitzgibbon, A.W.; Zisserman, A. Markerless tracking using planar structures in the scene. In Proceedings of theIEEE and ACM International Symposium on Augmented Reality (ISAR 2000), Munich, Germany, 5–6 October 2000; pp. 120–128. [Google Scholar] [CrossRef] [Green Version]
  34. Xiao, C.; Lifeng, Z. Implementation of mobile augmented reality based on Vuforia and Rawajali. In Proceedings of the 2014 IEEE 5th International Conference on Software Engineering and Service Science, Beijing, China, 27–29 June 2014; pp. 912–915. [Google Scholar] [CrossRef]
  35. Kato, H.; Billinghurst, M. Marker tracking and hmd calibration for a video-based augmented reality conferencing system. In Proceedings of the 2nd IEEE and ACM International Workshop on Augmented Reality (IWAR’99), San Francisco, CA, USA, 20–21 October 1999; pp. 85–94. [Google Scholar] [CrossRef] [Green Version]
  36. Kopsida, M.; Brilakis, I. BIM Registration Methods for Mobile Augmented Reality-Based Inspection. In Proceedings of the 11th European Conference on Product and Process Modelling eWork and eBusiness in Architecture, Engineering and Construction, (ECPPM 2016), Limassol, Cyprus, 7–9 September 2016; Christodoulou, S., Scherer, R., Eds.; CRC Press: Boca Raton, FL, USA, 2016. [Google Scholar] [CrossRef]
  37. Hübner, P.; Clintworth, K.; Liu, Q.; Weinmann, M.; Wursthorn, S. Evaluation of HoloLens Tracking and Depth Sensing for Indoor Mapping Applications. Sensors 2020, 20, 1021. [Google Scholar] [CrossRef] [Green Version]
  38. Krippendorff, K. Content Analysis: An Introduction to Its Methodology, 2nd ed.; Sage Publications: Thousand Oaks, CA, USA, 2004. [Google Scholar]
  39. Rankohi, S.; Waugh, L. Review and analysis of augmented reality literature for construction industry. Vis. Eng. 2013, 1, 1–18. [Google Scholar] [CrossRef] [Green Version]
  40. Ahmed, S. A review on using opportunities of augmented reality and virtual reality in construction project management. Organ. Technol. Manag. Constr. Int. J. 2018, 10, 1839–1852. [Google Scholar] [CrossRef] [Green Version]
  41. Alizadehsalehi, S.; Hadavi, A.; Huang, J.C. From BIM to extended reality in AEC industry. Autom. Constr. 2020, 116, 103254. [Google Scholar] [CrossRef]
  42. Hakkarainen, M.; Woodward, C.; Rainio, K. Software architecture for mobile mixed reality and 4D BIM interaction. In Proceedings of the CIB-W78 25th International Conference on Information Technology in Construction, Santiago, Chile, 15–17 July 2008; Rischmoller, L., Ed.; Universidad de Talca: Talca, Chile, 2009; pp. 1–8. [Google Scholar]
  43. Gheisari, M.; Goodman, S.; Schmidt, J.; Williams, G.; Irizarry, J. Exploring BIM and mobile augmented reality use in facilities management. In Proceedings of the 2014 Construction Research Congress: Construction in a Global Network, Atlanta, GA, USA, 19–21 May 2014; Castro-Lacouture, D., Irizarry, J., Ashuri, B., Eds.; American Society of Civil Engineers: Reston, VA, USA, 2014; pp. 1941–1950. [Google Scholar] [CrossRef]
  44. May, K.; Hanan, I.; Cunningham, A.; Thomas, B. 3DUITK: An Opensource Toolkit for Thirty Years of Three-Dimensional Interaction Research. In Proceedings of the 2019 IEEE International Symposium on Mixed and Augmented Reality Adjunct (ISMAR-Adjunct), Beijing, China, 10–18 October 2019; pp. 175–180. [Google Scholar] [CrossRef]
  45. Riege, K.; Holtkamper, T.; Wesche, G.; Frohlich, B. The bent pick ray: An extended pointing technique for multi-user interaction. In Proceedings of the IEEE Symposium on 3D User Interfaces (3DUI), Alexandria, VA, USA, 25–26 March 2006; pp. 62–65. [Google Scholar] [CrossRef] [Green Version]
  46. Paas, F. Training Strategies for Attaining Transfer of Problem-Solving Skill in Statistics: A Cognitive-Load Approach. J. Educ. Psychol. 1992, 84, 429–434. [Google Scholar] [CrossRef]
Figure 1. The growth of BIM and BIM + AR based on the yearly Google Scholar article mentions (patents and citations excluded). The following query terms were used: BIM—(“Building Information Modeling” OR "Building Information Modelling”), BIM + AR—(“Building Information Modeling” OR “Building Information Modelling”), AND (“Augmented Reality” OR “AR” OR “Mixed Reality”).
Buildings 12 00140 g001
Figure 2. This figure shows a third-person perspective of the BIM-ARDM system. The BIM model is superimposed over the physical site at a one-to-one mapping. A colour-coded visualisation represents correct (green), minor (yellow), and major (red) defects.
Buildings 12 00140 g002
Figure 3. These diagrams present the system architecture of the BIM-ARDM system. The UML diagram (A) presents an overview of the primary components integrated into the AR application. The sequence diagram (B) demonstrates how the main components within BIM-ARDM interact.
Buildings 12 00140 g003
Figure 4. The left image (A) presents the UI design for the visualisations tab; image (B) displays the UI design for the checklist tab where a dynamic checklist of each element within the BIM model was generated; image (C) presents the UI design for the diagnostics tab.
Buildings 12 00140 g004
Figure 5. This figure demonstrates the categorizing elements’ visualisation, which only displays specific elements in the AR view (B) that have been enabled by the inspector on the tablet UI (A).
Buildings 12 00140 g005
Figure 6. This figure demonstrates the rendering-distance visualisation, which mitigates the amount of elements visible by controlling the camera-rendering distance.
Buildings 12 00140 g006
Figure 7. This figure shows the Bendray visualisation, which acts as a visual guidance to direct users to specific elements. In this example, the inspector selected a lighting switch in the tablet-based UI.
Buildings 12 00140 g007
Figure 8. This figure demonstrates the checklist FOV renderer, which only displays elements in the checklist UI (A) that the inspector is currently looking at in the AR view (B). In this example, the inspector is looking at the stair rails, which appear in the tablet-based checklist UI.
Buildings 12 00140 g008
Figure 9. This diagram shows the basic calibration setup. The left image (A) shows the BIM model of the real-world building. Image (B) shows the BIM model superimposed onto the virtual point cloud. Image (C) shows the physical marker placed at the corresponding position of the virtual marker within the real-world environment.
Buildings 12 00140 g009
Figure 10. This figure showcases how checklist data were linked back to the original Revit model after running our developed Revit plugin. Image (A) shows images captured of elements that are stored as raster images in the given elements “Image” parameter. Image (B) shows additional data associated with checklist data that are stored in the elements “Comments” parameter.
Buildings 12 00140 g010
Figure 11. This figure showcases the developed 4D Playback Analysis Tool. Image (A) presents a playback of the inspector from a first-person perspective and Image (B) from a third-person perspective. The user can adjust the timestamp of the system, and it will display the exact position of where the user was in the real world at that time and where the user was looking. A heatmap is dynamically produced to keep track of where the user has and has not looked.
Buildings 12 00140 g011
Figure 12. Questionnaire Results for each condition visualised in a bar chart with standard deviation (*: statistically significant).
Buildings 12 00140 g012
Figure 13. Paas mental effort for paper-based and AR-based conditions. (Box and whiskers plot.)
Buildings 12 00140 g013
Figure 14. Participant approximations of the distances between virtual and physical elements.
Buildings 12 00140 g014
Table 1. This table shows the experience and roles of the workshop participants.
ParticipantRoleConstruction-Industry Experience
(1)General Builder and Director33 Years
(2)BIM Manager33 Years
(3)BIM Manager10 Years
(4)Project Administrator4 Years
Table 2. This table shows the modern AR HMDs commercialized over the last decade and the retail prices associated with the devices. ( Discontinued, planned, and § rumoured).
AR HeadsetYearPrice (USD)
Meta 1 2014750
Meta 2 2016494
HoloLens 1 20163000
Magic Leap 1 20182295
HoloLens 220193500
Magic Leap 2 20212295
Apple AR Headset §20223000
Table 3. Questionnaire results for each condition (paper = paper-based condition; AR = augmented-reality condition). A Wilcoxon Signed rank test was used to determine the significance for each Likert-based question (Blue shading represents AR condition, red represents paper-based condition).
#StatementsCondMeanSDp
Q1Based on the mental effort scale, please
rank the cognitive-load of the task.
Buildings 12 00140 i001Paper
AR
6.545
3.727
1.368
1.793
0.003
Shared-Condition Statements
Q2I found this system was useful in assisting
me to complete the inspection task.
Buildings 12 00140 i002Paper
AR
2.454
4.909
1.128
0.301
0.003
Q3I found this system was useful for locating
building elements in the building.
Buildings 12 00140 i002Paper
AR
2.454
4.818
1.035
0.404
0.003
Q4I found this system was useful to identify
construction defects.
Buildings 12 00140 i002Paper
AR
2.272
4.545
0.786
0.522
0.003
Condition-Specific Statements
Q5

Q6
I found the paper-based architectural plans
were useful in assisting me to complete the task.
I found the visualisations were useful in assisting
me to complete the task.
Buildings 12 00140 i002Paper

AR
2.181

4.818
0.981

0.404
0.003
Q7I found the tablet user-interface effective for inputting
data into a checklist and controlling the visualisations.
Buildings 12 00140 i002AR4.2721.009nil
Visualisations and Features Questions
Q8Sorting elements in the checklist. Buildings 12 00140 i003Paper
AR
2.3
3.545
1.337
1.572
0.01
Q9Bendray visualisation. Buildings 12 00140 i003AR4.9090.301nil
Q10Rendering-distance visualisation. Buildings 12 00140 i003AR2.4540.934nil
Q11Colour-coding visualisation. Buildings 12 00140 i003AR4.5450.934nil
Q12Visualising elements based on categories. Buildings 12 00140 i003AR3.4541.368nil
Post-Questions
Q13Please tick the condition you found MOST effective
for completing the inspection task.
Buildings 12 00140 i004 Buildings 12 00140 i005
Q14Please tick the condition that was your personal
preference.
Buildings 12 00140 i004 Buildings 12 00140 i006
Q15Please tick the condition you felt you were less likely
to make mistakes/errors with.
Buildings 12 00140 i004 Buildings 12 00140 i005
Table 4. Summary of common errors made by participants using AR and paper-based conditions.
CondCorrectMinorMajor
Mean Error RateMean Error DistMean Error RateMean Error DistMean Error RateMean Error Dist
AR2.333.86 cm1.7522.5 cm0.541.8 cm
Paper25.47 cm7.7540 cm6.7570.3 cm
p-val0.49
Paired T-Test
0.53
Wilcoxon Signed
Rank Test
<0.001
Paired T-Test
0.02
Wilcoxon Signed
Rank Test
0.1
Wilcoxon Signed
Rank Test
0.23
Paired T-Test
Table 5. This table presents a comparison of the most-common errors made during the inspection when using the paper-based and AR condition.
Augmented Reality
Element ID: NameIncorrect PercentageParticipant AnswersCorrect Answer
1: basic wall6 (54.5%)major (1 m) × 2, major (30 cm), major (10 cm, correct, major (rot 45)minor defect (rot)
4:stair springer5 (45.4%)minor 15cm × 2, minor (bit to the left), minor 20 cm, incorrect 60 cmcorrect (0 cm)
20: light 377825 (45.4%)minor 5 cm, minor 30 cm, minor 10c m, minor 15 cm, minor 7 cmcorrect (0 cm)
23:light 3777314 (36.3%)minor 5 cm × 2, minor 10 cm × 2correct (0 cm)
8:railing4 (36.3%)minor 7 cm, minor 10 cm, major 60 cmcorrect (0 cm)
paper-based
3: switch 36154810 (90.9%)correct × 10minor (7.5 cm)
14: basic wall9 (81.8%)correct × 5, major × 4minor (44.3 cm)
27: exit sign 29 (81.8%)correct × 4, minor (30 cm) × 2, minor (20 cm)major (85 cm)
28: fire sign8 (72.7%)major 2 m, major 1m × 2, major 3 m, correct × 3minor (30 cm)
18: light sign8 (72.7%)correct × 8minor (18.2 cm)
13: switch 3615088 (72.7%)correct × 8minor (16.4 cm)
Table 6. This table provides a summary of the subjective open-ended short-answer comments made by participants after completing both conditions.
StatementsSummary of Comments (AR)Summary of Comments (Paper)
What do you
like and/or dis-like about the...
(AR Cond)
tablet-based
user-interface?
(Paper Cond)
paper-based
architectural
plans?
Dislikes
-
Too much colour on the UI (×2),
-
Elements disappearing when looking down to the tablet when using the Rendered within FOV function. (×3),
-
Sorting checklist changing the element positions (×1).
Likes
-
Ease of use (×8),
-
Bendray to identify elements (×2),
-
Colour-coded visualisation (×2),
-
Rendered within FOV (×1),
-
Categories visualisation to filter elements (×1),
-
Controlling visualisations with the user-interface (×2)
Dislikes
-
Ability to detect small differences (×3)
-
Readability of paper plans (×7)
-
Annoyance reading plans (×1)
-
Annoyance of carrying tablet and paper-based plans (×1)
-
Increased mental effort (×1)
Likes
-
The ability to see the room without having to walk around it. (×2)
What did you
like about this
system?
-
Ease of use (×6), - Locating elements within Bendray (×7),
-
Colour-coded visualisation (×2),
-
Categories visualisation to filter elements (×1),
-
Sort functionality (×2),
-
Rendered within FOV function (×1),
-
Sorted by completion & alphabetical order (×1),
-
Inputting data into checklist (×1),
-
Improved spatial awareness (×1),
-
Use of tablet to control Hololens visualisations (×1)
-
Does not cause any motion sickness (×1)
-
Inputting data into the tablet checklist user-interface (×5)
-
Simple to use (×4)
What did you
NOT like
about this
system?
-
Bendray coming out of eye (×2),
-
Mild motion sickness (×1)
-
Rendered within FOV function not keeping items on top. (×2),
-
Holographic objects appearing to change based on the users position (depth perception) (×1),
-
Difficult identifying where some elements should be (×1),
-
Superimposing virtual objects on physical objects looks strange. (×1)
-
Interpretability of plans and ability to identify defects. (×7)
-
Lack of spatial awareness understanding. (×1)
-
Fatigue from holding the tablet for long period of time (×1)
Publisher’s Note: MDPI stays neutral with regard to jurisdictional claims in published maps and institutional affiliations.

