Article

Wind-Induced Interference Effect of Chamfered Square Cylinders in Tandem and Side-by-Side Arrangements

1
School of Hydraulic and Electric Power, Heilongjiang University, Harbin 150080, China
2
School of Civil Engineering, Heilongjiang University, Harbin 150080, China
*
Author to whom correspondence should be addressed.
Buildings 2022, 12(12), 2125; https://doi.org/10.3390/buildings12122125
Submission received: 18 September 2022 / Revised: 23 November 2022 / Accepted: 25 November 2022 / Published: 3 December 2022

Abstract

:
A large-eddy simulation analysis technique is introduced in this paper to determine the interference effect of chamfered square cylinders, which is crucial to predict the impact of wind pressure and load on chamfered high-rise buildings. Based on the grid convergence analysis of the model and the validation of its accuracy, the aerodynamic interference effect, including the flow field distribution of parallel and tandem square cylinders with different spacing ratios has been compared and analyzed. The influence regulation and formation mechanism of the wind pressure interference effect have been explored. For side-by-side chamfered corners square cylinders, the average drag coefficient mainly shows an amplification effect, and the fluctuating lift coefficient mainly shows a reduction effect. When B/L = 1.5, the interference factor of the disturbed square cylinder reaches a maximum, which is located at the back flow field on the adjacent side. There is a clear critical spacing ratio for tandem double-cut square cylinders. When the spacing ratio exceeds the critical value, significant changes are observed in the aerodynamic performance. These include wind pressure distribution, non-Gaussian characteristics, and the interference effects of structures.

1. Introduction

The interference effect has been one of the most important issues for aerodynamic studies of chamfered square cylinders. Under unfavorable high Reynolds number wind conditions, different arrangements and combinations cause dramatic changes in the wind pressure distribution on the building surface. For instance, the damage to the England bridge thermal power plant in 1965 [1] and the detachment of the building envelopes of the Hancock Building in the United States [2] were both caused by a disturbance in the wind field from surrounding buildings. Consequently, frequent interference with wind conditions may affect the safety of the retaining system and can even lead to the overall collapse of the structure.
The wind tunnel test showed the aerodynamic interference effect and the flow field distribution of parallel and tandem square cylinders with different spacing ratios. Early research involving wind load was mainly based on a single building [3,4,5,6,7,8,9,10,11,12], and was gradually extended to the research on the interference effect between multiple buildings. Due to the low testing costs, simple technology and flexible design, the wind tunnel test effectively promotes research on the interference effect between buildings. Gu et al. [13] studied the wind pressure interference effect of buildings under different arrangements. The results of the study showed that the amplification effect of parallel arrangement is significant. Mara et al. [14] summarized the aerodynamic interference effects of two high-rise buildings in different spatial positions based on the high-frequency force balance wind tunnel test. The study was accompanied by the building disturbance envelope and disturbance factor regular curve results. Long et al. [15] studied the influence of the flow around the top of a square high-rise building on the disturbed building passing the wind tunnel test. The results show that the flow around the top increases the average pressure coefficient of the windward side of the disturbed building by 46% and causes a small vortex-induced resonance response of the disturbed building when the distance is small. Wind tunnel tests have problems such as boundary effects and bracket interference, which often need to be studied in combination with numerical simulations.
Investigating the influence regulation and formation mechanism of the wind pressure interference effect is another important aspect of studying the interference effect on high-rise buildings with cut corners. Lo et al. [16] analyzed the influence of speed on the interference effect by using a wind tunnel test combined with a numerical simulation system of CFD (Computational Fluid Dynamics), and analyzed the interference effect between two square buildings when the disturbing building was either located upstream or located downstream. Yu et al. [17,18] and Kim et al. [19] systematically compared the torsional interference effect and acceleration interference effect between two high-rise buildings with different heights. The results revealed that the foundation bending moment of the disturbed building had the most significant effect. Kataoka et al. [20] used numerical simulation of CFD to compare the wind-induced vibration obtained by two methods and discussed the position along which the motion-induced aerodynamic force acted along its axis. Hui et al. [21,22] investigated the interference effect between a square building and a rectangular building. The average and pulsating torque of the square building could reach 3 times and 1.6 times that of the single-body state. The minimum extreme pressure at the corner of the building was found to be 40% higher than that of a single square cylinder. Yan et al. [23] employed the numerical simulation on the CFD method to study the wind load, wind-induced vibration, and aerodynamic interference effect between high-rise twin towers in the city center. As a result, an analytical framework for wind effect and comfort evaluation of high-rise buildings based on a stiffness mapping algorithm was proposed.
The above studies were mostly focused on the aerodynamic characteristics as well as the wind loads of square cylinders. However, fewer studies on wind-induced vibration were carried out. In fact, when the cylinder had a flexible or an elastic support, Vortex-included vibration (VIV) was stimulated under the complex interaction between the shedding vortex and the elastic structure [24]. VIV was also a hot topic for square cylinder wind-induced vibration. Flexible structures immersed in flowing fluids might exhibit vortex-induced vibrations, and nonlinear energy sinks were used by Zhang et al. [25,26] to deal with multimode coupled VIV. This could determine the dimensionless parameters that dominate the VIV response, as well as understand and model the complicated fluid-structure interaction phenomenon.
Considering the interference effect between square and rectangular buildings, scholars have achieved certain research results, but less consideration has been given to buildings with chamfered sections. In practical projects, buildings with chamfered sections are not uncommon. Literature reveals that chamfering can greatly improve the aerodynamic performance of the structure [27,28]. Hayashida et al. [29] proposed that rounded corners can effectively reduce the cross-wind aerodynamic spectrum of square-section high-rise buildings. The wind characteristics and response characteristics of buildings with chamfered and open square faces were studied in slight of wind tests by Miyashita et al. [30]. The study proposed that when the chamfered ratio is 10%, which refers to the removal of 10% of the length of both sides of the corner, the wind-induced displacement response of the building in the cross-wind and down-wind directions can be reduced by about 35% [31,32]. The number, shape, and size of the separation vortices around the chamfered buildings change significantly, which further leads to differences in the aerodynamic interference effects and wind pressure interference effects between buildings [33,34,35]. Although the above discussion has investigated the effects of wind load, wind-induced vibration, and aerodynamic interference on square buildings, there are still some deficiencies in the interference between cut-angle buildings and irregular buildings.
The object of this study is to adopt the large eddy simulation method to analyze the grid convergence and to verify the simulation method for the three-dimensional square cylinder under the uniform flow field. Additionally, based on the aerodynamic coefficients and wind pressure distribution characteristics, the relationship between the aerodynamic disturbance and the spacing ratio of the tangential square cylinders under parallel and tandem has been given. The reason for the aerodynamic disturbance regulation has been explained by analyzing the flow field. The characteristics of aerodynamic coefficients and the distribution of interference factors to parallel double-cut square cylinders with different spacing have been analyzed, and the position and value of the maximum interference have been clarified. The generation mechanism of interference effect on chamfered square cylinders with different permutations and combinations has also been examined. The influences on aerodynamic coefficients and wind pressure distribution characteristics as well as the distribution of interference factors in terms of contribution of the spacing ratio have been investigated.

2. Large Eddy Simulation and Data Processing Methods

2.1. Large Eddy Simulation

Large-eddy simulation (LES) has become a powerful tool for the assessment of wind pressures and loads on buildings and other structures. The physical properties of the fluid are regarded as viscous and incompressible according to the results of structural wind load studies. Assuming that the filtering process and the derivation process are interchangeable, an equation of motion (N-S equation) describing the momentum conservation of a viscous incompressible fluid is filtered [12]. The governing equations for the large eddy simulation are obtained as follows.
u ¯ i x i = 0
u ¯ i t + x j ( u ¯ i u ¯ j ) = 1 ρ p ¯ x i + ν 2 u ¯ i x j x j τ i j x j
τ i j = u ¯ i u ¯ j u i u j ¯
where, ρ is the air density; t is the time; ν is the air kinematic viscosity coefficient; p ¯ is the filtered pressure;  u ¯ i , u ¯ j indicates the filtered speed;  x i , x j is the spatial coordinate component;  τ i j is subgrid-scale stress. In order to implement large eddy simulations, a closed format for sublattice stresses must be constructed. This paper adopts the dynamic Smagorinsky sublattice model [36]:
τ i j 1 3 δ i j τ k k = 2 C Δ 2 | S ¯ | S ¯ i j
S ¯ i j = ( u ¯ i / x j + u ¯ j / x i ) / 2
| S ¯ | = 2 S ij ¯ S ij ¯
In the formula, S ¯ i j and | S ¯ | are calculated according to Equations (5) and (6), respectively. Where τ k k is the isotropic part of the subgrid stress, which is included in the filtered pressure term; δij is the Kronecker delta function; C is the dynamic Smagorinsky constant ranging from 0 to 0.23; Δ is the filter length of one filter, which is the spatial grid scale.

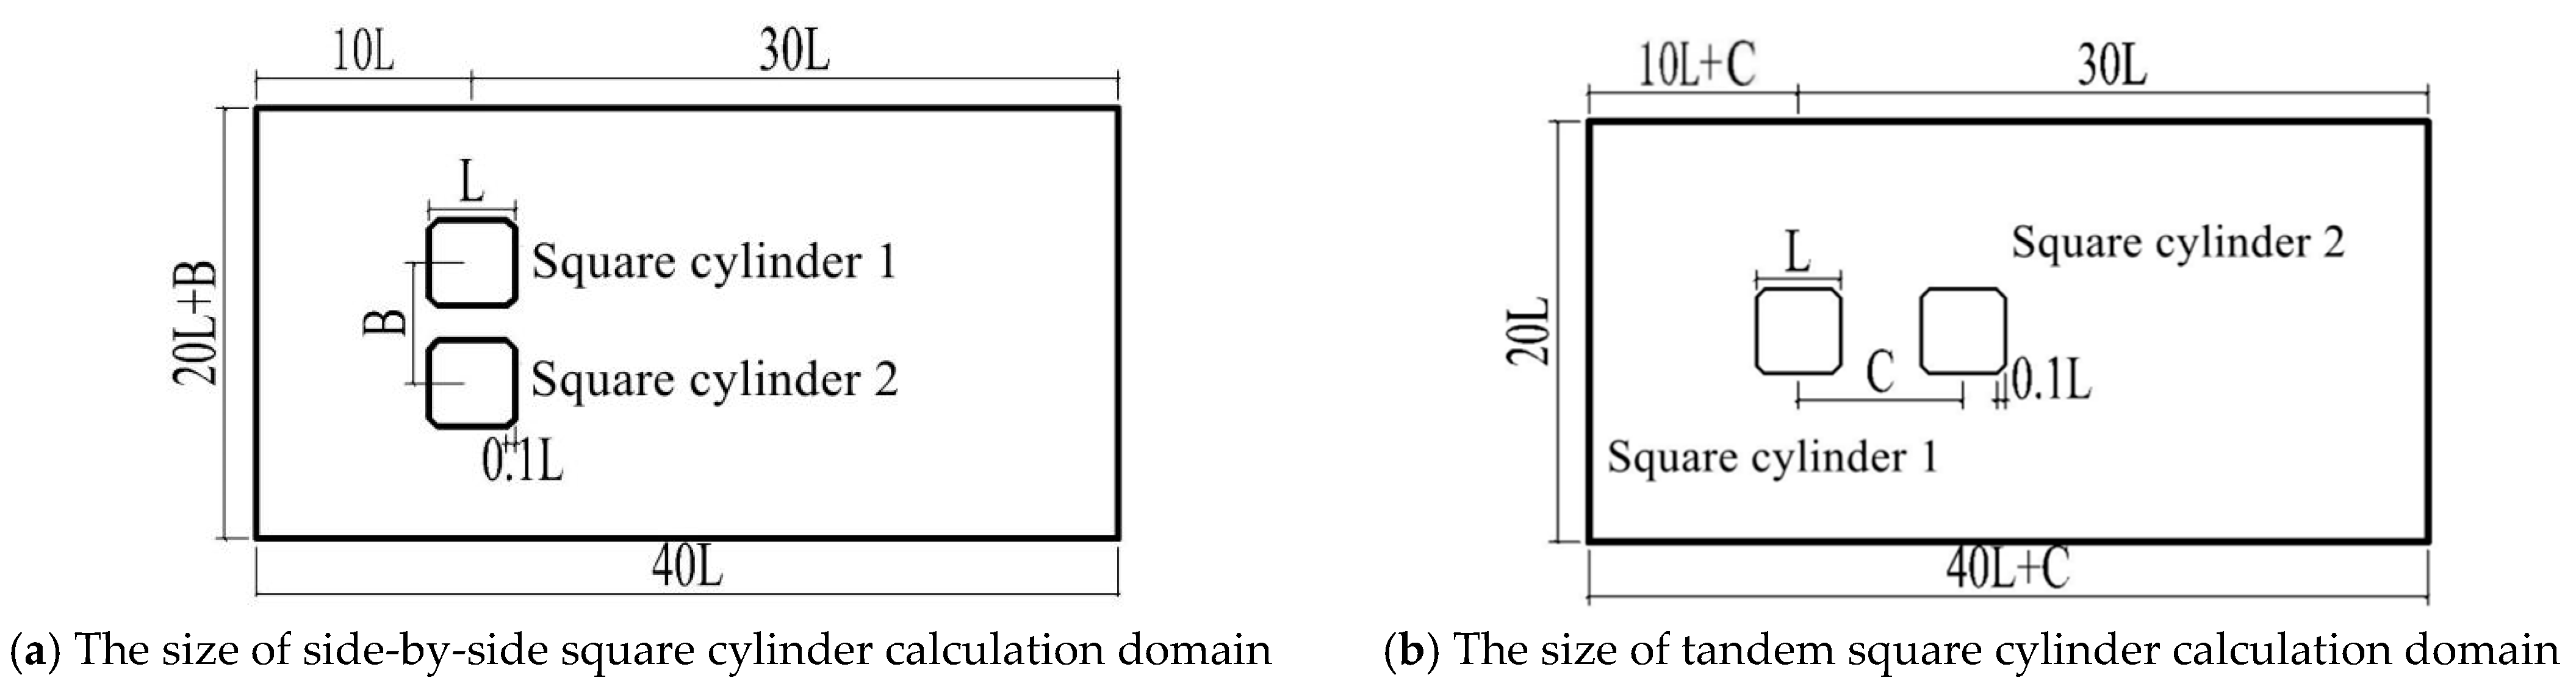
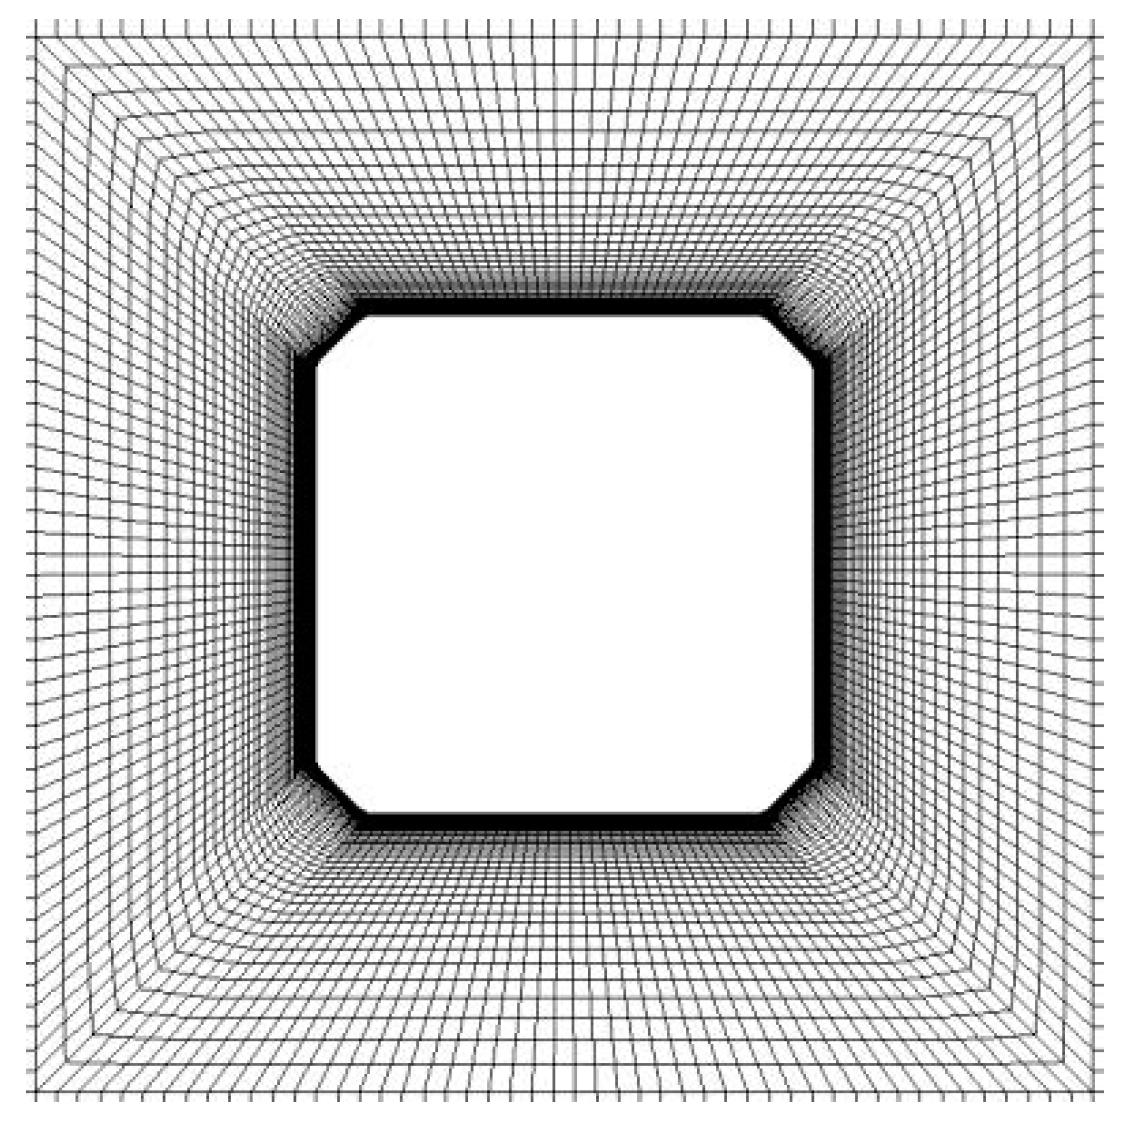
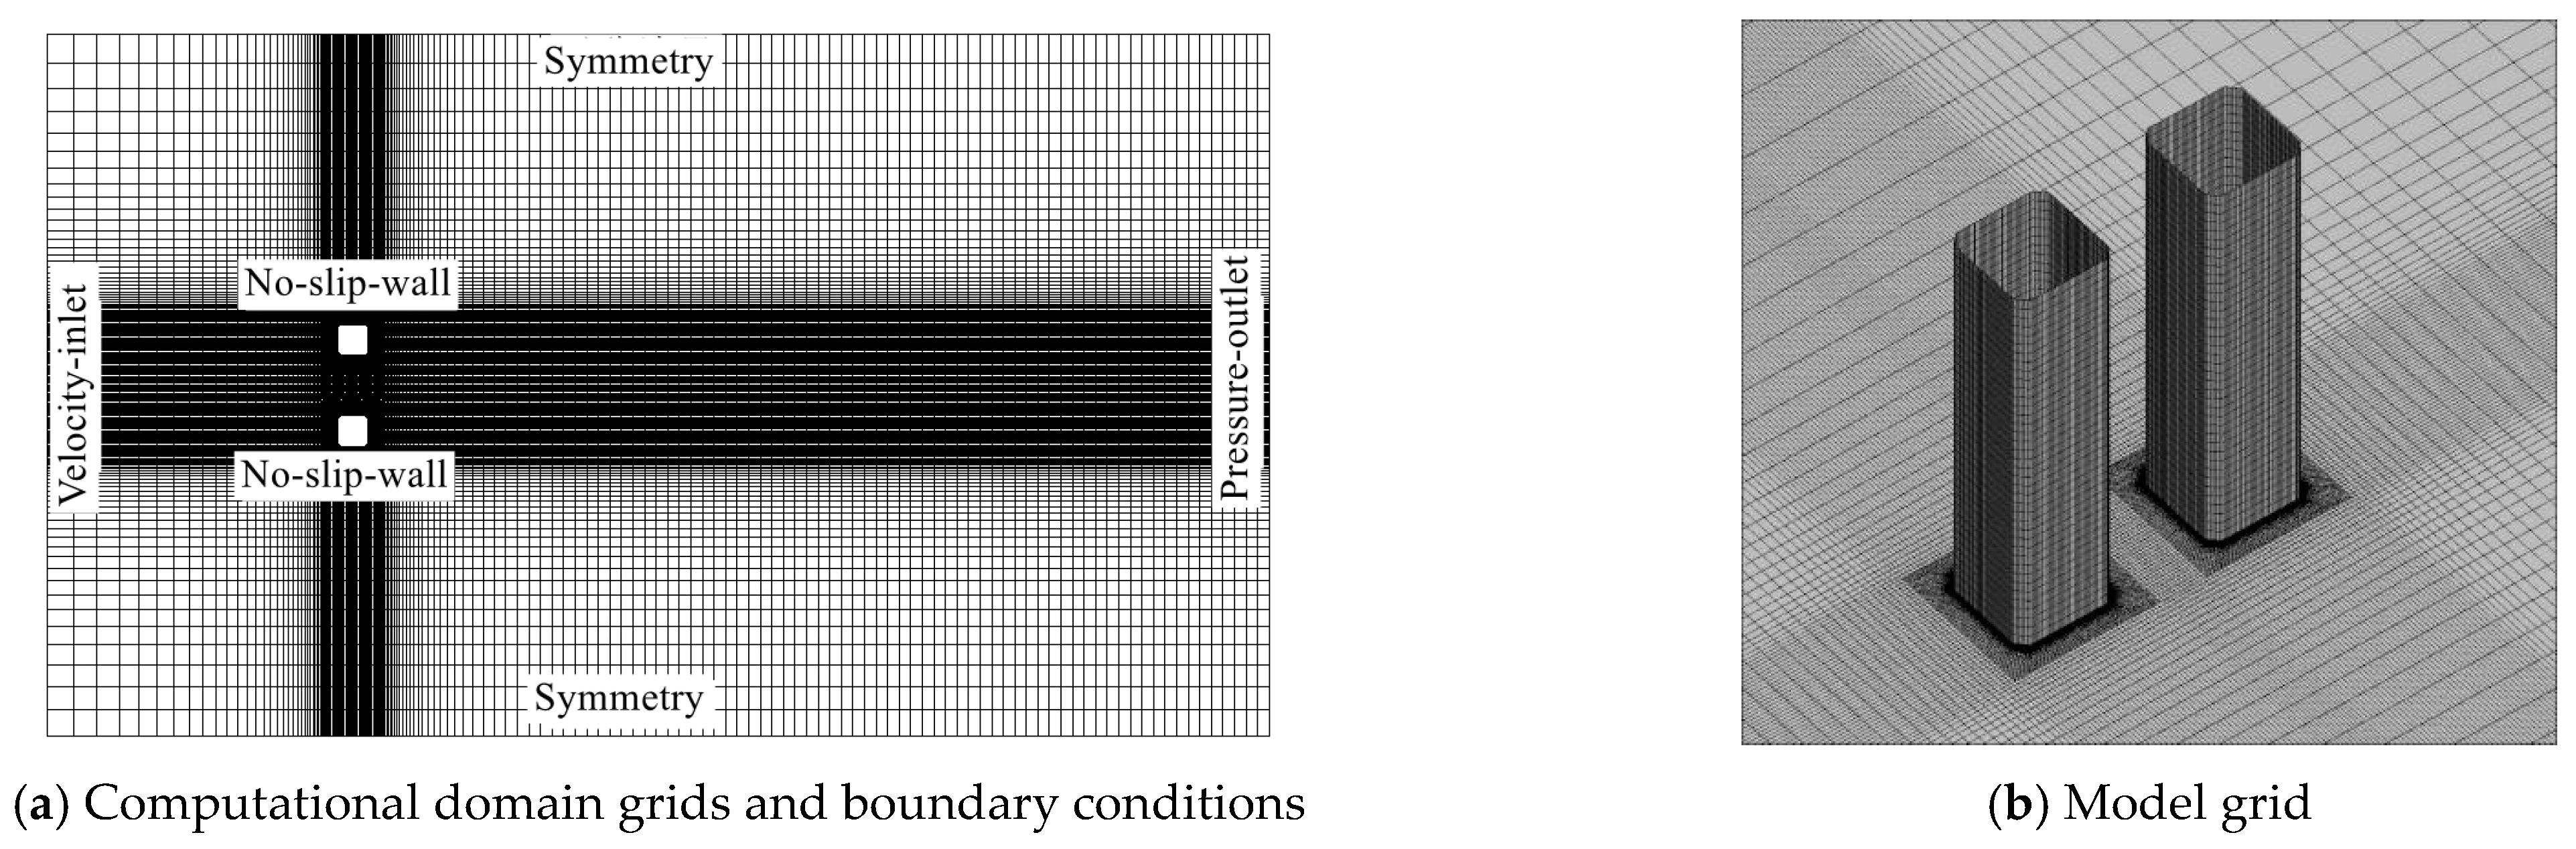
2.2. Numerical Details

The continuity and N-S equations are solved with the ANSYS Fluent package, Release 19.2. The spatial discretization is based on the finite volume method (FVM). The gradients are obtained by applying the least squares cell-based gradient evaluation. The calculation domain and model size of side-by-side and tandem square cylinders are shown in Figure 1a,b, respectively. The side length of the square cylinder is L = 0.1 m, the vertical height is 4 L, and the cut angle corresponds to the right-angle side length D = λL, λ = 0.1. The size of the computational domain of the parallel case is 40 L (flow direction x) × (20 L + B) (span direction y) × 4 L (vertical z), and B is the distance between the centers of the two square cylinders. The size of the computational domain of the tandem case is 40 L + C (flow direction x) × (20 L) (span direction y) × 4 L (vertical z), and C is the distance between the centers of the two square cylinders. The grid adopts a non-uniform structured grid, and the near-wall grid using the encryption treatment is shown in Figure 2. The minimum grid height is 5 × 10⁻⁴ L, and the total number of grids is controlled at 1.5 million to 2 million. The boundary conditions of the computational domain are shown in Figure 3 (Parallel square cylinders). The inlet is a velocity-inlet with the uniform flow, and the wind speed is U 0 ( U 0 = 3.214 m/s). The outlet is a pressure-outlet, the upper and lower surfaces and both sides use symmetry boundary conditions to simulate no-slip wall. The pressure-velocity coupling is solved using the SIMPLEC method, which is a semi-implicit method for solving the mass/momentum/energy transfer equations for the pressure coupling. The momentum equation is in a second-order discrete format. The convergence residual is controlled to 5 × 10⁻⁴, and the time step is set to 0.0005 s.

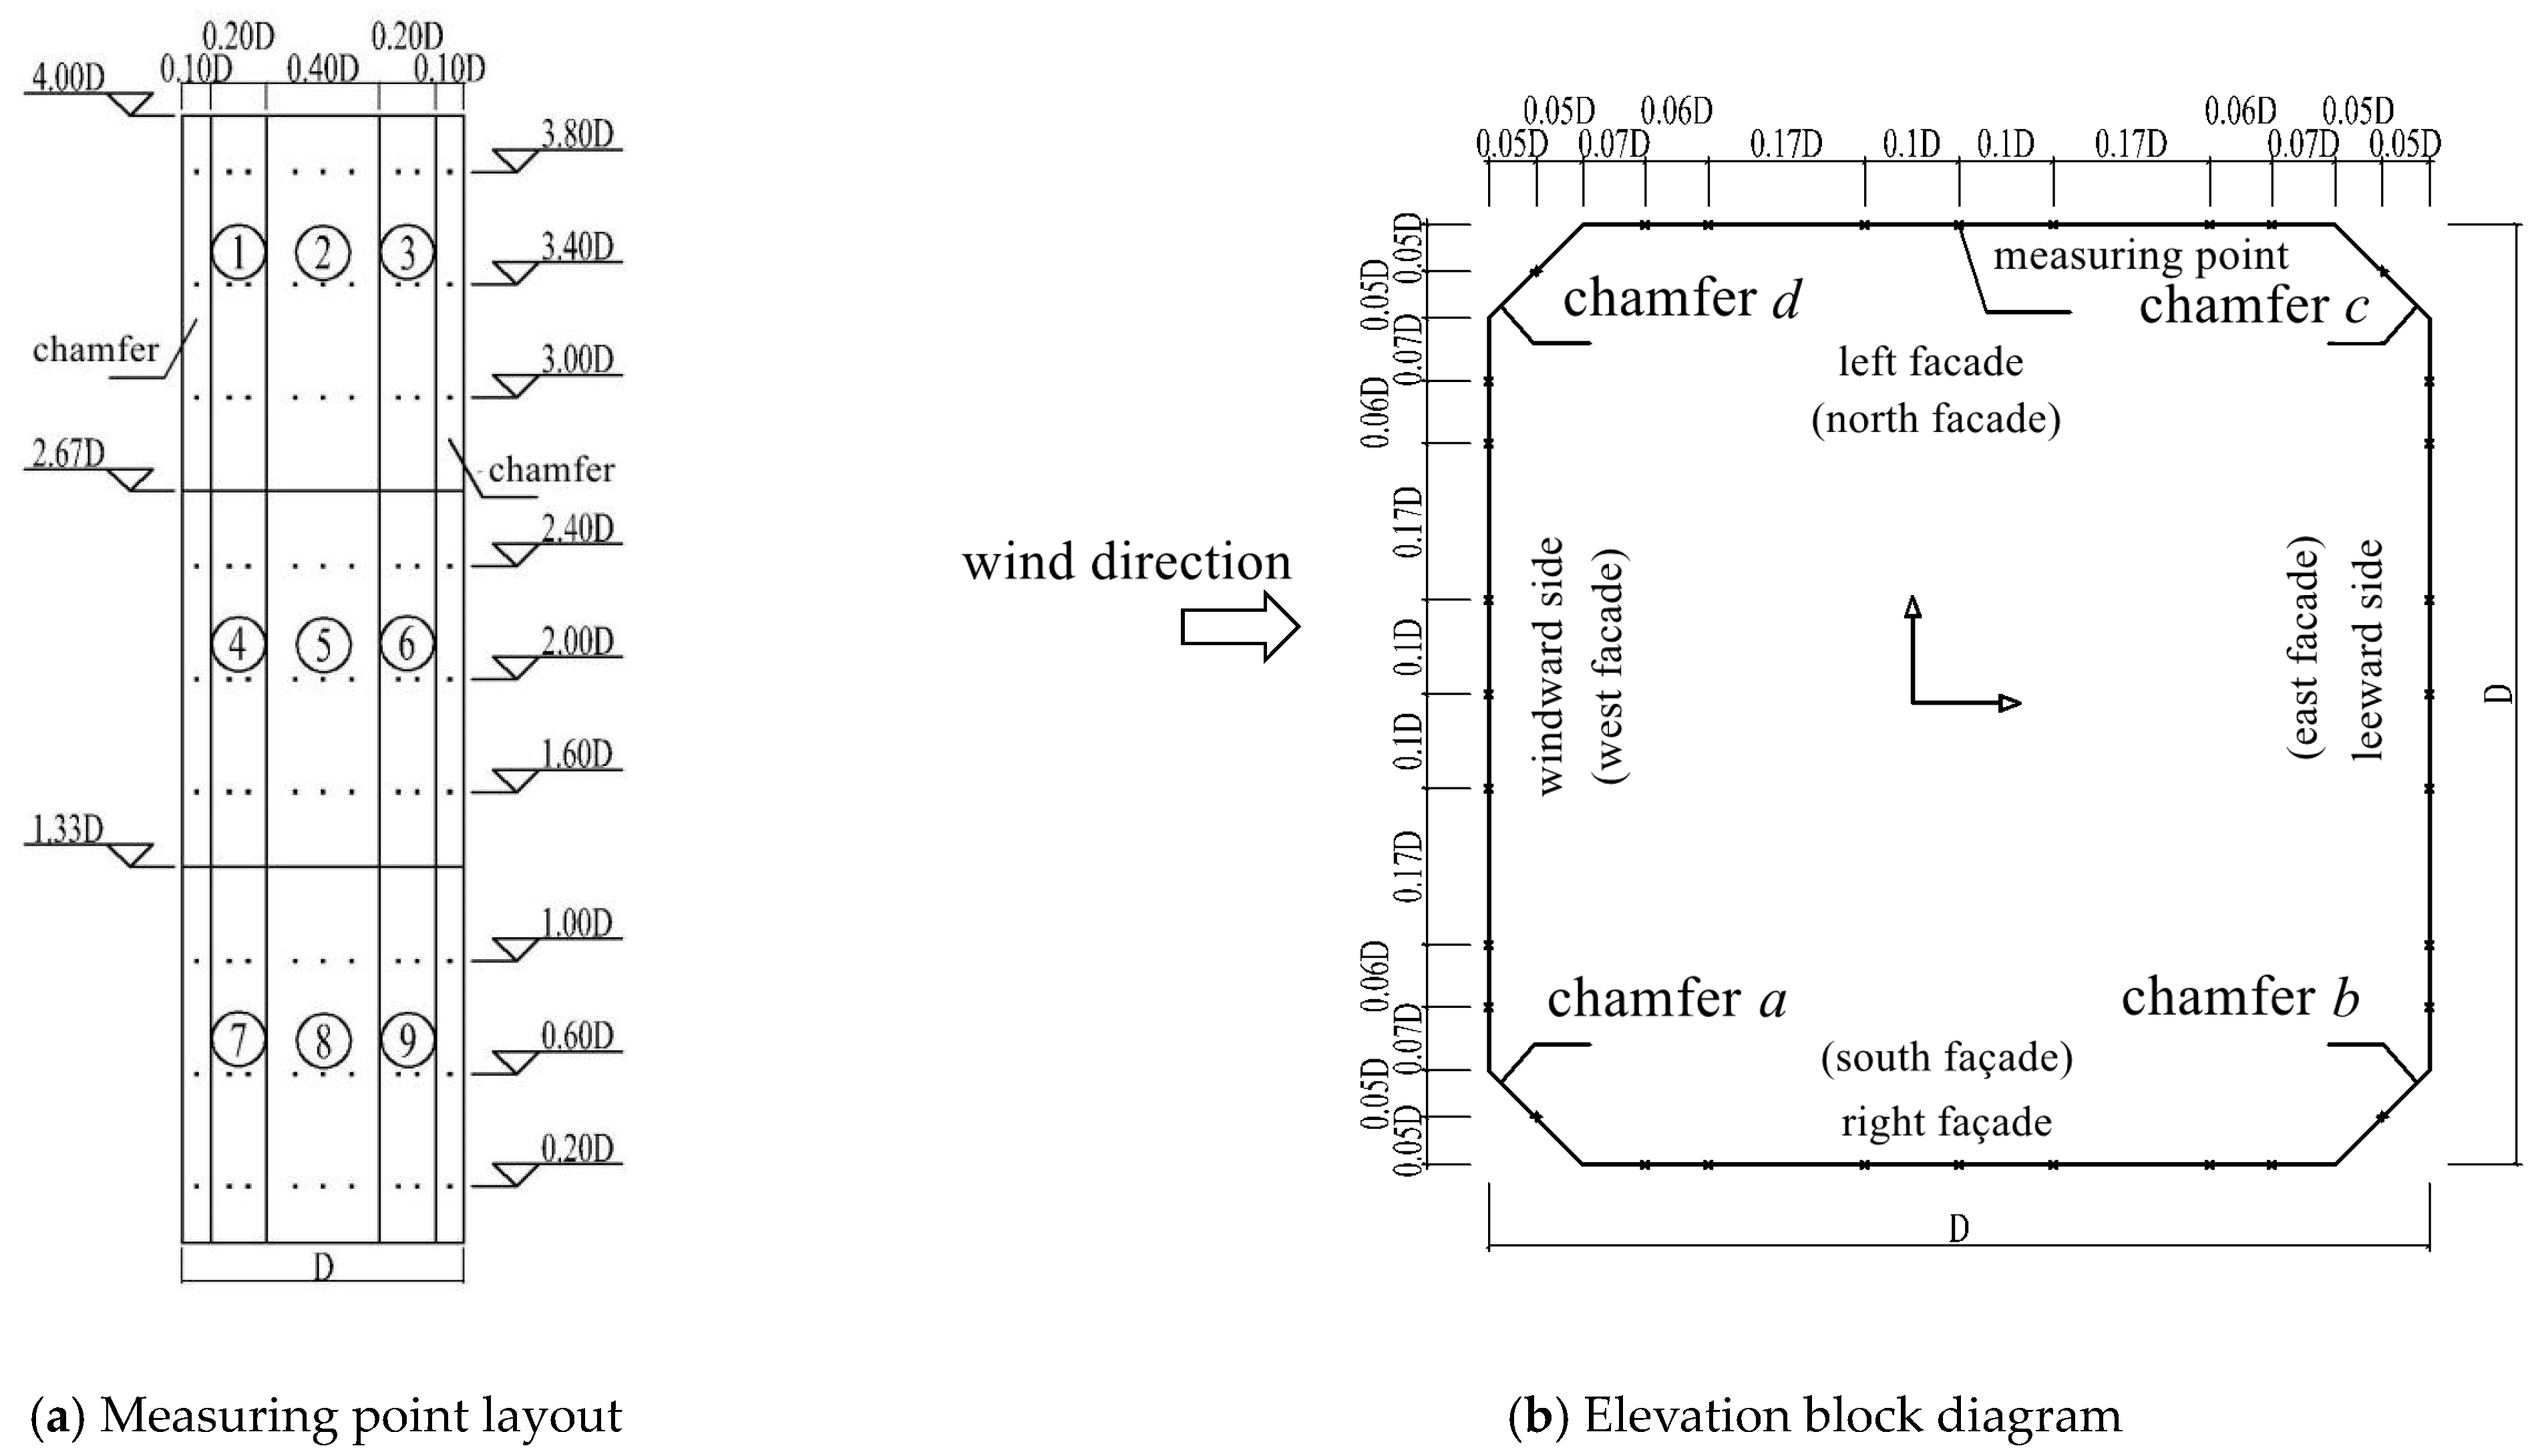
2.3. Data Processing Method

In order to facilitate the comparison of the results, the surface wind pressure, lift and drag appearing in the paper are processed. The specific expression is as follows:
C p = P 1 / 2 ρ U 0 2
C p ¯ = P ¯ 1 / 2 ρ U 0 2
C p = P 1 / 2 ρ U 0 2
C D = F D 1 / 2 ρ U 0 2 L H
C D ¯ = F D ¯ 1 / 2 ρ U 0 2 L H
C L = F L 1 / 2 ρ U 0 2 L H
where, P is the wind pressure at the measuring point; FD, FL are the drag and lift, respectively; ρ is the air density; U 0 is the incoming wind speed; L, H are the width and height of the windward surface of the square cylinder respectively; C p , C p ¯ , C p represent the wind pressure coefficient, the average wind pressure coefficient and the pulsating wind pressure coefficient of the measuring point, respectively; C D , C D ¯ represent the drag coefficient and the average drag coefficient, respectively; C L , C L are the lift coefficient and the pulsating lift coefficient.
Estimating the extreme wind pressure coefficient of each measuring point by using the crest factor method, the specific expression is as follows:
C ^ p = C p ¯ ± g σ p
where, σp represents the standard deviation of the wind pressure coefficient at the measuring point; g is the peak factor. For the value of peak factor, assuming that the structure satisfies Gaussian distribution, it is recommended in GB50009-2012 “Code for Structural Loads of Buildings” that g is taken as 2.5, and the confidence rate can reach 99.38%. In fact, there are non-Gaussian regions in the structure, and the peak factor value will increase under the guarantee rate as required by the specification. In this paper, the observation extremum method and the total probability iteration method are used to calculate the peak factor, and the confidence rate is 99.50%.
In order to more intuitively represent the interference effect between the square cylinders, each facade of the square cylinder is divided into 9 areas according to the wind pressure distribution, and the cut angles are numbered from a to d, as shown in Figure 4. The maximum value of the extreme wind pressure coefficient of each area is used as the extreme wind pressure coefficient of each area. For side-by-side square columns, due to the adjacent facade interference effect, the value is larger, while for the other facades, the interference effect is smaller. This was done in order to simplify and clearly show the interference effect. The block interference factor (BIF) was employed to describe the interference effects on the mean and peak wind pressure distributions [37]. Among them, C ^ p x represents the extreme wind pressure coefficient of each area of the disturbed square cylinder, and C ^ p y represents the extreme wind pressure coefficient of each area of the single square cylinder. The specific expression is as follows:
B I F = C ^ p x C ^ p y
Considering that the distribution of corner cutting points is lower, the use of BIF cannot accurately describe the distribution law of corner interference. Therefore, the wind pressure coefficient interference factor IF of measuring points is further used for analysis. Where, C ^ p i represents the extreme wind pressure coefficient of the disturbed square cylinder measuring point, C ^ p j represents the extreme wind pressure coefficient of the single square cylinder measuring point, and the specific expression is as follows:
I F = C ^ p i C ^ p j

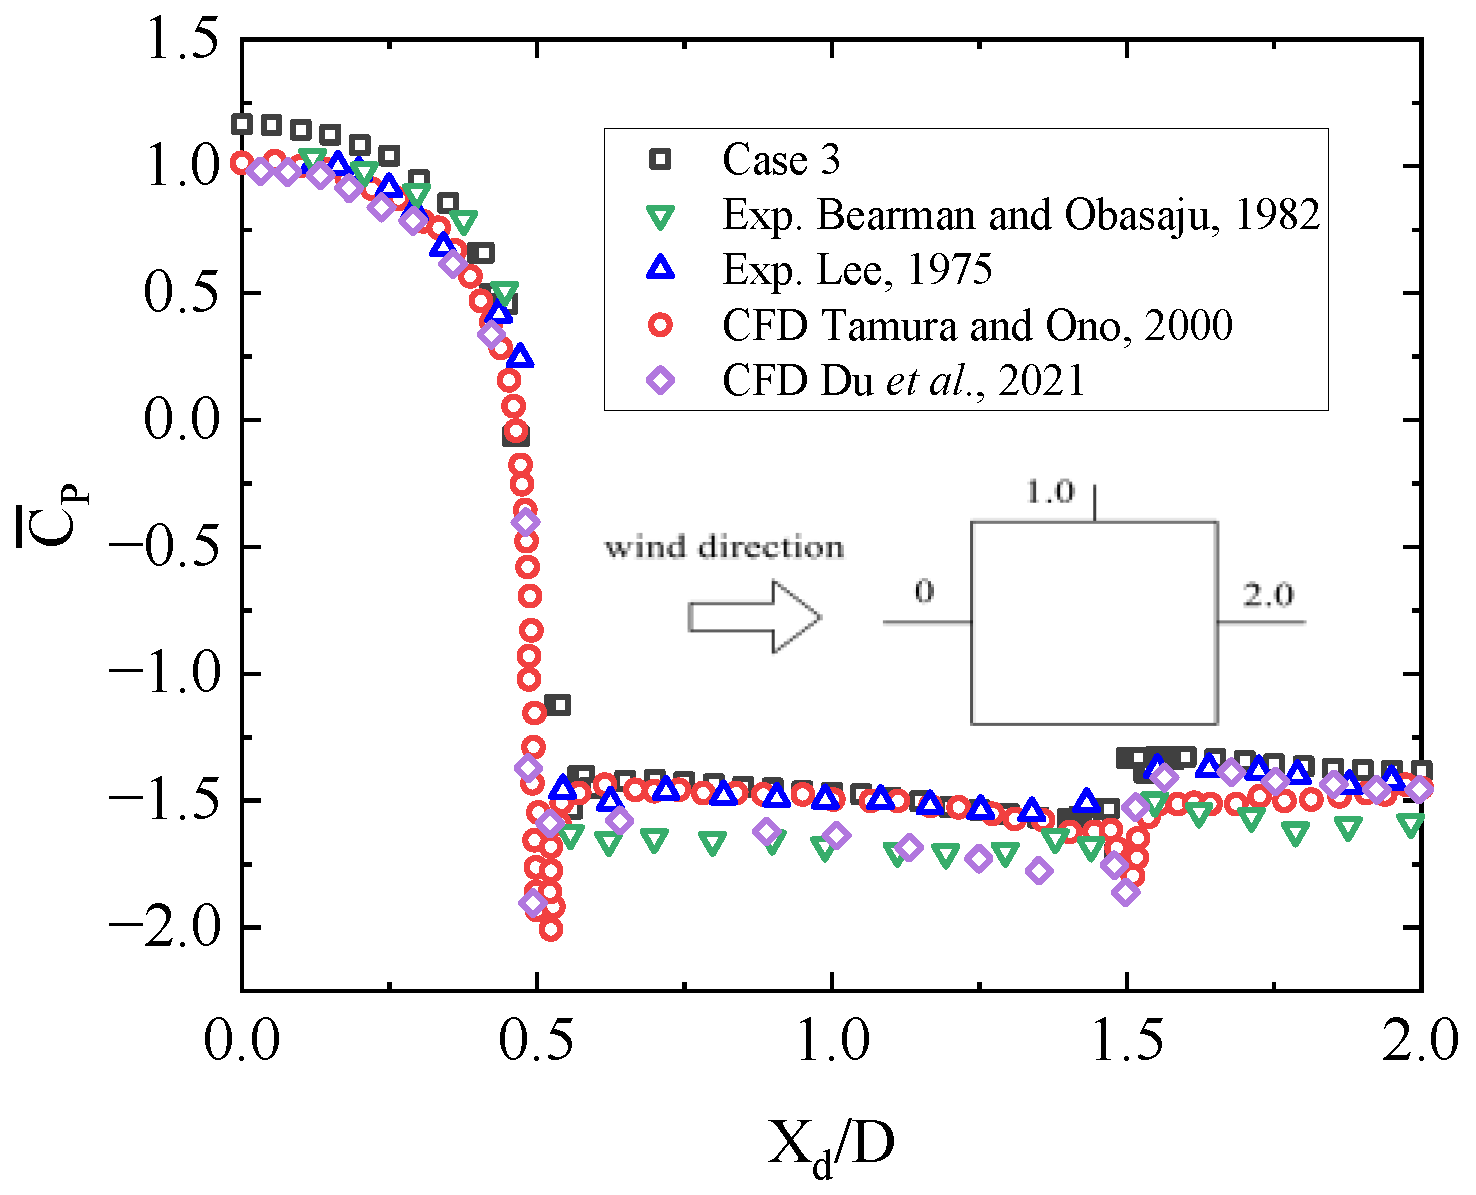
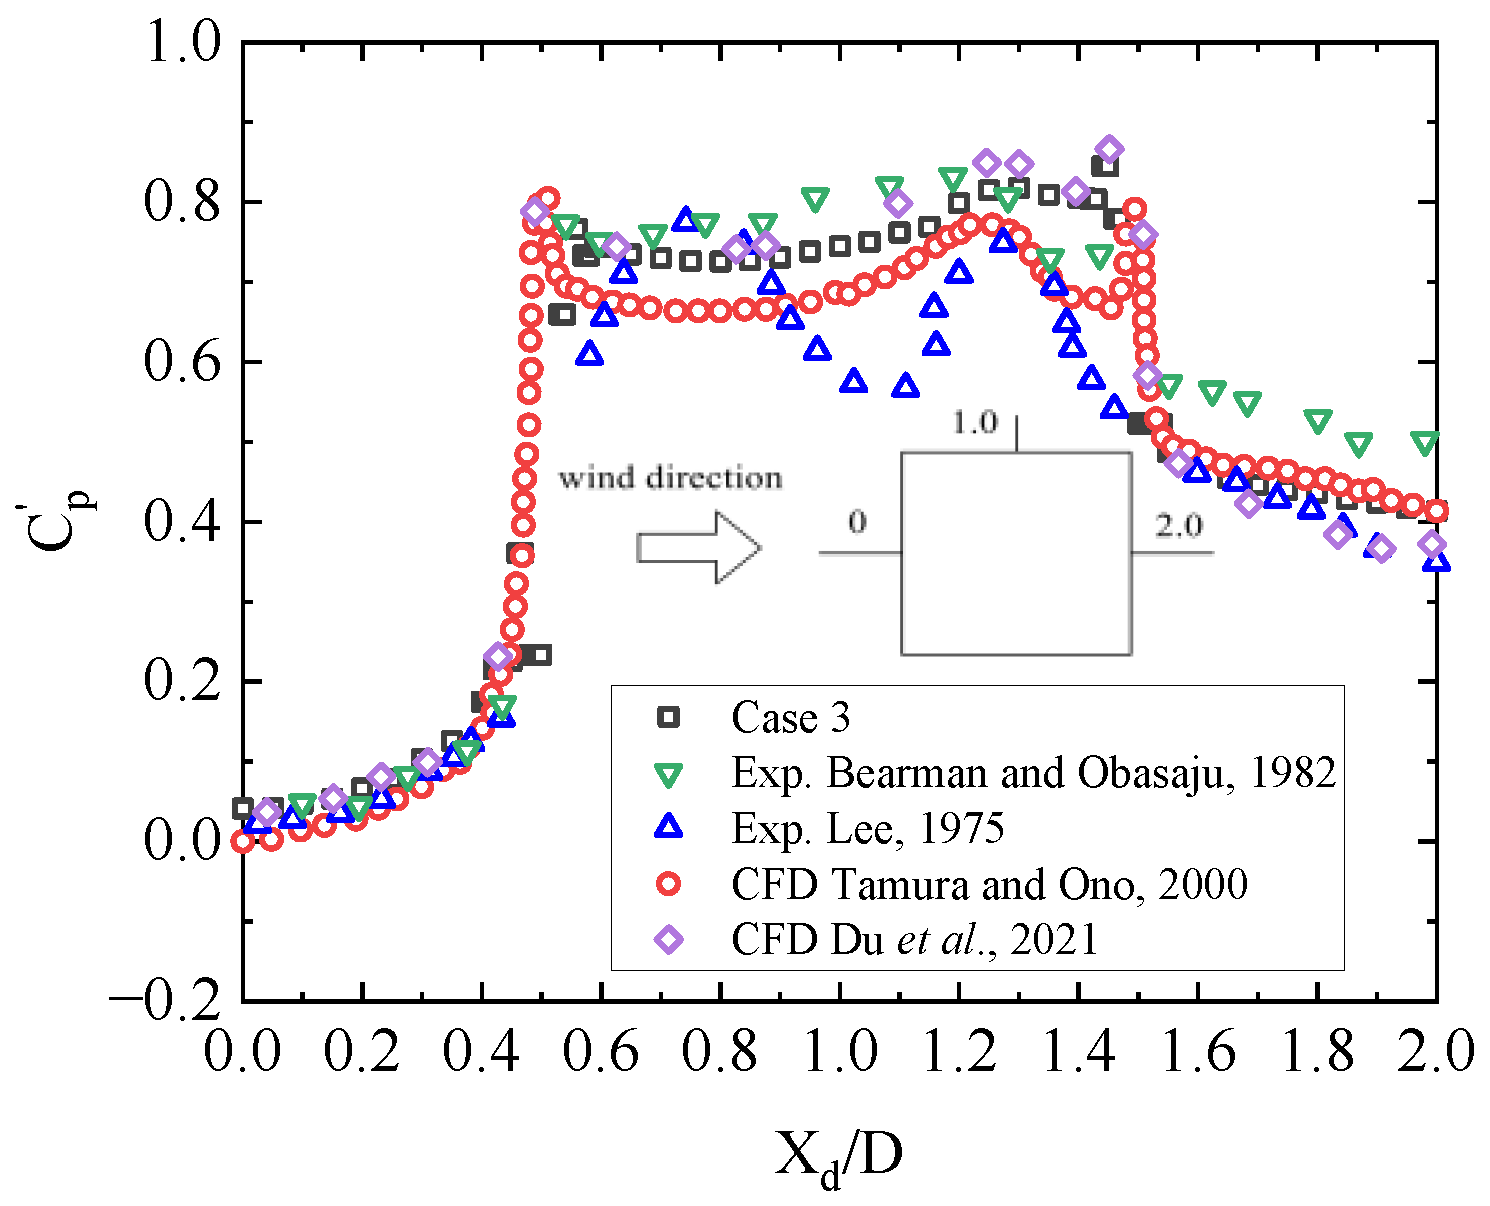
3. Mesh Convergence Analysis and Result Verification

The density of the computational domain grid affects the accuracy and efficiency of numerical simulation calculations. This paper adopts four grid forms from sparse to dense, namely Case 1~Case 4. Under the working condition of a high Reynolds number Re = 22,000, the grid convergence analysis and numerical model verification are carried out by taking the bypass flow around a single-sided column as an example. Table 1 shows the comparison results of average drag coefficient, pulsating lift coefficient, and Strouhal number in four grid schemes with the experimental values of literature [3,4,5,6] and the simulated values of literature [7,8,9]. The y+ value in the table represents the dimensionless distance from the grid of the first layer to the surface of the square cylinder, y+ =μy/ν, where, μ is the friction velocity and y is the mesh size near the wall. The Strouhal numbers of the four grid schemes are basically the same and are all within the range of the literature results. Compared to the literature results, the average drag coefficient and pulsating lift coefficient of Case 1 are far behind, and the results do not meet the requirements of numerical simulation accuracy. The simulation results of Case 2~Case 4 differ by no more than 5% and are all within the range of the literature results. In the case of ensuring the calculation accuracy, comprehensive cost and efficiency, the subsequent grid scheme in this paper refers to Case 3.
To further verify the accuracy of the Case 3 grid, the average wind pressure coefficient was compared (Figure 5) and the fluctuating wind pressure coefficient (Figure 6) curves between the simulation results of Case 3 were analyzed. The results of literature [5,6,11,12], showed that the simulation results are consistent with the curves of the literature results. The maximum deviation of the average wind pressure coefficient of the numerical simulation from the literature value is not more than 5%.
In case of the fluctuating wind pressure coefficient, the simulation results on the windward and leeward sides in this paper are not more than 8% different from those in the literature. However, the average value of the simulation results of the side elevation of the square cylinder is 13% larger than the experimental value of the literature [11]. The reason for these differences is that the numerical simulation is carried out under ideal conditions. In the test process, there are factors that affect the test results such as model scale ratio, the accuracy of the inflow wind field, etc. Based on the above comparison results, the overall large eddy simulation results accurately reflect the aerodynamic values and wind pressure results of the square cylinder, indicating that the grid model and parameter values in this paper have good accuracy and reliability.

4. Aerodynamic Interference Effects

4.1. Pneumatic Interference Effect of Side-by-Side Square Cylinders

Figure 7 shows the change curve of the aerodynamic coefficient of square cylinder 1 and square cylinder 2 with the spacing ratio. When 1.2 ≤ B/L < 2.5, the average resistance coefficients of the two square cylinders fluctuate irregularly and the values differ greatly, indicating that the flow field is still in a biased flow state at this time. When B/L = 1.5, the difference between the coefficients of the two square cylinders is the largest, reaching 18%, and when the spacing ratio is close to 2.5, the coefficient tends to the single value. When 2.5 ≤ B/L ≤ 8.0, the average resistance coefficient of the two square cylinders is basically the same, and the deviation from the value of the single square bar is no more than 2%.
When 1.2 ≤ B/L < 2.5, the pulsating lift coefficient of the two square cylinders gradually increases, but the pulsating lift coefficient at this time is smaller than that of the undisturbed square cylinder. When 2.5 ≤ B/L < 6.0, the pulsating lift coefficient of the two square cylinders first decreased and then increased, and the minimum value was 0.42, which appeared at B/L = 4.0. In this scenario, the pulsating lift coefficient was still a decreasing effect. When 6.0 ≤ B/L ≤ 8.0, the pulsating lift coefficient of the two square cylinder approaches the value of the single square cylinder, and the maximum error is 3%. In general, the difference between the pulsating lift coefficients of the two square cylinders is slight, and the change laws are consistent.

4.2. Interference Effect of Aerodynamic Coefficients of Tandem Square Cylinders

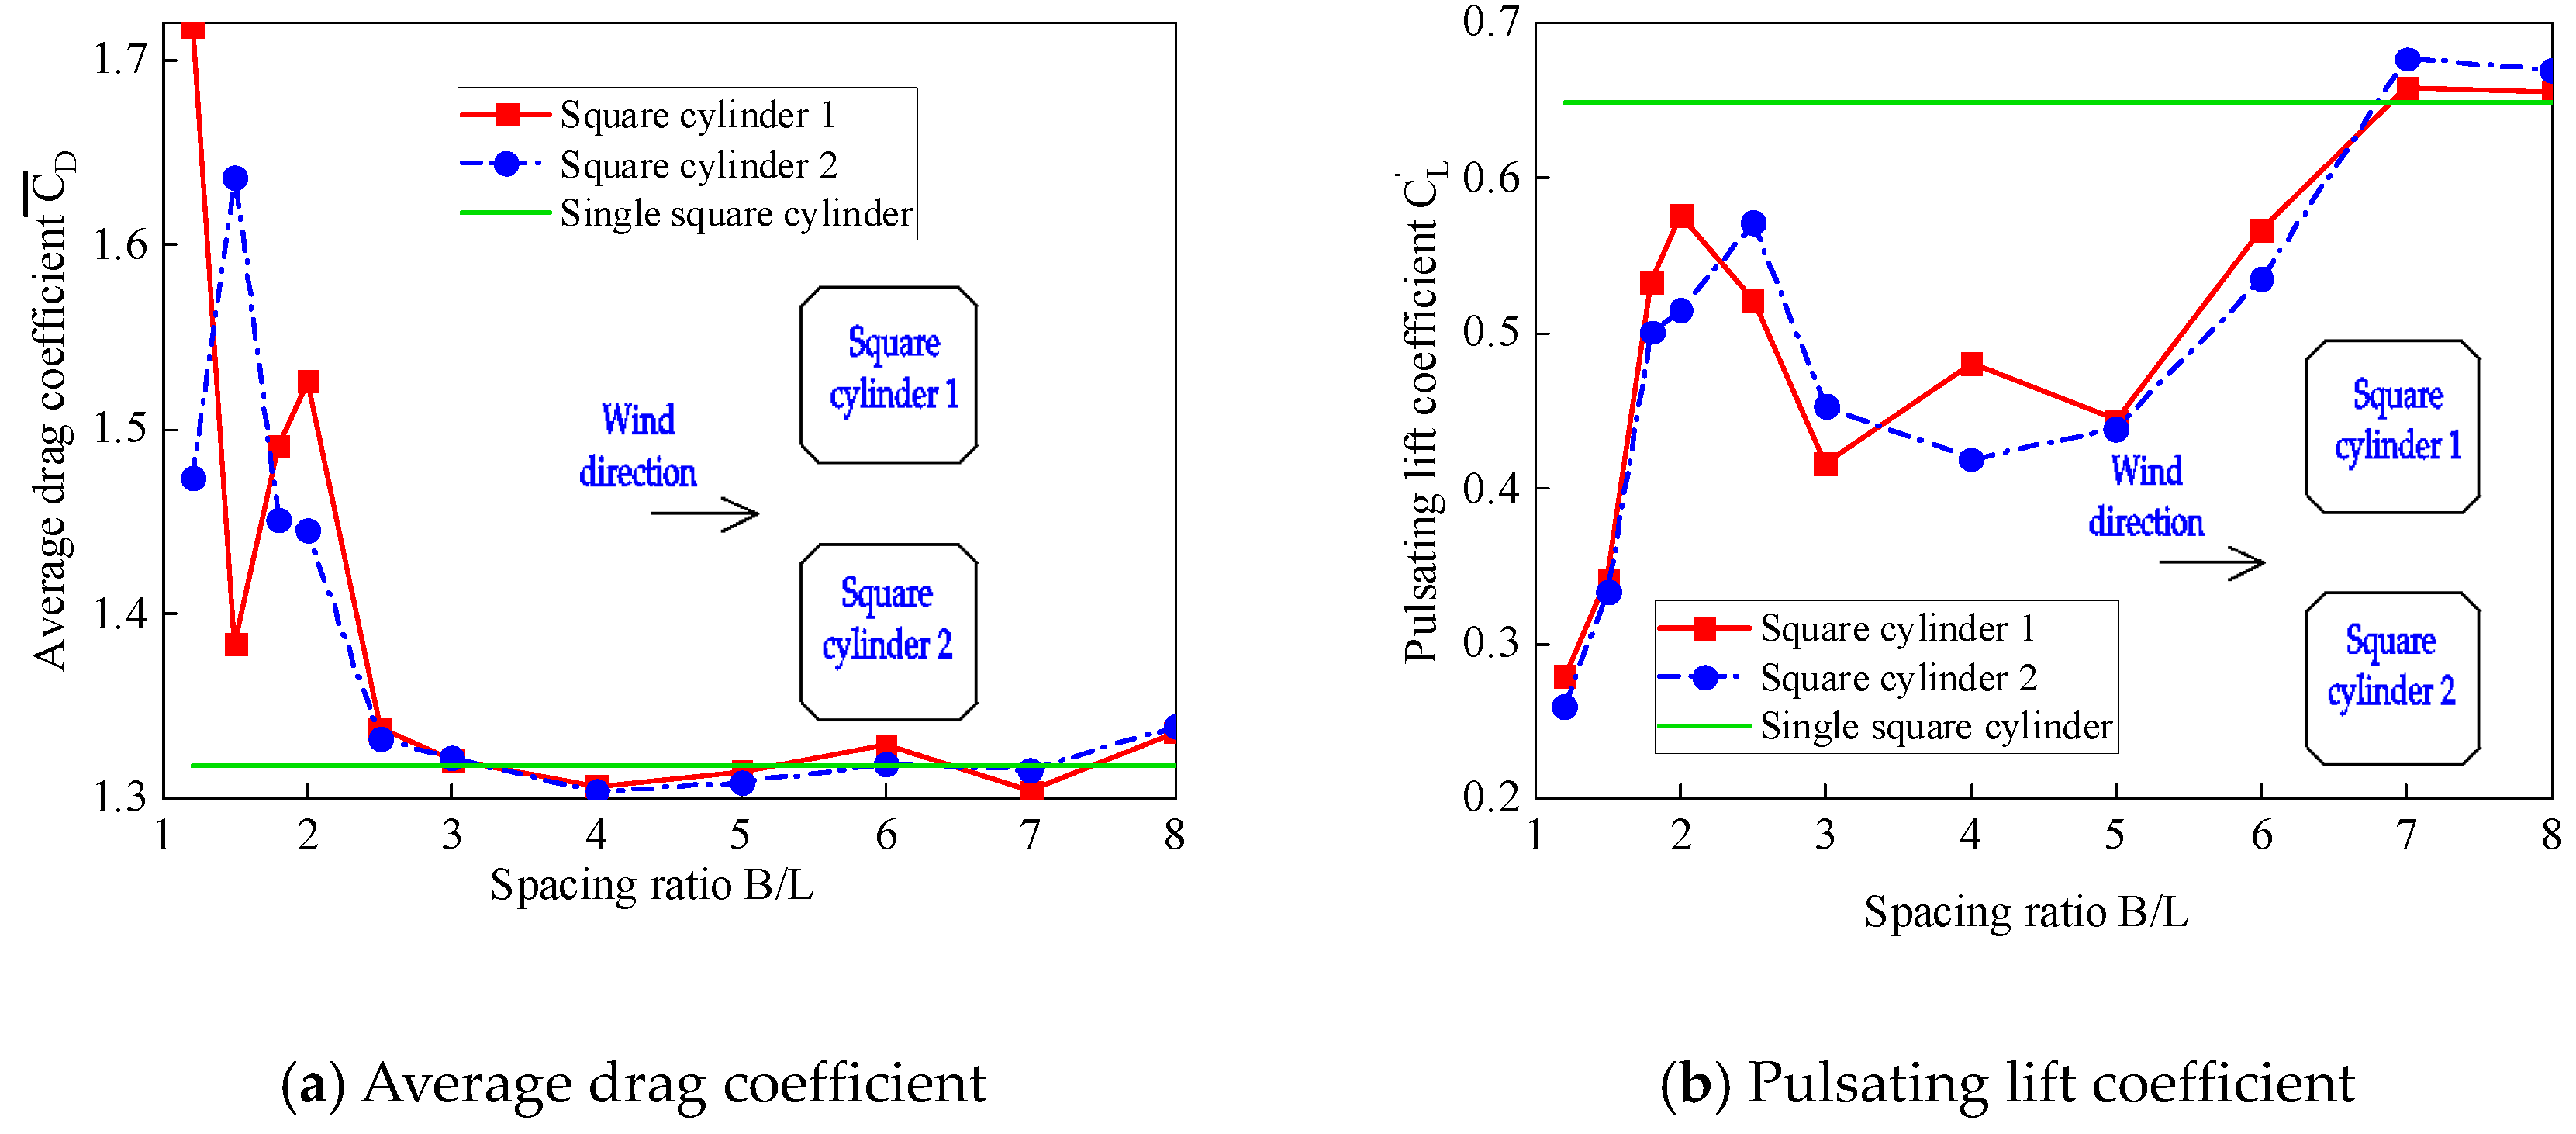
4.2.1. Interference Effect of Average Drag Coefficient

Figure 8a shows the variation curve of the average resistance coefficient of square cylinder 1 and square cylinder 2 with spacing. With the increase of the spacing ratio, the average resistance coefficient of square cylinder 1 (upstream square cylinder) is close to the value of the single square cylinder, and the deviation is not more than 5%. The average resistance coefficient of square cylinder 2 (downstream square cylinder) has an obviously stepped distribution. When 1.2 < C/L < 2.5, the average drag coefficient of the square cylinder decreases gradually with a negative value, and the decreasing speed is positively correlated with the distance. The relationship obtained by fitting data is:
C ¯ D = 0.28685 ( C / L ) 1.01233
The equation fits the data well (coefficient of determination R2 = 0.98484). When 2.5 ≤ C/L < 3.0, the downstream square cylinder appears aerodynamic jump, and the average drag coefficient suddenly changes from a negative value to a positive value. This spacing ratio is the critical spacing ratio. When 3.0 ≤ C/L ≤ 8.0, the average drag coefficient for the square cylinder is basically the same, at around 0.65.

4.2.2. Interference Effect of Pulsating Lift Coefficient

Figure 8b shows the variation curve of the pulsating lift coefficient of square cylinder 1 and square cylinder 2 with spacing. The values of the two square cylinder curves are close and both show a step-like change. When 1.2 ≤ C/L < 2.5, the value of square cylinder 1 is slightly smaller than the value of square cylinder 2, and the pulsating lift coefficient of the two square cylinders increases gradually. The pulsating lift coefficient is smaller than that of the single square cylinder, showing a decreasing effect. When 2.5 ≤ C/L < 3.0, the pulsating lift coefficients of the two square cylinders both increase suddenly, and the critical spacing ratio appears. When 2.5 ≤ C/L < 8.0, the pulsating lift coefficients of the two square cylinders fluctuate around the pulsating lift coefficients of the undisturbed single square cylinder.

5. Non-Gaussian Characteristics of Wind Pressure

At present, the judgment standard of the non-Gaussian region is mainly determined in the form of structure. Kumar et al. [38] took low-rise houses as the research object, and declared that the criterion of a non-Gaussian region is that the skewness is greater than 0.5 and the kurtosis is greater than 3.5. Sun et al. [39] analyzed the non-Gaussian characteristics of large-span roofs, and proposed that the boundary between Gaussian and non-Gaussian is when the absolute value of skewness is greater than 0.5 and the kurtosis is greater than 3.7. Lou et al. [40] gave the standard of a skewness greater than 0.2 and a kurtosis greater than 3.5 through the study of high-rise buildings with cut corners. Han et al. [41] also conducted research on high-rise buildings and found that it is unreasonable to limit the judgment scale of kurtosis and skewness at the same time. The invention proposes three conditions in which the skewness is greater than 0.25 and the kurtosis is greater than 3.2, or the skewness is greater than 0.45, or the kurtosis is greater than 4.0. In this paper, high-rise buildings with cut corners are taken as the research object, and the references [40] and [41] are combined. It is considered that the standard for delimiting non-Gaussian regions is that the absolute value of the skewness is greater than 0.2 and the kurtosis is greater than 3.5, or the skewness is greater than 0.45, or the kurtosis is greater than 4.0. The formula is as follows, where S represents skewness and K represents kurtosis.
S = 1 n i = 1 n ( x i x ¯ ) 3 ( 1 n i = 1 n ( x i x ¯ ) 3 ) 3 2
K = 1 n i = 1 n ( x i x ¯ ) 4 ( 1 n i = 1 n ( x i x ¯ ) 2 ) 2
non - Gaussian   characteristics = { | S | > 0.2 ,   K > 3.5 | S | > 0.45 K > 4.0

5.1. Non-Gaussian Characteristics of Wind Pressure in Parallel Square Cylinders

Figure 9 shows the non-Gaussian area distribution of the disturbed square cylinder for typical spacing ratios. When 1.2 ≤ B/L < 4.0, the structure is affected by the interference square cylinder, and the non-Gaussian region has no obvious features. When B/L ≥ 4.0, the windward side shows a Gaussian distribution, and the leeward side, left and right facades are non-Gaussian areas, which are consistent with the non-Gaussian area division of a single square cylinder.

5.2. Non-Gaussian Characteristics of Wind Pressure in Tandem Square Cylinders

Figure 10 shows the non-Gaussian area distribution of the downstream and downstream square cylinders with the typical spacing ratio of the tandem square cylinders. When C/L = 1.5, the windward and leeward sides of the structure are both non-Gaussian regions, the non-Gaussian regions of the left and right facades are distributed symmetrically, and the windward sides of the two facades are Gaussian. When C/L = 2.5, the non-Gaussian area on the windward side of the structure decreases. The left and right facades show obvious symmetry. The non-Gaussian area moves down, and the Gaussian area increases. When C/L > 3.0, the structure exceeds the critical spacing ratio, the non-Gaussian mutation of the structure. The windward side shows a Gaussian distribution, and on the leeward side, left and right facades are non-Gaussian areas, which are consistent with the non-Gaussian area division of a single square cylinder.

6. Interference Effect of Wind Pressure

6.1. Interference Effect of Wind Pressure on Side-by-Side Square Cylinders with Cut Corners

Due to the symmetry of the parallel double chamfered square cylinders along the flow direction, considering square cylinder 1 as the disturbing building, and square cylinder 2 as the disturbed building, the positional relationship between square cylinder 1 and square cylinder 2 is shown in Figure 1.

6.1.1. Adjacent Elevation (Left Elevation)

The left facade of square cylinder 2 is the adjacent facade of the disturbing building. The interference factor (IF) distribution of the left facade with distance is shown in Figure 11. When B/L = 1.2, the average wind pressure IF value and extreme wind pressure IF value of the left facade are 1.01 and 0.73, respectively, and the overall performance is a reduction effect. The reason for this phenomenon may be due to the existence of cut corners, which enhances the fluid reattachment. The reattachment of the fluid leads to an increase of the wind pressure on the facade. This, in turn, weakens the negative wind pressure on the facade (expressed as wind suction), which finally results in a reduction effect.
When B/L = 1.5, due to the increase of the spacing ratio, the ability to interfere with the flow field is reduced, the fluid reattachment effect of the cut angle is weakened, and the interference effect is amplified. During this time, the maximum value of the average wind pressure IF is 3.31 and the maximum value of the extreme wind pressure IF is 2.39. When 1.5 ≤ B/L < 6.0, the average wind pressure IF value shows an obvious regular distribution. From the windward side of the facade (the right side of the facade) to the leeward side (the left side of the facade), the interference factor gradually decreases. The law of extreme wind pressure IF value is similar to the law of average wind pressure IF value, and the maximum value of IF under each spacing ratio is located on the windward side of the facade. When 6.0 ≤ B/L ≤ 8.0, the average wind pressure IF value and the extreme wind pressure IF value decrease slowly. When B/L = 8.0, there is still a 28% amplification interference effect on the adjacent facade of the two corner square cylinders.

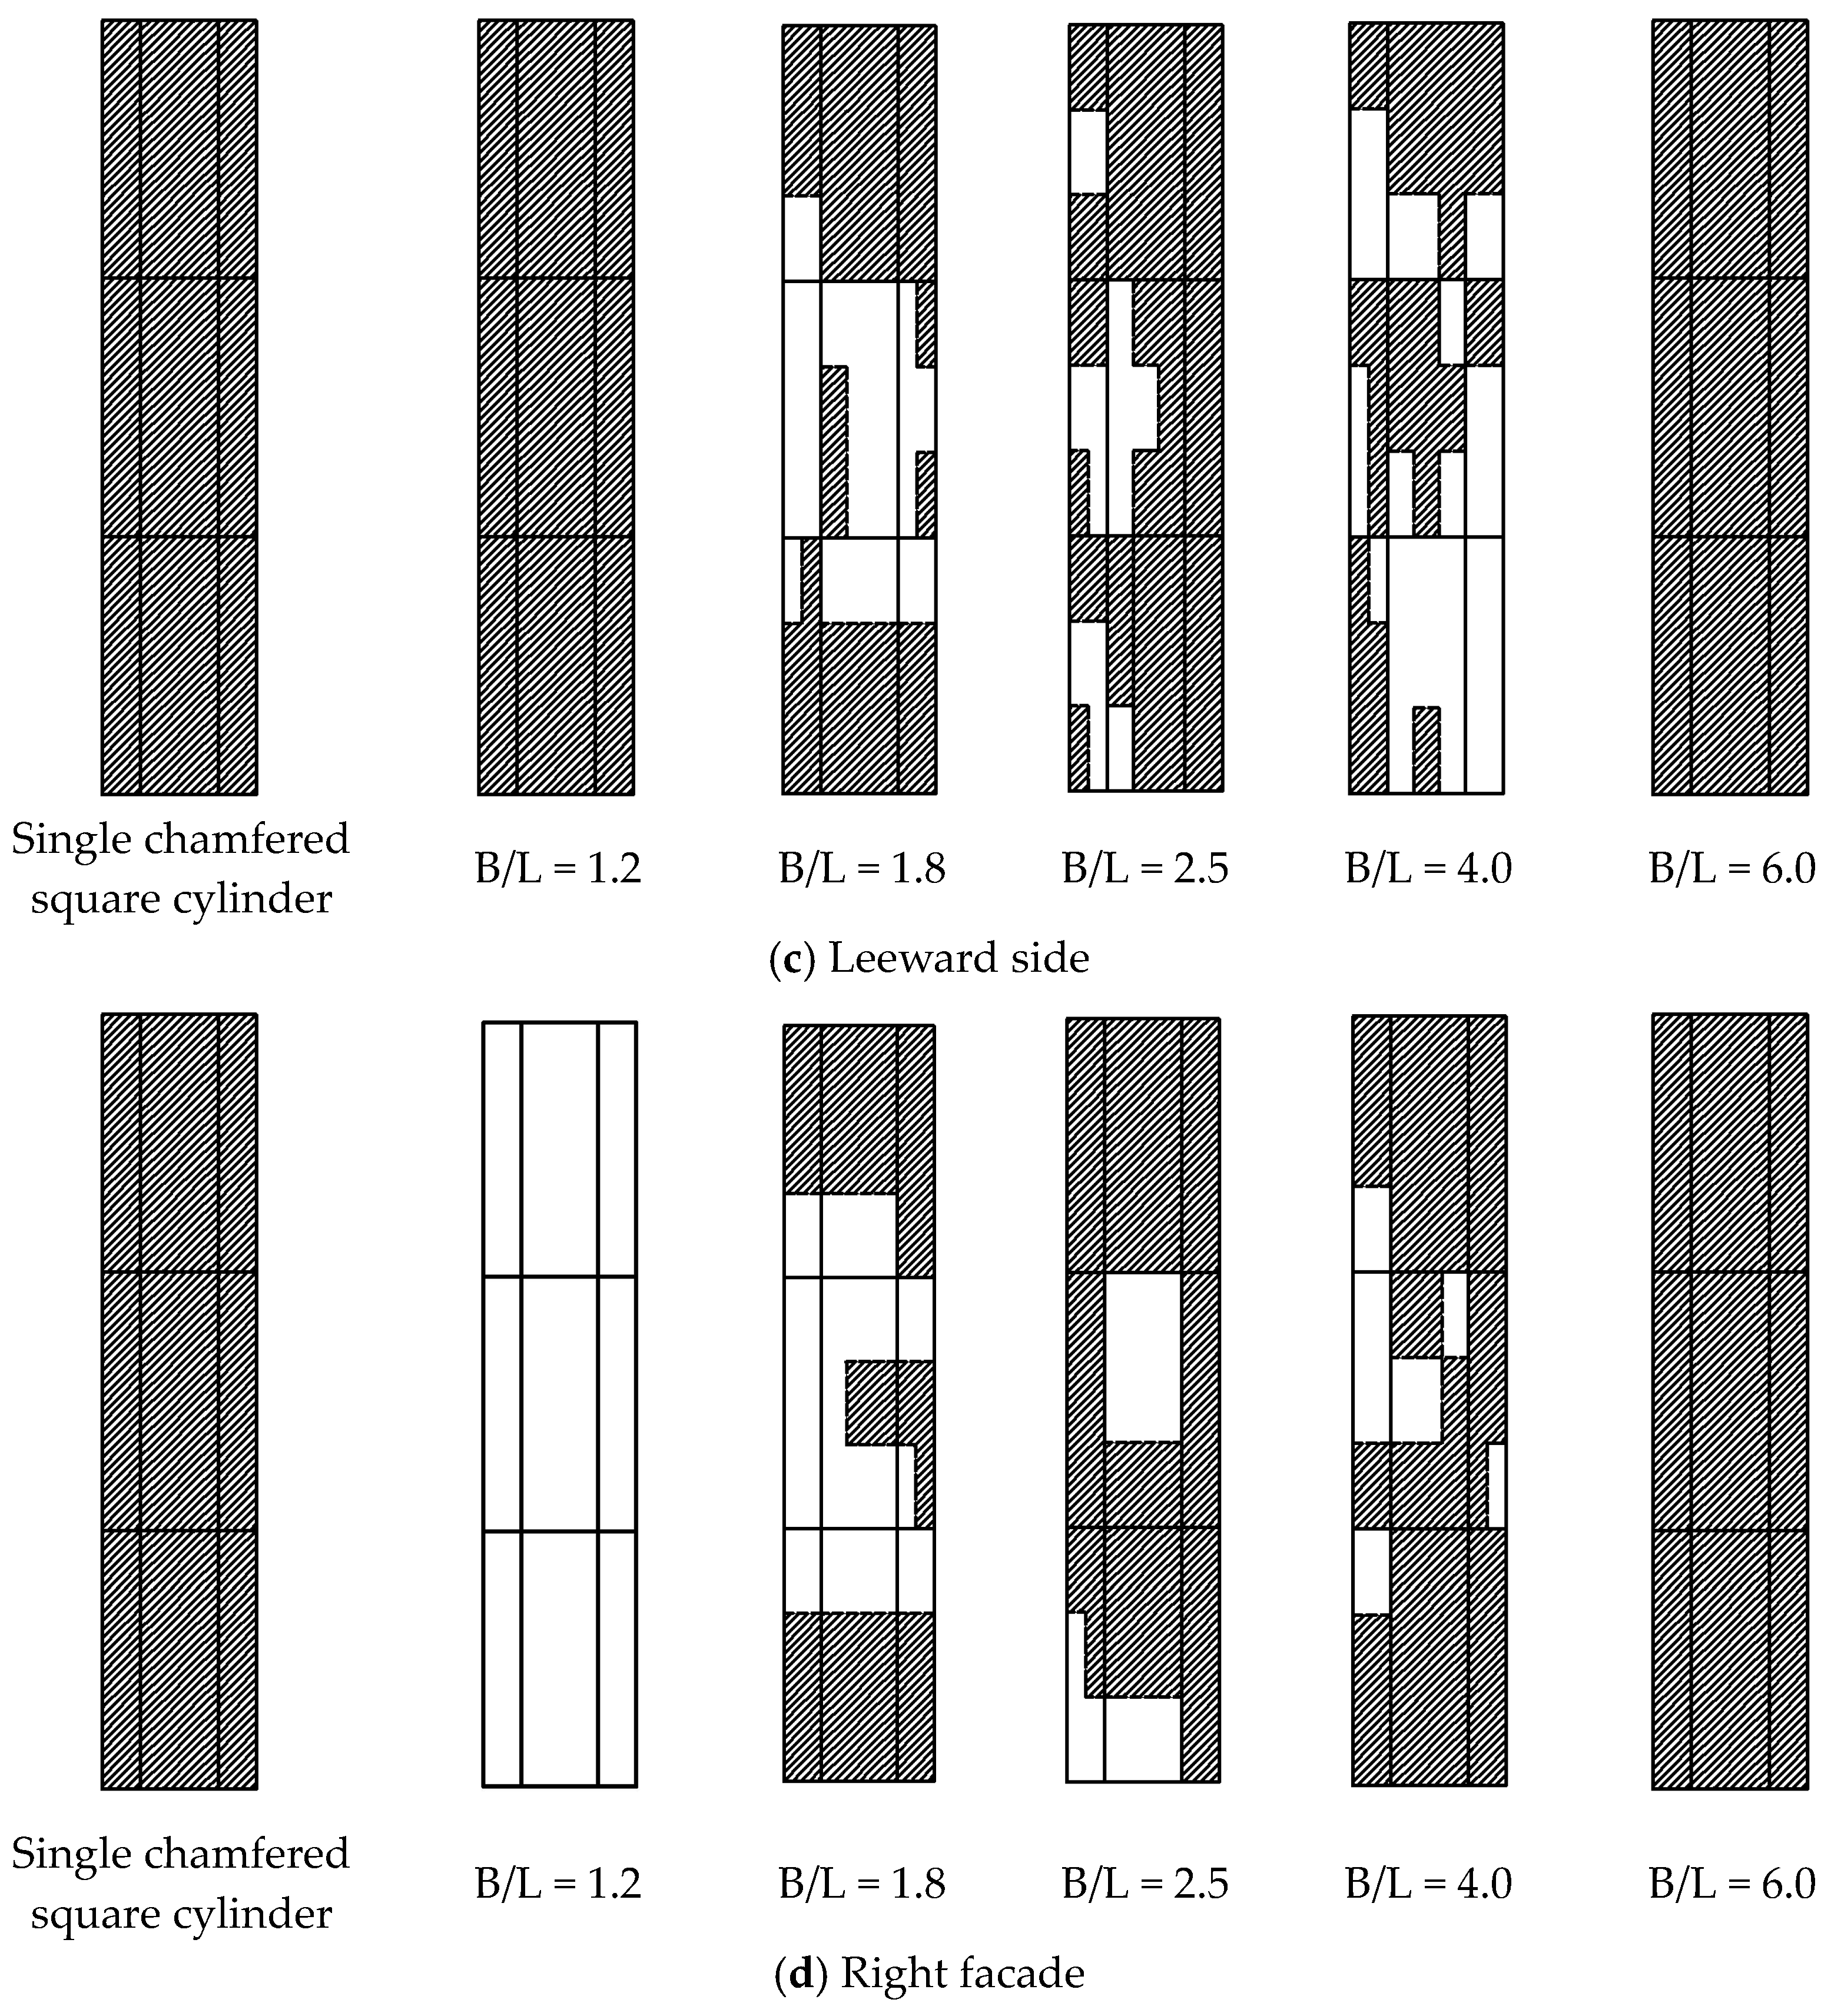
6.1.2. Right Facade, Windward, and Leeward Sides

For other facades of square cylinders, the block interference factor (BIF) is used to describe the interference size of different areas of the facade. Figure 12 shows the distribution of block interference factors at different distances between the three facades. When B/L = 1.2, the BIF value of the windward side changes in blocks. The areas numbered 1, 4, and 7 on the left show an amplification effect. Located in the No. 1 area, the maximum amplification effect is 45%. The areas 3 and 6 on the right side, the leeward side, and the right facade all show a reduction effect. The BIF value of the right facade is the smallest, only 0.74. When B/L = 1.5, this is the critical spacing ratio, after the flow field large-scale vortex in back flow field begins to fall off into a small-scale vortex. In comparison to other conditions, the vortex development is the most intense. The interference effects of all the three facades reached their peak values, and the BIF value of the side close to the left facade (adjacent facade) on the windward side and the leeward side was the largest. Both values crossed 2.00. When B/L ≤ 2.5, the BIF value of each region has a small change range, which gradually approaches 1.

6.1.3. Corner Cutting

Based on the interference results of each facade of the square cylinder, the interference effects of the adjacent facade and the adjacent sides of the windward and leeward sides are more obvious. Therefore, the interference effect of the cut angles c and d located on the adjacent sides of the two square cylinders are studied. Figure 13 shows the distribution results of the extreme wind pressure IF values of the two cut angles with height (please refer to Figure 4 for the elevation).
When B/L = 1.2, the two chamfers show a significant reduction effect, and the chamfer d interference factor is negative, when compared to the single chamfered square cylinder. In this case, the wind suction is transformed into the wind pressure. This is because the two square cylinders are too close, and the wind interacts when entering the canyon (the gap between the two square cylinders), generating wind pressure and changing the force at the cut corner. This also explains the magnification effect on the adjacent side of the windward side. When B/L = 1.5, the cut angle d at the front flow field still shows a reduction effect, but the interference factor changes from negative to positive, indicating that the interaction between the two square cylinders is weakened at this time. The wind pressure generated by the interaction is inadequate to offset the wind suction. As a result, it shows a positive reduction effect. This interaction gradually disappears as the subsequent distance increases. The chamfered angle c of the back flow field shows an obvious amplification effect. The maximum value of the interference factor is 2.58, which appears in the top area of the chamfered angle. When B/L ≥ 4.0, the interference factor does not change with the increase of the spacing, and the interference at the chamfer gradually disappears.

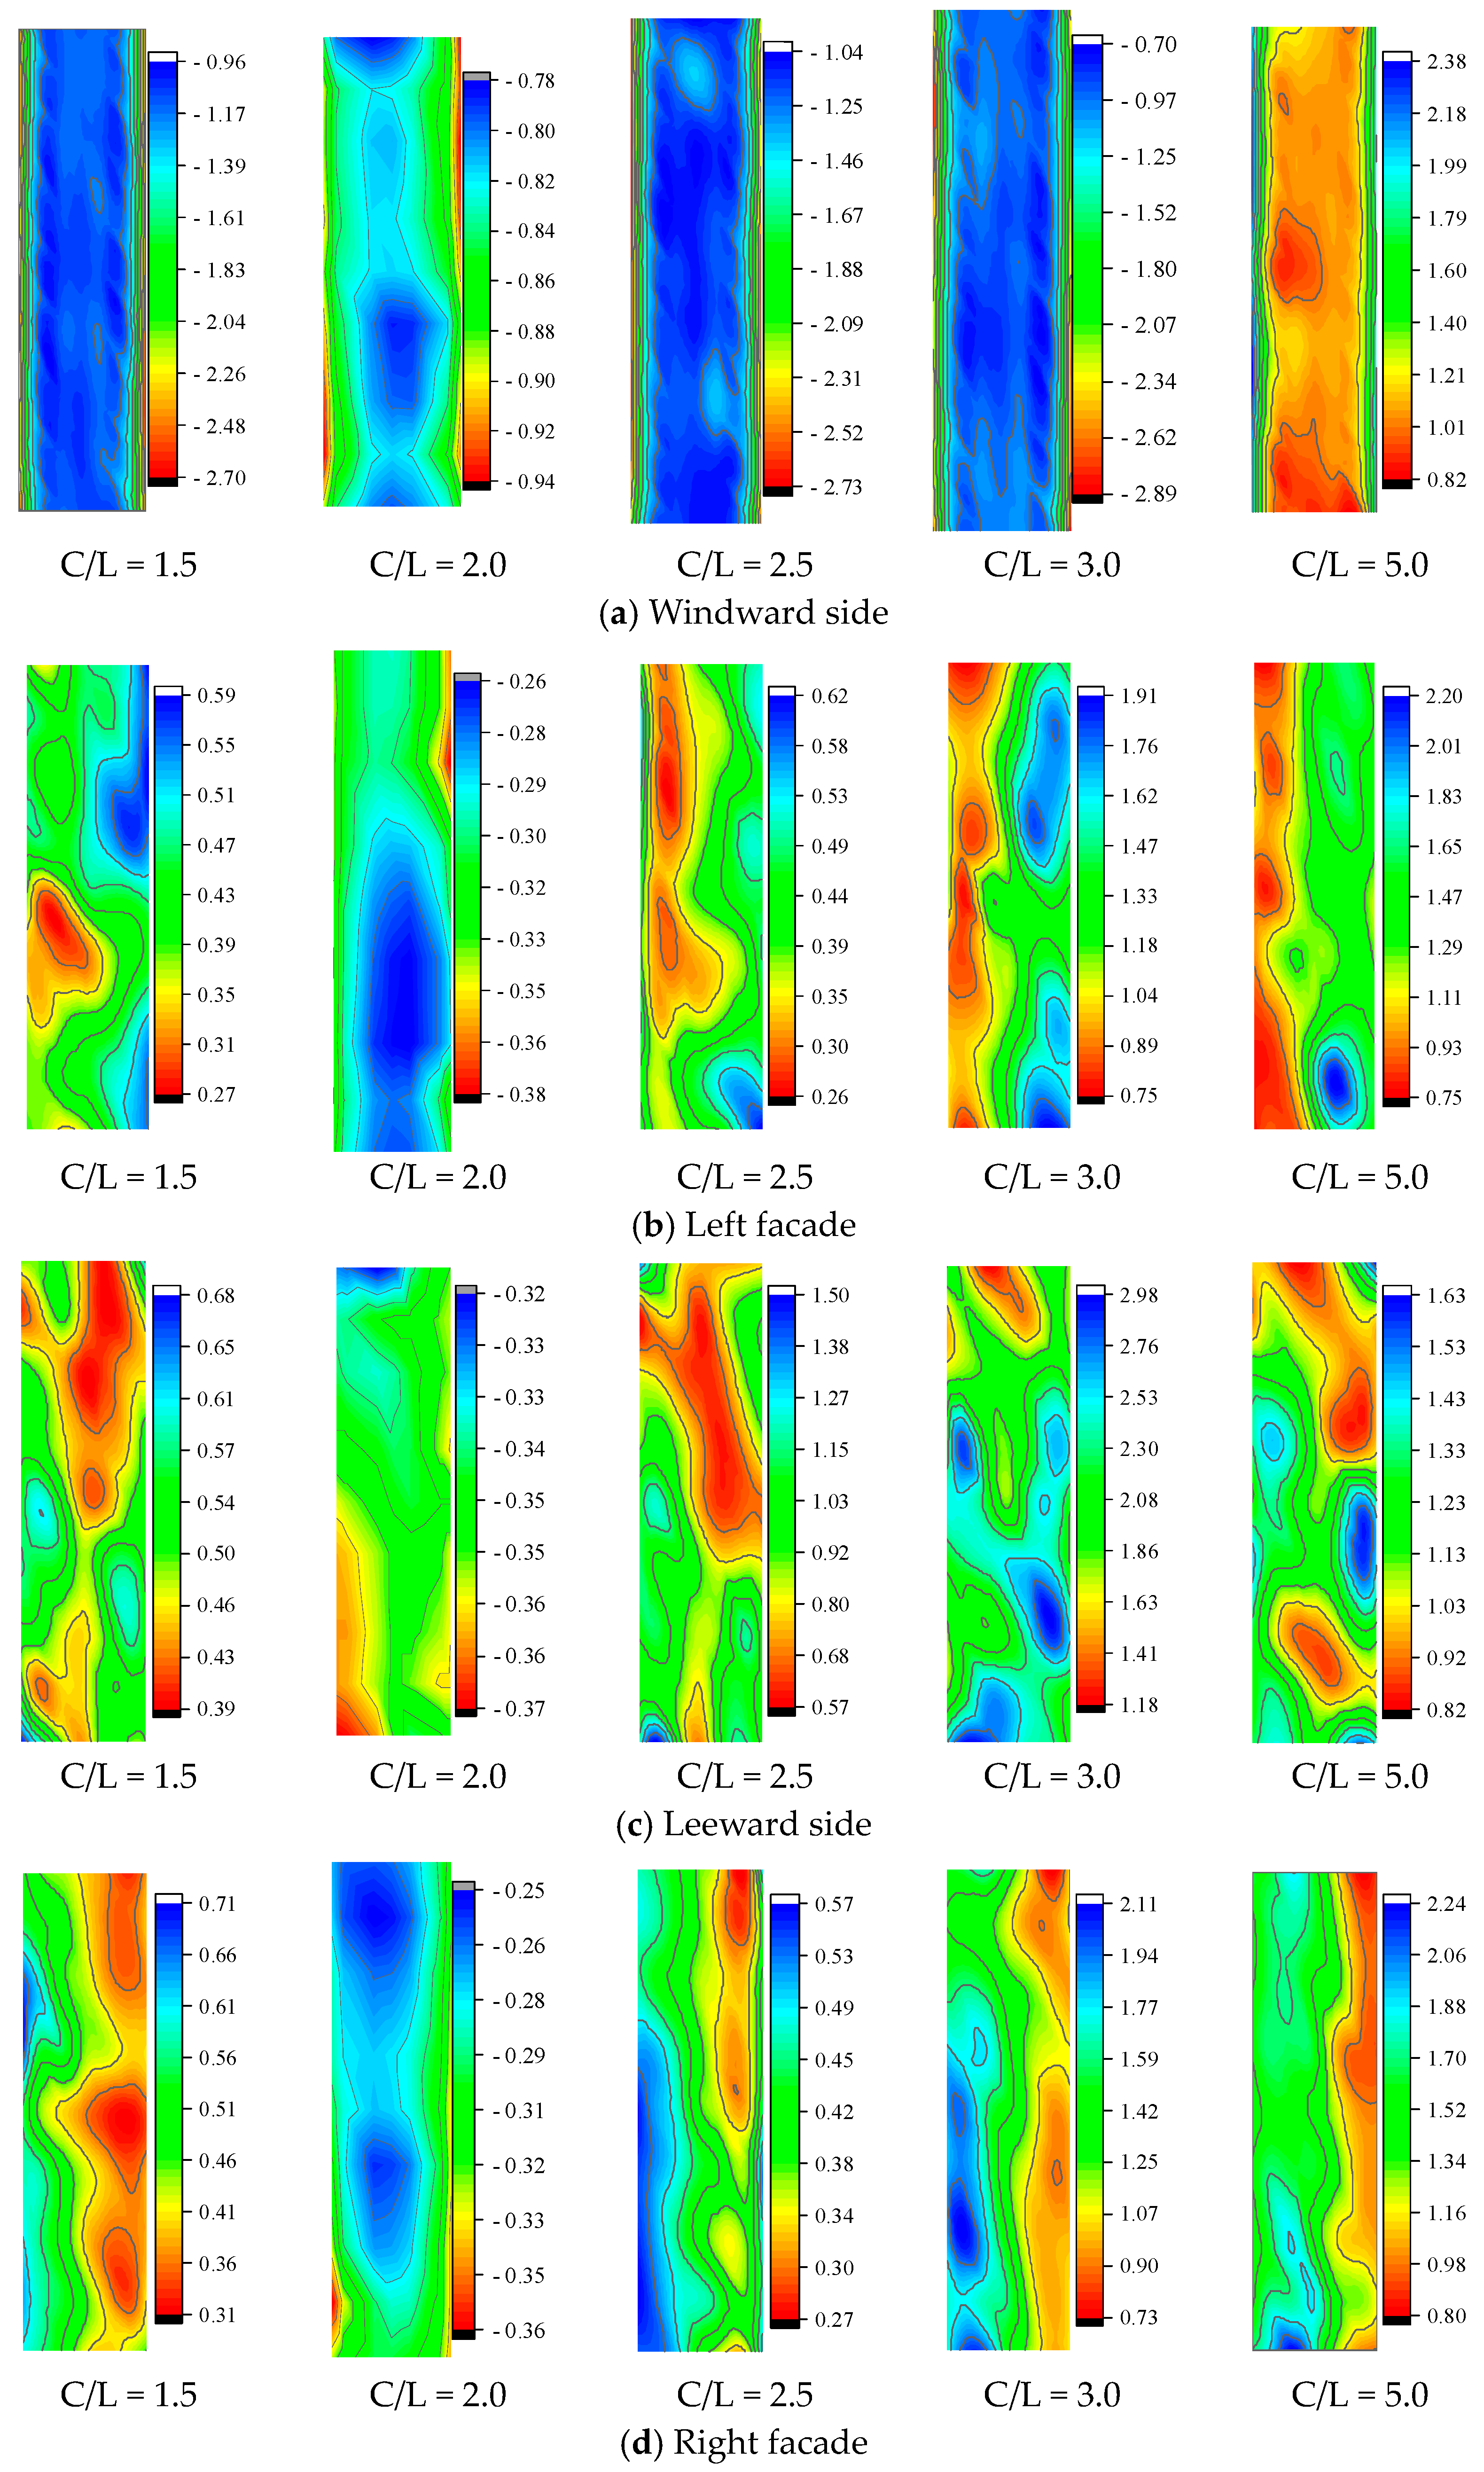
6.2. Interference Effect of Tandem Square Cylinder with Chamfered Angle

Based on the crest factor data, the interference effect of the downstream square cylinder was studied, and the square cylinder interference factor distribution was obtained, as shown in Figure 14. The distribution of disturbance factors on the windward side is similar to the distribution of wind pressure; the middle is layered to both sides and gradually increases. The interference in the middle of the windward side is relatively small, and it is mostly manifested as a reduction effect. The two sides are amplification effects, and the maximum value of the interference factor can reach 2.890. When 1.2 ≤ C/L ≤ 3.0, the interference factor on the windward side of the square cylinder is negative. This is due to the blocking effect of the disturbing building. The wind pressure on the windward side is expressed as wind suction, and the windward side of the single square cylinder is the wind pressure. When C/L > 3.0, the disturbance factor on the windward side did not change much, and there was still a maximum amplification effect of 2.390 on both sides. There is a clear symmetry between the left and right facade. When 1.5 ≤ C/L ≤ 2.5, both facades show a reduction effect, and the maximum interference factor is only 0.706. When 2.5 ≤ C/L ≤ 3.0, which is exactly the critical spacing ratio, the interference effect changes suddenly from a reduction effect to an amplification effect. The maximum value of the interference factor is located on the windward side of the facade. When C/L ≥ 3.0, the amplification effect of the facade fluctuates with the spacing. The amplitude is only 5%, and the maximum interference factor is 2.235. The leeward side of the square cylinder is less disturbed, and the interference factor increases significantly at the critical spacing ratio, and then gradually decreases to 1.

7. Conclusions

In a uniform flow field with a Reynolds number of 22,000, large eddy simulation calculations were carried out for double-cut square cylinders (10% chamfered ratio) with different spacing ratios, respectively. The flow field distribution characteristics of parallel and tandem square cylinders with tangential angles under different spacing ratios, and the changing laws of aerodynamic coefficients and interference coefficients were studied. The conclusions are as follows:
  • The aerodynamic interference effect of the square cylinder is sensitive to the change of the chamfer. Compared with the standard square cylinder, the aerodynamic coefficient of the chamfered square cylinder is significantly reduced. When 1.5 ≤ B/L < 2.5, the aerodynamic coefficients of the perturbed square cylinders in tandem mode are reduced, the mean drag coefficients in juxtaposition mode are magnified, and the pulsatile lift coefficients are reduced. When 2.5 ≤ B/L ≤ 8.0, the aerodynamic coefficients in all modes show a decreasing effect. The critical spacing ratio of the aerodynamic coefficients of the tandem square cylinders after chamfering is 2.5~3.0, which is smaller than the critical spacing ratio of 3.0~4.5 for standard square cylinders.
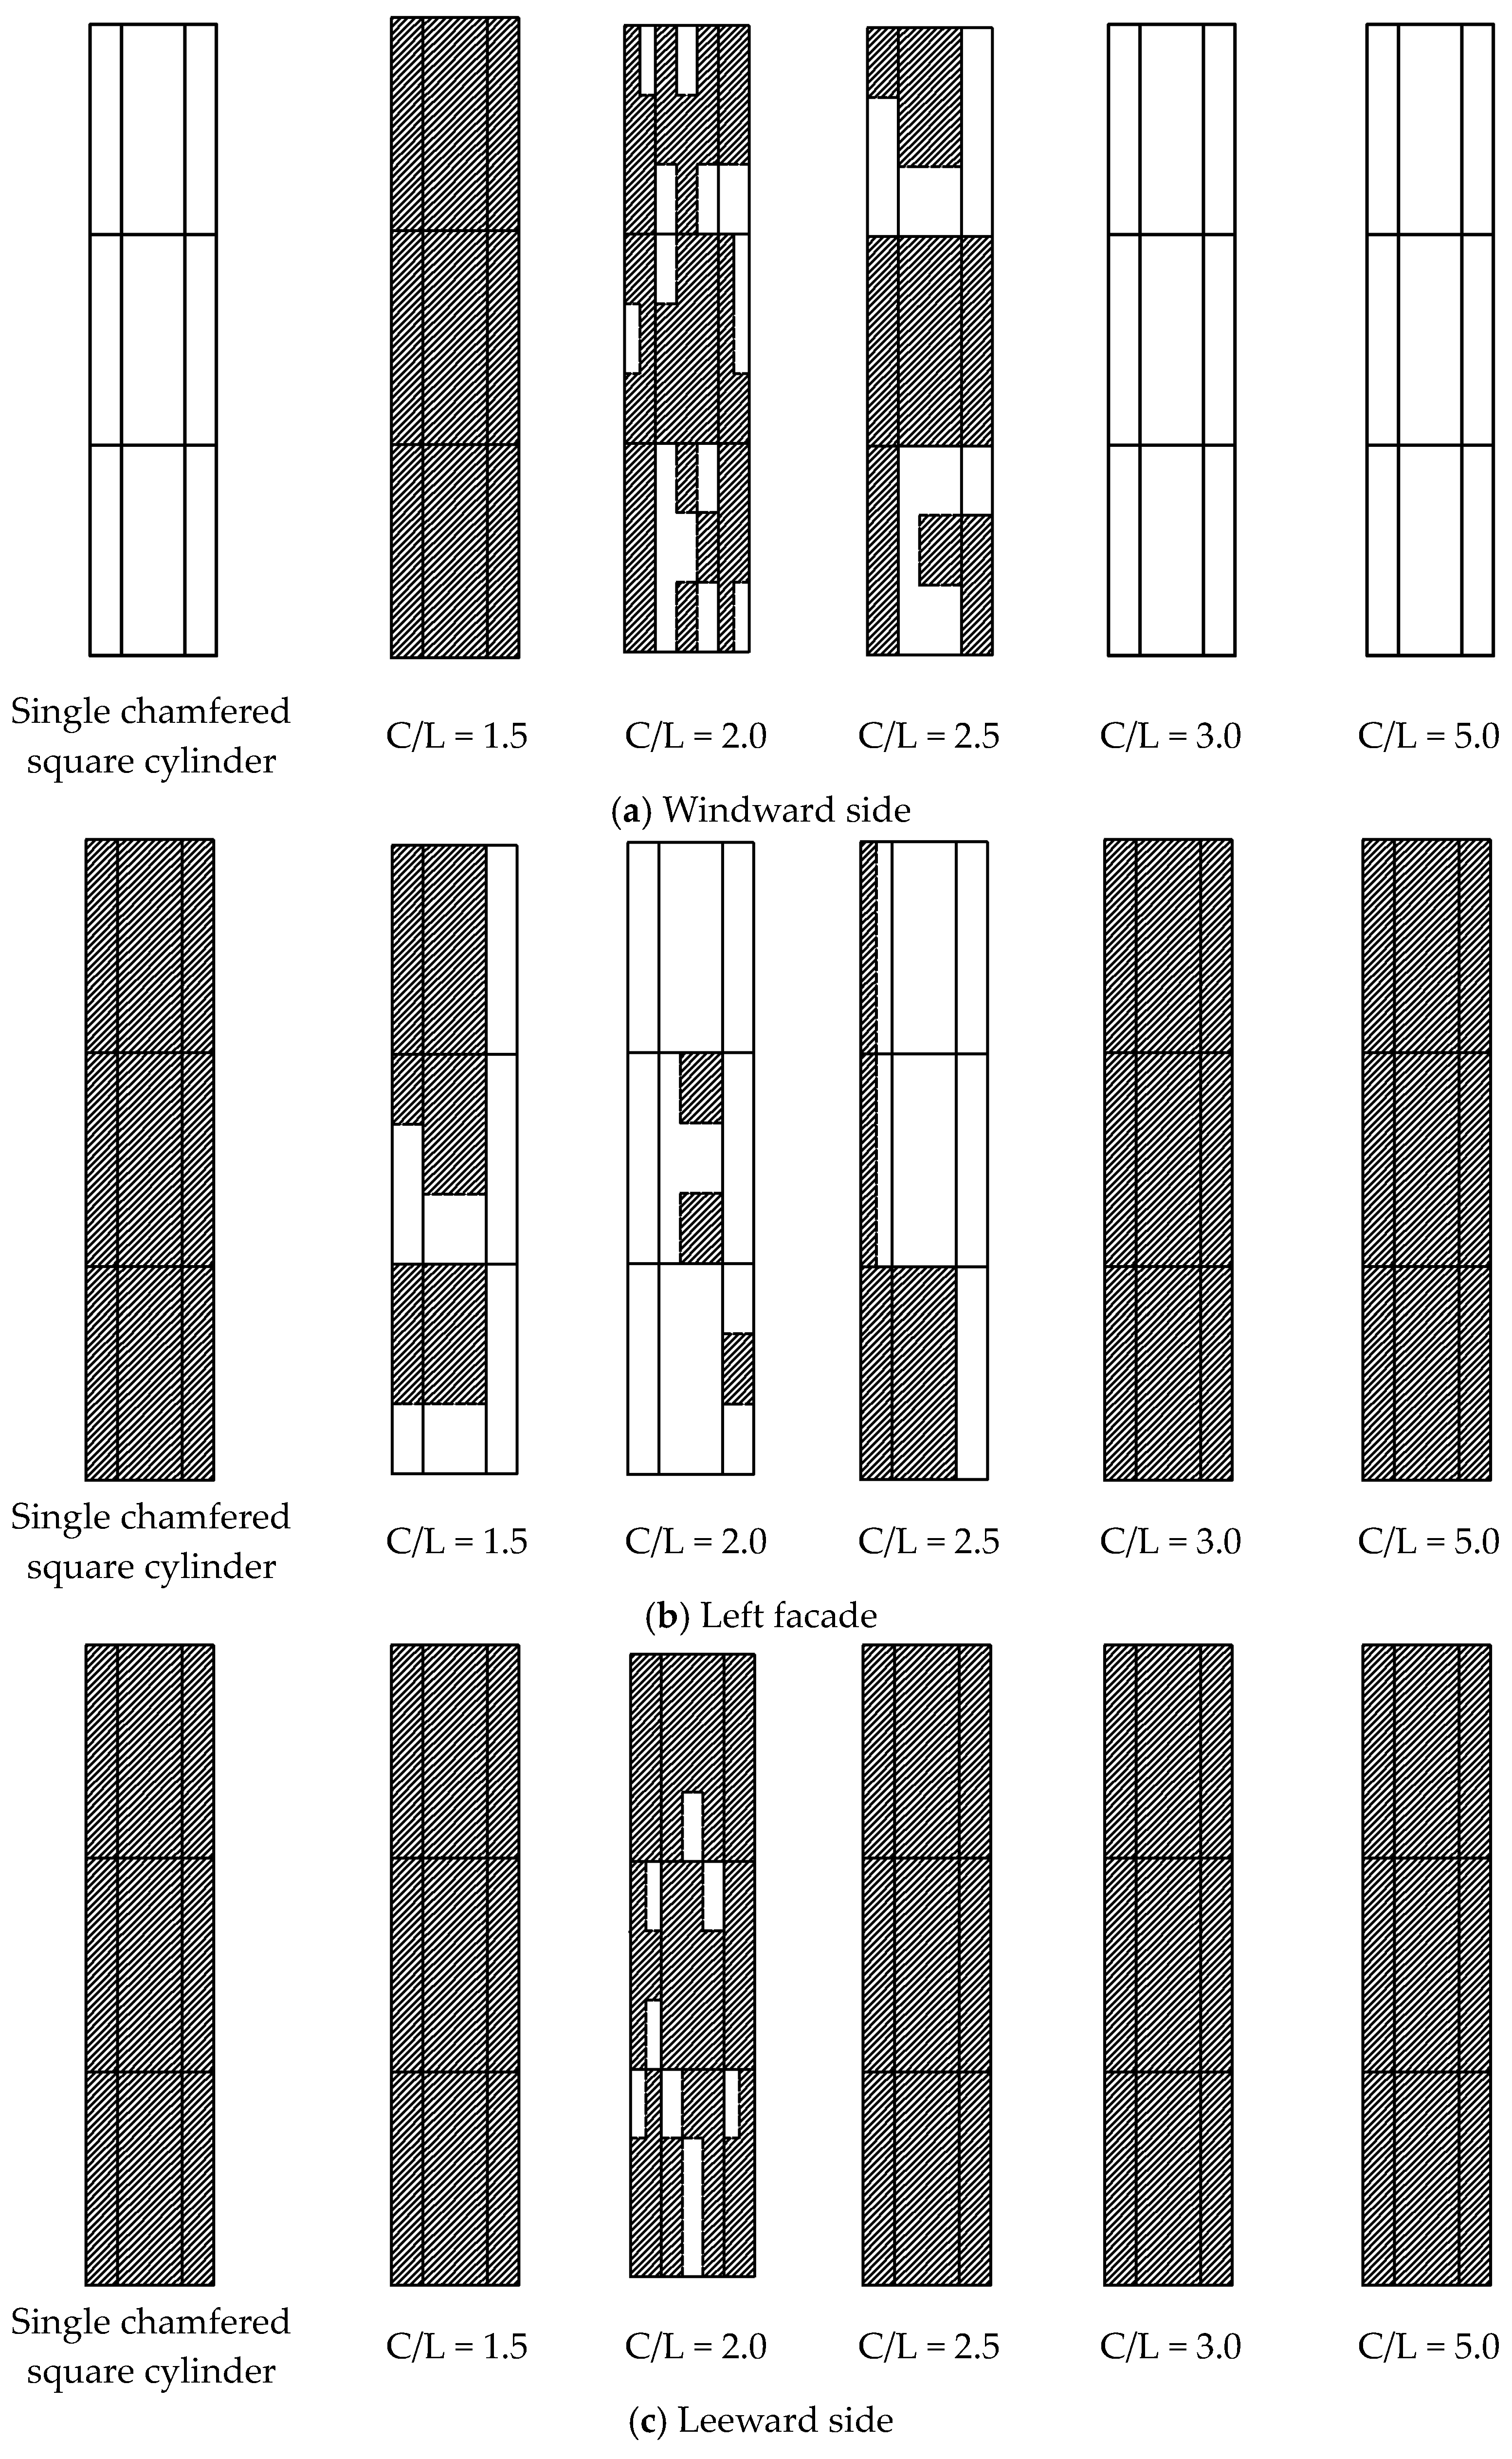
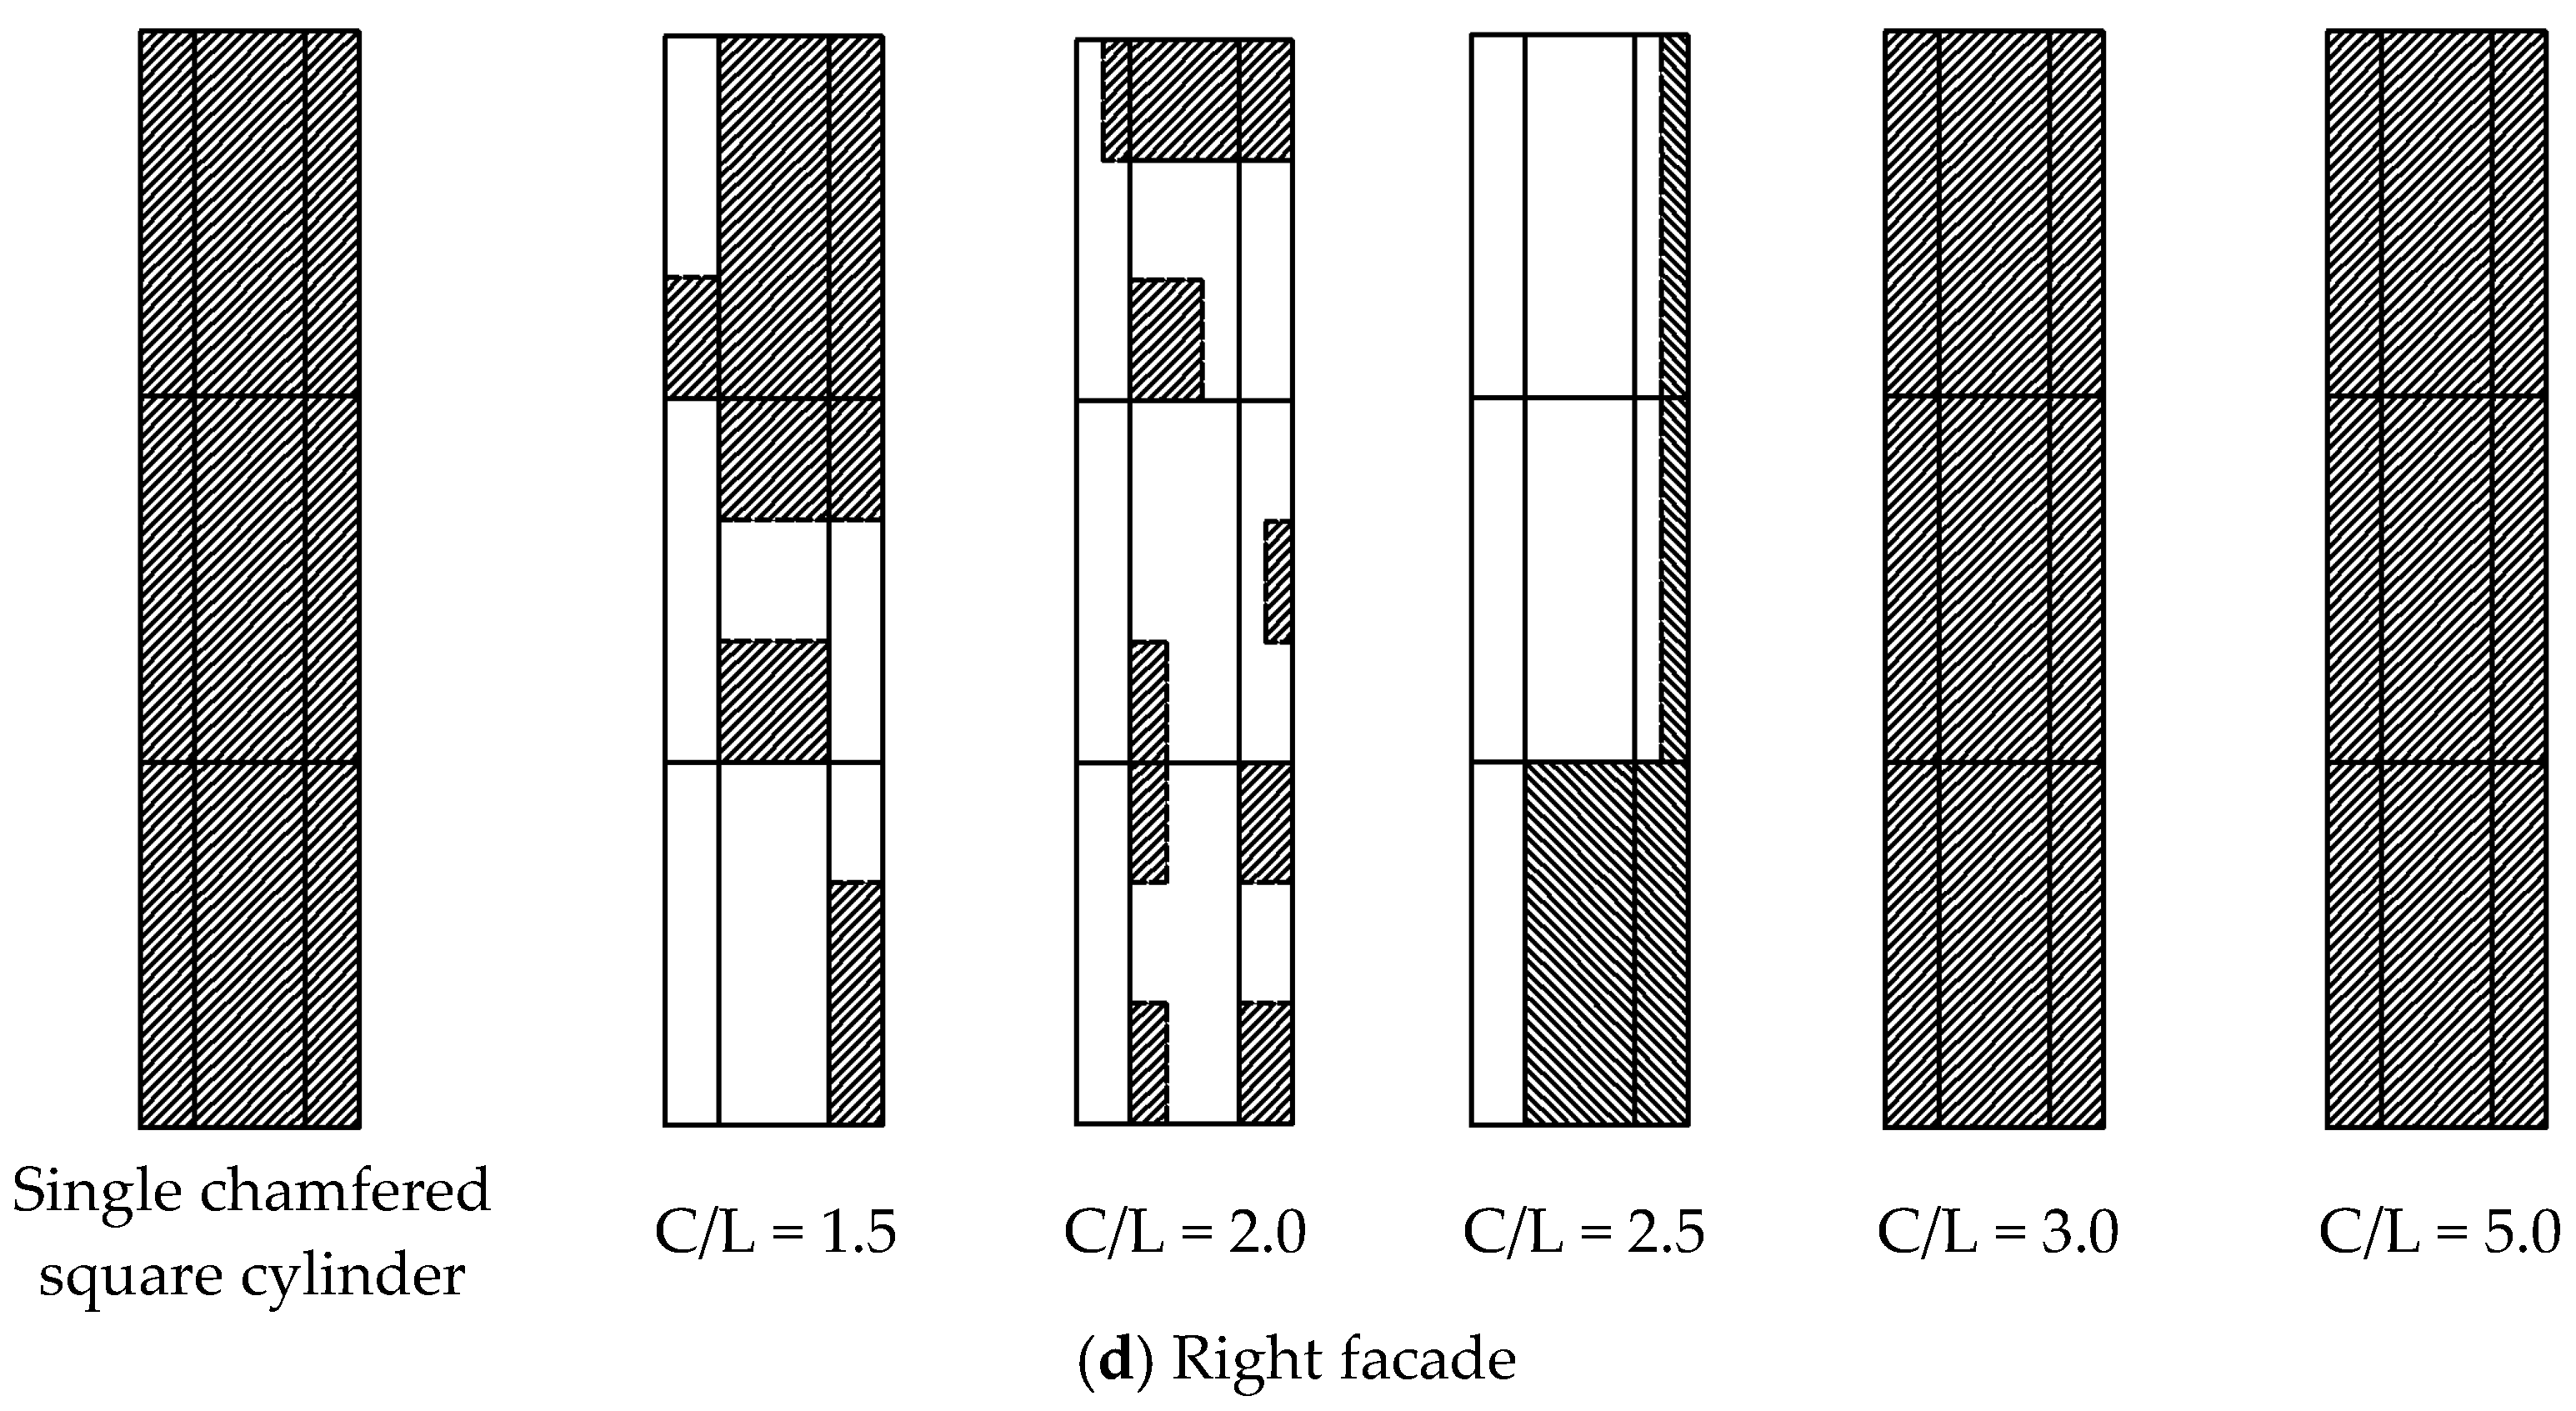
  • Based on other literature, a criterion for the division of non-Gaussian regions is defined in this paper. This is when the absolute value of skewness is greater than 0.2, the absolute value of kurtosis is greater than 3.5, the absolute value of skewness is greater than 0.45, and the absolute value of kurtosis is greater than 4.0. The juxtaposed square cylinders have no obvious characteristics and tend to be single square cylinders when the spacing ratio gradually increases. When the spacing ratio of the tandem square cylinders is less than the critical spacing ratio, the non-Gaussian area of the structure gradually decreases. Additionally, the non-Gaussian region division undergoes abrupt changes when the spacing ratio reaches the critical spacing ratio. Finally, the windward surface shows a Gaussian distribution, and the leeward, left, and right facades all appear in the non-Gaussian regions.
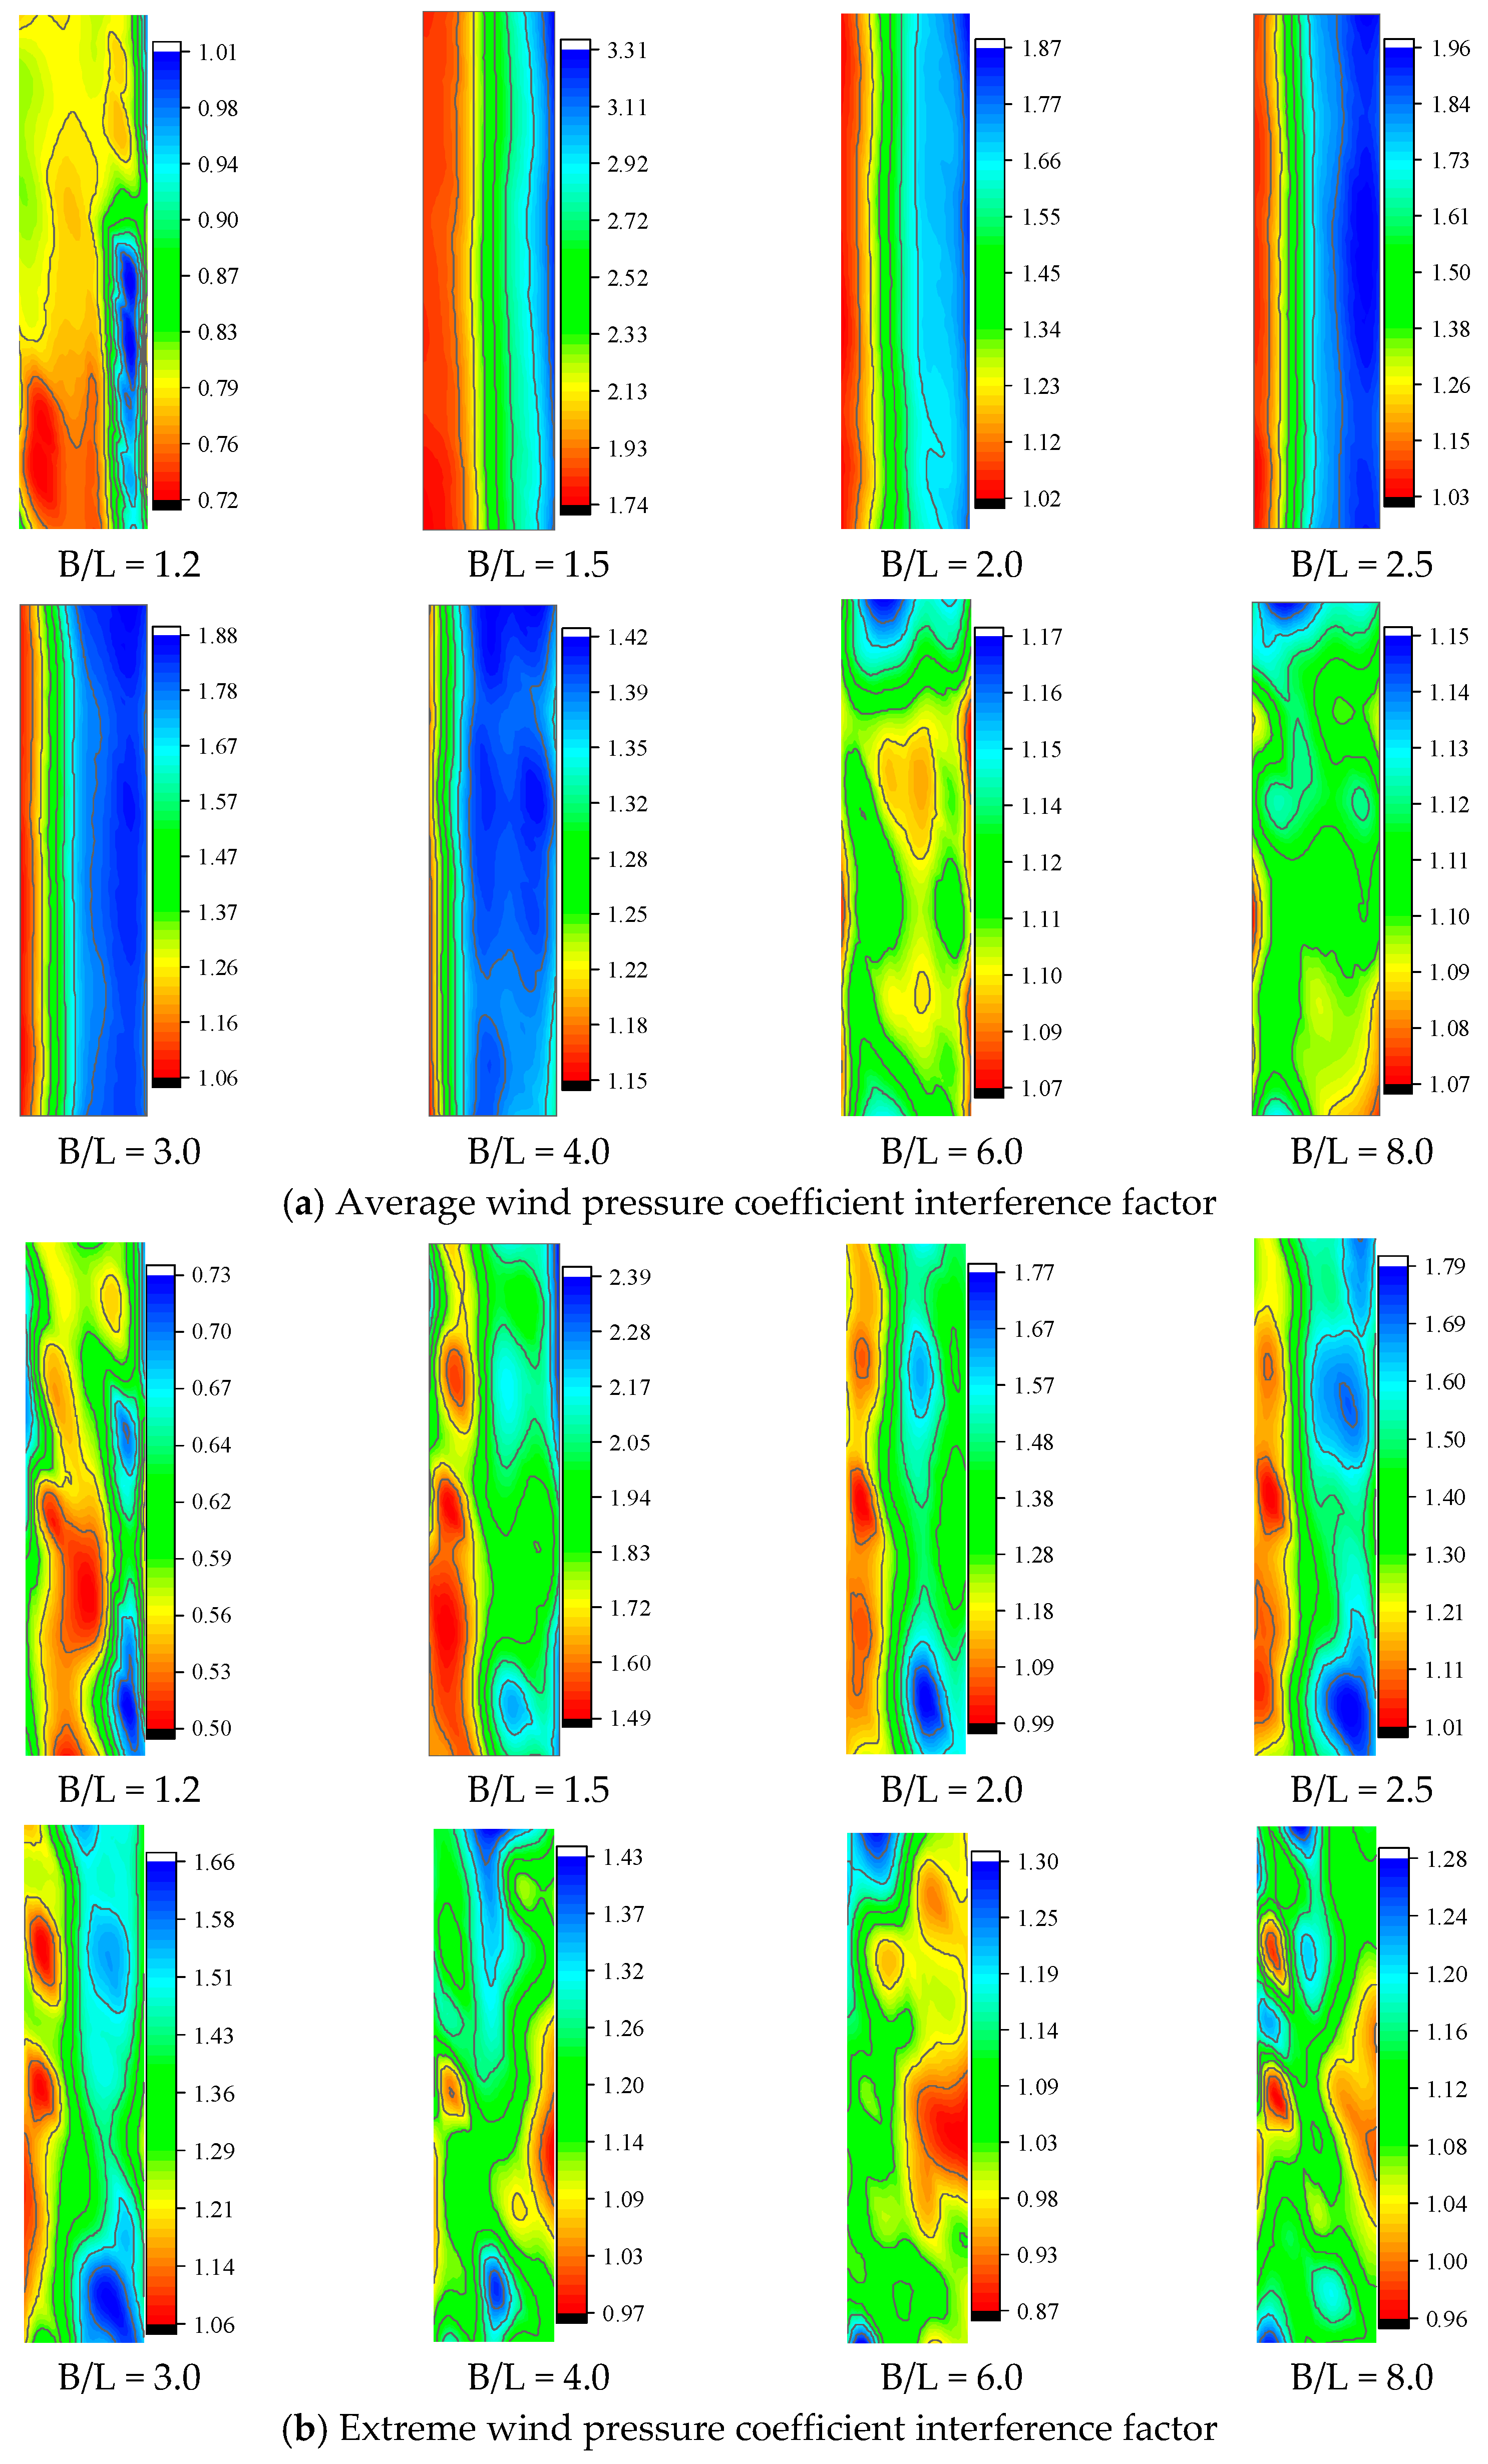
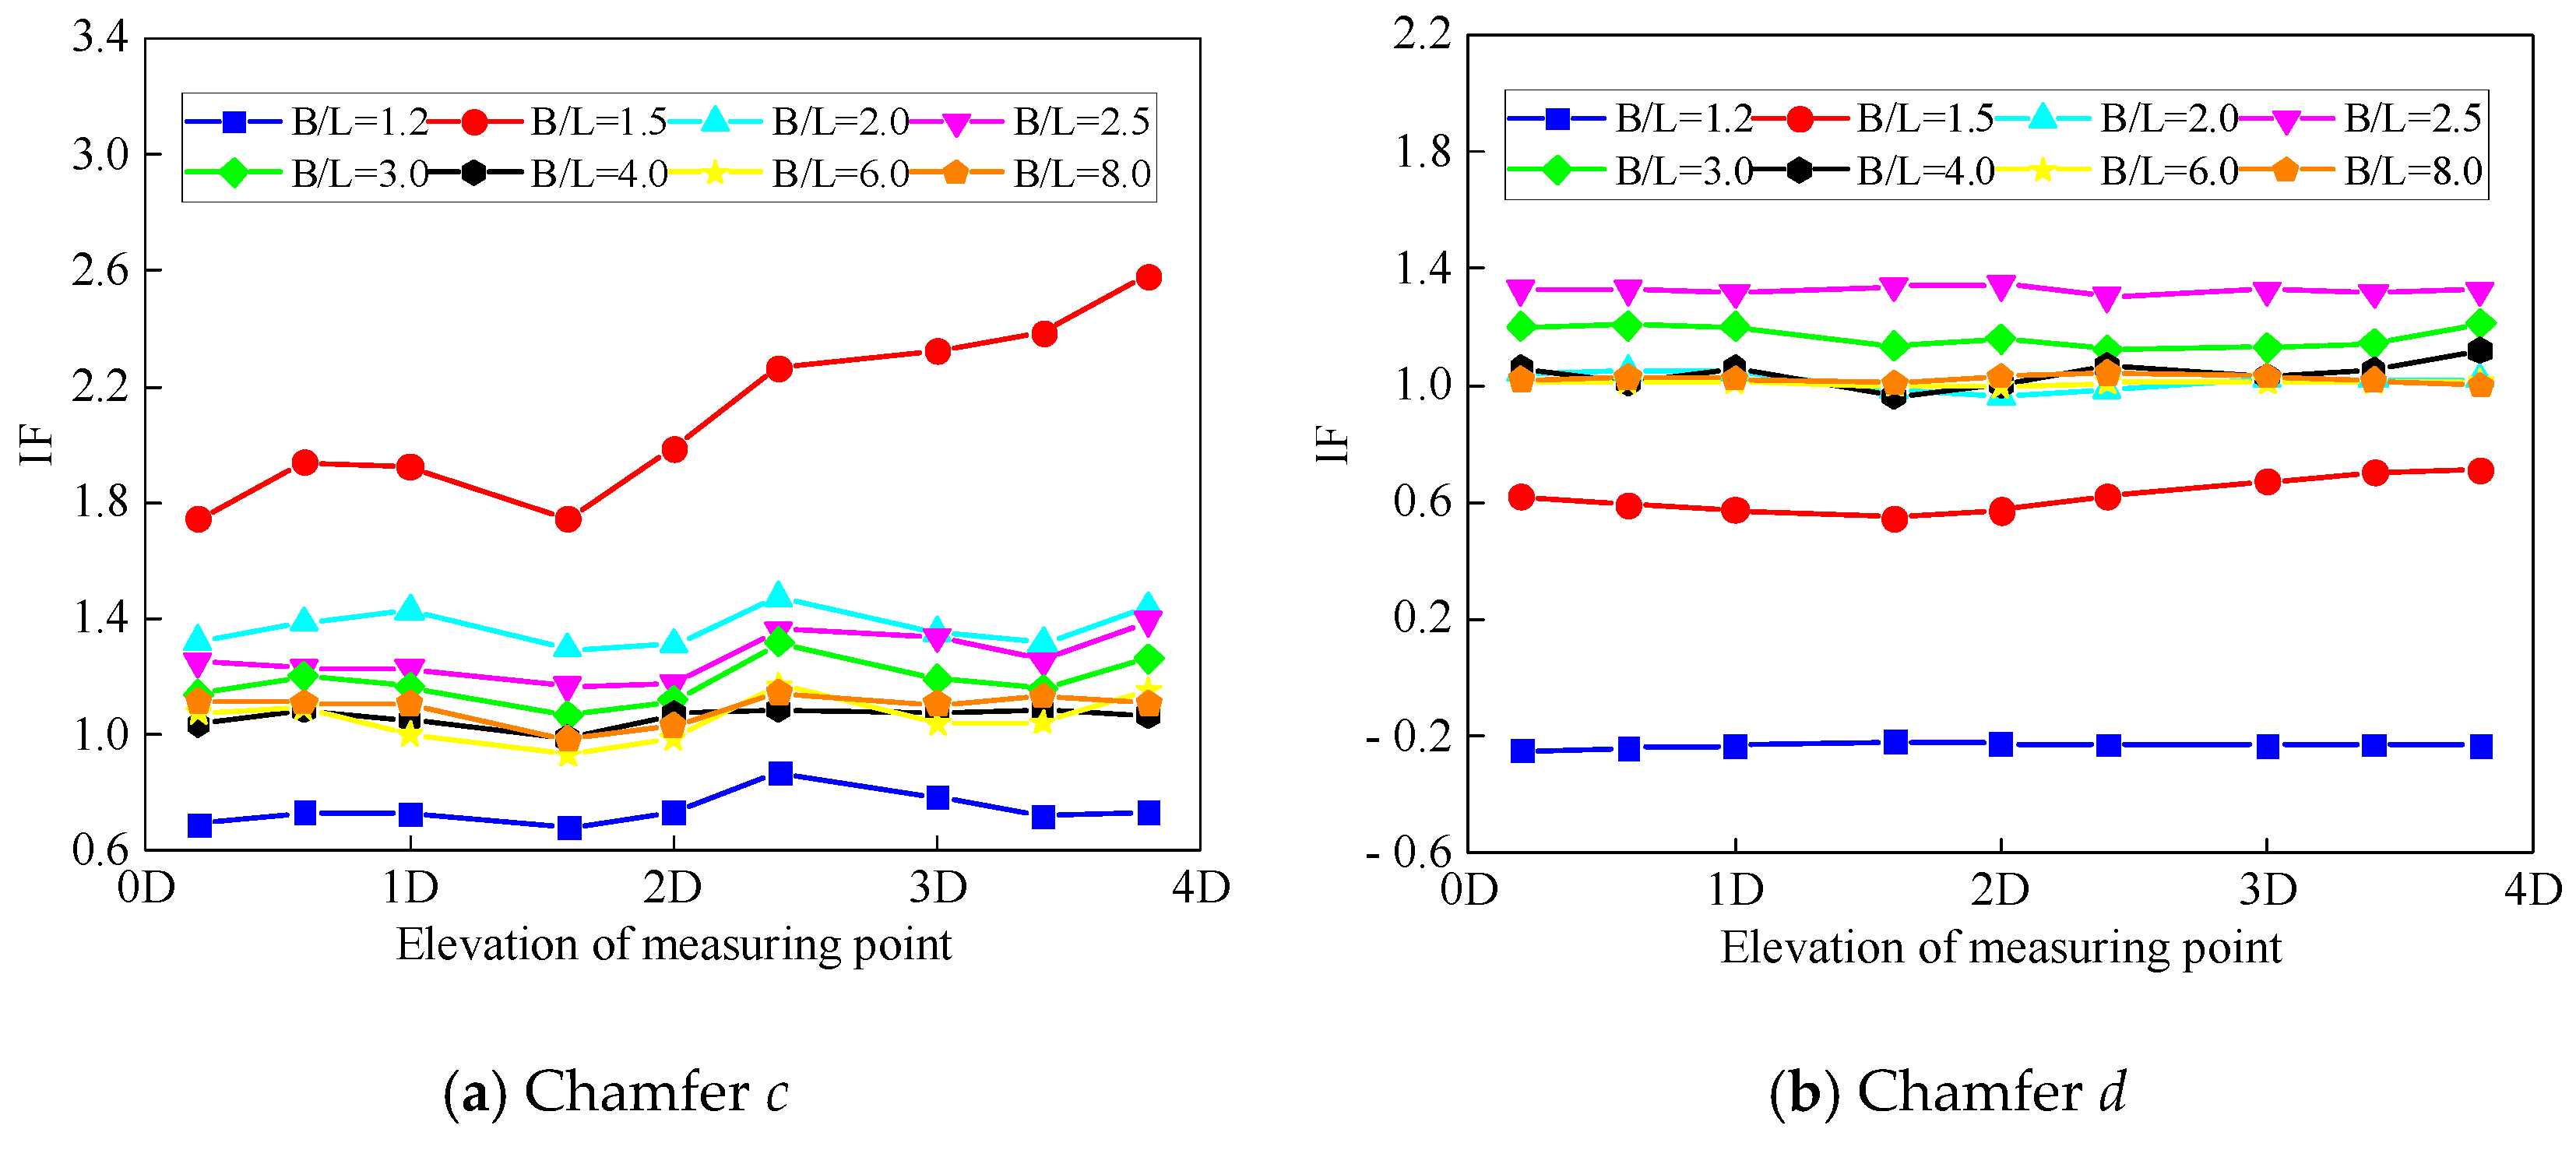
  • Chamfering magnifies the wind pressure interference effect between square cylinders and makes the interference spread more widely. For juxtaposed square cylinders, when B/L = 1.2, the upwind face shows a magnifying effect, while the other facades and tangential angles show a decreasing effect. When B/L = 1.5, the interference factor of the disturbed square cylinder reaches a maximum of 2.58, which is located at the tangent angle c of the rear flow field on the adjacent side. When B/L ≥ 2.5, the interference effects of other facades and tangent angles tend to disappear, except for the left facet. The left facet still has a large interference effect. When B/L = 8.0, there is still a 28% interference effect on the adjacent facades of two square cylinders. For tandem square cylinders, the downstream square cylinder is affected by the “Shelter effect” of the upstream square cylinder. The windward surface wind pressure is the wind suction. The interference factor in this case is negative, and the maximum value is 2.31. When 1.5 ≤ C/L ≤ 2.5, the leeward, left, and right elevations all show a significant reduction effect. When the spacing ratio reaches the critical spacing ratio, the interference factor increases suddenly, but there is still a decreasing effect.

Author Contributions

Conceptualization, J.Z. and F.L.; methodology, J.Z.; software, Z.Z.; validation, J.Z., F.L. and T.Z.; formal analysis, J.Z.; investigation, Z.Z.; resources, F.L.; data curation, C.W.; writing—original draft preparation, J.Z.; writing—review and editing, B.X.; visualization, J.Z.; supervision, Y.Z.; project administration, F.L.; funding acquisition, F.L. All authors have read and agreed to the published version of the manuscript.

Funding

This work was supported by the National Natural Science Foundation of China (50908077).

Institutional Review Board Statement

Not applicable.

Informed Consent Statement

Not applicable.

Data Availability Statement

Data derived from the current study an be provided to readers upon request.

Acknowledgments

All support is gratefully acknowledged.

Conflicts of Interest

The authors declare no conflict of interest.

References

  1. Armitt, J. Wind loading on cooling towers. J. Struct. Div. 1980, 106, 623–641. [Google Scholar] [CrossRef]
  2. Liu, Z. Study on the Law of Interference Effect between High-Rise Buildings on Wind Induced Pressure and Acceleration; Harbin Institute of Technology: Harbin, China, 2019. [Google Scholar]
  3. Luo, S.C.; Yazdani, M.G.; Chew, Y.T.; Lee, T.S. Effects of incidence and after body shape on flow past bluff cylinders. J. Wind Eng. Ind. Aerodyn. 1994, 53, 375–399. [Google Scholar] [CrossRef]
  4. Lyn, D.A.; Einav, S.; Rodi, W.; Park, J.H. A laser-Doppler velocimetry study of ensemble-averaged characteristics of the turbulent near wake of a square cylinder. J. Fluid Mech. 2006, 304, 285–319. [Google Scholar] [CrossRef]
  5. Bearman, P.W.; Obasaju, E.D. An experimental study of pressure fluctuations on fixed and oscillating square-section cylinders. J. Fluid Mech. 1982, 119, 297–321. [Google Scholar] [CrossRef]
  6. Lee, B.E. The effect of turbulence on the surface pressure field of a square prism. J. Fluid Mech. 2006, 69, 263–282. [Google Scholar] [CrossRef]
  7. Rodi, W.; Ferziger, J.H.; Breuer, M.; Pourquie, M. Status of large-eddy simulation: Results of a workshop. J. Fluid Mech. 1997, 119, 248–262. [Google Scholar] [CrossRef]
  8. Cao, Y.; Tamura, T. Large-eddy simulations of flow past a square cylinder using structured and unstructured grids. Comput. Fluids 2016, 137, 36–54. [Google Scholar] [CrossRef]
  9. Rodi, W. Comparison of LES and RANS calculations of the flow around bluff bodies. J. Wind Eng. Ind. Aerodyn. 1997, 69–71, 55–75. [Google Scholar] [CrossRef]
  10. Grigoriadis, D.G.E.; Bartzis, J.G.; Goulas, A. LES of the flow past a rectangular cylinder using the immersed boundary concept. Int. J. Numer. Methods Fluids 2003, 41, 615–632. [Google Scholar] [CrossRef]
  11. Tamura, T.; Ono, Y. LES analysis on aeroelastic instability of prisms in turbulent flow. J. Wind Eng. Ind. Aerodyn. 2003, 91, 1827–1846. [Google Scholar] [CrossRef]
  12. Du, X.; Shi, D.; Dong, H.; Li, Y. Flow around square-like cylinders with corner and side modifications. J. Wind Eng. Ind. Aerodyn. 2021, 215, 104686. [Google Scholar] [CrossRef]
  13. Gu, M.; Xie, Z.N. Interference effects of two and three super-tall buildings under wind action. Acta Mech. Sin. 2011, 27, 687–696. [Google Scholar] [CrossRef]
  14. Mara, T.G.; Terry, B.K.; Ho, T.C.; Isyumov, N. Aerodynamic and peak response interference factors for an upstream square building of identical height. J. Wind Eng. Ind. Aerodyn. J. Int. Assoc. Wind Eng. 2014, 133, 200–210. [Google Scholar] [CrossRef]
  15. Long, D.S.; Yamada, H.; Katsuchi, H. Interference effects of wind-over-top flow on high-rise buildings. J. Wind Eng. Ind. Aerodyn. 2019, 187, 85–96. [Google Scholar] [CrossRef]
  16. Lo, Y.L.; Kim, Y.C.; Li, Y.C. Downstream interference effect of high-rise buildings under turbulent boundary layer flow. J. Wind Eng. Ind. Aerodyn. 2016, 159, 19–35. [Google Scholar] [CrossRef]
  17. Yu, X.F.; Xie, Z.N.; Wang, X.; Cai, B. Interference effects between two high-rise buildings on wind-induced torsion. J. Wind Eng. Ind. Aerodyn. 2016, 159, 123–133. [Google Scholar] [CrossRef]
  18. Yu, X.; Xie, Z.; Gu, M. Interference effects between two tall buildings with different section sizes on wind-induced acceleration. J. Wind Eng. Ind. Aerodyn. 2018, 182, 16–26. [Google Scholar] [CrossRef]
  19. Kim, W.; Tamura, Y.; Yoshida, A. Interference effects on aerodynamic wind forces between two buildings. J. Wind Eng. Ind. Aerodyn. 2015, 147, 186–201. [Google Scholar] [CrossRef]
  20. Kataoka, H. Numerical simulations of a wind-induced vibrating square cylinder within turbulent boundary layer. J. Wind Eng. Ind. Aerodyn. 2008, 96, 1985–1997. [Google Scholar] [CrossRef]
  21. Hui, Y.; Tamura, Y.; Yoshida, A. Mutual interference effects between two high-rise building models with different shapes on local peak pressure coefficients. J. Wind Eng. Ind. Aerodyn. 2012, 104, 98–108. [Google Scholar] [CrossRef]
  22. Hui, Y.; Tamura, Y.; Yang, Q.S. Analysis of interference effects on torsional moment between two high-rise buildings based on pressure and flow field measurement. J. Wind Eng. Ind. Aerodyn. 2017, 164, 54–68. [Google Scholar] [CrossRef]
  23. Yan, B.W.; Li, Q.S. Wind tunnel study of interference effects between twin super-tall buildings with aerodynamic modifications. J. Wind Eng. Ind. Aerodyn. 2016, 156, 129–145. [Google Scholar] [CrossRef]
  24. Bin, L.; Ren, J. Vortex-induced vibrations of a rectangular cylinder. Ocean Eng. 2022, 266, 112883. [Google Scholar] [CrossRef]
  25. Ming, Z.; Teng, W.; Ole, Ø. Vortex-induced vibration control of a flexible circular cylinder using a nonlinear energy sink. J. Wind. Eng. Ind. Aerodyn. 2022, 229, 105163. [Google Scholar] [CrossRef]
  26. Bo, W.; Ming, Z.; Fu, X. Experimental investigation on the vortex-induced vibration of a rectangular 4:1 cylinder under skew winds. J. Wind Eng. Ind. Aerodyn. 2022, 229, 105114. [Google Scholar] [CrossRef]
  27. Tamura, T.; Miyagi, T.; Kitagishi, T. Numerical prediction of unsteady pressures on a square cylinder with various corner shapes. J. Wind Eng. Ind. Aerodyn. 1998, 74, 531–542. [Google Scholar] [CrossRef]
  28. Gu, M.; Quan, Y. Across-wind loads of typical tall buildings. J. Wind Eng. Ind. Aerodyn. 2004, 92, 1147–1165. [Google Scholar] [CrossRef]
  29. Hayashida, H.; Iwasa, Y. Aerodynamic shape effects of tall building for vortex induced vibration. J. Wind Eng. Ind. Aerodyn. 1990, 33, 237–242. [Google Scholar] [CrossRef]
  30. Miyashita, K.; Katagiri, J.; Nakamura, O.; Ohkuma, T.; Tamura, Y.; Itoh, M.; Mimachi, T. Wind-induced response of high-rise buildings Effects of corner cuts or openings in square buildings. J. Wind Eng. Ind. Aerodyn. 1993, 50, 319–328. [Google Scholar] [CrossRef]
  31. Kwok, K.; Wilhelm, P.A.; Wilkie, B.G. Effect of edge configuration on wind-induced response of tall buildings. Eng. Struct. 1988, 10, 135–140. [Google Scholar] [CrossRef]
  32. Zheng, D.; Liu, S.; Ma, W.; Chen, H. Large eddy simulation for effects of chamfering and corner cut on aerodynamic performance of square cylinder. J. Vib. Shock. 2021, 40, 8–14. [Google Scholar] [CrossRef]
  33. Tanaka, H.; Tamura, Y.; Ohtake, K.; Nakai, M.; Yong, C.K. Experimental investigation of aerodynamic forces and wind pressures acting on tall buildings with various unconventional configurations. J. Wind Eng. Ind. Aerodyn. 2012, 107, 179–191. [Google Scholar] [CrossRef]
  34. Kawai, H. Effect of corner modifications on aeroelastic instabilities of tall buildings. J. Wind Eng. Ind. Aerodyn. 1998, 74, 719–729. [Google Scholar] [CrossRef]
  35. Wang, X.; Gu, M. Experimental study on wind pressure distributions of 2-D square prisms with various corner treatments. China Civ. Eng. J. 2016, 49, 79–88. [Google Scholar] [CrossRef]
  36. Nicoud, F.; Ducros, F. Subgrid-Scale Stress Modelling Based on the Square of the Velocity Gradient Tensor. Flow Turbul. Combust. 1999, 62, 183–200. [Google Scholar] [CrossRef]
  37. Yu, X.F.; Xie, Z.N.; Zhu, J.B.; Gu, M. Interference effects on wind pressure distribution between two high-rise buildings. J. Wind Eng. Ind. Aerodyn. 2015, 142, 188–197. [Google Scholar] [CrossRef]
  38. Kumar, K.S.; Stathopoulos, T. Computer simulation of fluctuating wind pressures on low building roofs. J. Wind Eng. Ind. Aerodyn. 1997, 69, 485–495. [Google Scholar] [CrossRef]
  39. Sun, Y.; Wu, Y.; Lin, Z.; Shen, S. Non-Gaussian features of fluctuating wind pressure sonlong span roofs. China Civ. Eng. J. 2007, 40, 1–5. [Google Scholar] [CrossRef]
  40. Lou, W.; Li, J.; Shen, G. Non -Gaussian feature of wind-induced pressure on super-tall building. J. Zhejiang Univ. 2011, 45, 671–677. [Google Scholar] [CrossRef]
  41. Han, N.; Gu, M. Analysis on non -Gaussian features of fluctuating wind pressure on square tall buildings. J. Tongji Univ. 2012, 40, 971–976. [Google Scholar] [CrossRef]
Figure 1. The size of calculation domain.
Buildings 12 02125 g001
Figure 2. Near-wall mesh generation.
Buildings 12 02125 g002
Figure 3. Grid parameters.
Buildings 12 02125 g003
Figure 4. Sketch of tapping location and blocking region of facade.
Buildings 12 02125 g004
Figure 5. Comparison of average wind pressure coefficients [5,6,11,12].
Buildings 12 02125 g005
Figure 6. Comparison of fluctuating wind pressure coefficients [5,6,11,12].
Buildings 12 02125 g006
Figure 7. Variation curve of aerodynamic coefficient of juxtaposed square cylinders with spacing ratio.
Buildings 12 02125 g007
Figure 8. Variation curve of aerodynamic coefficient of tandem square cylinder with spacing ratio.
Buildings 12 02125 g008
Figure 9. Non-Gaussian wind pressure distribution area of parallel square cylinders (filled region).
Buildings 12 02125 g009aBuildings 12 02125 g009b
Figure 10. Non-Gaussian wind pressure distribution area of tandem square cylinder (filled region).
Buildings 12 02125 g010aBuildings 12 02125 g010b
Figure 11. IF contours of the north facade.
Buildings 12 02125 g011
Figure 12. BIF contours of windward facade, leeward facade and south facade.
Buildings 12 02125 g012
Figure 13. IF on chamfered corners at different elevations.
Buildings 12 02125 g013
Figure 14. IF contours of square cylinders.
Buildings 12 02125 g014
Table 1. Analysis of grid convergence and comparison of results.
ProgramFirst Layer Grid SizeWall y+Number of GridsAverage Drag CoefficientPulsating Lift CoefficientStrouhal Number
Case 11 × 10−2 L<105.6 × 1052.0580.8420.132
Case 21 × 10−3 L<2.59.5 × 1052.2721.3390.130
Case 35 × 10−4 L<11.4 × 1062.2691.4280.131
Case 41 × 10−4 L<0.251.8 × 1062.3721.3650.132
Exp [3]2.2101.2600.130
Exp [4]2.1001.6000.132
Exp [5]1.2000.130
Exp [6]2.0501.2200.120
CFD [7]2.3001.1500.130
CFD [8]2.110–2.3001.260–1.5400.130–0.140
CFD [9]2.020–2.2701.150–1.7900.090–0.150
Note: Exp represents the wind tunnel experimental value of the flow around a single square cylinder, and CFD represents the numerical simulation value of the flow around the single square cylinder.
Publisher’s Note: MDPI stays neutral with regard to jurisdictional claims in published maps and institutional affiliations.

