1. Introduction
Construction composite materials capable of electric transmission have recently become a promising and developing technology with many advantages, which can provide a relatively simple solution to various engineering problems. Conductive composite materials with cement as a binder, combining graphite particles and carbon fibers (nanofibers or nanotubes) as active resistivity-reducing fillers, are particularly effective [
1,
2,
3,
4]. The resistivity of dried concrete, according to available resources, ranges from 6.54 × 10
5 to 11.40 × 10
5 Ω∙cm [
1]. The values of resistivity of water-saturated concrete are 100–110 Ω∙cm. The values of resistivity of dry fine-grained, cement-based composites are higher by two orders than those of dried concrete, hence 10
6–10
7 Ω·cm [
2]. Using the above-mentioned combinations makes it possible to achieve resistivity in the order of tens or low hundreds of Ω·cm [
3,
4].
The suitable combination and dosing of graphite and carbon fibers in conductive cement-based materials considerably reduce values of resistivity, which is the most important parameter of so-called “intrinsically intelligent” materials, which also have good thermal–technical properties and enhanced tensile strength and show a thermoelectric effect [
5,
6,
7]. The thermoelectric or Peltier–Seebeck effect is a thermodynamically reversible process. It is manifested by the generation of electric potential, based on different temperatures on different sides of a thermoelectric cell, or by transferring heat energy from one side of the cell to the other if electric potential is supplied.
An electrically conductive cement-based composite can become a thermoelectric cell if two sufficiently different conductive fillers are used. A sufficient difference in electrically conductive fillers means a different number of free electrons, which guarantees a sufficient voltage difference caused by temperature differences. Using the Peltier–Seebeck effect can diversify the range of functions of intelligent structures [
6,
7].
The first use of advanced functions of electrically conductive cement composites in the heating of transportation or structural constructions was to remove snow or ice from their surfaces. Structures made from electrically conductive composites with two different conductive fillers were heated during current passage by the Joule heating principle, as well as by the heat created on the basis of the Peltier–Seebeck effect [
1,
6,
7,
8,
9,
10].
There are also studies and projects focusing on the utilization of reverse thermoelectric effects to use waste heat and transfer it to clean electric energy [
11].
The shielding of the electromagnetic interference (EMI) is another function of conductive cement-based composites. The most harmful and undesirable microwave radiations, with wavelengths from 1 mm to 1 m and radio radiation with wavelengths longer than 1 m, are effectively shielded when parametrically different conductive fillers are used [
12,
13,
14].
Another important function of, in this case, actually ’intelligent‘ material, is Structural Health Monitoring (SHM). The combination of piezoresistive sensory properties with thermoelectric power open possibilities for monitoring many parameters, such as the pace of reinforcement corrosion, internal humidity, pH value, mechanical (compressive, tensile, and tangential) tension, deformation, or direct defects of construction in real time [
15,
16,
17].
Other similar functions of conductive composites in a different application field are the transportation structures capable of monitoring traffic. They use identical principles for gaining the structure parameters, in this case the carriage way, and these are processed by software to traffic data [
17,
18].
All these applications are closely tied to monitoring the effects of external conditions on piezoresistive and thermoelectric properties of conductive cement-based composites. The work, as such, is focused on research of the influence and its impact. Then, it becomes also necessary to study and archive long-term data concerning the development of exposure conditions for given times and places where the structures are built. Exposure conditions capable of considerably altering the observed parameters of conductive cement-based composites are humidity, temperature, mechanical load of the structure, and effects of CO
2 [
2].
Air humidity, rain, or melting snow are exposures impacting the humidity bound within the structure of cement-based composites. Several studies have experimentally confirmed that reducing humidity in plain mastic cement, modified mastic cement, and mastic cement with conductive carbon fibers, increases their impedance. Vice versa, increasing humidity causes decreasing impedance. It was confirmed that humidity has an effect on the electrical conductivity of cement composite materials.
The effect of humidity on the thermoelectric properties of cement composites was not proven, while on the other hand, the effect of humidity on piezoresistive properties was confirmed [
2,
11]. These findings are in correlation with the fact that humidity contributes to electrical conductivity of the material by the ion conductivity of H
+ and OH
− ions, which cannot take part in the Peltier–Seebeck effect, nor can they be influenced by it.
Ions creating solutions in the pores contributes to electric conductivity. Increasing the content of humidity causes higher amounts of solution in the pores, and ions can actively contribute to the transfer of electric charges. For this reason, as the impedance or resistivity is lowered, the humidity of the material is raised. As humidity increases, the piezoresistive properties of the materials become unstable [
19,
20,
21,
22]. One study showed that, to the contrary, humidity can increase resistivity. This was found in an experiment where removing water from samples of cement with CNFs caused a further reduction in impedance. The authors of the research ascribe this phenomenon to humidity encapsulating electrically conductive particles with a water film to various extents. Water can also penetrate between individual layers of graphite and increase the electrical contact resistance. Wet samples may also show electric polarization, which causes a reverse electric field. All these aspects may result in increased resistivity [
11,
23].
The electrical resistivity of cement composites with a proportion of fillers based on carbon has the same dependance on temperature as all semiconductors; i.e., resistivity decreases with increasing temperature. However, actual structures face both high temperatures, as well as temperatures below zero. In general, frost resistance is a crucial parameter of silicate-based composites, and this becomes even more important for conductive composites. Freezing can cause considerable damage to conductive microstructures, which high temperatures cannot cause.
As Cao and Chung state in their research, cyclical freezing from 52 °C to −20 °C causes an irreversible increase in resistivity for the material, while cycling from 52 °C to 0 °C causes no permanent changes. Hence, it is clear that permanent changes in the cracks and pores cause an irreversible increase in the electrical resistivity that is caused by growth as well as the thawing of ice in the porous structures of the material. The created microcracks are the reason for interrupted continuous conductive paths created by conductive fillers dispersed in the material [
2,
24,
25]. Ding and colleagues, in their research, prove that the relationship between the number of freezing cycles and impedance is almost linear [
26].
The effect of temperature on the resistivity is based on two mutually independent phenomena [
27,
28].
The first phenomenon is the dependence of the resistivity of carbon in the form of graphite on temperature, which is caused by the thermal dependence of relaxation time (mobility). As temperatures increase, the amplitude of the oscillation of ions grows as well, and the probability of a collision of electrons with ions is higher. The relaxation time is the mean value of the time between two collisions. The relaxation time shortens with increasing temperature, which causes a decrease in the conductivity of conductors or semiconductors, and resistivity increases. Carbon in the form of graphite is a proper semiconductor, and proper semiconductors show another important phenomenon. When a semiconductor is thermally activated, its concentration of electric charge carriers increases. The resulting resistivity of the graphite decreases with increasing temperature [
27].
The second phenomenon Is the mobility of the ions in the solution in the pores, which also increases with an increasing temperature of the solution, and, as a consequence, ion conductivity increases as well. The conductivity continues increasing up to the moment when the solution in the pores evaporates, and ion conductivity rapidly decreases, because the ion conductivity of water vapor is considerably lower than that of liquid water. As the temperature decreases, the mobility of the ions in the solution in the pores decreases, while 0 °C is the lower limit at which the physically bound water in the pores changes to ice and the ion conductivity of ice is close to zero [
22,
28,
29].
As regards the influence of CO
2, there are not many relevant scientific studies available. Extensive research by Mr. Gawel [
30] focuses on the influence of carbonation on the electrical resistivity in cement-based composites with carbon nanotubes CNTs over the course of 136 days. Based on these findings, the resistivity of samples considerably increases during the first phase of carbonation, i.e., during the first hours and days. Carbonation develops from the surface, and CaCO
3 is leached out because of a pH decrease. The carbonated layer, from which CaCO
3 is dissolved, changes into a porous layer. The leached CaCO
3 precipitates again; however, it takes up a larger space than the reacting hydrocarbon. This leads to a reduction in the porosity of the carbonated cement matrix. This can disturb the continuity of the conductive network of CNFs created during the hydration of the cement.
This phenomenon is thought to be the cause of increasing electrical resistivity in given areas. The leaching and the precipitation of calcium carbonate cause a disruption of the continuous conductive network of CNFs. In time, CaCO
3 is corroded by alkali products in the cement matrix. In this area, there is probably potential to renew the continuity of the conductive network of CNFs and prevent an increase in electrical resistivity in the sample. In fact, after 50 days of carbonation, some stagnation can be observed on the curve showing increases in electrical resistivity. Later, as the volume of layers with depleted carbon prevails, resistivity decreases in the carbonated layer. It is assumed that both precipitation and the leaching of CaCO
3 have a considerable influence on the electrical resistivity. The measured electrical resistivity of the carbonated samples of electrically conductive cement composites is a sum of the individual electrical resistance of areas reacting differently. There is an assumption that continuing the process of carbonation causes further decreases in the electrical resistivity in the sample [
30,
31,
32,
33,
34].
The dependence of resistivity of silicate-based composites on load is a topic of many studies, in particular, their self-sensing ability, which is closely connected with loading [
23,
35,
36,
37]. Changes in resistivity, depending on changes in the load acting upon the structure, which, thanks to its material composition, is capable of self-sensing, is the main observed parameter of such structures. The influence of humidity, temperature, or CO
2, as external factors, is mostly undesirable [
38].
The effort will focus on a maximum possible elimination of resistivity changes caused by the external conditions of actual constructions. The purpose of the development of a self-sensing ability within structural composites is the early detection of overloading or wear upon the structure [
39]. Typically, the resistivity of electrically conductive composites decreases as loads increase. This trend is identical for most such commonly used active fillers, such as carbon nanotubes (CNTs) [
40,
41], carbon fibers [
41], crushed lamellar graphite [
42], steel fibers [
43], and others [
39].
An important aspect connected with all above-mentioned influences on the resistivity of cement composites is their proportion of active filler. The properties of electrically conductive composites, in particular, piezoresistivity and resistivity, are highly dependent on the filler. The theory of electrical percolation describes the various behaviors of composites, depending on their proportion of electrically-conductive materials to the inert matrix and other components of the composite material. The
percolation threshold is an important term of percolation theory. It is the percent proportions of electrically conductive fillers in cement composites, which, if exceeded, significantly changes the properties of the given composite materials. Typically, electrical conductivity increases abruptly by several orders (resistivity decreases) [
22,
29,
44,
45,
46,
47].
Previous works focused mostly on proving the influence of partial physical states on the resistivity of cement composites. This work focuses on both verifying and highlighting the different behaviors of electrically conductive cement composites with different dosages of electrically conductive fillers caused by various external conditions.
2. Materials
The matrix of the test samples was made of cement paste, which consisted only of Portland cement, electrically conductive fillers, and mixing water. Such a simple composition was chosen to reduce possible variable factors that could affect the results.
As a binder, Portland CEM I 42.5 R cement was used, according to EN 197-1 [
48]. The basic properties of the cement were laboratory-verified. The specific surface was tested according to EN 196-6 [
49], and Blaine, the specific surface of the cement CEM I 42.5 R used, was 411 m
2/kg. Specific weight was determined to 3130 kg/m
3 according to the ČSN 72 2113 standard “Determination of density of cement” [
50]. Resistivity was determined using the GW Instek LCR 6020. Because the determination of the resistivity of powdered raw materials was not specified by a standard, a procedure from previous research was used, which was similarly focused, and the results are therefore both comparable and repeatable. The cement resistivity was 1.03 × 10
6 Ω·cm [
51].
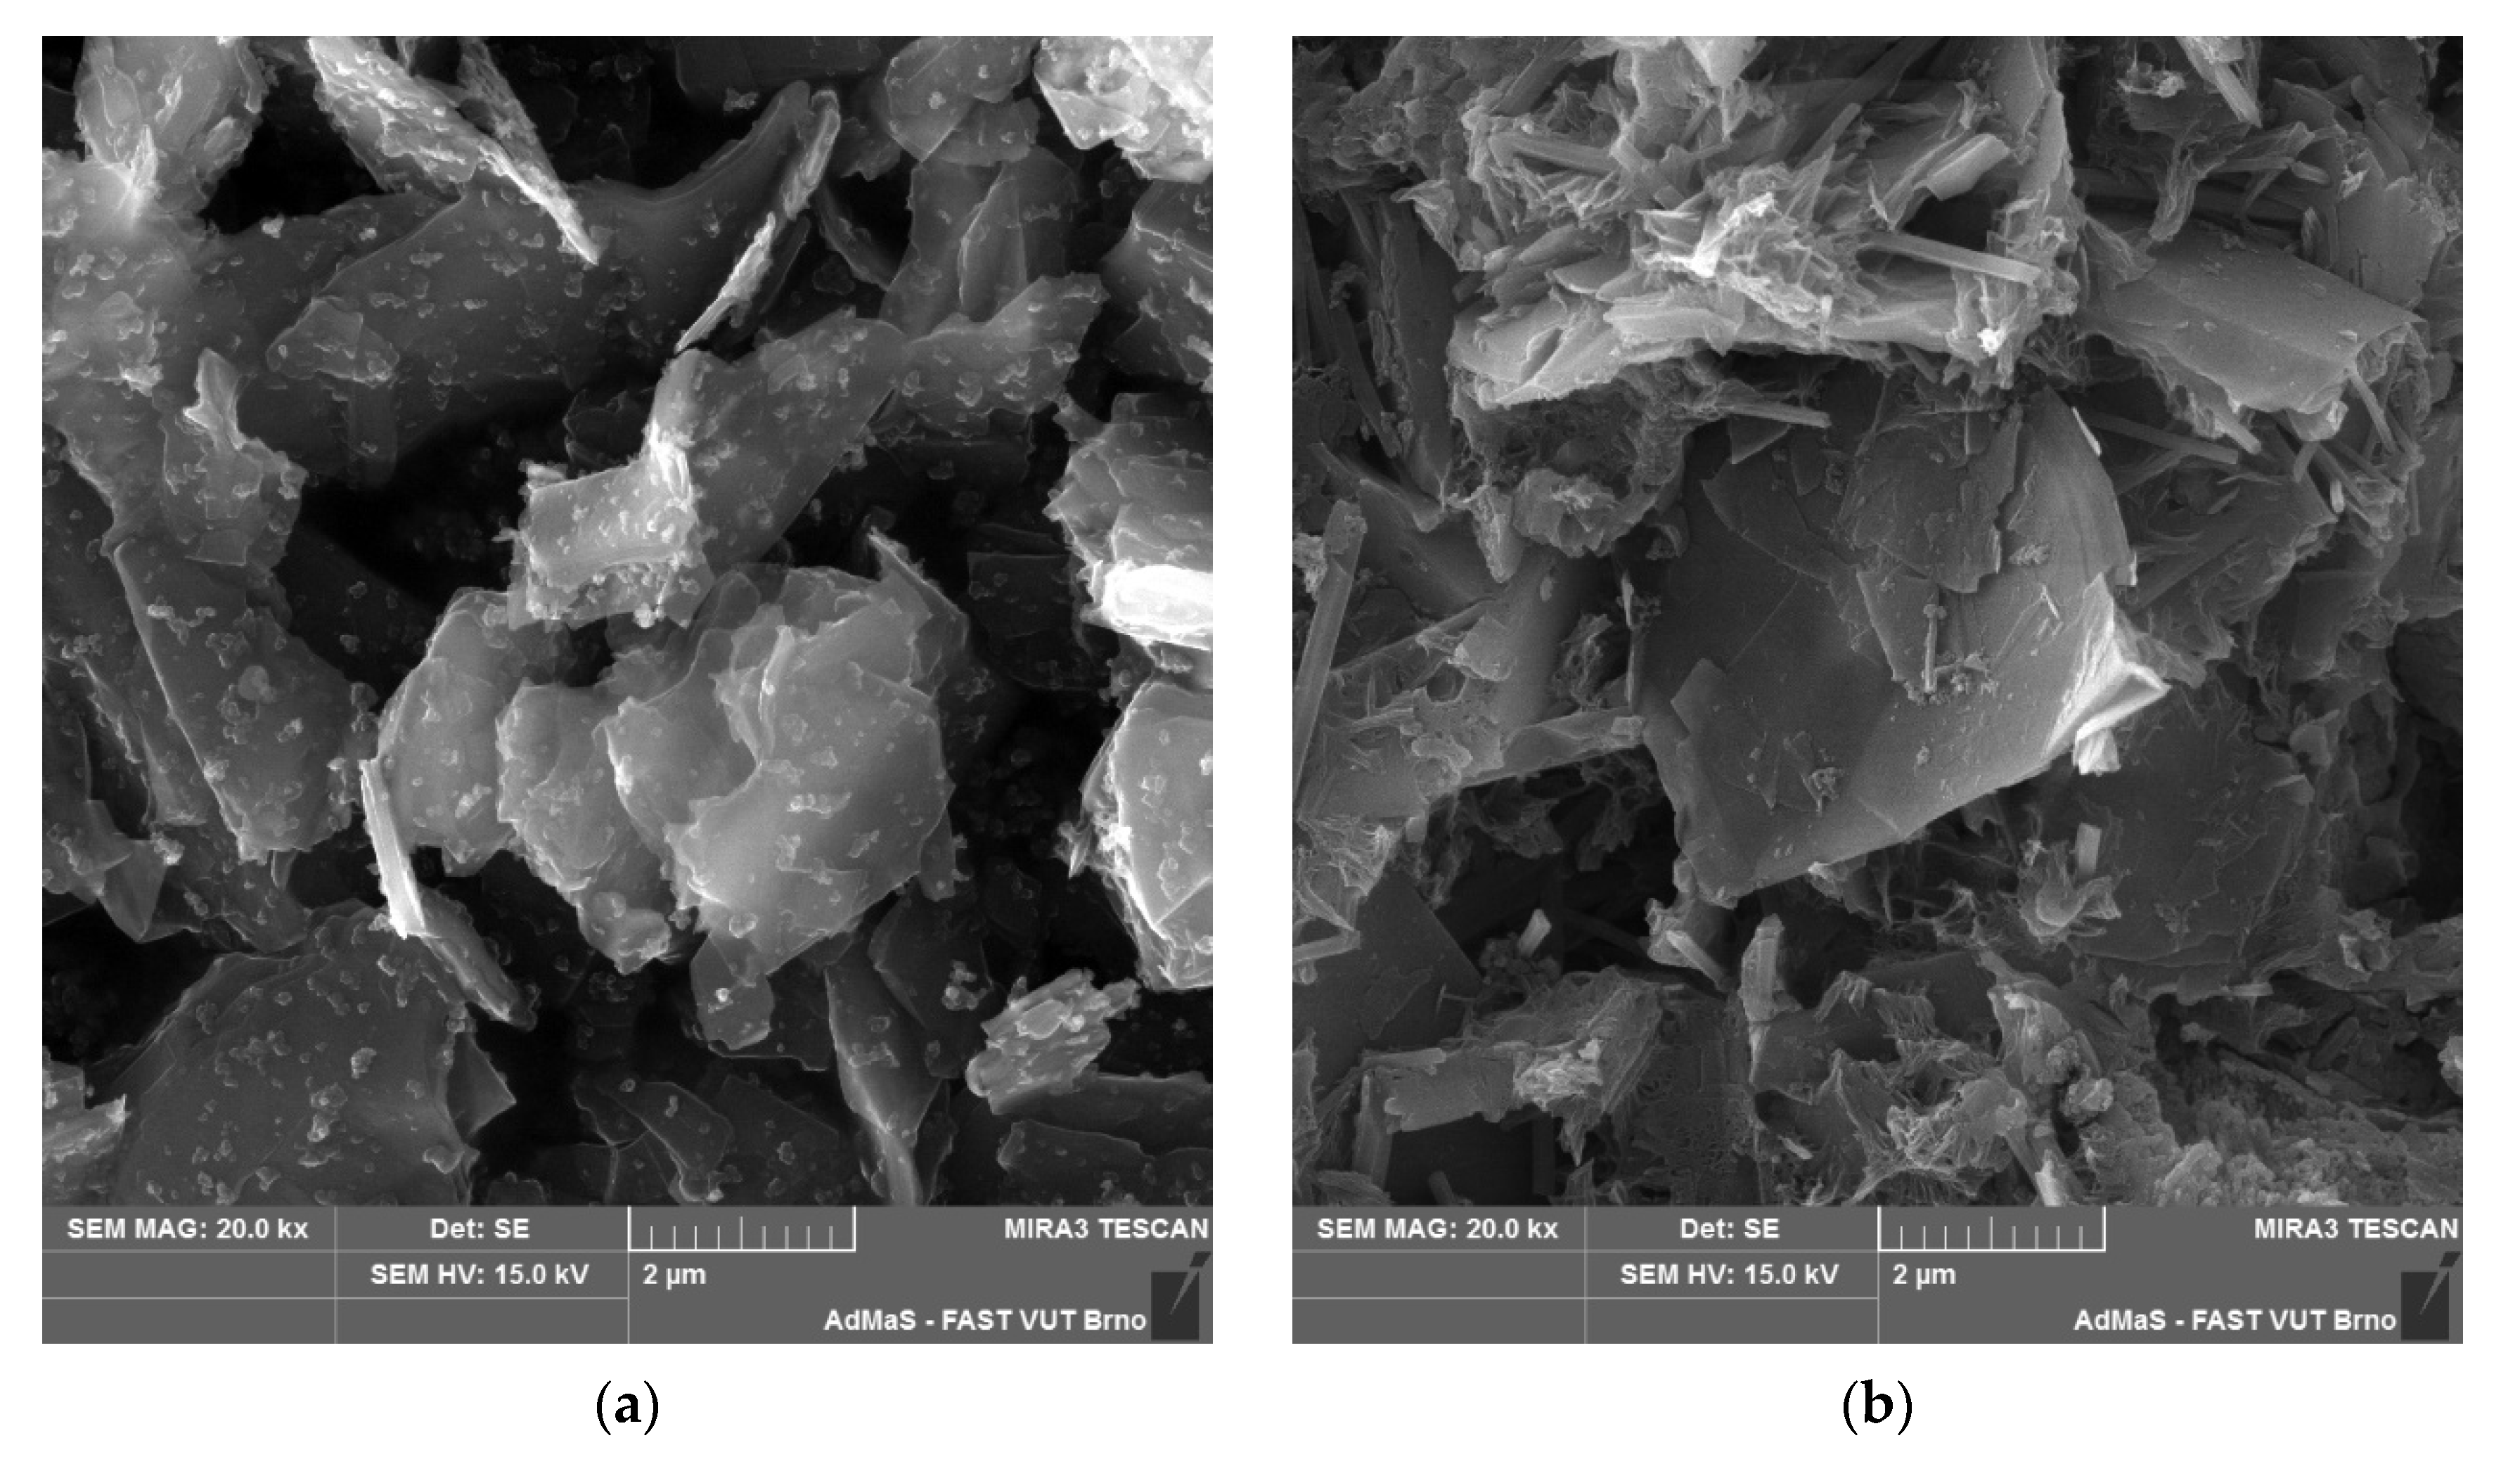
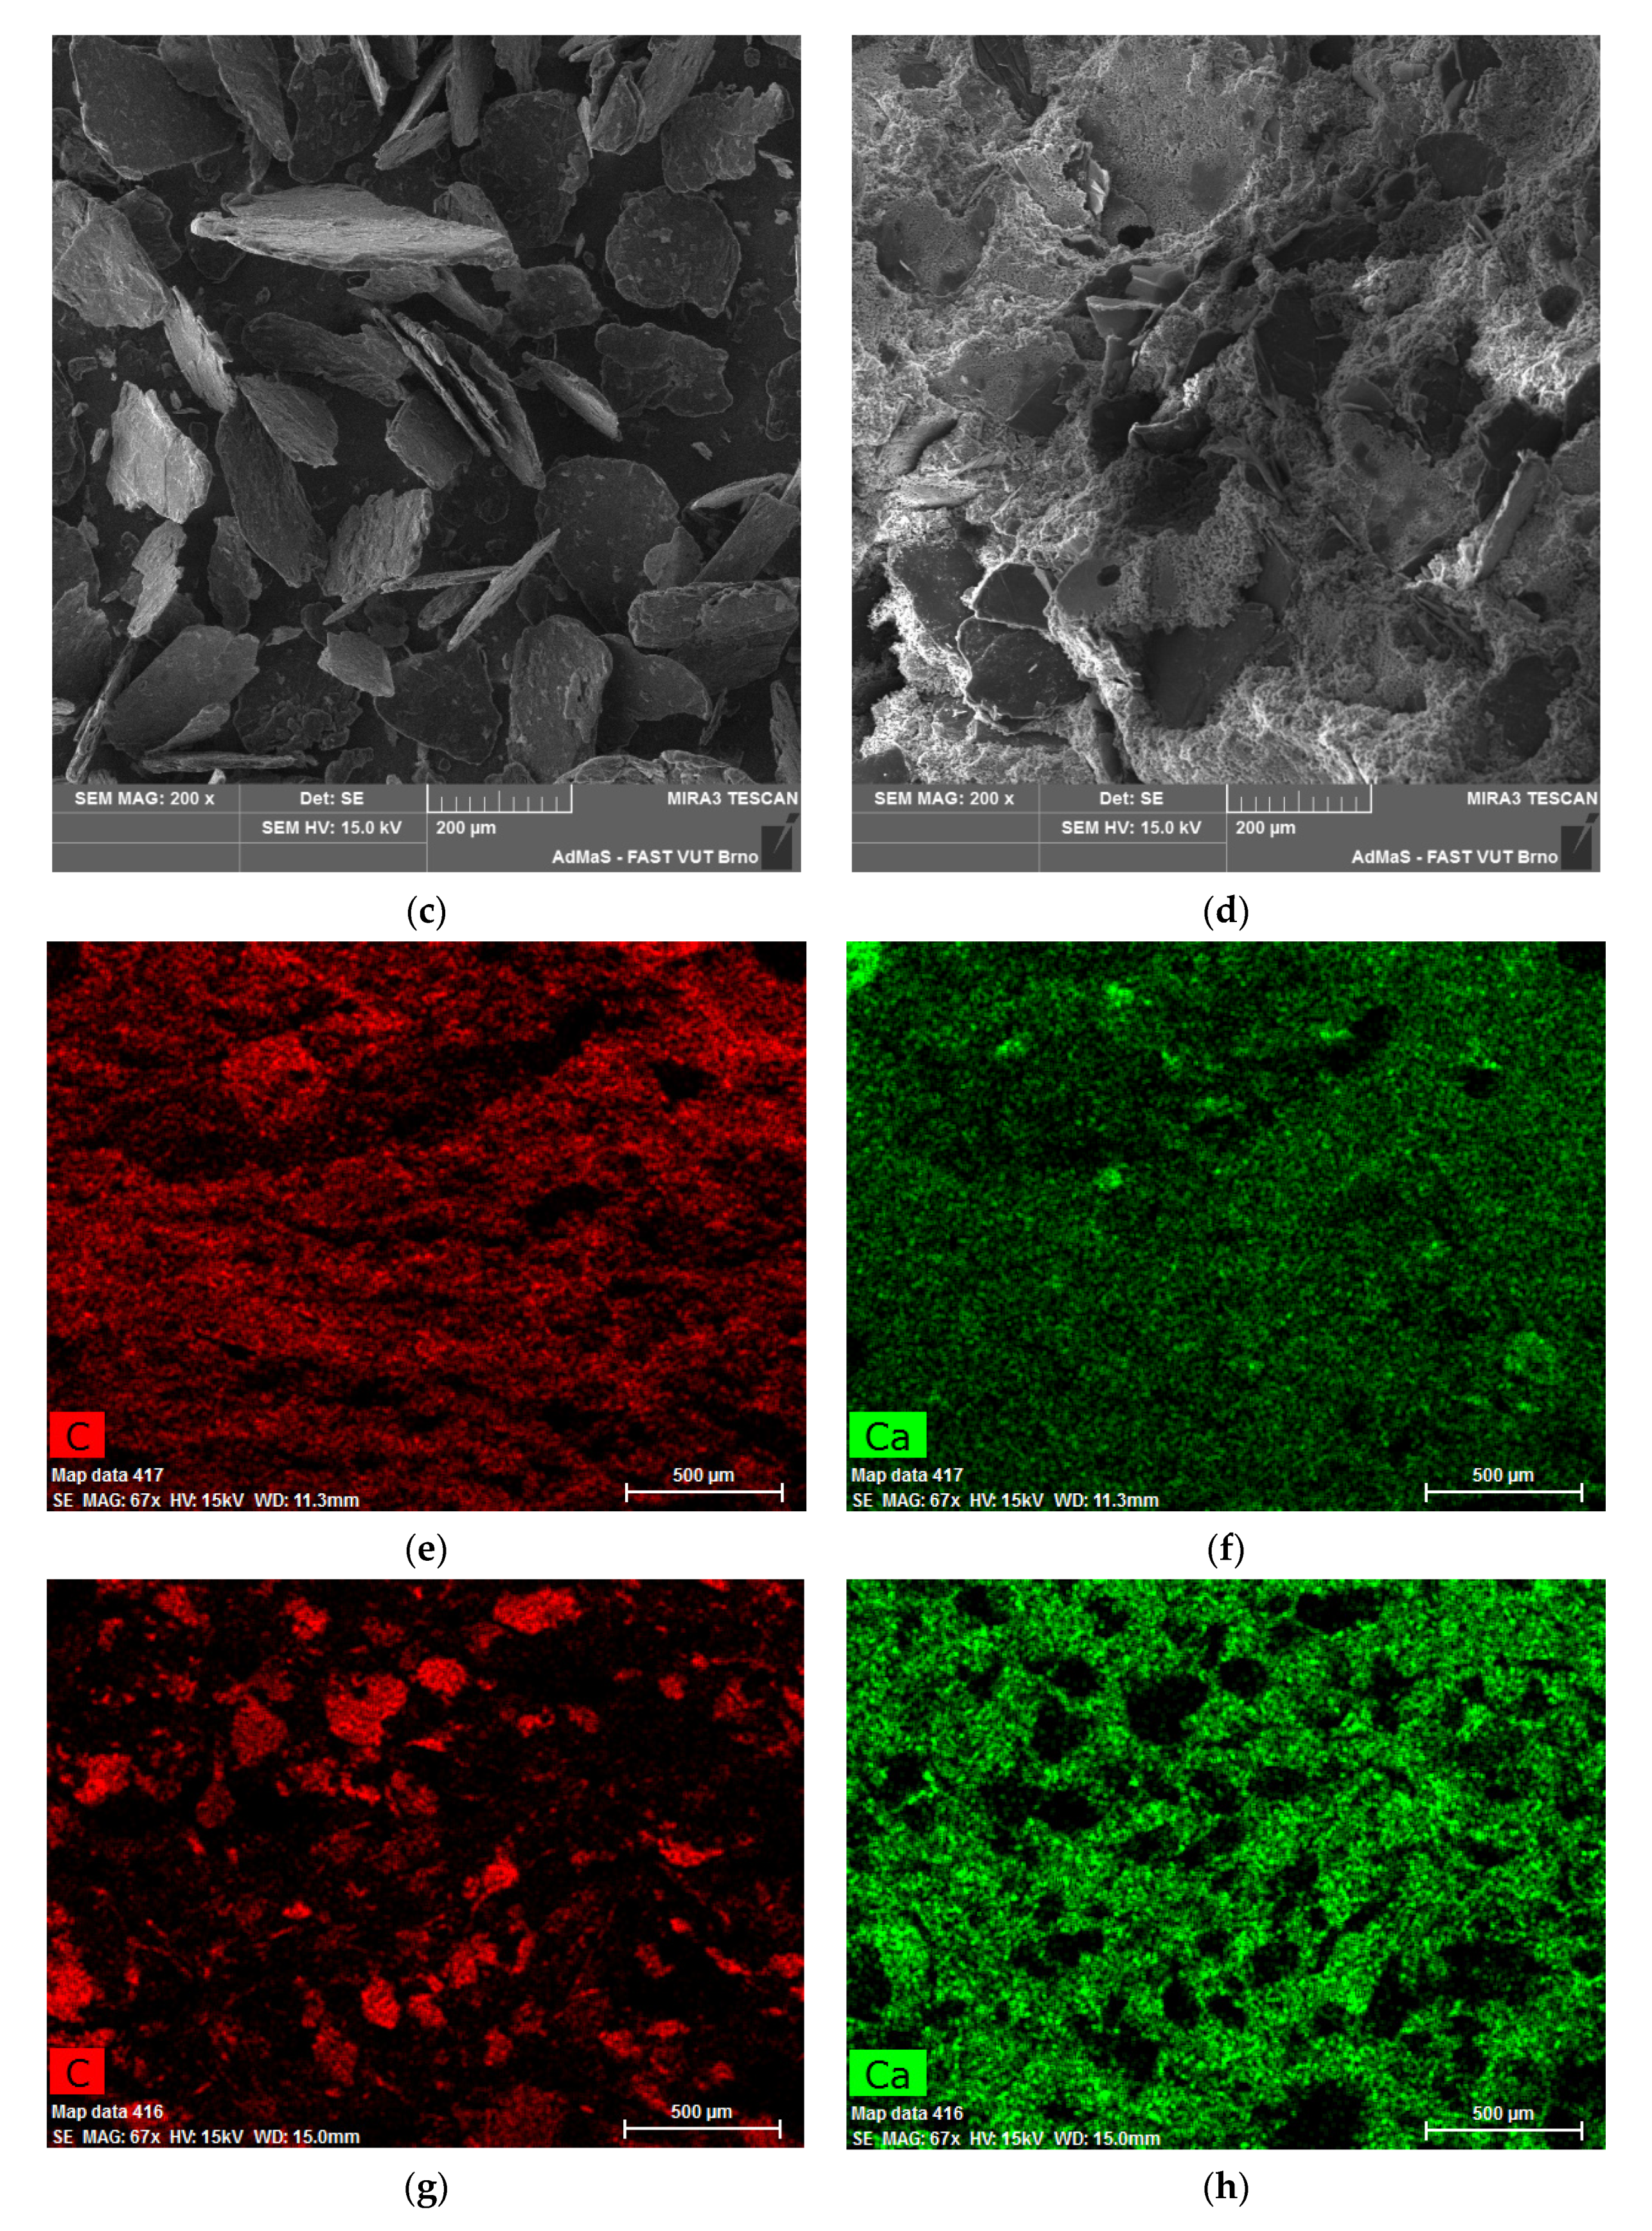
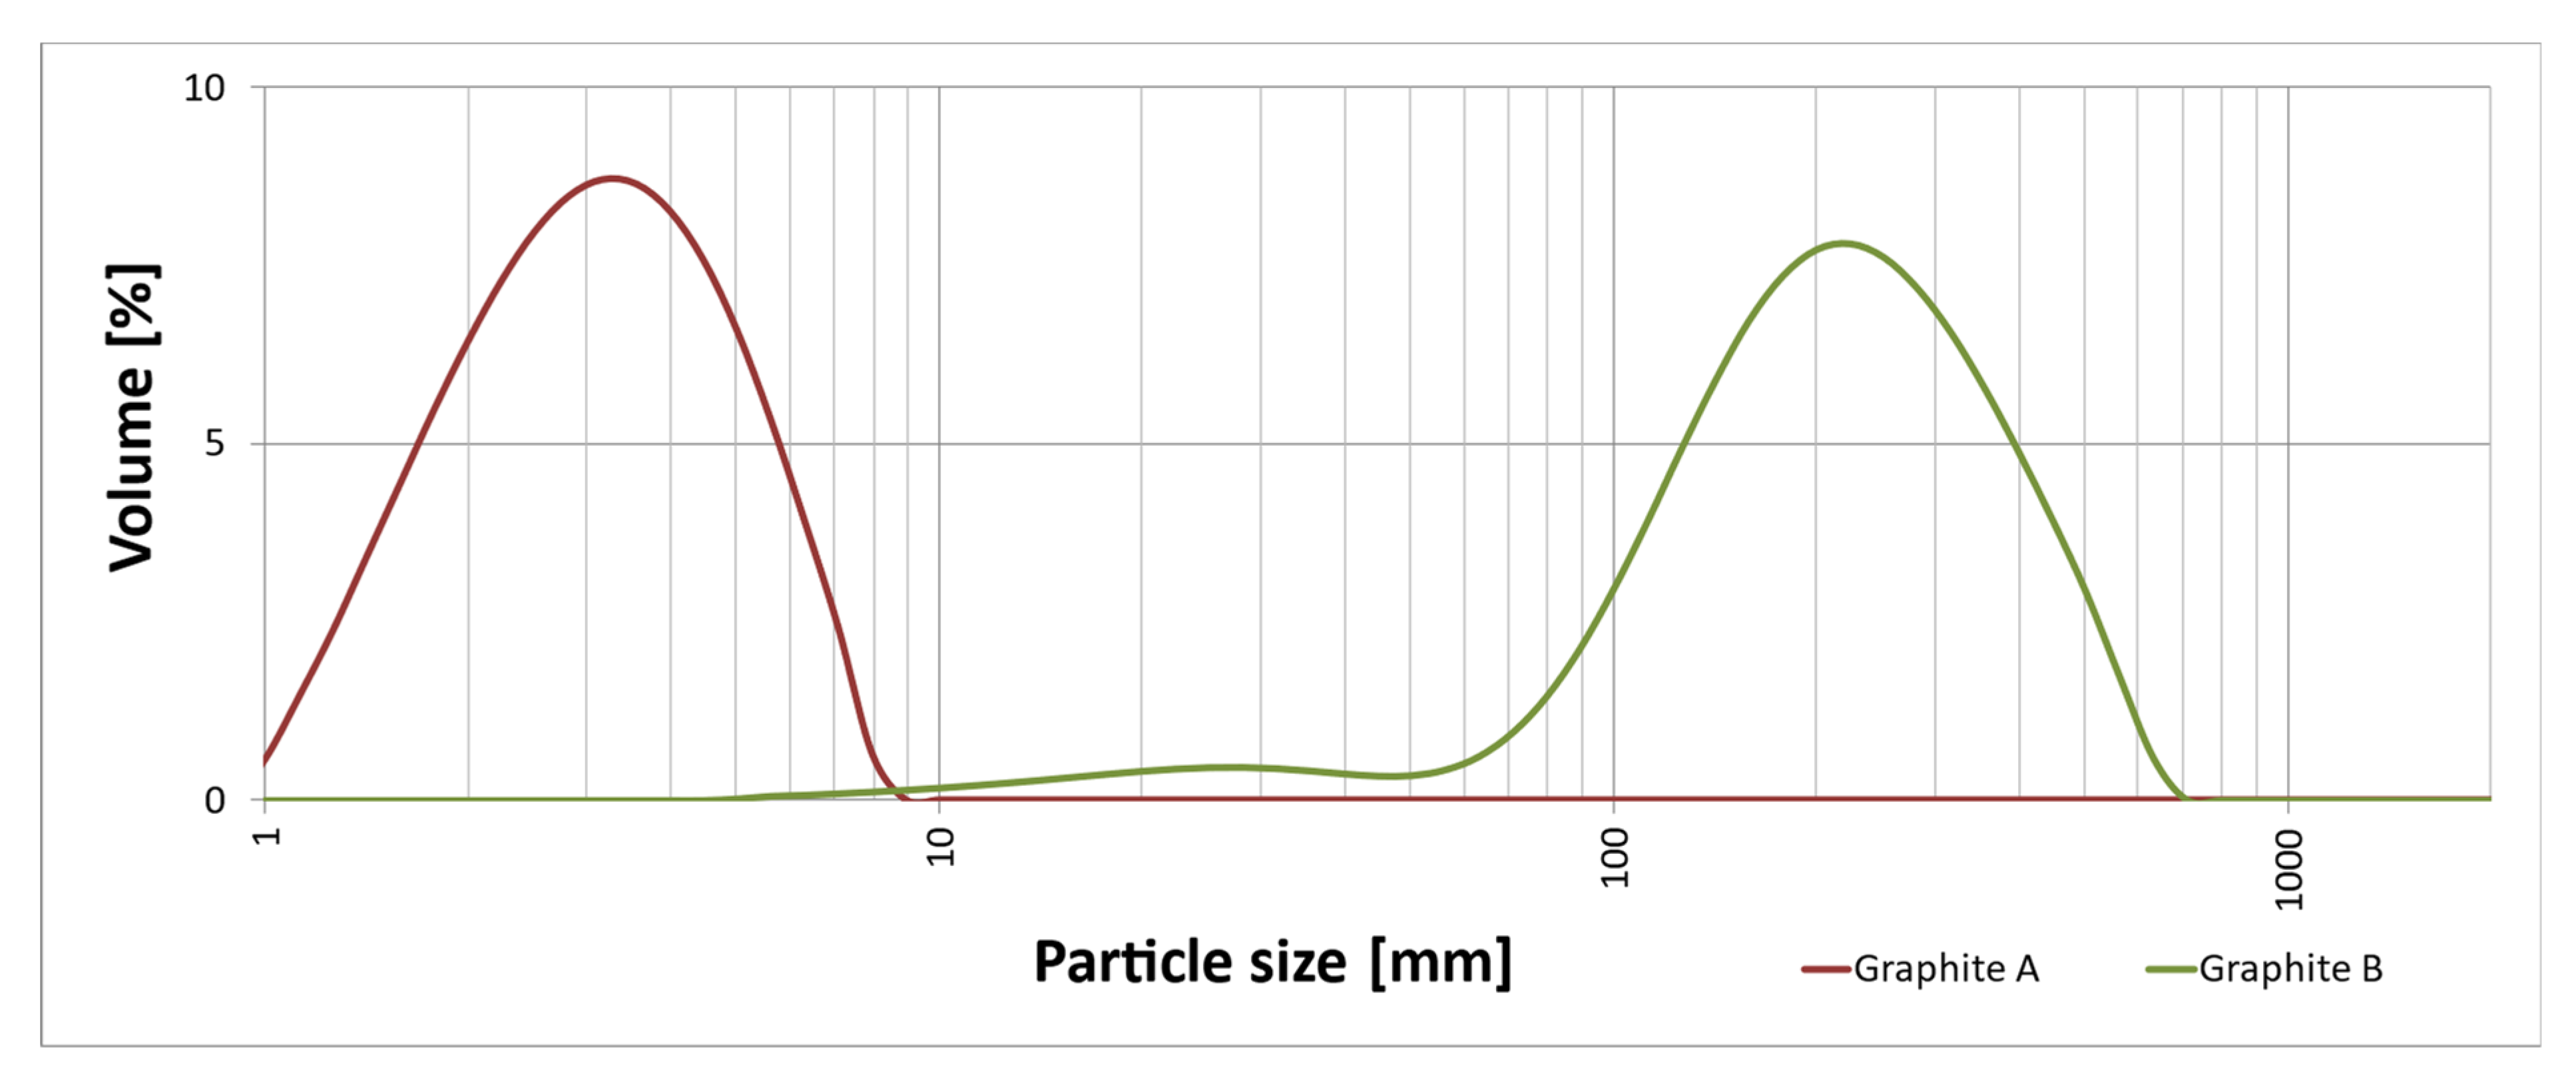
Two types of modified natural graphite were used in the research. In both cases, it was high-quality and pure graphite. Two species that differ in particle size were chosen. The first of the graphite fillers (Graphite A) is a representative of microground fillers, and its grain size is close to the lower limit of the grain size to which natural graphite can be modified by mechanical grinding. Graphite A has microground particles of irregular grain character. The second of the graphite fillers (Graphite B) is a representative of finely ground fillers with a grain size comparable to fine sand. Graphite B has plate-like particles resembling flakes in shape.
These graphite fillers were chosen to compare the effects of the external conditions on the composites with a significantly different grain size, which significantly affects the electrically conductive properties of the material. For the purposes of this research, the important properties of graphite powders used were determined in the laboratory, see
Table 1.
These graphite powders were selected based on previous research where the properties of the composite varied significantly for a given grain size of the graphite powder used [
51].
Figure 1 shows the images of the graphite fillers and graphite fillers in a fully hardened cement matrix from the SEM analysis and the EDX analysis.
Figure 2 shows the grain size curves of the graphite fillers.
Mixture
The mixture was designed to eliminate possible negative effects that nonconductive fillers and construction chemicals could bring to the measurement. The mixture consisted only of cement and graphite powders in varying amounts, which were dosed in weight %. The water was dosed to maintain the same workability; therefore, the w/c ratio varied for different mixtures. The target workability was the consistency of fresh mortar in which the poured mortar cake had a diameter of 150 mm ± 5 mm. The consistency of the fresh mortar was tested according to the EN 1015-3 standard [
52]. The composition of the mixtures is specified in the
Table 2 below.
Based on previous research, graphite fillers were used in quantities both above and below the percolation threshold. Materials containing conductive fillers below or above the percolation threshold have significantly different properties under external changes, both climatic and physical–mechanical [
27,
51].
Properties of the test specimens used for experiments
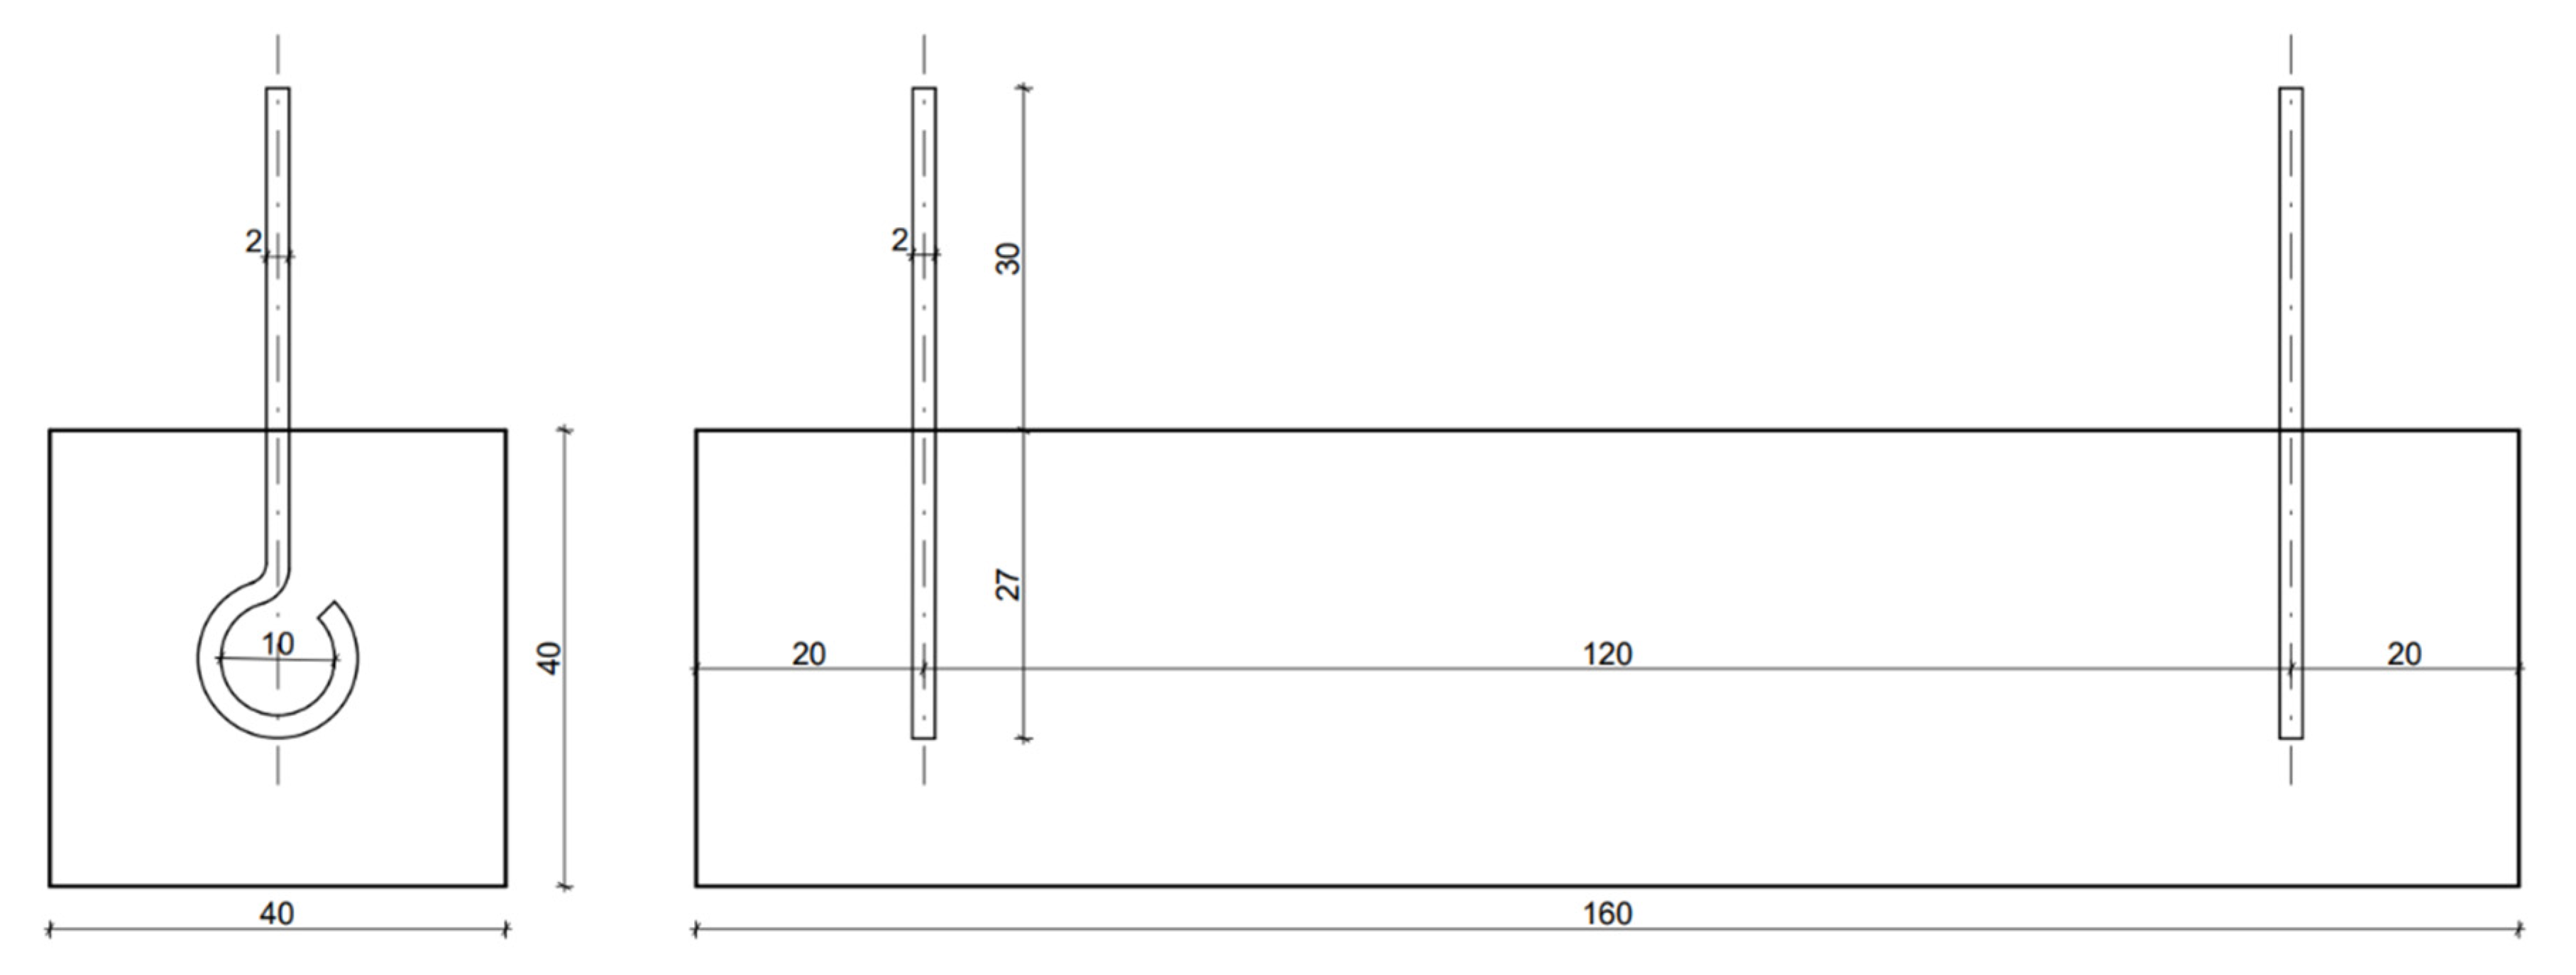
For experimental verification, test specimens with dimensions 40 × 40 × 160 (mm) were designed. The disposition of the electrodes is shown in
Figure 3. The samples were then cured for 28 days in water, similar to the standard [
53]. Copper wire electrodes were placed in each test specimen exactly as shown in the scheme below. Subsequently, each condition was verified on three test specimens, which were dried to a constant weight before exposure.
The values in
Table 3 are the physical and mechanical properties of test specimens in a hardened state after 28 days. The values show that the determining factor of density is the amount of graphite fillers in mixtures. As the amount of graphite fillers increases, the density of the mixture decreases. The parameters of all mixtures containing graphite fillers were compared with the REF mixture.
It is crucial to notice the relationship among density, water absorption, and compressive strength. Water absorption and compressive strength decrease almost linearly with decreasing density. Tensile strength also decreases, but not as significantly as the other parameters. This is due to the aspect ratio of the graphite fillers, which, by their shape, can contribute to an improvement in tensile strength.
3. Methods
The input materials used in this research were subjected to the basic analyses required for clear specification and identification of the raw materials.
The loose bulk density was primarily determined on electrically conductive graphite powders to illustrate the difference between the volume of feedstock before and after mixing with water, which significantly affected the volume of these raw materials. The loose density mass was determined on a 1 dm
3 container according to EN 1097-3 [
54] standard.
Specific mass of powder was verified using the pycnometric method, and the measurement was performed in technical alcohol, due to the possible reaction of the binder and the hydrophobic character of the electrically conductive fillers used. The volumetric density was determined according to EN 1097-6 [
55]. Specific mass was verified by using an AccuPyc II 1340 helium pycnometer to verify the manual measurement. The instrument measures the volume of a material by displacing the gas using the volume–pressure relationship of Boyle’s law. An inert gas, helium, was used as the displacement medium.
The median particle size (D 0.5) of the raw materials used was determined by laser diffraction analysis according to the ISO 13320:2009 standard [
56] using the Malvern Mastersizer 2000. The principle of this method is the continuous flow of particles of the sample illuminated by a laser beam, which is then bent (refracted) or diffracted. The bent laser beams then form a diffraction image, and this image is then captured by a Fourier lens. Using the Fourier transform, this image is converted to a grain-size curve by a computer.
The BET method, according to ISO 9277:1995 (E) [
57], was used to determine the specific surface area of conductive graphite powders. This method uses single or multilayer technology of physisorption of nitrogen gas molecules on the surface of the test sample at reduced temperature and pressure. The area or specific surface area, which corresponds to the amount of gas adsorbed in one or more layers, is then calculated by computer. The specific surface of the cement binder was determined using the Blain apparatus according to the EN 196-6 [
49] Standard.
The absorption of graphite fillers had to be determined by the vacuum method. The hydrophobicity of graphite particles prevents natural soaking. The absorption was determined in accordance with EN 13055 (D) [
58]. The powder sample was weighed and poured in a layer of 1 cm into a Büchner funnel with filter paper inserted; then, the sample was poured with water under constant stirring, and a vacuum of 50–100 mbar was created under the sieve using a vacuum pump. After a period of time (5 min), the saturated sample was weighed again. The absorption of the samples was denoted by WA(t), where ‘t’ represents the time at which the sample is exposed to vacuum absorption. A common time t = 5 min was used for the measurements.
The resistivity of the powdered raw materials was determined based on previous research to allow for comparison and verification of results. The raw materials were compressed with a pressure of 100 N in a nonconducting chamber with electrodes [
51].
Simulation of moisture conditions
Moisture was monitored in 6 conditions: 1. dry state, the samples were dried to a constant weight; 2. natural absorption (laboratory conditions); 3. 5 min of vacuum absorption (WA); 4. 25 min of WA; 5. 50 min of WA; and 6. 100 min of WA to get full saturation of the samples.
Simulation of temperature condition
For temperature simulations, climatic chamber CTS C-20/600 was used as the initial temperature was a temperature typically used for laboratory conditions, 23 °C (50% relative humidity). In the first step, the maximum temperature was reached. An upper test limit of temperature 50 °C (10% relative humidity) was chosen. After reaching the upper limit, test specimens were tempered to laboratory conditions. In the next step, the minimum temperature was reached, as a lower limit was chosen with a temperature of −10 °C. The last step was tempering back to the laboratory conditions. During each step, test specimens were tempered for 24 h at a specific temperature. This procedure guaranteed the same temperature throughout the sample volume. Required parameters were recorded immediately after test specimens were taken from the climactic chamber.
Simulation of climate with higher CO2
Three levels of elevated CO2 conditions were simulated. The microclimate conditions were simulated in climate chambers and in normal water storage. The conditions of the first chamber were: air temperature of 23 °C, 50% relative humidity and with an extremely high amount of 10,000 ppm CO2. Second chamber: air temperature of 23 °C, 50% relative humidity and a normal 400 ppm CO2. The third environment was water storage, with ideal conditions for the hydration process without access to CO2. After 28 days of exposure to the conditions, the samples were dried to constant weight, placed in vacuum bags, and tempered to 23 °C, and then their resistivity values were determined.
Simulation of conditions with compressive stress
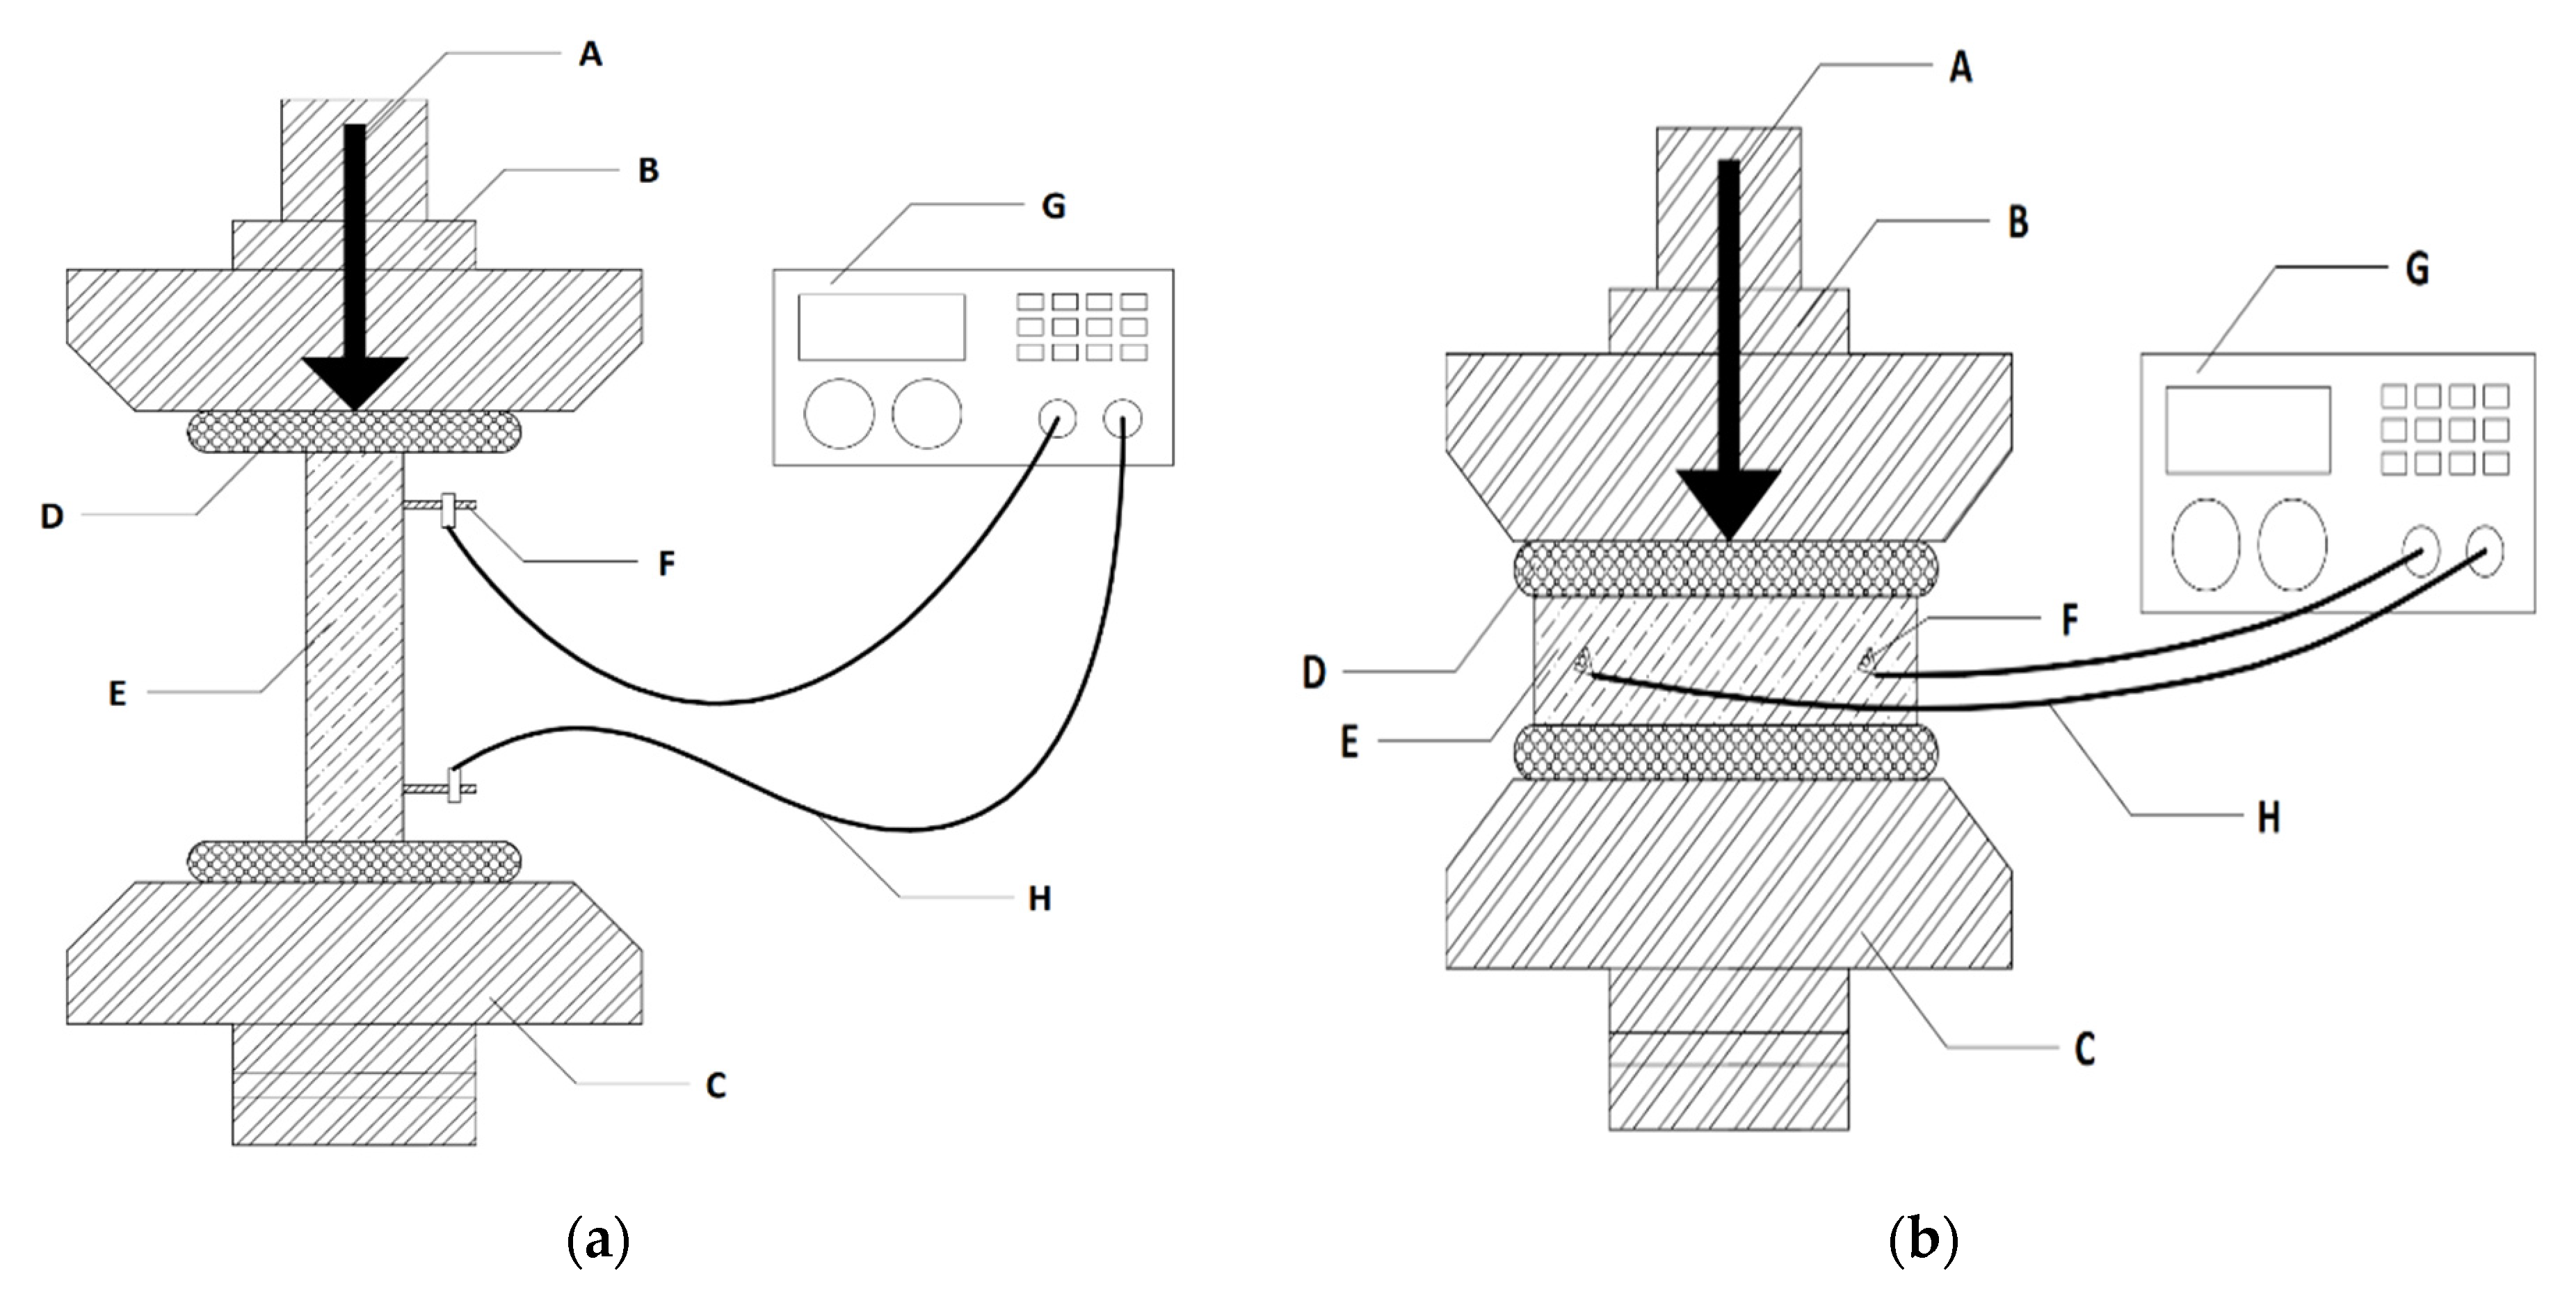
Test specimens made from cement composite with graphite fillers were loaded in a hydraulic press with 1.0% accuracy of load in the top 4/5 of the measuring range. The loading rate was set at (50 ± 10) N/s. Test specimens were placed between the jaws of the press with HDPE protection elements. Two methods of loading were used: Horizontal orientation see
Figure 4a (perpendicular to the direction of compaction, as well as perpendicular to the direction of electric current) and vertical orientation see
Figure 4b (parallel to direction of electric current). During all loading processes, the test specimens were connected to LCR meters. To obtain sufficient data, display of LCR meter and gauge of the press were monitored with two digital cameras (main and backup). Loading was carried out to the moment of failure of test specimens.
Determination of the resistivity of the material
Impedance and θ angle were measured on the GW Instek LCR 6020 device, and then, using the area of the integrated part of the electrode, the impedance was recalculated to resistivity. For direct measurement of the impedance of material exposed to climatic conditions, electrodes of known area were integrated into the 40 × 40 × 160 (mm) test specimens and distanced by 120 mm. The copper electrodes were then connected to the device, with a set frequency of 1.0 kHz. This method has been proven in previous research [
51].
Differential thermal analysis (DTA)
A Mettler Toledo TGA/SDTA 851 instrument was used for the DTA analysis of tested graphite fillers and samples from simulation of climate with higher CO2. The monitored parameter was the temperature difference between the sample being analyzed and the reference substance. This analysis was used to determine the endothermic and exothermic transformations as a function of temperature, and the carbonation phases of the samples were determined from the results of the analyses. The samples were tempered at a temperature rise rate of approximately 20 °C/min up to a maximum temperature of 1000 °C.
4. Results and Discussion
4.1. Effect of Moisture
The first of the factors observed influencing the resistivity of the cement-based composite materials was the influence of internal moisture. The aim of the measurements of the resistivity at different levels of internal moisture was to prove the dependence of resistivity of cement composites with graphite fillers on moisture.
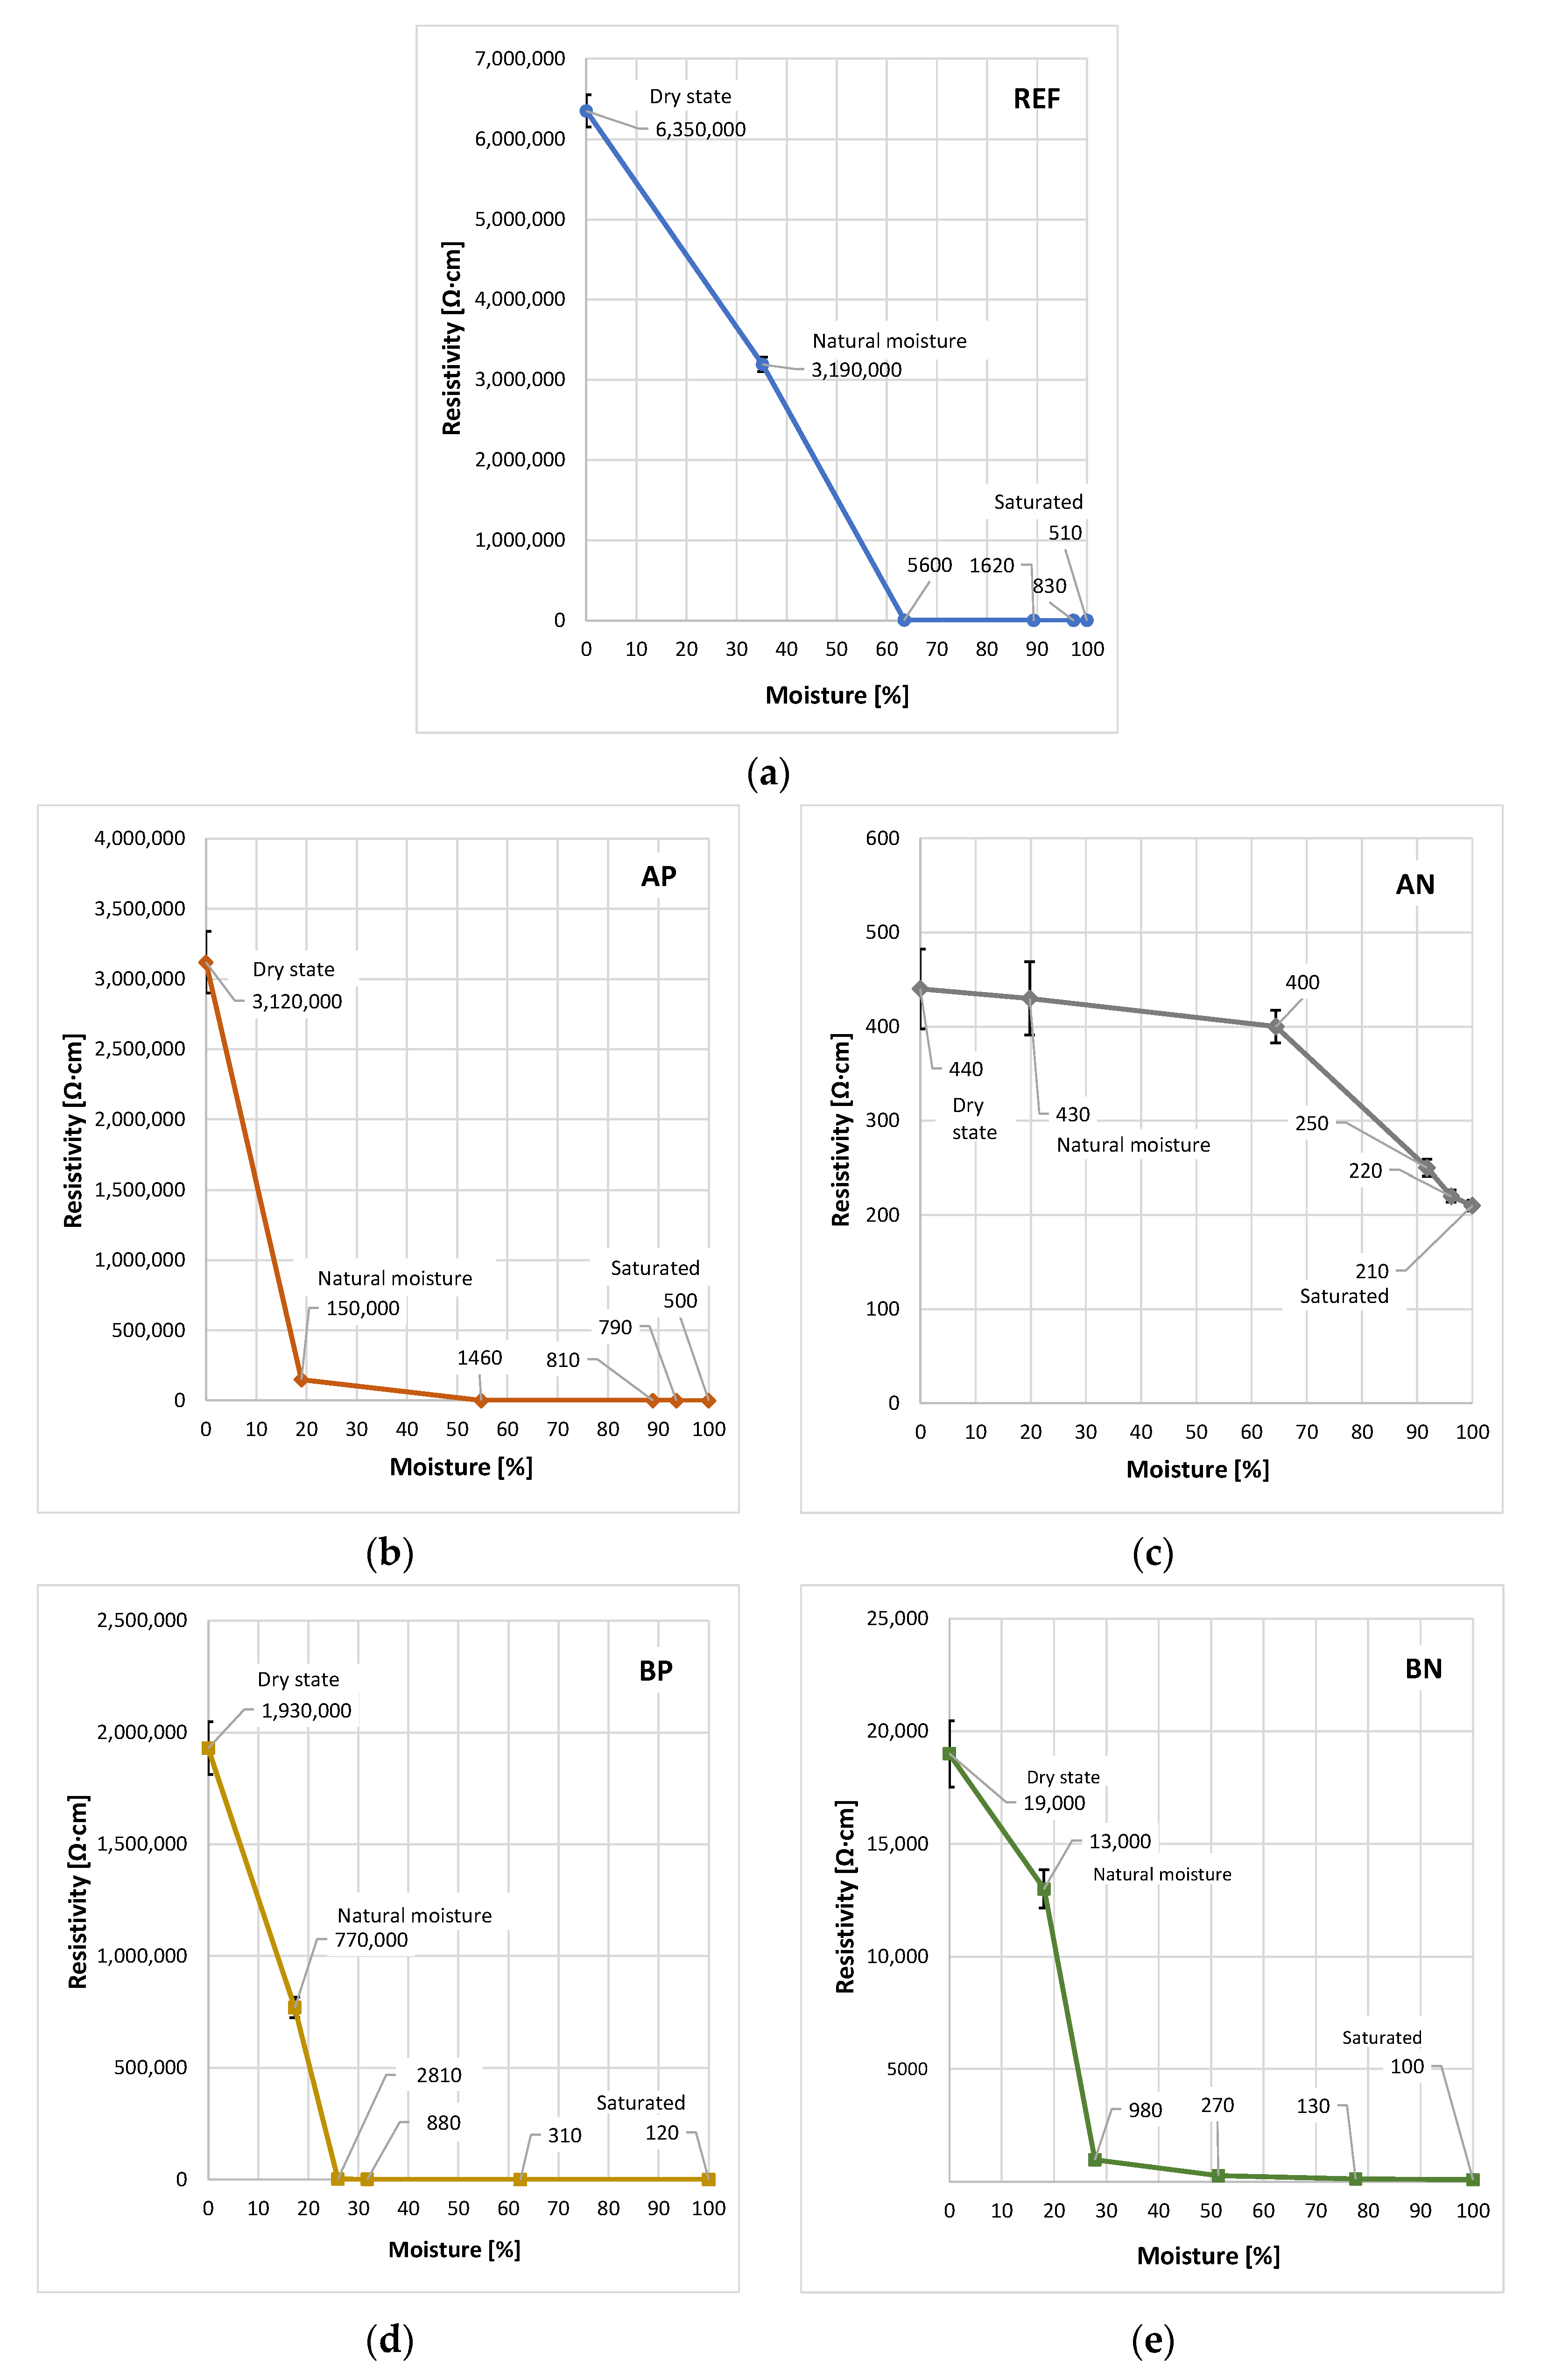
Figure 5 shows the resistivity values for certain moisture conditions for all tested mixtures.
The resistivity of the reference mix decreased steeply with increasing moisture. Increasing moisture had a significant influence on the AP and BP mixes, i.e., the mixes where electrically conductive graphite filler was dosed in lower amounts than the percolation threshold. Mixes AN and BN showed resistivity on levels lower by orders even on dry samples; their resistivity further decreased with increasing moisture. In particular, the AN mix showed a negligible reduction in resistivity caused by growing moisture. The achieved results correspond to theoretical assumptions [
2,
11,
19,
20,
21,
22].
The transfer of electric charge in the cement composites without conductive fillers or with their dosages below the percolation thresholds is realized mainly by ion conductivity (in this work, these are the mixes REF, AP, and BP). Resistivity is highly dependent on moisture, and, as a rule, resistivity decreases by orders with increasing moisture.
It is assumed that this is caused by two phenomena taking place in the microstructure of the material. The first is the increase in mobility and total amount of H
+, OH
−, and other dissolved ions, due to higher amounts of the solution in the pores. The higher the ion conductivity, the higher the moisture. The second phenomenon is a secondary implication of higher amounts of the solution in the pores. The filling up of pores, which were not filled before, makes it possible to connect new conductive paths as water fills the gap between two particles of a conductive filler. It can be assumed that this is the manner in which hybrid electrically conductive paths are created; in these, partial tunnel conduction or direct contact conduction occurs by means of a conductive filler, and partial ion conduction occurs by means of water filling the connections critical for a continuous path [
11,
19,
20,
21,
22,
29,
38,
46].
In cement composites, where dosages of the conductive fillers are higher than the percolation thresholds, the transfer of electric charge is realized by means of tunnel and direct contact conduction. The resistivity of such composites still depends on moisture; however, moisture is not the dominant factor influencing resistivity here. Composites with conductive fillers exceeding the percolation thresholds also show both the above-mentioned phenomena; however, their effect is less significant, and thus the decrease in resistivity is not so abrupt and by several orders with increasing moisture. Rather, it is because the resistivity of the structure as such is relatively low. The cause of low resistivity is the existence of many fixed, continuous, electrically conductive paths created by particles of the conductive filler. The functionality of the fixed paths cannot be influenced by moisture [
11,
19,
20,
21,
22,
29,
38,
45].
It can be assumed that even if the proportion of conductive filler exceeds the percolation threshold, there are still some imperfect electrically conductive paths, which may become hybrid if moisture increases sufficiently. The proportion between the fixed and hybrid electrically conductive paths determines the significance of the influence of moisture on the resistivity of cement composites. The higher this proportion is, the less significant the influence of moisture [
11,
19,
20,
21,
22,
29,
38,
44,
45,
46,
47,
51].
An important fact is that conductive filler A, with a grain size in the order of ones of μm, shows very low values of resistivity, and the significance of moisture influence is negligible. This confirms a theoretical assumption that the smaller the particles from the fixed electrically conductive paths, the higher the number of paths. It can be stated that the proportion between fixed and hybrid paths of mix AN is higher than this proportion in other mixes. Electrically conductive filler B, with a particle size in hundreds of μm, in mix BN and dosed over the percolation threshold, showed a high proportion of fixed and hybrid paths as well. Because the size of the particles is higher, a lower number of fixed electrically conductive paths compared to filler A is assumed. As a result, the proportion between fixed and hybrid paths must be lower as well, and the significance of the moisture influence is more considerable, but still not dominant [
11,
19,
20,
21,
22,
29,
38,
44,
45,
46,
47,
51].
4.2. Effect of Temperature
The second factor observed influencing the resistivity of cement-based composite materials was the influence of the temperature of the material. The aim of the thermal load carried out was to prove considerable differences in the resistivity of cement composites with graphite fillers at extreme temperatures.
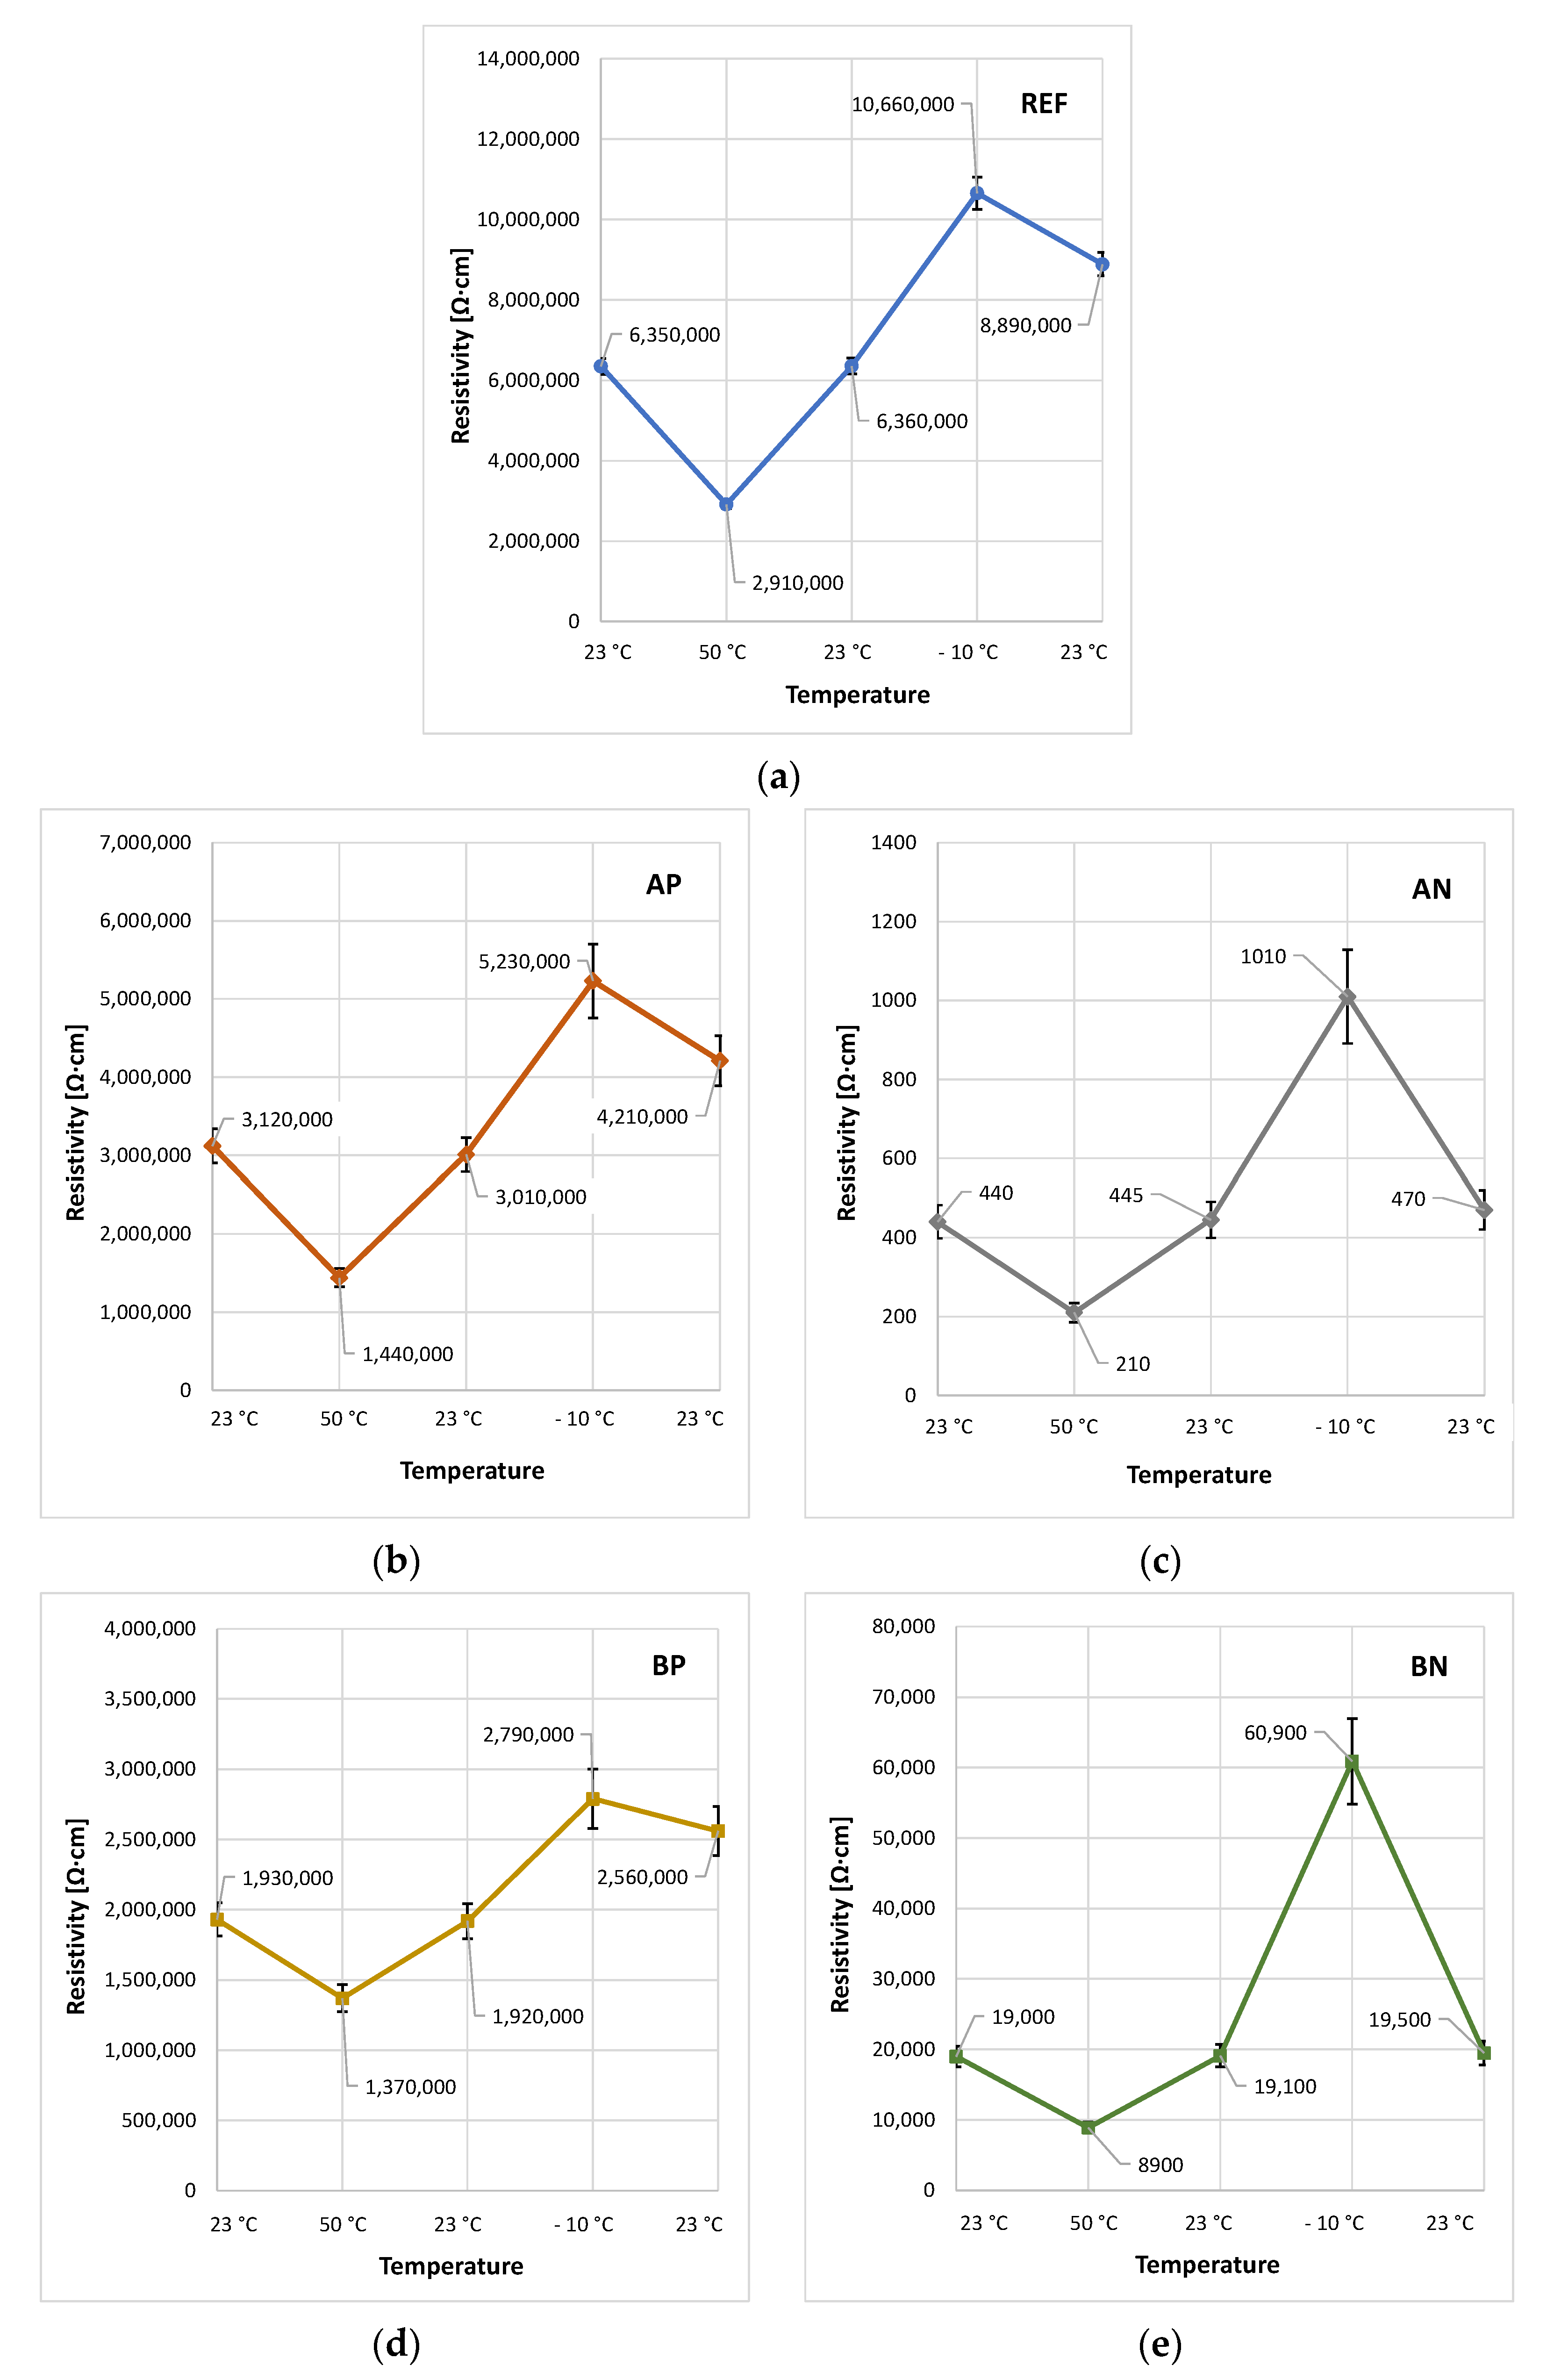
Figure 6 shows the values of the resistivity found during the thermal load for specific temperatures.
The influence of temperature as proven in this research fully corresponds with the results of other studies carried out in this area of research and development [
24,
25,
31,
38]. Our results show that the higher the temperature of the test specimens, the lower the values of resistivity and vice versa. This behavior is typical for semiconductors. There is an assumption that cement-based composites with some proportion of graphite become semiconductors because graphite is a semiconductor. Experimentally verified behavior corresponding to the theoretical assumptions may be considered evidence of this assumption [
24,
25,
38].
However, values of the resistivity for the REF mix are contrary to this theory, because the trend is identical. It is certain that the REF mix (only cement and water) is an electrical insulant. Therefore, it is necessary to observe the relative changes in resistivity and focus on the values of resistivity at a final 23 °C temperature are stated after exposure of the test specimen to −10 °C. Permanent increases in resistivity are ascribed to permanent changes in microstructure caused by microcracks. According to previous studies, these defects are caused by ice and its thawing in the porous structure of materials and disruption of the conductive paths created by the electrically conductive filler.
The REF mix has no conductive filler, and permanent increases in the resistivity of the test specimens are ascribed to the substantial damage to the microstructure such that even the ion electrical conductivity of the material is decreased. It is assumed that only ion conductivity occurs in REF samples. Ion conductivity is probably the only factor determining the dependence of REF resistivity on temperature [
22,
24,
25,
28,
29].
This assumption is in accordance with the overall concepts of the influence of temperature on the resistivity of cement composites with graphite fillers. With increasing temperature, the resistivity of the test specimens decreases, and, on the contrary, with decreasing temperature, the resistivity grows based on the two mutually independent phenomena described in the introduction [
29,
47].
In the mixes AP and BP, in mixes with lower proportions of graphite than the percolation thresholds, the influence of temperature is less dominant than in the mixes AN and BN, i.e., mixes with proportions of graphite exceeding the percolation threshold. The assumption is that in the AN and BN mixes, the influence of the direct contact conductivity through fixed continuous conductive paths will prevail. Based on the comparable humidity of all test specimens, ion conduction can be neglected, as its influence will be the same for all mixes. At a temperature of 50 °C, the decrease in the resistivity of AN and BN compared to the resistivity at 23 °C is relatively more considerable than that of the AP and BP mixes.
The main reason for this is considered to the different resistivity of the individual mixes at the basic temperature of 23 °C. The resistivity of AN and BN at a basic temperature is considerably lower (around 10
2–10
4 Ω·cm) compared to the mixes AP and BP (around 10
6 Ω·cm). It is also important to highlight that the resistivity of the AN and BN mixes is more sensitive to changes in temperature than that of the AP and BP mixes; sensitivity to change is expressed by relative change compared to a basic temperature of 23 °C [
25,
38].
At the temperature of −10 °C, the relative change in resistivity of AN and BN is again higher compared to the relative change in the AP and BP mixes. This confirms the hypothesis about the sensitivity of resistivity to temperature. The reason for increasing resistivity at temperatures below zero is the freeing of physically bound water in places where water was filling up critical connections of hybrid electrically conductive paths. It can be assumed that, at the same time, ice expands into the connection of electrically conductive paths, where flashover conduction takes place [
25,
38].
The values of resistivity at the end temperature of 23 °C after previous exposure to −10 °C are interesting. The effect of frost permanently increases the resistivity of all mixes. This increase was relatively higher with the mixes AP and BP compared to the mixes AN and BN. This is ascribed to a generally lower resistivity of the mixes AP and BP. Low resistivity is explained by low numbers of electrically conductive paths. Test specimens with low numbers of conductive paths are more sensitive to defects in microstructure caused by the formation of ice. Damage to even a single path has a relatively higher impact due to a low total number of paths compared to the damage to several paths out of quite a high number of paths [
22,
25,
28,
29,
38].
4.3. Effect of CO2
Another factor observed that influences the resistivity of cement composites is CO
2. Test specimens were exposed to various environments for defined times to verify the influence of carbonation on the resistivity of cement composites with graphite fillers.
Table 4 shows the results of a DTA analysis of the samples from various environments (CO
2 chamber, laboratory conditions, and water).
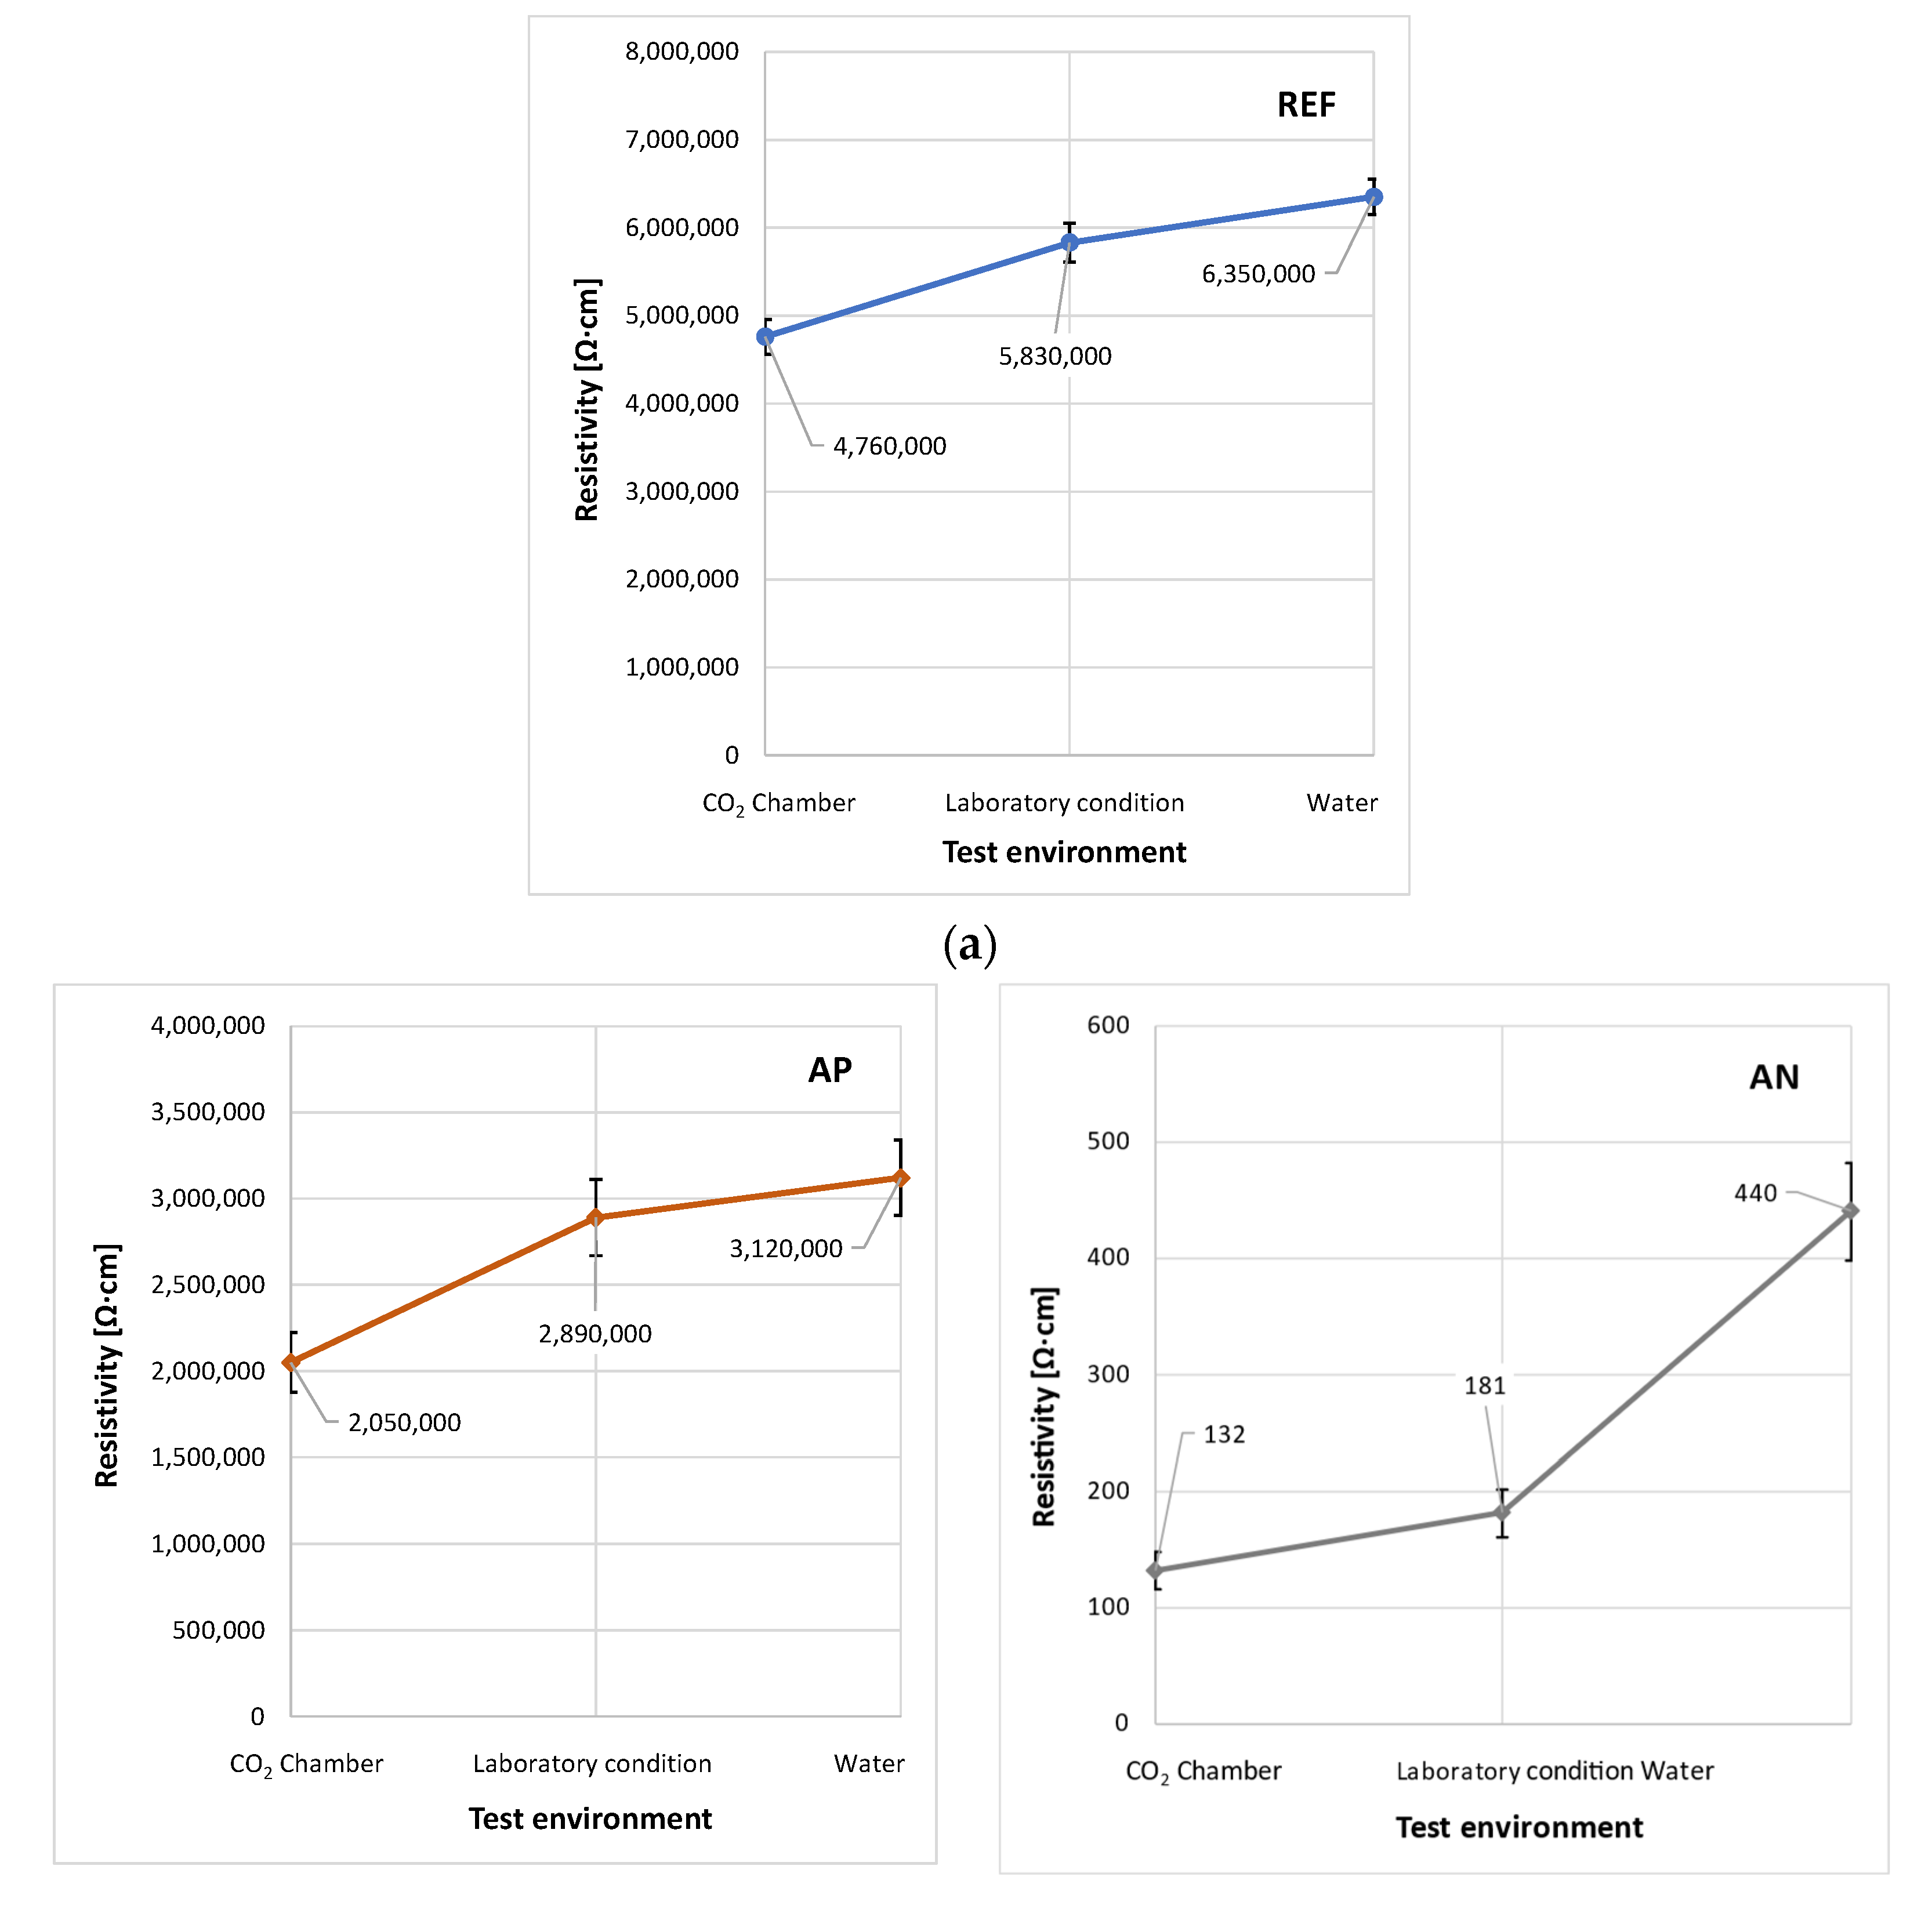
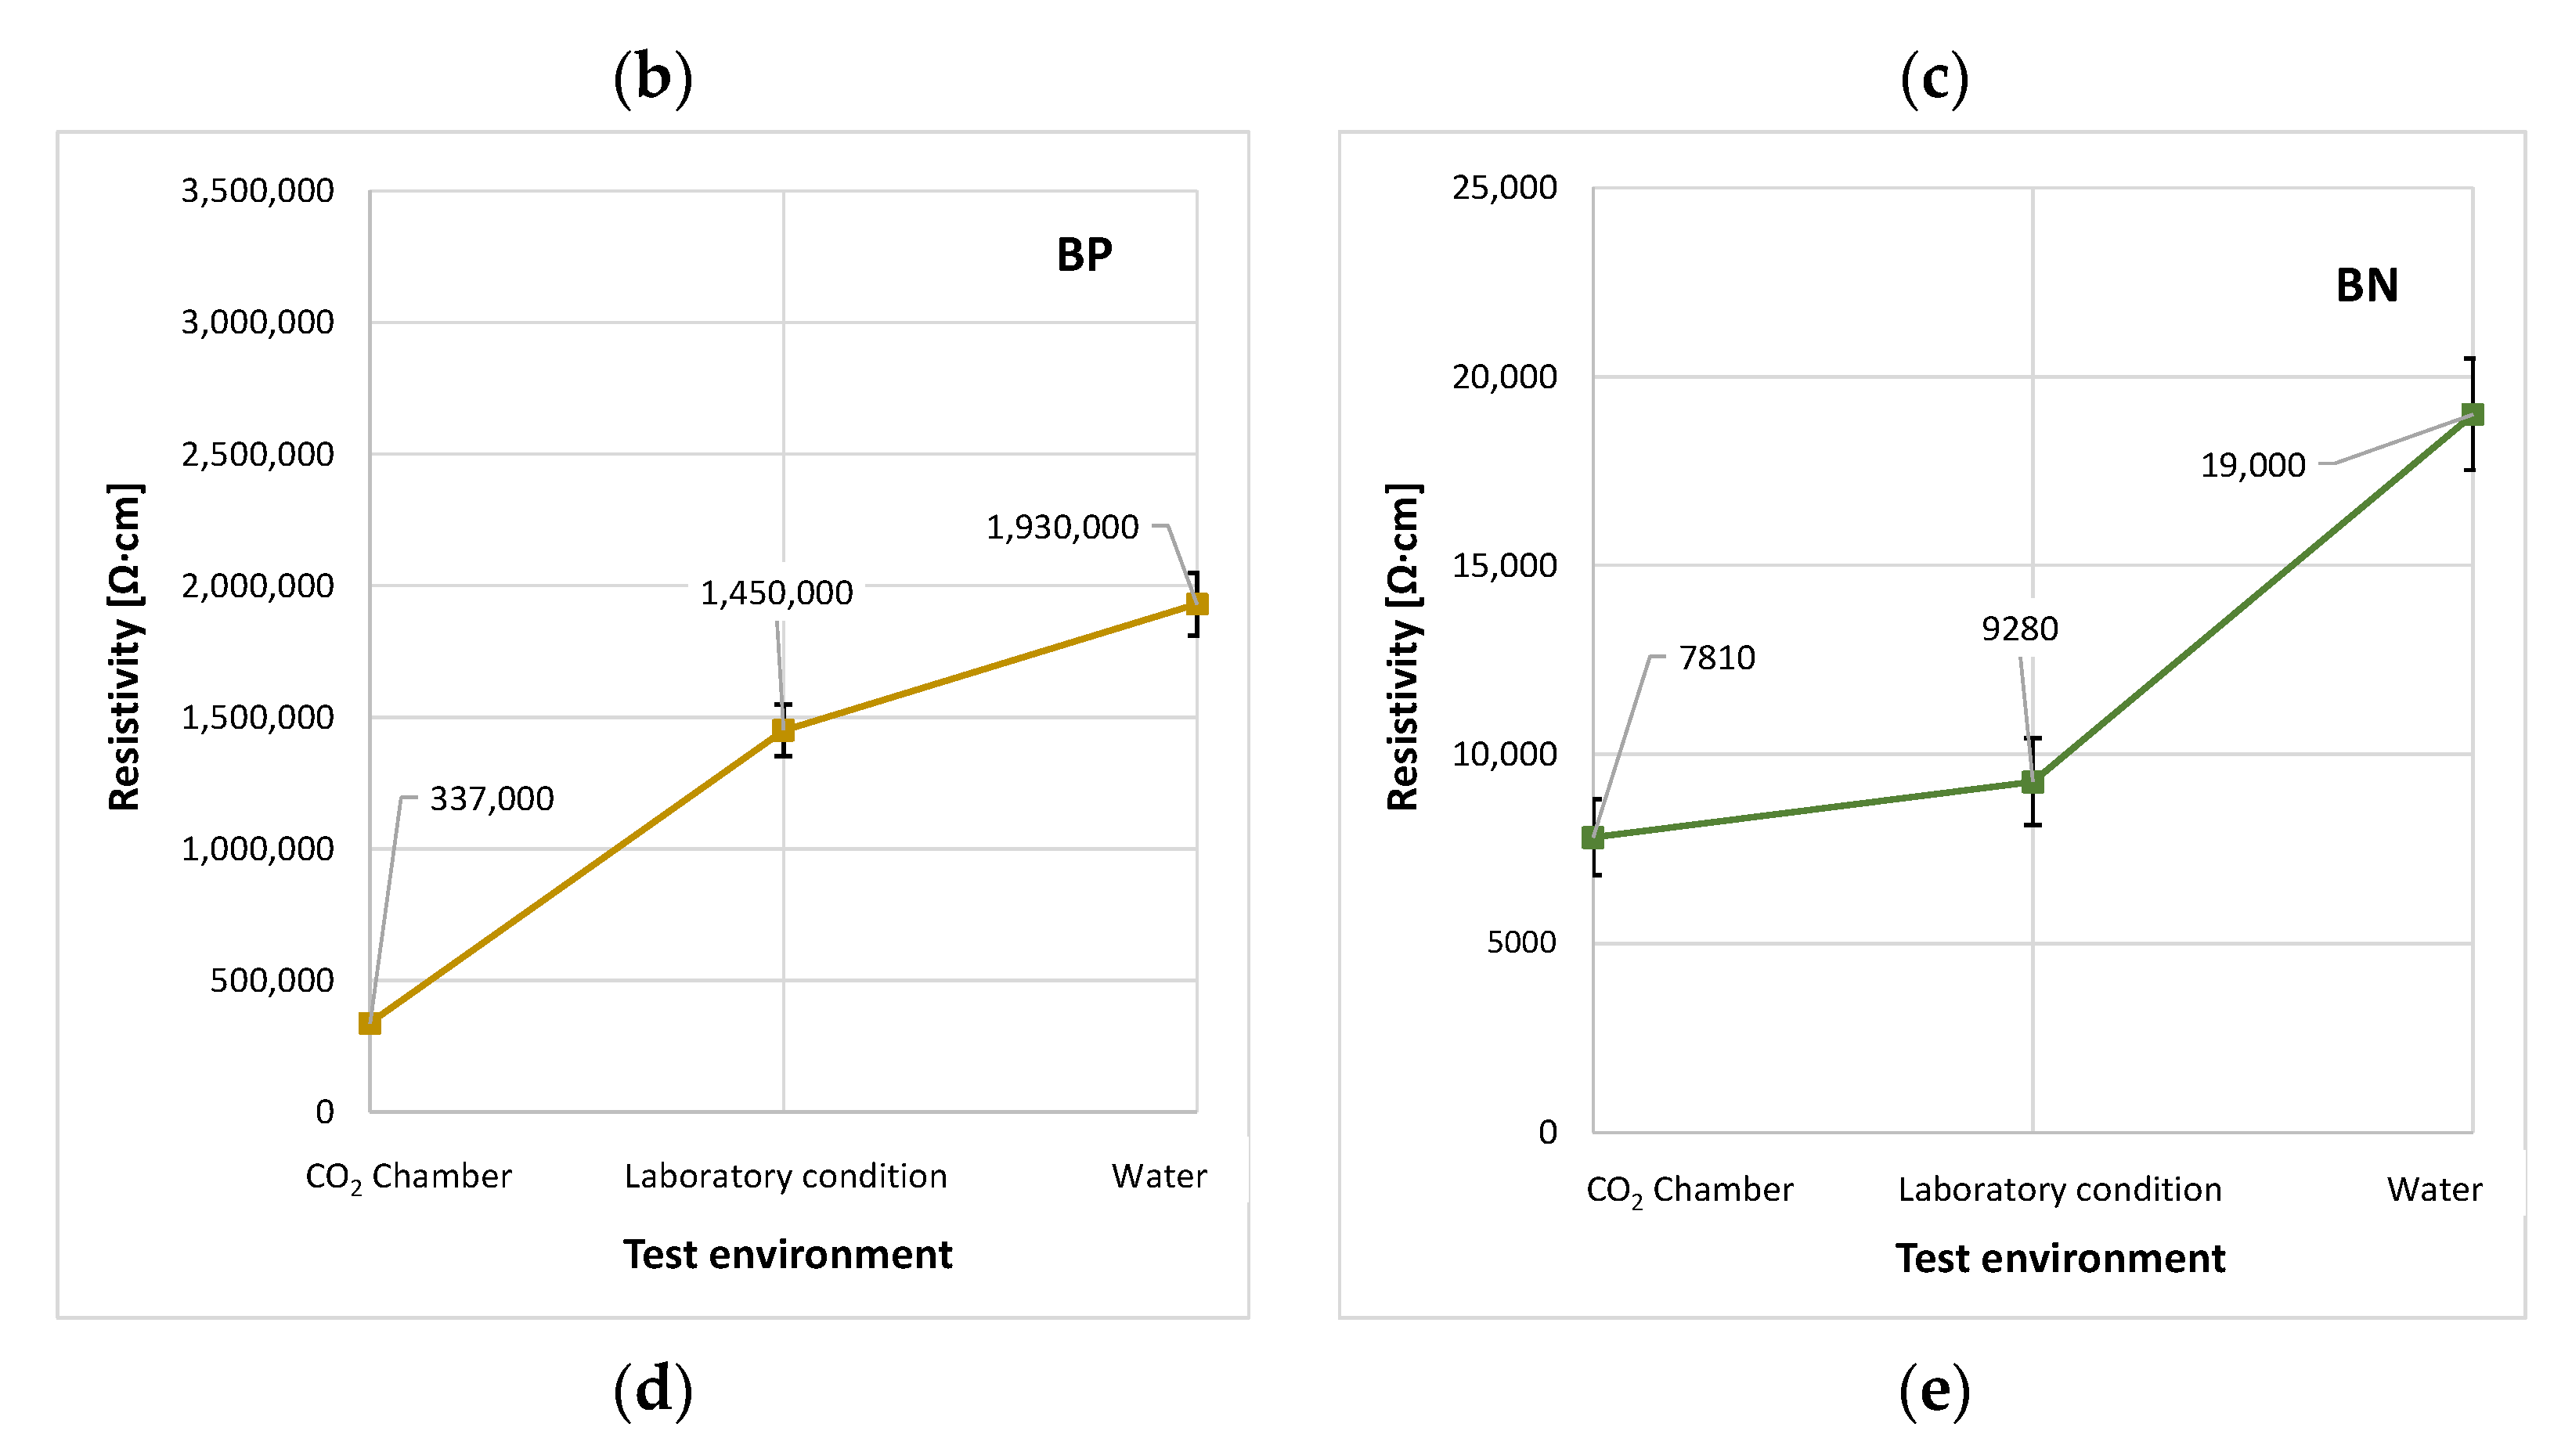
Figure 7 shows the values of the resistivity found for the tested mixtures in various environments.
To prove this assumption, a phenolphthalein test and a DTA analysis were carried out. The loss of ignition of the graphite fillers used was taken into account when calculating the Ca(OH)
2 and CaCO
3 contents. All test specimens from the CO
2 chamber show high degrees of carbonation, whereas the test specimens under laboratory conditions show low degrees of carbonation, and test specimens from water environments are not carbonated [
30,
31,
32,
33,
34]. There are only minor signs of carbonation that occurred during the preparation of the samples by drying and grinding. The degree of carbonation is closely related to the properties of the composite, with decreasing bulk density and especially water absorption causing a higher degree of carbonation even with a lower cement content in the matrix [
59].
In the first place, the results show that the test specimens from water environments have the highest values of resistivity. This is because the test specimens in such environments had unlimited amounts water for further hydration, and, at the same time, they were protected from the effects of CO
2. It can be assumed that the high values of resistivity were caused by the high density of the cement matrix [
33].
It was found that the resistivity of silicate-based composite materials is dependent on the concentrations of CO
2 in the surrounding environment. Comparisons of samples with CO
2 from a chamber, from water. and from water environments showed a clear trend of the values of resistivity. The resistivity of specimens made from all mixes has the lowest values for the CO
2 chambers and the highest values for water environments. The resistivity of the test specimens from laboratory conditions is, as expected, between these two values [
30,
31,
32,
33,
34].
The relative changes in resistivity show that the influence of CO2 on resistivity is lower for the AN and BN mixes compared to the AP and BP mixes. This is in accordance with the explanation given in the aforementioned research by Kamila Gawel, which states that the CO2 action on the cement matrix and its degradation causes decreases in the overall electrical resistance of the carbonated matrix. It shows that the effect of high concentrations of CO2 leads to properties expected after long-term exposure. It can be assumed that the exposure of the test specimens to a concentration of 100,000 ppm CO2 for 14 days is a credible simulation of long-term exposure to lower concentrations of CO2.
A stronger dependence of the resistivity of the AP and BP mixes compared to the AN and BN mixes on the effect of CO
2 can be reasoned in that the test specimens AP and BP, which have lower resistivity because of a lower number of electrically conductive paths, show a more distinct decrease in resistivity at hither degrees of carbonation. This is because further electrically conductive paths are made accessible as a result of a change in the porous structure. The number of paths made accessible related to the low number of paths in mixes AP and BP and has a relatively more significant influence on resistivity compared to the AN and BN mixes. Mixes AN and BN have relatively low resistivity in almost all noncarbonated matrixes, and new paths made accessible by carbonation do not have such a significant influence [
30,
31,
32,
33,
34].
4.4. Effect of Load
The last factor observed to affect the specific resistance of a cementitious composite was the compressive stress due to loading. The test specimens were loaded to ultimate strength.
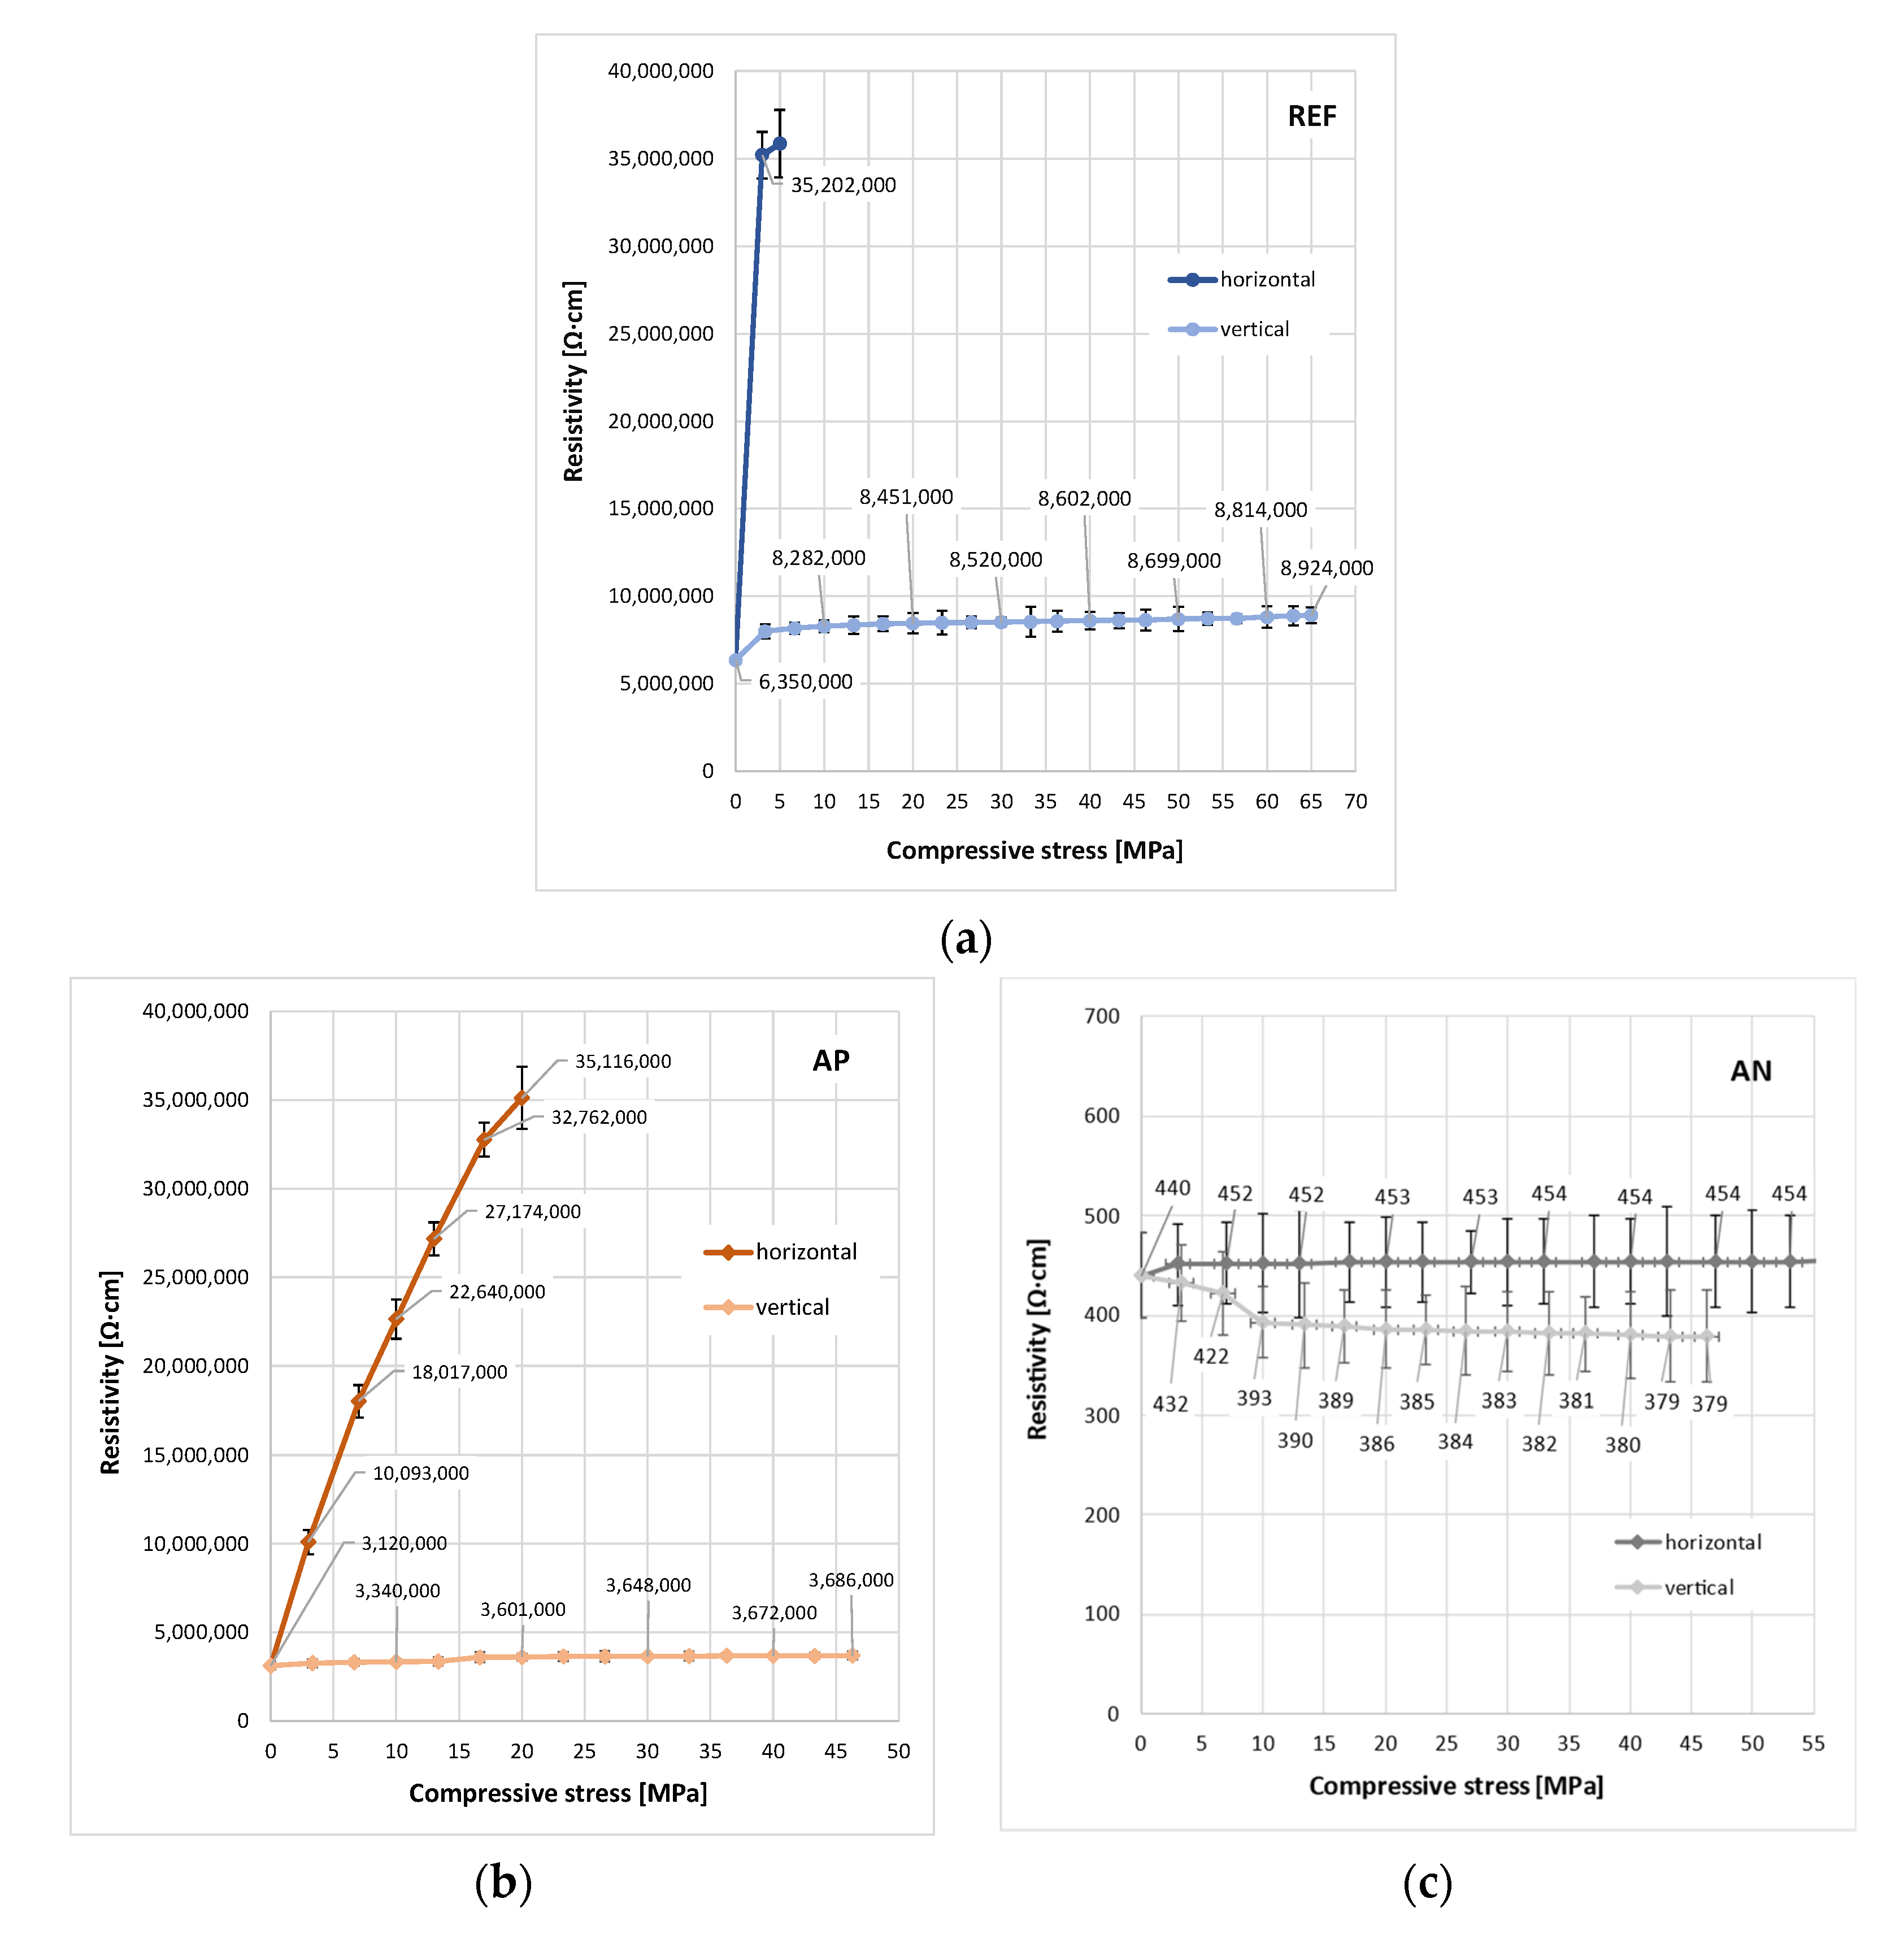
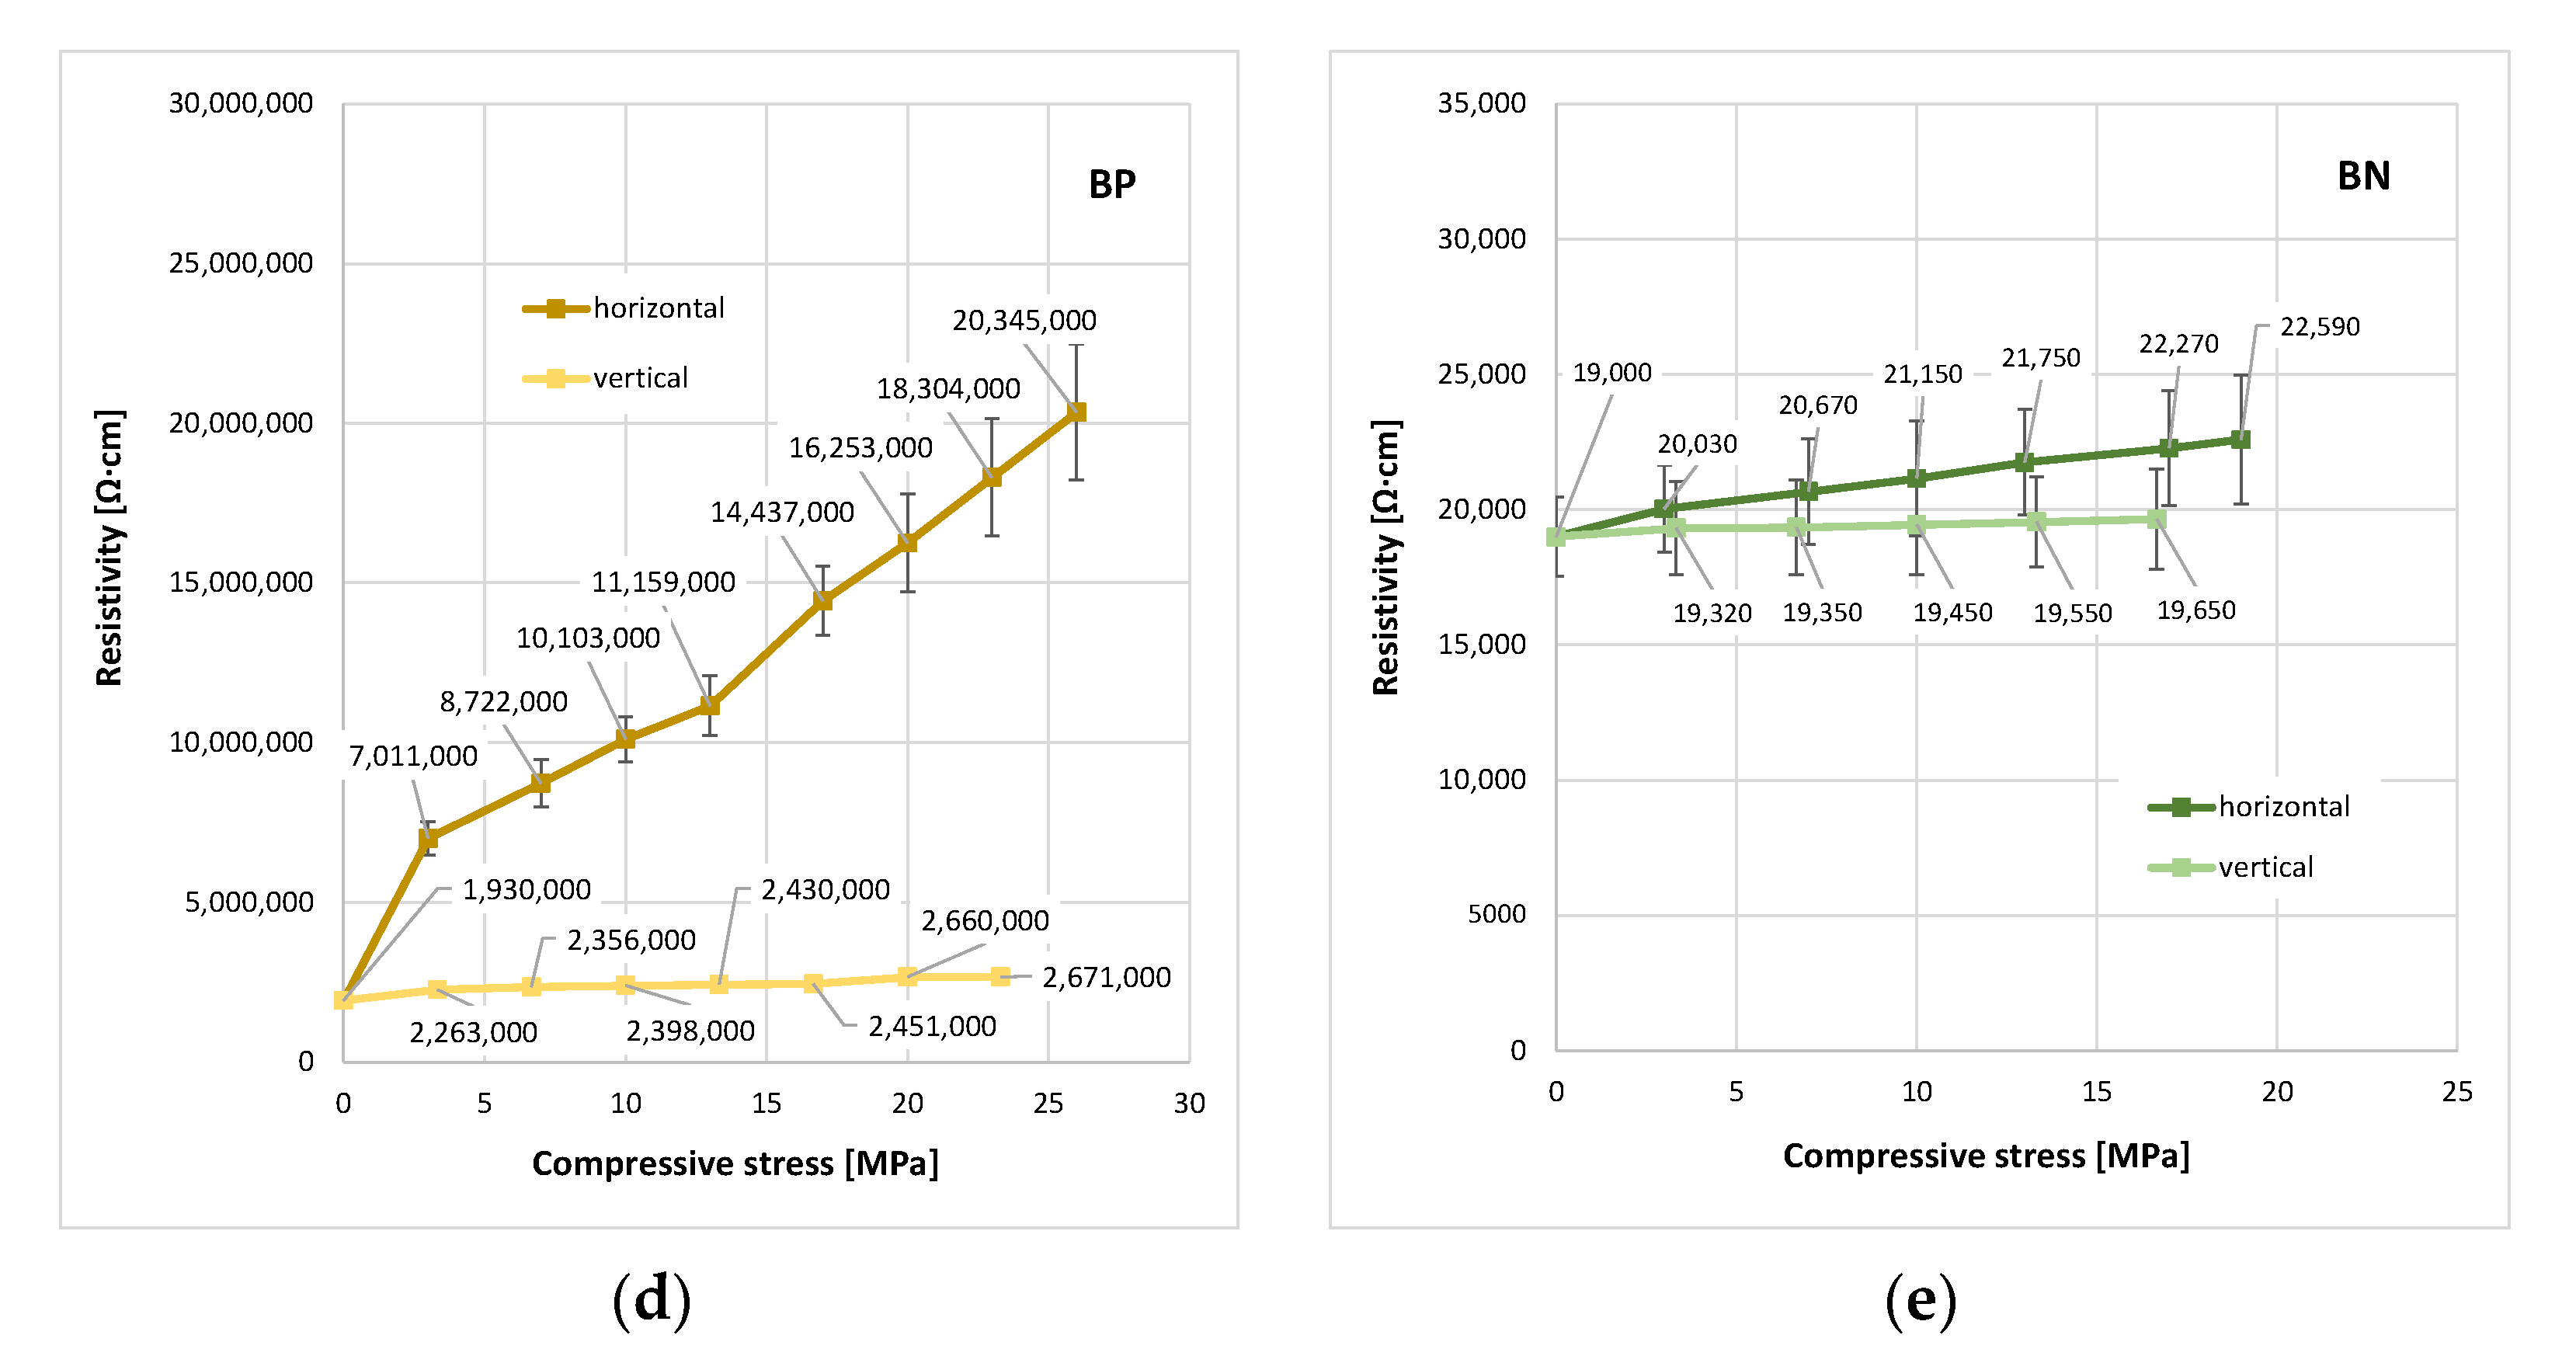
Figure 8 shows the specific resistance values corresponding to the compressive stress values.
It was found that the mixes REF, AP, and BP, with graphite fillers below the percolation thresholds, are highly sensitive to pressure loads [
23,
35,
36,
37]. Trends of dependence of the resistivity on the exerted loads are quite comparable; resistivity grows with increasing load.
The important factor is how the test specimens are oriented during loading. The resistivity of the horizontally loaded samples of mixes REF, AP, and BP grow considerably faster than that of vertically loaded test specimens. While vertical loading induces gradual growth in resistivity by 20–40%, horizontal loading causes increases by approx 10 times, and the final value was only limited by the top of the range of the measuring device. The REF mix showed this value at the beginning of the loading, at approximately 10% of the compressive strength value. The AP samples showed a maximum value at approximately 50% of the compressive strength. Samples of the BP mix reached the ultimate compressive strength.
Mixes AN and BN are much more stable compared to REF, AP, and BP. An increase in the resistivity of AN and BN is minimal with increasing horizontal load. The vertical loading of the BN test specimens showed practically stable results, and the AN mix loaded vertically even shows a slight decrease in resistivity.
Because of the differences in behavior at different orientations of the samples, increases in resistivity at higher pressure loads can be interpreted as follows: Both horizontal and vertical loadings of the test specimens cause a higher density of the matrix, which leads to a disruption of some electrically conductive paths. It can be assumed that the horizontal load causes a slight elongation of the test specimens as a result of the wedging of particles of one layer between particles of underlying layers. This increases the distance between individual particles of graphite and the disruption of further conductive paths. On the other hand, vertical loading causes a slight shortening of the test specimens. This leads to a shortening of the distance between individual particles of graphite, and this creates further conductive paths. The resulting resistivity is then the subtraction of resistivity of the newly formed and disrupted conductive paths.
5. Conclusions
The research studied changes in resistivity depending on the exposure conditions of cement composite materials with fine-grained or coarse-grained graphite in proportions below and above the percolation thresholds. In particular, the influence of temperature, moisture, CO2 action, and vertical loading in two directions was described. The results show a significant influence of the percolation thresholds on the behavior of the individual test mixes. Based on the evaluated experiments and discussions, the following facts were concluded:
The influence of the size of the particles of the individually tested graphite is mainly apparent in the values of the resulting resistivity. If the proportion of graphite is below the percolation threshold, the values of resistivity are quite comparable. However, exceeding the percolation thresholds considerably reduces the resistivity in the case of fine-grained graphite A and, in some exposure conditions, even causes a different character of resistivity changes compared to samples with graphite B.
All four tested exposure conditions showed a comparable character of resistance to change in the mixes with graphite proportions below percolation thresholds, which is different from the character of the resistivity changes in the mixes with graphite proportions above percolation thresholds.
It was found that the resistivity of all tested mixes decreased with increasing moisture. This development of resistivity depending on moisture is extremely significant for mixes with proportions of graphite below percolation thresholds (to around 0.003% of the value of a dry sample compared to that saturated with water). A reduction in the resistivity depending on moisture is much smaller for mixes with graphite proportions above percolation thresholds. The resistivity of fine-grained graphite A connected with increasing moisture decreases to 50% of the dry sample value, although in the case of coarse graphite B, only to ca 0.5% of the dry sample value.
The resistivity of all tested mixes decreases with increasing temperatures; on the other hand, it increases with decreasing temperatures. Mixes with graphite below percolation levels are less sensitive to changes in temperature (increasing 2–4 times when cooled down from 50 °C to −10 °C) compared to mixes with a graphite proportion above percolation thresholds (increasing 5–7 times when cooled down from 50 °C to −10 °C). A permanent increase in the resistivity, which occurs after damage to the microstructure of the composites by frost, is more significant for mixes with graphite proportions under percolation thresholds. Composites with a graphite proportion above percolation thresholds showed nearly no permanent change in resistivity.
The long-term action of increased CO2 levels causes a considerable reduction in the resistivity of all mixes. Similar to the effect of temperature, it is also true for CO2 that mixes with graphite proportions below percolation thresholds show lower sensitivity to CO2 than mixes with graphite proportions above percolation thresholds.
The loading of the test specimens with graphite proportions below percolation thresholds horizontally showed a ten times higher resistivity depending on the increasing load. Vertical loading of these mixes also showed an increase in resistivity (by 20–40%).
The test specimens with graphite proportions above percolation thresholds showed low sensitivity to resistivity change, depending on the increasing load. The test specimens loaded horizontally increased their resistivity, or their resistivity showed no significant changes.
Mixes with graphite A showed interesting results; their resistivity decreased even when the load was increasing.


