1. Introduction
With the implementation of an energy strategy in China [
1]. More and more transmission lines will cross valleys, rivers, and microclimate areas, and icing is inevitable. Because the conductor freezes in a low-temperature environment, the cross-section finally forms an asymmetric circular shape [
2], The section shape will provide greater aerodynamic force for the conductors. Transmission lines will inevitably freeze in winter, and the natural wind would induce the iced lines to produce low-frequency and largeamplitude galloping under certain conditions [
3]. Conductor galloping may damage conductors or other parts, or bring immeasurable economic losses such as line and tower breaking [
4,
5]. The study of aerodynamic characteristics is the basis of this experiment [
6,
7,
8,
9,
10,
11,
12,
13,
14,
15,
16,
17,
18,
19,
20].
In recent years, more and more scholars have researched the mechanization of galloping conductors. First of all, scholars have studied the aerodynamic force of conductors. Li et al. [
21] conducted wind tunnel tests to obtain the static aerodynamic parameters of crescent ice conductors. Rossi et al. [
22] proposed a method for estimating wind and ice loads on conductors. Jafari et al. [
23] believe that the aerodynamic characteristics of cables and conductors are similar, and wind-induced vibration can be studied in the same way. Huang et al. [
24], based on the measured aerodynamic coefficients, identified the large-scale wind-induced vibration of the conductor and distinguished the areas of galloping instability. Then, through numerical simulation or theoretical methods, the obtained aerodynamic force is loaded on a single conductor and multi-bundle conductor to study the galloping of a conductor. Kim et al. [
25] used the commercial software ANSYS fluent to obtain the aerodynamic coefficient of each cross-section and study the vibration of the conductor, which proposed simplified galloping equations of a single conductor. Oh et al. [
26] used the analysis program RecurDyn to model the transmission line as a multi-mass spring damper system to analyze the galloping dynamic phenomenon. In order to study the large-scale vibration of quad-bundle conductors, Matsumiya et al. [
27] successfully simulated large-scale low-frequency galloping in all directions. Hu et al. [
28] have obtained the simulation result of iced quad-bundle conductors galloping simulation results by finite element method, and the aerodynamic parameters are simulated and loaded for the beam element to obtain the influence of environmental parameters on the line structure of iced four bundle conductors. Liu et al. [
1] derived the three-dimensional partial differential galloping equation of the iced quad-bundle conductor, and simplified the galloping partial differential equation by two discrete methods. Cai et al. [
29] exert wind loads on each conductor unit through the finite element method (FEM), and the galloping response of iced eight-bundle conductors is discussed. Ding et al. [
30] analyzed the galloping mode, frequency characteristics, amplitude, and galloping traces of multi-span iced eight-bundle conductors under specific working conditions. Yu et al. [
31] analyzed the oscillation characteristics of iced eight-bundle conductors during the galloping process.
Most scholars have only considered the influence of galloping on single-span bundle conductors or towers. However, to simulate the galloping law in the real environment, the influence of the transmission tower on the whole-span system must be considered. To the knowledge of the authors, the investigation of galloping for eight-bundle conductor transmission lines has not been reported before. In this paper, the galloping characteristics of multi-span conductor transmission lines are comprehensively investigated by the proposed numerical method of FEM for sub-conductors in which the critical parameters can be included. The effects of critical parameters on galloping behaviors are comprehensively analyzed. The purpose of the present research is to develop a useful reference and theoretical foundation based on the obtained results and provides effective anti-galloping technology for the eight-bundle conductor 1000 kV UHV transmission lines.
2. Finite Element Model
A finite element model of an iced eight-bundle conductor tower line system with a span length of 200 m and 400 m is established, as shown in
Figure 1. The model is 8×LGJ-400/50 transmission line is taken as the object. The diameter of the conductor is 30 mm, and the interval between the eight sub-conductors is about 400 mm. The average the weight of spacer used to restrict the mutual movement between sub conductors is 8.5 kg, and the model is FJZ-400. The two transmission towers in the line section are the tangent tower and the tension tower, respectively. The height of the tangent tower is 89 m and the height of the tension tower is 109 m, the height difference between the tangent tower and tension tower is 11 m. The tower comprises round steel pipes, with materials Q235 and Q345 and Young’s modulus of 2.06 × 10
5 MPa, Poisson’s ratio of 0.3, and density of 7.8 kg/m
3. According to the previous research results [
21], the accuracy requirement can be met when the length of the conductor element is about 0.5 m, and the conductor is selected as the cable element, which is obtained by releasing the bending degrees of freedom of the nodes of the spatial Euler beam element [
31]. The spacer can be simplified into a regular octagonal frame, simulated by spatial beam elements, and beam elements also simulate the suspension insulator string. Transmission towers are mainly round steel pipes. The transmission tower is a typical frame structure. In the design code, the towers are generally simplified as a space truss structure, and some are simplified as a space beam structure [
32]. According to the structural details of the tower, the numerical model of the tower can be established. In order to ensure calculation accuracy, the tension tower and tangent tower are divided into 5387 elements and 3366 elements, respectively.
In order to ensure that the conductors do not interfere with each other and are closer to the real working conditions of UHV transmission lines, spacers are installed on them at the same spacing as conductor separation accessories. In order to simulate the most natural situation, a crescent ice covering with 12 mm thickness is added to the conductor, and its initial freezing angle is 60°. In the simulation, the influence of the tower on the whole test is considered, and the conductor is fixedly connected with the spacer and insulator, constraining the conductor’s degree of freedom of the conductor at the corresponding position. In the connection between the insulator string and transmission tower, the displacement in three spatial directions is constrained at the connection, and the constraint of three rotational degrees of freedom is released. The sides of the conductors also constrain the displacement in three spatial directions, and each rotation direction is released. To strive to be the closest to the most real connection state of the transmission line during the modeling process. According to the analysis of the finite element model of the UHV eight-bundle transmission line and the selection of various working conditions, it is finally determined that the case with a unit length of 0.5 m can meet the accuracy requirements of the analysis at the same time. In order to simplify the simulation of the spacer, the regular octagonal frame structure is used to avoid the angle problem caused by abnormal shape. The spatial beam element simulates the suspended insulator string and spacer. We use the Lenovo workstation P320 to simulate various working conditions, with an average calculation time of 143 h.
Crescent ice is the most representative ice shape that occurs most easily in Southwest China. Due to the unique meteorological conditions in Southwest China and the diameter and surface of the conductor, a crescent ice covering with 12 mm thickness is the most common. During the galloping, the shape of the ice does not change. Galloping occurs because ice changes the original aerodynamic parameters of the conductor under the original working condition. There are similar methods in the previous galloping research of four bundle conductors, such as reference [
28]. Two assumptions are made: (1) the icing condition is set as the common crescent shape ice with a uniform thickness of 12 mm to cover the whole section; (2) the crescent ice section is equivalent to a circle. The simulation data is more effective and reliable in the above two ideal equivalent cases. Various mechanical parameters of the conductor in the model are described in
Table 1, and the next step of the numerical calculation is carried out based on the given mechanical parameters. Where
EA is the axial stiffness,
GI is the torsional stiffness, μ is the mass per unit length,
J is the moment of inertia per unit length, and
H is the horizontal tension on the conductor.
3. Analysis of Vibration of Multi-Span Iced Eight-Bundle Conductors Tower Line System
Firstly, the mode of vibration of conductors is analyzed. The low-order modes and natural frequencies of the three-span conductor with a span length of 400 m are obtained in the vertical, horizontal and torsional directions, respectively.
Figure 2 shows the mode of vibration of the low-order of three-span conductor model with a span of 400 m. The low-order natural frequency values are listed in
Table 2. From
Table 2, the third span conductor has the maximum frequency in the same vibration form compared with other spans. The span length significantly affects the mode of the tower line system. With the increase in the span length, the frequency of the conductor decreases. In the tower line system with a span length of 200 m, the first mode of the first span conductor in the vertical direction is a pseudo shock instead of a single half wave, and the frequency reaches 0.38. With a span length of 400 m, two frequencies of 0.353 and 0.465 appear in the three half-waves of the first conductor in the vertical direction.
4. Analysis of Galloping Characteristics of Multi-Span Iced Conductor Model under Wind Load
Numerical models for motion analysis of sub-conductors rely on the quasi-steady theory (QST) [
33,
34,
35,
36]. In order to study the galloping feature of iced conductors, the aerodynamic characteristics should be obtained. These aerodynamic coefficients are acquired through wind tunnel experiments. The Re of conductors is less than 1.5 × 10
5, it belongs to the sub-critical region. They pointed out that the aerodynamic coefficients acquired by the quasi-steady wind tunnel experiment could be reasonable descriptions of the conductor motion phenomena in uniform and turbulent flows.
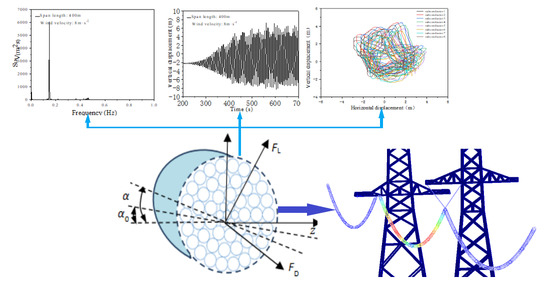
The main purpose of this section is to conduct a preliminary analysis of the galloping process of the model. Firstly, the galloping characteristics of the model are analyzed theoretically. Under the action of wind load, iced conductors are accompanied by certain lifts and torsions. Therefore, the wind-induced vibration of conductors is a complex coupling process, aerodynamic coefficients are shown in
Figure 3. The specific formulas related to aerodynamic loads such as drag
FD, lift
FL, and torque M acting on the conductor are as follows:
ρ is air density;
U is the wind velocity;
d is the diameter of the iced sub-conductor.
Cd(α) is the drag coefficient,
CL(α) is the lift coefficient,
CM(α) is the moment coefficient; the angle of wind attack α is defined as follows:
is the torsion angle, R is the conductor radius, is the torsion angle speed and is the speed in the vertical direction. The formula of the standard value of wind load on insulator strings is:
W0 is the standard value of wind pressure. μz is the wind pressure height variation coefficient; μs is the shape coefficient; Ai is the calculated wind pressure area of insulator strings.
WS is the calculation formula of wind load acting on the transmission tower:
βz is the wind load adjustment coefficient of the transmission tower; As is the wind pressure area of the component, and the calculation formula of the wind vibration coefficient is:
ξ is the pulsation amplification coefficient; ε1 is considered the influence coefficient of wind pressure fluctuation and wind pressure height; ε2 is the influence coefficient of structure shape.
Figure 3.
Aerodynamic coefficients of sub-conductors with crescent-shaped ice varying with angle of wind attack (ice thickness: 12 mm).
Figure 3.
Aerodynamic coefficients of sub-conductors with crescent-shaped ice varying with angle of wind attack (ice thickness: 12 mm).
5. Galloping Characteristics of Conductors of Tower Line System
Firstly, the galloping process of three spans of iced eight-bundle conductors with a span length of 200 m and 400 m under wind velocity of 8 m/s are numerically simulated, respectively.
Figure 4 shows the spectrum diagram of each span midpoint of the phase C conductor. It can be seen that simulated data of galloping of each span of the conductor is basically stable.
The vibration form of the conductor of a span length of 200 m can be seen in
Figure 3, The low-order vertical vibration form of the first span is a pseudo base wave, rather than a single half wave, and the frequency approach is 0.389 Hz. The vibration frequencies of the other two spans are close to the natural frequency of 0.245 Hz in
Table 2, that is, the conductor galloping form is a single half wave. In the horizontal direction, the vibration frequency of the three spans is also close to its lower order natural frequency of 0.239 Hz, 0.237 Hz, and 0.250 Hz.
As can be seen in
Figure 5, the vertical and horizontal orientation of the second and third spans of the conductor of a span length of 400 m merely excite the vibration of a single low-order mode. Vertical direction frequency is close to 0.143 Hz and 0.141 Hz, respectively, and close to 0.136 Hz in both directions horizontally. The vibration form is a single half wave of low order. While the first span excites the three vibrations of mode, all of these are three half waves in different forms, frequencies are close to 0.353 Hz and 0.465 Hz. For vibration in the torsion direction in each span, it is obvious that violent torsion has occurred. Among them, multiple peak values appeared in three torsion spectrum diagrams. It is shown that in the excited multi-order vibration of the conductor on the torsion, each peak value is close to the torsional low-order natural frequency, The vibration form is three half waves. Each span response has the same frequency characteristics. The results show that the wave response frequency characteristic of the conductor is complicated, but the vibration mode is unchanged. Compared with Ding’s [
30] results, we choose the third span as the comparison object, because the third span conductors are connected to the tower by the tangent method in both models. Under the same working condition, as shown in
Figure 6a–c, after considering the transmission tower, the frequency of the conductor in vertical and horizontal directions is obviously smaller than that without the tower, this is the impact of transmission tower stiffness. The conductor excites multiple natural frequencies in the torsional, indicating that multiple vibrations are multiple, which is more consistent with the real environment.
6. The Influence of Different Parameters on Galloping of Tower Line Systems
6.1. The Influence of Different Suspension Methods of Conductor on Galloping
This section studies the galloping of conductors under the condition that the conductor adopts different suspension methods. The galloping displacement of different positions is different at the same time. In the overall state, the vertical displacement is slightly larger than the horizontal displacement, and the vertical vibrations are more obvious. The vertical displacement of the third span is the largest, but the torsional angle of the second span is the largest. Compared with the conclusion of Ding et al. [
30], due to the three rotational degrees of freedom being released, the horizontal amplitude and torsion angle are larger than the model results of the model that six degrees of freedom are restricted, and the vertical amplitude is slightly larger.
In this model, the connections methods between the conductor and the tower are set to the following two different states: one end of the conductor of the first span and second span are connected with the tension tower, while the other end of the conductors of the second span and third span are suspended with the tangent tower by a V-type insulator string. The tension tower can support the transverse tension of some conductors; the conductor is directly suspended on the tangent tower by insulated parts and cannot bear transverse tension. Two suspension methods are shown in
Figure 7. Taking the typical working condition with a wind velocity of 8 m/s and initial angle of wind attack of 60° as an example, the conductors galloping amplitude at the midpoint of three spans of phase A are shown in
Figure 8, respectively. The third span conductor is not connected with the tension tower, and compared to the results of the first span conductor, the horizontal and vertical amplitude is much more than the first span conductor’s galloping amplitude, the reason can be summed down to, the end of the first span conductor received a large lateral tension. Therefore, it can be concluded that the suspension methods of the conductor have a great influence on the galloping mode of the conductor, and the conductor connected with a tangent tower will produce a relatively large amplitude. After the horizontal comparison of the conductor galloping situation, it can be found that the horizontal vibration displacement of the conductor is more uniform, while the vertical vibration displacement appears in the fault-type movement traces, and the movement is more uneven and unstable. It is found that different suspension modes have an obvious influence on amplitudes. From the results of
Figure 8, it is found the conductor in phase A is under a large wind load in the whole system, and the galloping amplitude and torsion are more unstable.
6.2. The Influence of Wind Velocity on Conductor Galloping
Flexible structures in flowing fluid may exhibit vortex-induced vibration (VIV), which depends on the flow velocity in fundamental or a higher-order mode [
37]. The influence of wind velocity on conductor galloping is one of the most direct and obvious factors among all the parameters studied. Wind load generally affects the galloping state of the model by affecting the aerodynamic force on the conductor, and different wind velocities have different effects. This section mainly studies the impact of wind velocity in combination with some data obtained from research. The galloping response of the conductor span length of 200 m is calculated, when the wind velocity increases from 4 m/s to 12 m/s, and the initial angle of wind attack is 60°. The model galloping results obtained are shown in
Table 3 and
Figure 9a–c.
Meanwhile, the wind velocity has a great influence on the galloping amplitude and trace of the conductor. Compared with Ding’s [
30] results, in the same case, after considering the transmission tower, as shown in
Table 4, the galloping amplitude of the conductor is slightly larger. The time history displacement curve of the conductor is more like a fish bone. As shown in
Figure 9d, the galloping trace is more chaotic. As the wind velocity increased from 4 m/s to 12 m/s, the galloping amplitude increased significantly. It is worth noting that the horizontal displacement of each span is basically less than the vertical displacement, and the trace diagram of each span is mainly elliptical, which can show that the vibration situation is mainly vertical direction vibration. Under wind velocity of 8 m/s, the galloping trace of the conductor becomes chaotic, with the shape of 8. According to
Table 3, under the wind velocity of 12 m/s, the horizontal displacement of the conductor is even less than the results under the wind velocity of 8 m/s, while the vertical displacement is much greater than the results under the wind velocity of 8 m/s. It can be considered that the energy is mainly excited by the conductor in the vertical direction under the wind velocity of 12 m/s.
6.3. The Influence of Initial Angle of Wind Attack on Galloping
In the real environment, the range of angle of wind attack is generally not more than 60°, and the conductor will not gallop below 30°. Additionally, 30° and 60° are selected as the most representative angles. The vibration of a conductor with a span length of 200 m is simulated under the different initial angles of wind attack. Four typical cases are selected: one’s wind velocity is 8 m/s, angle of wind attack is 60°; two’s wind velocity is 4 m/s, angle of wind attack is 60°; three’s wind velocity is 8 m/s, angle of wind attack is 30°; four’s wind velocity is 4 m/s, angle of wind attack is 30°; as specific study parameters. Select the same midpoint of the conductor for comparison, and the resulting conductor galloping situation is shown in
Figure 10.
It can be seen from the above galloping amplitude that the angle of attack has a great influence on the vibration of the conductor. Compared with the amplitude of the angle of attack of 30 and 60 under the wind velocity of 8 m/s, respectively, especially when the angle of attack is increased to 60, and the amplitude of the conductor is significantly increased. Comparing working cases 2 and 3, we can see that the amplitude of case 2 is greater than case 3, so the angle of wind attack has a greater impact on the galloping amplitude than wind velocity. Comparing working cases 1 and 2, the wind velocity has a great impact on the starting galloping time of the conductor. As the wind velocity increases, the earlier the conductor starts to gallop. With the increase in the angle of wind attack, the nonlinear galloping ability of the conductor is more obvious, the galloping becomes more intense, compared with the small angle of wind attack, the amplitude is more chaotic under the larger angle of wind attack. Using the Den Hartog and Nigol theory [
38,
39] and this data simulation, we can conclude that the initial wind attack angle may gallop within the 60 range, and the angle of wind attack is also one of the significant factors of conductor galloping.
6.4. The Influence of Different Span Lengths on Galloping
This section studies the influence of different span lengths on the galloping of the conductor in the whole tower line system. The galloping characteristics of each phase midpoint are selected as the research object. The table summarizes the midpoints of each phase galloping amplitude data for the different span lengths.
As can be seen from
Table 5, compared with the galloping results of 200 m and 400 m span length, the galloping amplitude becomes more intense with the span length increasing under the same working cases, and the maximum value is the vertical displacement of phase A in span length of 400 m, reaching 15.57 m. The vertical galloping amplitude excited at a span length of 400 m under wind velocity 4 m/s is much greater than the horizontal amplitude, while it is noteworthy that the vertical amplitude at 400 m span length increases with increasing suspension height, while the opposite horizontal amplitude decreases with increasing suspension height. The reason can be attributed to that that the conductor of phase A is subjected to a greater aerodynamic load and that the suspension position of the conductor of phase A is more unstable relative to the other positions of the tower body.
7. Conclusions
The galloping situation of the tower line coupling system is analyzed by finite element simulation. The galloping characteristics of the conductor under the wind velocity, suspension mode, span length, and angle of wind attack are compared and analyzed. Finally, based on the galloping characteristics of the model, the motion mode, frequency characteristics, vibration amplitude, and trace of the conductor are analyzed:
(1) Wind velocity has a great impact on the galloping behavior of the system model. With the increased wind load input energy, the conductor galloping becomes more intense. The multiple peak values of the torsion spectrum appear, indicating that a variety of low-order vibrations are excited at the same time. The low-order vibration form in the first midpoint vertical vibration at the span length of 200 m is a pseudo base wave rather than a single half wave, while multiple peaks are excited in the vertical vibration spectrum of the first span with a span length of 400 m. Each span response has the same frequency characteristics. The results show that the frequency response characteristic of the conductor is complicated, but the vibration mode is unchanged.
(2) As the increasing of angle of wind attack, the nonlinear galloping ability of the conductor becomes more obvious and the galloping becomes more intense, compared with the small angle of the wind attack, the galloping amplitude is more chaotic under the larger angle of wind attack. Using the Den Hartog theory and this data simulation, we can conclude that the initial angle of wind attack may gallop within the 60° range. The angle of wind attack has a greater impact on the galloping amplitude than the wind velocity.
(3) The different connection methods of the conductor and the tower body will also have a certain influence on the transmission line, and the vertical amplitude of the conductor connected by the tangent tower suspension method is the largest. As the span length increases, the amplitude of each span also increases, while the frequency relatively decreases. At a large span length and higher wind velocity, the vertical amplitude increases with the increase in the suspension height. On the contrary, the horizontal amplitude decreases with the increase of the suspension height, and the energy is mainly excited by the conductor in the vertical direction.
The purpose of the present research is to develop a useful reference and theoretical foundation based on the obtained results and provides effective antigalloping technology for the eight-bundle conductor 1000 kV UHV transmission lines.
Author Contributions
Conceptualization, M.C. and B.T.; methodology, L.Z.; software, H.H.; validation, S.D., J.L. and M.H.; formal analysis, M.C.; investigation, B.T.; resources, L.Z.; data curation, H.H.; writing—original draft preparation, B.T.; writing—review and editing, B.T.; visualization, H.H.; supervision, M.C.; project administration, M.C.; funding acquisition, M.C. All authors have read and agreed to the published version of the manuscript.
Funding
This work is financially supported by the National Natural Science Foundation of China (51507106), Postdoctoral Research Foundation of China (51507106), Chengdu International Science and Technology Cooperation Support Funding (2020-GH02-00059-HZ) and Open Research Fund of Failure Mechanics and Engineering Disaster Prevention, Key Laboratory of Sichuan Province, Sichuan University (FMEDP202201).
Data Availability Statement
The data presented in this study are available in this article.
Conflicts of Interest
The authors declare no conflict of interest.
References
- Liu, X.; Min, G.; Cai, M.; Yan, B.; Wu, C. Two Simplified Methods for Galloping of Iced Transmission Lines. KSCE J. Civ. Eng. 2021, 25, 272–290. [Google Scholar] [CrossRef]
- Cai, M.; Zhou, L.; Lei, H.; Huang, H. Wind Tunnel Test Investigation on Unsteady Aerodynamic Coefficients of Iced 4-Bundle Conductors. Adv. Civ. Eng. 2019, 2019, 2586242. [Google Scholar] [CrossRef]
- Liu, X.; Zou, M.; Wu, C.; Cai, M.; Min, G.; Yang, S. Galloping Stability and Wind Tunnel Test of Iced Quad Bundled Conductors considering Wake Effect. Discret. Dyn. Nat. Soc. 2020, 2020, 8885648. [Google Scholar] [CrossRef]
- Lou, W.; Lv, J.; Huang, M.; Yang, L.; Yan, D. Aerodynamic force characteristics and galloping analysis of iced bundled conductors. Wind Struct. Int. J. 2014, 18, 135–154. [Google Scholar] [CrossRef]
- Doocy, E.S.; Hard, A.R.; Rawlins, C.B.; Ikegami, R. Transmission Line Reference Book: Wind-Induced Conductor Motion; EPRI: Palo Alto, CA, USA, 2009. [Google Scholar]
- Chabart, O.; Lilien, J. Galloping of electrical lines in wind tunnel facilities. J. Wind Eng. Ind. Aerodyn. 1998, 74–76, 967–976. [Google Scholar] [CrossRef]
- Wardlaw, R.L.; Cooper, K.R.; Ko, R.G.; Watts, J.A. Wind tunnel and analytical investigations into the aeroelastic behaviour of bundled conductors. IEEE Trans. Power Appar. Syst. 1975, 94, 642–654. [Google Scholar] [CrossRef]
- Price, S. Wake induced flutter of power transmission conductors. J. Sound Vib. 1975, 38, 125–147. [Google Scholar] [CrossRef]
- Belloli, M.; Melzi, S.; Negrini, S.; Squicciarini, G. Numerical Analysis of the Dynamic Response of a 5-Conductor Expanded Bundle Subjected to Turbulent Wind. IEEE Trans. Power Deliv. 2010, 25, 3105–3112. [Google Scholar] [CrossRef]
- Diana, G.; Belloli, M.; Giappino, S.; Manenti, A.; Mazzola, L.; Muggiasca, S.; Zuin, A. Wind Tunnel Tests on Two Cylinders to Measure Subspan Oscillation Aerodynamic Forces. IEEE Trans. Power Deliv. 2014, 29, 1273–1283. [Google Scholar] [CrossRef]
- Diana, G.; Belloli, M.; Giappino, S.; Manenti, A.; Mazzola, L.; Muggiasca, S.; Zuin, A. A Numerical Approach to Reproduce Subspan Oscillations and Comparison With Experimental Data. IEEE Trans. Power Deliv. 2014, 29, 1311–1317. [Google Scholar] [CrossRef]
- Carmo, B.S.; Assi, G.R.; Meneghini, J.R. Computational simulation of the flow-induced vibration of a circular cylinder subjected to wake interference. J. Fluids Struct. 2013, 41, 99–108. [Google Scholar] [CrossRef]
- Borna, A.; Habashi, W.G.; Nadarajah, S.K.; McClure, G. A Computational Aeroelastic Approach to Predict Galloping of Iced Conductors with 3 Degrees of Freedom. In Proceedings of the 14th International Workshop on Atmospheric Icing of Structures, Chongqing, China, 8–13 May 2011. [Google Scholar]
- Spalart, P.R.; Allmaras, S.R. A one-equation turbulence model for aerodynamic flows. In Proceedings of the 30th Aerospace Sciences Meeting and Exhibit, Reno, NV, USA, 6–9 January 1992. [Google Scholar]
- Prasanth, T.; Mittal, S. Vortex-induced vibration of two circular cylinders at low Reynolds number. J. Fluids Struct. 2009, 25, 731–741. [Google Scholar] [CrossRef]
- Ma, W.; Liu, Q.; Du, X.; Wei, Y. Effect of the Reynolds number on the aerodynamic forces and galloping instability of a cylinder with semi-elliptical cross sections. J. Wind Eng. Ind. Aerodyn. 2015, 146, 71–80. [Google Scholar] [CrossRef]
- Piccardo, G.; Pagnini, L.C.; Tubino, F. Some research perspectives in galloping phenomena: Critical conditions and post-critical behavior. Contin. Mech. Thermodyn. 2015, 27, 261–285. [Google Scholar] [CrossRef]
- Alonso, G.; Meseguer, J.; Sanz-Andrés, A.; Valero, E. On the galloping instability of two-dimensional bodies having elliptical cross-sections. J. Wind Eng. Ind. Aerodyn. 2010, 98, 438–448. [Google Scholar] [CrossRef]
- Fu, X.; Wang, J.; Li, H.-N.; Li, J.-X.; Yang, L.-D. Full-scale test and its numerical simulation of a transmission tower under extreme wind loads. J. Wind Eng. Ind. Aerodyn. 2019, 190, 119–133. [Google Scholar] [CrossRef]
- Aboshosha, H.; Elawady, A.; El Ansary, A.; El Damatty, A. Review on dynamic and quasi-static buffeting response of transmission lines under synoptic and non-synoptic winds. Eng. Struct. 2016, 112, 23–46. [Google Scholar] [CrossRef]
- Li, X.-M.; Nie, X.-C.; Zhu, Y.-K.; Yi, Y.; Yan, Z.-T. Wind Tunnel Tests on Aerodynamic Characteristics of Ice-Coated 4-Bundled Conductors. Math. Probl. Eng. 2017, 2017, 1628173. [Google Scholar]
- Rossi, A.; Jubayer, C.; Koss, H.; Arriaga, D.; Hangan, H. Combined effects of wind and atmospheric icing on overhead transmission lines. J. Wind Eng. Ind. Aerodyn. 2020, 204, 104271. [Google Scholar] [CrossRef]
- Jafari, M.; Hou, F.; Abdelkefi, A. Wind-induced vibration of structural cables. Nonlinear Dyn. 2020, 100, 351–421. [Google Scholar] [CrossRef]
- Hung, P.V.; Yamaguchi, H.; Isozaki, M.; Gull, J.H. Large amplitude vibrations of long-span transmission lines with bundled conductors in gusty wind. J. Wind Eng. Ind. Aerodyn. 2014, 126, 48–59. [Google Scholar] [CrossRef]
- Kim, J.-W.; Sohn, J.-H. Galloping Simulation of the Power Transmission Line under the Fluctuating Wind. Int. J. Precis. Eng. Manuf. 2018, 19, 1393–1398. [Google Scholar] [CrossRef]
- Oh, Y.-J.; Sohn, J.-H. Stability Evaluation of the Transmission Line by using Galloping Simulation. Int. J. Precis. Eng. Manuf. 2020, 21, 2139–2147. [Google Scholar] [CrossRef]
- Matsumiya, H.; Nishihara, T.; Yagi, T. Aerodynamic modeling for large-amplitude galloping of four-bundled conductors. J. Fluids Struct. 2018, 82, 559–576. [Google Scholar] [CrossRef]
- Hu, J.; Yan, B.; Zhou, S.; Zhang, H. Numerical Investigation on Galloping of Iced Quad Bundle Conductors. IEEE Trans. Power Deliv. 2012, 27, 784–792. [Google Scholar] [CrossRef]
- Cai, M.-Q.; Zhou, L.-S.; Xu, Q.; Yang, X.-H.; Liu, X.-H. Galloping response of sector-shape iced eight bundle conductors. Can. J. Civ. Eng. 2020, 47, 1201–1213. [Google Scholar] [CrossRef]
- Ding, S.L.; Mengqi, C.; Tian, B. Numerical Simulation of Galloping Characteristics of Multi-Span Iced Eight-Bundle Conductors. Front. Energy Res. 2022, 919. [Google Scholar] [CrossRef]
- Yu, L.; Mengqi, C.; Qingyuan, W.; Linshu, Z.; Qian, X.; Shunli, D.; Jun, L.; Chunlin, H. Numerical Analysis on the Sub-Span Oscillation of Iced Eight-Bundle Conductors During Galloping. Front. Energy Res. 2022, 10, 396. [Google Scholar] [CrossRef]
- Yan, B.; Liu, X.; Lv, X.; Zhou, L. Investigation into galloping characteristics of iced quad bundle conductors. J. Vib. Control 2016, 22, 965–987. [Google Scholar] [CrossRef]
- Wang, J.; Lilien, J.L. Overhead electrical transmission line galloping: A full multi-Span 3-DOF model, some applications and design recommendations. IEEE Trans. Power Deliv. 1998, 13, 909–916. [Google Scholar] [CrossRef]
- Barrero-Gil, A.; Sanz-Andrés, A.; Alonso, G. Hysteresis in transverse galloping: The role of the inflection points. J. Fluids Struct. 2009, 25, 1007–1020. [Google Scholar] [CrossRef]
- Raeesi, A.; Cheng, S.; Ting, D.S.-K. Aerodynamic damping of an inclined circular cylinder in unsteady flow and its application to the prediction of dry inclined cable galloping. J. Wind Eng. Ind. Aerodyn. 2013, 113, 12–28. [Google Scholar] [CrossRef]
- Cai, M.; Yang, X.; Huang, H.; Zhou, L. Investigation on Galloping of D-Shape Iced 6-Bundle Conductors in Transmission Tower Line. KSCE J. Civ. Eng. 2020, 24, 1799–1809. [Google Scholar] [CrossRef]
- Zhang, M.; Wu, T.; Øiseth, O. Vortex-induced vibration control of a flexible circular cylinder using a nonlinear energy sink. J. Wind Eng. Ind. Aerodyn. 2022, 229, 105163. [Google Scholar] [CrossRef]
- Hartog, J. Transmission Line Vibration Due to Sleet. Trans. Am. Inst. Electr. Eng. 2013, 51, 1074–1076. [Google Scholar] [CrossRef]
- Nigol, O.; Clarke, G.J.; Havard, D.G. Torsional stability of bundle conductors. IEEE Trans. Power Appar. Syst. 1977, 96, 1666–1674. [Google Scholar] [CrossRef]
Figure 1.
Multi-span iced eight-bundle conductor tower line system finite element model.
Figure 1.
Multi-span iced eight-bundle conductor tower line system finite element model.
Figure 2.
Low-order mode of three spans with span of 400 m iced eight-bundle conductor: (a) Vibration form of vertical; (b) Vibration form of horizontal; (c) Vibration form of torsional.
Figure 2.
Low-order mode of three spans with span of 400 m iced eight-bundle conductor: (a) Vibration form of vertical; (b) Vibration form of horizontal; (c) Vibration form of torsional.
Figure 4.
Midpoint spectrum diagram of each span of conductor under wind velocity of 8 m/s with span length: 200 m: (a) Spectrum diagram of the first span conductor; (b) Spectrum diagram of the second span conductor; (c) Spectrum diagram of the third span conductor.
Figure 4.
Midpoint spectrum diagram of each span of conductor under wind velocity of 8 m/s with span length: 200 m: (a) Spectrum diagram of the first span conductor; (b) Spectrum diagram of the second span conductor; (c) Spectrum diagram of the third span conductor.
Figure 5.
Midpoint spectrum diagram of each span of conductor under wind velocity of 8 m/s with span length: 400 m: (a) Spectrum diagram of the first span conductor; (b) Spectrum diagram of the second span conductor; (c) Spectrum diagram of the third span conductor.
Figure 5.
Midpoint spectrum diagram of each span of conductor under wind velocity of 8 m/s with span length: 400 m: (a) Spectrum diagram of the first span conductor; (b) Spectrum diagram of the second span conductor; (c) Spectrum diagram of the third span conductor.
Figure 6.
Spectrum comparison of the third span of conductor under wind velocity of 8 m/s With span length: 200 m: (a) Frequency spectrum diagram in vertical direction; (b) Frequency spectrum diagram in horizontal direction; (c) Frequency spectrum diagram in torsion.
Figure 6.
Spectrum comparison of the third span of conductor under wind velocity of 8 m/s With span length: 200 m: (a) Frequency spectrum diagram in vertical direction; (b) Frequency spectrum diagram in horizontal direction; (c) Frequency spectrum diagram in torsion.
Figure 7.
Schematic diagram of the conductor suspension methods: (a) Suspension method of tension tower; (b) Suspension method of tangent tower.
Figure 7.
Schematic diagram of the conductor suspension methods: (a) Suspension method of tension tower; (b) Suspension method of tangent tower.
Figure 8.
The amplitude of phase A of each span conductor under different suspension methods: (a) First span midpoint displacement time history; (b) Second span midpoint displacement time history; (c) Third span midpoint displacement time history.
Figure 8.
The amplitude of phase A of each span conductor under different suspension methods: (a) First span midpoint displacement time history; (b) Second span midpoint displacement time history; (c) Third span midpoint displacement time history.
Figure 9.
Trace diagram of Conductor displacement: (a) Trace diagram of the midpoint displacement at wind velocity 4 m/s; (b) Trace diagram of the midpoint displacement at wind velocity 8 m/s; (c) Trace diagram of the midpoint displacement at wind velocity 12 m/s; (d) Ding’s trace diagram of the midpoint displacement at wind velocity 8 m/s.
Figure 10.
Galloping situation of conductor under different wind velocities and different initial angle of attack.
Figure 10.
Galloping situation of conductor under different wind velocities and different initial angle of attack.
Table 1.
Physical and mechanical parameters of iced conductor.
Table 1.
Physical and mechanical parameters of iced conductor.
| EA (×106 N) | GI (Nm2/rad) | Μ (kg/m) | J (×10−4 kg m) | H (×103 N) |
|---|
| 31.7 | 1057 | 1.733 | 2.69 | 32.19 |
Table 2.
Low-order mode of three spans iced eight-bundle conductor.
Table 2.
Low-order mode of three spans iced eight-bundle conductor.
| Vibration Direction | Vibration Mode | Frequency (Hz) |
|---|
| 200 m | 400 m |
|---|
| First Span | Second Span | Third Span | First Span | Second Span | Third Span |
|---|
| Vertical | Single half
(Pseudo-based) | 0.389 | 0.245 | 0.245 | 0.136 | 0.143 | 0.141 |
| Double half | 0.475 | 0.472 | 0.488 | 0.271 | 0.269 | 0.271 |
| Three half | 0.737 | 0.727 | 0.736 | 0.353/0.465 | 0.412 | 0.458 |
| Horizontal | Single half | 0.239 | 0.237 | 0.250 | 0.136 | 0.136 | 0.137 |
| Double half | 0.478 | 0.473 | 0.496 | 0.273 | 0.273 | 0.275 |
| Three half | 0.713 | 0.720 | 0.747 | 0.409 | 0.410 | 0.412 |
| Torsion | Single half | 0.368 | 0.319 | 0.401 | 0.271 | 0.263 | 0.291 |
| Single half | 0.514 | 0.517 | 0.538 | 0.320 | 0.323 | 0.339 |
| Three half | 0.774 | 0.767 | 0.795 | 0.443 | 0.444 | 0.456 |
Table 3.
Galloping amplitude of each span conductor at wind velocity of 8 m/s.
Table 3.
Galloping amplitude of each span conductor at wind velocity of 8 m/s.
| Wind Velocity | Phase | Vibration Direction (m) | First Span | Second Span | Third Span |
|---|
| 4 m/s | A | Vertical | 2.04 | 2.70 | 1.99 |
| Horizontal (m) | 1.02 | 1.69 | 1.25 |
| B | Vertical (m) | 2.14 | 2.56 | 2.69 |
| Horizontal (m) | 1.25 | 1.55 | 1.43 |
| C | Vertical (m) | 1.99 | 2.66 | 1.75 |
| Horizontal (m) | 1.17 | 2.35 | 1.01 |
| 8 m/s | A | Vertical (m) | 7.64 | 9.56 | 7.51 |
| Horizontal (m) | 7.67 | 3.45 | 7.47 |
| B | Vertical (m) | 7.96 | 10.07 | 9.64 |
| Horizontal (m) | 6.61 | 7.41 | 9.21 |
| C | Vertical (m) | 9.09 | 10.08 | 8.35 |
| Horizontal (m) | 7.74 | 7.41 | 6.56 |
| 12 m/s | A | Vertical (m) | 14.40 | 11.95 | 15.12 |
| Horizontal (m) | 6.11 | 6.16 | 6.55 |
| B | Vertical (m) | 13.09 | 14.61 | 14.59 |
| Horizontal (m) | 5.91 | 6.08 | 10.80 |
| C | Vertical (m) | 14.36 | 15.74 | 15.31 |
| Horizontal (m) | 6.61 | 6.18 | 13.38 |
Table 4.
Galloping amplitude comparison of each span conductor at wind velocity of 8 m/s.
Table 4.
Galloping amplitude comparison of each span conductor at wind velocity of 8 m/s.
| NO. | Vertical (m) | Horizontal (m) |
|---|
| Test Data | Ding’s Data | Test Data | Ding’s Data |
|---|
| First span | 9.09 | 7.92 | 7.74 | 2.95 |
| Second span | 10.08 | 8.05 | 7.41 | 3.41 |
| Third span | 8.35 | 8.64 | 6.56 | 3.42 |
Table 5.
Galloping amplitude of conductor with different span lengths in different wind velocity.
Table 5.
Galloping amplitude of conductor with different span lengths in different wind velocity.
| Wind Velocity | Phase | Vibration Direction | 200 m | 400 m |
|---|
| 4 m/s | A | Vertical (m) | 2.70 | 8.49 |
| Horizontal (m) | 1.69 | 3.98 |
| B | Vertical (m) | 2.56 | 7.55 |
| Horizontal (m) | 1.55 | 3.49 |
| C | Vertical (m) | 2.66 | 8.07 |
| Horizontal (m) | 2.35 | 2.60 |
| 8 m/s | A | Vertical (m) | 9.56 | 15.57 |
| Horizontal (m) | 3.45 | 8.29 |
| B | Vertical (m) | 10.07 | 13.95 |
| Horizontal (m) | 7.41 | 9.20 |
| C | Vertical (m) | 10.08 | 13.08 |
| Horizontal (m) | 7.41 | 10.12 |
| Publisher’s Note: MDPI stays neutral with regard to jurisdictional claims in published maps and institutional affiliations. |
© 2022 by the authors. Licensee MDPI, Basel, Switzerland. This article is an open access article distributed under the terms and conditions of the Creative Commons Attribution (CC BY) license (https://creativecommons.org/licenses/by/4.0/).


 ,
, 


