Article

Assessment of the Retrofit Strategies on Thermal Insulation Applied in Buildings Located on the Southern Border of the EU: The Case of the Canary Islands

by
Eduardo González-Díaz
1,
José Miguel Márquez-Martinón
1,
Ana Pérez-García
1,
Norena Martín-Dorta
1 and
Benjamín González-Díaz
2,*
1
Departamento de Técnicas y Proyectos en Ingeniería y Arquitectura, Universidad de La Laguna (ULL), 38200 San Cristóbal de La Laguna, Spain
2
Departamento de Ingeniería Industrial, Escuela Superior de Ingeniería y Tecnología, Universidad de La Laguna (ULL), 38206 San Cristóbal de La Laguna, Spain
*
Author to whom correspondence should be addressed.
Buildings 2022, 12(11), 1994; https://doi.org/10.3390/buildings12111994
Submission received: 3 October 2022 / Revised: 1 November 2022 / Accepted: 11 November 2022 / Published: 16 November 2022

Abstract

:
Nowadays, a large amount of the total primary energy is consumed by buildings, accounting for about 40% of the total energy demand. Aligned with the EU objectives and the strategies to reduce the demand, cooling and heating are stated as the most energy consuming processes and the building envelope plays an important role to reduce the energy consumption. In this work, the energy demand related to heating and cooling in a typical building has been evaluated, which has been simulated in 35 cities located in different climatic zones, using the DesignBuilder v.6.1.7.007 software. Although the increase in insulation and the replacement of windows lead to a reduction in energy demand, in the case of the cities of Santa Cruz de Tenerife and Las Palmas de Gran Canaria without insulation, the demands are lower than 1.7 kWh/m2/year and 5 kWh/m2/year, respectively, and these results indicate that energy saving strategies, driven by policies and economic support, based on the renovation and improvement of the thermal insulation of the building envelope, are not the most appropriate due to the need for an additional energy load for cooling and to maintain comfort within the regulatory limits.

1. Introduction

The global energy demand has been increasing during the last years mainly due to the economic development and globalization processes. The building sector is one of the principal energy-consuming sectors in the world, representing around 40% of the total demand [1] and contributing over 30% of the CO2 emissions [2], where heating and cooling processes are responsible for more than 33% of the total energy consumed in buildings [3]. Additionally, in some trend scenarios proposed for 2050, the energy demand for cooling will reach 150% of the actual values and the cooling energy demand will rise by 300% to 600% in buildings [4].
In this sense, EU has established clear objectives on energy saving in the construction sector, defining broad major objectives and assumptions aimed at lowering the energy consumption of buildings [5], complemented by the Directive 2010/31//UE which introduced the concept of nearly zero-energy building (nZEB) [6,7]. In the nZEB concept, some authors have defined two approaches for the retrofitting strategy to achieve the targets: reducing the power consumption and perform an energy transition, replacing the actual energy mix and introducing renewable energies [1].
Therefore, the improvements to reduce the heating and cooling demand are the most relevant retrofitting actions in the buildings to produce an effective reduction of the energy demand, where the building envelope [8] plays a key role, together with other construction elements.
In this aforementioned sense, the most used renovation proposals to reduce the energy consumption are to increase the insulation thickness of the thermal envelope as well as installing double-glazed windows. Several authors have been focused on the optimization of the insulation thickness of the exterior walls of buildings to minimize the heating demand required in cold regions [9] and to reduce the temperature [10,11,12], where the retrofitting actions in continental climates have reported reduction over 30% of the energy demand [13]. Similar studies referred to hot climates [14] have reported the optimization of insulation thickness for the reduction of heat transfer in buildings during the summer, considering solar radiation and the feasibility of retrofit actions, in combination with Solar Passive Technologies [15]. Additionally, the thermal performance of the building considering the percentage of window surface and type of glazing [16] has been analyzed for different climate conditions.
The aforementioned strategies have different results depending on the climatic zone [17] and the specific boundary conditions of the environment, in order to provide results in context-specific solutions [18]. For example, in Algeria, reducing cooling demand by replacing single glass with double glass contributes, on average, to a reduction in energy demand of 8%. However, the application of other strategies, such as solar protection, window glazing, air tightness and insulation, and reductions in energy consumption can achieve energy savings of 33% [19].
The analysis of the comfort for buildings without installed heating or cooling systems reveals that it is possible to have winter thermal comfort without additional thermal insulation on façades in climates similar to the cities of southern Europe [20].
In general, the results of the energy evaluation in different locations show the reduction in energy demand associated with retrofit strategies depends, to a large extent, on the climate zone where the building is located. Therefore, the criteria for achieving the objectives set by the EU in terms of improving the energy performance of the building stock require adaptation to the climatic singularities of each region [18,21].
The scientific literature has extensively reported the effect of insulation in buildings located in areas with a remarkable heating demand where the implications of passive design measures on heating and cooling energy have been properly addressed [22]. In particular, the Spanish standard, which is the transposition of European directives, promotes and partially finances the placement of building insulation and the replacement of windows.
In this sense, following the aforementioned studies published in the literature, we present in this work a novel study of the energy evaluation of a building on the southern border of the EU, to evaluate the behavior of these strategies for the Canary Islands, in comparison with other EU cities.
The present work analyzes the energy demand of a reference building located in 33 cities in different climate zones, following the classification reported in [23], and compared with the two Canary Islands capital cities.
The paper is structured as follows. In Section 2, the building model and simulation variables are listed. In Section 3, the obtained results and discussion are shown. This section is followed by the conclusions in Section 4.

2. Building Model and Methodology

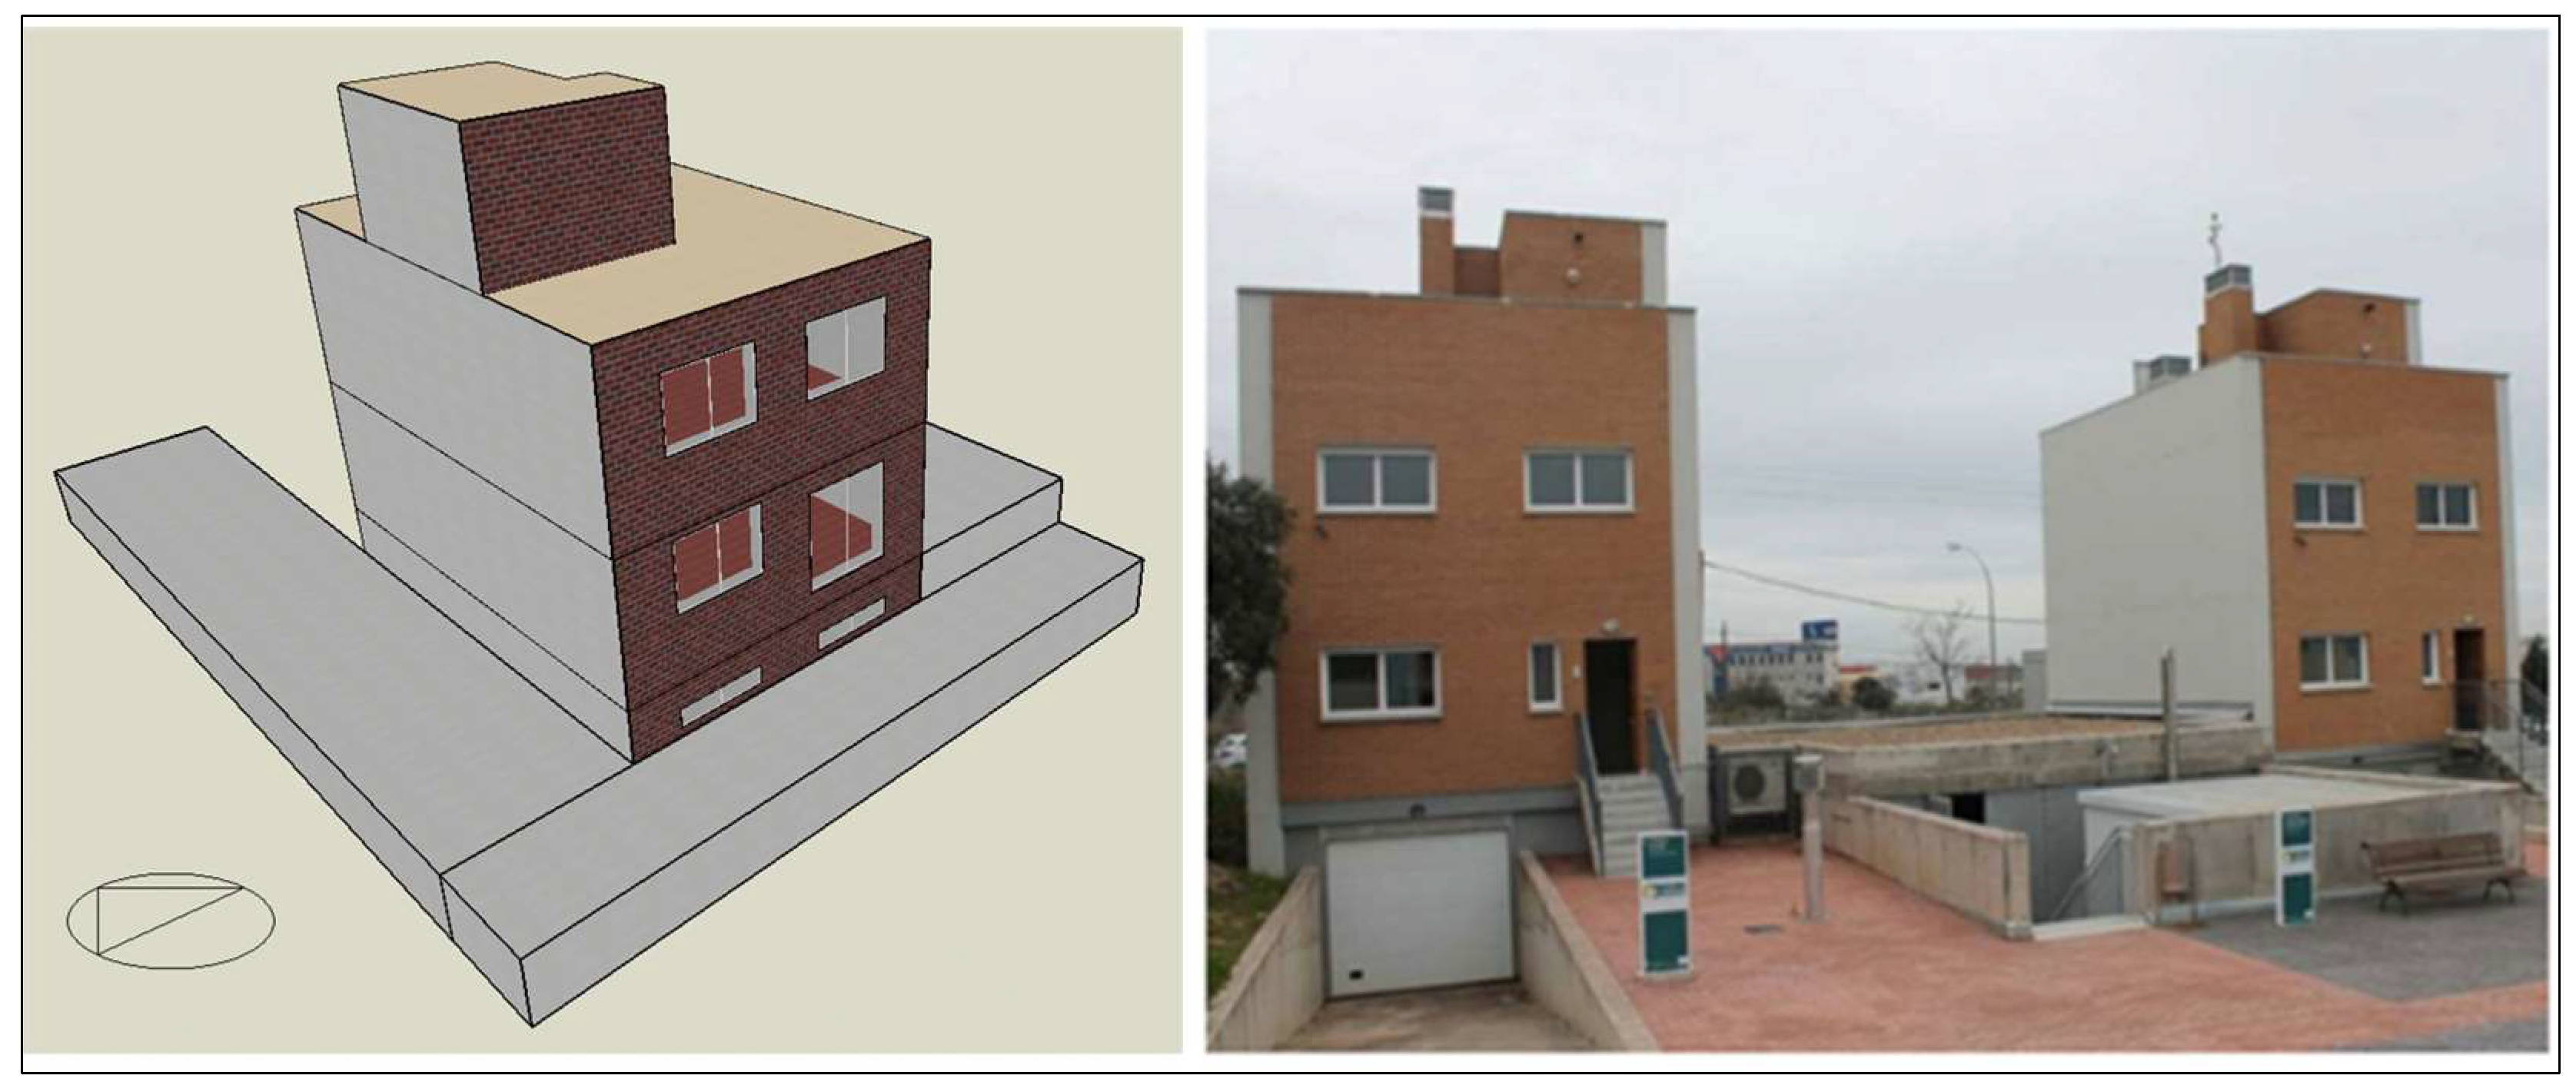
2.1. Description of the Building Used in This Work

We have selected one of the twin buildings used as a reference for the European ENCORE H2020 Project (ENergy aware BIM Cloud Platform in a COst-effective Building REnovation Context), to carry out the simulations. They are two single-family dwellings built at full scale: a standard dwelling, used as a reference and the twin dwelling, used to carry out experimental innovations to reduce the energy consumption. These buildings were built in the framework of the Experimental Demonstrators in Energy and Architecture (EDEA) project co-funded by the LIFE program of the European Commission [24].
The experimental building used in the simulations has a façade of 140.5 m2 (north and south), dividing walls of 160.7 m2 (east and west), a roof of 70.4 m2, and 22.0 m2 of openings in the façade walls (Figure 1). In terms of the window-wall ratio (WWR), the building presents 11% of openings to the north and 20% of openings to the south (see Table 1). The selected building model does not present window opening areas in the east and west façades, because this model represents a rowhouse. The window-wall areas and WWR are the standard values in Spain for the typology of the selected building.
The building materials and construction solutions used in the simulation have been chosen to represent a single-family house type of construction system. Table 2 shows the description and thermal properties of the building materials included in the construction solutions of the building envelope. The orientation of the EDEA building has been unaltered in the different emplacements to minimize a crossed effect due to the orientation changes.
To implement a systematic comparison, we have selected commercial insulation thickness of 0, 40, 80, and 120 mm, in accordance with what has been reported in the literature [26], to evaluate the insulation influence in the chosen cities. Despite the selected values not being the most appropriate for northern and central countries according to EU country policies, the aim of this work is focused on the analysis and comparison of the insulation performance and constraints for the southern cities under study.
The characteristics of the construction materials of the building’s interior construction solutions are shown in Table 3.

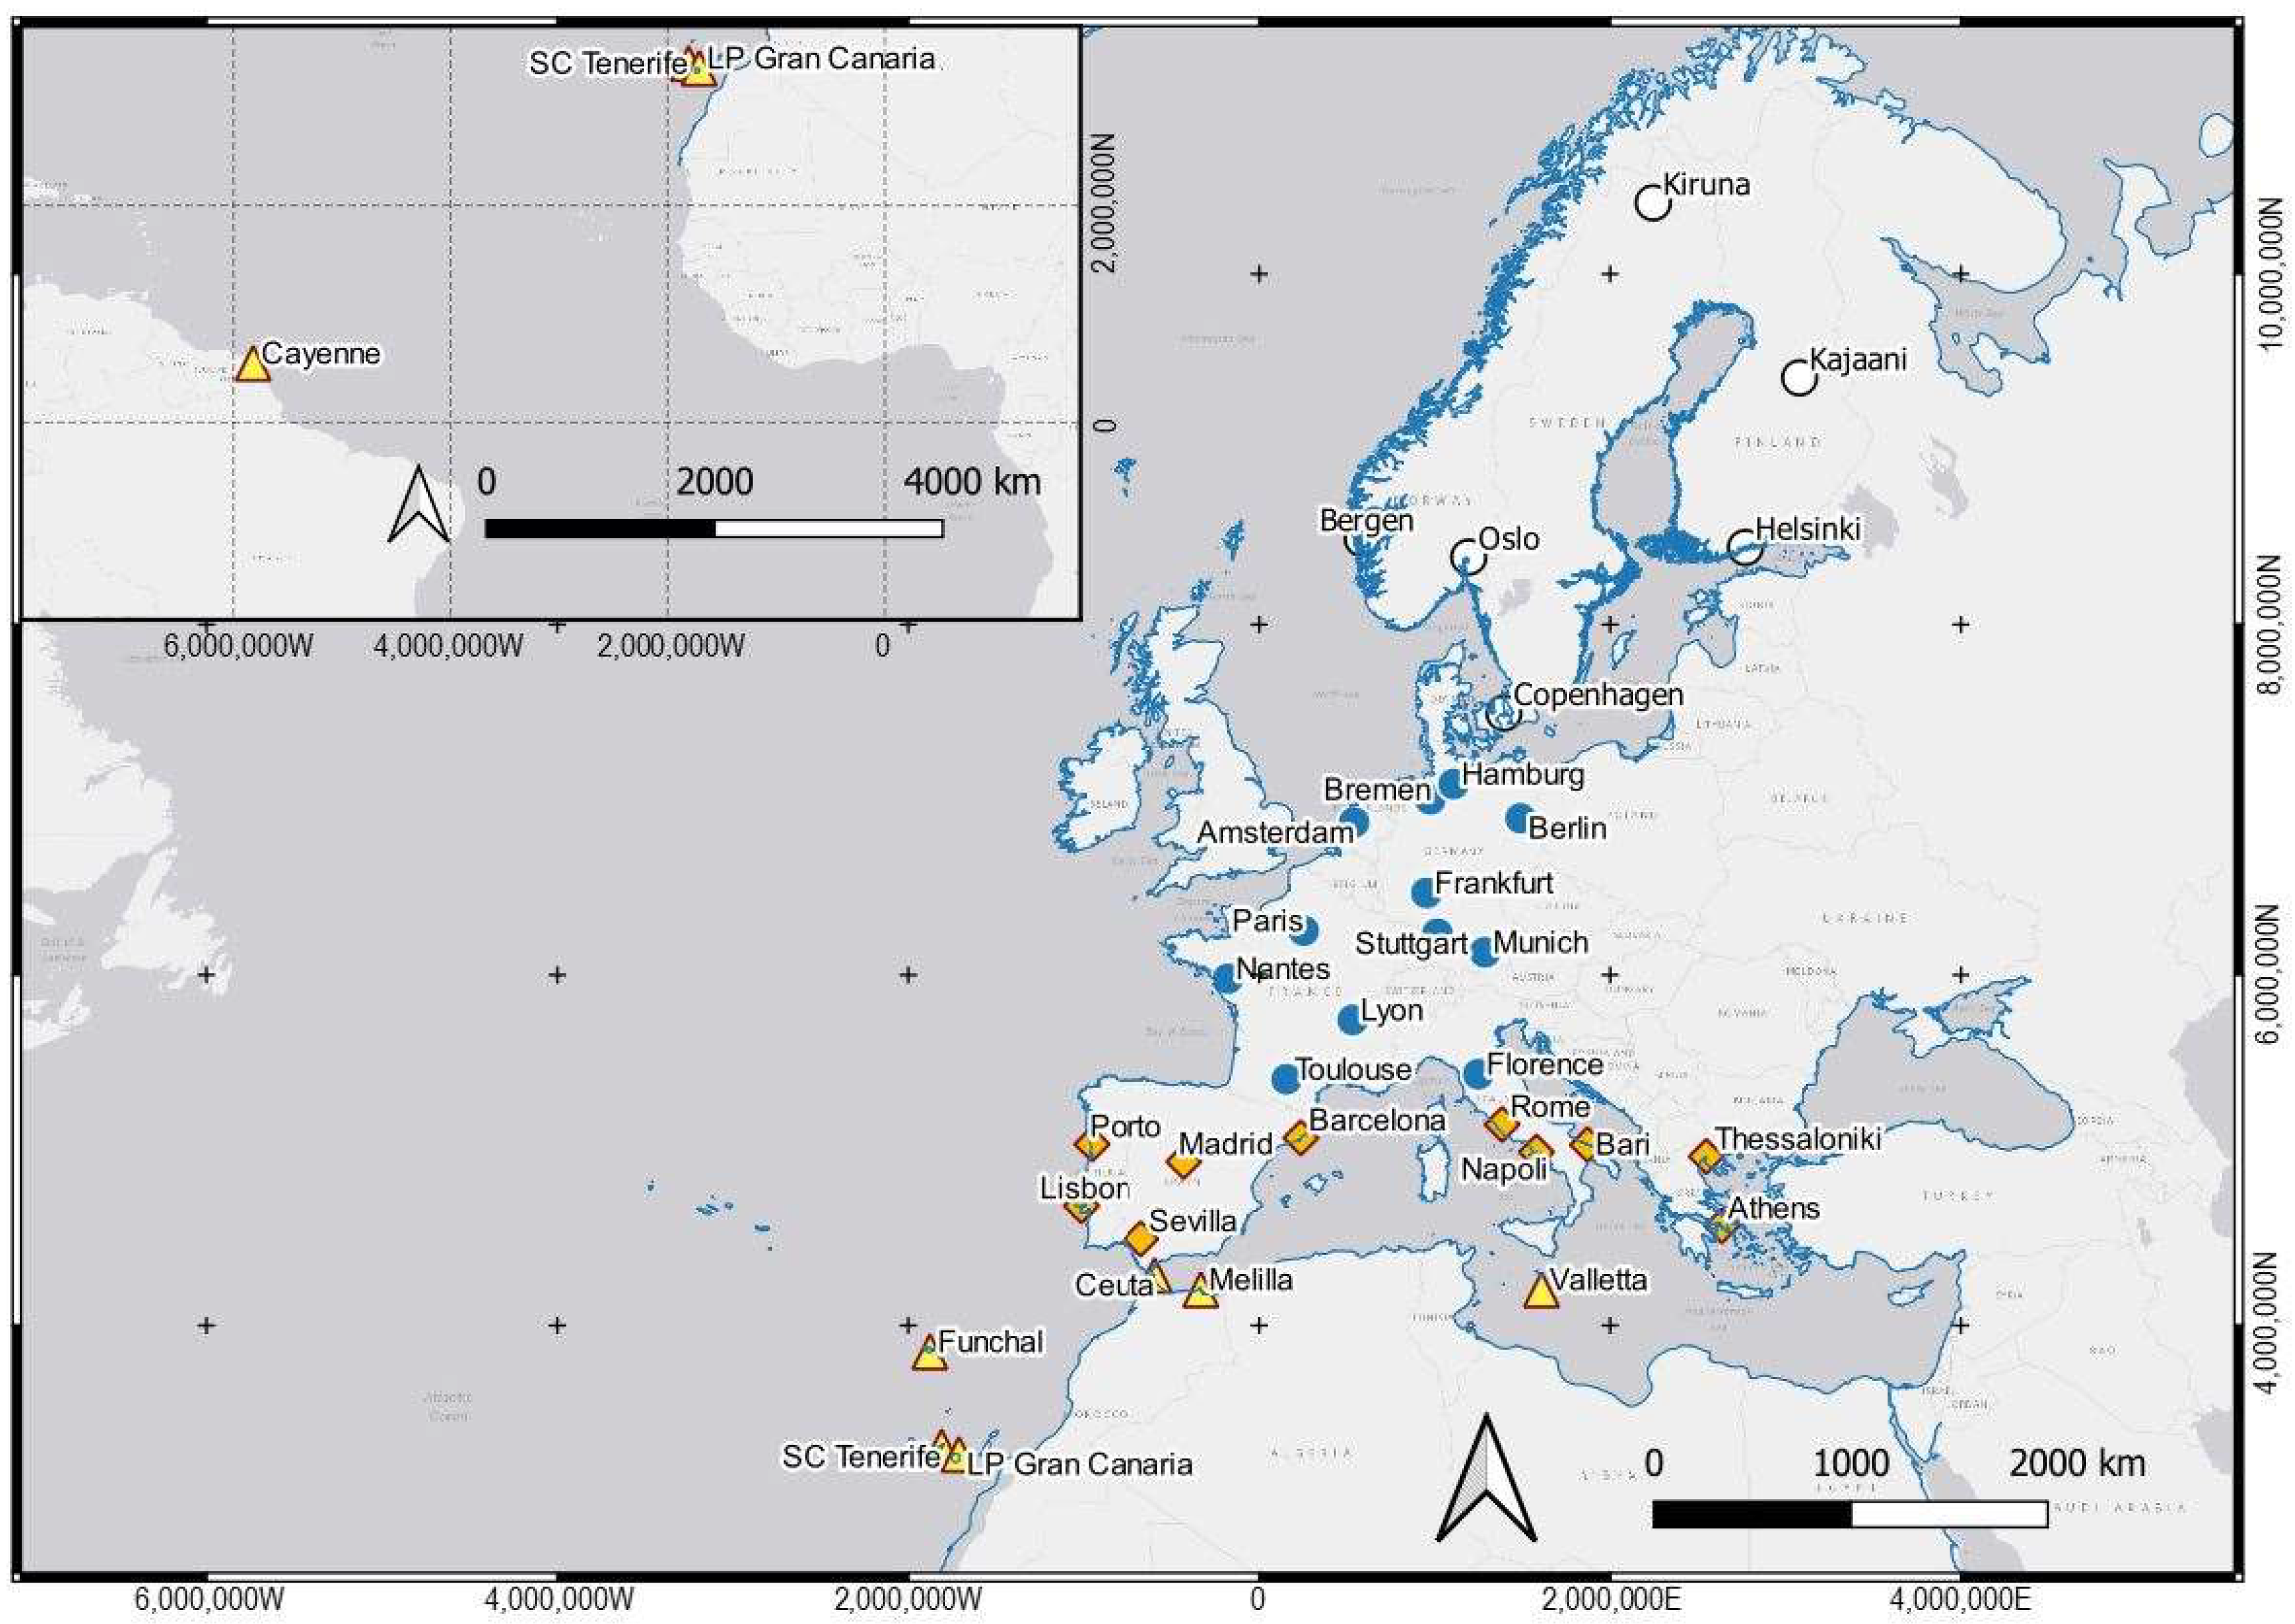
2.2. Methodology of Calculation and Selection of Cities

The proposed methodology evaluates the energy demand of the building, when the insulation thicknesses and the type of glazing in windows are modified, aligned with European retrofitting guidelines. The selection of cities has been performed in two groups: (i) cities with heating demand and (ii) cities without heating demand. The energy analysis was performed with DesignBuilder (Calculation Engine EnergyPlus) v.6.1.7.007 software, whose calculation engine is Energy Plus v.8.9.0.001. The EPW (Energy Plus Weather) files from the Energy Plus database were used as climate files for each of the selected locations.
The Engine EnergyPlus uses finite difference calculation method, the Conduction Transfer Function (CTF) algorithm, TARP method for the internal convection algorithm, and DOE-2 for the external convection algorithm.
To carry out the simulations, four thermal zones have been considered in the building, one zone per floor. The interior partition walls have not been considered for the energy evaluation. Additionally, the building has been simulated considering the slab in contact with the first floor for all the locations.
The energy demand of the test building, located in 35 cities in different locations of the EU, has been calculated (Figure 2). The results have been considered appropriate when the insulation thickness reduces the cooling energy demand. In the opposite case, when the insulation thickness increases the cooling energy demand, the previous valid insulation thickness has been considered. We have chosen different locations to consider the different climates zones in the EU, and the cities have been grouped by latitude, forming different groups according to the classification shown in [23].
Moreover, in this study, we have included European cities located outside of the continental climates, to evaluate the impact of the political guidelines of retrofitting from the EU.

2.3. Transmittances of the Envelope and Windows

The transmittances of the different elements of the thermal envelope according to the insulation level are shown in Table 4. Regarding the glazing type, we have carried out simulations for two window types and frame combinations: 6 mm glass with aluminum frame (the most widely used window in buildings in the Canary Island cities under study) and 4 + 12 + 6 mm glass with PVC frame, to assess the energy demand changes due to the replacement of the windows.

2.4. Calculation of Infiltrations in the Building

The calculation of infiltration was performed according to the Energy Performance of Buildings Directive 2010/31/EU, the Energy Efficiency Directive 2012/27/EU, and subsequent amendments contained in the Spanish transposition of the aforementioned Directives [25].
According to study [27], the infiltration value obtained was 0.186 ACH (Air Changes per Hour) with a permeability value equal to 9 m3/h·m2 (at 100 Pa) and a mechanical ventilation equal to 0.63 ACH for the volume of the dwelling, façade and roof areas, and percentage of openings indicated in the building description.
The year-round mechanical ventilation of 0.63 ACH ensures healthiness through proper aeration of the living spaces. However, a natural ventilation of 4 ACH has also been included during the summer months (June, July, August, and September) from 0:00 to 07:59 to cool the interior spaces in summer and improve the thermal comfort of the occupants to minimize the use of active cooling systems.
Night ventilation has been used exclusively in the summer months (June, July, August, and September, between 1 and 7 a.m.). In the case of northern European cities, night ventilation produces indoor temperatures of between 17 °C and 20 °C.

2.5. Internal Loads, Usage Profiles, Metabolic Rate, and Set-Point Temperatures

The internal loads define the heat generated inside the building due to internal sources: occupancy, lighting, equipment, etc. These loads are involved in the calculation of the energy demand of the analyzed models. The internal loads and associated operating hours used in the simulations are described in Table 5.
The metabolic rate was estimated as the sum of the sensible occupation (Osen = 2.15 W/m2) and latent occupation (Olat = 1.36 W/m2) for an occupancy density (ρd) equal to 33.33 m2/person. Applying Equation (1), we obtain a metabolic rate (Mrate) equal to 117 W/m2.
M r a t e = O s e n · ρ d + O l a t · ρ d
The set-point temperatures used for the winter months were 20 °C and 17 °C (heating temperatures) and for the summer months were 25 °C and 27 °C (cooling temperatures). These four set-point temperatures were used with the times indicated in Table 6 which correspond to those established in [28].

2.6. Inverse Distance Weighting Interpolation

Inverse distance weighting interpolation (IDW) is a deterministic interpolation method that assumes that the interpolated value will be more similar to nearby data than to remote data. IDW interpolation uses distance as the weight, so sample points that are close will have greater weight and the amount of weight will decrease as the distance from the sample point increases. The equation used for IDW interpolation is as follows:
h d j = k j   i = 1 n 1 d i j p h d i
k j = i = 1 n 1 d i j
where:
h d j estimated heating demand (kWh/m2/year) at point j;
h d i experimental heating demand (kWh/m2/year) at point i;
d i j distance from point i to j;
p power, in this case p = 2 (weighting with the square of the distance);
n number of cases.
The effect of decreasing the heating demand can be obtained continuously by interpolating the experimental data. The interpolation of the inverse square of the distance is an easy method to apply to estimate the parameters required in the calculation of the energy consumption of buildings [29]. Additionally, this interpolation can be used for the prediction of the buildings’ operation through analysis of energy consumption [30]. This technique allows the estimation of the values at the unknown point from a weighted sum of the values of N known points.

3. Results and Discussion

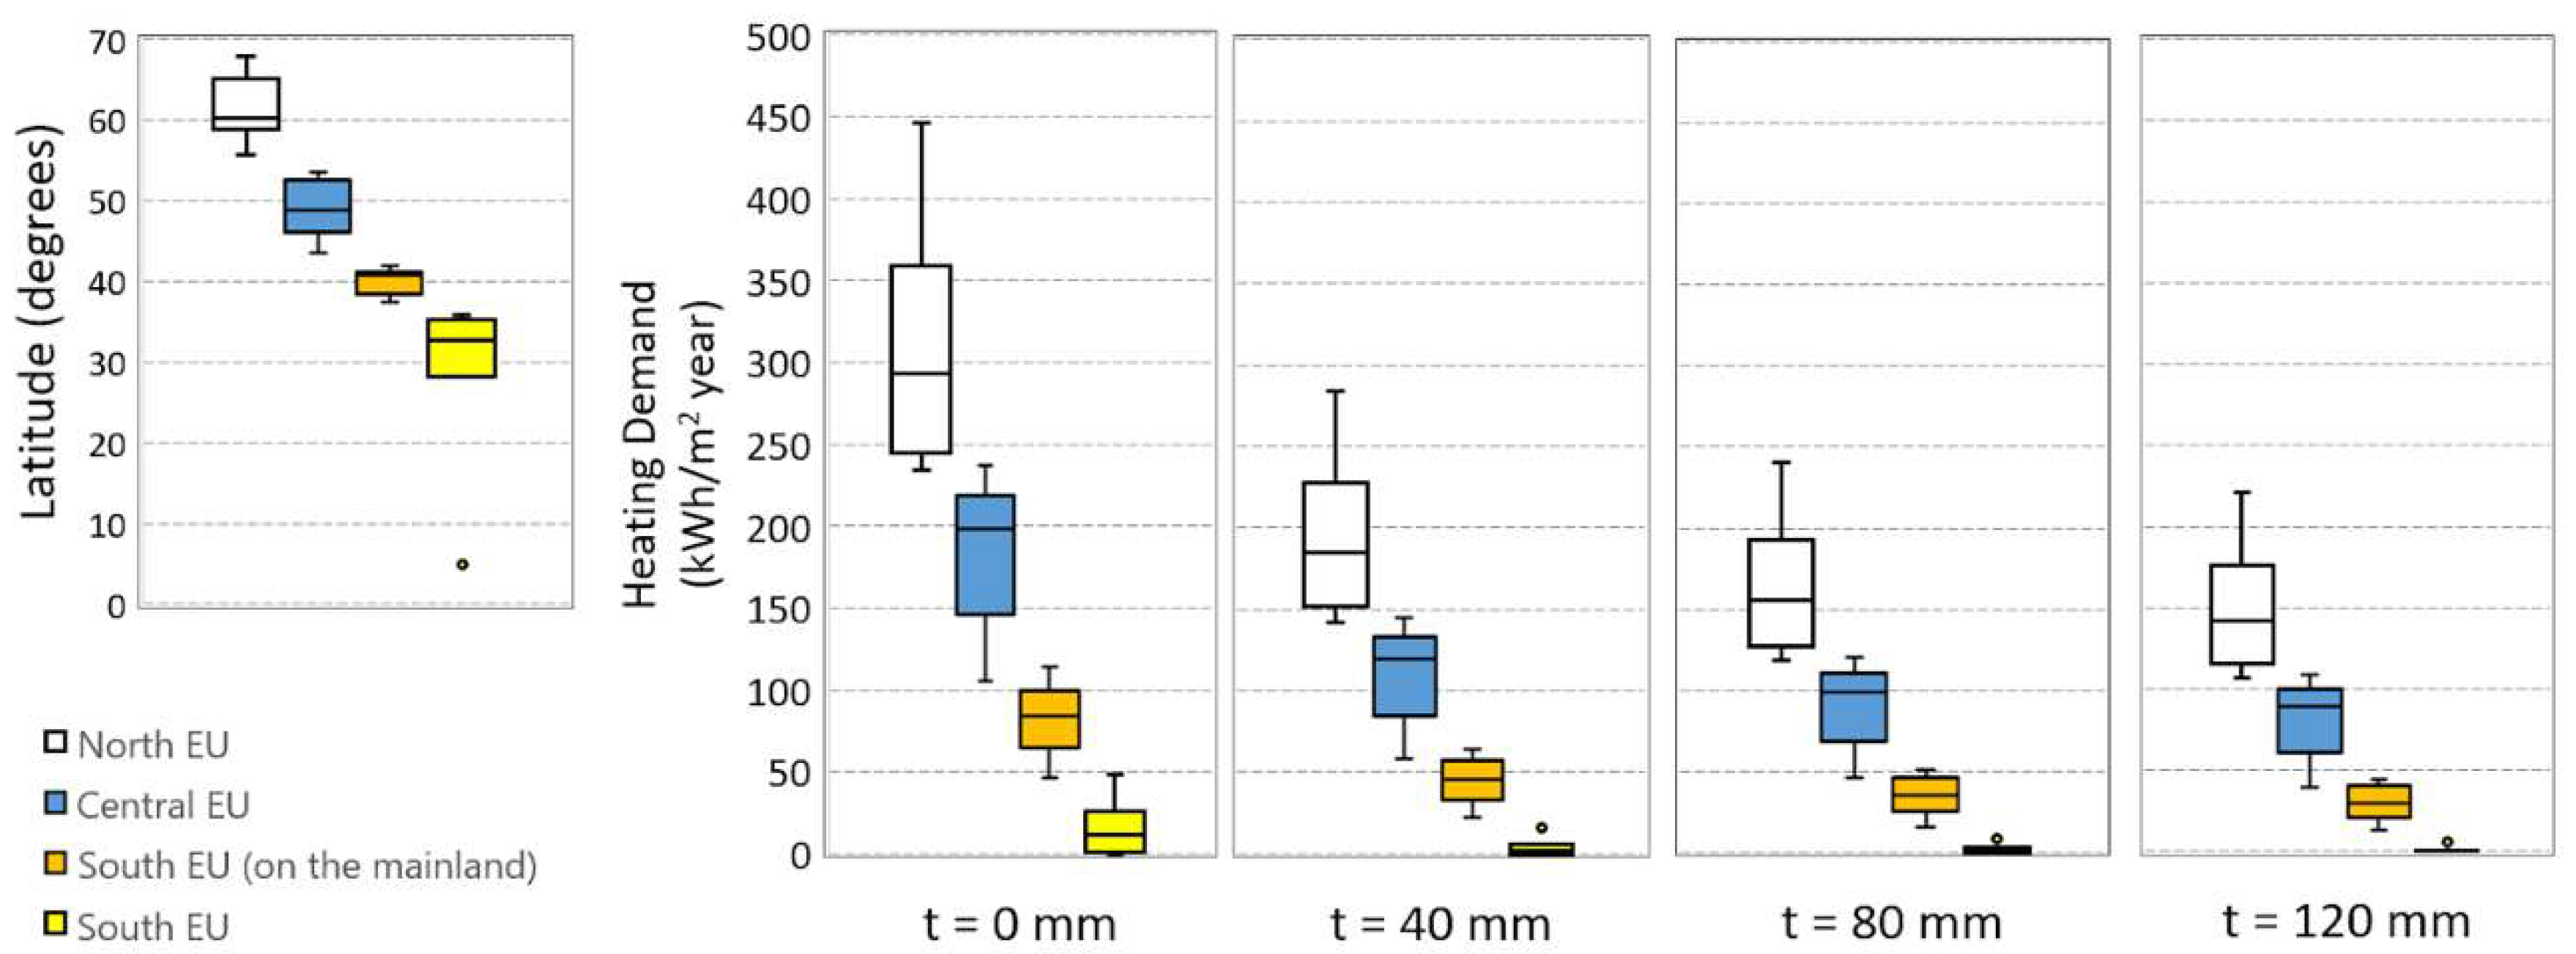
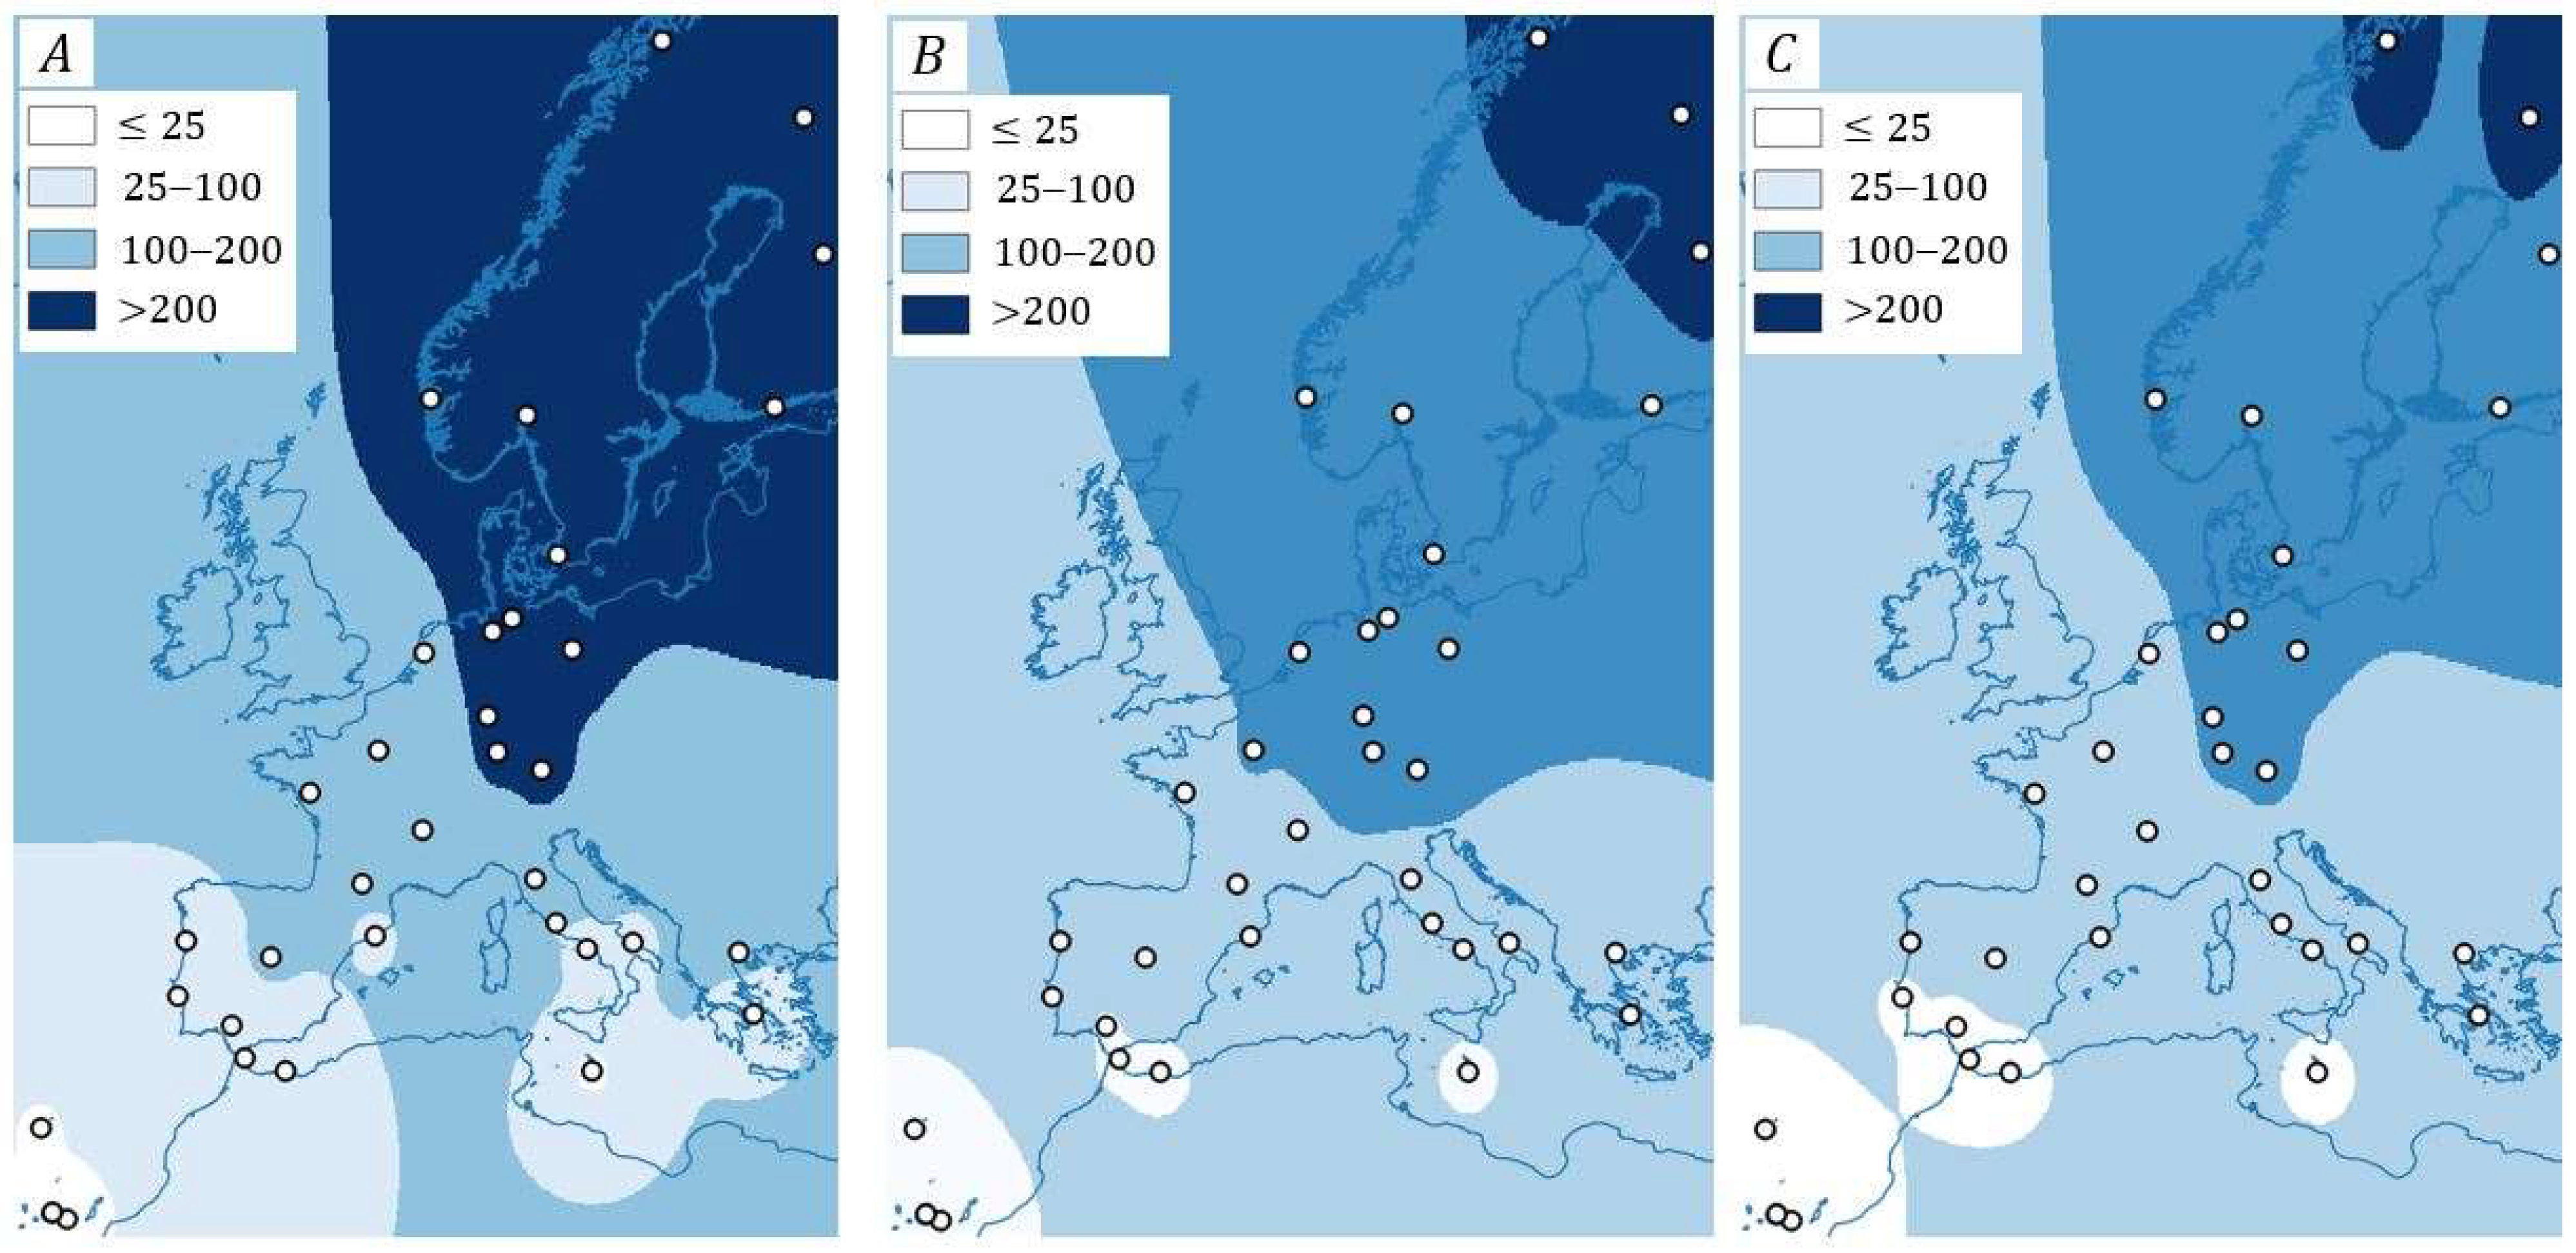
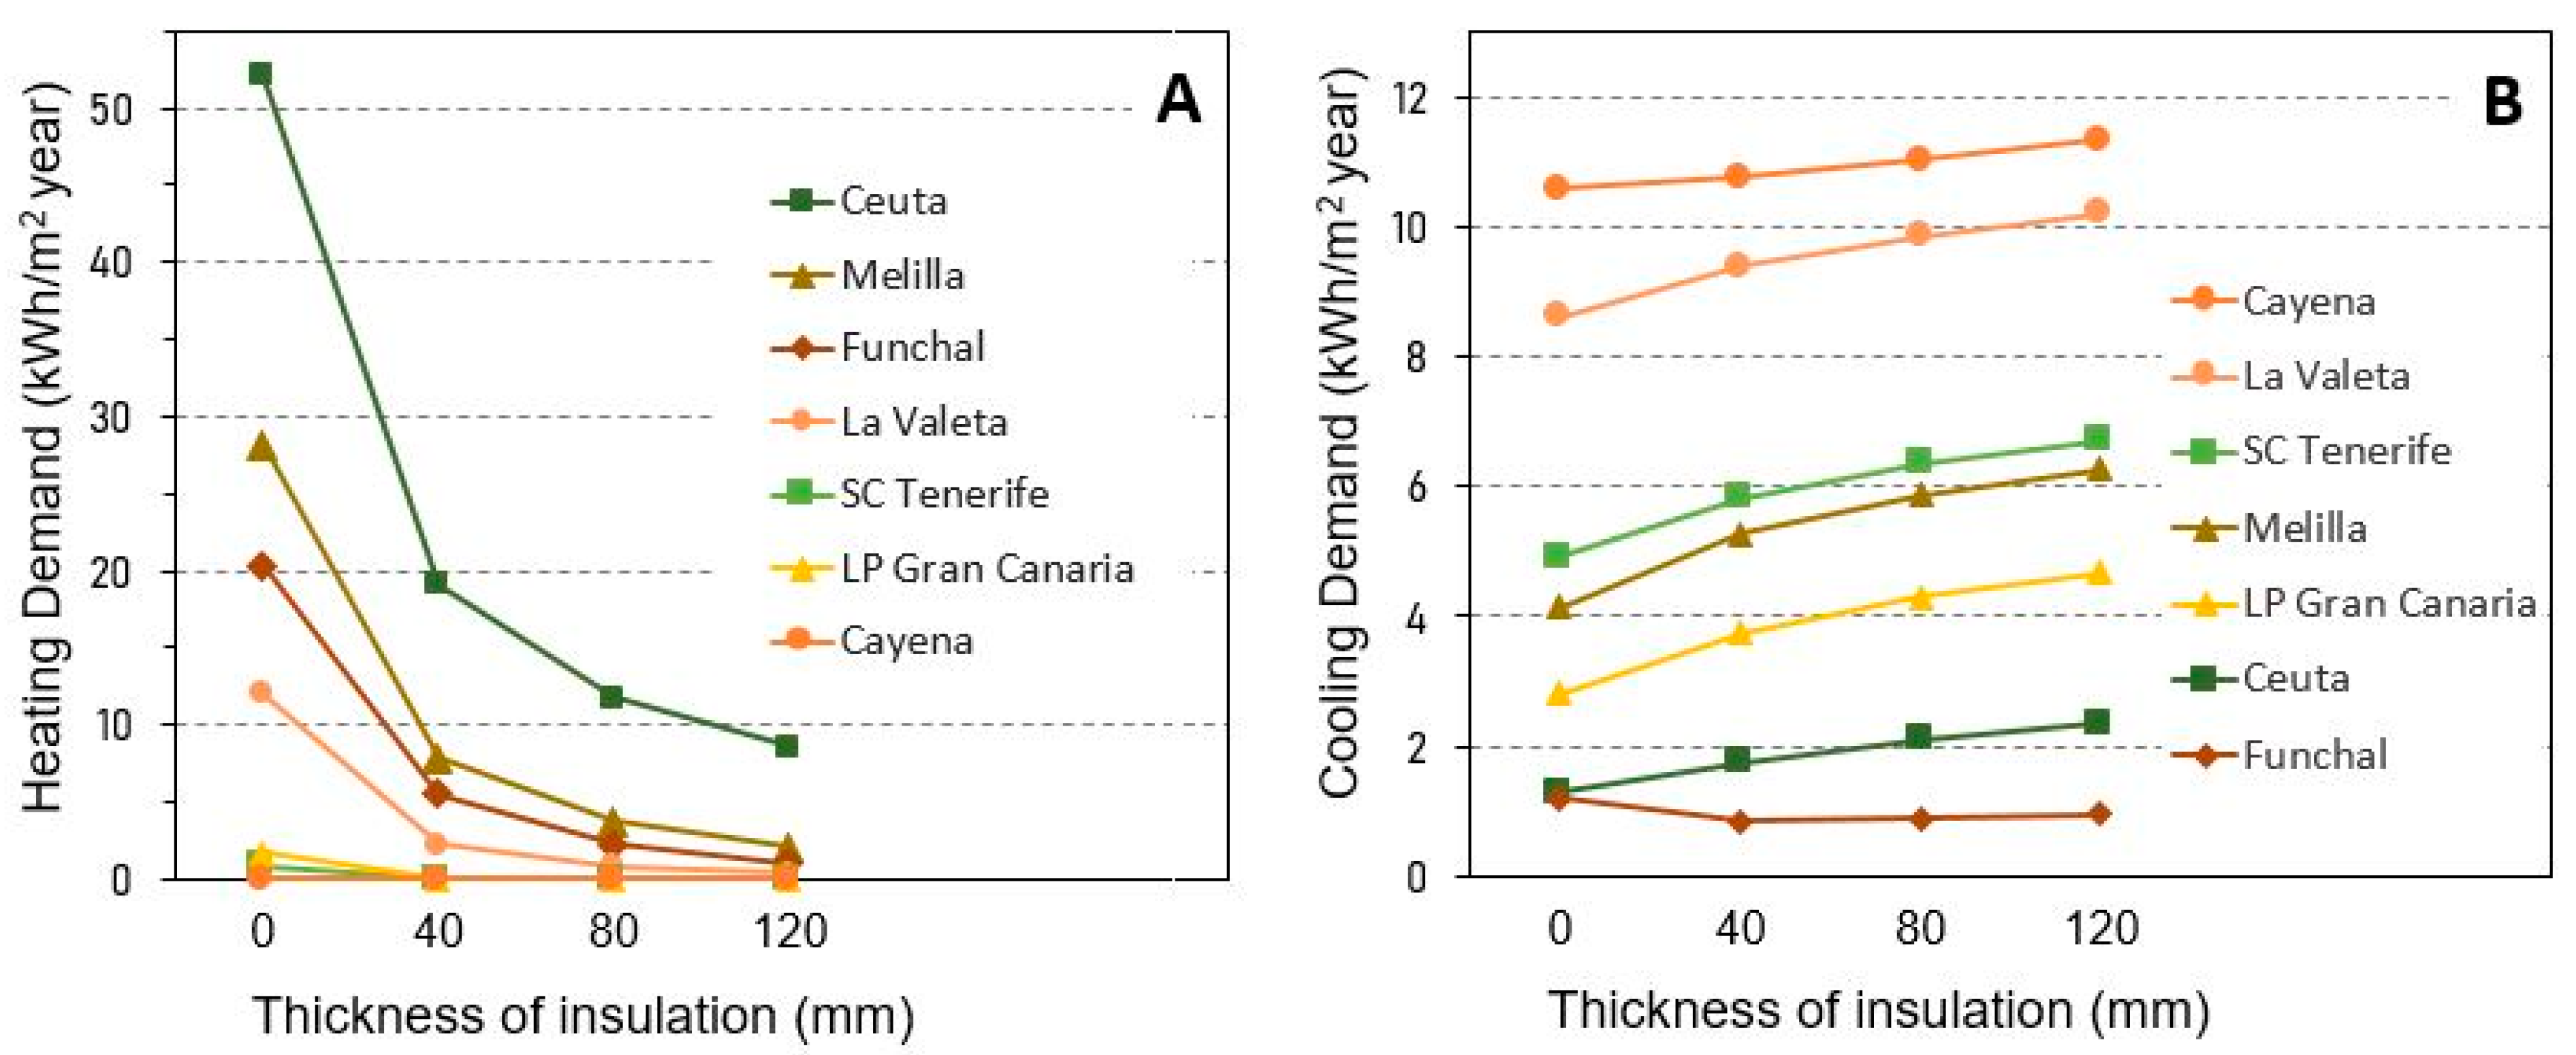
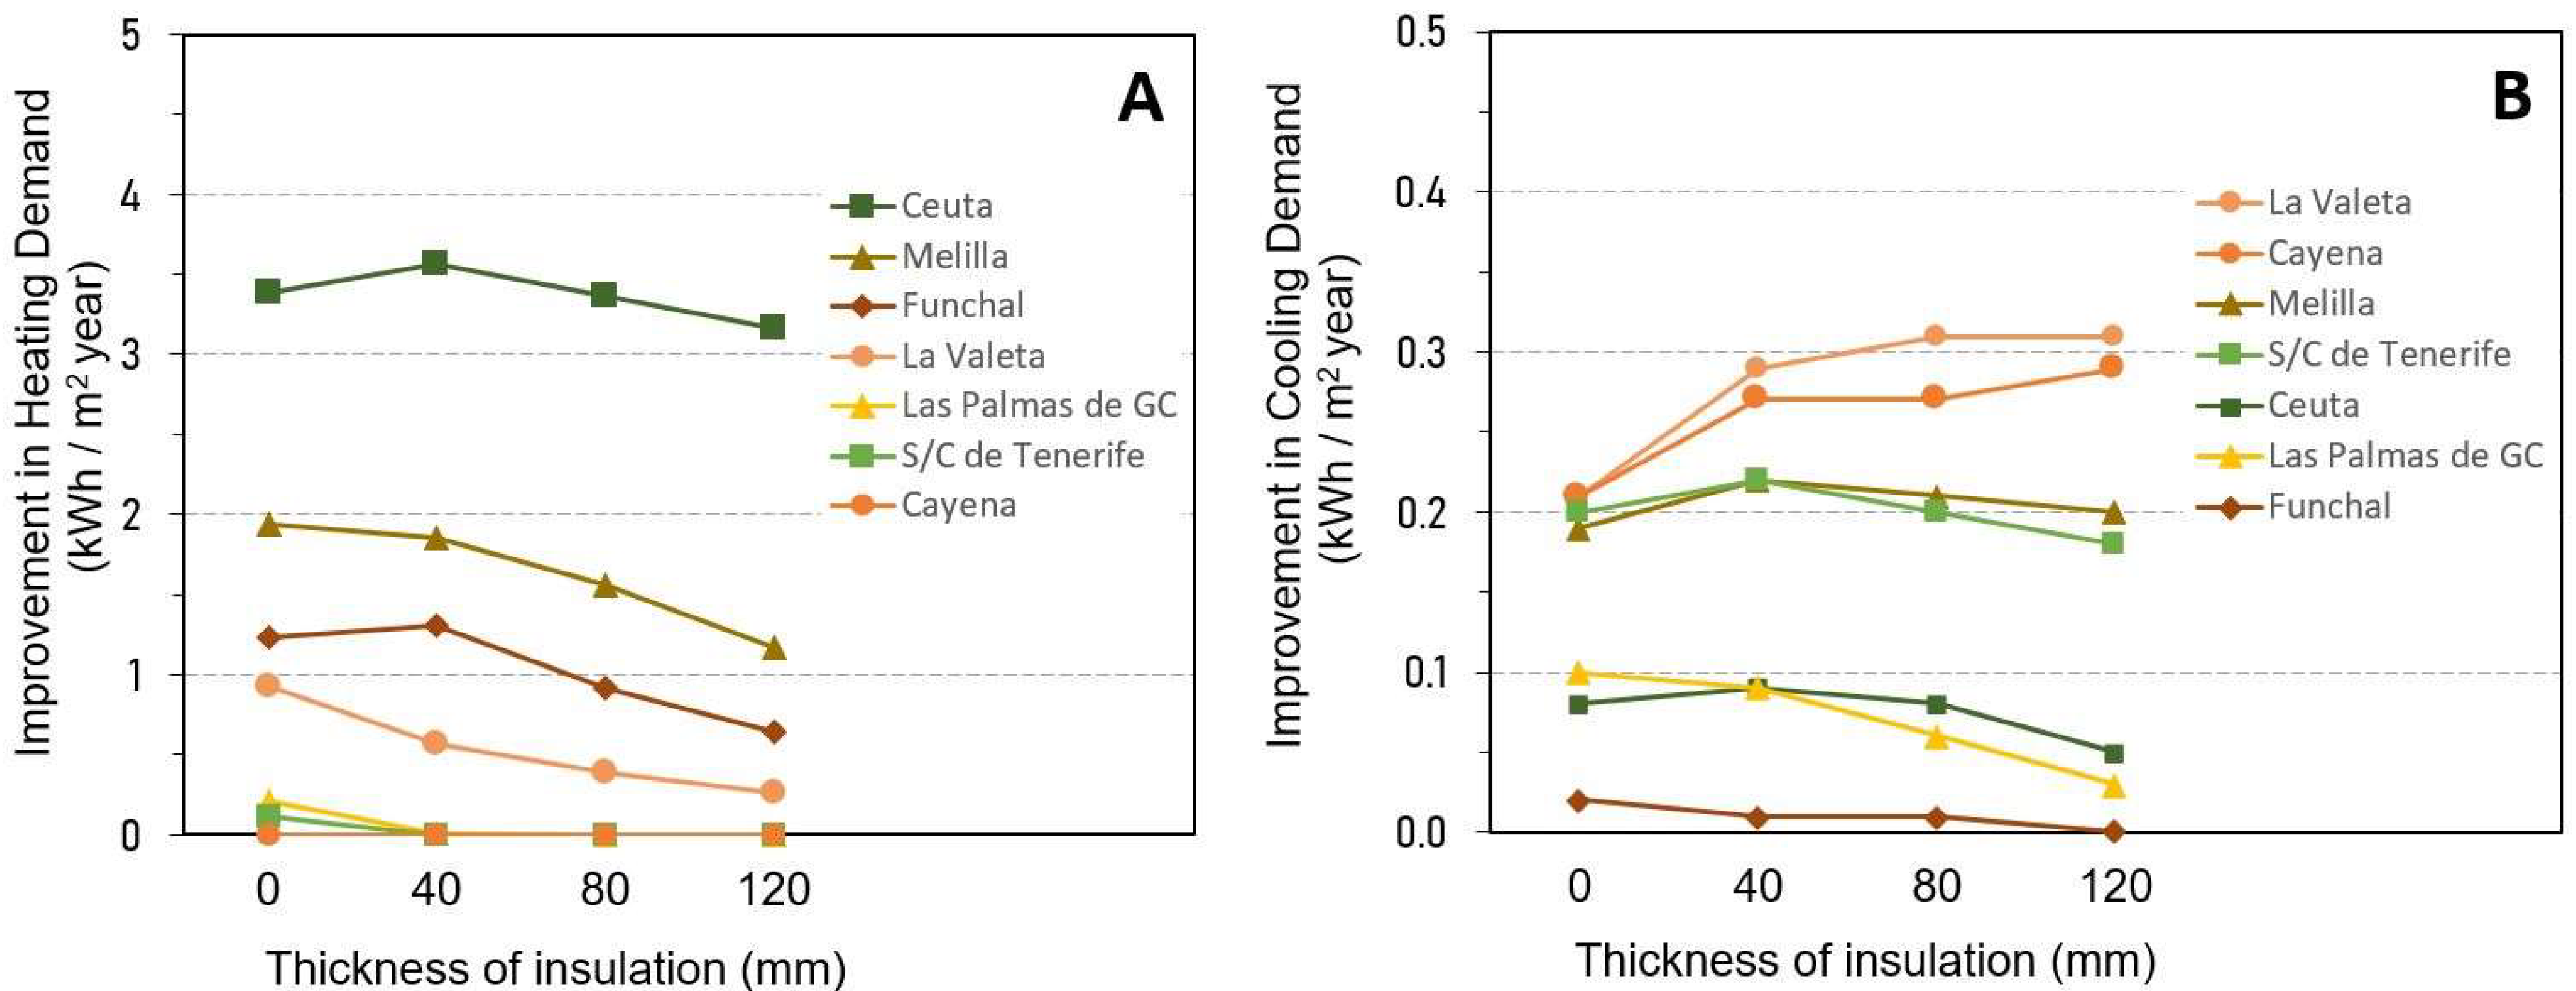
3.1. Heating Demand as a Function of Insulation Thickness

In this work, the total energy demand has been defined as the required energy for cooling and heating systems, to maintain comfort temperature conditions inside the building. Figure 3 shows the heating demand values (kWh/m2/year) of the house with double- glazed windows 4 + 12 + 6 mm located in northern, central, and southern EU cities, as a function of insulation thickness.
In the northern cities of the EU, heating demand without insulation ranges between 446 and 142 kWh/m2/year, achieving values of 240 and 118 kWh/m2/year with 80 mm insulation. For the cities located in the central part of the EU, heating demand varies between 105 and 237 kWh/m2/year (without insulation) and 45–120 kWh/m2/year (with 80 mm insulation).
This decrease in heating demand is almost 4 times lower in southern cities of the EU, with the highest demand in cities located within the continent with a heating demand ranging between 114 and 46 kWh/m2/year (without insulation) and between 50 and 16 kWh/m2/year with 80 mm thick insulation, despite the fact that the thicknesses selected in this comparative study are not the optimal thicknesses that could be found in those countries.
Specifically, the cities of Ceuta (Spain), Melilla (Spain), Funchal (Portugal), and Valleta (Malta) have a heating demand ranging between 50 and 12 kWh/m2/year for the building without insulation. This heating demand decreases to values of 15 and 2 kWh/m2/year, respectively, when 40 mm insulation is included. These values also reach 9 and 0.5 kWh/m2/year increasing the insulation thickness to 80 mm.
The determination of the interpolated points allows an adequate visualization of the heating energy demand using the values obtained for the cities depicted in Figure 2. The values obtained from the interpolation method compared with the precise values, show an error below 10% on average. The objective of Figure 4 is to show graphically how the heating demand is in the Canary Islands compared to the rest of the EU. This demand remains below the threshold of 15 kWh/m2/year regardless of the thickness of the insulation.
In general, this improvement of heating demand with insulation in northern, central, and southern EU cities can also be observed graphically in the heating demand map by applying IDW, shown in Figure 4.
However, the general behavior observed in northern, central, and southern European cities contrasts with those observed in cities even further south in the EU: Cayenne, Santa Cruz de Tenerife, and Las Palmas de Gran Canaria. In these cases, the installation of insulation does not result in significant savings in heating demand. In these cities, the heating demand is less than 1.7 kWh/m2/year without insulation (Figure 5A). Therefore, the installation of insulation in Santa Cruz de Tenerife, Las Palmas de Gran Canaria, and Cayenne does not significantly reduce the heating demand in the buildings constructed.
On the other hand, it is remarkable that there was different behavior shown in the Spanish cities of North Africa (Ceuta and Melilla), compared to the results obtained in the Canary Islands capitals, for the same reference building. In the cities of the Canary Islands, unlike the cities of North Africa and the rest of the cities of continental Europe, the installation of insulation does not improve the demand for heating (Figure 5A) and even produces an increase in the demand for cooling (Figure 5B). These results obtained for the reference building show the need to evaluate the rehabilitation strategies that are currently applied in the Canary Islands.

3.2. Cooling Demand as a Function of Insulation Thickness

In a previous work, the cooling demand in Helsinki, Berlin, and Madrid, which are located in the northern and central areas of the EU defined in this work [23], were calculated. The results of this study show the cooling demand in these cities is very low compared to the heating demand. Specifically, the values range between 12 and 0.3 kWh/m2/year in uninsulated envelopes, and between 9 and 0.3 kWh/m2/year with 120 mm insulation, being higher in Madrid and lower in Helsinki. In general, northern and central EU cities do not require active systems to control cooling demand.
On the other hand, in the cities of Santa Cruz de Tenerife, Las Palmas de Gran Canaria, Funchal, Ceuta, Melilla, and Cayenne, it is observed (Figure 5B) that the cooling demand is practically constant with insulation thickness, the value always being less than 12 kWh/m2/year, corresponding to Cayenne. In the case of the Canary Island cities, the cooling demand is less than 5 kWh/m2/year without insulation, increasing slightly to a value of 7 kWh/m2/year when the insulation thickness is increased.
This effect of increased cooling demand observed in many cities in the south of the EU as insulation thickness increases is due precisely to the fact that, in hot weather, heat cannot be dissipated through the envelope due to the incorporation of that insulation. This fact could cause overheating and therefore, active cooling systems could be required. Therefore, it can be deduced from the results of these simulations that, in these Canary Island cities, the use of insulation in buildings does not lead to an improvement in energy demand, and even causes a slight increase in cooling demand. In these cities, the reduction of energy demand should be focused on strategies such as orientation, use of shading, and incorporation of renewable energies.

3.3. Single-Glazed vs. Double-Glazed Windows

The installation of double-glazed windows is another frequently used intervention to reduce the energy demand in the dwelling. Figure 6 shows the improvement by replacing single-glazed windows with double-glazed windows in the EDEA building used as a reference in the simulations.
Regarding heating demand, it is observed that in Ceuta and Melilla the improvement in heating demand is in the order of 3.5 and 2 kWh/m2/year, respectively. In Funchal and Valletta, the improvement is of the order of 1 kWh/m2/year, and in the Canary Island cities, it is less than 0.2 kWh/m2/year. Therefore, there are not significant changes observed increasing insulation thickness (Figure 6A). In general, these changes do not present significative improvements and therefore, the payback period is dramatically increased.
Moreover, cooling demand in all cases is always less than 0.5 kWh/m2/year and the cooling demand with insulation thickness is lower than 0.1 kWh/m2/year (Figure 6B).
The results show that the retrofitting actions consisting in the change of glazing do not lead to significant savings in either heating or cooling demand. In the cities Santa Cruz de Tenerife and Las Palmas de Gran Canaria, the improvement in heating and cooling demand does not exceed 0.2 and 0.25 kWh/m2/year, respectively. In this work, the influence of the WWR on the energy demand has not been studied. The modification of the WWR values implies important changes on the energy demand and must be studied for each case [31]. Even when the WWR values of the simulated building are not among the typical values for current buildings in the northern and central areas of the EU, these values have been used in order to compare with the obtained results for the Canary Island cities. Moreover, it is expected that in the near future, new buildings in the north and central EU will present WWR values close to the ones considered in this study [22].

4. Conclusions

In this article, an energy analysis of a reference building placed in 35 EU cities has been presented where the effectiveness of retrofit strategies for energy savings in buildings in EU has been evaluated, considering different cities in different climate zones.
The behavior observed in northern, central, and southern European cities contrasts with those observed in cities even further south in the EU: Santa Cruz de Tenerife and Las Palmas de Gran Canaria. In these cases, the installation of insulation does not represent a significant saving in the heating demand since the heating demand without insulation in the building is already less than 1.7 kWh/m2/year.
In relation to the cooling demand, in the case of these cities located on the Canary Islands, the cooling demand without insulation is also low (<5 kWh/m2/year). This demand increases slightly to a value of 7 kWh/m2/year when the thickness of the insulation increases, due to the heat which cannot be dissipated through the enclosure due to the insulation improvement. In these cities, the reduction of energy demand should be focused on other strategies, such as orientation, use of shading, and incorporation of renewable energies.
On the other hand, the rehabilitation actions consisting of changing the glazing do not represent a significant saving in either the demand for heating or cooling. In the cities of Santa Cruz de Tenerife and Las Palmas de Gran Canaria, the improvement in heating and cooling demand is less than 0.25 kWh/m2/year, which implies an excessively long amortization period.
The results reveal the energy-saving strategies, and therefore, the European subsidies for energy rehabilitation of buildings, based on the renovation and improvement of the thermal insulation of the building envelope are suitable for the cities of the north and center of the EU. However, in the case of the southern evaluated cities, the placement of insulation in the walls, which is required by law to comply with thermal transmittance requirements, does not imply an improvement in energy demand for the Canary Island cities studied.
Therefore, the general retrofit strategies for energy savings in buildings in the EU are not suitable for the southern cities under study, revealing the need for new strategies and policies to save energy in buildings placed in the studied cities from the Canary Islands.
Although the typologies of buildings can be very diverse in each of the cities studied, the results obtained on the reference building highlight the need to evaluate the rehabilitation strategies currently applied in the Canary Islands territory.

Author Contributions

Conceptualization, J.M.M.-M. and E.G.-D.; methodology, J.M.M.-M., E.G.-D., N.M.-D., A.P.-G. and B.G.-D.; software, J.M.M.-M.; validation, E.G.-D., N.M.-D., A.P.-G. and B.G.-D.; formal analysis, J.M.M.-M. and E.G.-D.; investigation, A.P.-G., E.G.-D. and B.G.-D.; resources, J.M.M.-M.; data curation, N.M.-D., E.G.-D. and A.P.-G.; writing—original draft preparation, J.M.M.-M. and E.G.-D.; writing—review and editing, N.M.-D., B.G.-D. and A.P.-G.; visualization, B.G.-D. and A.P.-G.; supervision, E.G.-D., B.G.-D. and N.M.-D.; project administration, N.M.-D.; funding acquisition, N.M.-D. All authors have read and agreed to the published version of the manuscript.

Funding

This work was funded by the EU H2020 ENCORE Project—“Energy aware BIM Cloud Platform in a Cost-effective Building Renovation Context”, European Union’s Horizon 2020 research and innovation program under grant agreement number 820434. Also this work has received co-funding support by the Agencia Canaria de Investigación, Innovación y Sociedad de la Información (ACIISI) de la Consejería de Economía, Conocimiento y Empleo, and by the European Social Fund (ESF)—Canary Islands Integrated Operational Programme 2014–2020, Axis 3—Priority Theme 74 (85%).

Data Availability Statement

Not applicable.

Conflicts of Interest

The authors declare no conflict of interest.

References

  1. Li, S.Y.; Han, J.Y. The Impact of Shadow Covering on the Rooftop Solar Photovoltaic System for Evaluating Self-Sufficiency Rate in the Concept of Nearly Zero Energy Building. Sustain. Cities Soc. 2022, 80, 103821. [Google Scholar] [CrossRef]
  2. Yang, L.; Yan, H.; Lam, J.C. Thermal Comfort and Building Energy Consumption Implications—A Review. Appl. Energy 2014, 115, 164–173. [Google Scholar] [CrossRef]
  3. Rathore, P.K.S.; Gupta, N.K.; Yadav, D.; Shukla, S.K.; Kaul, S. Thermal Performance of the Building Envelope Integrated with Phase Change Material for Thermal Energy Storage: An Updated Review. Sustain. Cities Soc. 2022, 79, 103690. [Google Scholar] [CrossRef]
  4. International Energy Agency (IEA). Technology Roadmap—Energy Efficient Building Envelopes. Available online: https://www.iea.org/reports/technology-roadmap-energy-efficient-building-envelopes (accessed on 20 July 2022).
  5. Fedorczak-Cisak, M.; Radziszewska-Zielina, E.; Orlik-Kozdoń, B.; Steidl, T.; Tatara, T. Analysis of the Thermal Retrofitting Potential of the External Walls of Podhale’s Historical Timber Buildings in the Aspect of the Non-Deterioration of Their Technical Condition. Energies 2020, 13, 4610. [Google Scholar] [CrossRef]
  6. EU. Parliament Directive 2010/31/EU of the European Parliament and of the Council of 19 May 2010 on the Energy Performance of Buildings. Available online: https://eur-lex.europa.eu/LexUriServ/LexUriServ.do?uri=OJ:L:2010:153:0013:0035:en:PDF (accessed on 20 July 2022).
  7. European Parliament Directive (EU). 2018/844 of the European Parliament and of the Council of 30 May 2018 Amending Directive 2010/31/EU on the Energy Performance of Buildings and Directive 2012/27/EU on Energy Efficiency. Available online: https://eur-lex.europa.eu/legal-content/EN/TXT/?uri=celex%3A32018L0844 (accessed on 20 July 2022).
  8. Sadineni, S.B.; Madala, S.; Boehm, R.F. Passive Building Energy Savings: A Review of Building Envelope Components. Renew. Sustain. Energy Rev. 2011, 15, 3617–3631. [Google Scholar] [CrossRef]
  9. Çomakli, K.; Yüksel, B. Optimum Insulation Thickness of External Walls for Energy Saving. Appl. Therm. Eng. 2003, 23, 473–479. [Google Scholar] [CrossRef]
  10. de la Flor, F.S.; Jara, E.R.; Pardo, .R.; Lissén, J.S.; Kolokotroni, M. Energy-Efficient Envelope Design for Apartment Blocks—Case Study of a Residential Building in Spain. Appl. Sci. 2021, 11, 433. [Google Scholar] [CrossRef]
  11. Nyers, J.; Kajtar, L.; Tomić, S.; Nyers, A. Investment-Savings Method for Energy-Economic Optimization of External Wall Thermal Insulation Thickness. Energy Build 2015, 86, 268–274. [Google Scholar] [CrossRef]
  12. Dylewski, R.; Adamczyk, J. Optimum Thickness of Thermal Insulation with Both Economic and Ecological Costs of Heating and Cooling. Energies 2021, 14, 3835. [Google Scholar] [CrossRef]
  13. Zyczyńska, A.; Suchorab, Z.; Majerek, D. Influence of Thermal Retrofitting on Annual Energy Demand for Heating in Multi-Family Buildings. Energies 2020, 13, 4625. [Google Scholar] [CrossRef]
  14. Al-Khawaja, M.J. Determination and Selecting the Optimum Thickness of Insulation for Buildings in Hot Countries by Accounting for Solar Radiation. Appl. Therm. Eng. 2004, 24, 2601–2610. [Google Scholar] [CrossRef]
  15. Brito-Coimbra, S.; Aelenei, D.; Gomes, M.G.; Rodrigues, A.M.; Gomes, G.; Rodrigues, M.; Façade, A.B. Building Façade Retrofit with Solar Passive Technologies: A Literature Review. Energies 2021, 14, 1774. [Google Scholar] [CrossRef]
  16. Derradji, L.; Imessad, K.; Amara, M.; Boudali Errebai, F. A Study on Residential Energy Requirement and the Effect of the Glazing on the Optimum Insulation Thickness. Appl. Therm. Eng. 2017, 112, 975–985. [Google Scholar] [CrossRef]
  17. Yang, Y.; Javanroodi, K.; Nik, V.M. Climate Change and Energy Performance of European Residential Building Stocks—A Comprehensive Impact Assessment Using Climate Big Data from the Coordinated Regional Climate Downscaling Experiment. Appl. Energy 2021, 298. [Google Scholar] [CrossRef]
  18. Walker, L.; Hischier, I.; Schlueter, A. Does Context Matter? Robust Building Retrofit Decision-Making for Decarbonization across Europe. Build. Environ. 2022, 226. [Google Scholar] [CrossRef]
  19. El-Darwish, I.; Gomaa, M. Retrofitting Strategy for Building Envelopes to Achieve Energy Efficiency. Alex. Eng. J. 2017, 56, 579–589. [Google Scholar] [CrossRef] [Green Version]
  20. Curado, A.; de Freitas, V.P. Influence of Thermal Insulation of Facades on the Performance of Retrofitted Social Housing Buildings in Southern European Countries. Sustain. Cities Soc. 2019, 48, 101534. [Google Scholar] [CrossRef]
  21. European Parliament Maximising the Energy Efficiency Potential of the EU Building Stock. Available online: https://www.europarl.europa.eu/doceo/document/A-9-2020-0134_EN.html (accessed on 20 July 2022).
  22. Pajek, L.; Košir, M. Strategy for Achieving Long-Term Energy Efficiency of European Single-Family Buildings through Passive Climate Adaptation. Appl. Energy 2021, 297, 117116. [Google Scholar] [CrossRef]
  23. Márquez-Martinón, J.M.; Martín-Dorta, N.; González-Díaz, E.; González-Díaz, B. Influence of Thermal Enclosures on Energy Saving Simulations of Residential Building Typologies in European Climatic Zones. Sustainability 2021, 13, 8646. [Google Scholar] [CrossRef]
  24. Gamero, E.; Vizcaíno, A.M.; Méndez, L.V.; Conejero, S. Proyecto EDEA: Desarrollo de la Eficiencia Energética en la Arquitectura. In Proceedings of the 13th International Conference on Project Engineering (AEIPRO), Badajoz, Spain, 8–10 July 2009. [Google Scholar]
  25. Spanish Technical Building Code, C. Royal Decree 732/2019, 314/2006 Which Modifies the CTE, Approved by Royal Decree 314/2006. Available online: https://www.boe.es/buscar/act.php?id=BOE-A-2006-5515 (accessed on 20 July 2022).
  26. Kaynakli, O. A Review of the Economical and Optimum Thermal Insulation Thickness for Building Applications. Renew. Sustain. Energy Rev. 2012, 16, 415–425. [Google Scholar] [CrossRef]
  27. Aurea Consulting-DesignBuilder España Cálculo de Infiltraciones Conforme al DB-HE y Certificación Energética. Available online: https://ecoeficiente.es/infiltracioneshe/ (accessed on 20 March 2022).
  28. Ministerio de Transportes Movilidad y Agenda Urbana Basic Document on Energy Saving: Annex D. Available online: https://www.codigotecnico.org/pdf/Documentos/HE/DcmHE.pdf (accessed on 26 August 2022).
  29. Qiao, R.; Liu, T. Impact of Building Greening on Building Energy Consumption: A Quantitative Computational Approach. J. Clean. Prod. 2020, 246, 119020. [Google Scholar] [CrossRef]
  30. Belussi, L.; Danza, L. Method for the Prediction of Malfunctions of Buildings through Real Energy Consumption Analysis: Holistic and Multidisciplinary Approach of Energy Signature. Energy Build. 2012, 55, 715–720. [Google Scholar] [CrossRef]
  31. Veillette, D.; Rouleau, J.; Gosselin, L. Impact of Window-to-Wall Ratio on Heating Demand and Thermal Comfort When Considering a Variety of Occupant Behavior Profiles. Front. Sustain. Cities 2021, 3, 700794. [Google Scholar] [CrossRef]
Figure 1. EDEA characteristic building BIM model (left) used in the simulations and demonstration houses of the EDEA project built in Cáceres, Spain (right).
Buildings 12 01994 g001
Figure 2. Location of the 35 cities studied grouped into 4 zones: north (white circle), center (blue circle), south on the continent (yellow rhombus), and south (yellow triangle).
Buildings 12 01994 g002
Figure 3. Heating demand (kWh/m2/year) in cities belonging to the northern, central, southern (on the continent), and southern EU for different insulation thicknesses.
Buildings 12 01994 g003
Figure 4. Heating demand intervals (kWh/m2/year) interpolated by IDW for the reference building with double-glazed windows of 4 + 12 + 6 mm and without insulation in the envelope (A), with insulation thicknesses of 40 mm (B) and with thicknesses of 80 mm insulation (C).
Buildings 12 01994 g004
Figure 5. Heating demand (A) and cooling demand (B) in southern EU cities for different insulation thicknesses and with single-glazed windows (6 mm).
Buildings 12 01994 g005
Figure 6. Improvement in heating (A) and cooling (B) demand replacing a single-glazed window (6 mm) with a double-glazed window (4 + 12 + 6 mm).
Buildings 12 01994 g006
Table 1. Wall areas, window opening areas, window wall ratios, and gross wall areas for the different façades of the simulated building.
Walls and AreasTotalNorth (315 to 45 deg)East (45 to 135 deg)South (135 to 225 deg)West (225 to 315 deg)
Gross Wall Area (m2)325.1175.374.8975.399.61
Above Ground Wall Area (m2)301.3375.374.8965.2585.88
Window Opening Area (m2)21.988.43013.550
Gross Window-Wall Ratio (%)6.7611.2017.990
Above Ground Window-Wall
Ratio (%)
7.2911.2020.760
Gross Wall Area (m2)325.1175.374.8975.399.61
Table 2. Building envelope construction solutions and material properties: t: Thickness; λ: Thermal conductivity; ρ: Density; Cp: Specific heat; R: Thermal resistivity; i(t): Insulation thickness where i = 0, 40, 80 or 120 mm. (1) Depending on the thickness R = i(t)/λ. (2) Spanish Technical Building Code [25].
ParametersU (W/m2K)Materialst
(10−2 m)
λ
(W/m K)
ρ (kg/m3)Cp
(J/kg K)
R
(m2K/W)
Roof2.40 i(0), 0.62 i(40), 0.36 i(80), 0.25 i(120)Crushed stone102.0145010500.05
Concrete with lightweight aggregates (1600 < ρ < 1800)81.15170010000.07
XPS expanded with CO2i(t)0.034381000(1)
Reinforced concrete
(2300 < ρ < 2500)
302.3240010000.13
Gypsum plaster
(1000 < ρ < 1300)
1.50.57115010000.03
Floor slab1.87 i(0), 0.59 i(40), 0.35 i(80), 0.25 i(120)Stoneware tile22.3250010000.01
Cement mortar for plastering (1600 < ρ < 1800)31.0152510000.03
XPS expanded with CO2i(t)0.034381000(1)
Reinforced concrete slab
(2300 < ρ < 2500)
152.3240010000.07
Hardcore (stone)402.0145010500.20
Outer wall (North and South)1.69 i(0), 0.61 i(40), 0.37 i(80), 0.27 i(120)Ceramic perforated brick11.50.667114010000.17
Unvented air chamber insulation5---0.18 (2)
Mineral wool insulationi(t)0.04401000(1)
Gypsum board (750 < ρ < 900)1.50.2582510000.06
Outer wall (East and West)1.13 i(0), 0.52 i(40), 0.33 i(80), 0.25 i(120)Viroc® Cement Bonded Particle Board (CBPB)20.22135015000.09
Unvented air chamber insulation10---0.19 (2)
Mineral wool insulationi(t)0.04401000(1)
Cement mortar for plastering (1600 < ρ < 1800)1.51152510000.02
Ceramic perforated brick11.50.667114010000.17
Cement mortar for plastering (1600 < ρ < 1800)1.51152510000.02
Unvented air chamber insulation5---0.18 (2)
Gypsum board (750 < ρ < 900)1.50.2582510000.06
Table 3. Interior construction solutions and material properties: t: Thickness; λ: Thermal conductivity; ρ: Density; Cp: Specific heat.
Interior Parameters Materialst
(10−2 m)
λ
(W/m K)
ρ (kg/m3)Cp (J/kg K)
Interior slab 1.66 W/m2KCeramic tile22.325001000
Cement mortar for plastering 1600 < ρ < 18003115251000
Concrete with lightweight aggregates 1600 < ρ < 180051.1517001000
Reinforced concrete slab 2300 < ρ < 2500372.324001000
Gypsum plaster 1000 < ρ < 130020.5711501000
Interior wall 2.09 W/m2KGypsum plaster 1000 < ρ < 13001.50.5711501000
Ceramic perforated brick11.50.66711401000
Gypsum plaster 1000 < ρ < 13001.50.5711501000
Table 4. Transmittance (W/m2K) of envelope elements (Uenv), window types (UW), and g/SHGC values: t = Insulation thickness (mm); N = North; S = South; E = East; W = West.
ElementsUenv Window TypeUWg/SHGC
t = 0t = 40t = 80t = 120
Roof2.560.630.360.256 mm glass with aluminum frame5.8
5.7
0.85
External wall (N and S)1.690.610.370.27
Internal wall (E andW)1.120.510.330.25
Interior slab1.66---4 + 12 + 6 mm glass with PVC frame2.7
1.8
0.77
Floor slab1.83---
Interior wall2.09---
Table 5. Internal loads and schedules used in the simulations [25]. WD: Working days; NWD: Weekend and public holidays.
Internal Load (W/m2)Schedule (Typical Week)
0:00–6:597:00–14:5915:00–17:5918:00–18:5919:00–22:5923:00–23:59
Occupation (Sensitive)WD2.150.541.081.081.082.15
NWD2.152.152.152.152.152.15
Occupation
(Latent)
WD1.360.340.680.680.681.36
NWD1.361.361.361.361.361.36
LightingBoth0.441.321.322.204.402.20
EquipmentBoth0.441.321.322.204.402.20
Table 6. Set-point temperatures and times used in the simulations [25].
Set Point TemperaturesPeriodSchedule (Typical Week)
0:00–6:597:00–14:5915:00–22:5923:00–23:59
Winter set-point (C) temperatures (heating)January–May17202017
June–September----
October–December17202017
Summer set-point temperatures (C) (cooling)January–May----
June–September27-2527
October–December----
Publisher’s Note: MDPI stays neutral with regard to jurisdictional claims in published maps and institutional affiliations.

