Abstract
Predictive Maintenance 4.0 (PdM 4.0) showed a highly positive impact on chilled water system (CWS) maintenance. This research followed the recommendations of a systematic literature review (SLR), which was performed on PdM 4.0 applications for CWS at commercial buildings. Per the SLR, and to start making an excellent PdM 4.0 program, the faults and their frequencies must be identified. Therefore, this research constructed an industry survey, which went through a pilot study, and then shared it with 761 maintenance officers in different commercial buildings. The first goal of this survey is to verify the faults reported by SLR, explore more faults, and suggest a managerial solution for each fault. The second goal is to determine the minimum and maximum frequencies of faults occurrence, while the third goal is to verify selected operational parameters, in which their data can be used in smart buildings applications. A total of 304 responses are considered in this study, which identified additional faults and provided faults solutions for all CWS components. Based on the survey outcomes, justifiable frequencies are proposed, which can be used in creating the dataset of any machine learning model, and then to control the CWS performance.
1. Introduction
The commercial building (CB) is defined as a large facility that contains sophisticated systems such as a chilled water system (CWS) and power plants [1]. Globally, the number of CBs have rapidly increased and require significant attention from a maintenance management point of view [2]. Wireman defined maintenance as managing any assets that are owned by the organization [3]. Duffuaa and others pointed out that maintenance can be looked such as a system with input and an associated output [4]. The input part contains workforces, management, tools, equipment, and machines, while the output part comprises the equipment or machines that are working perfectly, fulfilling the reliability concepts, and well-configured to reach the scheduled operational time. According to the European Standard, maintenance connects all managerial actions that are required during the life cycle of a particular CB’s equipment [5,6].
Previously, the attention provided to the maintenance was not recognized as it was considered as a “Cinderella Function” due to some historical reasons and it can be surmounted by new information technologies [7]. Up to around 1940, maintenance was considered as an inescapable cost and once the failure of a particular equipment happened, the maintenance technician should be servicing the same equipment based on a call request [8]. In 1968, it was predestined that better maintenance practices in the United Kingdom (UK) could have economized approximately GBP 300 million per year of lost production; because of the unavailability of a particular equipment [9]. In 1972, the significance of building maintenance was first recognized by the responsible authorities in the UK [10]. Maintenance became one of the important managerial departments or functions that should be included in the company’s organizational hierarchy [11]. Maintenance, in the 21st century is a huge business where operating and maintaining CBs is significantly taking more time than designing and constructing the same building during its project time, also the life cycle cost of operating and maintaining the same building is about sixty percent to eighty-five percent of the total cost, whereas its design and its construction are about five percent to ten percent [12]. Moreover, alongside energy costs, maintenance costs can be the biggest portion of the operational budget [13]. Many researchers have argued that implementing good and effective maintenance management increases the equipment performance and this is definitely maximizing the revenues, minimizing the operation and maintenance (O and M) costs, and then growing the organisations’ profits [14,15,16,17]. In this regard, Cholasuke and others explained how to maximise organisations’ profit through implementing maintenance management [18]. He listed some factors such as trying to minimise the accidents or failures. Dhillon presented an approach containing steps and important principles for maintenance management in a cost-effective manner such as measurement comes before control [19].
Maintenance can be actioned in many ways, depending on the operational status and the strategy of the organisation. However, Seeley categorized maintenance types for buildings [20]. He mentioned that it can be considered as a planned activity which can be organized by scheduling the building operation and tracking its performance, so it can be considered as a scheduled activity as well. In contrast, it can be also considered as unplanned activity [20,21]. In addition, it can be performed as a preventive task by controlling the building operation to reduce the probability of destruction, to avoid the failure of a mechanical or an electrical system (s), or to maintain an item performance from any unexpected breakdown [20,22]. Furthermore, this task can be considered as a planned, scheduled, or predictive activity [20,23]. In case of failure, it can be considered as a corrective workorder to return a system to its standard operation. For immediate action, maintenance can be known as an emergency task such as big water leakage or power outage. Furthermore, Kanisuru classified maintenance into four major types [24]. The first one is reactive (RM), corrective, or breakdown maintenance. The second one is preventive maintenance (PM), which he categorised it into two major types, predictive maintenance (PdM), which is considered in this article, and periodic one. The third major type of maintenance is the improvement or design maintenance while the fourth one is technology maintenance.
Applying quality engineering and quality control concepts in maintenance management and processes is one of the keys of making it a successful program. Having said that, Marquez and others presented a modelled framework containing eight phases, which are linked to four blocks (effectiveness, efficiency, assessment, and improvement) [25]. The philosophy behind this framework was to make a strategic plan for the organisations to improve the outcome of maintenance program. Applying the maintenance control function is another valuable technique for improving the maintenance management [26]. This function contains four phases, which are planning, organising, implementing, and controlling. Specifically, this research believes in the paradigm of the last phase (controlling), which is measuring the performance of the maintained equipment, taking predictive and corrective actions, and reviewing the associated policies and procedures. Quality control is one of the main domains of evaluating the risks of maintenance activities [27]. Chanter and Swallow argued that constructing industrial quality control procedures in maintenance projects prevents the organisation from any managerial failure with any contractual party [28]. One of the concepts of maintenance management is the process improvement, which is part of industrial quality control and was performed in many applications using Six-Sigma techniques [29,30,31,32]. With a specific regard to this research, the quality engineering approach is a data driven in PdM filed. It is one of the important features of the fourth industrial revolution, which is called Industry 4.0 [33]. Many research studies have proposed a data driven PdM framework for multiple purposes as part of quality control [34,35,36,37,38]. Zonnenshan and Kenett indicated that quality engineering is a crucial dimension of the processes in maintenance, and it should be a data driven, and accordingly they proposed a framework called Quality 4.0 [39]. According to Zonta and others, PdM is a rife area in the locomotion across Quality 4.0 and its related data are the clef to produce acquaintance that can partake to predict decisions [40].
This research follows a systematic literature review (SLR) study, which was looked into in the studies that proposed PdM frameworks or fault detection and diagnosis (FDD) protocols, which are in line with Industry 4.0/ Quality 4.0 [1]. The aforementioned SLR study explained and focused on CWS, which has four components as shown in Figure 1.
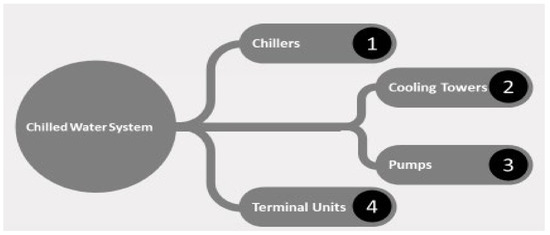
Figure 1.
CWS components.
The said SLR has two research questions (RQ) from engineering management point of view as follows:
- RQ1: How can the faults be identified in order to predict them?
- RQ2: What are the methods that can be used to predict the faults?
Based on these RQs, the SLR considered 168 studies that applied different machine learning (ML) algorithms to predict CWS faults [1]. In addition, two more review studies have been considered in this regard [41,42]. The fault here is defined as any operational issue that may negatively affect CWS over time [1]. Having said ML, the said studies were considered different operational parameters to collect their readings. These readings must cover two modes, which are fault existing and fault free [1,43]. The SLR defined these readings as fault frequencies, which are used to build the prediction model [1]. So, this research focuses on these two elements (faults and their frequencies), as the research gaps resulted from the said SLR were related to both. Table 1 shows the gaps that are intended to be filled by this research.

Table 1.
SLR’s research gaps.
To fill these three gaps, SLR recommended an industry survey to execute the following points:
- To validate the faults that are identified by the literature. Furthermore, from the first research gap the SLR argued that CWS may have some other different faults, so the survey can explore more ones;
- To identify the minimum and maximum faults’ occurrence timings. These timings help to determine the frequencies, which can be used in creating the dataset of any ML model; for more prediction accuracy;
- To understand how to solve/ fix the faults, which are either identified by the literature or by the survey.
2. Methodology
As mentioned in the previous section, this article is intended to address the aforementioned gaps, which are related to CWS’s faults and their frequencies by proposing a survey. A survey is defined as a research method utilised to collect data from a predetermined group of participants to obtain information and thoughts on diverse topics of interest [44]. Collecting data that are related to any study is important in terms of harmonization with the research goals [45]. In this research, the data should allow to investigate the operational circumstances at the buildings that are managed by the respondents. As recommended by the aforementioned SLR, the survey should be looked onto the CBs in the area/ city of the building that is going to be studied [1], and for this article Riyadh city of the Kingdom of Saudi Arabia was chosen.
2.1. Survey Construction
This research followed four guidelines while constructing the survey [46,47]. They are furnished in Figure 2.
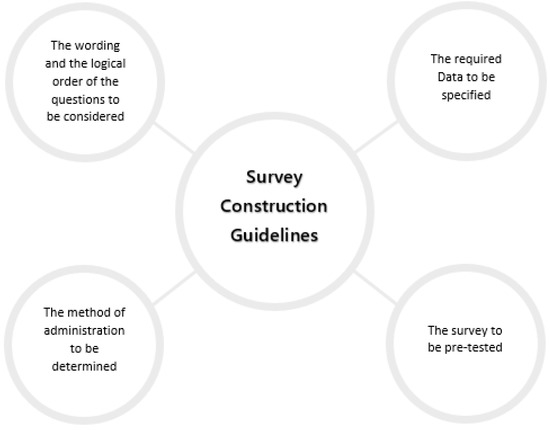
Figure 2.
Survey construction guidelines.
The proposed survey contains four parts, which acquire quantitative and qualitative data. The said survey began with asking the participants about the availability of CWS in their facilities. The answer required for this enquiry is either ‘yes’ or ‘no’, and the participants were asked to complete the survey if the answer was ‘yes’. The second part of the survey is related to the faults and asked the participants about the observation of listed faults that were collected from the literature for each CWS component and to provide additional faults that occurred in their buildings. Moreover, the participants were asked to suggest solution for each listed/ provided fault.
The third part of the survey is related to the faults frequencies by asking the participants which the most fault occurred so often and which most fault occurred rarely, and then to specify the frequency occurrence time for both. The further action of this part is to pick the frequencies’ minimum value of the faults that occur often, and to pick the frequencies’ maximum value of the faults that occur rarely. The idea here is to utilise these two values in creating the dataset that is going to be used in building any ML model. The minimum frequency is proposed to be used as a time interval in collecting the data for each component, for example, the readings should be taken every forty-five minutes. In contrast, the idea of using the maximum one is to consider it as a study period, for example, the readings should be taken over three months. Asking the participants to state those two faults is to make obtaining the frequencies information easy and to avoid any misunderstanding. As advised by the said SLR, the source of the associated data are the readings of any chosen operational parameter of each component as these operational parameters can reflect the health conditions of CWS components [1]. The fourth part of the said survey is seeking the opinion of the participants about the chosen operational parameter of each CWS component for validation purposes. The parameters are the water leaving temperature for chillers and cooling towers, pressure for pumps, and space temperature for terminal units. Up to this point, the first two guidelines, which are related to the specification of the data type and the consideration of the questions’ wording and their logical order, were fulfilled. Regarding the third guideline, which is related to the method of administration, the self-completed questionnaire is selected as an instrument to collect the data. The last guideline, which is related to pre-testing the survey, was performed through a pilot study, which is explained in the next subsection.
2.2. Pilot Study
In order to adhere to the fourth guideline, the draft questionnaire was sent to ten experts from academia and industry for their review and advice. In addition to the questions, the draft included an explanation of the research goal and expectation. This is to ensure that the survey with its questions is fulfilling the needs from validity and reliability points of view and to rise the response rate [48,49]. The experts from academia were from different departments/ fields, which are industrial engineering, mechanical engineering, electrical engineering, economics, and operation management. On the other hand, a manufacturer of each CWS component as well as an O and M contractor were the experts from the industry.
The experts were provided a month to reply with their feedback. Table 2 shows the main comments from both side, academia and industry.

Table 2.
Pilot study’s outcomes.
After addressing the experts’ comments, the survey was finalised and inserted into a web-based platform, which is explained in the next sub-section. Figure 3 shows an excerpt from the survey that is related to the cooling tower part. The same is repeated with other CWS components.

Figure 3.
Excerpt of cooling tower’s survey.
2.3. Targeted Participants and Survey Distribution
Following the outcome of the pilot study, the concerned authority in Riyadh city was contacted, and accordingly the professionals’ contacts of seven hundred and sixty-one (761) CBs were received, which contained e-mails and phone numbers. The professionals are facility managers, O and M managers, and support services managers. For survey distribution, the associated technique of the survey administration method, which is part of the survey construction guidelines, is the web-based questionnaire through the SurveyMonkey platform. The aforementioned platform generated e-mails to the participants, and following Andrews’ and others’ recommendations, an informative title of the e-mail was used as well as using careful language in the body of said e-mail in order to encourage the participants to open the e-mail, to click on the survey link, and to downplay the onus of the participants [50]. In this regard, the agreement with the participants was deal with their answers anonymously by writing a statement in the body of the generated e-mails. The duration of the survey was three months, and auto reminders were sent every seven working days. In addition to the auto reminders, a follow-up mechanism was used via phone calls for a more response rate [51].
3. Survey Results and Discussion
As the outcomes of the survey contained quantitative and qualitative data, an analysis activity was taken and then the said outcomes were summarised. The time spent on this task was three weeks.
3.1. Response Rate
From the mentioned 761 CBs that were contacted, three hundred and thirty-six (336) responses were received within the provided time, out of which three hundred and four (304) responses have CWS at their facilities, which are considered in this study. Figure 4 illustrates the response rate of the survey.
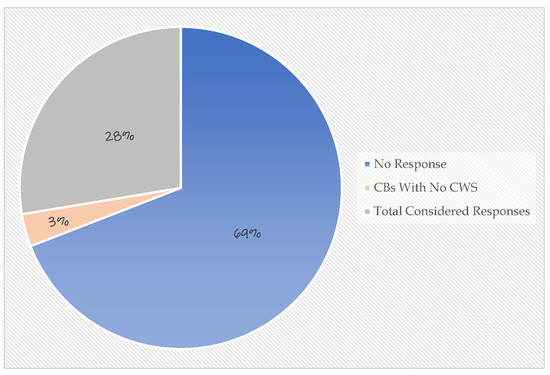
Figure 4.
Survey responses.
The auto reminders and the phone calls’ follow-up paid-off as the responses increased during the second and the third months, respectively. Figure 5 explains the number of responses for each month of the provided duration.
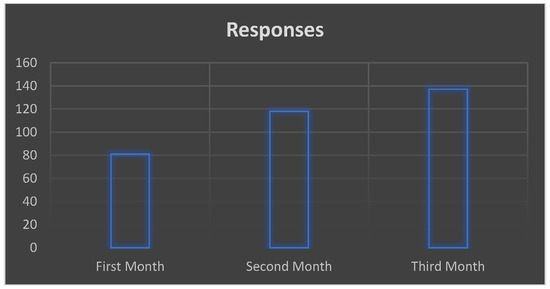
Figure 5.
Monthly number of responses.
3.2. CWS Faults
To summarise the CWS faults that were addressed in the SLR, a fish-bone diagram was prepared to highlight the same as shown in Figure 6. In contrast, the argument of the aforementioned SLR was proven here as the survey came up with more faults for each CWS component. The outcome provided the research community with seventeen (17) faults for chillers, thirteen (13) faults for cooling towers, ten (10) faults for pumps, and twenty (20) faults for terminal units. In this regard, Figure 7 illustrates the difference increment between the literature and the survey outcomes.
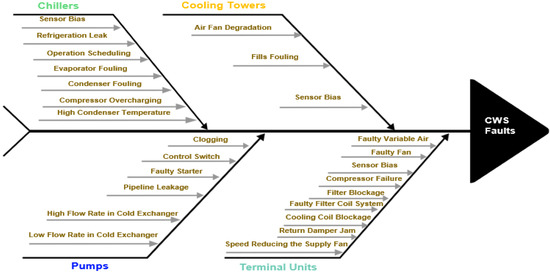
Figure 6.
Faults presented in the literature.
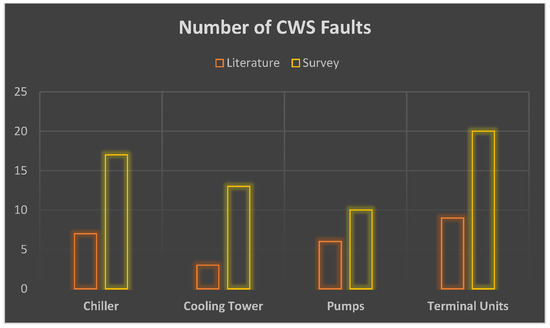
Figure 7.
Difference in faults number.
The appearance of faults is different between the CBs that are managed by the participants, who repeated some faults for each component and stated some other faults a few times or only one time. Table 3 shows the most repeated fault for each CWS component in the CBs that are managed by the participants.

Table 3.
Most repeated faults.
From the above table, a refrigeration leak is the most common fault for chillers, and this is aligned with what was mentioned in the said SLR. For the cooling towers, the literature mostly addressed fills fouling and air fan degradation faults, while the survey showed that the malfunctioning blowdown system fault is mostly repeated and therefore, more research attention should be provided to this fault. The same is seen with pumps and terminal units where the literature mostly addressed the pumps’ clogging fault and the terminal units’ return damper jam fault, while the survey showed different faults that are repeated by the majority of the participants and therefore, they should be provided more focus in the upcoming research.
As stated previously, the faults that were addressed in the literature were listed in the survey for each component and the participants were asked if they observe them, and then were asked to state other faults that are not listed. Furthermore, the survey provided managerial solutions for both the faults that were studied in the literature and the new faults that are resulted from the survey, whereas the previous studies of the said literature ended their proposed PdM or FDD programs by tracing the faults with no solutions to fix the studied faults. To summarise these outcomes, a table for each component describes the faults and its source, which is either from the literature or from the survey, as well as lists a solution/action for each fault. Table 4 is for chillers, and Table 5, Table 6 and Table 7 are for cooling towers, pumps, and terminal units, respectively.

Table 4.
Chillers faults and solutions.

Table 5.
Cooling towers faults and solutions.

Table 6.
Pumps faults and solutions.

Table 7.
Terminal units faults and solutions.
Part of the research gaps of the said SLR was related to the coverage of the previous studies where the literature did not focus on the entire CWS [1]. They were either considered one, two, or three components only [1]. In return, the said SLR argued to study the whole system; in order to obtain a comprehensive PdM program. Having said that, the information in Table 4, Table 5, Table 6 and Table 7 confirmed this argument as many faults in a particular component are due to the health condition of another component.
3.3. CWS Faults’ Frequencies
This subsection is related to the third part of the survey, which its concept was explained in the methodology section. The participants’ responses were counted by tabulating the frequencies’ values of the faults that are occurring so often (x’s) as well as the frequencies’ values of the faults that are occurred rarely (y’s). Then, the smallest value of the x’s and the biggest value of the y’s are identified. In addition, these two values were scored by the majority of the participants. Table 8 summarises these outcomes where each CWS component has two values (x and y) and shows the highest percentage of how many times each value is repeated by the participants.

Table 8.
Frequencies outcome.
From the above table, the proposed readings’ time interval of the chosen operational parameters for the chiller in operation is every 30 min over a study period of 12 weeks. The same procedure is for other CWS components taking into consideration that these frequencies are convenient and applicable for the chosen city (Riyadh). These frequencies provide a justifiable thought on how to build the ML model, to predict the faults, and to control the entire CWS. Having said the operational parameters, the survey asked the participants in its fourth part about their opinion on specific operational parameters for each CWS component. This is to ensure that these operational parameters are valid and are the best to provide the health condition of the CWS components, and accordingly to find and predict the faults. Table 9 shows that the majority of the participants said the chosen operational parameters are the best to predict the health condition of CWS components, and accordingly verifies the belief of the said SLR.

Table 9.
Operational parameters.
4. Conclusions
This article is a contribution of the published SLR research on the applications of PdM 4.0 for CWS at CBs. It is intended to fill the research gaps that are listed by the said SLR, which are related to the CWS faults and their frequencies. To address these research gaps, a survey was prepared as concluded by the said SLR, and it went through constructive guidelines and a pilot study. The survey was sent to 761 CBs in Riyadh city, which have valid registration certificates with the concerned authority. As recommended by the pilot study, the CBs that were contacted have a minimum age of three years. Within three months’ time, 336 responses were received, out of which 304 responses are considered in this research as they have CWS in their facilities.
Besides the outcomes of the said SLR, the survey enriched the research community with additional faults that are affecting CWS performance. It provided 17 faults for chillers, 13 faults for cooling towers, 10 faults for pumps, and 20 faults for terminal units, while the said literature only addressed 7 faults for chillers, 3 faults for cooling towers, 6 faults for pumps, and 9 faults for terminal units. Moreover, the survey provided a manageable solution or action for each fault, which either addressed in the literature or resulted from the survey, whereas the previous studies, which were mentioned in the said SLR, ended with only detecting the faults and they did not provide solutions to fix the same. Furthermore, this research showed the importance of covering the entire CWS in future studies as there are faults appearing in a particular CWS component due to another component’s health condition.
The main part of any PdM 4.0 program is applying ML algorithms to predict the system faults, and these algorithms require a dataset to build the predictive model. Having said that, the said literature has not justified the frequencies of fault appearance, which were used to create their datasets, noting that the source of these frequencies was the readings of chosen operational parameters. The survey resulted in justifiable frequencies for each component, which can be used in creating the dataset of any ML model and to control the CWS after training and testing the said model. The chosen operational parameters here are the water leaving temperature for chillers and cooling towers, the pressure for pumps, and the space temperature for the terminal units, which are the best to predict the faults as verified by the survey. To create a dataset for each CWS component, the readings of water leaving temperature of a particular chiller are proposed to be taken every 30 min for a time period of 12 weeks. For a particular cooling tower, the readings of water leaving temperature are proposed to be taken every 30 min for a time period of 24 weeks. For a particular pump, the readings of pressure are proposed to be taken every 60 min over a time period of 24 weeks. For a particular terminal unit, the readings of the space temperature should be taken every 45 min for a time period of 8 weeks. The readings must be taken while operating the system and should be collected by professional technicians or users. These data are recommended to be recorded by one of the quality engineering tools such as check sheet. The check sheet should include cells for writing down the readings as well as cells for the inspection results, which should be either ‘1′ in case of fault, or ‘0′ in case of no fault. So, the dataset contains two columns, one is for the readings of the particular component and the other one is for the related inspection results.
The scientific contributions of this research are summarised as follows:
- The survey outcomes verified that there are more faults, which are not addressed or identified by the literature;
- Based on the survey results, faults frequencies are proposed to provide the researchers a justifiable thought on how to build the dataset for any ML model;
- A solution or action is provided for each fault to provide a comprehensive management view as the literature ended the proposed PdM programs by tracing the faults.
Though this research and the said SLR made a rigorous investigation on PdM 4.0 application for CWS, researchers are advised to perform further studies to explore more insights on these applications. Below are the suggested future research agendas:
- While making a PdM 4.0 program, the proposed frequencies can be considered to create the dataset for ML algorithms;
- This research confirmed that the appearance of the faults at a particular CWS component is due to the health condition of another component. Therefore, future research should consider covering the whole system for a more effective PdM program;
- The selected building is assumed to have sensors, for example, to collect readings of the operational parameters. In case of no reading’s tools, a procedure on how to have them available should be discussed and proposed.
Author Contributions
Conceptualization, M.A. and K.M.; methodology, M.A.; investigation and analysis, M.A., A.A. and S.M.; writing—review and editing, M.A., A.A. and S.M.; supervision, K.M. All authors have read and agreed to the published version of the manuscript.
Funding
This research received no external funding.
Acknowledgments
Many thanks to the DMEM department at the University of Strathclyde, especially Anja Maier, Jorn Mehnen, Xichun Luo, Ian Whitfield, Laura Hay, and Gillian Eadie for their guidance, advice, and support. A special thanks also goes to Alfaisal University President (Mohammed Alhayaza), VP External relation and advancement (Maha Bint Mishari Bin Abdulaziz AlSaud), VP Admin and Finance (Khaled AlKattan), and Acting Dean of College of Engineering (Muhammad Anan) for their unlimited support. In addition, a big thanks goes to O and M Manager at Alfaisal University (Eng. Kaleemoddin Ahmed) as well as to Eng. Mohamed Yunus for their great assistance during this research.
Conflicts of Interest
The authors declare no conflict of interest.
References
- Almobarek, M.; Mendibil, K.; Alrashdan, A. Predictive Maintenance 4.0 for Chilled Water System at Commercial Buildings: A Systematic Literature Review. Buildings 2022, 12, 1229. [Google Scholar] [CrossRef]
- Hauashdh, A.; Jailani, J.; Rahman, I.A. Strategic approaches towards achieving sustainable and effective building maintenance practices in maintenance-managed buildings: A combination of expert interviews and a literature review. J. Build. Eng. 2022, 45, 103490. [Google Scholar] [CrossRef]
- Wireman, T. Developing Performance Indicators for Managing Maintenance, 2nd ed.; Industrial Press Inc.: New York, NY, USA, 2005. [Google Scholar]
- Duffuaa, S.O.; Raouf, A. Planning and Control of Maintenance Systems, 2nd ed.; Springer International Publishing: Zürich, Switzerland, 2015. [Google Scholar]
- Marquez, A.C.; Gupta, J.N. Contemporary maintenance management: Process, framework and supporting pillars. Omega 2006, 34, 313–326. [Google Scholar] [CrossRef]
- Márquez, A.C. The Maintenance Management Framework: Models and Methods for Complex Systems Maintenance, 1st ed.; Springer Science & Business Media: Berlin, Germany, 2007. [Google Scholar]
- Sherwin, D. A review of overall models for maintenance management. J. Qual. Maint. Eng. 2000, 6, 138–164. [Google Scholar] [CrossRef]
- Murthy, D.N.P.; Atrens, A.; Eccleston, J.A. Strategic maintenance management. J. Qual. Maint. Eng. 2002, 8, 287–305. [Google Scholar] [CrossRef]
- Kelly., A. Strategic Maintenance Planning, 1st ed.; Elsevier Ltd.: London, UK, 2006. [Google Scholar]
- Allen, D. What is Building Maintenance? Facilities 1993, 11, 7–12. [Google Scholar] [CrossRef]
- Pintelon, L.M.; Gelders, L.F. Maintenance management decision making. Eur. J. Oper. Res. 1992, 58, 301–317. [Google Scholar] [CrossRef]
- Lewis, A.; Riley, D.; Elmualim, A. Defining high performance buildings for operations and maintenance. Int. J. Facil. Manag. 2010, 1, 1–16. [Google Scholar]
- Dekker, R. Applications of maintenance optimization models: A review and analysis. Reliab. Eng. Syst. Saf. 1996, 51, 229–240. [Google Scholar] [CrossRef]
- Willmott, H. Business process re-engineering and human resource management. Pers. Rev. 1994, 23, 34–46. [Google Scholar] [CrossRef]
- Alsyouf, I. The role of maintenance in improving companies’ productivity and profitability. Int. J. Prod. Econ. 2007, 105, 70–78. [Google Scholar] [CrossRef]
- Naidu, S.; Amalesh, J.; Rao, P.V.; Sawhney, R. An Empirical Model for Maintenance Strategy Selection based on Organizational Profit. In Proceedings of the Industrial Engineering Research Conference, Norcross, GA, USA, 26–27 December 2009; Institute of Industrial and Systems Engineers (IISE): Peachtree Corners, GA, USA, 2009; pp. 1765–1770. [Google Scholar]
- Xia, T.; Sun, B.; Chen, Z.; Pan, E.; Wang, H.; Xi, L. Opportunistic maintenance policy integrating leasing profit and capacity balancing for serial-parallel leased systems. Reliab. Eng. Syst. Saf. 2021, 205, 107233. [Google Scholar] [CrossRef]
- Cholasuke, C.; Bhardwa, R.; Antony, J. The status of maintenance management in UK manufacturing organisations: Results from a pilot survey. J. Qual. Maint. Eng. 2004, 10, 5–15. [Google Scholar] [CrossRef]
- Dhillon, B.S. Engineering Maintenance: A Modern Approach, 1st ed.; CRC Press: Boca Raton, FL, USA, 2002. [Google Scholar]
- Seeley, I.H. Building Maintenance, 2nd ed.; Macmillan International Higher Education: New York, NY, USA, 1987. [Google Scholar]
- Tambe, P.P.; Mohite, S.; Kulkarni, M.S. Optimisation of opportunistic maintenance of a multi-component system considering the effect of failures on quality and production schedule: A case study. Int. J. Adv. Manuf. Technol. 2013, 69, 1743–1756. [Google Scholar] [CrossRef]
- Gouiaa-Mtibaa, A.; Dellagi, S.; Achour, Z.; Erray, W. Integrated Maintenance-Quality policy with rework process under improved imperfect preventive maintenance. Reliab. Eng. Syst. Saf. 2018, 173, 1–11. [Google Scholar] [CrossRef]
- Curcurù, G.; Galante, G.; Lombardo, A. A predictive maintenance policy with imperfect monitoring. Reliab. Eng. Syst. Saf. 2010, 95, 989–997. [Google Scholar] [CrossRef]
- Kanisuru, A.M. Sustainable Maintenance Practices and Skills for Competitive Production System, Chapter 3. In Skills Development for Sustainable Manufacturing; IntechOpen: Rijeka, Croatia, 2017. [Google Scholar]
- Márquez, A.C.; de León, P.M.; Fernández, J.G.; Márquez, C.P.; Campos, M.L. The maintenance management framework: A practical view to maintenance management. J. Qual. Maint. Eng. 2009, 15, 167–178. [Google Scholar] [CrossRef]
- Duffuaa, S.O.; Haroun, A.E. Maintenance control. In Handbook of Maintenance Management and Engineering; Springer: London, UK, 2009; pp. 93–113. [Google Scholar]
- Kosztyan, Z.T.; Pribojszki-Németh, A.; Szalkai, I. Hybrid multimode resource-constrained maintenance project scheduling problem. Oper. Res. Perspect. 2019, 6, 100129. [Google Scholar] [CrossRef]
- Chanter, B.; Swallow, P. Building Maintenance Management, 2nd ed.; Blackwell Publishing, John Wiley & Sons.: Hoboken, NJ, USA, 2008. [Google Scholar]
- Wang, X.; Wang, Y.; Xu, D. Lean six sigma implementations in equipment maintenance process. In Proceedings of the International Conference on Quality, Reliability, Risk, Maintenance, and Safety Engineering (ICQRMS), Chengdu, China, 15–18 June 2012; IEEE: Piscataway, NJ, USA, 2012; pp. 1391–1395. [Google Scholar]
- Zasadzien, M. Application of the Six Sigma method for improving maintenance processes-case study. In Proceedings of the 6th International Conference on Operations Research and Enterprise Systems, Porto, Portugal, 23–25 February 2017; SCITEPRESS: Setubal, Portugal, 2017; 2, pp. 314–320. [Google Scholar]
- Schafer, F.; Schwulera, E.; Otten, H.; Franke, J. From Descriptive to Predictive Six Sigma: Machine Learning for Predictive Maintenance. In Proceedings of the 2nd International Conference on Artificial Intelligence for Industries (AI4I), Laguna Hills, CA, USA, 25–27 September 2019; IEEE: Piscataway, NJ, USA, 2019; pp. 35–38. [Google Scholar]
- Vaidya, S.; Bhosle, S.; Ambad, P. DMAIC Approach to Improve Carbon Weighing Compliance of Banburry Machine. In Computing in Engineering and Technology; Springer: Singapore, 2020; pp. 803–816. [Google Scholar]
- Kenett, R.S.; Redman, T.C. The Real Work of Data Science: Turning Data into Information, Better Decisions, and Stronger Organizations, 1st ed.; John Wiley & Sons.: Hoboken, NJ, USA, 2019. [Google Scholar]
- Rodseth, H.; Schjolberg, P. Data-driven predictive maintenance for green manufacturing. In Proceedings of the 6th international workshop of advanced manufacturing and automation. Advances in Economics, Business and Management Research, University of Manchester, Manchester, UK, 10–11 November 2016; Atlantis Press: Amsterdam, The Netherlands, 2016; pp. 36–41. [Google Scholar]
- Gerum PC, L.; Altay, A.; Baykal-Gursoy, M. Data-driven predictive maintenance scheduling policies for railways. Transp. Res. Part C: Emerg. Technol. 2019, 107, 137–154. [Google Scholar] [CrossRef]
- Antomarioni, S.; Bevilacqua, M.; Potena, D.; Diamantini, C. Defining a data-driven maintenance policy: An application to an oil refinery plant. Int. J. Qual. Reliab. Manag. 2019, 36, 77–97. [Google Scholar] [CrossRef]
- Cheng, J.C.; Chen, W.; Chen, K.; Wang, Q. Data-driven predictive maintenance planning framework for MEP components based on BIM and IoT using machine learning algorithms. Autom. Constr. 2020, 112, 103087. [Google Scholar] [CrossRef]
- Pisacane, O.; Potena, D.; Antomarioni, S.; Bevilacqua, M.; Emanuele Ciarapica, F.; Diamantini, C. Data-driven predictive maintenance policy based on multi-objective optimization approaches for the component repairing problem. Eng. Optim. 2021, 53, 1752–1771. [Google Scholar] [CrossRef]
- Zonnenshain, A.; Kenett, R.S. Quality 4.0—The challenging future of quality engineering. Qual. Eng. 2020, 32, 614–626. [Google Scholar] [CrossRef]
- Zonta, T.; da Costa, C.A.; da Rosa Righi, R.; de Lima, M.J.; da Trindade, E.S.; Li, G.P. Predictive maintenance in the Industry 4.0: A systematic literature review. Comput. Ind. Eng. 2020, 150, 106889. [Google Scholar] [CrossRef]
- Mirnaghi, M.S.; Haghighat, F. Fault detection and diagnosis of large-scale HVAC systems in buildings using data-driven methods: A comprehensive review. Energy Build. 2020, 229, 110492. [Google Scholar] [CrossRef]
- Kim, W.; Katipamula, S. A review of fault detection and diagnostics methods for building systems. Sci. Technol. Built Environ. 2017, 24, 3–21. [Google Scholar] [CrossRef]
- Zhang, W.; Yang, D.; Wang, H. Data-driven methods for predictive maintenance of industrial equipment: A survey. IEEE Syst. J. 2019, 13, 2213–2227. [Google Scholar] [CrossRef]
- Schouten, B.; Peytchev, A.; Wagner, J. Adaptive Survey Design, 1st ed.; Chapman and Hall/CRC: New York, NY, USA, 2017. [Google Scholar]
- Ramakrishnan, T.; Jones, M.C.; Sidorova, A. Factors influencing business intelligence (BI) data collection strategies: An empirical investigation. Decis. Support Syst. 2012, 52, 486–496. [Google Scholar] [CrossRef]
- Anseel, F.; Lievens, F.; Schollaert, E.; Choragwicka, B. Response rates in organizational science, 1995–2008: A meta-analytic review and guidelines for survey researchers. J. Bus. Psychol. 2010, 25, 335–349. [Google Scholar] [CrossRef]
- Ghauri, P.; Gronhaug, K. Research Methods in Business Studies: A Practical Guide, 3rd ed.; Pearson Education Limited: London, UK, 2005. [Google Scholar]
- Easterby-Smith, M.; Thorpe, R.; Jackson, P.; Jaspersen, L. Management and Business Research, 6th ed.; Sage Publications Ltd.: London, UK, 2018. [Google Scholar]
- Saunders, M.N.K.; Lewis, P.; Thornhill, A. Research Methods for Business Students, 8th ed.; Pearson: London, UK, 2019. [Google Scholar]
- Andrews, D.; Nonnecke, B.; Preece, J. Electronic survey methodology: A case study in reaching hard-to-involve Internet users. Int. J. Hum.-Comput. Interact. 2003, 16, 185–210. [Google Scholar] [CrossRef]
- Hudson, D.; Seah, L.H.; Hite, D.; Haab, T. Telephone presurveys, self-selection, and non-response bias to mail and internet surveys in economic research. Appl. Econ. Lett. 2004, 11, 237–240. [Google Scholar] [CrossRef]
Publisher’s Note: MDPI stays neutral with regard to jurisdictional claims in published maps and institutional affiliations. |
© 2022 by the authors. Licensee MDPI, Basel, Switzerland. This article is an open access article distributed under the terms and conditions of the Creative Commons Attribution (CC BY) license (https://creativecommons.org/licenses/by/4.0/).