Abstract
The development of non-proprietary Ultra-High Performance Concrete (UHPC) is one way to reduce the initial cost of construction. However, workability is a major issue for which such mixtures are not practical in field conditions. Ultra-high performance cannot be achieved in field conditions if the concrete is not placed, finished, and compacted properly during placement. In this research, six UHPC mixtures were developed (three with steel fibers and three without fibers) using materials which are readily available on the local marketplace with water-to-cementitious materials ratios ranging between 0.17 to 0.30. The workability was determined using standard ASTM flow table apparatus, and specimens were prepared to determine compressive strength, splitting tensile strength, and permeable porosity. Flow table test exhibited flow values greater than 250 mm. Such high workability of the mixtures was achieved by optimizing the silica fume content and water reducing admixture dosage. These mixtures exhibited compressive strengths greater than 120 MPa and splitting tensile strengths greater than 5.10 MPa in both ambient and elevated curing temperatures. Results indicated that UHPC can be produced with a water-to-cementitious materials ratio as high as 0.30. Steel fibers helped to increase splitting tensile strength due to fiber-matrix interactions. Very low permeable porosity (1.7–16.7%) was observed which indicates superior durability due to the significant reduction of ingress of deleterious ions.
1. Introduction
Ultra-high-performance concrete (UHPC) is a relatively new class of cementitious composite material that is attracting interest globally due to its superior mechanical properties (very high strength and ductility) and excellent durability properties. UHPC was first developed in the early 1990s [1], with compressive strengths greater than 150 MPa. Apart from high strength, discrete steel fibers in UHPC help to improve tensile ductility. Due to its dense microstructure, UHPC possesses superior durability properties including resistance to alkali silica reactivity (ASR), rapid freeze–thaw cycles, negligible to very low chloride penetration, and significantly lower permeable porosity. Therefore, this innovative material can be used in a wider variety of highway infrastructure applications including closure and connection pours, thin-bonded overlays on deteriorated bridge decks, bridge shear keys (as a grout material), and connections between deck panels, and seismic retrofit of bridge substructures. Although UHPC offers several benefits to performance and design, like any other advanced material, the issue of the initial cost is a concern that needs to be addressed in order to make this innovative material available for a wide variety of applications. Several pre-packaged UHPC products are available in the commercial market [2,3,4], which are expensive, consequently increasing the initial cost of construction. This is the main reason for not being able to fully utilize the benefits of UHPC. Therefore, the use of local materials to produce non-proprietary UHPC products should be explored.
UHPC is typically produced with portland cement, silica fume, fine sand (particle size range of 75–600 μm), quartz powder, high range water reducing admixture (HRWRA), accelerators, discrete steel fibers, and water. UHPC mixtures are developed using a very low water-cementitious materials (w/cm) ratio, typically less than 0.20. Silica fume help enhance the microstructure by filling up the voids with the secondary hydrates produced due to its reaction with calcium hydroxide to form secondary C-S-H. Quartz powder is used to increase the pozzolanic reaction. The HRWRA is added to improve the workability of the mixture, while the steel fibers are used to improve the tensile ductility. Each of these materials’ selection plays an important role in developing UHPC that exhibits superior mechanical and durability properties.
UHPC’s superior properties are mainly due to its dense microstructure. Dense microstructure of UHPC can be achieved by optimizing the particle packing density at a very low w/cm ratio (less than 0.20). However, achieving optimum packing density in field conditions depends on proper pumping, casting, molding, and consolidation [5,6]. Otherwise, entrapped air, fiber segregation, and clustering will occur, leading to continued porous structure [7,8]. As a result, mechanical and durability properties will be negatively affected.
Developing workable UHPC mixtures is very important to achieve better consolidation and pumpability. Most studies on UHPC have focused on achieving and assessing mechanical properties and durability, and limited studies have elucidated the workability aspects of UHPC. Difficulties in the handling UHPC have been recognized as a major problem during construction because a significant workability reduction occurs due to a very low w/cm ratio and very high dosages of fine powders. Ultra-high performance could not be achieved if the required workability of UHPC does not meet. Therefore, in this research, an attempt has been made to develop a highly workable UHPC without compromising its mechanical strength.
The workability of UHPC depends on particle packing density, the specific surface area of constituent materials, chemical admixtures, absorption or release of water during the cement hydration process and temperature of the mixture [9]. So, the choice of material constituents can influence many parameters of UHPC, including strength, shrinkage, durability, etc. Choice of materials includes the cement type, supplementary cementitious material (SCM), aggregate type and size, type of fibers, and type of admixtures. Each of these factors can significantly change the fresh and hardened properties of UHPC. For example, short straight fibers produce a higher flow value than long straight and hooked fibers [10]. Again, an increase in fiber content decreases the workability while increasing the air content and permeable porosity [11]. At the same time, both compressive and flexural strength increases with the increase in fiber content in the case of straight fibers at1.5% by volume fiber content [11]. However, hooked fibers showed 17–50% improved bending strength for the same fiber content compared to straight fiber counterparts [10,12].
HRWRAs are polymers or copolymers with long chains [13] and help to reduce the w/cm ratio as low as 0.11 [1]. Cementitious particles absorb the HRWRA molecules and create steric and electrostatic forces [14,15]. Therefore, they repel each other, and water is released due to dispersion. As a result, flowability increases with increasing HRWRA dosage [13,16]. However, the type of HRWRA can affect the workability as their dispersion capacity varies with the chemical composition [17]. Therefore, the choice of HRWRA can depend on SCM used in the UHPC mixture.
Researchers use different types of SCMs to identify their suitability to produce UHPC. Since the specific surface area of different SCMs varies, their water absorption capacity and the resultant workability change. Nano-metakaolin reduces flowability due to higher specific surface area, for which the water absorption rate is high [18,19]. For a similar reason, rice husk ash and blast furnace slag should not be used at more than 40% replacement level [20,21]. Nevertheless, fly ash was found to increase workability due to its spherical shape, which creates a ball-bearing effect between particles [22]. However, the effect of silica fume (SF) on workability is not straight forward as other SCMs. The workability of the mixtures was improved due to the addition of silica fume [1,23]. However, other researchers reported that workability was reduced due to the addition of silica fume. Due to the large specific surface area of SF particles, water demand increases in UHPC mixtures [24]. Therefore, high SF content increases viscosity and requires a high HRWRA dosage to attain target workability [25]. Replacing 10–20% cement with SF was an optimum replacement level without negatively affecting the flowability [20,26]. However, Duval and Kadri [26] proposed a 10% optimum replacement level to maximize workability and strength. Type of SF used by these researchers may be one reason for this variation. Abdulkareem et al. [17] demonstrated that white SF outperformed grey SF in terms of workability. However, white SF underperformed in terms of compressive strength due to lower specific surface area, which reduces the rate of pozzolanic reaction. Carbon content in SF may also affect workability [27]. Nevertheless, the effect of SF on workability is still unclear [12].
The combined action of HRWRA and SF helped disperse flocculated cement particles, making more water available for lubrication [26]. At a 10–20% replacement level, spherical fine SF particles can provide a lubricating effect for which less HRWRA dosage is required [26]. After 20%, a higher specific surface area may subdue the lubricant effect of spherical particles, which increases the HRWRA requirement [20]. However, Duval and Kadri [26] showed that target workability could be achieved by minimum HRWRA dosage at a 10% SF replacement level. A significant amount of superplasticizer was adsorbed on the SF particles if the SF replacement level is high [28]. Liu et al. [13] found that at a constant w/cm ratio, HRWRA has a maximum adsorption capacity. When maximum capacity is reached, additional HRWRA remains unadsorbed which may agglomerate and increase the viscosity. Therefore, dispersive capacity and water reducing effect diminish with increased HRWRA dosage. This effect is more pronounced at a very low w/cm ratio (less than 0.20) with a high HRWRA dosage. However, the research was focused on attaining target workability by changing HRWRA dosage at a fixed SF content. Therefore, HRWRA dosage as high as 2% and more by mass of total cementitious material content were used by Richard & Cheyrezy [1], Shi et al. [21], Duval & Kadri [26], Aldahdooh et al. [27] at a very low w/cm ratio.
In this research, cost-effective, sustainable, and workable UHPC mixtures were developed using constituent materials that are local to northeast Ohio. This work demonstrated that a very low w/cm ratio (less than 0.20) is not needed to develop UHPC with comparable mechanical performance but can be developed using a w/cm as high as 0.30. The materials used were Type I/II portland cement, silica fume, fine sand, steel fibers that were 13 mm long (aspect ratio of 65), and HRWRA. Apart from the traditional UHPC containing steel fibers, mixtures without fibers were also studied to produce a cost-effective option for applications that do not require high tensile ductility. Flow test was performed to identify the workability of UHPC in fresh state while compressive strength and splitting tensile strength tests were performed in the hardened state to determine the mechanical properties. Permeable porosity was also determined to evaluate physical properties. The test results showed that the presented mixtures conformed to the UHPC class concrete as per ASTM C1856 [29].
2. Materials and Experimental Methods
2.1. Materials
Type I/II ordinary portland cement with a specific gravity of 3.15 was used in this study. Commercially available silica fume with a specific gravity of 2.24 was used as a mineral admixture. The chemical and physical properties of Type I/II cement and silica fume used in this study are presented in Table 1.

Table 1.
Chemical compositions and physical properties of cementitious materials.
Local sand conforming to ASTM C33 [30] was used in this work. The sand was first sieved through ASTM No. 30 sieve and then washed over ASTM No. 200 sieve to achieve particle size between 75–600 µm. After washing, the sand was kept in an oven at 105 °C to achieve 0% moisture content. Specific gravity and absorption values of the sand were determined according to ASTM C128 [31] and were found to be 2.78 and 2.35%, respectively. The particle size distribution of fine sand is shown in Figure 1, which is determined as per ASTM C136 [32].
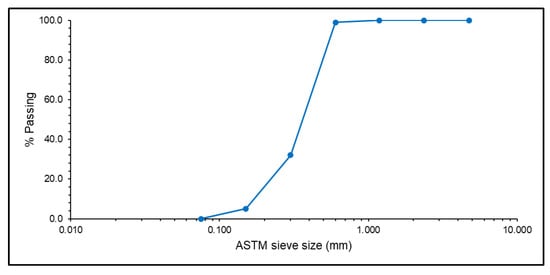
Figure 1.
Particle size distribution of fine aggregate.
Straight steel fibers (1.5% by volume) with a length of 13 mm and an aspect ratio of 65 were used to provide ductility. Polycarboxylate-based HRWRA (MasterGlenium 3030 from Master Builders Solutions) with an ability to reduce water demand by 25–30% was used to achieve workability”.
2.2. Mixture Proportioning of UHPC
Table 2 shows the mixture proportions, w/cm ratio, water-to-cement ratio (w/c), silica fume-to total cementitious materials (sf/cm) ratio, sand to-cementitious materials (s/cm) ratio, and HRWRA/cementitious materials ratio for the final six mixtures that were obtained by modifying the mixture proportions proposed by Allena and Newtson [33]. These mixtures were categorized into three groups: A, B, and C, based on silica fume content and w/cm ratio.
Table 2.
Mixture proportions of formulated UHPC mixtures.
Category A mixtures had the greatest silica fume content (20% by mass of total cementitious materials) with a 0.30 w/cm ratio. Mixture categories B and C were developed by modifying silica fume content and w/cm ratio used in the category A mixture. The w/cm ratio was reduced to 0.20 for category B mixtures which was further reduced to 0.17 for Category C mixtures. Silica fume content was also reduced to 16.7% and to 16.0% by mass of total cementitious material content for the corresponding mixtures to maintain workability.
2.3. Mixing Procedure, and Workability
A vertical shaft mixer with a 38 rpm paddle speed was used to mix the constituents of UHPC. Initially, sand and cementitious materials were dry mixed. After dry mixing for 2 min, 75% of the total water was added to the mixer. After thorough mixing, HRWRA, followed by the remaining 25% of water was added, and mixing was continued. Steel fibers were added to the mix at the end. The total mixing time varied from 15–20 min. The mixing sequence is illustrated in Figure 2. After mixing, the workability of freshly mixed UHPC was measured by conducting a flow table test as per ASTM C1437 [34].
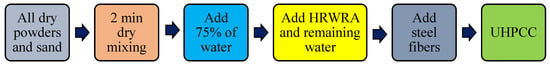
Figure 2.
Mixing procedure for UHPC.
2.4. Specimen Preparation
50 mm cubes, 100 mm cubes, 100 by 200 mm cylinders, and discs of 50 mm thick and 100 mm diameter were produced from each batch. A high frequency vibration table was used for consolidation. The time of vibration was selected based on the consistency of the individual mixture that ranged between 30–90 s. Specimens were cast into molds and were covered with plastic sheets to avoid loss of moisture and kept at room temperature for 24 h. After 24 h, specimens were demolded and placed under specified curing regimens.
2.5. Curing Regimes
Four different curing regimens were investigated in this research to study the effect of curing conditions on UHPC properties. The details of these four curing regimens are shown in Table 3.
Table 3.
Curing regimens.
2.6. Permeable Porosity
Water permeable porosity was determined by following the procedure reported in Yu et al. [35]. Disk specimens (100 mm diameter and 50 mm thickness) were prepared and cured for 7 and 28 days. Two disk specimens were tested on each day. Specimens were water saturated by submerging specimens under the water for 24 h. Water temperature was maintained at 23 ± 2 °C (73.5 ± 3.5 °F). After 24 h of saturation, the mass of the samples was measured underwater (). Samples were then air-dried to achieve saturated surface dry (SSD) condition, and the mass of SSD samples () was recorded. Air dried samples were then kept in an oven at 90 °C (194 °F) temperature for 24 h to achieve the oven-dry condition. After 24 h of oven drying, the oven-dry mass () of the samples was measured. The water permeable porosity of each sample was then calculated using the following equation.
2.7. Compressive Strength
A total of 144 cubes of 50 mm size and 96 cubes of 100 mm size were tested to evaluate the compressive strength of UHPC as per the procedure outlined in ASTM C109 [36] at 7 and 28 days.
2.8. Splitting Tensile Strength
A total of 96 cylinder specimens of size 100 by 200 mm were tested to evaluate the split tensile strength of UHPC as per ASTM C496 [37] at 7 and 28 days.
3. Results and Discussion
3.1. Workability
All the mixtures exhibited flow diameters larger than 200 mm as specified in ASTM C1856 [29] (Table 2). The plain mixtures exhibited flows greater than 250 mm (overflowing the flow table, Figure 3a) in both static (without jolting) and dynamic (with jolting) conditions. However, fiber-reinforced mixtures overflowed the flow table in dynamic conditions only. The shape of fibers increases the friction to achieve improved anchorage between fiber and matrix [38], resulting in reduced flow of the mixture.
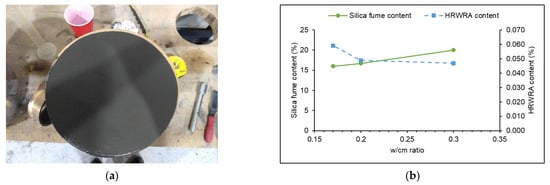
Figure 3.
Workability of UHPC mixtures; (a) flow table test, and (b) effect of silica fume content and HRWRA dosage on workability.
3.2. Permeable Porosity
Permeable porosity values for all UHPC mixtures are presented in Table 4 and Figure 4. UHPC mixtures exhibited very low porosity values. These values ranged from 1.7 to 21.8% after seven days of curing, while this range was between 1.7 and 16.7% after 28 days of curing. Here, porosity increased with the w/cm ratio. These values are consistent with the literature [39,40]. It has been observed that the curing period, curing temperature, fiber dosage, and silica fume content affect permeable porosity.
Table 4.
Mechanical and Physical Properties of UHPC Mixtures.
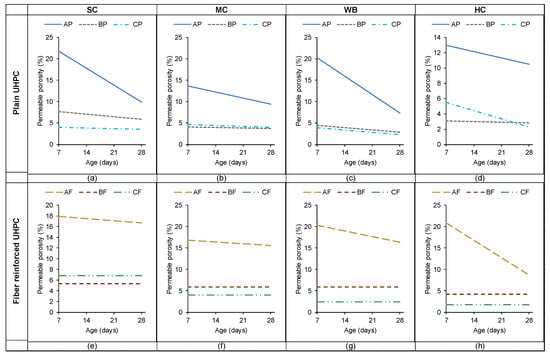
Figure 4.
Permeable porosity of plain UHPC mixtures cured under (a) SC, (b) MC, (c) WB, and (d) HC regimens and permeable porosity of fiber reinforced mixtures cured under (e) SC, (f) MC, (g) WB, and (h) HC regimens.
Figure 4 shows the effectiveness of a longer curing period in reducing permeable porosity. After 28 days of curing, the permeable porosity of AP and AF mixtures was reduced by 45.9% and 24.4%, respectively, compared to permeable porosity after seven days of curing. The reduction was 22.1% and 33.1% for BP and CP mixtures, respectively. However, the permeable porosity of BF and CF mixtures did not change with an extended curing period.
3.2.1. Effect of Curing Regimen on Permeable Porosity
The specimens cured under MC, WB, and HC curing regimens exhibited similar permeable porosity values and were lower than those of the SC curing regimen (Figure 5). However, the permeable porosity values exhibited by specimens cured at elevated temperatures (WB and HC) were the lowest compared to those cured under SC and MC curing regimens. One possible reason can be the greater amount of secondary calcium-silicate-hydrate (C-S-H) gel produced due to the accelerated pozzolanic reaction of silica fume at elevated temperature [41]. However, the MC curing regimen performed better than SC and produced almost similar permeable porosity as that of WB and HC. This can be attributed to the heat entrapped within the closed curing box (Table 3), and this heat might have increased the air temperature which might have eventually increased the hydration rate in specimens cured under MC curing regimen.
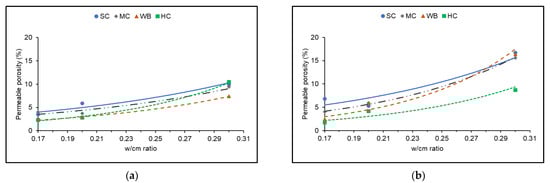
Figure 5.
Effect of curing regimens on permeable porosity of (a) plain UHPC and (b) fiber reinforced UHPC.
3.2.2. Effect of Steel Fibers on Permeable Porosity
Figure 6 shows that the permeable porosity of fiber reinforced mixtures is greater than the corresponding plain mixtures. Yu et al. [11] reported a similar trend for UHPCs with different fiber content. The Addition of steel fibers in a matrix of uniformly graded fine aggregate can reduce the packing density, which, in return might have increased the permeable porosity of the fiber-reinforced mixtures compared to corresponding plain mixtures [42,43].
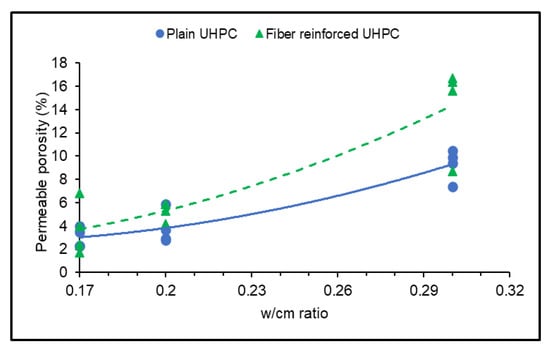
Figure 6.
Permeable porosity vs. w/cm ratio for formulated UHPCs.
3.2.3. Effect of Silica Fume Content on Permeable Porosity
The extreme fineness of silica fume (21.82 m2/gm) should help reduce the permeable porosity of concrete. However, in this study, a decrease in permeable porosity was observed with a decrease in silica fume content. Permeable porosities of plain and fiber reinforced mixtures were reduced by 67.5% and 74.0%, respectively, as the silica fume to cementitious materials (sf/cm) ratio decreased from 0.20 to 0.16 (Figure 7).
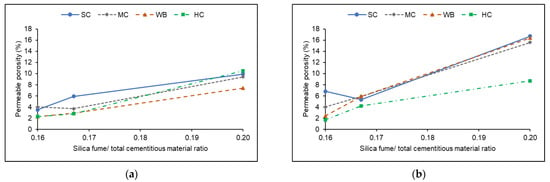
Figure 7.
Effect of silica fume content on permeable porosity in (a) plain UHPC and (b) in fiber reinforced UHPC.
For category A mixtures, w/cm ratio and sf/cm were 0.30 and 0.20, respectively. Sf/cm was reduced to 0.167 in the case of 0.20 w/cm ratio mixtures (category B) and was further reduced to 0.16 for 0.17 w/cm ratio mixtures (category C) to maximize the flowability of UHPC. With the reduction in w/cm, the permeable porosity of the mixtures decreased, consequently; a smaller amount of silica fume seems to be effectively filled up the capillary pores at a very low w/cm ratio.
However, 0.20 sf/cm ratio may not be sufficient to fill up the capillary pores present in the UHPC mixture with a 0.30 w/cm ratio. UHPC mixtures produced using greater w/cm ratios, lower permeable porosity can be achieved by increasing the silica fume content.
3.3. Compressive Strength of UHPC
The Average compressive strengths of 50 mm and 100 mm cube specimens produced from all six mixtures that were cured under different curing regimens are depicted in Figure 8 and Figure 9, respectively. These figures, show that 28 days of curing was required to achieve maximum compressive strength. WB curing regimen helped mixtures AF, BP, and BF to achieve compressive strengths of 138.0 MPa, 138.6 MPa, and 138.0 MPa, respectively. On the other hand, the greatest compressive strengths exhibited by mixtures AP, CP, and CF incurred under HC curing regimen were 127.0 MPa, 134.0 MPa, and 147.2 MPa, respectively. In similar studies, the compressive strength of non-proprietary UHPC mixtures was reported to be within the range of 120.0–190.0 MPa [44,45,46,47]. High volume of cementitious material content, use of silica fume to enhance secondary hydration reaction, improved packing density, and application of post-setting heat treatment can be attributed as the reasons for achieving ultra-high compressive strength [1].
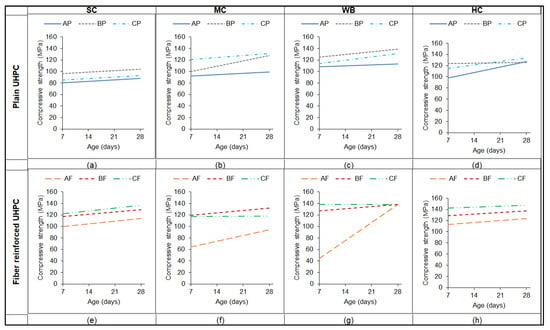
Figure 8.
Compressive strengths of 50 mm cube specimens of plain UHPC mixtures when cured under (a) SC, (b) MC, (c) WB, and (d) HC regimens and compressive strengths of 50 mm cube specimens of fiber reinforced UHPC mixtures when cured under (e) SC, (f) MC, (g) WB, and (h) HC regimens.
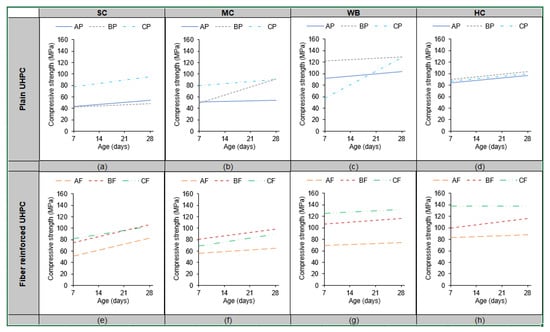
Figure 9.
Compressive strengths of 100 mm cube specimens of plain UHPC mixtures when cured under (a) SC, (b) MC, (c) WB, and (d) HC regimens and compressive strengths of 100 mm cube specimens of fiber reinforced UHPC mixtures when cured under (e) SC, (f) MC, (g) WB, and (h) HC regimens.
3.3.1. Effect of Curing Regimen on Compressive Strength
Development of compressive strength was influenced by the curing regimen in both plain and fiber-reinforced UHPC mixtures (Figure 10 and Figure 11).
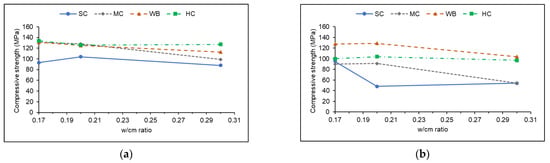
Figure 10.
Effect of different curing regimens on compressive strength of plain UHPC mixtures (a) 50 mm cube specimen and (b) 100 mm cube specimens.
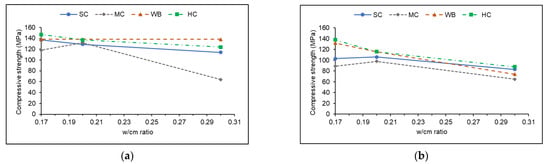
Figure 11.
Effect of different curing regimen on compressive strength of fiber-reinforced UHPC mixtures; (a) 50 mm cube specimens and (b) 100 mm cube specimens.
Plain UHPC: As can be seen from Figure 10a, the SC curing regimen was not effective in producing compressive strength greater than 120 MPa in plain mixtures. Compared to the SC curing regimen, the MC curing regimen helped increase the 50 mm cube compressive strengths by 24% and 42% for BP and CP mixtures, respectively. 100 mm cube compressive strength, specimens of AP and CP mixtures, when cured under SC and MC conditions, exhibited similar strengths (Figure 10b). Between the two accelerated curing regimens, WB cured specimens exhibited greater strengths than those of HC cured specimens. When compared to the SC curing regimen, the HC regimen helped increase compressive strengths by 45%, 22%, and 44% in CP, BP, and AP mixtures, respectively, while these increases were 41%, 34%, and 28%, respectively for specimens cured under WB curing regimen.
Fiber-reinforced UHPC: In the case of fiber reinforced UHPC mixtures, the target compressive strength of 120 MPa was achieved by 50 mm cube specimens cured under any of the curing regimens, including the SC curing regimen (Figure 11a).
MC curing regimen produced similar strengths as SC curing regimen for BF mixture. However, the compressive strengths of AF and CF mixtures under the MC curing regimen were lower than that of the SC curing regimen by 14% and 17%, respectively. This trend persisted for 100 mm cube specimens (Figure 11b). Again, accelerated curing regimens HC and WB increased 50 mm cube compressive strengths by 7% and 10%, respectively, compared to the SC regimen. However, for 100 mm cube specimens, a 7% increase in compressive strength with the HC curing regimen was observed compared to WB curing regimen.
3.3.2. Effect of Steel Fibers on Compressive Strength
Figure 12 shows the evidence that steel fibers influenced the compressive strength of UHPC cured under the SC curing regimen. This increase is significant in the case of SC cured specimens where fiber reinforced mixtures AF, BF, and CF exhibited 48%, 24%, and 29% greater compressive strengths compared to plain mixtures AP, BP, and CP, respectively. Similarly, 9% and 5% greater compressive strengths were observed for WB and HC curing regimens, respectively. The higher influence factor of steel fibers on compressive strength of SC cured specimens can be attributed to the lower strength gain in that curing regimen. Due to low strength, cracks formed and propagated at lower stress levels due to which the plain mixtures failed. However, the presence of steel fibers might have resisted crack propagation and delayed the failure for which the fiber reinforced mixtures exhibited higher compressive strengths when cured under SC curing regimen.
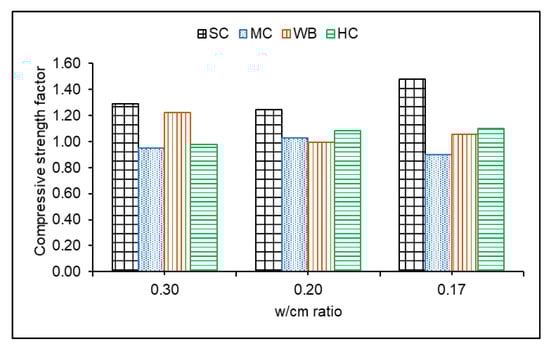
Figure 12.
Ratio of compressive strength of fiber-reinforced UHPC mixtures compared to plain UHPC mixtures.
However, a different trend was observed for the fiber reinforced UHPC mixtures under the MC curing regimen. On average, fiber reinforced mixtures exhibited 4% less compressive strength than plain mixtures. The reason for the lower compressive strengths of fiber reinforced mixtures can be attributed to the greater permeable porosity observed under the MC curing regimen (Figure 4b,f). The MC cured fiber reinforced mixtures had 42% more permeable porosity than plain mixtures.
3.3.3. Specimen Size Effect on Compressive Strength
Compressive strength increases as the size of the specimen decrease because the larger volume is more likely to contain an element of low strength. Much research data is available on the effects of specimen size on the compressive strength of normal strength concrete. However, the data on this subject for UHPC mixtures is limited. Therefore, an attempt has been made in the present research to investigate the effect of specimen size on the compressive strength of UHPC. 50 mm and 100 mm cube compressive strengths at 7 and 28 days were compared to investigate the influence of specimen size on compressive strength of UHPC. Conversion factors for the compressive strength of 50 mm cubes produced from each curing regimen were calculated to relate them to the 100 mm cube specimens. These factors are presented in Table 5. The conversion factors obtained here were consistent with earlier research [48,49,50].
Table 5.
Conversion factors for compressive strength from 100 mm cube strength to 50 mm cube strength at different curing regimen.
3.3.4. Relationship between Permeable Porosity and Compressive Strength
The compressive strengths of UHPC mixtures increased with the decrease in permeable porosity (Figure 13). Permeable porosity and total porosity have an indirect relationship. Since UHPC contains only fine sand, the porosity within the aggregates may be neglected. Therefore, porosity in UHPC primarily depends on capillary and gel pores. Again, a very low w/cm ratio of UHPC mixtures can result in the reduced size and volume of capillary pores. At the same time, silica fume fills up the micropores in the interfacial transition zone (ITZ) [45]. Silica fume also reacts with Ca(OH)2 at ITZ to produce secondary C-S-H gel that strengthens the bond strength of ITZ [45]. As a result, the reduction of porosity resulted in denser microstructure, and stronger ITZ increased the stress required to initiate bond cracking. Therefore, UHPC with lower permeable porosity exhibited greater compressive strength.
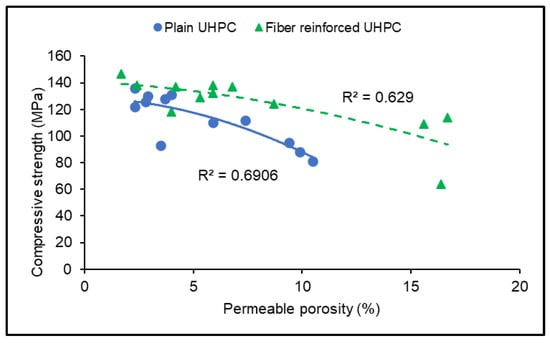
Figure 13.
Compressive strength vs. permeable porosity for formulated UHPC mixtures after 28 days of curing.
Figure 13 also shows that fiber reinforced UHPC exhibited greater compressive strength than plain UHPC mixtures, even at higher permeable porosity. The steel fibers might have prevented the crack propagation after their formation under compression, consequently greater strengths were observed. This observation is in agreement with the greater compressive strengths observed for fiber reinforced mixtures under the SC curing regimen as described in Section 3.3.2.
3.4. Splitting Tensile Strength
All the six UHPC mixtures cured for 7 and 28 days under different curing regimens were tested to evaluate the splitting tensile strength and are presented in Figure 14. Plain UHPC mixtures exhibited splitting tensile strength of 3.85–9.30 MPa while fiber reinforced UHPC mixtures showed 8.60–14.70 MPa after 28 days of curing. The splitting tensile strength of fiber reinforced UHPC mixtures was found between the range of 9.0–23.0 MPa [51,52,53,54]. Such high tensile strength can be achieved due to improved homogeneity, dense microstructure, as well as secondary hydration resulted from the application of silica fume [1]. Figure 14 shows that splitting tensile strengths were influenced by the w/cm ratio, curing regimen, and steel fibers.
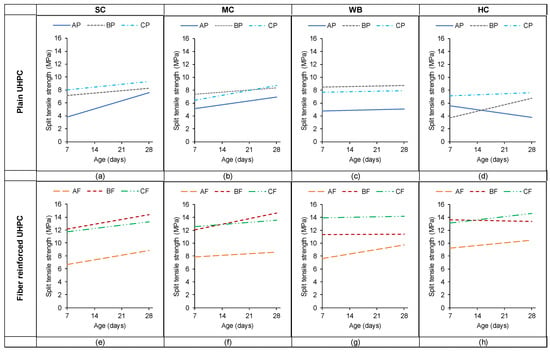
Figure 14.
Split tensile strength of plain UHPC mixtures when cured under (a) SC, (b) MC, (c) WB, and (d) HC regimens and split tensile strength of fiber reinforced UHPC mixtures when cured under (e) SC, (f) MC, (g) WB, and (h) HC regimens.
3.4.1. Effect of w/cm Ratio and Permeable Porosity
Splitting tensile strength was increased with the decrease in the w/cm ratio of UHPC mixtures (Figure 15). For plain mixtures, splitting tensile strength increased by 36.9% as the w/cm ratio decreased from 0.30 to 0.20. Further reduction in w/cm ratio from 0.20 to 0.17 increased the splitting tensile strength by 4.9%. In fiber-reinforced mixtures, these increases were 42.8%, and 3.3%, respectively. This increase in splitting tensile strengths is associated with the reduction in permeable porosity of UHPC as the w/cm ratio decreases (Figure 6).
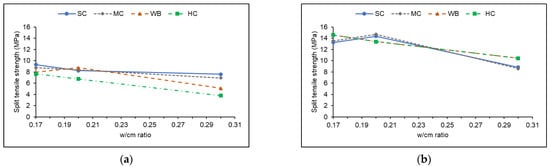
Figure 15.
Effect of different curing regimens on split tensile strength of (a) plain mixtures and (b) fiber-reinforced mixtures.
Splitting tensile strength was decreased with permeable porosity increase (Figure 16). For plain UHPC, as the permeable porosity increased by 8.2%, the splitting tensile strength decreased by approximately 35%. For fiber reinforced UHPC, as the permeable porosity increased by 15.0%, the split tensile strength was decreased by approximately 41%. As porosity decreases, the density of UHPC increases. In addition, the pozzolanic reaction of silica fume might have strengthened the ITZ. These two combined actions might have increased the splitting tensile strength at lower permeable porosity.
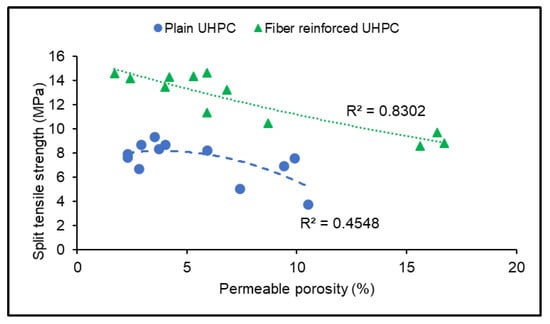
Figure 16.
Effect of permeable porosity on split tensile strength.
3.4.2. Effect of Curing Regimens
Plain UHPC: For plain mixtures, SC and MC cured specimens performed better than those cured under WB and HC curing regimens (Figure 15a and Figure 17a). Compared to SC cured specimens, the splitting tensile strength of the MC cured specimens showed an increase by 1.3% for mixture BP while it was decreased by 9.0% and 5.9% for AP and CP mixtures, respectively. Curing at elevated temperatures reduced the split tensile strength of plain UHPC mixtures. Splitting tensile strengths of AP and CP mixtures that were cured under the WB curing regimen were decreased by 33.0% and 14.4%, respectively, compared to those cured in the SC curing regimen. The splitting tensile strength of BP mixture was marginally increased (6.3%) when cured under the WB regimen compared to the SC regimen. However, lower splitting tensile strength was observed under the HC curing regimen in all three mixtures AP, BP, and CP. These decreases were 50.2%, 18%, and 17.8% for AP, BP, and CP, respectively.
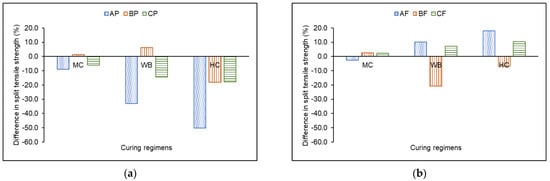
Figure 17.
Difference in split tensile strength compared to SC curing regimen for (a) plain mixtures and (b) fiber−reinforced mixtures.
Curing the specimens at elevated temperatures might have caused the drying of the samples and decreased the bond strength of the ITZ. Heat treatment can also cause thermal cracks within the specimens which might contribute to the lowered splitting tensile strength.
Fiber reinforced UHPC: The effect of curing regimens on splitting tensile strength is depicted in Figure 15b and Figure 17b. Compared to the SC curing regimen, specimens produced from the mixture AP and cured under the MC regimen exhibited a decrease in split tensile strength by 2.7%. However, splitting tensile strengths increased by 2.6% and 2.3% for BP and CP mixtures cured under the MC regimen. However, the WB curing regimen resulted in reduced splitting tensile strength of the BP mixture by 20.7%, while for AP and CP mixtures, it was increased by 10.1% and 7.3%, respectively compared to the SC curing regimen. Similarly, splitting tensile strength under the HC curing regimen was reduced by 6.7% for the BP mixture and increased by 17.9% and 10.4% for AP and CP mixtures, respectively. So, fiber–reinforced mixtures under WB and HC curing regimens performed better than SC and MC curing regimens.
3.4.3. Effect of Steel Fibers
The effect of steel fibers on splitting tensile strength is presented in Figure 18. The addition of 1.5% of steel fibers by volume significantly increased the splitting tensile strength. Specifically, the effect of steel fibers was pronounced with higher permeable porosity is beneficial. Figure 18 depicts the effect of steel fibers on splitting tensile strengths of mixtures produced with different w/cm ratios and by curing under different curing regimens. Splitting tensile strength of the SC cured specimens was increased by 16%, 74%, and 42% for category A, B, and C mixtures, respectively. With the MC curing regimen, these increases were 24%, 76%, and 55% for category A, B, and C mixtures, respectively. At elevated temperature curing, the effect was even more significant. WB curing regimen helped to increase splitting tensile strength by 91%, 30%, and 78% for category A, B, and C mixtures, respectively. For the HC curing regimen, these increases were 176%, 98%, and 91%, respectively. In fiber reinforced mixtures, interfacial shear and interlock between deformed surface of the fibers, and the matrix allowed stress to transfer from matrix to fiber which improved the tensile strength. Ming-zhe et al. [45] explained that the steel fibers impede the cracks from propagating and support the internal forces resulting from the fracture. Additionally, with the increase in stress, the crack-bridging effect of steel fibers, followed by partial debonding and pull out, increases the energy absorption capacity [44].
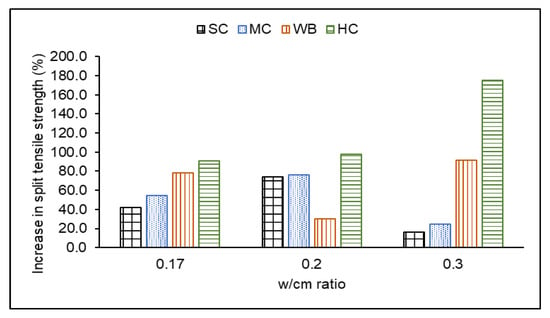
Figure 18.
Effect of steel fibers on splitting tensile strength of UHPC mixtures.
4. Conclusions
Six UHPC mixtures were developed in this research using locally available materials. The effect of silica fume content, HRWRA dosage, w/cm ratio, and different curing regimens on UHPC properties were studied. The following conclusions were drawn from this study.
- UHPC with a flow diameter greater than 250 mm can be developed at different w/cm ratios by adjusting silica fume content and HRWRA dosage. At 0.30 w/cm ratio, such a high workability was achieved by using HRWRA/cm ratio of 0.047 at sf/cm ratio of 0.20. At 0.20 w/cm ratio, HRWRA/cm ratio was increased to 0.048 while sf/cm ratio was decreased to 0.17 to achieve similar workability. Both HRWRA/cm ratio and sf/cm ratio were further adjusted to 0.059 and 0.16, respectively to achieve a flow diameter of 250 mm at w/cm ratio of 0.17. Therefore, at a very low w/cm ratio, silica fume content in the UHPC mixtures needs to be reduced with the increase in HRWRA dosage to achieve highly workable mixtures.
- For category A mixtures with a w/cm ratio of 0.30, curing at 90 °C temperature helped to achieve compressive strength as high as 138.0 MPa after 28 days of curing. In similar curing conditions, category B and C mixtures with w/cm ratios of 0.20 and 0.17, achieved compressive strength of 138.6 MPa and 147.2 MPa, respectively. Splitting tensile strengths obtained from category A, B and, C mixtures were 10.45 MPa, 13.40 MPa, and 14.60 MPa, respectively. Therefore, ultra-high strength can be achieved at a w/cm ratio as high as 0.30. This can inspire the local ready-mix concrete companies to produce UHPC as they might not require upgrading their system as warranted for the very low w/cm ratio mixtures.
- Results from the MC cured specimens showed that category B and C mixtures achieved 120 MPa compressive strength after seven days of curing, while the splitting tensile strength was 12.1 MPa for both mixtures. Therefore, UHPC class strength can be achieved in field conditions without using heat treatment which can also reduce the cost associated with the curing.
- Permeable porosity of category A mixtures was as low as 7.4%, which was observed after 28 days of 90 °C curing. However, category B and C mixtures achieved less than 6% permeable porosity after only seven, similar to category B and C mixtures.
5. Recommendation for Future Research
- Durability performance of the presented mixtures in terms of chloride ion ingress, resistance to rapid freezing-thawing cycles, and resistance to carbonation should be evaluated
- Drying shrinkage and autogenous shrinkage of developed mixtures should be investigated.
- Statistical inference using analysis of variance or other statistical tools should be used to validate further the conclusions drawn in this research.
- The cost of the materials and the cost associated with the curing should be investigated.
Author Contributions
The authors confirm the following contribution to this paper: funding acquisition: S.A.; study conception and design: T.M.H., L.G. and S.A.; data collection: T.M.H. and L.G.; analysis and interpretation of results: T.M.H., L.G. and S.A.; draft manuscript preparation: T.M.H., S.A., J.O.-D. and A.T. All authors have read and agreed to the published version of the manuscript.
Funding
This research received no external funding.
Data Availability Statement
Data is contained within the article.
Conflicts of Interest
The authors have no conflict of interest.
References
- Richard, P.; Cheyrezy, M. Composition of reactive powder concretes. Cem. Concr. Res. 1995, 25, 1501–1511. [Google Scholar] [CrossRef]
- Russell, H.G.; Graybeal, B.A.; Russell, H.G. Ultra-High Performance Concrete: A State-Of-The-Art Report for the Bridge Community; (No. FHWA-HRT-13-060); United States, Federal Highway Administration, Office of Infrastructure Research and Development: Mc Lean, VA, USA, 2013.
- Graybeal, B. Design and Construction of Field-Cast UHPC Connections; (No. FHWA-HRT-14-084; HRDI-40/10-14 (750) E); United States, Federal Highway Administration: Mc Lean, VA, USA, 2014.
- Alsalman, A.; Dang, C.N.; Martí-Vargas, J.R.; Hale, W.M. Mixture-Proportioning of Economical UHPC Mixtures. J. Build. Eng. 2020, 27, 100970. [Google Scholar] [CrossRef]
- Schmidt, M.; Fehling, E. Ultra-High-Performance Concrete: Research, Development and Application in Europe. ACI Spec. Publ. 2005, 228, 51–78. [Google Scholar]
- Yoo, D.Y.; Yoon, Y.S. A Review on Structural Behavior, Design, and Application of Ultra-High-Performance Fiber-Reinforced Concrete. Int. J. Concr. Struct. Mater. 2016, 10, 125–142. [Google Scholar] [CrossRef]
- Boulekbache, B.; Hamrat, M.; Chemrouk, M.; Amziane, S. Flowability of fibre-reinforced concrete and its effect on the mechanical properties of the material. Constr. Build. Mater. 2010, 24, 1664–1671. [Google Scholar] [CrossRef]
- Wang, R.; Gao, X. Relationship Between Flowability, Entrapped Air Content and Strength of UHPC Mixtures Containing Different Dosage of Steel Fiber. Appl. Sci. 2016, 6, 216. [Google Scholar] [CrossRef]
- Khayat, K.H.; Meng, W.; Vallurupalli, K.; Teng, L. Rheological Properties of Ultra-High-Performance Concrete—An Overview. Cem. Concr. Res. 2019, 124, 105828. [Google Scholar] [CrossRef]
- Yu, R.; Spiesz, P.; Brouwers, H. Development of Ultra-High Performance Fibre Reinforced Concrete (UHPFRC): Towards an efficient utilization of binders and fibres. Constr. Build. Mater. 2015, 79, 273–282. [Google Scholar] [CrossRef]
- Yu, R.; Spiesz, P.; Brouwers, H.J.H. Static Properties and Impact Resistance of a Green Ultra-High Performance Hybrid Fiber Reinforced Concrete (UHPHFRC): Experiments and Modeling. Constr. Build. Mater. 2014, 68, 158–171. [Google Scholar] [CrossRef]
- Hung, C.-C.; Chen, Y.-T.; Yen, C.-H. Workability, fiber distribution, and mechanical properties of UHPC with hooked end steel macro-fibers. Constr. Build. Mater. 2020, 260, 119944. [Google Scholar] [CrossRef]
- Liu, J.; Wang, K.; Zhang, Q.; Han, F.; Sha, J.; Liu, J. Influence of superplasticizer dosage on the viscosity of cement paste with low water-binder ratio. Constr. Build. Mater. 2017, 149, 359–366. [Google Scholar] [CrossRef]
- Li, C.-Z.; Feng, N.-Q.; Li, Y.-D.; Chen, R.-J. Effects of polyethlene oxide chains on the performance of polycarboxylate-type water-reducers. Cem. Concr. Res. 2005, 35, 867–873. [Google Scholar] [CrossRef]
- Li, Y.; Yang, C.; Zhang, Y.; Zheng, J.; Guo, H.; Lu, M. Study on dispersion, adsorption and flow retaining behaviors of cement mortars with TPEG-type polyether kind polycarboxylate superplasticizers. Constr. Build. Mater. 2014, 64, 324–332. [Google Scholar] [CrossRef]
- Weyers, M.; Kearsley, E.P. Effect of High Plasticiser Dosage on Ultra High-Performance Fibre Reinforced Concrete (UHPFRC). In International Conference on Application of Superabsorbent Polymers & Other New Admixtures Towards Smart Concrete; Springer: Berlin/Heidelberg, Germany, 2019; pp. 248–255. [Google Scholar]
- Abdulkareem, O.M.; Ben Fraj, A.; Bouasker, M.; Khelidj, A. Mixture design and early age investigations of more sustainable UHPC. Constr. Build. Mater. 2018, 163, 235–246. [Google Scholar] [CrossRef]
- Muhd Norhasri, M.S.; Hamidah, M.S.; Fadzil, A.M.; Megawati, O. Inclusion of nano metakaolin as additive in ultra high performance concrete (UHPC). Constr. Build. Mater. 2016, 127, 167–175. [Google Scholar] [CrossRef]
- Norhasri, M.M.; Hamidah, M.; Fadzil, A.M. Inclusion of nano metaclayed as additive in ultra high performance concrete (UHPC). Constr. Build. Mater. 2019, 201, 590–598. [Google Scholar] [CrossRef]
- Van Tuan, N.; Ye, G.; van Breugel, K.; Fraaij, A.L.; Dai Bui, D. The study of using rice husk ash to produce ultra high performance concrete. Constr. Build. Mater. 2011, 25, 2030–2035. [Google Scholar] [CrossRef]
- Shi, C.; Wang, D.; Wu, L.; Wu, Z. The hydration and microstructure of ultra high-strength concrete with cement–silica fume–slag binder. Cem. Concr. Compos. 2015, 61, 44–52. [Google Scholar] [CrossRef]
- Yazıcı, H.; Yiğiter, H.; Karabulut, A.; Baradan, B. Utilization of fly ash and ground granulated blast furnace slag as an alternative silica source in reactive powder concrete. Fuel 2008, 87, 2401–2407. [Google Scholar] [CrossRef]
- Wang, D.; Shi, C.; Wu, Z.; Xiao, J.; Huang, Z.; Fang, Z. A review on ultra high performance concrete: Part II. Hydration, microstructure and properties. Constr. Build. Mater. 2015, 96, 368–377. [Google Scholar] [CrossRef]
- Sbia, L.A.; Peyvandi, A.; Lu, J.; Abideen, S.; Weerasiri, R.R.; Balachandra, A.M.; Soroushian, P. Production methods for reliable construction of ultra-high-performance concrete (UHPC) structures. Mater. Struct. 2016, 50, 7. [Google Scholar] [CrossRef]
- Holland, T.C. Silica Fume User's Manual; Federal Highway Administration: Washinton, DC, USA, 2005. [Google Scholar]
- Duval, R.; Kadri, E. Influence of Silica Fume on the Workability and the Compressive Strength of High-Performance Concretes. Cem. Concr. Res. 1998, 28, 533–547. [Google Scholar] [CrossRef]
- Aldahdooh, M.; Bunnori, N.M.; Johari, M.A.M. Evaluation of ultra-high-performance-fiber reinforced concrete binder content using the response surface method. Mater. Des. 2013, 52, 957–965. [Google Scholar] [CrossRef]
- Khatri, R.; Sirivivatnanon, V.; Gross, W. Effect of different supplementary cementitious materials on mechanical properties of high performance concrete. Cem. Concr. Res. 1995, 25, 209–220. [Google Scholar] [CrossRef]
- ASTM C1856/C1856M-17; Standard Practice for Fabricating and Testing Specimens of Ultra-High Performance Concrete. ASTM International: West Conshohocken, PA, USA, 2017. Available online: www.astm.org (accessed on 5 October 2022).
- ASTM C33/C33M-18; Standard Specification for Concrete Aggregates. ASTM International: West Conshohocken, PA, USA, 2018. Available online: www.astm.org (accessed on 5 October 2022).
- ASTM C128-15; Standard Test Method for Relative Density (Specific Gravity) and Absorption of Fine Aggregate. ASTM International: West Conshohocken, PA, USA, 2015. Available online: www.astm.org (accessed on 5 October 2022).
- ASTM C136/C136M-19; Standard Test Method for Sieve Analysis of Fine and Coarse Aggregates. ASTM International: West Conshohocken, PA, USA, 2019. Available online: www.astm.org (accessed on 5 October 2022).
- Allena, S.; Newtson, C.M. Ultra-High Strength Concrete Mixtures Using Local Materials. J. Civ. Eng. Arch. 2011, 5, 322–330. [Google Scholar]
- ASTM C1437-15; Standard Test Method for Flow of Hydraulic Cement Mortar. ASTM International: West Conshohocken, PA, USA, 2015. Available online: www.astm.org (accessed on 5 October 2022).
- Yu, R.; Spiesz, P.; Brouwers, H.J.H. Mix design and properties assessment of Ultra-High Performance Fibre Reinforced Concrete (UHPFRC). Cem. Concr. Res. 2014, 56, 29–39. [Google Scholar] [CrossRef]
- ASTM C109/C109M-16a; Standard Test Method for Compressive Strength of Hydraulic Cement Mortars (Using 2-in. or [50-mm] Cube Specimens). ASTM International: West Conshohocken, PA, USA, 2016. Available online: www.astm.org (accessed on 5 October 2022).
- ASTM C496/C496M-17; Standard Test Method for Splitting Tensile Strength of Cylindrical Concrete Specimens. ASTM International: West Conshohocken, PA, USA, 2017. Available online: www.astm.org (accessed on 5 October 2022).
- Dyer, T. Concrete Durability; CRC Press: Boca Raton, FL, USA, 2014. [Google Scholar]
- Pyo, S.; Kim, H.-K. Fresh and hardened properties of ultra-high performance concrete incorporating coal bottom ash and slag powder. Constr. Build. Mater. 2017, 131, 459–466. [Google Scholar] [CrossRef]
- Funk, J.E.; Dinger, D.R. Predictive Process Control of Crowded Particulate Suspensions: Applied to Ceramic Manufacturing; Springer Science & Business Media: New York, NY, USA, 2013. [Google Scholar]
- Jeong, D.G.; Lee, H.S. The effect of Pozzolanic reaction under different curing temperatures in strength development of RPC. In Proceedings of the International Conference on Sustainable Building Asia, Seoul, Korea, 24–26 February 2010. [Google Scholar]
- Grünewald, S. Performance-Based Design of Self-Compacting Fibre Reinforced Concrete. Doctoral Dissertation, Delft University, Delft, The Netherlands, 2004. Available online: http://resolver.tudelft.nl/uuid:07a817aa-cba1-4c93-bbed-40a5645cf0f1 (accessed on 5 October 2022).
- Mindess, S.; Young, J.F.; Darwin, D. Concrete, 2nd ed.; Pearson Education Inc.: Upper Saddle River, NJ, USA, 2002. [Google Scholar]
- Yang, I.H.; Joh, C.; Kim, B.-S. Structural behavior of ultra high performance concrete beams subjected to bending. Eng. Struct. 2010, 32, 3478–3487. [Google Scholar] [CrossRef]
- Kang, S.-T.; Kim, J.-K. The relation between fiber orientation and tensile behavior in an Ultra High Performance Fiber Reinforced Cementitious Composites (UHPFRCC). Cem. Concr. Res. 2011, 41, 1001–1014. [Google Scholar] [CrossRef]
- Visage, E.T.; Weldon, B.D.; Jauregui, D.V.; Newtson, C.M. Flexural Performance of Ultrahigh-Performance Concrete Developed Using Local Materials. J. Mater. Civ. Eng. 2019, 31, 04019050. [Google Scholar] [CrossRef]
- Nasrin, S.; Ibrahim, A. Flexural response of Ultra-High-Performance Concrete (UHPC) hybrid bridge deck connections made with local materials. Constr. Build. Mater. 2021, 270, 121451. [Google Scholar] [CrossRef]
- An, M.; Zhang, L.J.; Yi, Q.X. Size Effect on Compressive Strength of Reactive Powder Concrete. J. China Univ. Min. Technol. 2008, 18, 279–282. [Google Scholar] [CrossRef]
- Graybeal, B.; Davis, M. Cylinder or Cube: Strength Testing of 80 to 120 MPa (11.6 to 29 ksi) Ultra-High-Performance Fiber-Reinforced Concrete. ACI Mater. J. 2008, 110, 603–609. [Google Scholar]
- Kazemi, S.; Lubell, A.S. Influence of Specimen Size and Fiber Content on Mechanical Properties of Ultra-High-Performance Fiber-Reinforced Concrete. ACI Mater. J. 2012, 109, 675–684. [Google Scholar]
- Graybeal, B. Material Property Characterization of Ultra-High Performance Concrete; Federal Highway Administration: McLean, VA, USA, 2006.
- Graybeal, B.; Baby, F. Development of a Direct Tension Test Method for UHPFRC. ACI Mater. J. 2013, 110, 177–186. [Google Scholar]
- Shafieifar, M.; Farzad, M.; Azizinamini, A. Experimental and numerical study on mechanical properties of Ultra High Performance Concrete (UHPC). Constr. Build. Mater. 2017, 156, 402–411. [Google Scholar] [CrossRef]
- Gurusideswar, S.; Shukla, A.; Jonnalagadda, K.N.; Nanthagopalan, P. Tensile strength and failure of ultra-high performance concrete (UHPC) composition over a wide range of strain rates. Constr. Build. Mater. 2020, 258, 119642. [Google Scholar] [CrossRef]
Publisher’s Note: MDPI stays neutral with regard to jurisdictional claims in published maps and institutional affiliations. |
© 2022 by the authors. Licensee MDPI, Basel, Switzerland. This article is an open access article distributed under the terms and conditions of the Creative Commons Attribution (CC BY) license (https://creativecommons.org/licenses/by/4.0/).