
A Design Method for Semi-Rigid Steel Frame via Pre-Established Performance-Based Connection Database


Abstract
:1. Introduction
2. Proposed Method for Semi-Rigid Steel Frame Design
2.1. Normalization of the Joint Properties
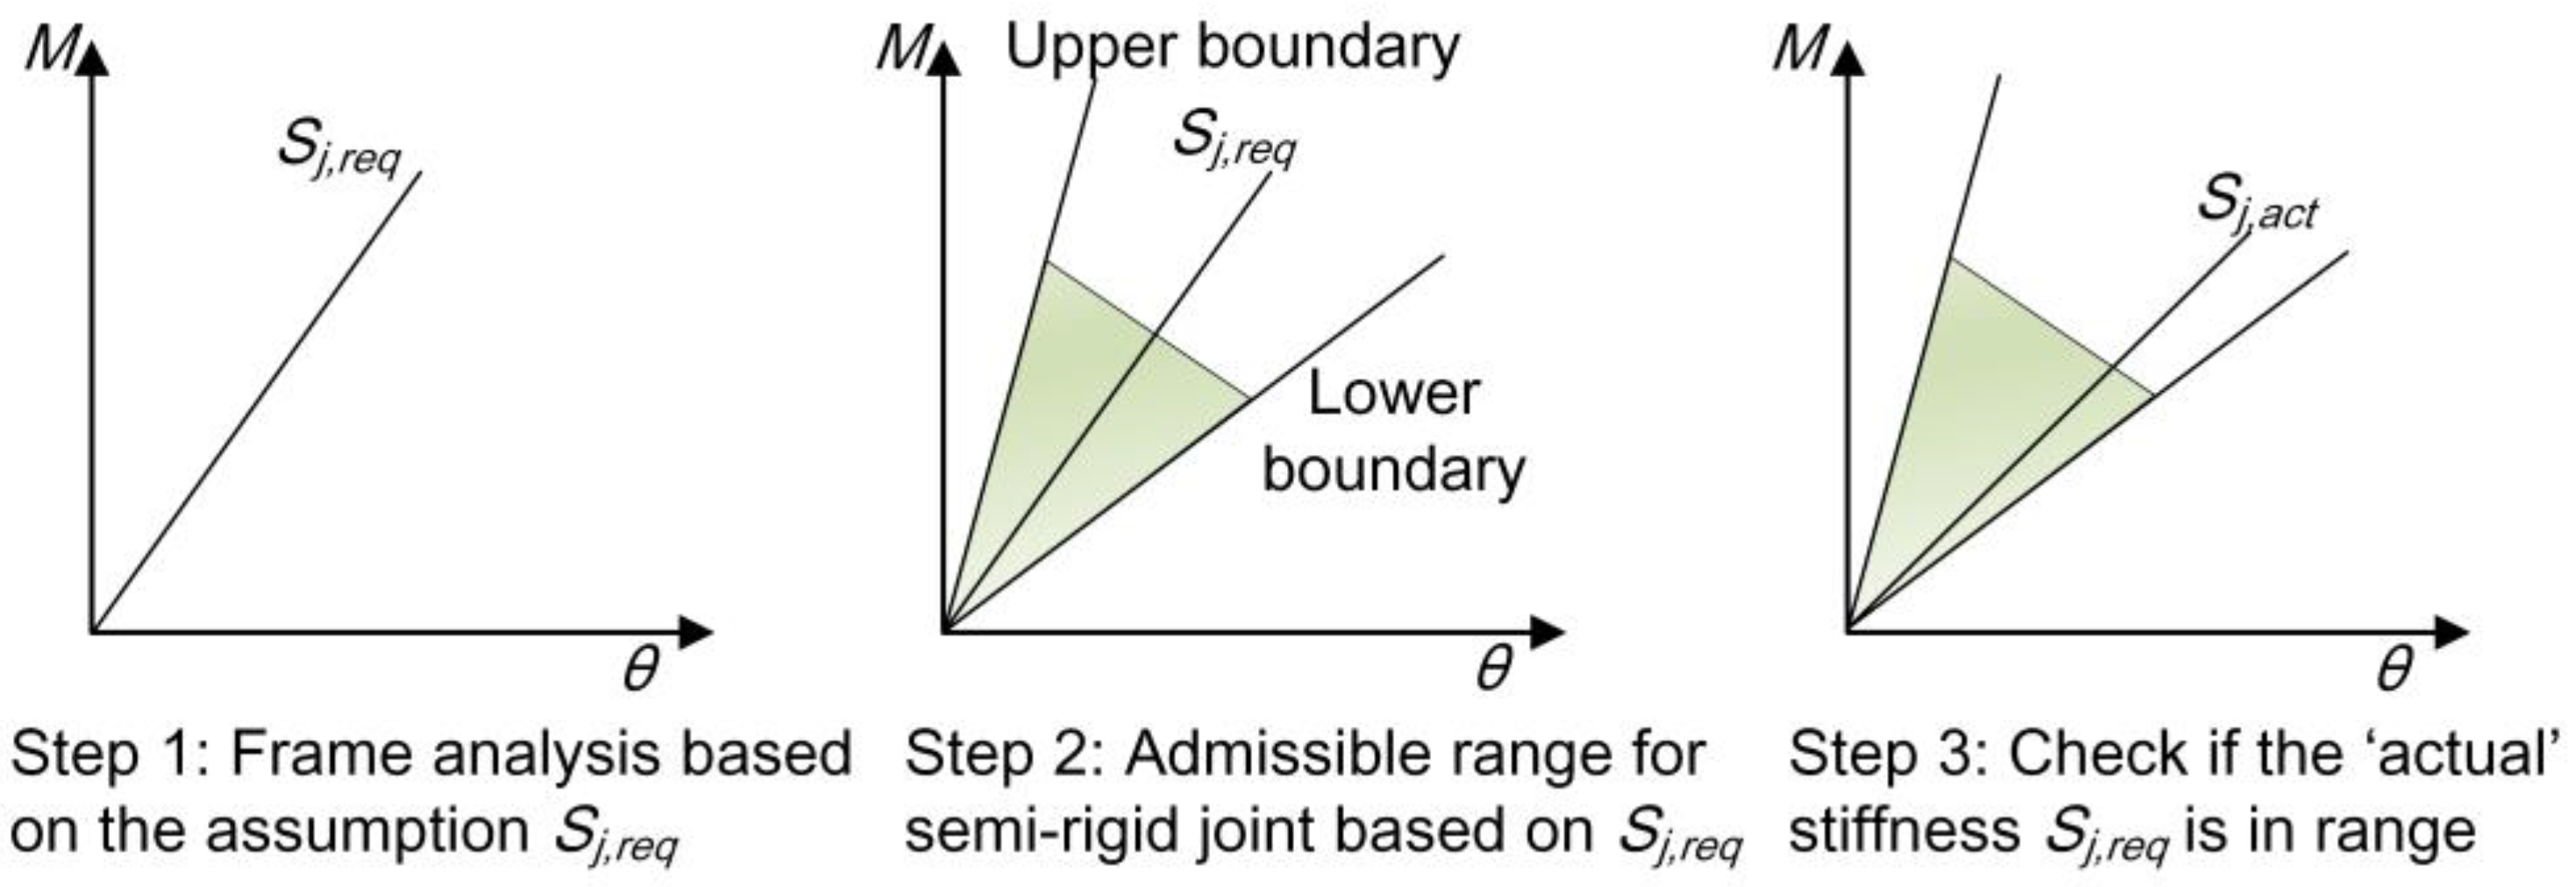
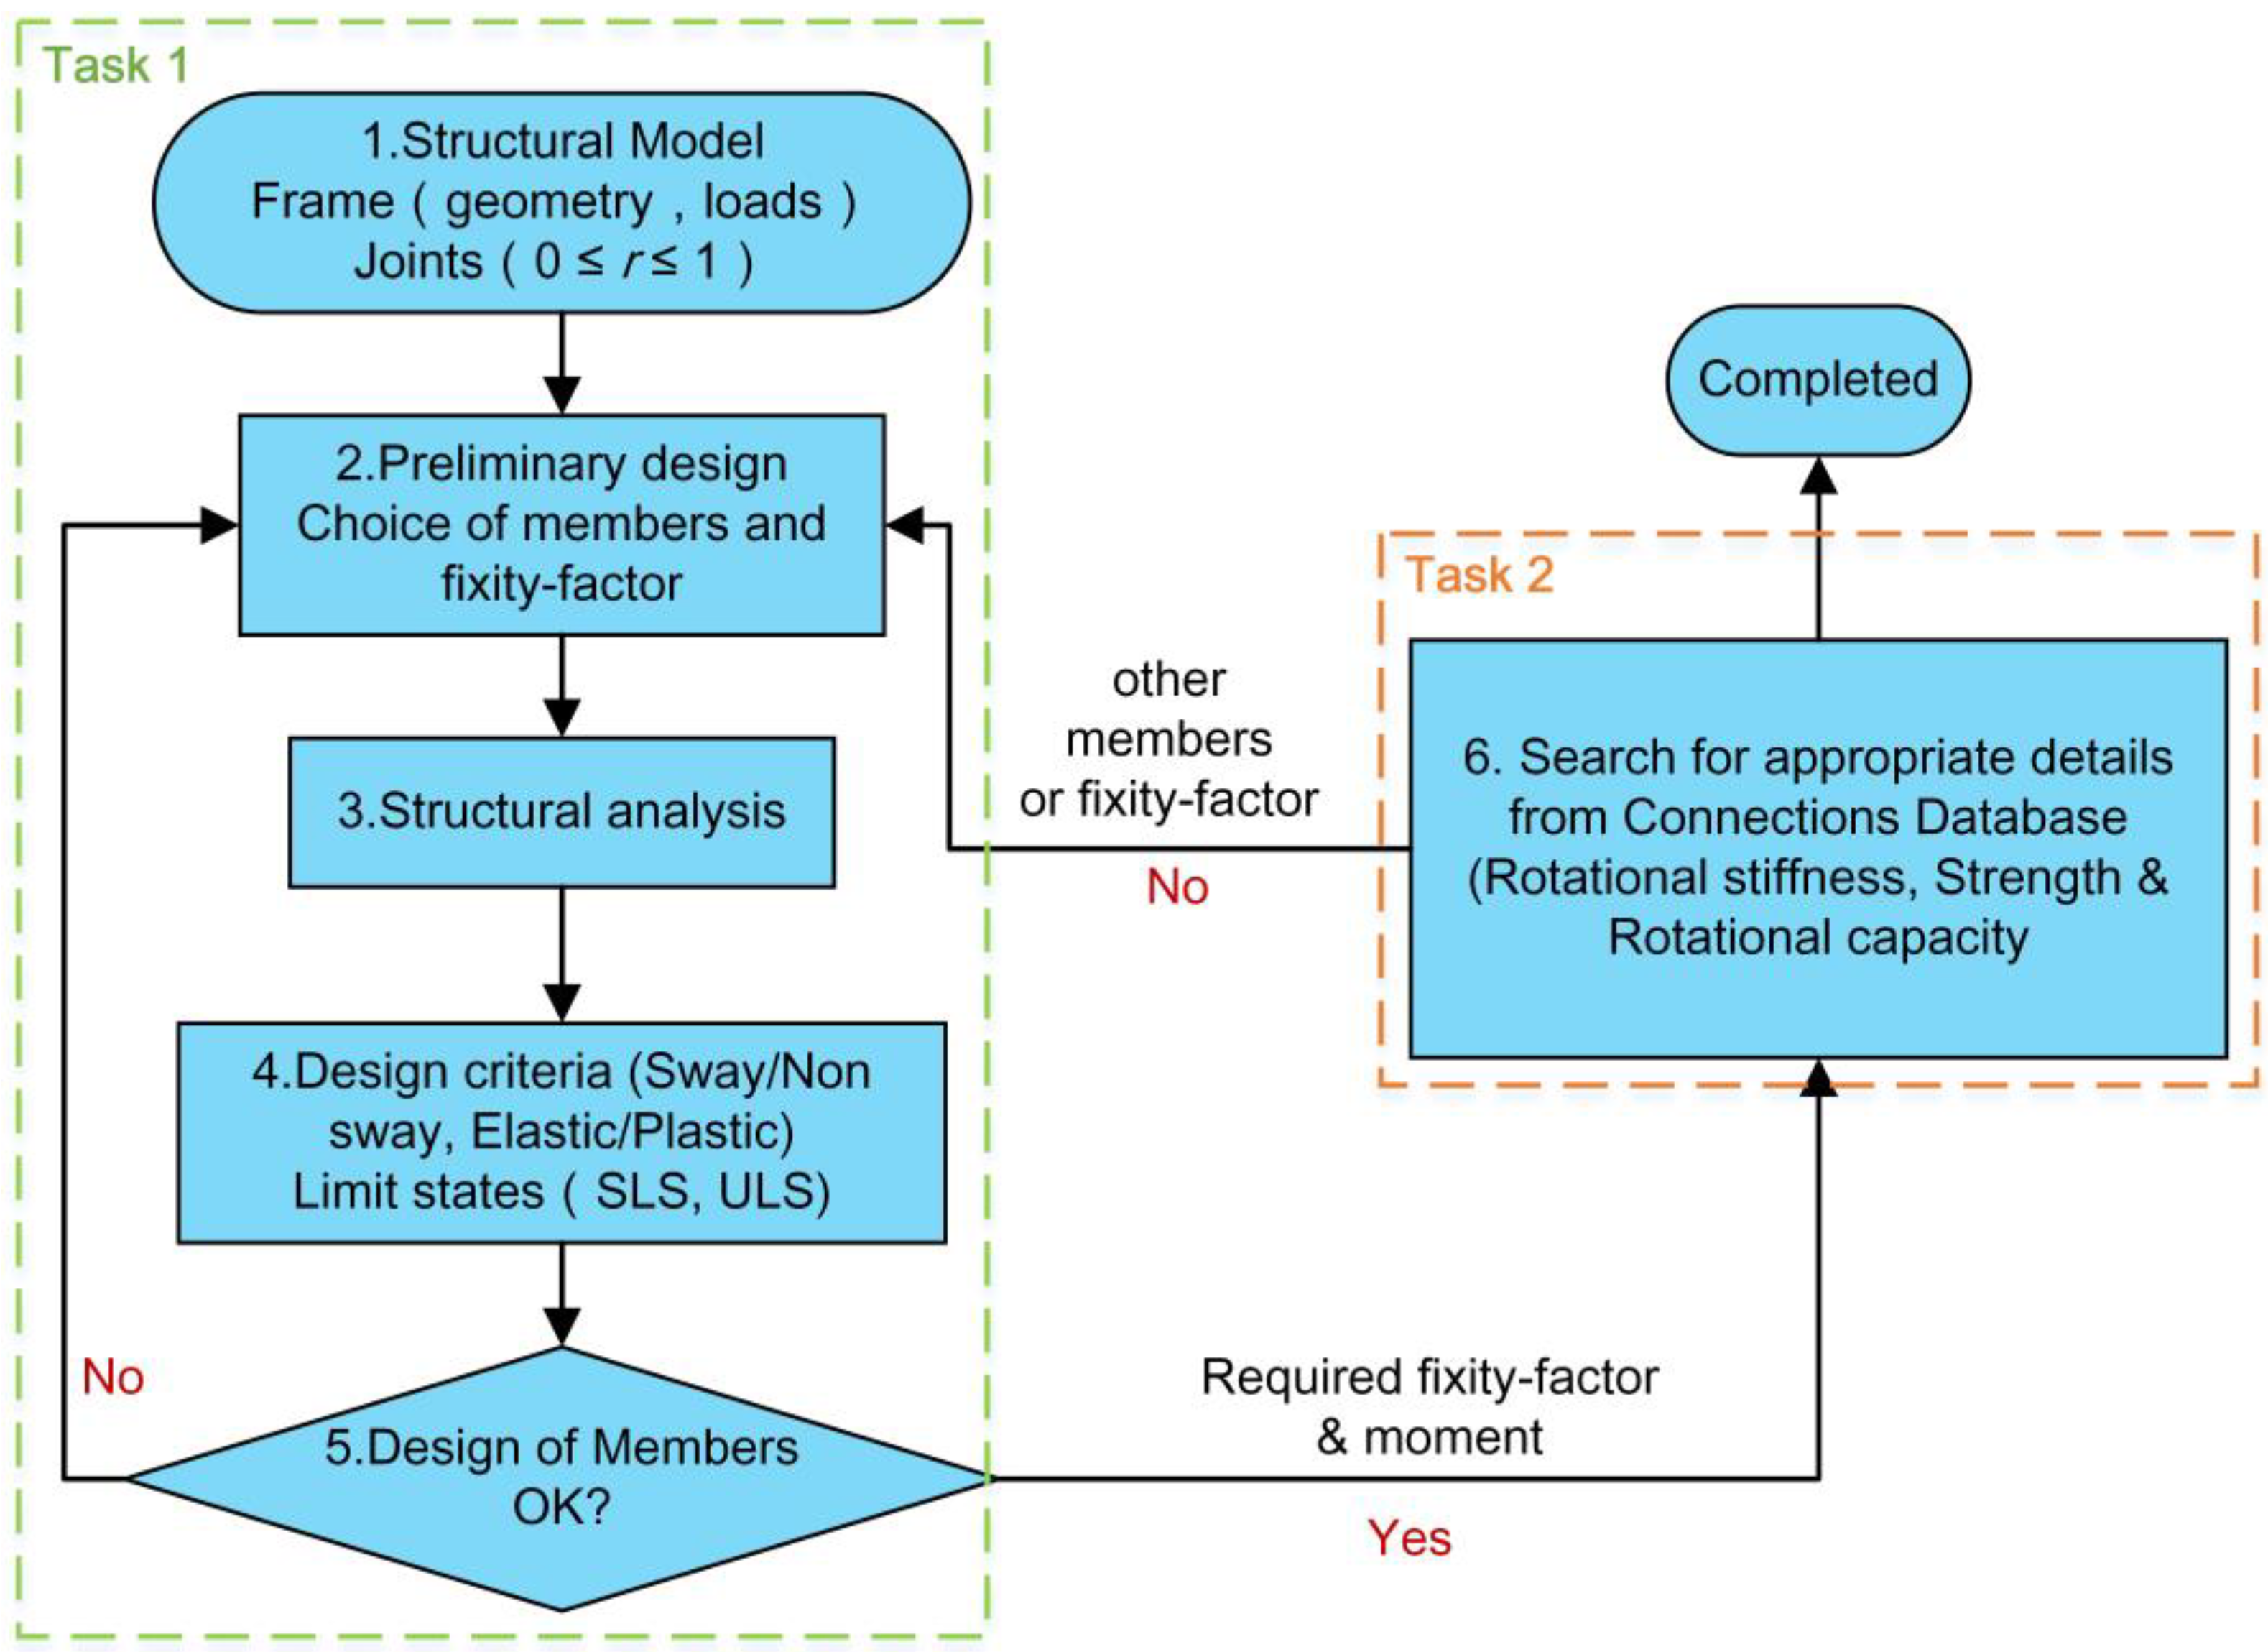
2.2. Philosophy and Methodology
3. Criteria for Constructing a Performance-Based Connection Database
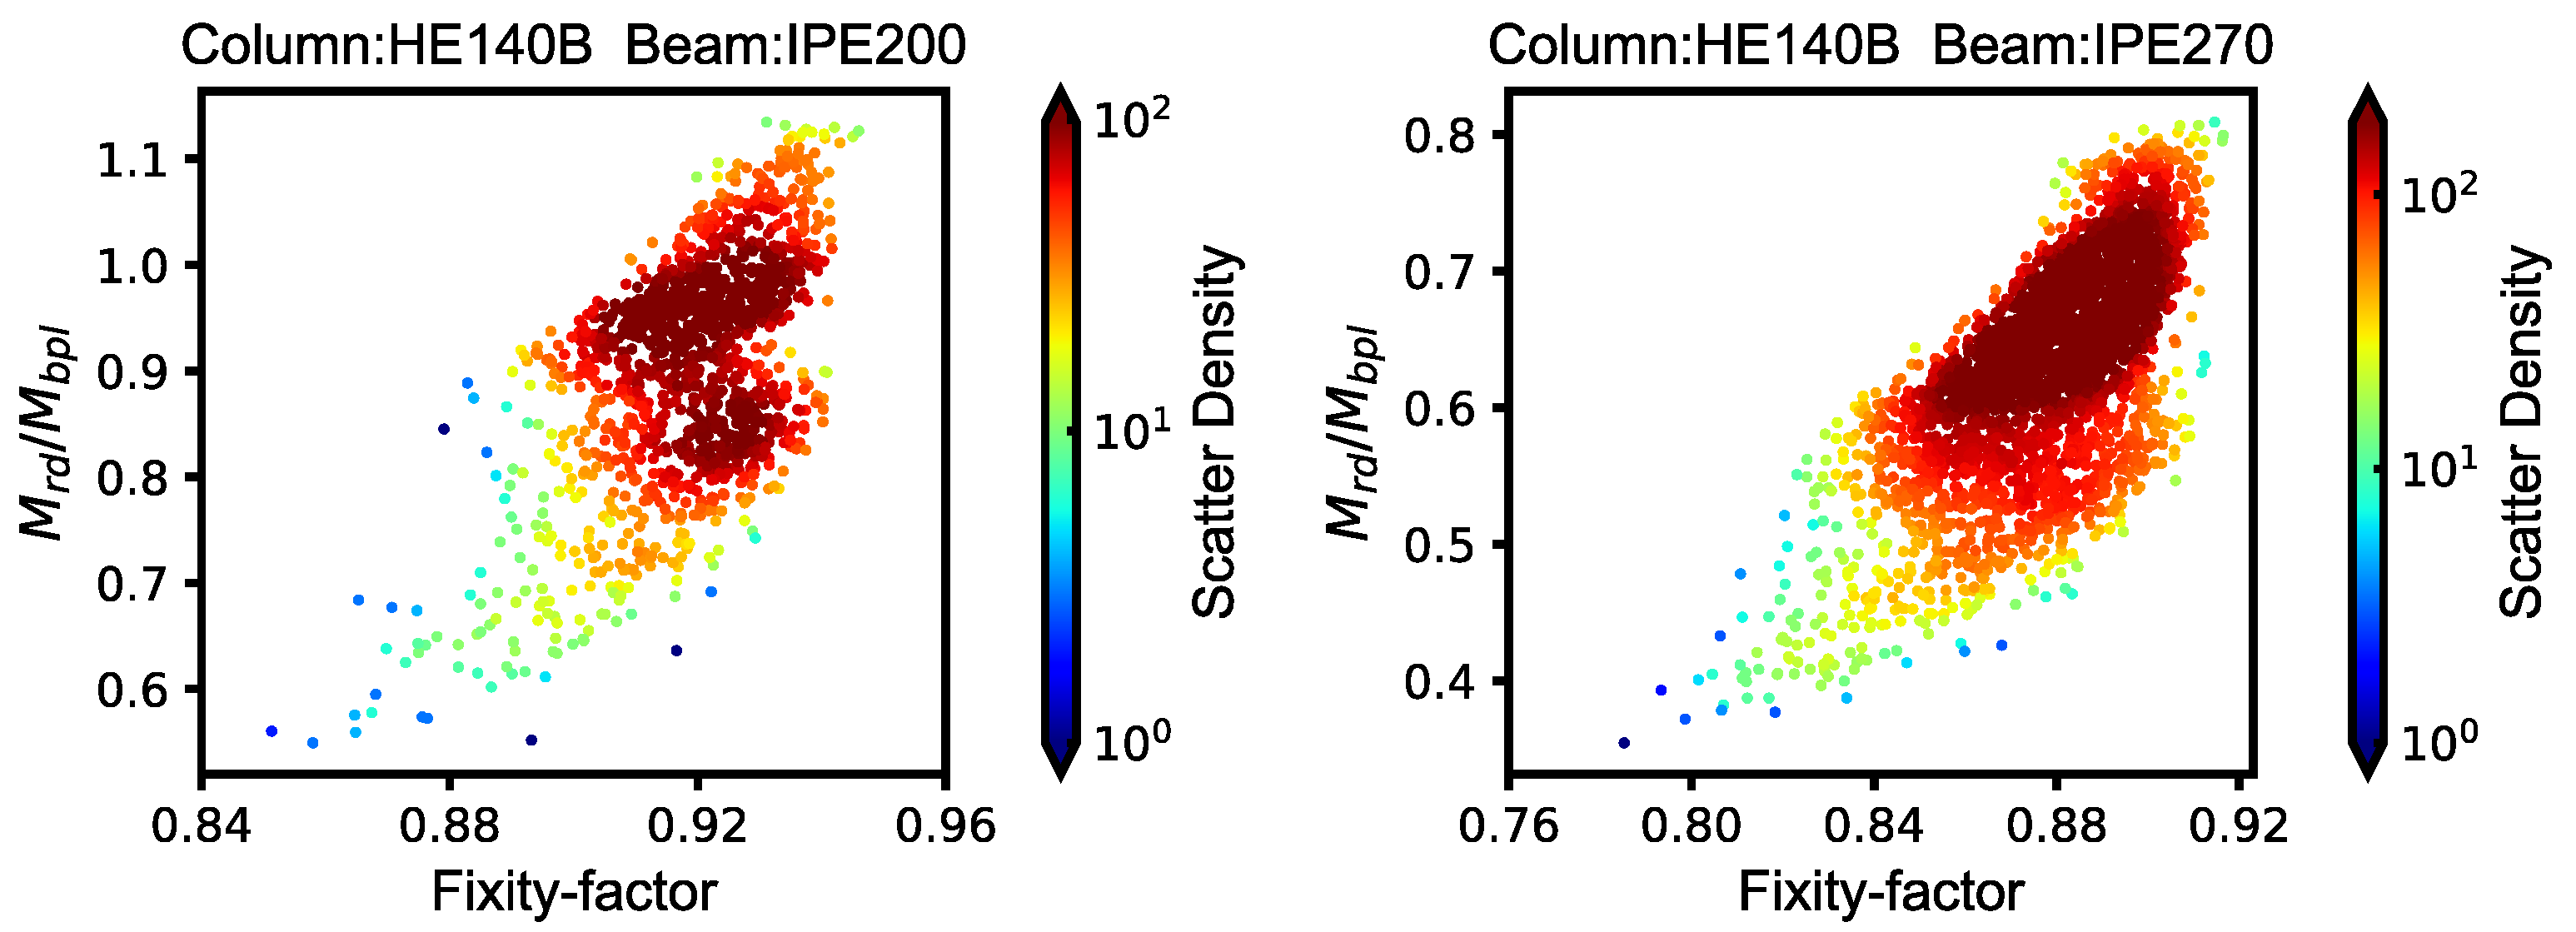
3.1. Performance-Levels for Fixity-Factor
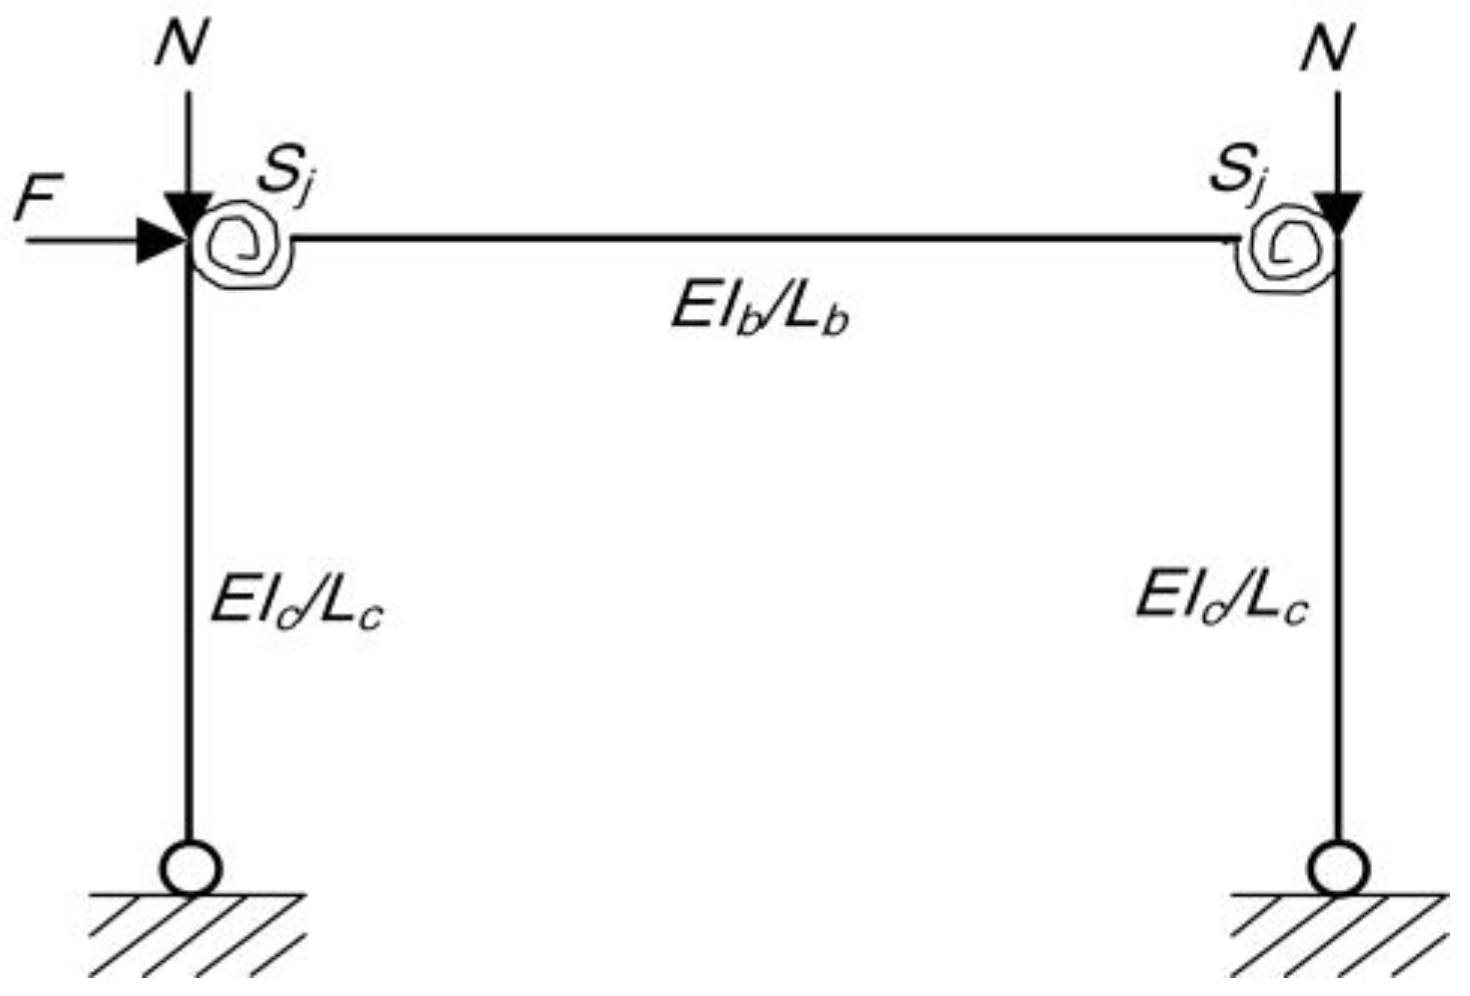
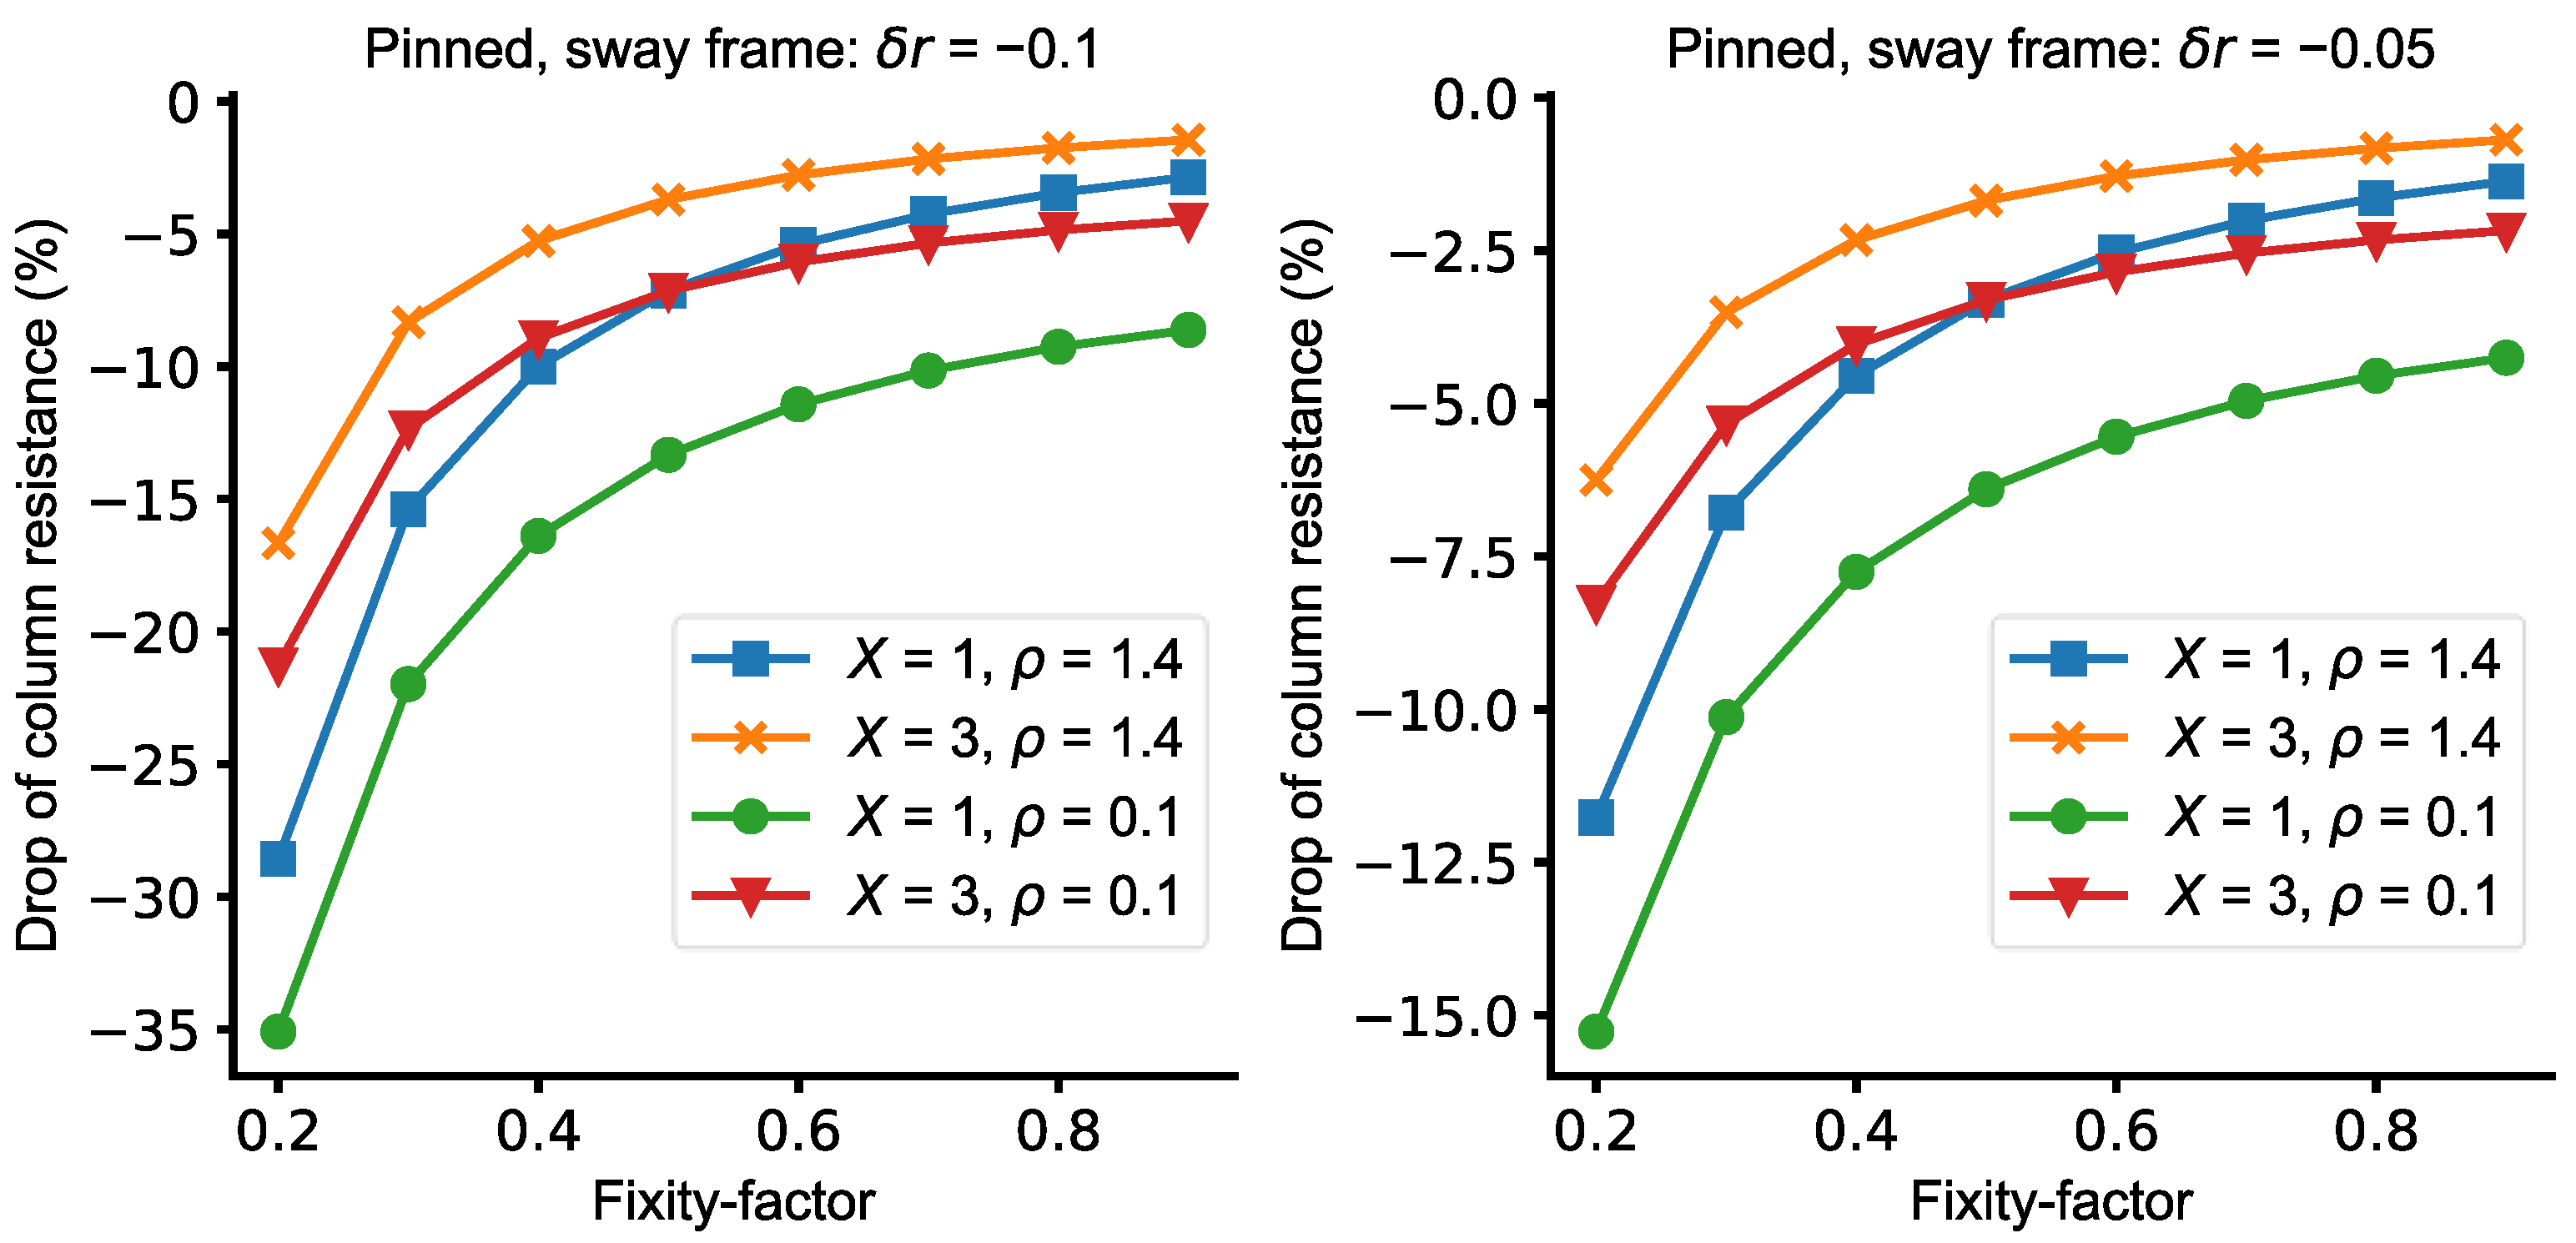
3.1.1. The Influence of Fixity-Factor Deviation on Column Bearing Capacity
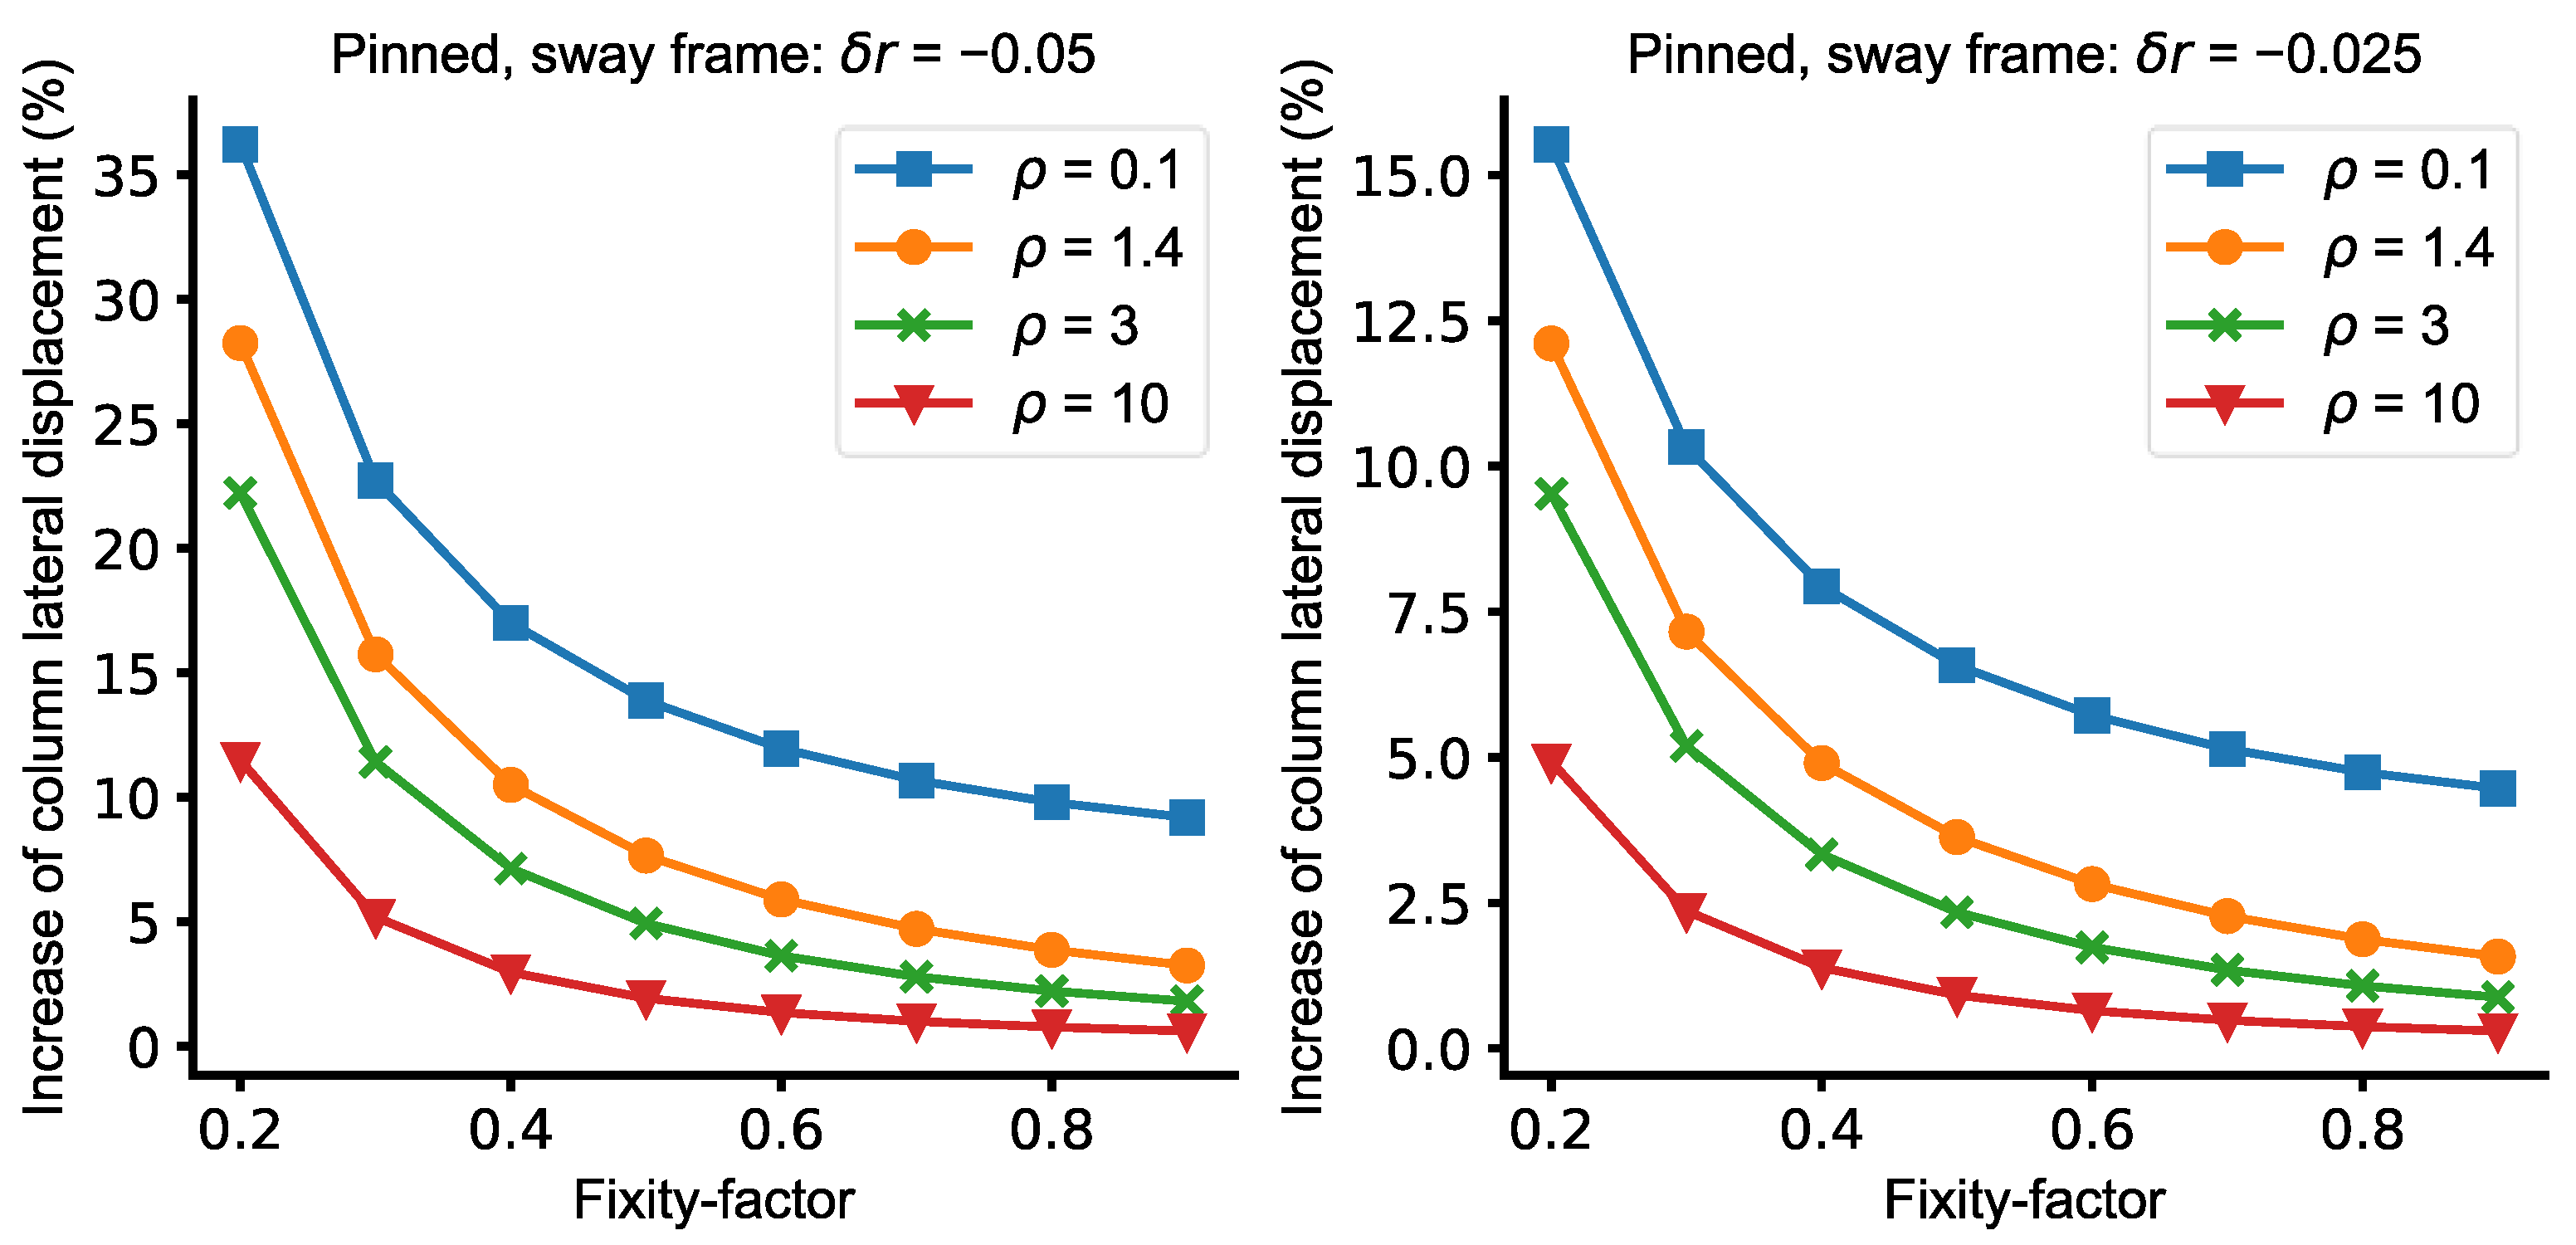
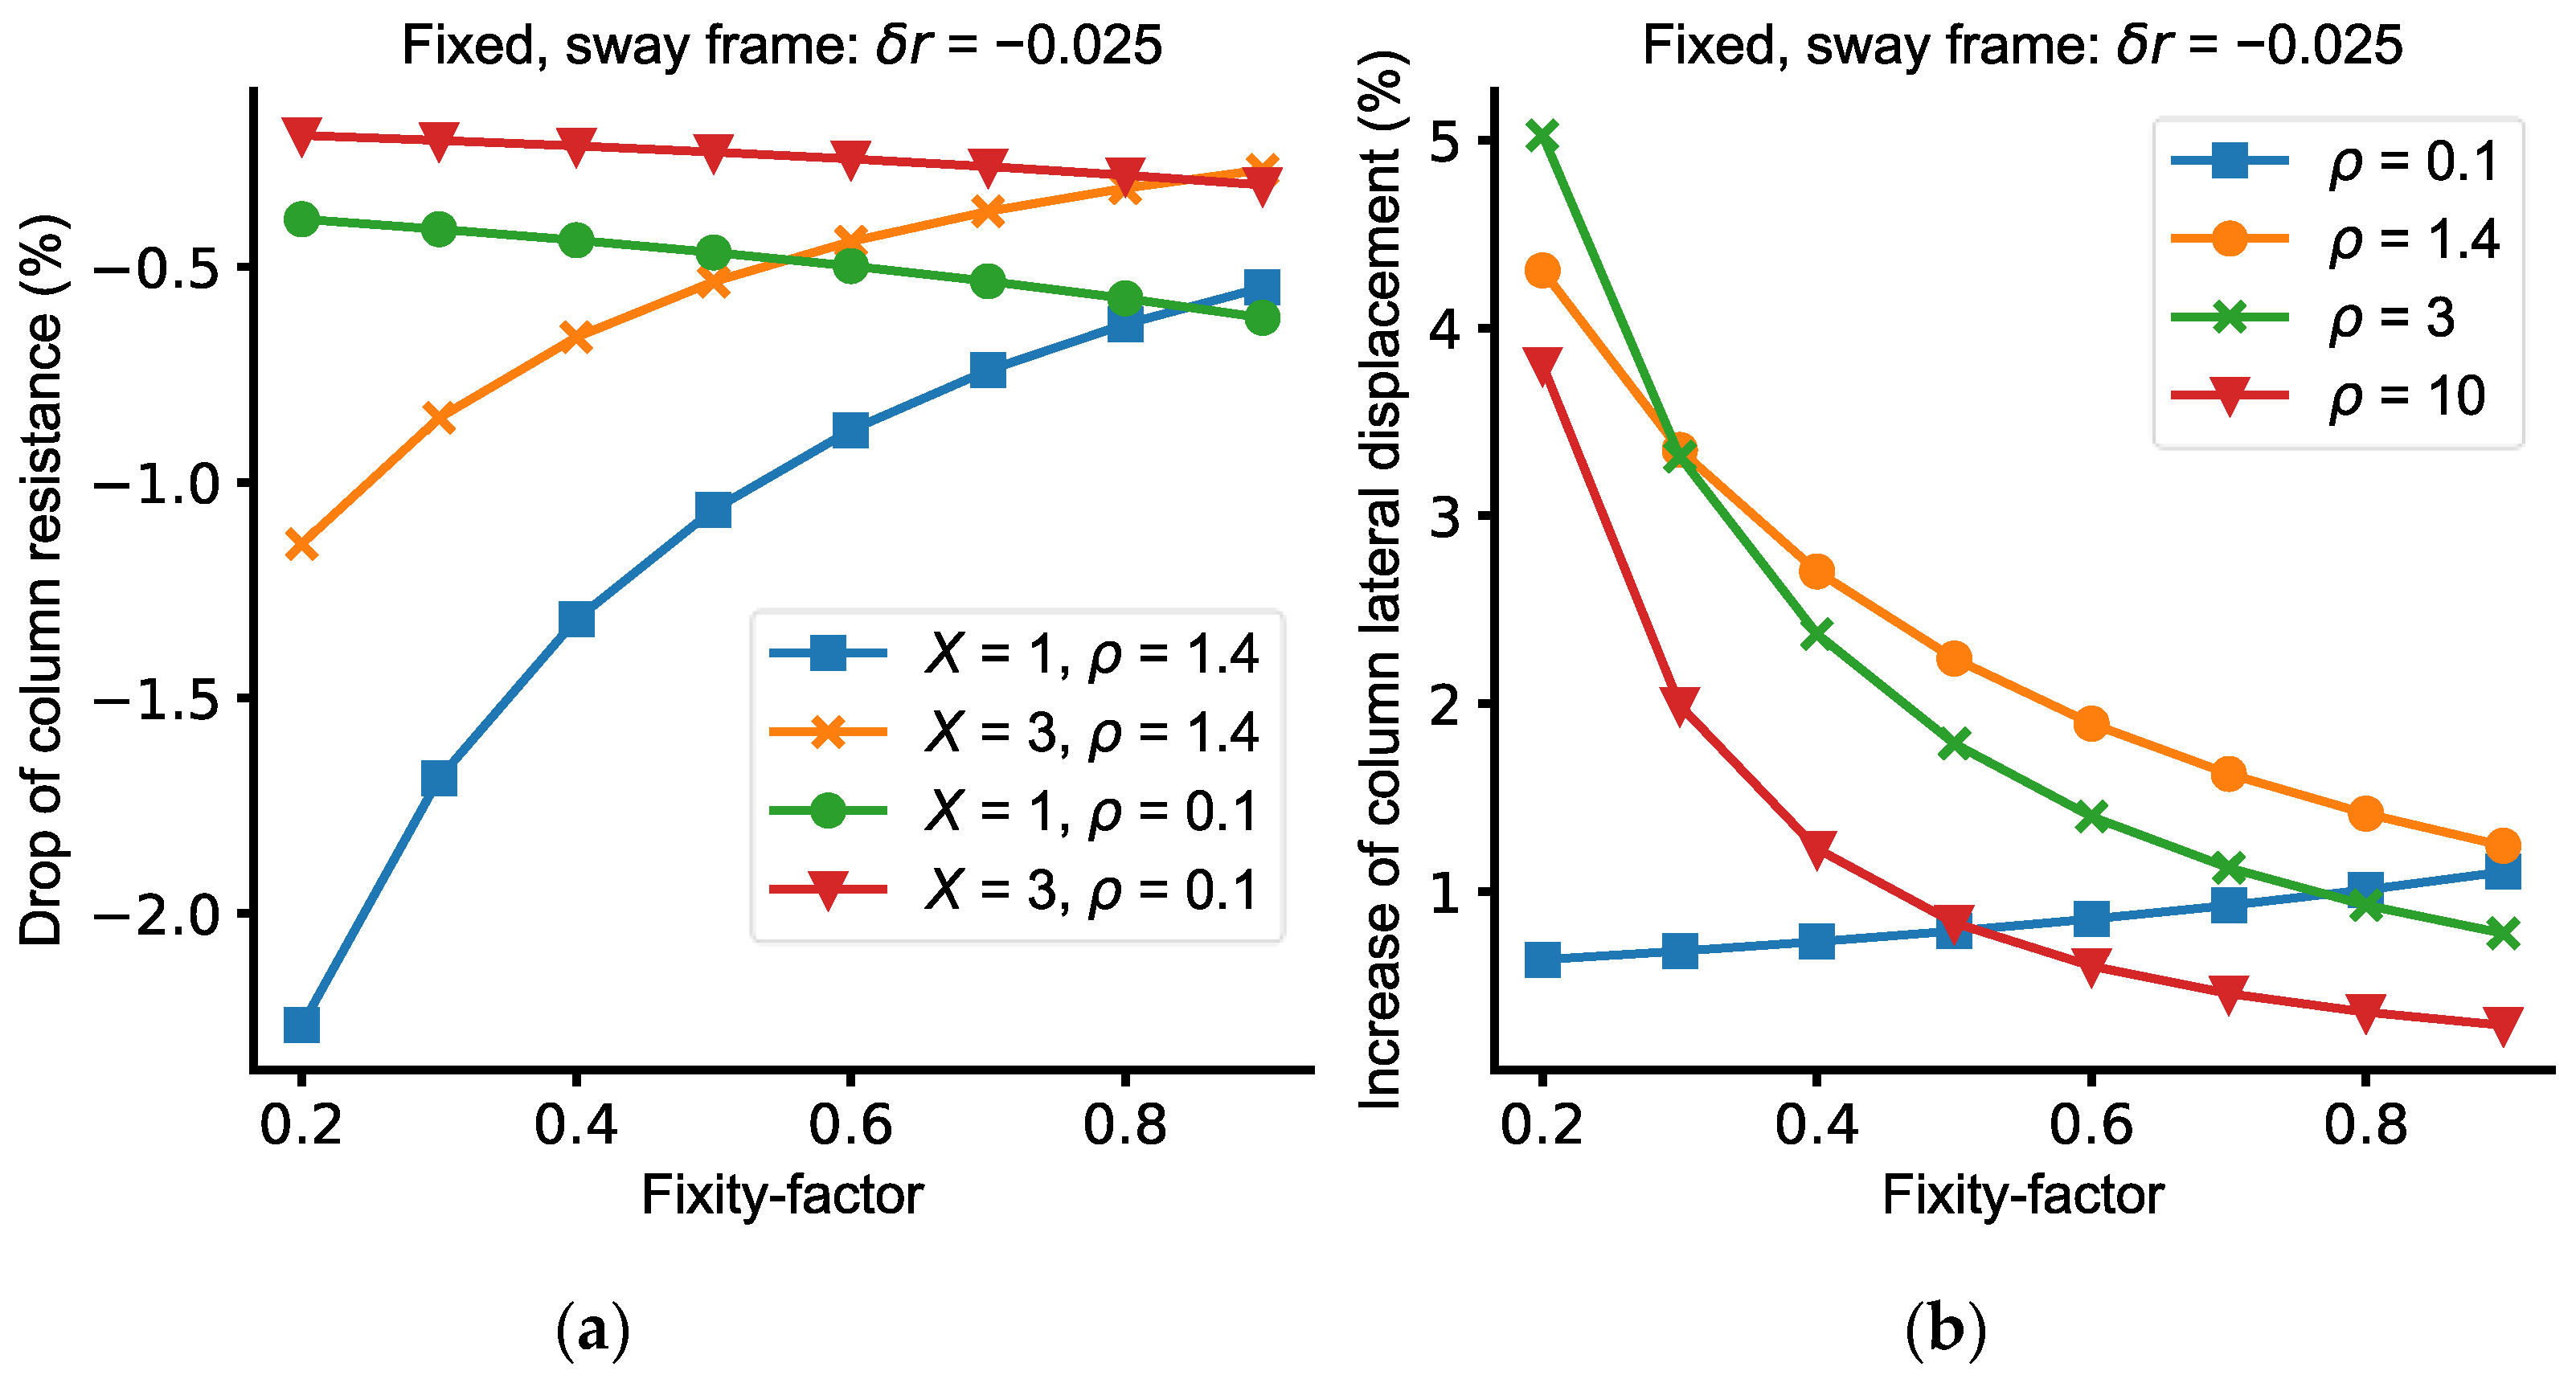
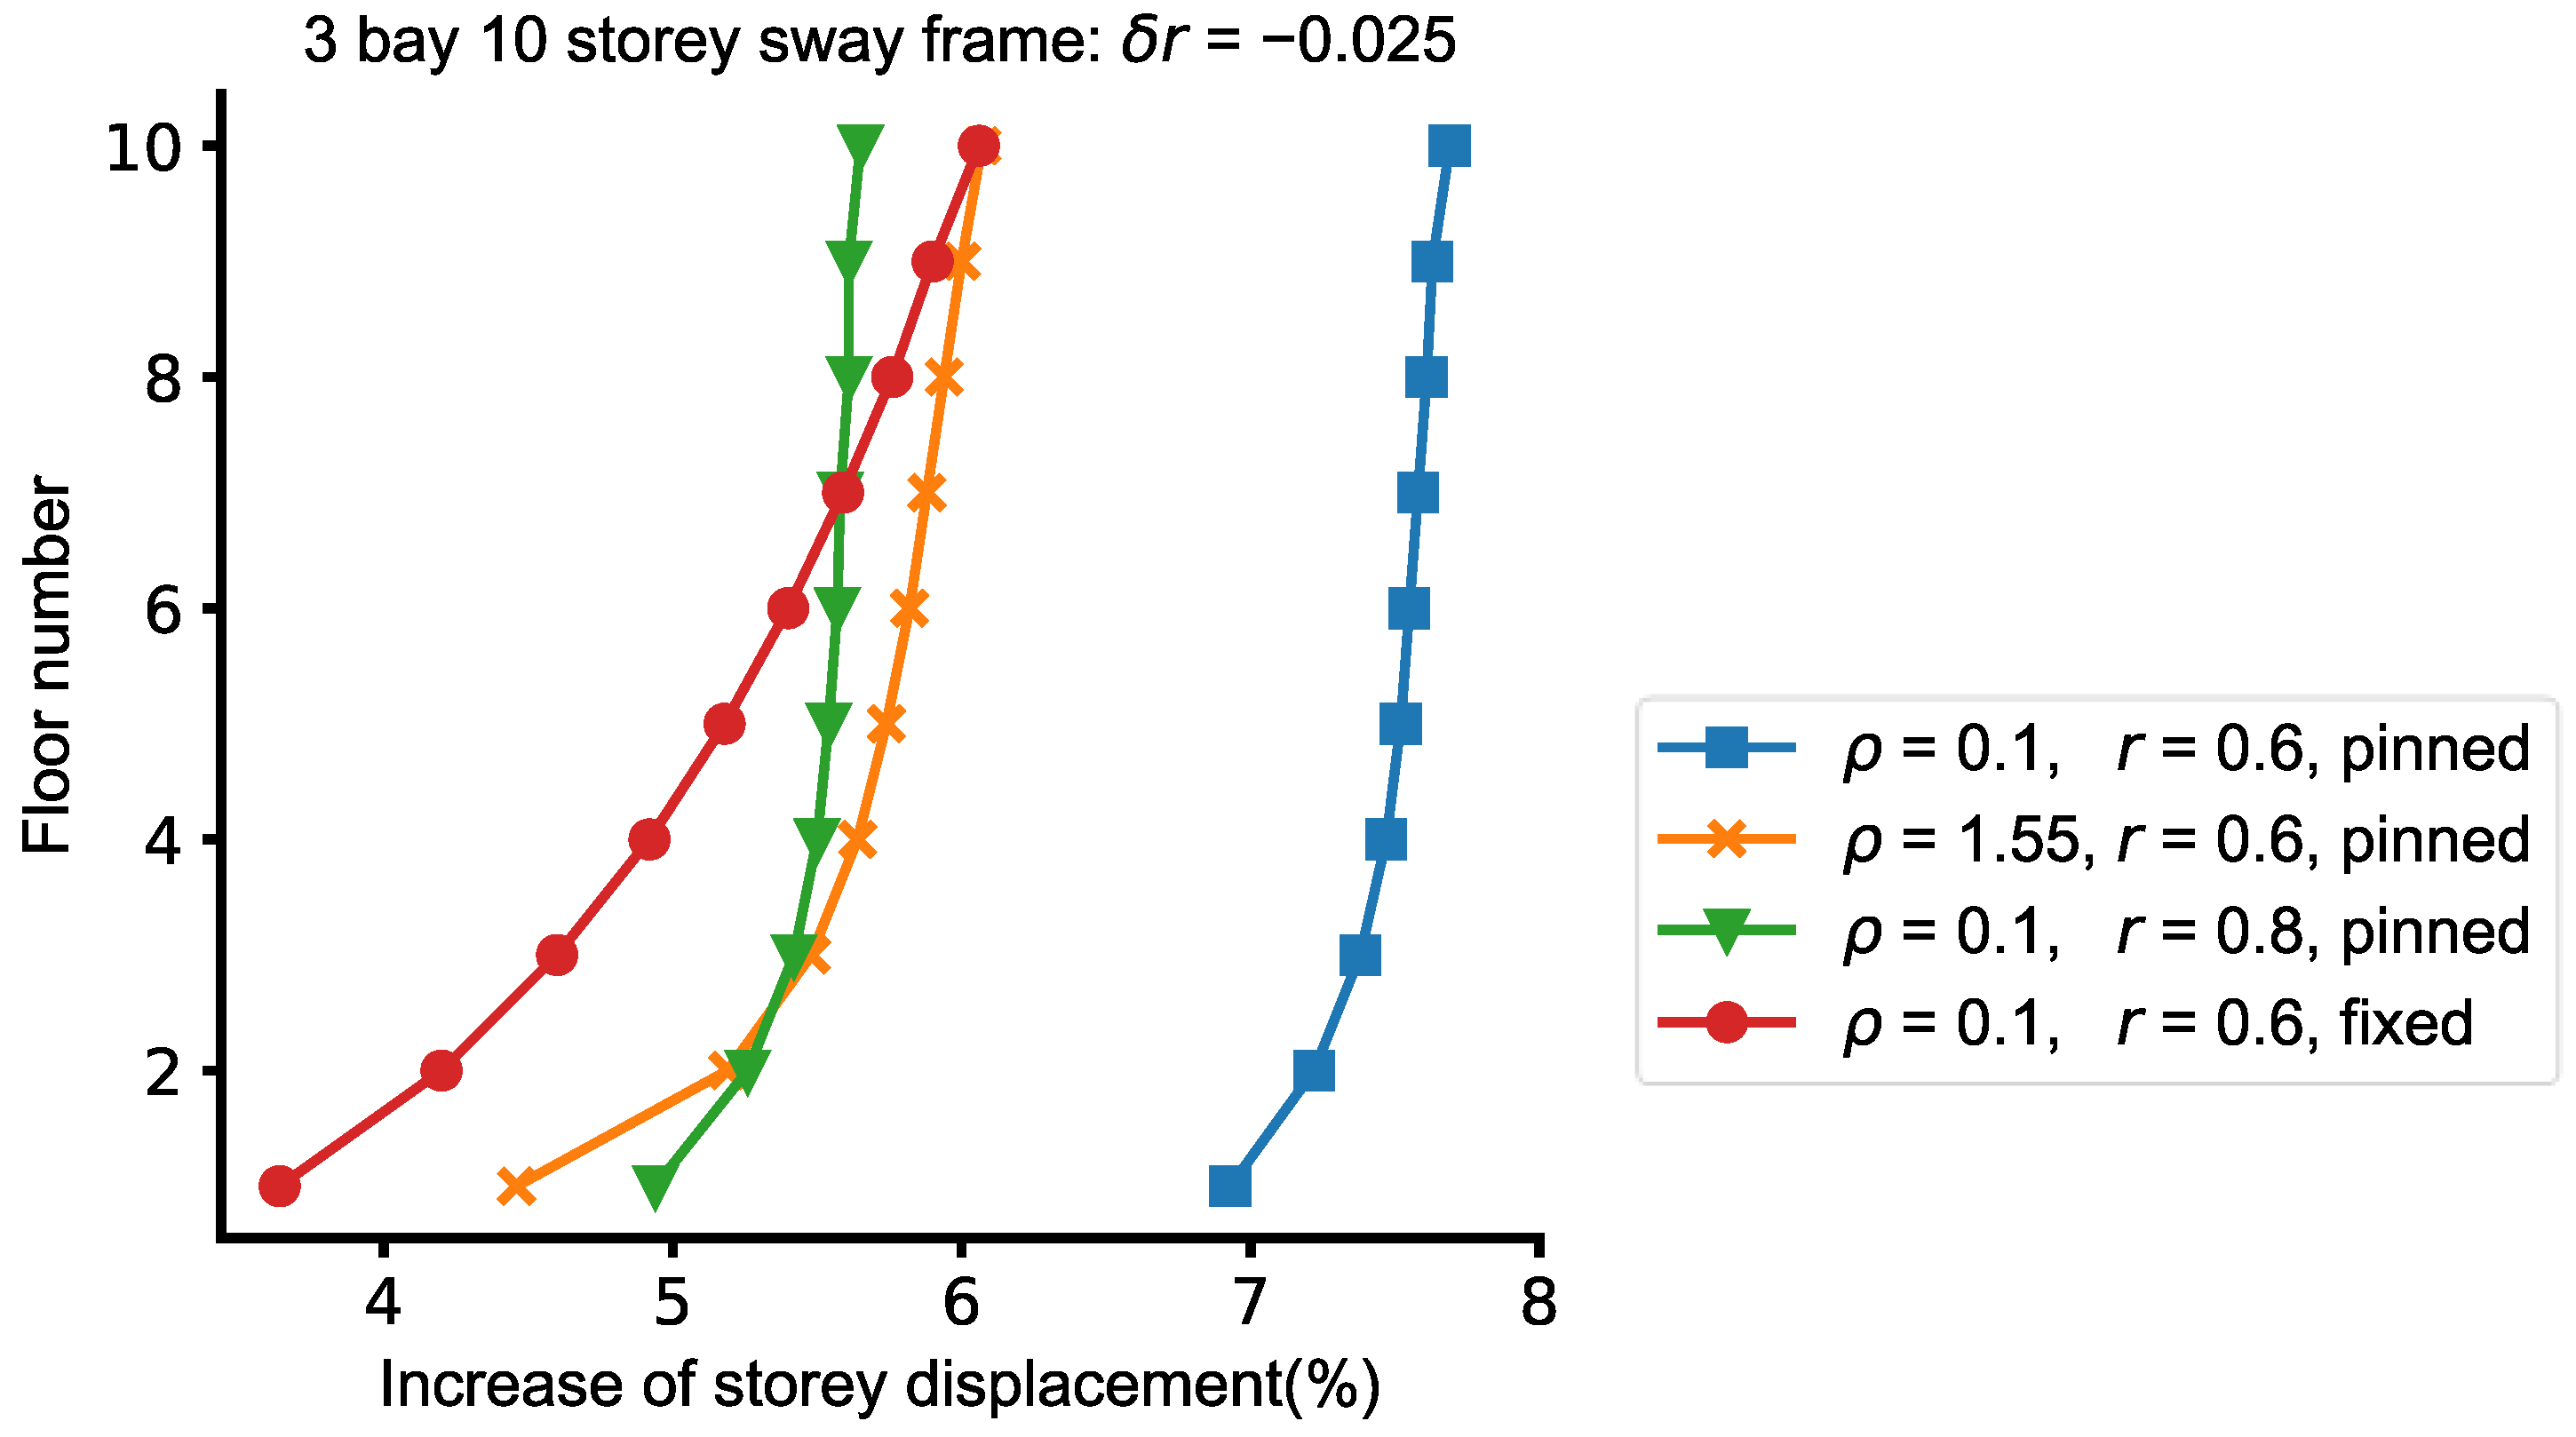
3.1.2. The Influence of Fixity-Factor Deviation on Column Lateral Displacement
3.1.3. The Influence of Bases Constraints
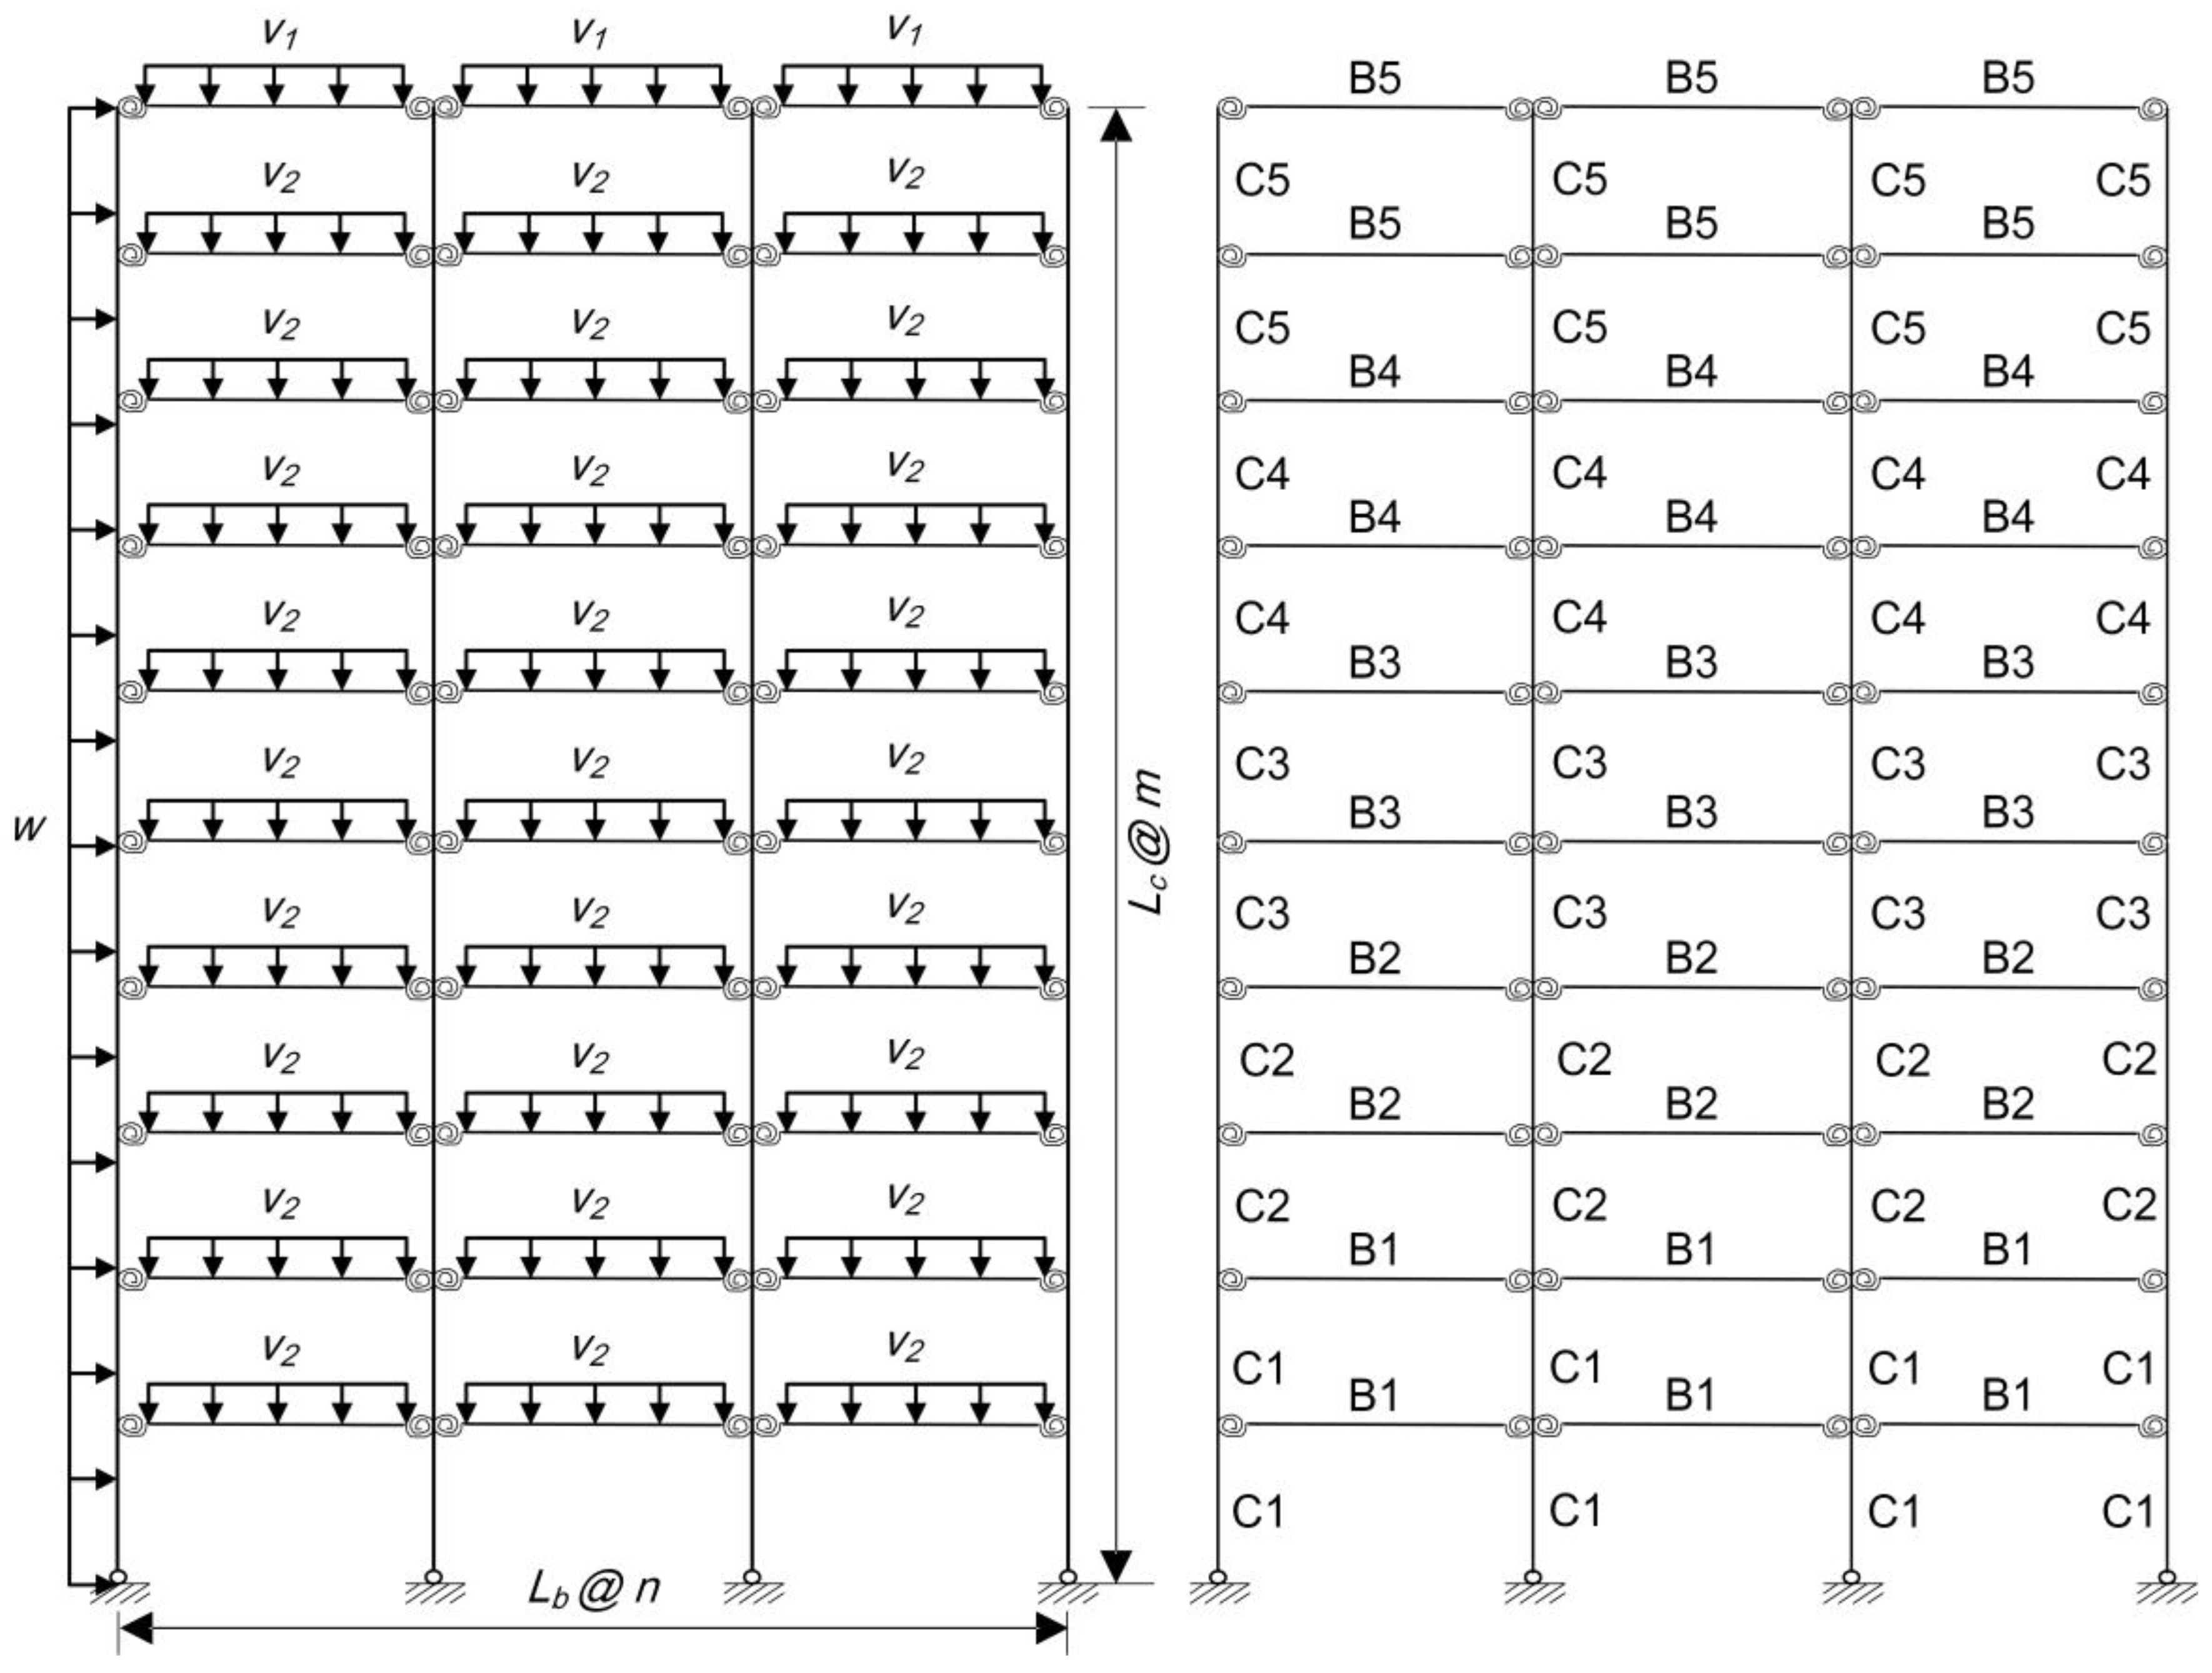
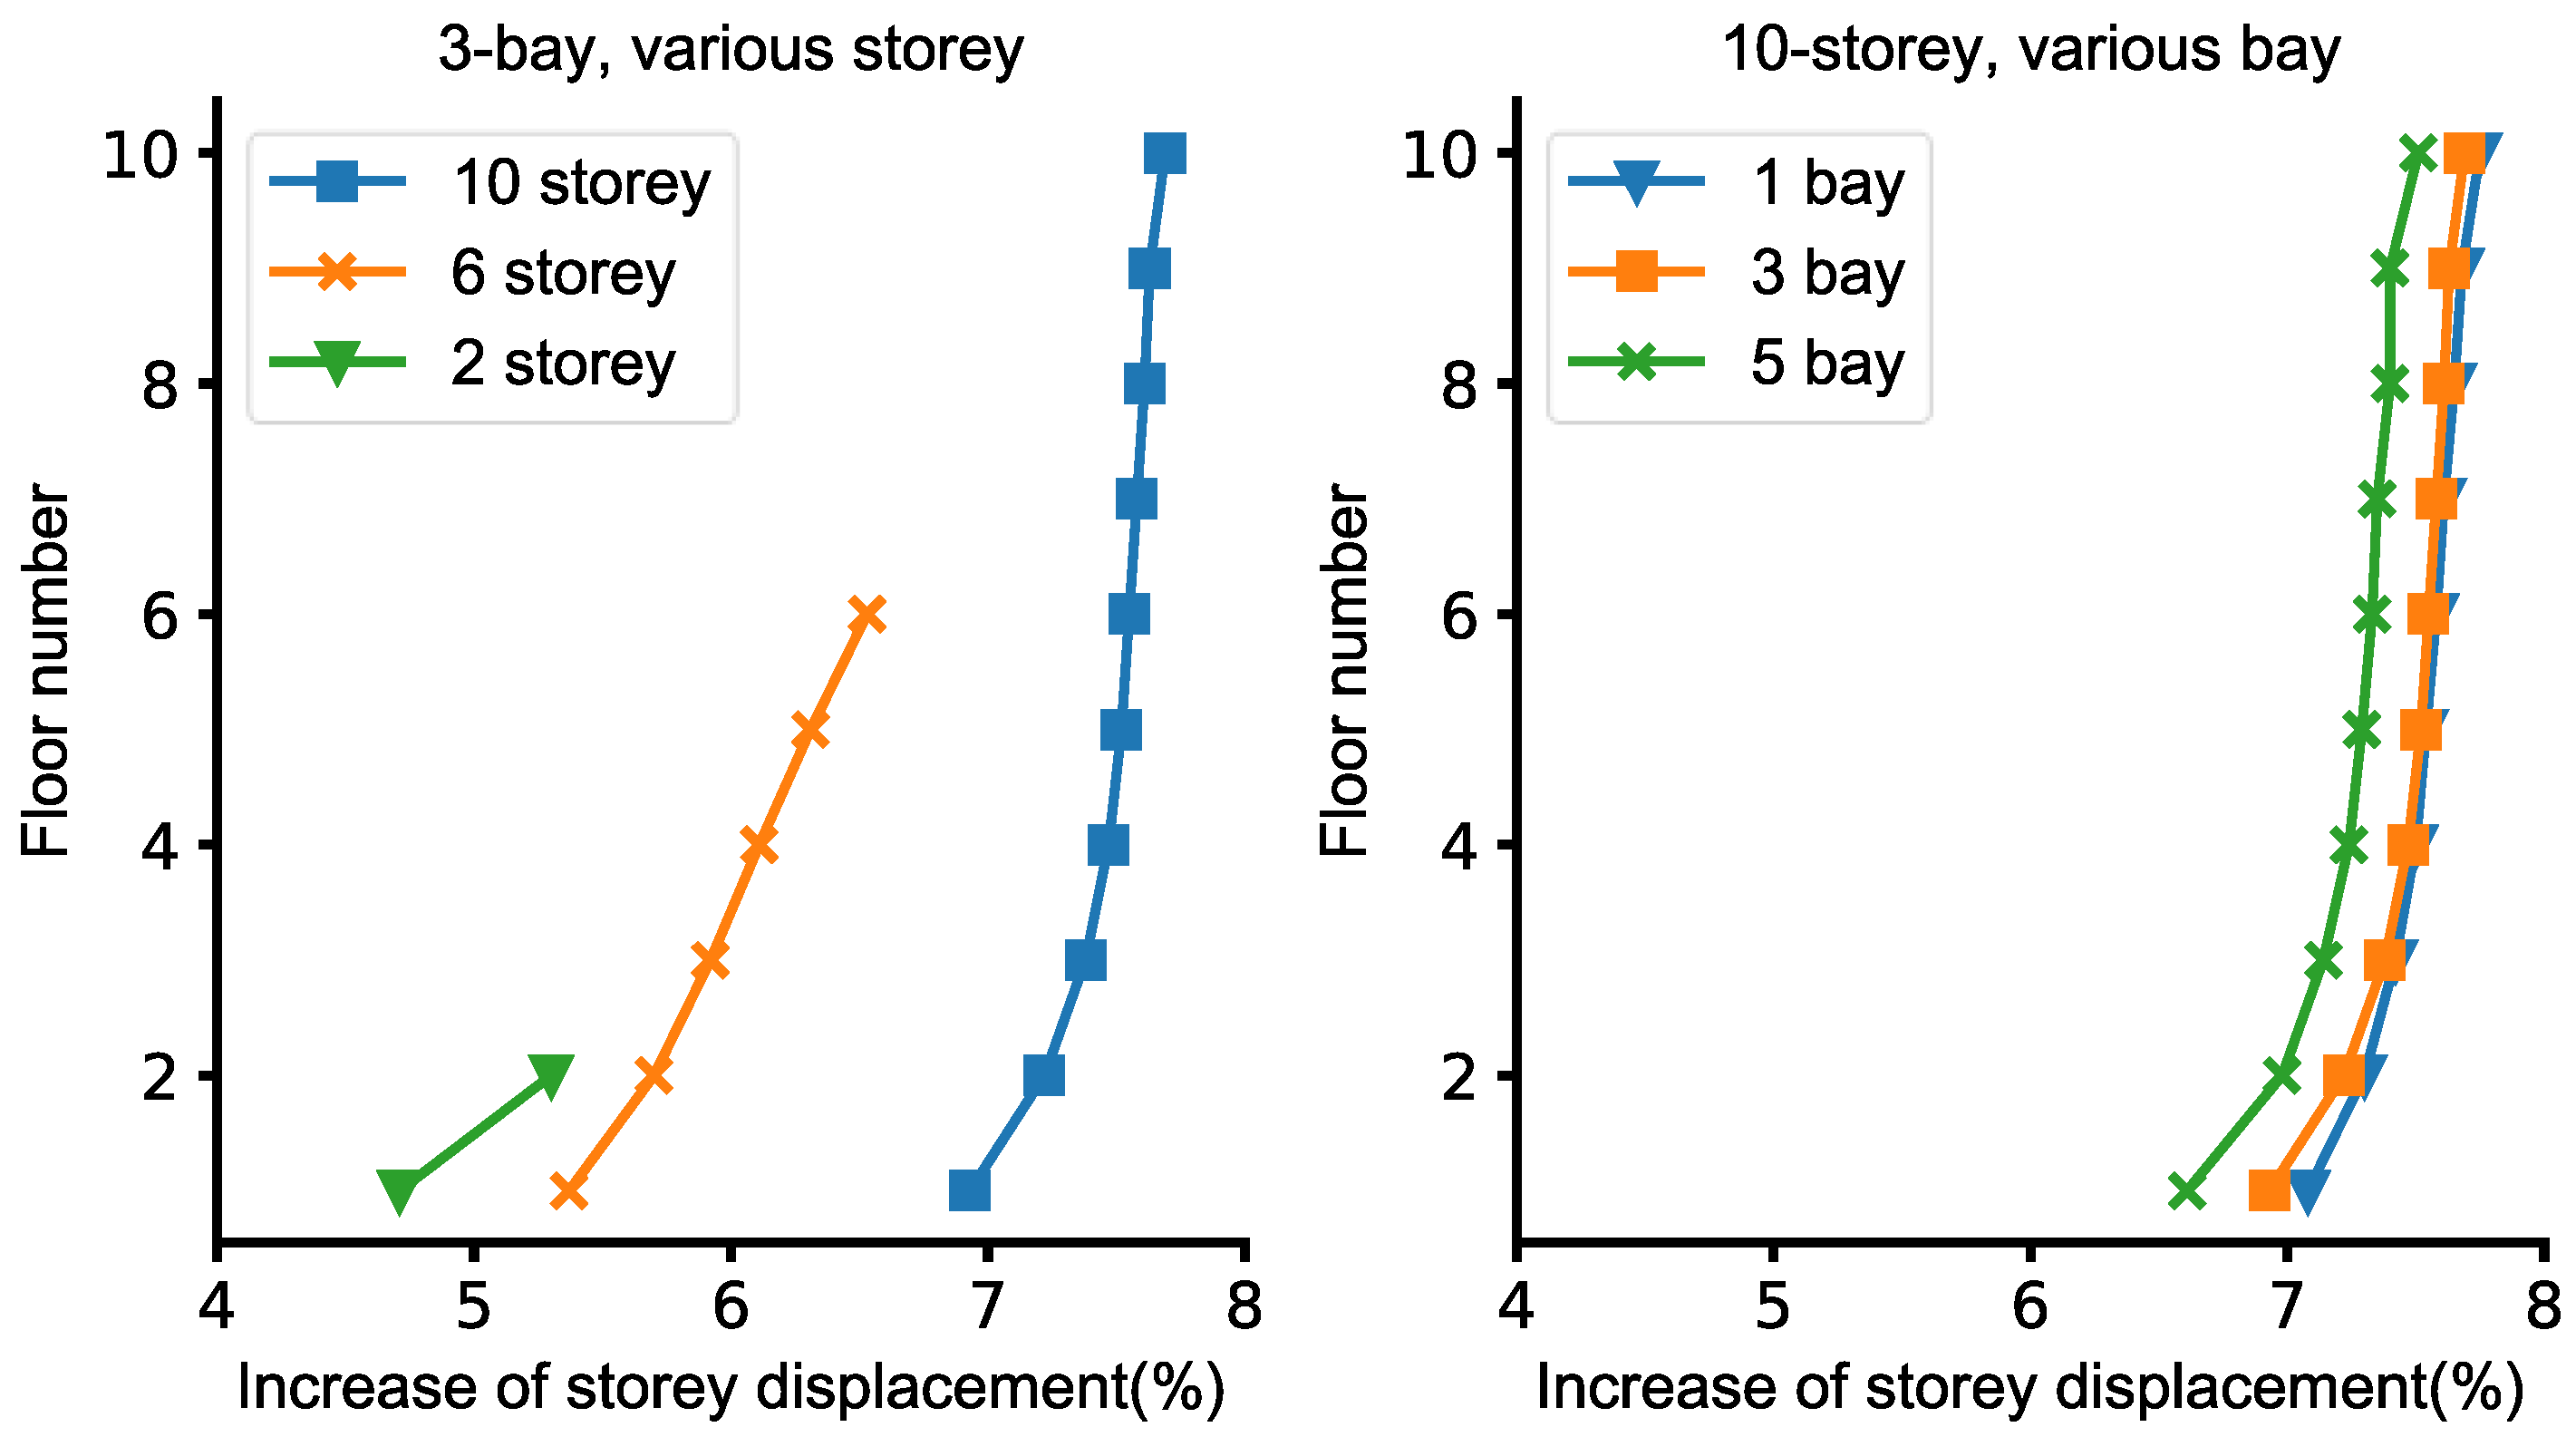
3.1.4. Applicability Verification in Multi-Story Multi-Bay Frames
3.2. Performance-Levels for Moment Capacity
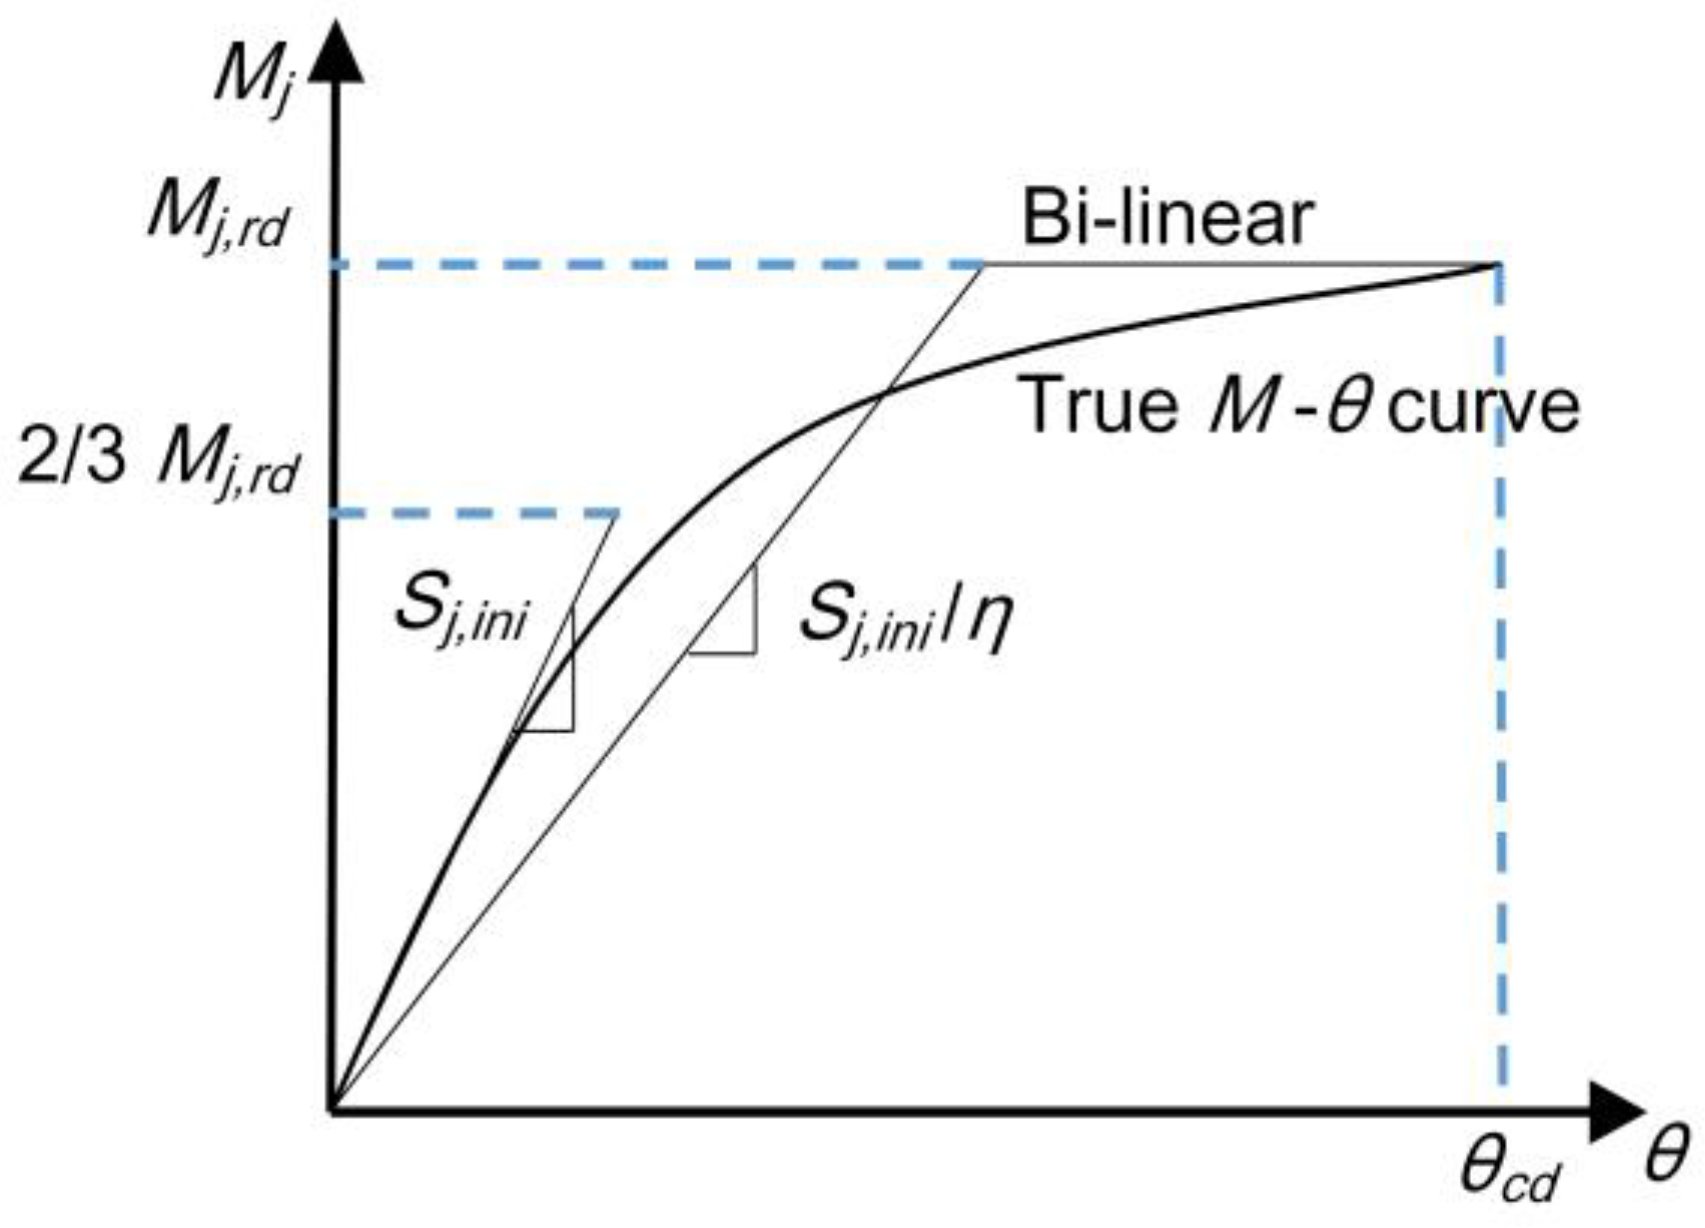
3.3. Ductility Requirement
3.4. Generation of a Connection Database
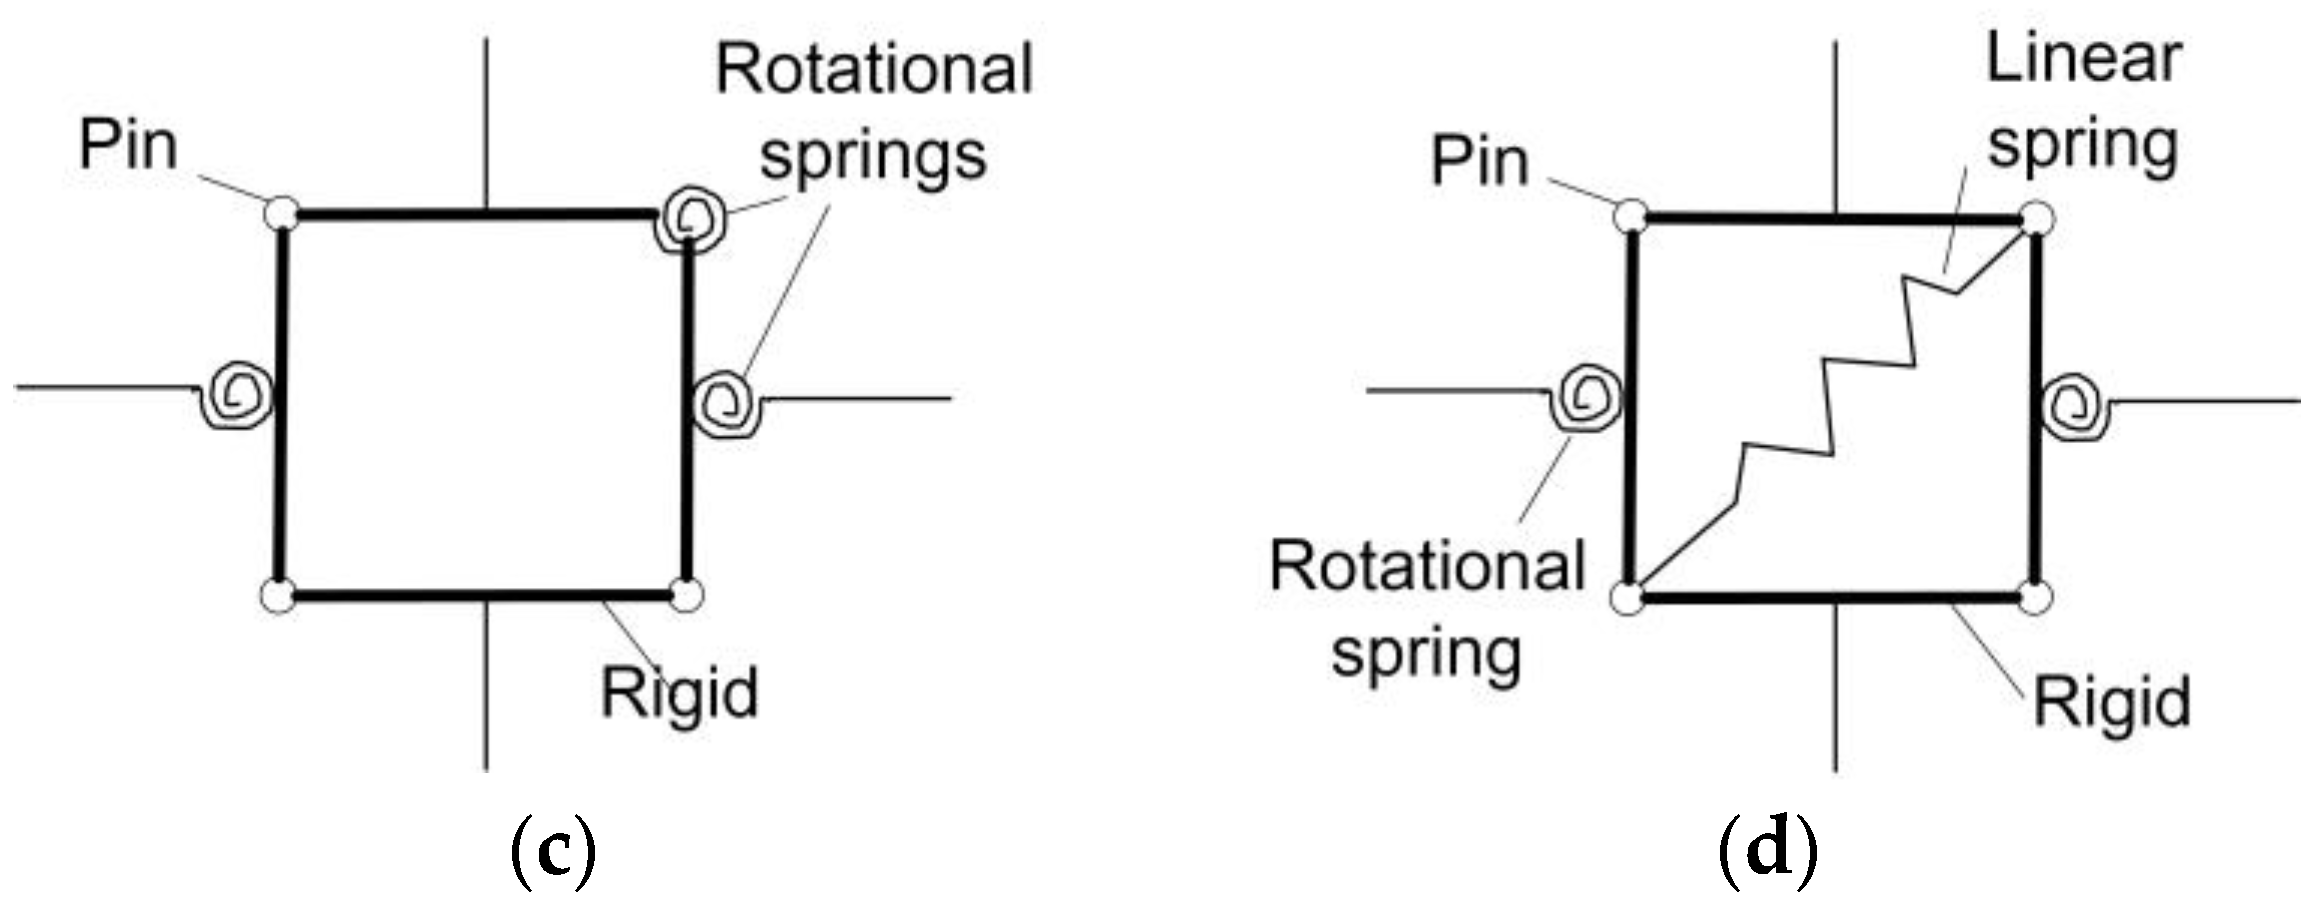
4. Joint Modelling
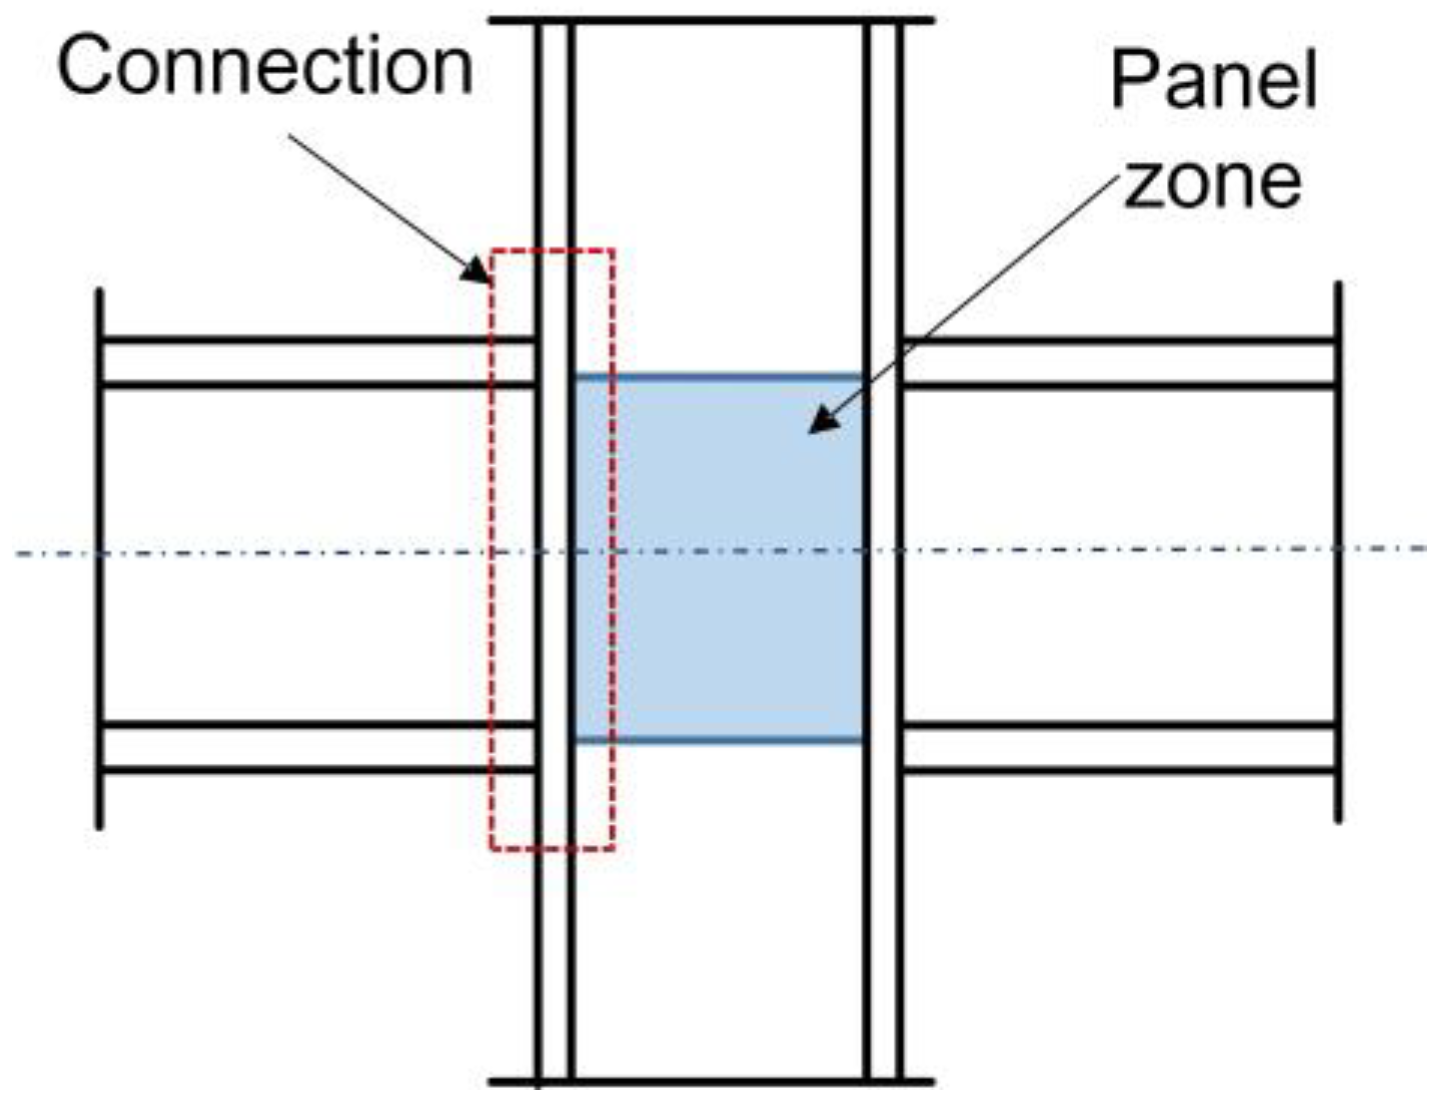
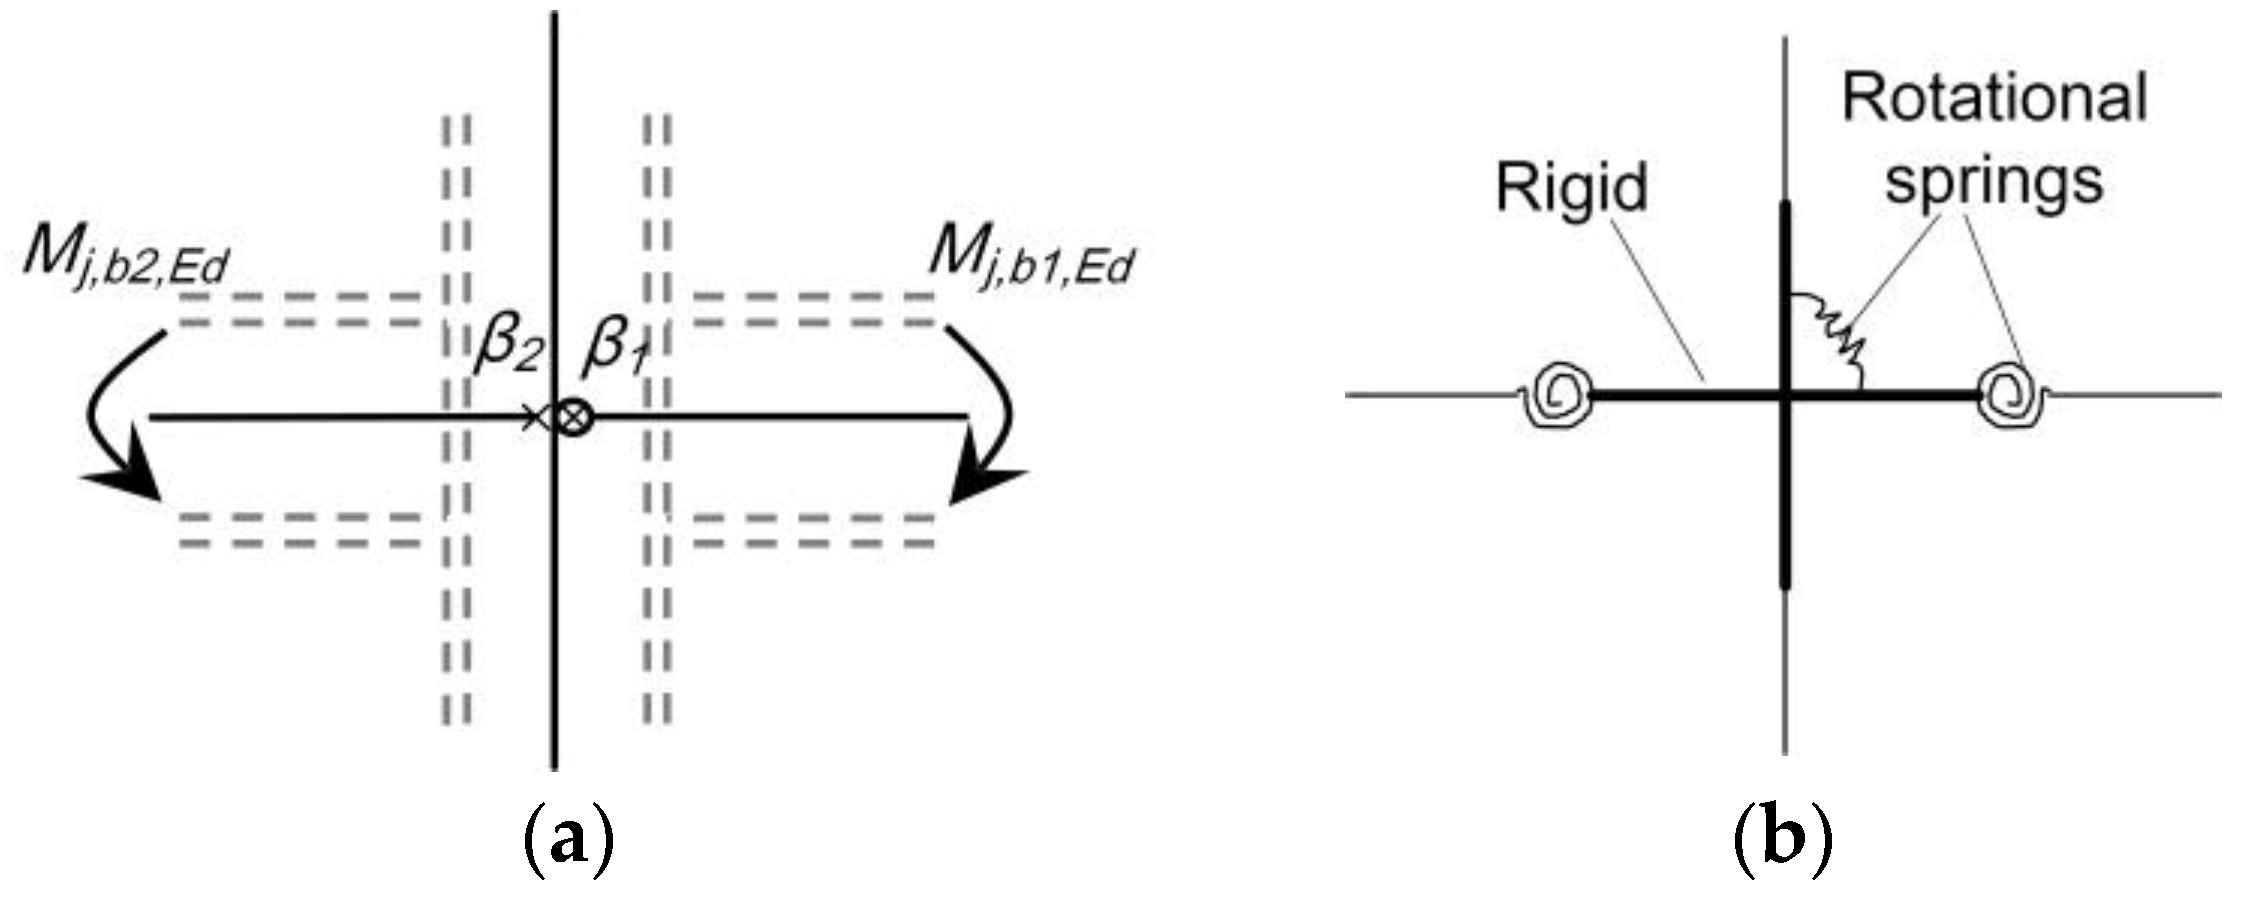
4.1. Interaction of Web Panel
4.2. Constitutive Relationship of Rotational Spring
5. Strategies for Preliminary Design
5.1. Pre-Sizing for Members
5.2. Initial Selection for Fixity-Factor
6. Examples
- Pre-establishment of the connection database
- Step 1: Determine the set of member sections for which the connection database would be generated.
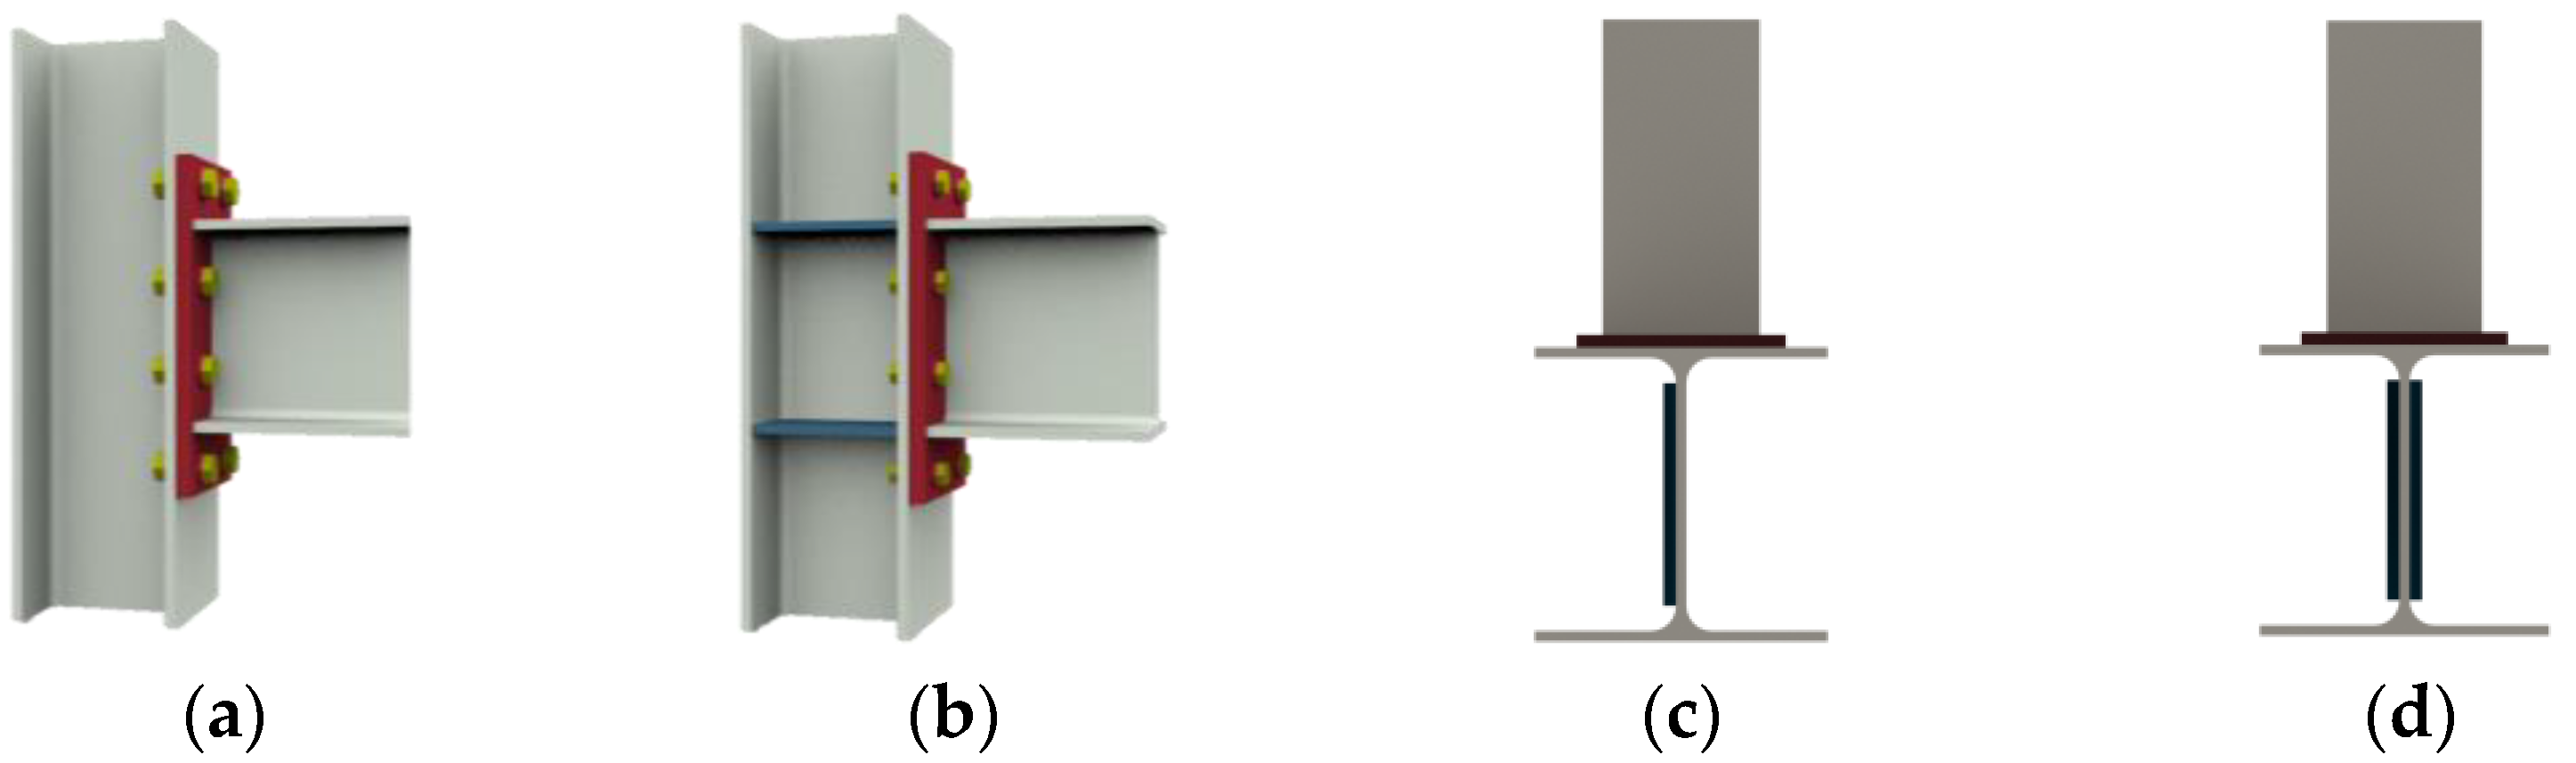
- Step 2: Select the type of connection (i.e., extended end-plate connection) and reinforcement form of a web panel (i.e., continuity plates).
- Step 3: Select a specific section for beam and column, steel grade, and assume the length of the beam.
- Step 4: Generate the performance matrix for fixity-factor and moment capacity coefficient referring to the discrete levels in Figure 12, and infill each grid with available connections.
- Step 5: Go back to Step 3 until all sections are iterated.
- Design of the semi-rigid steel frame
- Step 1: Select a preliminary profile for each member, set the initial value of the fixity-factor according to Section 5.2, then carry out the structural analysis and complete the checking of the rest of the parts except the joints, such as the strength and stability of the members, deformations, etc.
- Step 2: Extract the end moment of each beam, then query the available connections in the database according to the required moment and fixity-factor. If available, the strength check of web panels can also be made.
- Step 3: Check whether all results meet the requirements of the specifications; if not, return to Step 1. Adjust the sections or fixity-factors and re-analyze.
6.1. A Database for Extended End-Plate Connection
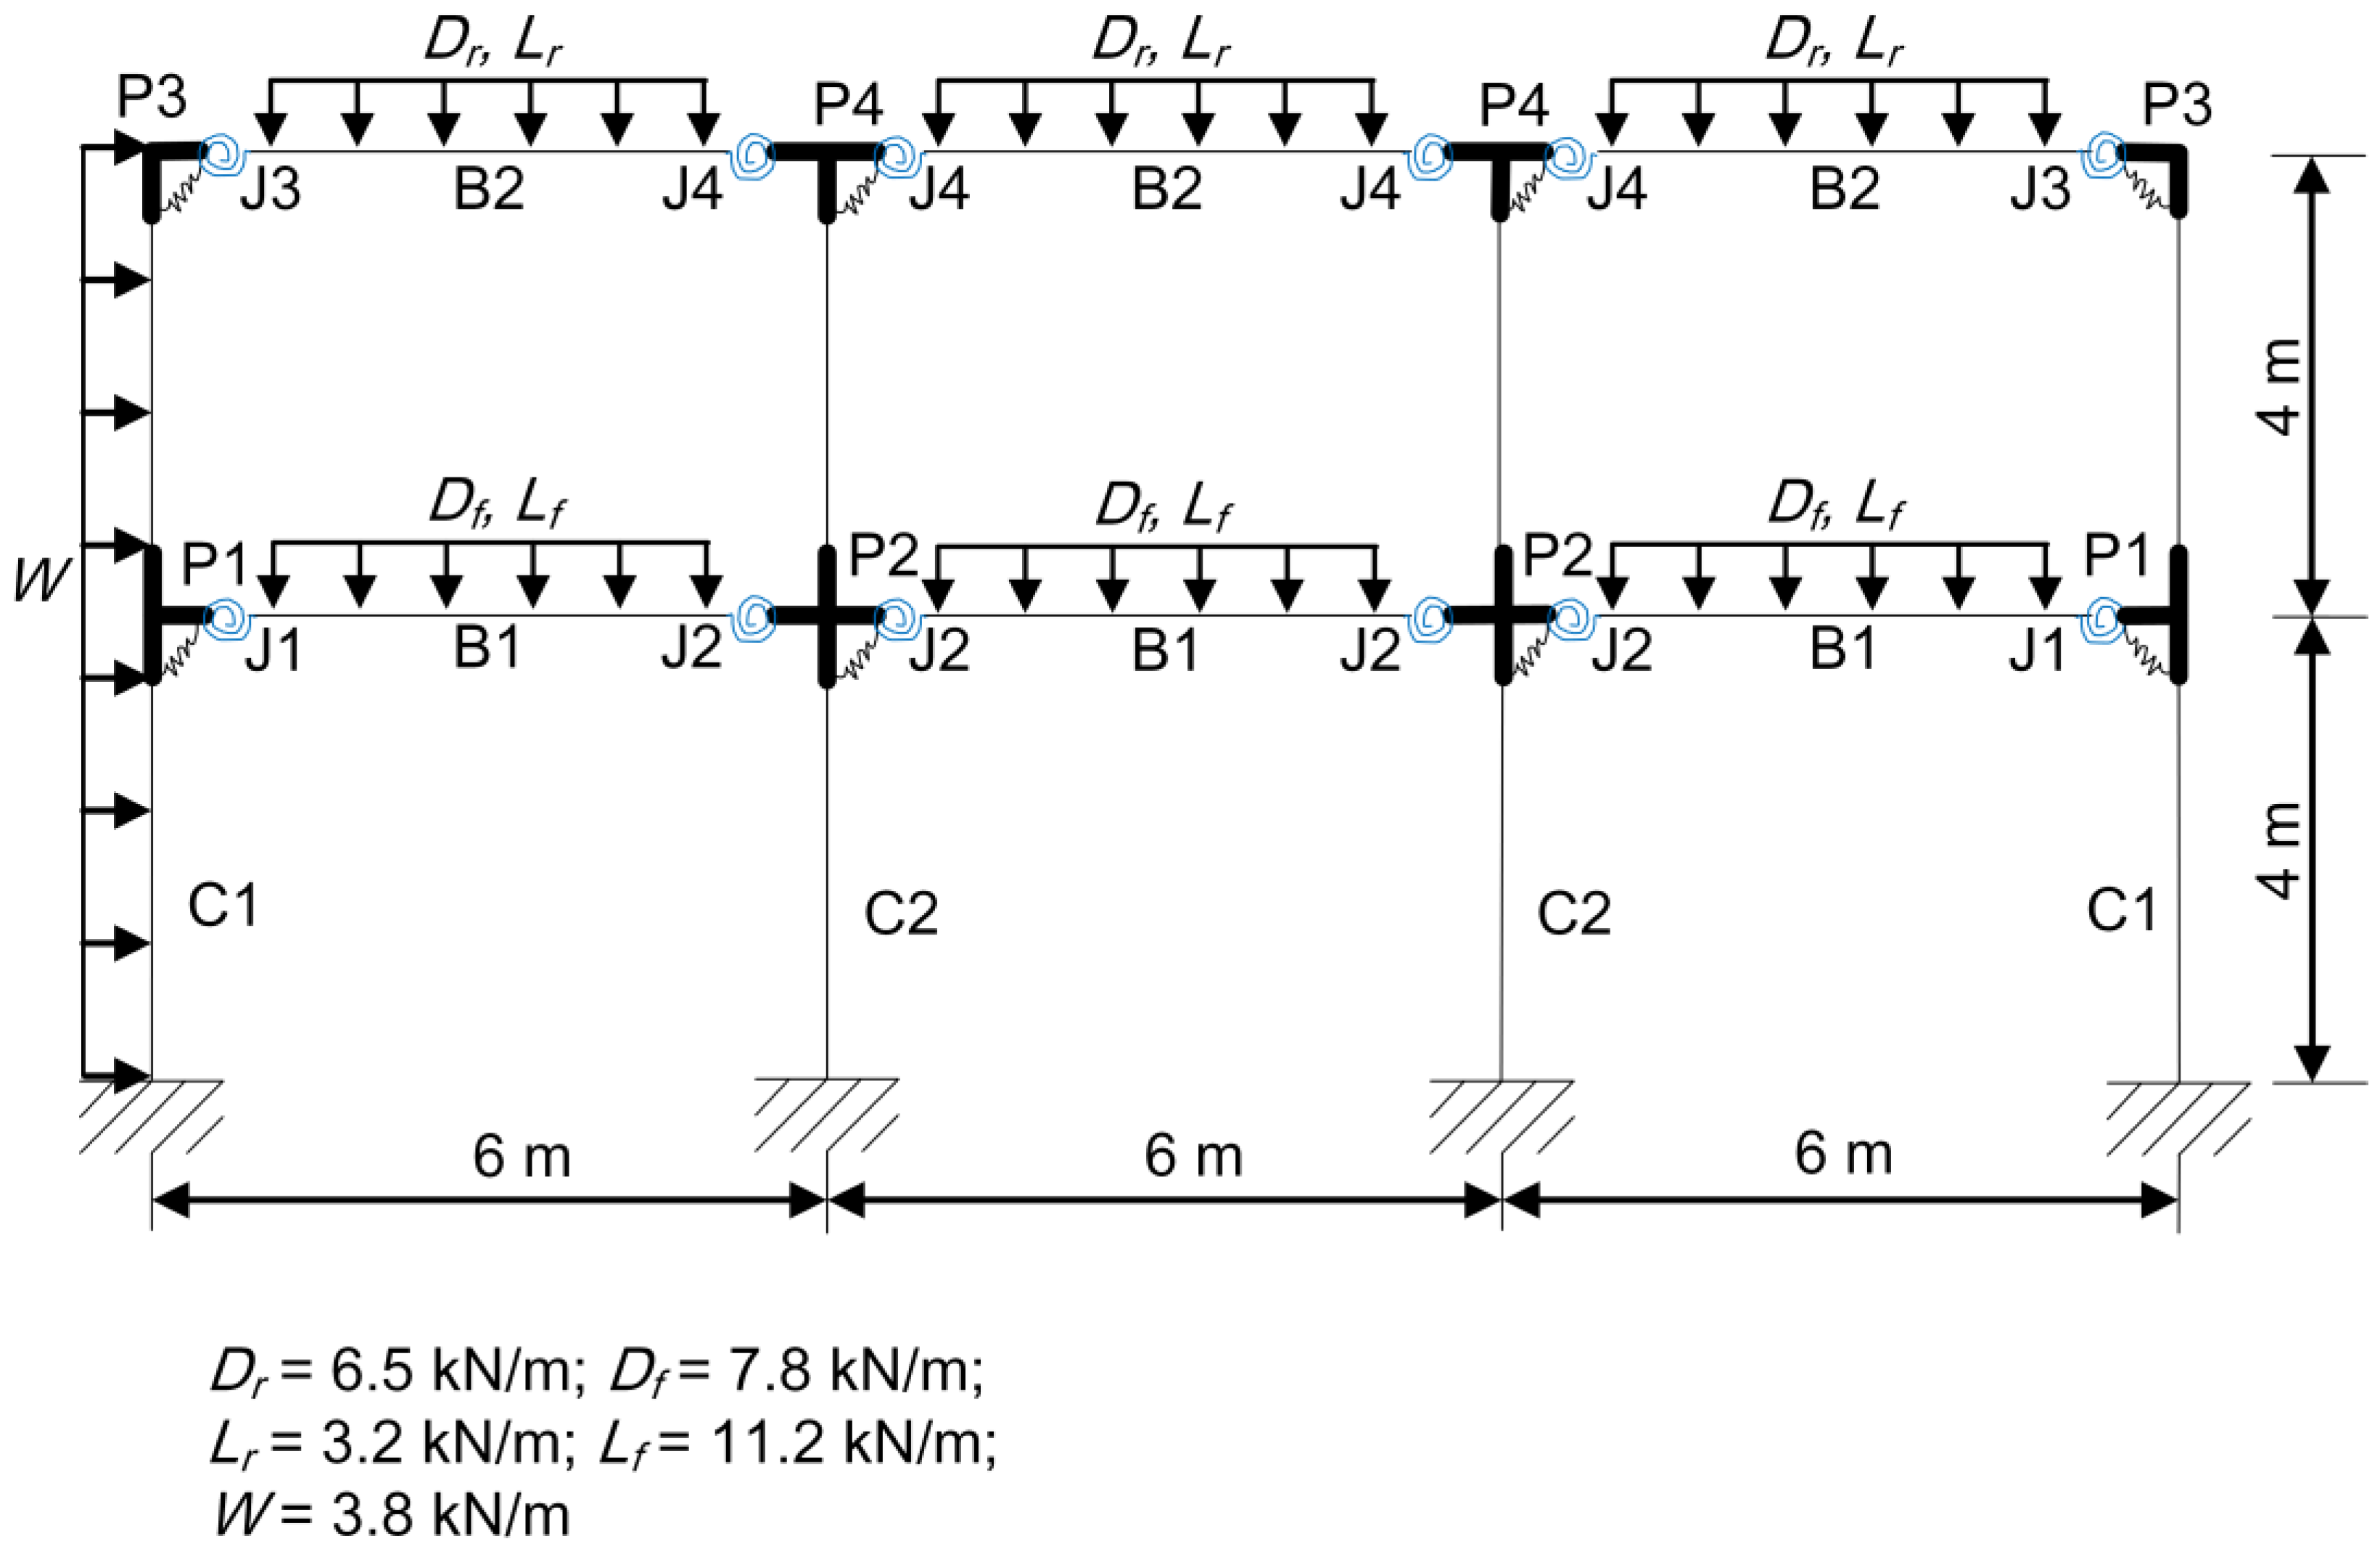
6.2. Three-Bay Two-Storey Frame
6.3. Three-Bay Ten-Story Frame
7. Conclusions
- As a continuation of the work in literature [34], the new method proposed in this paper has additional features besides maintaining all the advantages of the old one. Under the framework of the proposed method, the structural design is separated into two consecutive parts, element, and joint design, which are linked together by the performance requirements of joints. The structural design is transformed into a search for the proper matching of performance requirements between elements and joints, while the geometry of connections no longer needs to be concerned throughout the process. As a portability template, once the connection database is generated, it can be easily used for various frames, avoiding the repeated design of connections in different projects.
- The general principle for classifying the performance levels of connections is established, whose core is to determine the interval between the upper and lower levels, followed by the applicability boundaries. In terms of the joint fixity-factor, it is found that the lateral displacement of the frame is more sensitive to the variation of the fixity-factor than internal forces. Frames with a low stiffness ratio of the beam to column are more sensitive to the variation of the fixity-factor than those with a high ratio. The sensitivity increases with the total number of floors and, conversely, decreases with the total number of spans. For multi-story multi-bay moment resistance frames with less than ten stories, when the fixity-factor is not less than 0.6, all connections with a difference in the fixity-factor within ±0.025 can be classified into one category. In terms of the moment capacity coefficient, it is stipulated that the lower level should not be less than 2/3 times that of the higher level so that the obtained connection requirements can be as close as possible to its resistance and the flexural capacity of the connection is fully utilized.
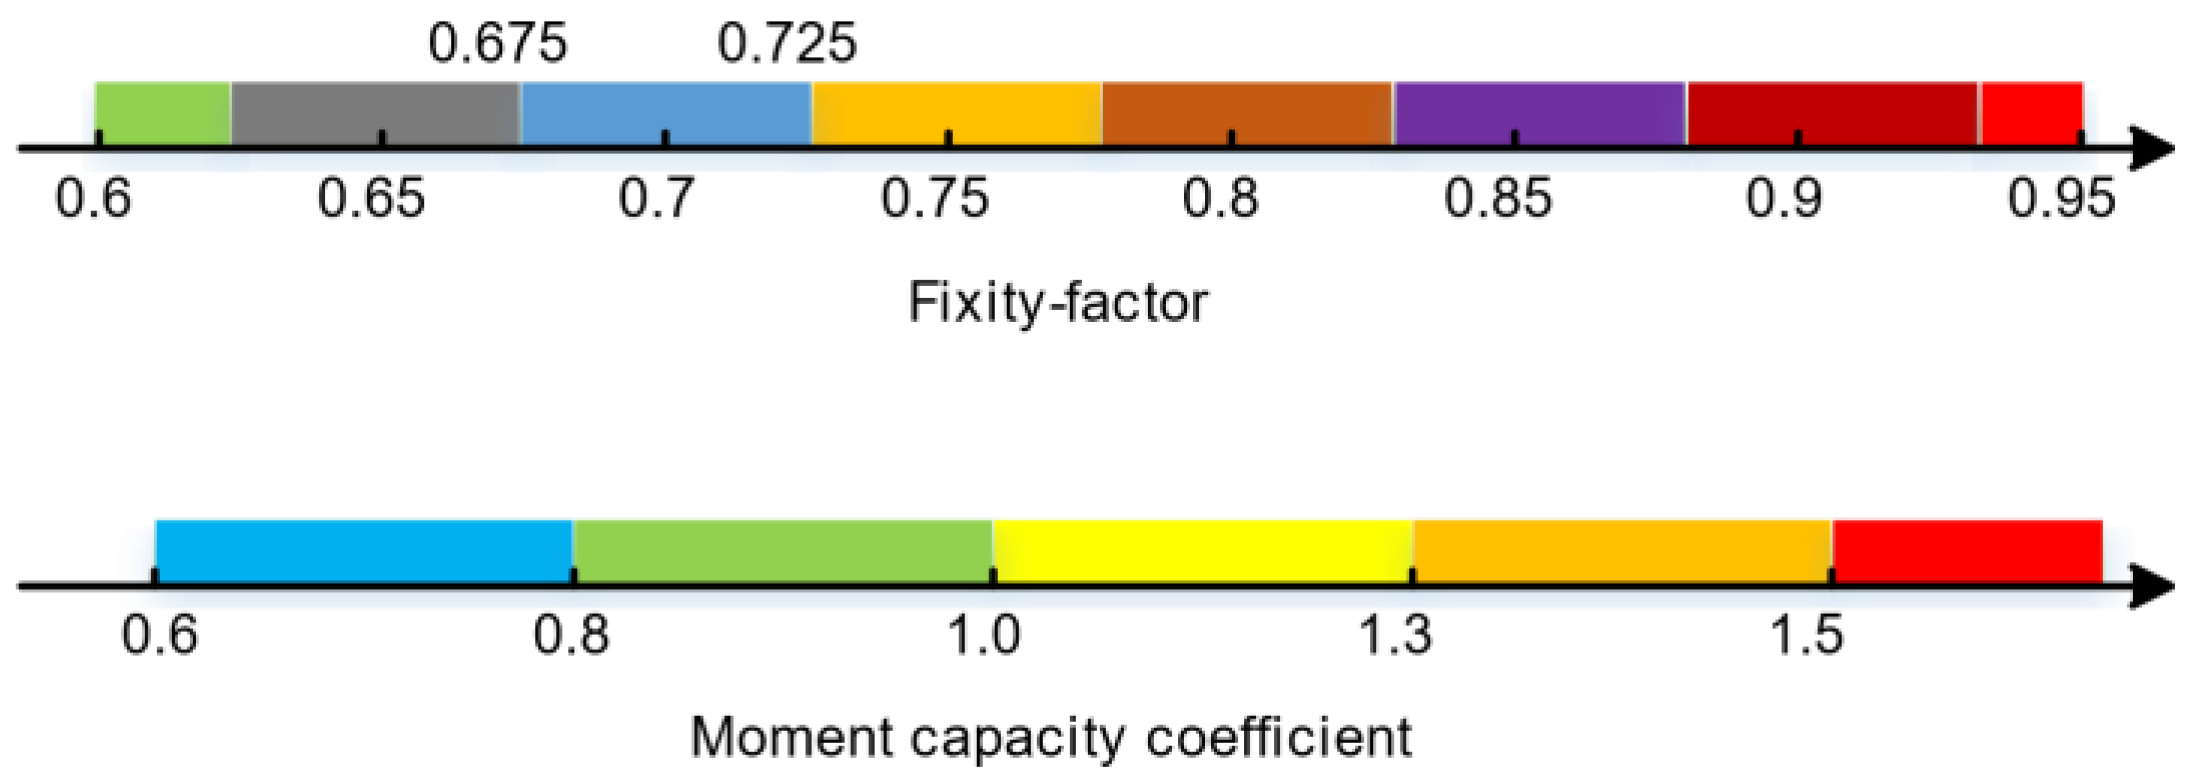
- The performance matrix for connections is established, whose vertical axis is the fixity-factor with the value of 0.6, 0.65, 0.7, 0.75, 0.8, 0.85, 0.9, and 0.95, and the horizontal axis is the moment capacity coefficient with the value of 0.6, 0.8, 1.0, 1.3, and 1.5. For each assembly of beam–column, not all performance grids have available connections. This means that, on the one hand, the volume of the connection database can be compressed, and on the other, arbitrary assumed performance requirements for the connections can lead to invalid calculations, while choosing a good initial value is tricky.
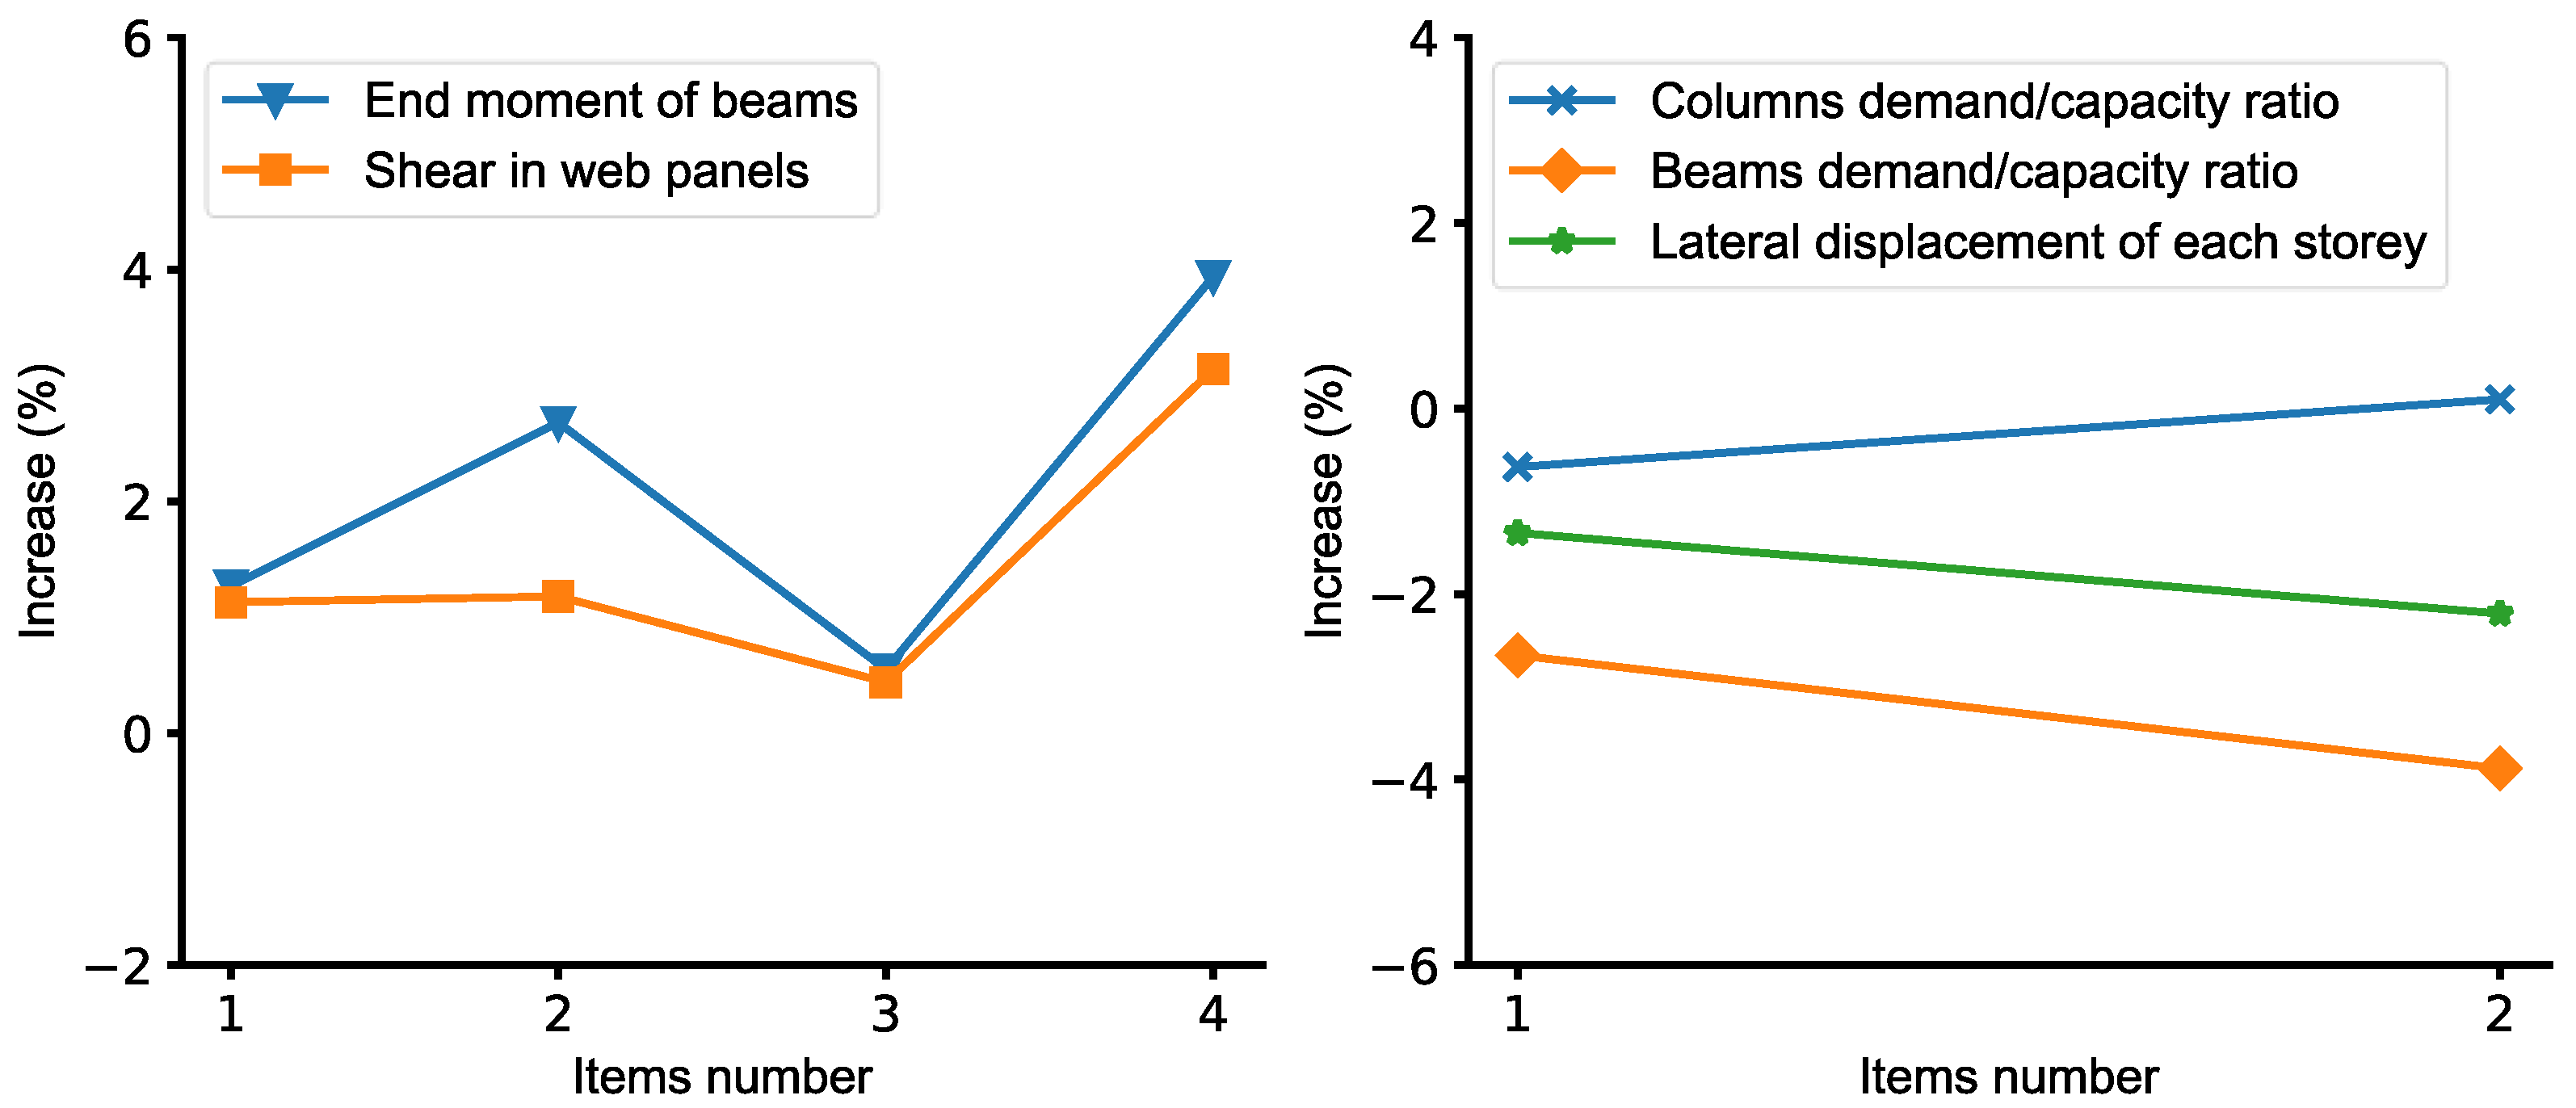
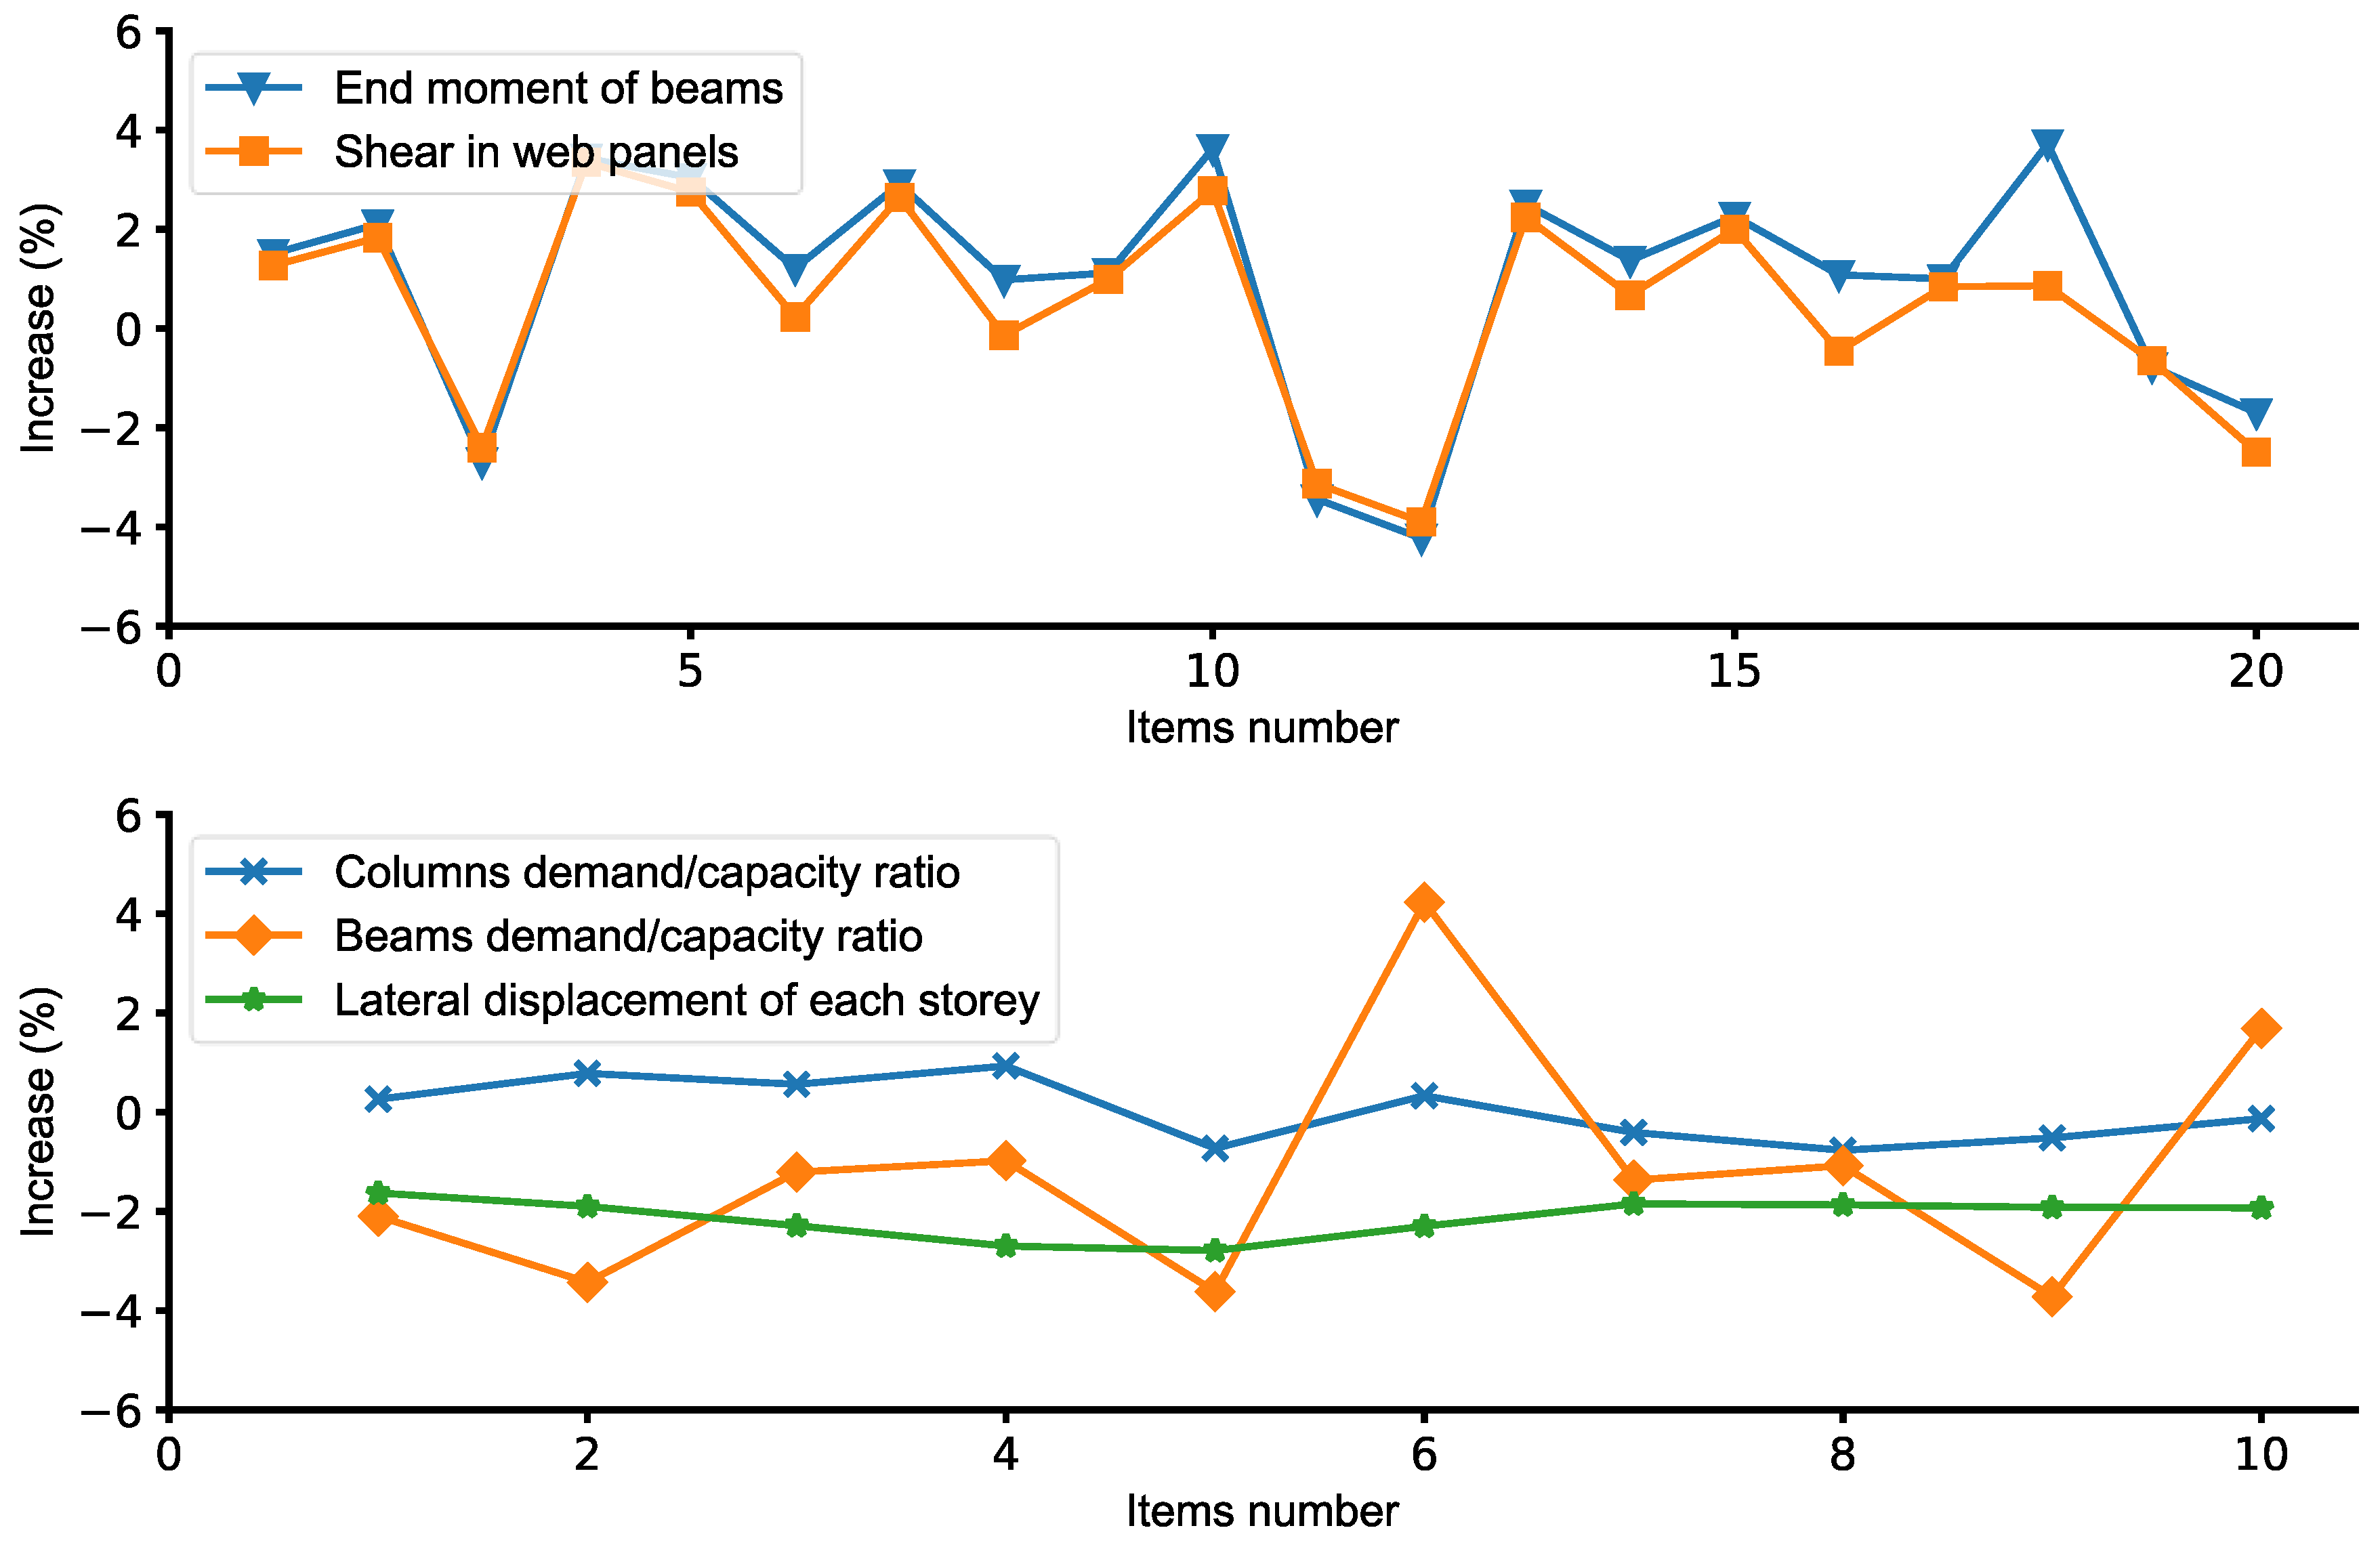
- The design process of two frames demonstrates the feasibility and high efficiency of the proposed method. The design of joints needs more iterations than that for elements to obtain a satisfactory solution. Due to the ductility requirements for partial strength connections, large diameters, high classes of bolts, and thin plates are used. The changes in the structural responses caused by the deviation between the obtained connections and the assumed connections are all within 5%, which can meet the engineering requirements well.
Author Contributions
Funding
Institutional Review Board Statement
Informed Consent Statement
Data Availability Statement
Acknowledgments
Conflicts of Interest
Nomenclature
| E | Young’s modulus | N | vertical load on top of the column |
| r | end fixity-factor | Nu | ultimate resistance of the column |
| δr | deviation between the required and ‘actual’ | Nu,req | column ultimate resistance at the required fixity-factor |
| fixity-factor | Nu,act | column ultimate resistance at the ‘actual’ fixity-factor | |
| rreq | required fixity-factor | ε | column critical elastic buckling load ratio at the required |
| ract | ‘actual’ fixity-factor | and ‘actual’ fixity-factor | |
| m | moment capacity coefficient | Ncr | critical elastic buckling load of the column |
| η | reduction factor for the joint secant stiffness | Np | squash load of the column |
| Sj,ini | initial rotational stiffness of the joint | X | ratio of the critical elastic buckling load to the squash load |
| Sj,sec | secant stiffness of the joint | Xreq | ratio of the critical elastic buckling load to the squash load |
| Mj,rd | moment resistance of the joint | at the required fixity-factor | |
| Mb,pl | plastic moment resistance of the beam | Xact | ratio of the critical elastic buckling load to the squash load |
| kb | linear stiffness of the beam | at the ‘actual’ fixity-factor | |
| kc | linear stiffness of the column | Δ | relative variation in the ultimate bearing capacity of the |
| ρ | linear stiffness ratio of beam to column | column due to the deviation between the ‘actual’ and the | |
| Ib | moment of inertia of the beam | required fixity-factor | |
| Ic | moment of inertia of the column | δ | lateral displacement of the column |
| Lb | length of the beam | δact | column lateral displacement at the ‘actual’ fixity-factor |
| Lc | length of the column | δreq | column lateral displacement at the required fixity-factor |
| L | unsupported length of the column | ω | relative variation in the lateral displacement of the |
| Lcr | Euler buckling length of the column | column due to the deviation between the ‘actual’ and the | |
| η1, η2 | distribution factors of the lower and upper | required fixity-factor | |
| ends of the column | d | nominal bolt diameter | |
| K | effective length factor | t | thickness of the end-plate |
| Kreq | column effective length factor at the required | fub | bolt ultimate strength |
| fixity-factor | fy | yield strength of the end-plate or column flange | |
| Kact | column effective length factor at the ‘actual’ | γov | over-strength factor |
| fixity-factor | Rd | resistance of the connection | |
| F | lateral load on top of the column | Rfy | plastic resistance of the connected dissipative member |
Appendix A

| r\m | 0.6 | 0.8 | 1.0 | 1.3 | 1.5 |
|---|---|---|---|---|---|
| 0.6 | |||||
| 0.65 | |||||
| 0.7 | |||||
| 0.75 | |||||
| 0.8 | |||||
| 0.85 | √ 1 | ||||
| 0.9 | √ | √ | √ | ||
| 0.95 | √ |
| r\m | 0.6 | 0.8 | 1.0 | 1.3 | 1.5 |
|---|---|---|---|---|---|
| 0.6 | |||||
| 0.65 | |||||
| 0.7 | |||||
| 0.75 | |||||
| 0.8 | |||||
| 0.85 | |||||
| 0.9 | √ | √ | √ | ||
| 0.95 | √ | √ | √ |
Appendix B
| No. | Initial | Iter1 | Iter2 | Iter3 |
|---|---|---|---|---|
| C1 | HEB300 0.82 | HEB300 0.74 | HEB300 0.75 | HEB300 0.75 |
| C2 | HEB650 0.94 | HEB900 0.88 | HEB900 0.87 | HEB900 0.87 |
| C3 | HEB260 0.88 | HEB260 0.87 | HEB260 0.88 | HEB260 0.87 |
| C4 | HEB500 0.71 | HEB500 0.79 | HEB500 0.78 | HEB500 0.78 |
| C5 | HEB220 0.94 | HEB240 0.81 | HEB240 0.85 | HEB240 0.84 |
| C6 | HEB340 0.76 | HEB340 0.73 | HEB340 0.72 | HEB340 0.73 |
| C7 | HEB180 1.04 | HEB200 0.87 | HEB200 0.87 | HEB200 0.88 |
| C8 | HEB260 0.79 | HEB260 0.76 | HEB260 0.74 | HEB260 0.74 |
| C9 | HEB160 0.94 | HEB180 0.74 | HEB180 0.79 | HEB180 0.79 |
| C10 | HEB160 0.95 | HEB180 0.74 | HEB180 0.73 | HEB180 0.73 |
| B1 | IPE500 0.40 | IPE360 0.58 | IPE360 0.57 | IPE360 0.57 |
| B2 | IPE450 0.54 | IPE400 0.60 | IPE400 0.60 | IPE400 0.60 |
| B3 | IPE450 0.66 | IPE400 0.73 | IPE400 0.72 | IPE400 0.72 |
| B4 | IPE400 0.76 | IPE400 0.76 | IPE400 0.74 | IPE400 0.75 |
| B5 | IPE400 0.74 | IPE400 0.71 | IPE400 0.69 | IPE400 0.70 |
| B6 | IPE360 0.91 | IPE400 0.73 | IPE400 0.71 | IPE400 0.71 |
| B7 | IPE360 0.83 | IPE360 0.79 | IPE360 0.78 | IPE360 0.78 |
| B8 | IPE330 0.92 | IPE360 0.72 | IPE360 0.71 | IPE360 0.71 |
| B9 | IPE330 0.79 | IPE330 0.77 | IPE360 0.60 | IPE360 0.60 |
| B10 | IPE270 0.73 | IPE270 0.72 | IPE270 0.71 | IPE270 0.71 |
| Phase | No. | rreq | mreq | ract | mact | Check |
|---|---|---|---|---|---|---|
| Initial | J1 | 0.70 | 0.31 | 0.72 | 0.67 | OK |
| J2 | 0.70 | 0.40 | 0.71 | 0.74 | OK | |
| J3 | 0.75 | 0.47 | 0.77 | 0.79 | OK | |
| J4 | 0.70 | 0.54 | 0.71 | 0.69 | OK | |
| J5 | 0.75 | 0.50 | 0.76 | 0.65 | OK | |
| J6 | 0.75 | 0.66 | 0.77 | 0.78 | OK | |
| J7 | 0.75 | 0.60 | 0.76 | 0.72 | OK | |
| J8 | 0.75 | 0.76 | 0.77 | 0.85 | OK | |
| J9 | 0.75 | 0.58 | 0.77 | 0.61 | OK | |
| J10 | 0.75 | 0.74 | 0.77 | 0.77 | OK | |
| J11 | 0.80 | 0.68 | 0.82 | 0.76 | OK | |
| J12 | 0.80 | 0.91 | 0.81 | 1.05 | OK | |
| J13 | 0.80 | 0.56 | 0.82 | 0.60 | OK | |
| J14 | 0.80 | 0.83 | 0.81 | 0.86 | OK | |
| J15 | 0.80 | 0.63 | 0.82 | 0.65 | OK | |
| J16 | 0.80 | 0.92 | 0.81 | 0.94 | OK | |
| J17 | 0.80 | 0.52 | Null | Null | NO | |
| J18 | 0.80 | 0.79 | Null | Null | NO | |
| J19 | 0.85 | 0.41 | 0.87 | 0.80 | OK | |
| J20 | 0.85 | 0.70 | 0.87 | 0.80 | OK | |
| Iter1 | J1 | 0.80 | 0.51 | 0.81 | 0.80 | OK |
| J2 | 0.75 | 0.58 | 0.76 | 0.78 | OK | |
| J3 | 0.75 | 0.48 | 0.74 | 0.78 | OK | |
| J4 | 0.75 | 0.60 | 0.77 | 0.78 | OK | |
| J5 | 0.75 | 0.57 | 0.76 | 0.72 | OK | |
| J6 | 0.75 | 0.73 | 0.77 | 0.85 | OK | |
| J7 | 0.75 | 0.60 | 0.76 | 0.72 | OK | |
| J8 | 0.75 | 0.76 | 0.77 | 0.85 | OK | |
| J9 | 0.75 | 0.58 | 0.77 | 0.69 | OK | |
| J10 | 0.75 | 0.71 | 0.77 | 0.77 | OK | |
| J11 | 0.75 | 0.56 | 0.77 | 0.69 | OK | |
| J12 | 0.75 | 0.73 | 0.77 | 0.77 | OK | |
| J13 | 0.80 | 0.58 | 0.82 | 0.69 | OK | |
| J14 | 0.80 | 0.79 | 0.81 | 0.80 | OK | |
| J15 | 0.80 | 0.52 | 0.82 | 0.69 | OK | |
| J16 | 0.80 | 0.72 | 0.81 | 0.80 | OK | |
| J17 | 0.80 | 0.54 | 0.82 | 0.65 | OK | |
| J18 | 0.80 | 0.77 | Null | Null | NO | |
| J19 | 0.85 | 0.46 | 0.84 | 0.80 | OK | |
| J20 | 0.85 | 0.69 | 0.84 | 0.80 | OK | |
| Iter2 | J1 | 0.80 | 0.51 | 0.81 | 0.80 | OK |
| J2 | 0.75 | 0.57 | 0.76 | 0.78 | OK | |
| J3 | 0.75 | 0.48 | 0.74 | 0.78 | OK | |
| J4 | 0.75 | 0.60 | 0.77 | 0.78 | OK | |
| J5 | 0.75 | 0.65 | 0.77 | 0.73 | OK | |
| J6 | 0.75 | 0.72 | 0.76 | 0.78 | OK | |
| J7 | 0.75 | 0.69 | 0.77 | 0.73 | OK | |
| J8 | 0.75 | 0.74 | 0.76 | 0.78 | OK | |
| J9 | 0.75 | 0.67 | Null | Null | NO | |
| J10 | 0.75 | 0.69 | 0.77 | 0.77 | OK | |
| J11 | 0.75 | 0.64 | 0.77 | 0.65 | OK | |
| J12 | 0.75 | 0.71 | 0.77 | 0.77 | OK | |
| J13 | 0.80 | 0.58 | 0.82 | 0.62 | OK | |
| J14 | 0.80 | 0.78 | 0.81 | 0.80 | OK | |
| J15 | 0.80 | 0.51 | 0.82 | 0.62 | OK | |
| J16 | 0.80 | 0.71 | 0.81 | 0.80 | OK | |
| J17 | 0.80 | 0.48 | 0.82 | 0.65 | OK | |
| J18 | 0.80 | 0.60 | 0.82 | 0.64 | OK | |
| J19 | 0.85 | 0.46 | 0.84 | 0.80 | OK | |
| J20 | 0.85 | 0.68 | 0.84 | 0.80 | OK | |
| Iter3 | J1 | 0.80 | 0.51 | 0.81 | 0.80 | OK |
| J2 | 0.75 | 0.57 | 0.76 | 0.78 | OK | |
| J3 | 0.75 | 0.48 | 0.74 | 0.78 | OK | |
| J4 | 0.75 | 0.60 | 0.77 | 0.78 | OK | |
| J5 | 0.75 | 0.66 | 0.77 | 0.73 | OK | |
| J6 | 0.75 | 0.72 | 0.76 | 0.78 | OK | |
| J7 | 0.75 | 0.69 | 0.77 | 0.73 | OK | |
| J8 | 0.75 | 0.75 | 0.76 | 0.78 | OK | |
| J9 | 0.80 | 0.62 | 0.82 | 0.73 | OK | |
| J10 | 0.75 | 0.70 | 0.77 | 0.77 | OK | |
| J11 | 0.75 | 0.64 | 0.77 | 0.65 | OK | |
| J12 | 0.75 | 0.71 | 0.77 | 0.77 | OK | |
| J13 | 0.80 | 0.58 | 0.82 | 0.62 | OK | |
| J14 | 0.80 | 0.78 | 0.81 | 0.80 | OK | |
| J15 | 0.80 | 0.51 | 0.82 | 0.62 | OK | |
| J16 | 0.80 | 0.71 | 0.81 | 0.80 | OK | |
| J17 | 0.80 | 0.48 | 0.82 | 0.65 | OK | |
| J18 | 0.80 | 0.60 | 0.82 | 0.64 | OK | |
| J19 | 0.85 | 0.46 | 0.84 | 0.80 | OK | |
| J20 | 0.85 | 0.68 | 0.84 | 0.80 | OK |
| Phase | No. | Mrd,req | Mrd,act | Continuity | Double | Check |
|---|---|---|---|---|---|---|
| Initial | P1 | 186.29 | 289.10 | 0 | 0 | OK |
| P2 | 280.85 | 743.06 | 0 | 0 | OK | |
| P3 | 218.27 | 260.19 | 0 | 0 | OK | |
| P4 | 298.92 | 668.75 | 0 | 0 | OK | |
| P5 | 226.36 | Null | Null | Null | NO | |
| P6 | 359.40 | 495.55 | 0 | 0 | OK | |
| P7 | 208.37 | Null | Null | Null | NO | |
| P8 | 297.59 | 440.49 | 0 | 0 | OK | |
| P9 | 198.79 | Null | Null | Null | NO | |
| P10 | 262.66 | 274.46 | 0 | 0 | OK | |
| P11 | 182.91 | Null | Null | Null | NO | |
| P12 | 219.94 | 247.02 | 0 | 0 | OK | |
| P13 | 150.27 | Null | Null | Null | NO | |
| P14 | 170.40 | Null | Null | Null | NO | |
| P15 | 134.84 | Null | Null | Null | NO | |
| P16 | 114.40 | 149.70 | 0 | 0 | OK | |
| P17 | 110.52 | Null | Null | Null | NO | |
| P18 | 49.29 | Null | Null | Null | NO | |
| P19 | 53.28 | 58.16 | 0 | 0 | OK | |
| P20 | 16.65 | 58.16 | 0 | 0 | OK | |
| Iter1 | P1 | 147.03 | 434.89 | 1 | 0 | OK |
| P2 | 126.93 | 828.55 | 0 | 0 | OK | |
| P3 | 173.74 | 231.28 | 0 | 0 | OK | |
| P4 | 240.29 | 1319.40 | 1 | 0 | OK | |
| P5 | 198.36 | Null | Null | Null | NO | |
| P6 | 279.99 | 440.49 | 0 | 0 | OK | |
| P7 | 209.76 | Null | Null | Null | NO | |
| P8 | 300.47 | 440.49 | 0 | 0 | OK | |
| P9 | 202.23 | Null | Null | Null | NO | |
| P10 | 243.87 | 274.46 | 0 | 0 | OK | |
| P11 | 194.74 | Null | Null | Null | NO | |
| P12 | 233.22 | 274.46 | 0 | 0 | OK | |
| P13 | 156.48 | 190.01 | 1 | 0 | OK | |
| P14 | 148.18 | 163.31 | 0 | 0 | OK | |
| P15 | 140.44 | 190.01 | 1 | 0 | OK | |
| P16 | 111.49 | 163.31 | 0 | 0 | OK | |
| P17 | 117.03 | Null | Null | Null | NO | |
| P18 | 47.66 | Null | Null | Null | NO | |
| P19 | 59.64 | 66.90 | 0 | 0 | OK | |
| P20 | 17.02 | 66.90 | 0 | 0 | OK | |
| Iter2 | P1 | 146.16 | 434.89 | 1 | 0 | OK |
| P2 | 125.53 | 828.55 | 0 | 0 | OK | |
| P3 | 172.61 | 231.28 | 0 | 0 | OK | |
| P4 | 236.11 | 1319.40 | 1 | 0 | OK | |
| P5 | 225.73 | 267.92 | 0 | 1 | OK | |
| P6 | 269.17 | 440.49 | 0 | 0 | OK | |
| P7 | 237.19 | 267.92 | 0 | 1 | OK | |
| P8 | 285.71 | 440.49 | 0 | 0 | OK | |
| P9 | 229.46 | Null | Null | Null | NO | |
| P10 | 228.55 | 274.46 | 0 | 0 | OK | |
| P11 | 220.40 | 242.47 | 0 | 1 | OK | |
| P12 | 219.20 | 274.46 | 0 | 0 | OK | |
| P13 | 155.29 | 190.01 | 1 | 0 | OK | |
| P14 | 144.60 | 163.31 | 0 | 0 | OK | |
| P15 | 139.08 | 190.01 | 1 | 0 | OK | |
| P16 | 108.86 | 163.31 | 0 | 0 | OK | |
| P17 | 129.32 | 137.47 | 0 | 1 | OK | |
| P18 | 45.36 | 89.20 | 0 | 0 | OK | |
| P19 | 59.26 | 66.90 | 0 | 0 | OK | |
| P20 | 14.81 | 66.90 | 0 | 0 | OK | |
| Iter3 | P1 | 146.21 | 434.89 | 1 | 0 | OK |
| P2 | 125.60 | 828.55 | 0 | 0 | OK | |
| P3 | 172.70 | 231.28 | 0 | 0 | OK | |
| P4 | 236.31 | 1319.40 | 1 | 0 | OK | |
| P5 | 226.33 | 267.92 | 0 | 1 | OK | |
| P6 | 269.79 | 440.49 | 0 | 0 | OK | |
| P7 | 237.18 | 267.92 | 0 | 1 | OK | |
| P8 | 287.59 | 440.49 | 0 | 0 | OK | |
| P9 | 213.45 | 297.32 | 1 | 0 | OK | |
| P10 | 232.30 | 274.46 | 0 | 0 | OK | |
| P11 | 220.27 | 242.47 | 0 | 1 | OK | |
| P12 | 221.81 | 274.46 | 0 | 0 | OK | |
| P13 | 155.68 | 190.01 | 1 | 0 | OK | |
| P14 | 144.77 | 163.31 | 0 | 0 | OK | |
| P15 | 139.13 | 190.01 | 1 | 0 | OK | |
| P16 | 108.92 | 163.31 | 0 | 0 | OK | |
| P17 | 129.39 | 137.47 | 0 | 1 | OK | |
| P18 | 45.32 | 89.20 | 0 | 0 | OK | |
| P19 | 59.28 | 66.90 | 0 | 0 | OK | |
| P20 | 14.79 | 66.90 | 0 | 0 | OK |
References
- Christopher, J.E.; Bjorhovde, R. Response characteristics of frames with semi-rigid connections. J. Constr. Steel Res. 1998, 46, 253–254. [Google Scholar] [CrossRef]
- Chen, W.F. Practical Analysis for Semi-Rigid Frame Design; World Scientific: Singapore, 2000. [Google Scholar]
- Braham, M.; Jaspart, J.-P. Is it safe to design a building structure with simple joints, when they are known to exhibit a semi-rigid behaviour? J. Constr. Steel Res. 2004, 60, 713–723. [Google Scholar] [CrossRef]
- EN1993-1-1:2005; Eurocode 3: Design of Steel Structures, Part 1-1: General Rules and Rules for Buildings. European Committee for Standardization: Brussels, Belgium, 2005.
- ANSI/AISC360-16; Specification for Structural Steel Buildings. American Institute of Steel Construction: Chicago, IL, USA, 2016.
- GB50017-2017; Code of Design of Steel Structures. CABP: Beijing, China, 2017.
- Frye, M.J.; Morris, G.A. Analysis of flexibly connected steel frames. Can. J. Civil Eng. 1975, 2, 280–291. [Google Scholar] [CrossRef]
- Hadidi, A.; Rafiee, A. A new hybrid algorithm for simultaneous size and semi-rigid connection type optimization of steel frames. Int. J. Steel Struct. 2015, 15, 89–102. [Google Scholar] [CrossRef]
- Doğan, E.; Şeker, S.; Celalettin Kozanoğlu, M.P.S. Investigating the effect of joint behavior on the optimum design on steel frames via hunting search algorithm. Adv. Steel Constr. 2018, 14, 166–183. [Google Scholar]
- Degertekin, S.O.; Hayalioglu, M.S. Harmony search algorithm for minimum cost design of steel frames with semirigid connections and column bases. Struct. Multidiscipl. Optimiz. 2010, 42, 755–768. [Google Scholar] [CrossRef]
- Díaz, C.; Martí, P.; Victoria, M.; Querin, O.M. Review on the modelling of joint behaviour in steel frames. J. Constr. Steel Res. 2011, 67, 741–758. [Google Scholar] [CrossRef]
- EN1993-1-8:2005; Eurocode 3: Design of Steel Structures, Part 1–8: Design of Joints. European Committee for Standardization: Brussels, Belgium, 2005.
- Brown, D.; Iles, D.; Brettle, M.; Malik, A.; BCSA/SCI Connections Group. Joints in Steel Construction: Moment-Resisting Joints to Eurocode 3; Vol BCSA/SCI Connections Group; The British Constructional Steel work Association Limited: London, UK, 2013; p. 163. [Google Scholar]
- Jaspart, J.P. Integration of the joint actual behaviour into the frame analysis and design process. In Semi-Rigid Connections in Structural Steelwork; Ivanyi, M., Baniotopoulos, C.C., Eds.; CISM Courses and Lectures; Springer: Berlin/Heidelberg, Germany, 2000; pp. 103–166. [Google Scholar]
- Weynand, K.; Feldmann, M. Quick and easy design of joints in practice using new tools for designers. In Proceedings of the Fourth International Workshop on Connections in Steel Structures, Roanoke, VA, USA, 22–25 October 2000. [Google Scholar]
- Landolfo, R. European seismic prequalification of steel beam-to-column joints: EQUALJOINTS and EQUALJOINTS-Plus projects. J. Constr. Steel Res. 2022, 192, 107238. [Google Scholar] [CrossRef]
- Yang, H. Performance analysis of semi-rigid connections in prefabricated high-rise steel structures. Structures 2020, 28, 837–846. [Google Scholar] [CrossRef]
- Zhai, X.; Zha, X.; Chen, D. Elastic stability of unbraced plate-type modular steel frames with semi-rigid corner connections. J. Constr. Steel Res. 2022, 192, 107243. [Google Scholar] [CrossRef]
- Wang, H.; Zhao, X.; Ma, G. Experimental study on seismic performance of column-column-beam joint in panelised steel-modular structure. J. Constr. Steel Res. 2022, 192, 107240. [Google Scholar] [CrossRef]
- Lu, S.; Wang, Z.; Pan, J.; Wang, P. The Seismic Performance Analysis of Semi-rigid Spatial Steel Frames Based on Moment-Rotation Curves of End-plate Connection. Structures 2022, 36, 1032–1049. [Google Scholar] [CrossRef]
- Díaz, C.; Victoria, M.; Querin, O.M.; Martí, P. FE Model of Three-Dimensional Steel Beam-to-Column Bolted Extended End-Plate Joint. Int. J. Steel Struct. 2018, 18, 843–867. [Google Scholar] [CrossRef]
- Gernay, T.; Franssen, J.-M. The introduction and the influence of semi-rigid connections in framed structures subjected to fire. Fire Saf. J. 2020, 114, 103007. [Google Scholar] [CrossRef]
- Tran, V.-L. Moment-rotation-temperature model of semi-rigid cruciform flush endplate connection in fire. Fire Saf. J. 2020, 114, 102992-17. [Google Scholar] [CrossRef]
- Ribeiro, J.; Santiago, A.; Rigueiro, C.; Da Silva, L.S. Analytical model for the response of T-stub joint component under impact loading. J. Constr. Steel Res. 2015, 106, 23–34. [Google Scholar] [CrossRef]
- Ribeiro, J.; Santiago, A.; Rigueiro, C.; Barata, P.; Veljkovic, M. Numerical assessment of T-stub component subjected to impact loading. Eng. Struct. 2016, 106, 450–460. [Google Scholar] [CrossRef]
- Bjorhovde, R.; Colson, A. Economy of Semi-Rigid Frame Design. In Proceedings of the 2nd International Workshop; American Institute of Steel Construction: Pittsburgh, PA, USA, 1991. [Google Scholar]
- David Anderson, A.C.; Jaspart, J.-P. Connections and frame design for economy. New Steel Constr. 1993, 1, 30–33. [Google Scholar]
- Steenhuis, M.; Weynand, K.; Gresnigt, A.M. Strategies for economic design of unbraced steel frames. J. Constr. Steel Res. 1998, 46, 88–89. [Google Scholar] [CrossRef]
- Weynand, K.; Jaspart, J.-P.; Steenhuis, M. Economy studies of steel building frames with semi-rigid joints. In Proceeding of the Second World Conference on Constructional Steel Design; Elsevier: Amsterdam, The Netherlands, 1998. [Google Scholar]
- Xu, L.; Grierson, D.E. Computer-automated design of semi-rigid steel frameworks. J. Struct. Eng. 1993, 119, 1740–1760. [Google Scholar] [CrossRef]
- Dhillon, B.S.; O’Malley, J.W., III. Interactive design of semi-rigid steel frames. J. Struct. Eng. 1999, 125, 556–564. [Google Scholar] [CrossRef]
- Steenhuis, M.; Gresnigt, N.; Weynand, K. Predesign of semi-rigid joints in steel frames. In Proceedings of the Second COST C1 Workshop on Semi-Rigid Connections; Technical University: Prague, Czech Republic, 1994. [Google Scholar]
- Cabrero, J.M.; Bayo, E. Development of practical design methods for steel structures with semi-rigid connections. Eng. Struct. 2005, 27, 1125–1137. [Google Scholar] [CrossRef]
- Yin, T.; Wang, Z.; Zheng, K.; Lu, S. A New Method for Design of the Semi-Rigid Steel Frame-The Integration of Joint Inverse Design and Structural Design. Buildings 2022, 12, 938. [Google Scholar] [CrossRef]
- Oppe, M.; Muller, C.; Iles, C. NCCI: Buckling Lengths of Columns: Rigorous Approach; Access Steel: London, UK, 2005. [Google Scholar]
- Chen, W.F.; Goto, Y.; Liew, J.Y.R. Stability Design of Semi-Rigid Frames; John Wiley & Sons: New York, NY, USA, 1996. [Google Scholar]
- Merchant, W. The failure load of rigid jointed frameworks as influenced by stability. Struct. Eng. 1954, 32, 185–190. [Google Scholar]
- Anderson, D.; Lok, T.S. Design studies of unbraced, multi-storey frames. Struct. Eng. 1983, 61B, 29–34. [Google Scholar]
- Bijlaard, F.; Steenhuis, M. Prediciton of the influence of connection behaviour on the strength, deformations and stability of frames, by classification of connections. In Proceedings of the Second International Workshop; American Institute of Steel Construction: Pittsburgh, PA, USA, 1991. [Google Scholar]
- Jaspart, J.-P.; Wald, F.; Weynand, K.; Gresnigt, A.M. Steel column base classification. HERON 2008, 53, 69–86. [Google Scholar]
- CSI. SAP2000 Integrated Software for Structural Analysis and Design; Computers and Structures Inc.: Berkeley, CA, USA, 2021. [Google Scholar]
- EN 1998-1:2004; Design of Structures for Earthquake Resistance—Part 1: General Rules, Seismic Actions and Rules for Buildings. European Committee for Standardization: Brussels, Belgium, 2005.
- ANSI/AISC 341-16; Seismic Provisions for Structural Steel Buildings. American Institute of Steel Construction: Chicago, IL, USA, 2016.
- Landolfo, R.; D’Aniello, M.; Tartaglia, R.; Constanzo, S.; Demonceau, J.F.; Jaspart, J.P. EQUALJOINTS PLUS: Volume with pre-normative design recommendations for seismically qualified steel joints. In Proceedings of the ECCS–European Convention for Constructional Steelwork, Brussels, Belgium, 6–7 December 2018. [Google Scholar]
- Faella, C.; Piluso, V.; Rizzano, G. Structural Steel Semirigid Connections: Theory, Design, and Software, 1st ed.; CRC Press: Boca Raton, FL, USA, 1999. [Google Scholar]
- D’Aniello, M.; Tartaglia, R.; Costanzo, S.; Landolfo, R. Seismic design of extended stiffened end-plate joints in the framework of Eurocodes. J. Constr. Steel Res. 2017, 128, 512–527. [Google Scholar] [CrossRef]
- Bayo, E.; Cabrero, J.M.; Gil, B. An effective component-based method to model semi-rigid connections for the global analysis of steel and composite structures. Eng. Struct. 2006, 28, 97–108. [Google Scholar] [CrossRef]
- Gupta, A.; Krawinkler, H. Seismic Demands for Performance Evaluation of Steel Moment Resisting Frame Structures; The John A. Blum Earthquake Engineering Center, Stanford University: Stanford, CA, USA, 1999; p. 379. [Google Scholar]
- FEMA-355C State of the Art Report on Systems Performance of Steel Moment Frames Subject to Earthquake Ground Shaking; SAC Joint Venture: Washington, DC, USA, 2000; p. 344.
- Castro, J.M.; Elghazouli, A.Y.; Izzuddin, B.A. Modelling of the panel zone in steel and composite moment frames. Eng. Struct. 2005, 27, 129–144. [Google Scholar] [CrossRef]
- Van Keulen, D.C.; Nethercot, D.A.; Snijder, H.H.; Bakker, M.C.M. Frame analysis incorporating semi-rigid joint action: Applicability of the half initial Secant stiffness approach. J. Constr. Steel Res. 2003, 59, 1083–1100. [Google Scholar] [CrossRef]
- EN 10365:2017; Hot Rolled Steel Channels, I and H Sections—Dimensions and Masses. European Committee for Standardization: Brussels, Belgium, 2017.
- EN 14399-4:2015; High Strength Structural Bolting for Preloading—Part 4: System HV -Hexagon Bolt and Nut Assemblies. European Committee for Standardization: Brussels, Belgium, 2015.


| Items | Frame 1 | Frame 2 | Frame 3 | Frame 4 | Frame5 | Frame 6 | Frame 7 | Frame 8 |
|---|---|---|---|---|---|---|---|---|
| Lb (m) | 6.1 | 6.1 | 3.66 | 6.1 | 6.1 | 6.1 | 6.1 | 6.1 |
| Lc (m) | 3.66 | 3.66 | 3.66 | 3.66 | 3.66 | 3.66 | 3.66 | 3.66 |
| n | 3 | 3 | 3 | 3 | 3 | 3 | 1 | 5 |
| m | 10 | 10 | 10 | 10 | 2 | 6 | 10 | 10 |
| Support | pinned | fixed | pinned | pinned | pinned | pinned | pinned | pinned |
| ρ | 0.1 | 0.1 | 0.1~1.55 | 0.1 | 0.1 | 0.1 | 0.1 | 0.1 |
| r | 0.6 | 0.6 | 0.6 | 0.8 | 0.6 | 0.6 | 0.6 | 0.6 |
| C1 | HE550B | HE550B | HE260B | HE550B | HE550B | HE550B | HE550B | HE550B |
| C2 | HE500B | HE500B | HE260B | HE500B | - 1 | HE500B | HE500B | HE500B |
| C3 | HE450B | HE450B | HE260B | HE450B | - | HE450B | HE450B | HE450B |
| C4 | HE400B | HE400B | HE260B | HE400B | - | - | HE400B | HE400B |
| C5 | HE260B | HE260B | HE260B | HE260B | - | - | HE260B | HE260B |
| B1 | IPE400 | IPE400 | IPE400 | IPE400 | IPE400 | IPE400 | IPE400 | IPE400 |
| B2 | IPE360 | IPE360 | IPE360 | IPE360 | - | IPE360 | IPE360 | IPE360 |
| B3 | IPE330 | IPE330 | IPE330 | IPE330 | - | IPE330 | IPE330 | IPE330 |
| B4 | IPE300 | IPE300 | IPE300 | IPE300 | - | - | IPE300 | IPE300 |
| B5 | IPE220 | IPE220 | IPE220 | IPE220 | - | - | IPE220 | IPE220 |
| Project | Available |
|---|---|
| Plate thickness (mm) | 10, 12, 14, 16, 20, 25 |
| Steel grade 1 | S235, S275, S355 |
| Bolt thread d 2 | M16, M20, M24, M30 |
| Bolt class 3 | 8.8, 10.9 |
| Rows of bolts 4 | ≥3 |
| Edge distance 5 | 1.2d0~4t + 40 |
| Bolt spacing | ≥2.2d0 |
| Assembly space | ≥2.2d0 |
| Continuity plates 6 | Yes or No |
| Supplement plates 7 | Single, Double, or No |
| Extended end-plate ribs 8 | Yes or No |
| No. | Initial | Iter1 | Iter2 |
|---|---|---|---|
| C1 | HEB140 0.67 | HEB140 0.60 | HEB140 0.64 |
| C2 | HEB140 0.80 | HEB160 0.61 | HEB160 0.60 |
| B1 | IPE240 0.87 | IPE270 0.67 | IPE270 0.66 |
| B2 | IPE180 0.96 | IPE200 0.72 | IPE200 0.72 |
| Phase | No. | rreq 1 | mreq 2 | ract 3 | mact 4 | Check |
|---|---|---|---|---|---|---|
| Initial | J1 | 0.85 | 0.56 | 0.87 | 0.71 | OK |
| J2 | 0.85 | 0.83 | Null 5 | Null | NO | |
| J3 | 0.90 | 0.64 | 0.92 | 0.79 | OK | |
| J4 | 0.90 | 0.88 | 0.92 | 0.92 | OK | |
| Iter1 | J1 | 0.85 | 0.37 | 0.85 | 0.62 | OK |
| J2 | 0.85 | 0.64 | 0.87 | 0.74 | OK | |
| J3 | 0.90 | 0.43 | 0.92 | 0.80 | OK | |
| J4 | 0.90 | 0.67 | 0.92 | 0.79 | OK | |
| Iter2 | J1 | 0.85 | 0.41 | 0.87 | 0.70 | OK |
| J2 | 0.85 | 0.63 | 0.87 | 0.74 | OK | |
| J3 | 0.90 | 0.44 | 0.92 | 0.80 | OK | |
| J4 | 0.90 | 0.66 | 0.92 | 0.79 | OK |
| Phase | No. | Mrd,req 1 | Mrd,act 2 | Continuity 3 | Double 4 | Check |
|---|---|---|---|---|---|---|
| Initial | P1 | 61.89 | Null 5 | Null | Null | NO |
| P2 | 31.46 | Null | Null | Null | NO | |
| P3 | 31.98 | 33.75 | 0 | 0 | OK | |
| P4 | 10.77 | 70.88 | 1 | 0 | OK | |
| Iter1 | P1 | 54.15 | Null | Null | Null | NO |
| P2 | 34.58 | 68.06 | 0 | 0 | OK | |
| P3 | 28.75 | 37.50 | 0 | 0 | OK | |
| P4 | 11.57 | 50.41 | 0 | 0 | OK | |
| Iter2 | P1 | 60.67 | 75.47 | 0 | 1 | OK |
| P2 | 32.90 | 68.06 | 0 | 0 | OK | |
| P3 | 29.22 | 37.50 | 0 | 0 | OK | |
| P4 | 10.95 | 50.41 | 0 | 0 | OK |
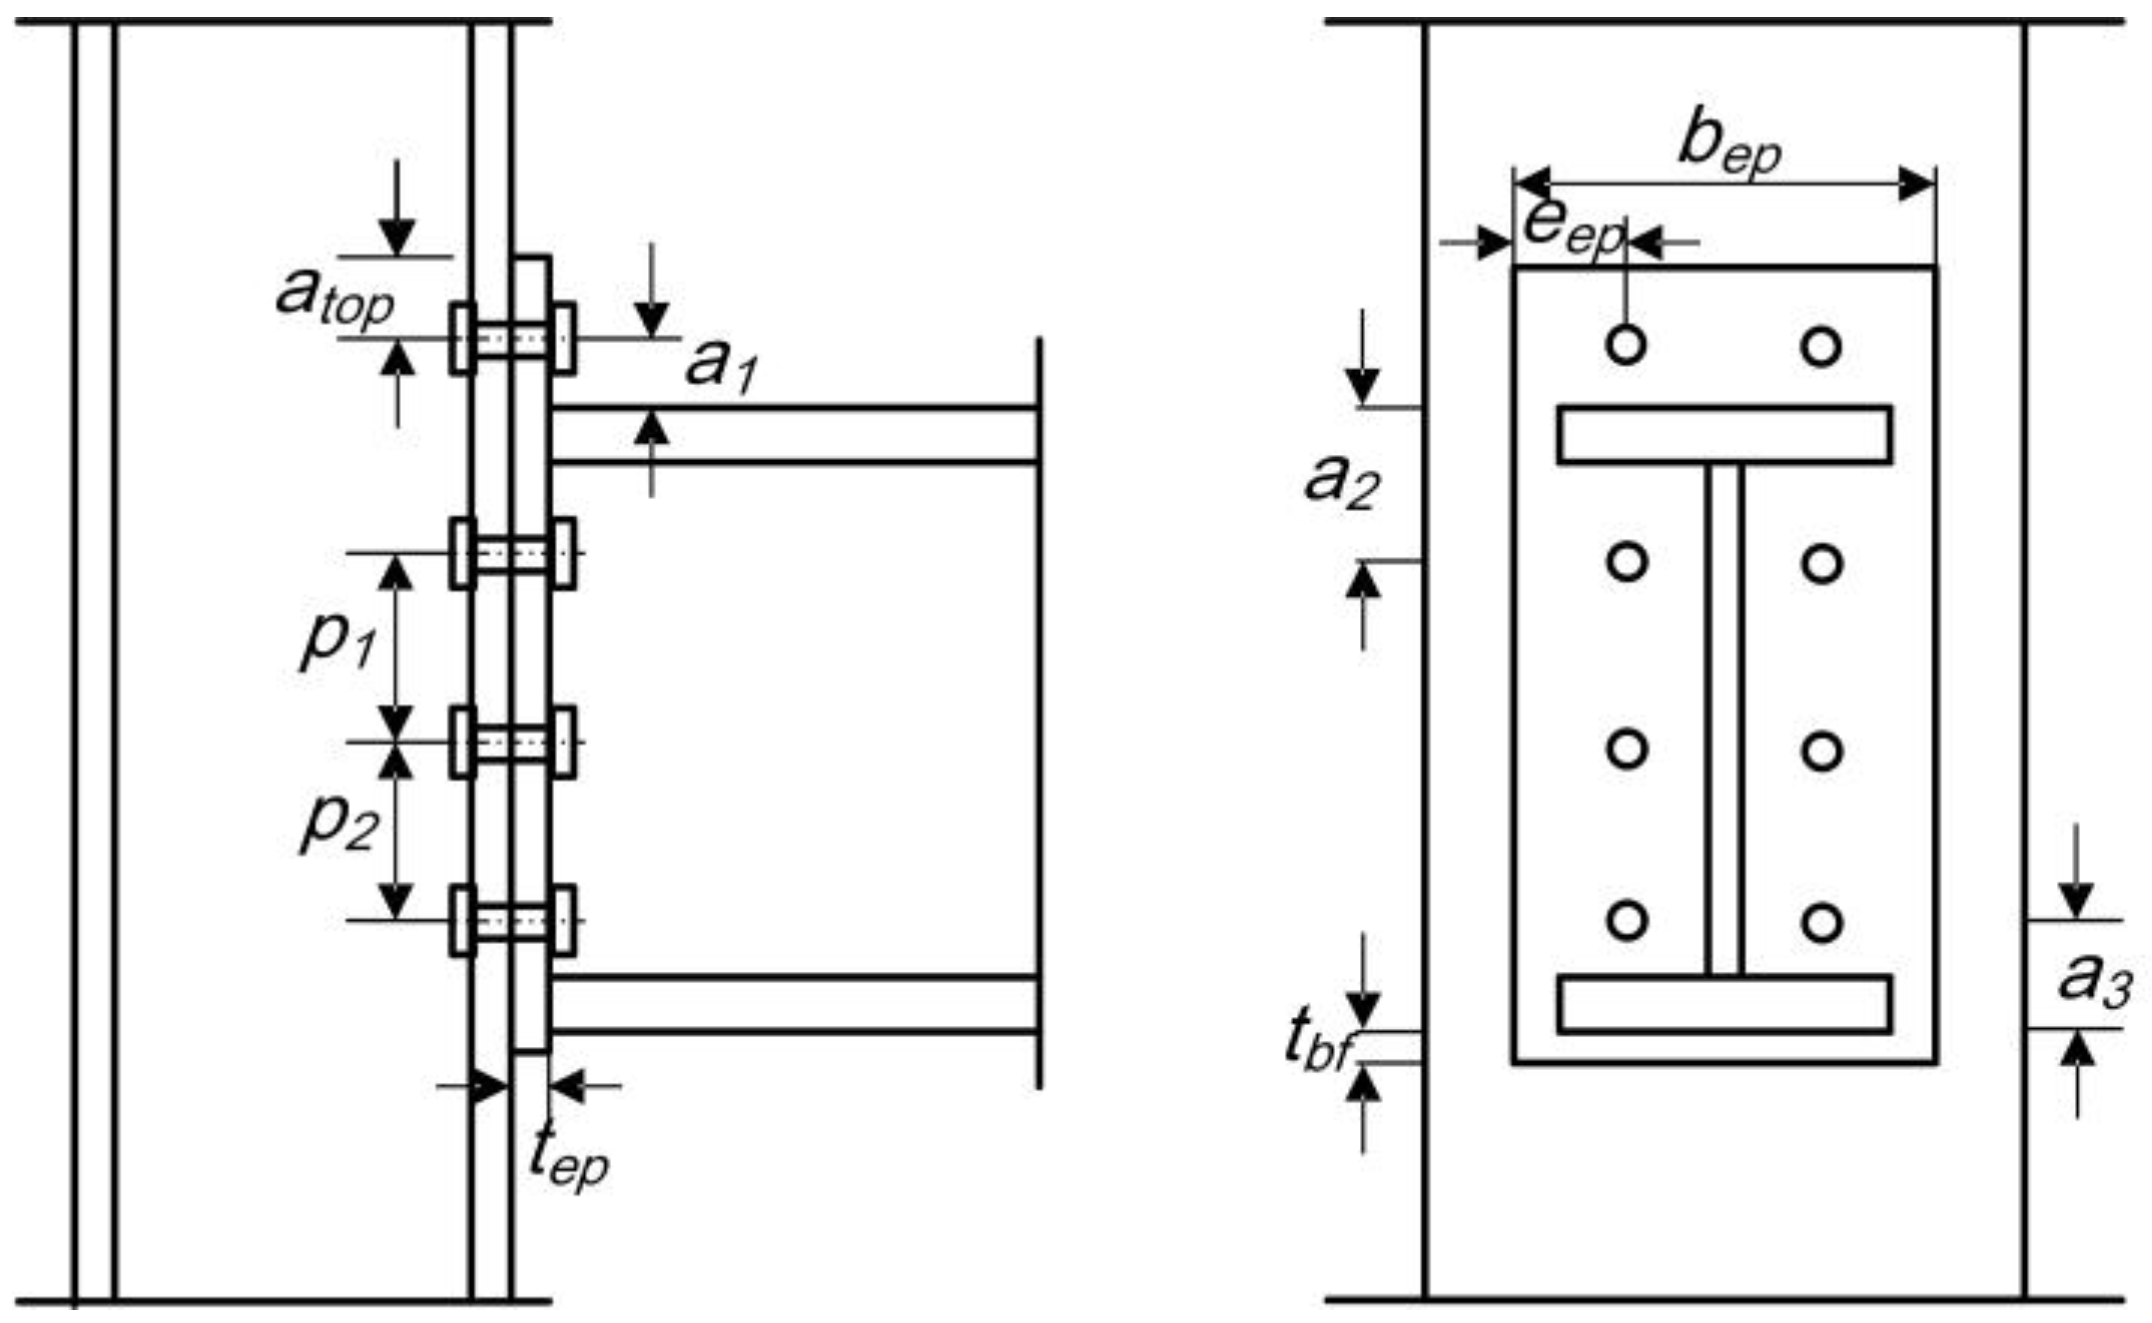
| Joint | Beam | Column | Bolt 1 | tep | bep | eep | atop | a1 | a2 | a3 |
|---|---|---|---|---|---|---|---|---|---|---|
| J1 | IPE270 | HEB140 | M20 | 10 | 136 | 28 | 65 | 27 | 59 | 50 |
| J2 | IPE270 | HEB160 | M20 | 10 | 155 | 37 | 77 | 27 | 55 | 48 |
| J3 | IPE200 | HEB140 | M20 | 10 | 140 | 35 | 59 | 48 | 42 | 35 |
| J4 | IPE200 | HEB160 | M20 | 10 | 149 | 38 | 28 | 46 | 36 | 44 |
| No. | Continuity Plate 1 | Double Plate 2 |
|---|---|---|
| P1 | Null 3 | 1 × 10 |
| P2 | Null | Null |
| P3 | Null | Null |
| P4 | Null | Null |
| Joint | Beam | Column | Bolt 1 | tep | bep | eep | atop | a1 | a2 | a3 | p1 | p2 | p3 |
|---|---|---|---|---|---|---|---|---|---|---|---|---|---|
| J1 | IPE360 | HE300B | M24 | 14 | 255 | 35 | 78 | 51 | 73 | 71 | 109 | 107 | Null 2 |
| J2 | IPE360 | HE900B | M30 | 16 | 270 | 69 | 83 | 76 | 59 | 73 | 142 | 86 | Null |
| J3 | IPE400 | HE300B | M24 | 14 | 295 | 50 | 52 | 47 | 59 | 46 | 86 | 132 | 77 |
| J4 | IPE400 | HE900B | M24 | 14 | 195 | 38 | 57 | 38 | 48 | 69 | 159 | 124 | Null |
| J5 | IPE400 | HE260B | M24 | 14 | 237 | 39 | 90 | 50 | 69 | 50 | 66 | 96 | 119 |
| J6 | IPE400 | HE500B | M24 | 14 | 270 | 41 | 67 | 49 | 49 | 60 | 117 | 89 | 85 |
| J7 | IPE400 | HE260B | M24 | 14 | 237 | 39 | 90 | 50 | 69 | 50 | 66 | 96 | 119 |
| J8 | IPE400 | HE500B | M24 | 14 | 270 | 41 | 67 | 49 | 49 | 60 | 117 | 89 | 85 |
| J9 | IPE400 | HE240B | M30 | 16 | 225 | 42 | 89 | 55 | 89 | 70 | 124 | 117 | Null |
| J10 | IPE400 | HE340B | M30 | 16 | 280 | 44 | 70 | 74 | 68 | 55 | 188 | 89 | Null |
| J11 | IPE400 | HE240B | M24 | 14 | 231 | 38 | 67 | 54 | 67 | 69 | 132 | 132 | Null |
| J12 | IPE400 | HE340B | M30 | 16 | 280 | 44 | 70 | 74 | 68 | 55 | 188 | 89 | Null |
| J13 | IPE360 | HE200B | M24 | 14 | 186 | 34 | 59 | 56 | 73 | 76 | 58 | 153 | Null |
| J14 | IPE360 | HE260B | M30 | 16 | 235 | 41 | 74 | 76 | 78 | 85 | 111 | 86 | Null |
| J15 | IPE360 | HE200B | M24 | 14 | 186 | 34 | 59 | 56 | 73 | 76 | 58 | 153 | Null |
| J16 | IPE360 | HE260B | M30 | 16 | 235 | 41 | 74 | 76 | 78 | 85 | 111 | 86 | Null |
| J17 | IPE360 | HE180B | M24 | 14 | 178 | 32 | 55 | 50 | 74 | 68 | 112 | 106 | Null |
| J18 | IPE360 | HE180B | M24 | 25 | 176 | 32 | 59 | 62 | 67 | 67 | 88 | 138 | Null |
| J19 | IPE270 | HE180B | M20 | 12 | 173 | 30 | 79 | 28 | 62 | 62 | 146 | Null | Null |
| J20 | IPE270 | HE180B | M20 | 12 | 173 | 30 | 79 | 28 | 62 | 62 | 146 | Null | Null |
| Label | Continuity Plate | Double Plate |
|---|---|---|
| P1 | 130 × 12 | Null |
| P2 | Null | Null |
| P3 | Null | Null |
| P4 | 132 × 14 | Null |
| P5 | Null | 1 × 10 |
| P6 | Null | Null |
| P7 | Null | 1 × 10 |
| P8 | Null | Null |
| P9 | 110 × 14 | Null |
| P10 | Null | Null |
| P11 | Null | 1 × 10 |
| P12 | Null | Null |
| P13 | 82 × 12 | Null |
| P14 | Null | Null |
| P15 | 82 × 12 | Null |
| P16 | Null | Null |
| P17 | Null | 1 × 10 |
| P18 | Null | Null |
| P19 | Null | Null |
| P20 | Null | Null |
Publisher’s Note: MDPI stays neutral with regard to jurisdictional claims in published maps and institutional affiliations. |
© 2022 by the authors. Licensee MDPI, Basel, Switzerland. This article is an open access article distributed under the terms and conditions of the Creative Commons Attribution (CC BY) license (https://creativecommons.org/licenses/by/4.0/).
Share and Cite
Yin, T.; Wang, Z.; Pan, J.; Zheng, K.; Liu, D.; Lu, S. A Design Method for Semi-Rigid Steel Frame via Pre-Established Performance-Based Connection Database. Buildings 2022, 12, 1634. https://doi.org/10.3390/buildings12101634
Yin T, Wang Z, Pan J, Zheng K, Liu D, Lu S. A Design Method for Semi-Rigid Steel Frame via Pre-Established Performance-Based Connection Database. Buildings. 2022; 12(10):1634. https://doi.org/10.3390/buildings12101634
Chicago/Turabian StyleYin, Tulong, Zhan Wang, Jianrong Pan, Kaixiang Zheng, Deming Liu, and Shengcan Lu. 2022. "A Design Method for Semi-Rigid Steel Frame via Pre-Established Performance-Based Connection Database" Buildings 12, no. 10: 1634. https://doi.org/10.3390/buildings12101634
APA StyleYin, T., Wang, Z., Pan, J., Zheng, K., Liu, D., & Lu, S. (2022). A Design Method for Semi-Rigid Steel Frame via Pre-Established Performance-Based Connection Database. Buildings, 12(10), 1634. https://doi.org/10.3390/buildings12101634