Abstract
With the development of metering technologies, data mining techniques such as machine learning have been increasingly used for the prediction of building energy consumption. Among various machine learning methods, the KNN algorithm was implemented to predict the hourly energy consumption of community buildings composed of several different types of buildings. Based on the input data set, 10 similar hourly energy patterns for each season in the historic data sets were chosen, and these 10 energy consumption patterns were averaged. The prediction results were analyzed quantitatively and qualitatively. The prediction results for the summer and fall were close to the energy consumption data, while the results for the spring and winter were higher than the energy consumption data. For accuracy, a similar trend was observed. The values of CVRMSE for the summer and fall were within the acceptable range of ASHRAE guidelines 14, while higher values of CVRMSE for the spring and winter were observed. In sum, the total values of CVRMSE were within the acceptable range.
1. Introduction
With notable concern for CO2 emission increases, energy consumption by buildings has been significantly increasing [1,2,3]. According to the “Energy Statistics Handbook in 2020” provided by the Korea Energy Agency, a large amount of energy is accounted for in building sectors [4]. Thus, much attention has been paid to a reduction of energy consumption by buildings in South Korea (hereafter Korea). There have been many attempts to reduce or optimize building energy consumption. Focusing on passive or active design strategies, many studies have performed investigations to improve energy efficiency in buildings by enhancing the thermal performance of building envelopes, replacing them with advanced mechanical systems or installing renewable energy systems [5,6,7,8,9,10,11,12,13]. While these design strategies have played an important role in building energy management, the effects on the reduction of building energy consumption vary from 3% to 10% of the total building energy consumption [14,15]. In addition, a better energy performance can be expected only when these design strategies are implemented in the early building design stage.
With the rapid development of information and communication technologies, building energy management and prediction becomes a fundamental key for improving energy efficiency as well as for reducing building energy consumption [16]. By implementing metering technologies, the specific information on building operation and energy consumption data are more available for analyses of understanding energy use behaviors in buildings [17]. The large amount of data (i.e., hourly or sub-hourly energy performance data, etc.) collected by some systems such as building automation systems and building energy management systems can be used to predict their dynamic interactions affecting building energy consumption [18,19]. For example, Jairo et al. have analyzed the interrelationship between the electrical loads of each space in relation to the total building energy consumption for a full week of operation from the data obtained by the energy management systems [20]. Similarly, Alam and Devjani have implemented the building management systems to obtain the data at 5 min interval for one year to analyze the energy patterns of educational buildings [21]. Thus, it is inevitable to understand a huge number of data sets of energy consumption for developing effective energy saving strategies.
Traditionally, statistical methods have been employed to handle sets of data for identifying the patterns of building energy consumption. However, it is difficult to handle a huge amount of data. According to the study by Fan et al., data mining techniques are effective to clarify the massive data sets [22]. Therefore, the present study exists to predict the energy consumption of buildings by utilizing the data mining technique. Three years (2018–2020) of energy consumption in community buildings were used to train the mining technique such as the KNN (K-nearest neighbor) algorithm. By recognizing data patterns through the calculation of distances between test and training data sets, the KNN method is increasingly used for the analysis of large historical data sets [23]. The community buildings were composed of offices, a gymnasium, exhibition hall, etc. The energy consumption data of the community buildings were collected. By implementing the KNN algorithm, the seasonal energy consumption patterns were identified by the KNN method. The clustered energy consumption patterns were averaged, and then, these averaged patterns were verified with the collected energy consumption data qualitatively and quantitatively. By using the suggested method in the present study, the energy consumption of buildings in a community can be forecasted faster than other machine learning techniques. Currently, much attention has been paid to energy-sharing strategies in community buildings [24,25,26]. Therefore, the prediction of energy consumption by the KNN algorithm can be helpful to develop effective energy-sharing strategies for community buildings.
2. Literature Review
The use of machine learning algorithms has been increasingly implemented to analyze data as well as to continuously learn judgments or predictions for the future [27]. In the case of building energy predictions, steady-state approaches such as averaged monthly or hourly calculation methods have been generally used instead of dynamic approaches due to high computational cost. In the comparison of the energy demand of buildings by energy simulations, Fantozzi et al. mentioned that dynamic approaches can provide more accurate prediction than those obtained by the average monthly calculation method [28]. The accuracy of the hourly model was also pointed out by the study of Ballarini et al. [29]. Considering this point, it is necessary to implement machine learning techniques for achieving the accuracy of the energy consumption prediction by handling a huge amount of data sets.
For the present study, the energy demand patterns were recognized by the machine learning methods. To identify energy usage patterns, clustering techniques have been commonly used, which are generally unsupervised learning techniques for recognizing inherent data patterns [30]. Typically, these clustering techniques can be categorized as several methods: partition, hierarchical, and density-based [31]. As one of the partitioning clustering algorithms, the K-means algorithm has been widely used in several studies for the energy pattern identification due to its high efficiency [30]. However, the use of K-means algorithm had difficultly handling massive time series of similar electric load profiles, and the calculation can be computationally expensive [32]. Considering these difficulties, several researchers proposed supervised data mining-based approaches. According to the study of Xiong and Yao, common supervised classification algorithms are Artificial Neural Networks (ANN), Support Vector Machine (SVM), K-nearest neighbor (KNN), and so on [27].
Among these algorithms, the ANN algorithm is the most typical regression and commonly used technique in which the concept of this algorithm resembles the human brain by using interconnected processors, but this method requires a large number of parameters and massive training data sets [33]. In the case of the SVM algorithm, it is widely applied for pattern classification, which computes the linear regression function [34,35]. However, it requires a large number of historical data sets and design inputs [36]. As one of the supervised machine learning algorithms, the KNN can be also used to recognize data patterns. Contrary to other machine learning algorithms, the KNN only defines the number of the nearest neighbors not requiring other parameters [27]. Because of these convenient issues, the KNN algorithm can be increasingly applied for pattern recognition. Several studies revealed the high accuracy and computational efficiency of the data classification by the KNN algorithm [37,38].
Generally, the KNN algorithm calculates the distance between test and training samples and then returns k closest samples by using the linear search method to find the exact k nearest neighbors [37]. This means that the KNN algorithm can map the relationship between independent and dependent variable spaces. The computational complexity of the KNN algorithm is proportional to the size of the training data set for each test sample [39,40]. The sample distance can be calculated by using the Minkowski distance equation [36]:
where xi and yi are the coordinates of the sample points in multidimensional space. d is the absolute distance (the Manhattan distance), when p is 1. When p is 2, d is the linear distance (the Euclidean distance). If the sample distribution is unbalanced, the KNN algorithm weighs points regarding the inverse of the distance to minimize the impact of the distance between the test and training samples [36]. For example, closer neighbors of a query point have a more significant impact on the result than farther neighbors [41]. Since the region of the k-neighborhood is determined by the values of k, the classification performance can be easily affected by outliers of the smaller or larger value of k [42]. In addition, the k data points closest to the test point can be obtained by calculating the distances [27]. Since the number k is the number of data points needed, the clustering model can be oversensitive to sample points near the test point, if the number k is too small. If it is too large, a poor clustering result can be produced [27]. The best number k can be determined by cross validation by considering its accuracy.
3. Methodology
In the present study, a prediction strategy based on the classification of hourly energy consumption patterns was proposed by using the KNN algorithm for several buildings in the A community buildings, where these buildings are located in Gyeonggi-do, South Korea (Figure 1). While most previous studies have focused on single building function such as residential or commercial buildings, this study focuses on energy consumption patterns of community buildings composed of different building types. The A community buildings include six different buildings such as office, auditorium, gymnasium, and so on. Three years (2018–2020) of hourly electricity consumption data obtained from i-SMART of Power planner in KEPCO were utilized [43]. These data were classified seasonally. For each season, the maximum daily energy consumption data of the A community buildings were identified. In addition, the daily weather data were recognized. By implementing the KNN algorithm, the energy consumption patterns for each season were identified and validated with the historic energy consumption data.

Figure 1.
The buildings in the A community.
3.1. Data Preparation
This study analyzed the hourly electricity data for three years (2018–2020) of the A community. Among these data, the hourly energy consumption data for two years (2018 and 2019) were used as training data sets, while the data for the year of 2020 were used as test data sets. In addition, three years of TMY weather data for the location of the A community buildings were used as input data. Table 1 shows the summary of the KNN method. The description of buildings in the community is presented in Table 2. The energy consumption of each building is presented in Table 3. As the area of the building increased, high energy consumption was observed. In the case of the community center, the energy consumption was higher than that of the auditorium, while the area of the community center was smaller than that of the auditorium. This can be caused by the longer building occupancy schedule of the community center. In addition, the total energy consumption in 2019 was slightly more increased than that in 2018 (about 2%), while about a 5% decrease in the total energy consumption was observed compared with that in 2020. This can be caused by limited personal and social activities by COVID-19.

Table 1.
Summary of the KNN algorithm.

Table 2.
Building description.

Table 3.
Energy consumption of the A community buildings.
As shown in Figure 2, the data collection began from 01 January 2018 to 31 December 2020. In general, the building energy consumption can be affected by some considerable factors such as building design variables, occupants’ behaviors, building systems operation and their efficiency, and climatic conditions [21]. For this study, the hourly electrical consumption data, mainly heating and cooling, were collected for each building, and then, these data were summed to reduce computational errors as well as to promote computational efficiency. As a result, 26,280 records were available, and these were broken down seasonally (Figure 3). Table 4 presents the seasonal energy consumption data of the community buildings for three years. Among the energy consumption data for three years, the biggest energy consumption was observed in 2019, and this trend was also shown in most seasons except for winter.

Figure 2.
Energy consumption of the A community buildings for three consecutive years.

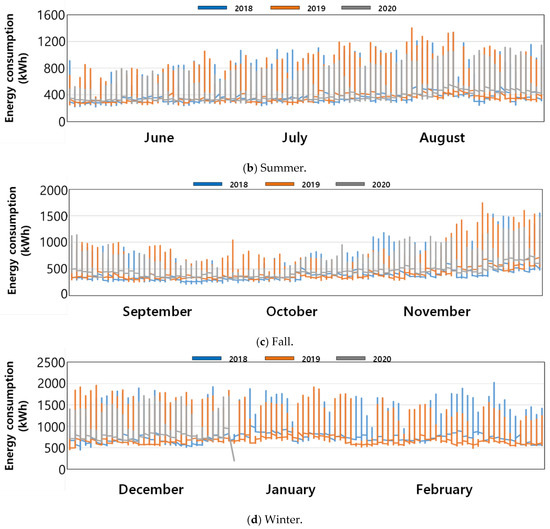
Figure 3.
Seasonal hourly energy consumption data of the A community buildings for three years.

Table 4.
Seasonal energy consumption and the hourly average of the A community buildings for three years.
Based on the hourly average energy consumption for each season, four dates were selected for each season. As shown in Figure 4, hourly energy consumption on the selected dates for three years are presented. Even though there was a little difference in energy consumption, similar patterns in each season for three years are observed visually, except for the spring season. Moreover, the daily weather data (outdoor temperature) and the cooling and heating energy consumption in each season for three years are presented in Figure 5. As presented, the energy consumption patterns for heating and cooling were different, but similar patterns within the heating and cooling were identified.
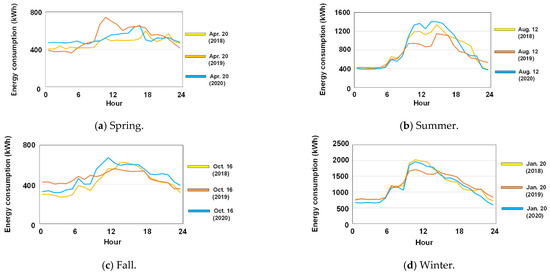
Figure 4.
Daily energy consumption for each season of the A community buildings for three years.
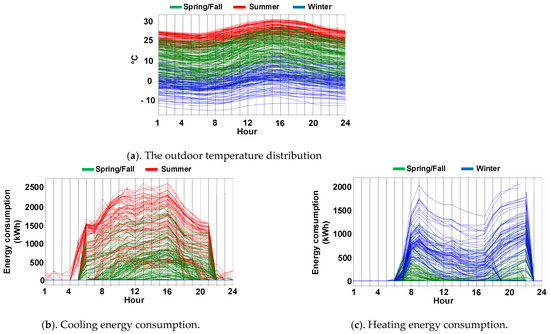
Figure 5.
Daily weather data and cooling and heating energy consumption for three years.
3.2. The KNN Algorithm
Generally, the proper number of k can be selected after some experiments by using an optimized tool [44]. In the present study, the distances between the patterns in the training data sets were computed to find the optimal number of k. Among the nearest patterns, the optimal number of k nearest patterns was extracted from the historical data sets. In addition, the weighed averaging values of each pattern were created for forecasting future values [45]. To assess the forecast model of electricity consumption pattern by the KNN algorithm, two performance assessments were employed: root mean square error (RMSE) and coefficient of variation of the root mean squared error (CVRMSE). While RMSE indicates the size of the variation, CVRMSE indicates the deviation degree of error of the training data for the comparison between different data sets [46]. These equations are expressed as Equations (2) and (3) [46]:
where Yi is the ith actual value, and is the ith predicted value. n is the total number of data in the KNN algorithm model.
4. Results
4.1. Forecasting Results
For the KNN algorithm, the periodicity of the variable was found (p = 24). Thus, the Euclidean distance was employed and calculated by Equation (1). First, the outdoor temperature patterns for each season were classified. As can be shown in Figure 6, 10 similar outdoor temperature patterns (i.e., the k number = 10) for two years (2018 and 2019) were identified based on test data on the selected dates for the year 2020. In the spring, 10 similar hourly outdoor temperature patterns for two years were chosen based on the daily outdoor temperature on 20 April in 2020 (blue curve). By averaging these chosen 10 outdoor temperature patterns, the prediction of the hourly outdoor temperature pattern for the spring was obtained (red curve). In a similar way, similar outdoor temperature patterns on the other seasons were classified for two years (2018 and 2019) based on the test data sets on the selected dates of 12 August, 16 October, and 20 January. As a result, it can be seen that the predictions for the summer, fall, and winter showed a similar pattern with the test data on these specific dates. In the case of spring, a somewhat difference of the outdoor temperature between the prediction and the test data on the specific date was observed.
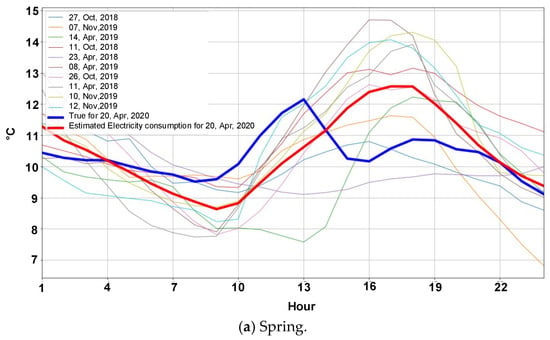
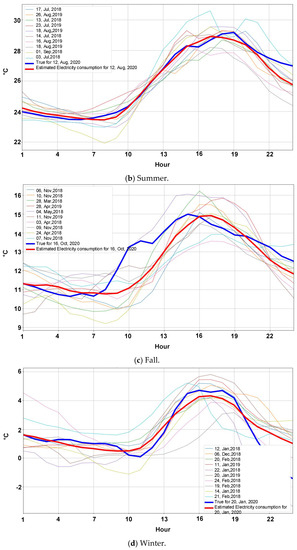
Figure 6.
The outdoor temperature patterns from the KNN algorithm.
As with the outdoor temperature prediction, the hourly energy consumption patterns for each season were identified (Figure 7). Based on the test data on 20 April in 2020 (Blue curve), 10 similar patterns in 2018 and 2019 were clustered for the spring season. The red curve presents the average value of the chosen 10 similar energy consumption patterns in 2018 and 2019. For the other seasons, 10 similar patterns based on the test data on specific dates were classified, and then, these were averaged. As shown in Figure 7, it can be seen that the test data on the selected dates in the summer and fall were close to the predicted energy consumptions by the KNN algorithm. While there was little difference in the energy consumption during the afternoon between the test data and the prediction in the winter, a similar pattern was observed. In the spring, a different pattern of energy consumption between the test data on the selected date and the prediction was observed. This was also observed in the outdoor temperature prediction in the spring.
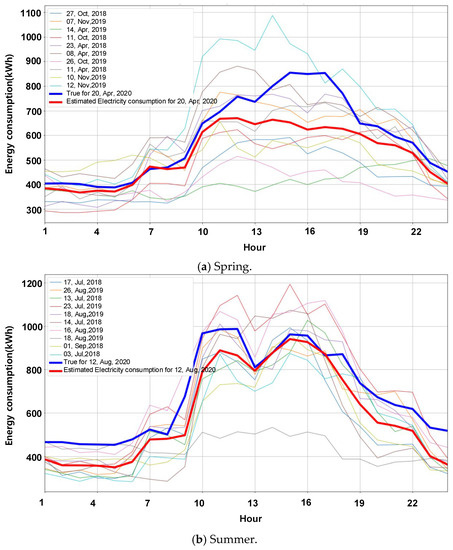
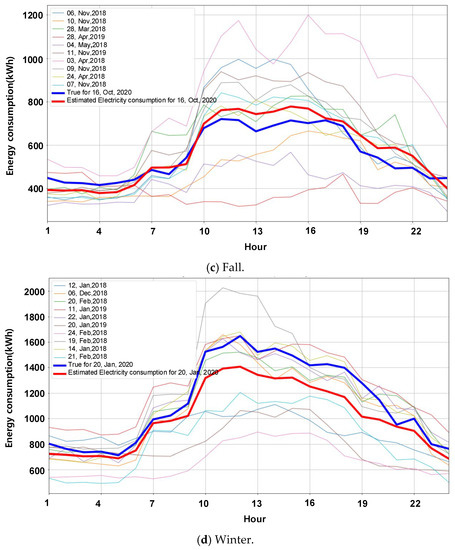
Figure 7.
Energy consumption patterns by the KNN algorithm.
4.2. Evaluation of Forecasting Accuracy by the KNN Method
Table 5 summarizes the forecasting accuracy by using the assessment indicators. As shown below, the RMSE and CVRMSE values of four seasons and the total energy consumption are presented. The RMSE and CVRMSE of the total energy consumption were 139.44 kWh and 24.15%, respectively. According to the ASHRAE guidelines 14, the acceptable range of the CVRMSE value can be differentiated as hourly, daily, and monthly [47]. By considering the hourly acceptable range of 30%, the CVRMSE values of the summer and fall were below 30%, while the values of the spring and winter were somewhat higher than or close to 30%. For the total energy consumption forecasting, the CVRMSE was below 30%.

Table 5.
Summary of the indicator for RMSE and CVRMSE.
5. Discussion
By using the KNN method, the energy consumption patterns of the community buildings including several building functions for two years were clustered. Based on the k value of 10, 10 hourly energy consumption profiles for each season were chosen. In addition, their averaging values (i.e., the prediction) were compared with the energy consumption data of the community buildings. Similar with the present study, building electrical demand was predicted by using the KNN algorithm in the study of Gomez-Omella et al. [45]. With 122 residential and small office buildings, they utilized two different versions of the KNN algorithm for an effective analysis of a large historical time series of electricity consumption data sets. While there was a little difference in the prediction results and computational efficiency between the two KNN algorithms, both the KNN methods provided good accuracy. In the case of the study by Liu et al., two step clustering approaches including density-based spatial clustering application and the k-means algorithm were used to identify daily electricity usage patterns of three office buildings [17]. However, it was difficult for the density-based clustering application to select the values of radius and the minimum number of observations, and the fast KNN algorithm was implemented. As shown in the results of the present study, the CVRMSE values of the prediction were somewhat higher than that obtained from the previous KNN studies. It can be seen that the overestimated value of the present study was caused by the different schedules and functions of the various types of buildings such as office, auditorium, gymnasium, and so on in the community buildings, while several studies focused on one or two different building functions. Moreover, the results predicted by the KNN method are presented in Table 6 by using the Mean Bias Error (MBE) (Equation (4)).
where Yi is the ith actual value and is the ith predicted value. n is the total number of data in the KNN algorithm model.

Table 6.
Summary of the indicator for the MBE.
Considering the acceptable error of the MBE (±10), the value of the spring was not acceptable, while the values of the summer and fall were acceptable. In the case of winter, the MBE value was slightly over the acceptable range. As observed in the CVRMSE values, spring carried the biggest prediction errors. It can be seen that the errors in the spring were caused by very irregular weather profiles in each year. This added greater probabilistic patterns to the prediction by the KNN method as opposed to the KNN predictions with clear weather characteristics of other seasons. As a result, this led to the overestimated MBE values in the total energy consumption prediction.
Moreover, the KNN algorithm was used for various purposes. For example, Xiong and Yao implemented this method to establish a personalized adaptive thermal comfort environment for occupants’ indoor environmental preferences [27]. In their study, the KNN-based thermal comfort model proved to have good accuracy after a large amount of data training. In addition, they calculated the distance for the parameters of the thermal comfort. Martinez et al. used the KNN method to handle time series patterns seasonally [44]. They applied different KNN schemes for different seasons. For the chiller system optimization, Ho and Yu utilized the KNN regression to discover optimal strategies [48]. Using the k number of 3, the design parameters were selected to identify specific strategies to the existing chiller system. Most previous studies pointed out the importance of the k number since the classification performance is quite affected by the k number [36]. For the present study, the k value was 10. To find the best k value, several k values were investigated. However, the k numbers above 10 were not investigated due to computational efficiency. In addition, the authors in the previous studies also stated that different scale combinations can influence the accuracy of forecasting. Even though hourly energy consumption for two years was used for the study, this seemed to be insufficient in that the overestimated CVRMSE values for some seasons were obtained. For further study, it is required to consider the prediction performance by different distances and different KNN schemes for better accurate prediction. In addition, it is also necessary to compare the prediction results with other machine learning techniques with the same data used for the present study.
By training three years of energy consumption data sets with weather parameters, the KNN method clustered similar patterns of energy consumptions with them in 2020. Even though it seemed that the predicted results were overestimated, this can be overcome with more historic data sets. In addition, it can be seen that the data sets were classified where similar weather characteristics were observed. Thus, it can expected to predict building energy consumption in more than a year with the data sets of weather information.
6. Conclusions
As with the development of mining techniques, the use of machine learning methods has been significantly increased. For the present study, the hourly energy consumption data were predicted by the machine learning technique, especially the KNN algorithm, which explores the whole training data sets for clustering based on the input test sample. Thus, the energy consumption pattern classification by using the KNN algorithm can recognize each pattern and then provide targeted predictions within each pattern. By using three years of hourly energy consumption data, the hourly energy consumption of the A community buildings composed of several types of buildings was predicted by the KNN algorithm.
The outcomes of the study were as follows:
- (a)
- For the KNN algorithm, the periodicity of the variable was set at 24. Thus, Euclidean distance was chosen for clustering the hourly energy consumptions for each season.
- (b)
- By investigating several k numbers, 10 was selected. Using this k number, 10 similar hourly energy consumption patterns for two years (2018 and 2019) were clustered based on the test data on seasonal specific dates in 2020. Then, these 10 clustered hourly energy consumption patterns were averaged for the prediction. As a result, the averaged energy consumption for the summer and fall were close to the test data, while the prediction results of the spring and winter were a little higher than the test data.
- (c)
- The accuracy of the prediction by using the KNN method was assessed by the RMSE and CVRMSE quantitatively. The CVRMSE values of the summer and fall ranged from 12–13%, which was within the acceptable range provided by ASHRAE guidelines 14. In the case of spring and winter, the values of CVRMSE were higher than 30% or close. In sum, the total CVRMSE was about 24%.
Considering the outcome of the present study, the total value of CVRMSE was within the acceptable range of ASHRAE guidelines 14. However, the CVRMSE values of the prediction results were still high in that the accuracy seemed to be overestimated. This can be caused by insufficient historic data sets and design inputs of the various types of buildings in the A community buildings. Further study will include design inputs of various building functions for more accurate prediction by using the KNN method. Moreover, it is necessary to compare the prediction results with other machine learning techniques to enhance the accuracy of the KNN method. As shown in the results, the prediction by using the KNN algorithm was obtained with three years of energy consumption data of the community buildings composed of various building functions. By improving the accuracy, the suggested method can be implemented to develop energy sharing strategies for the community buildings.
Author Contributions
G.H. contributed to the concept and design of the research and drafted the manuscript. G.-S.C., J.-Y.E. and H.S.L. collected and analyzed the data. D.D.K. wrote the manuscript. All authors have read and agreed to the published version of the manuscript.
Funding
This work is supported by the Korea Agency for Infrastructure Technology Advancement (KAIA) grant funded by the Ministry of Land, Infrastructure and Transport (grant RS-2019-KA153277).
Data Availability Statement
Not applicable.
Conflicts of Interest
The authors declare no conflict of interest.
References
- Oh, M.; Jang, K.M.; Kim, Y. Empirical analysis of building energy consumption and urban form in a large city: A case of seoul, south korea. Energy Build. 2021, 245, 111046. [Google Scholar] [CrossRef]
- Lei, L.; Chen, W.; Wu, B.; Chen, C.; Liu, W. A building energy consumption prediction model based on rough set theory and deep learning algorithms. Energy Build. 2021, 240, 110886. [Google Scholar] [CrossRef]
- Pi, Z.X.; Li, X.H.; Ding, Y.M.; Zhao, M.; Liu, Z.X. Demand response scheduling algorithm of the economic energy consumption in buildings for considering comfortable working time and user target price. Energy Build. 2021, 250, 111252. [Google Scholar] [CrossRef]
- Agency, K.E. Energy Statistics Handbook. 2020. Available online: https://www.Energy.Or.Kr/web/kem_home_new/new_main.Asp (accessed on 7 September 2022).
- Calero, M.; Alameda-Hernandez, E.; Fernández-Serrano, M.; Ronda, A.; Martín-Lara, M.Á. Energy consumption reduction proposals for thermal systems in residential buildings. Energy Build. 2018, 175, 121–130. [Google Scholar] [CrossRef]
- Golbazi, M.; Aktas, C.B. Energy efficiency of residential buildings in the U.S.: Improvement potential beyond iecc. Build. Environ. 2018, 142, 278–287. [Google Scholar] [CrossRef]
- Park, B.; Srubar, W.V.; Krarti, M. Energy performance analysis of variable thermal resistance envelopes in residential buildings. Energy Build. 2015, 103, 317–325. [Google Scholar] [CrossRef]
- Hachem-Vermette, C. Multistory building envelope: Creative design and enhanced performance. Sol. Energy 2018, 159, 710–721. [Google Scholar] [CrossRef]
- Athienitis, A.K.; Barone, G.; Buonomano, A.; Palombo, A. Assessing active and passive effects of façade building integrated photovoltaics/thermal systems: Dynamic modelling and simulation. Appl. Energy 2018, 209, 355–382. [Google Scholar] [CrossRef]
- Zhang, R.; Nie, Y.; Lam, K.P.; Biegler, L.T. Dynamic optimization based integrated operation strategy design for passive cooling ventilation and active building air conditioning. Energy Build. 2014, 85, 126–135. [Google Scholar] [CrossRef]
- Huide, F.; Xuxin, Z.; Lei, M.; Tao, Z.; Qixing, W.; Hongyuan, S. A comparative study on three types of solar utilization technologies for buildings: Photovoltaic, solar thermal and hybrid photovoltaic/thermal systems. Energy Convers. Manag. 2017, 140, 1–13. [Google Scholar] [CrossRef]
- McLarty, D.; Brouwer, J.; Ainscough, C. Economic analysis of fuel cell installations at commercial buildings including regional pricing and complementary technologies. Energy Build. 2016, 113, 112–122. [Google Scholar] [CrossRef]
- Gautam, K.R.; Andresen, G.B. Performance comparison of building-integrated combined photovoltaic thermal solar collectors (bipvt) with other building-integrated solar technologies. Sol. Energy 2017, 155, 93–102. [Google Scholar] [CrossRef]
- Kim, D.-B.; Kim, D.D.; Kim, T. Energy performance assessment of hvac commissioning using long-term monitoring data: A case study of the newly built office building in south korea. Energy Build. 2019, 204, 109465. [Google Scholar] [CrossRef]
- Suh, H.S.; Kim, D.D. Energy performance assessment towards nearly zero energy community buildings in south korea. Sustain. Cities Soc. 2019, 44, 488–498. [Google Scholar] [CrossRef]
- Capozzoli, A.; Piscitelli, M.S.; Brandi, S.; Grassi, D.; Chicco, G. Automated load pattern learning and anomaly detection for enhancing energy management in smart buildings. Energy 2018, 157, 336–352. [Google Scholar] [CrossRef]
- Liu, X.; Ding, Y.; Tang, H.; Xiao, F. A data mining-based framework for the identification of daily electricity usage patterns and anomaly detection in building electricity consumption data. Energy Build. 2021, 231, 110601. [Google Scholar] [CrossRef]
- Yu, Z.; Fung, B.C.M.; Haghighat, F. Extracting knowledge from building-related data—A data mining framework. Build. Simul. 2013, 6, 207–222. [Google Scholar] [CrossRef]
- Ding, Y.; Brattebø, H.; Nord, N. A systematic approach for data analysis and prediction methods for annual energy profiles: An example for school buildings in norway. Energy Build. 2021, 247, 111160. [Google Scholar] [CrossRef]
- Diaz-Acevedo, J.A.; Grisales-Noreña, L.F.; Escobar, A. A method for estimating electricity consumption patterns of buildings to implement energy management systems. J. Build. Eng. 2019, 25, 100774. [Google Scholar] [CrossRef]
- Alam, M.; Devjani, M.R. Analyzing energy consumption patterns of an educational building through data mining. J. Build. Eng. 2021, 44, 103385. [Google Scholar] [CrossRef]
- Fan, C.; Xiao, F.; Li, Z.; Wang, J. Unsupervised data analytics in mining big building operational data for energy efficiency enhancement: A review. Energy Build. 2018, 159, 296–308. [Google Scholar] [CrossRef]
- Yoon, Y.R.; Lee, Y.R.; Kim, S.H.; Kim, J.W.; Moon, H.J. A non-intrusive data-driven model for detailed occupants’ activities classification in residential buildings using environmental and energy usage data. Energy Build. 2022, 256, 111699. [Google Scholar] [CrossRef]
- Li, Y.; Hu, S.; Hoare, C.; O’Donnell, J.; García-Castro, R.; Vega-Sánchez, S.; Jiang, X. An information sharing strategy based on linked data for net zero energy buildings and clusters. Autom. Constr. 2021, 124, 103592. [Google Scholar] [CrossRef]
- Henni, S.; Staudt, P.; Weinhardt, C. A sharing economy for residential communities with pv-coupled battery storage: Benefits, pricing and participant matching. Appl. Energy 2021, 301, 117351. [Google Scholar] [CrossRef]
- Herenčić, L.; Kirac, M.; Keko, H.; Kuzle, I.; Rajšl, I. Automated energy sharing in mv and lv distribution grids within an energy community: A case for croatian city of križevci with a hybrid renewable system. Renew. Energy 2022, 191, 176–194. [Google Scholar] [CrossRef]
- Xiong, L.; Yao, Y. Study on an adaptive thermal comfort model with k-nearest-neighbors (knn) algorithm. Build. Environ. 2021, 202, 108026. [Google Scholar] [CrossRef]
- Fantozzi, F.; Romeo, C.; Salvadori, G.; Leccese, F.; Gazzarri, F. Simulation of the annual energy demand of buildings through averaged monthly and hourly calculation methods: A comparative analysis. Build. Simul. Conf. Proc. 2019, 6, 3839–3846. [Google Scholar]
- Ballarini, I.; Costantino, A.; Fabrizio, E.; Corrado, V. The dynamic model of en iso 52016-1 for the energy assessment of buildings compared to simplified and detailed simulation methods. In Proceedings of the Building Simulation 2019, Rome, Italy, 2–4 September 2019; pp. 3847–3854. [Google Scholar]
- Rajabi, A.; Eskandari, M.; Ghadi, M.J.; Li, L.; Zhang, J.; Siano, P. A comparative study of clustering techniques for electrical load pattern segmentation. Renew. Sustain. Energy Rev. 2020, 120, 109628. [Google Scholar] [CrossRef]
- Aghabozorgi, S.; Seyed Shirkhorshidi, A.; Ying Wah, T. Time-series clustering—A decade review. Inf. Syst. 2015, 53, 16–38. [Google Scholar] [CrossRef]
- Verleysen, M.; François, D. The curse of dimensionality in data mining and time series prediction. In Computational Intelligence and Bioinspired Systems; Cabestany, J., Prieto, A., Sandoval, F., Eds.; Springer: Berlin/Heidelberg, Germany, 2005; pp. 758–770. [Google Scholar]
- Mohandes, S.R.; Zhang, X.; Mahdiyar, A. A comprehensive review on the application of artificial neural networks in building energy analysis. Neurocomputing 2019, 340, 55–75. [Google Scholar] [CrossRef]
- Ring, M.; Eskofier, B.M. An approximation of the gaussian rbf kernel for efficient classification with svms. Pattern Recognit. Lett. 2016, 84, 107–113. [Google Scholar] [CrossRef]
- Santolamazza, A.; Cesarotti, V.; Introna, V. Anomaly detection in energy consumption for condition-based maintenance of compressed air generation systems: An approach based on artificial neural networks. IFAC-Pap. 2018, 51, 1131–1136. [Google Scholar] [CrossRef]
- Han, H.; Zhang, Z.; Cui, X.; Meng, Q. Ensemble learning with member optimization for fault diagnosis of a building energy system. Energy Build. 2020, 226, 110351. [Google Scholar] [CrossRef]
- Deng, Z.; Zhu, X.; Cheng, D.; Zong, M.; Zhang, S. Efficient knn classification algorithm for big data. Neurocomputing 2016, 195, 143–148. [Google Scholar] [CrossRef]
- Wang, Z.; Parkinson, T.; Li, P.; Lin, B.; Hong, T. The squeaky wheel: Machine learning for anomaly detection in subjective thermal comfort votes. Build. Environ. 2019, 151, 219–227. [Google Scholar] [CrossRef]
- Xindong, W.; Shichao, Z. Synthesizing high-frequency rules from different data sources. IEEE Trans. Knowl. Data Eng. 2003, 15, 353–367. [Google Scholar] [CrossRef]
- Wu, X.; Zhang, C.; Zhang, S. Database classification for multi-database mining. Inf. Syst. 2005, 30, 71–88. [Google Scholar] [CrossRef]
- Wylie, T.; Schuh, M.A.; Angryk, R.A. Enabling high-dimensional range queries using knn indexing techniques: Approaches and empirical results. J. Comb. Optim. 2016, 32, 1107–1132. [Google Scholar] [CrossRef]
- Gou, J.; Du, L.; Zhang, Y.; Xiong, T. A new distance-weighted k-nearest neighbor classifier. J. Inf. Comput. Sci. 2012, 9, 1429–1436. [Google Scholar]
- I-Smart, Power Planner, Kepco. Available online: https://home.kepco.co.kr/kepco/main.do (accessed on 7 September 2022).
- Martínez, F.; Frías, M.P.; Pérez-Godoy, M.D.; Rivera, A.J. Dealing with seasonality by narrowing the training set in time series forecasting with knn. Expert Syst. Appl. 2018, 103, 38–48. [Google Scholar] [CrossRef]
- Gómez-Omella, M.; Esnaola-Gonzalez, I.; Ferreiro, S.; Sierra, B. K-nearest patterns for electrical demand forecasting in residential and small commercial buildings. Energy Build. 2021, 253, 111396. [Google Scholar] [CrossRef]
- Dong, Z.; Liu, J.; Liu, B.; Li, K.; Li, X. Hourly energy consumption prediction of an office building based on ensemble learning and energy consumption pattern classification. Energy Build. 2021, 241, 110929. [Google Scholar] [CrossRef]
- American Society of Heating, Refrigerating and Air Conditioning Engineers. Ashrae Guideline 14-2002, Measurement of Energy and Demand Savings—Measurement of Energy, Demand and Water Savings. 2002. Available online: https://webstore.ansi.org/Standards/ASHRAE/ashraeguideline142002 (accessed on 7 September 2022).
- Ho, W.T.; Yu, F.W. Chiller system optimization using k nearest neighbour regression. J. Clean. Prod. 2021, 303, 127050. [Google Scholar] [CrossRef]
Publisher’s Note: MDPI stays neutral with regard to jurisdictional claims in published maps and institutional affiliations. |
© 2022 by the authors. Licensee MDPI, Basel, Switzerland. This article is an open access article distributed under the terms and conditions of the Creative Commons Attribution (CC BY) license (https://creativecommons.org/licenses/by/4.0/).