Article

Machine Learning Models for Predicting Shear Strength and Identifying Failure Modes of Rectangular RC Columns

Department of Civil Engineering, Vinh University, Vinh 461010, Vietnam
*
Author to whom correspondence should be addressed.
Buildings 2022, 12(10), 1493; https://doi.org/10.3390/buildings12101493
Submission received: 13 July 2022 / Revised: 20 August 2022 / Accepted: 14 September 2022 / Published: 20 September 2022

Abstract

:
The determination of shear strength and the identification of potential failure modes are the crucial steps in designing and evaluating the structural performance of reinforced concrete (RC) columns. However, the current design codes and guidelines do not clearly provide a detailed procedure for governing failure types of RC columns. This study predicted the shear strength and identified the failure modes of rectangular RC columns using various Machine Learning (ML) models. Six ML models, including Multivariate Adaptive Regression Splines (MARSs), Naïve Bayes (NBs), K-nearest Neighbors (KNNs), Decision Tree (DT), Support Vector Machine (SVM), and Artificial Neural Network (ANN), were developed to calculate the shear strength and to classify the failure modes of rectangular RC columns. A total of 541 experimental data samples were collected from literature and utilized for developing the ML models. The results reveal that the ANN and KNNs models outperformed other ML models in predicting the shear strength of rectangular RC columns with the R 2 value larger than 0.99. Additionally, the KNNs model achieved the highest accuracy, mostly 100%, for identifying the failure modes of rectangular RC columns. Based on the superior performance of the ANN and KNNs models, a graphical user interface was also developed to rapidly predict the shear strength and failure modes of rectangular RC columns.

1. Introduction

Rectangular reinforced concrete (RC) columns have been widely used in civil engineering structures. The columns are key components in ensuring the global safety of the structures. Calculating the shear strength and identifying the failure modes of such columns are crucial problems in the design process and structural analyses. Numerous experimental studies reported that the RC column could be failed in flexure, shear, or combined flexure–shear, depending on input design parameters.
Practical formulas for calculating the shear strength of RC columns were specified in design codes, such as ASCE/SEI-41-06 [1], ACI 318 [2], Eurocode-8 (EC-8) [3], CSA [4], and FEMA 273 [5]. Furthermore, many studies proposed equations for estimating the shear strength of RC columns [6,7,8,9,10,11,12]. However, a discrepancy was observed in comparing experimental tests and equations in the codes and published studies [13,14,15,16]. Additionally, several proposed formulas in previous works were limited in specific cases, such as short rectangular RC columns [17] and low transversal reinforcement [12]. Few models were even difficult in application practices since they contain many coefficients [18].
To overcome these drawbacks, Machine Learning (ML) techniques have been employed. Various studies applied ML models for predicting structural capacity and response of RC columns and beams [19,20,21,22,23,24,25,26,27,28,29,30,31]. Inel [19] estimated the ultimate flexure deformation of rectangular RC columns using Artificial Neural Networks (ANNs). A total of 237 data samples were used to construct the ANN model, which showed superior performance to other empirical equations. The flexure moment capacity of spiral RC columns was predicted using an Adaptive Fuzzy Inference System (ANFIS) model [20] and neural networks combined with particle swarm and Harris Hawks optimization techniques [21]. They proved that those ML models estimated the moment capacity with high precision. Recently, Feng et al. [22] employed the adaptive boosting model to predict the plastic hinge length of RC columns, in which 133 data sets were utilized. Lee et al. [23] collected 210 experimental tests to propose empirical equations for estimating the lumped plasticity model of circular RC columns using regression techniques. Aldabagh et al. [24] proposed simplified equations for predicting drift limits of circular RC bridge columns based on ML-based symbolic regression. Recently, Quaranta et al. [32] developed hybrid models combining mechanical concepts with machine learning-calibrated coefficients for improving shear strength equations of reinforced concrete members. They demonstrated that the accuracy of updated equations was significantly enhanced. Moreover, some studies utilized ML models to estimate the shear strength of circular [13,14,15,25] and rectangular RC columns [16,17,25,26]. However, they stated that a wide range of ML algorithms should be investigated and the number of data samples should be increased. Additionally, the previously developed ML models were not transferred to practical tools (e.g., mathematical formulas or graphical user interface), which can be used in design problems. Therefore, it will be very challenging to apply those ML models for practice. In addition, the influence of input variables on the predicted shear strength was not investigated systematically.
Normally, three typical failure modes of RC columns are observed under seismic loading [26,33]:
(1) Flexure failure: degradation of lateral load capacity occurred due to flexural deformation after yielding of the longitudinal reinforcing bar. This is the ductile failure, and it has a visible warning before losing capacity. In other words, it is the expected failure type in the design of the columns.
(2) Shear failure: degradation of lateral load capacity occurred due to shear distress (diagonal cracks) before yielding of the longitudinal reinforcing bar. This is the brittle failure and an unexpected type. It should be avoided in the design procedure.
(3) Flexure–shear failure: degradation of lateral load capacity occurred after yielding of the longitudinal reinforcing bar but results from shear distress.
In the last decades, the identification of the failure modes of RC columns has used conventional methods, such as the shear aspect ratio, shear strength ratio, and ductility factor. A very simplified indicator is the column aspect ratio, a / d (i.e., shear span—to-effective depth ratio) [34]. If a / d 4 , the column fails in flexure; if 2 < a / d < 4 , a flexure–shear failure is governed; otherwise, the shear failure is dominated if a / d 2 . Nevertheless, this approach does not consider the influence of material properties and reinforcement details [26]. Another parameter, the shear strength ratio ( V r ), which is defined as the ratio of the shear demand to shear capacity, has also been utilized for estimating the failure modes of rectangular RC columns [34,35]. The column fails in shear if V r > 1; the column suffers a flexure failure if V r ≤ 0.6; otherwise, a flexure–shear failure is governed. However, it was stated that this method predicted failure modes of RC columns less accurately [34,36]. Moreover, Ghee et al. [37] employed the displacement ductility factor ( μ ) to classify failure types of circular RC columns. If μ ≥ 6, the column fails in flexure; a ductile–shear failure can be experienced if 2 < μ < 6, and otherwise if μ ≤ 2, a shear failure is dominated. Nevertheless, a small data set was used; this approach is not suggested to apply for a wide range of columns. Additionally, the variation of calculated capacity and predicted failure is significant due to the complexity of mechanism.
To improve the prediction, Qi et al. [37] classified failure models of RC columns using the Fisher discriminant analysis. They gathered 111 tests of circular RC columns to derive the statistic method. However, a limited accuracy was shown for the flexure–shear failure mode. Ning and Feng [38] developed a probabilistic indicator to classify the failure mode of solid rectangular RC columns. For that, an explicit expression was derived using the simplified truss-and-arch model accounting for flexural and shear models, in which five unknown parameters were involved. However, given the complexity of failure mechanisms, prevailing uncertainties, and subjective definition of thresholds in the proposed modeling [38], the predicted failure modes were not perfectly consistent with the experimental data provided by Berry et al. [39] and Zhu et al. [33].
So far, several studies have applied ML techniques to identify the failure modes of RC columns. Mangalathu and Jeon [40] predicted failure modes of circular RC bridge piers based on six ML models, which were established based on 311 experimental results. They pointed out that ANN was the optimal approach among the investigated ML models. Feng et al. [26] applied various single and ensemble learning algorithms to classify failure modes and to predict the bearing capacity of rectangular RC columns using 254 test data samples. As a result, the adaptive boosting algorithm demonstrated better performance for classifying failures than other single learning techniques. Mangalathu et al. [41] employed the random forest model and the SHapley Additive exPlanation (SHAP) method [42] to predict failure modes of spiral RC columns. They concluded that the used methods provided an accuracy of 84% in identifying failure modes of the columns. Recently, Naderpour et al. [43] utilized ANN and Decision Tree (DT) models to predict failure modes of RC columns, in which 163 and 253 data sets were considered for spiral and rectangular RC columns, respectively. The aforesaid studies emphasized the high precision of ML techniques in identifying failure modes of RC columns. However, practical tools, such as mathematical equations or the graphical user interface, were not developed for design purposes.
This study employs six ML models to predict the shear strength and identify failure modes of rectangular RC columns. A total of 541 experimental data samples were selected to train the ML models. Six used ML models include Multivariate Adaptive Regression Splines (MARSs), DT, K-Nearest Neighbors (KNNs), Support Vector Machine (SVM), ANN, and Naïve Bayes (NBs). Among these, the MARSs, KNNs, DT, SVM, and ANN models were used for predicting the shear strength; meanwhile, the NBs, KNNs, DT, and SVM models are used for classifying failure modes. The optimal ML model was recognized, and then practical tools (i.e., mathematical equation and the graphical user interface) were developed for convenient design purposes of rectangular RC columns. Additionally, the effects of input parameters on the shear strength of RC columns are investigated in this study.

2. Data Collection

A significant database should be used in developing ML models to cover a wide range of input parameters of RC columns, such as geometric dimensions, material properties, and axial load effects. Additionally, the large enough sample size also enables the accuracy of prediction. A total of 541 experimental data sets of rectangular RC columns were extensively collected from the study of Ghannoum et al. [44] and other studies [45,46,47,48,49,50,51,52,53,54,55,56,57,58,59,60,61,62,63,64,65,66,67,68,69,70,71,72,73,74,75,76,77,78,79,80,81,82,83,84,85,86,87,88,89,90,91,92,93,94,95,96,97,98,99,100,101,102,103]. Ten input parameters, including geometric dimensions, reinforcing bar details, material properties, and axial load, need to be provided to estimate the shear strength and identify the failure mode of the RC columns. Geometric dimensions include the height of the column ( L ), the width of the cross-section ( B ), and the length of the cross-section ( H ). It is worth noting that the aspect ratio of columns ( L / B ) is varied from 1.1 to 15.3, covering short and slender RC columns. Reinforcement details contain the longitudinal reinforcement ratio ( ρ l ) , the transversal reinforcing bar ratio ( ρ h ) , and the spacing of the transversal reinforcements ( s ). Material properties comprise the yield strength of the longitudinal ( f y l ) and transversal ( f y h ) reinforcing bars and the compressive strength of the concrete ( f c ). The values of f c are ranged from 20 MPa to a high compressive strength of 140 MPa. Moreover, the effects of the centric axial load ( P ) are considered in the data sets, in which the axial compression ratio is varied from zero to 90%.
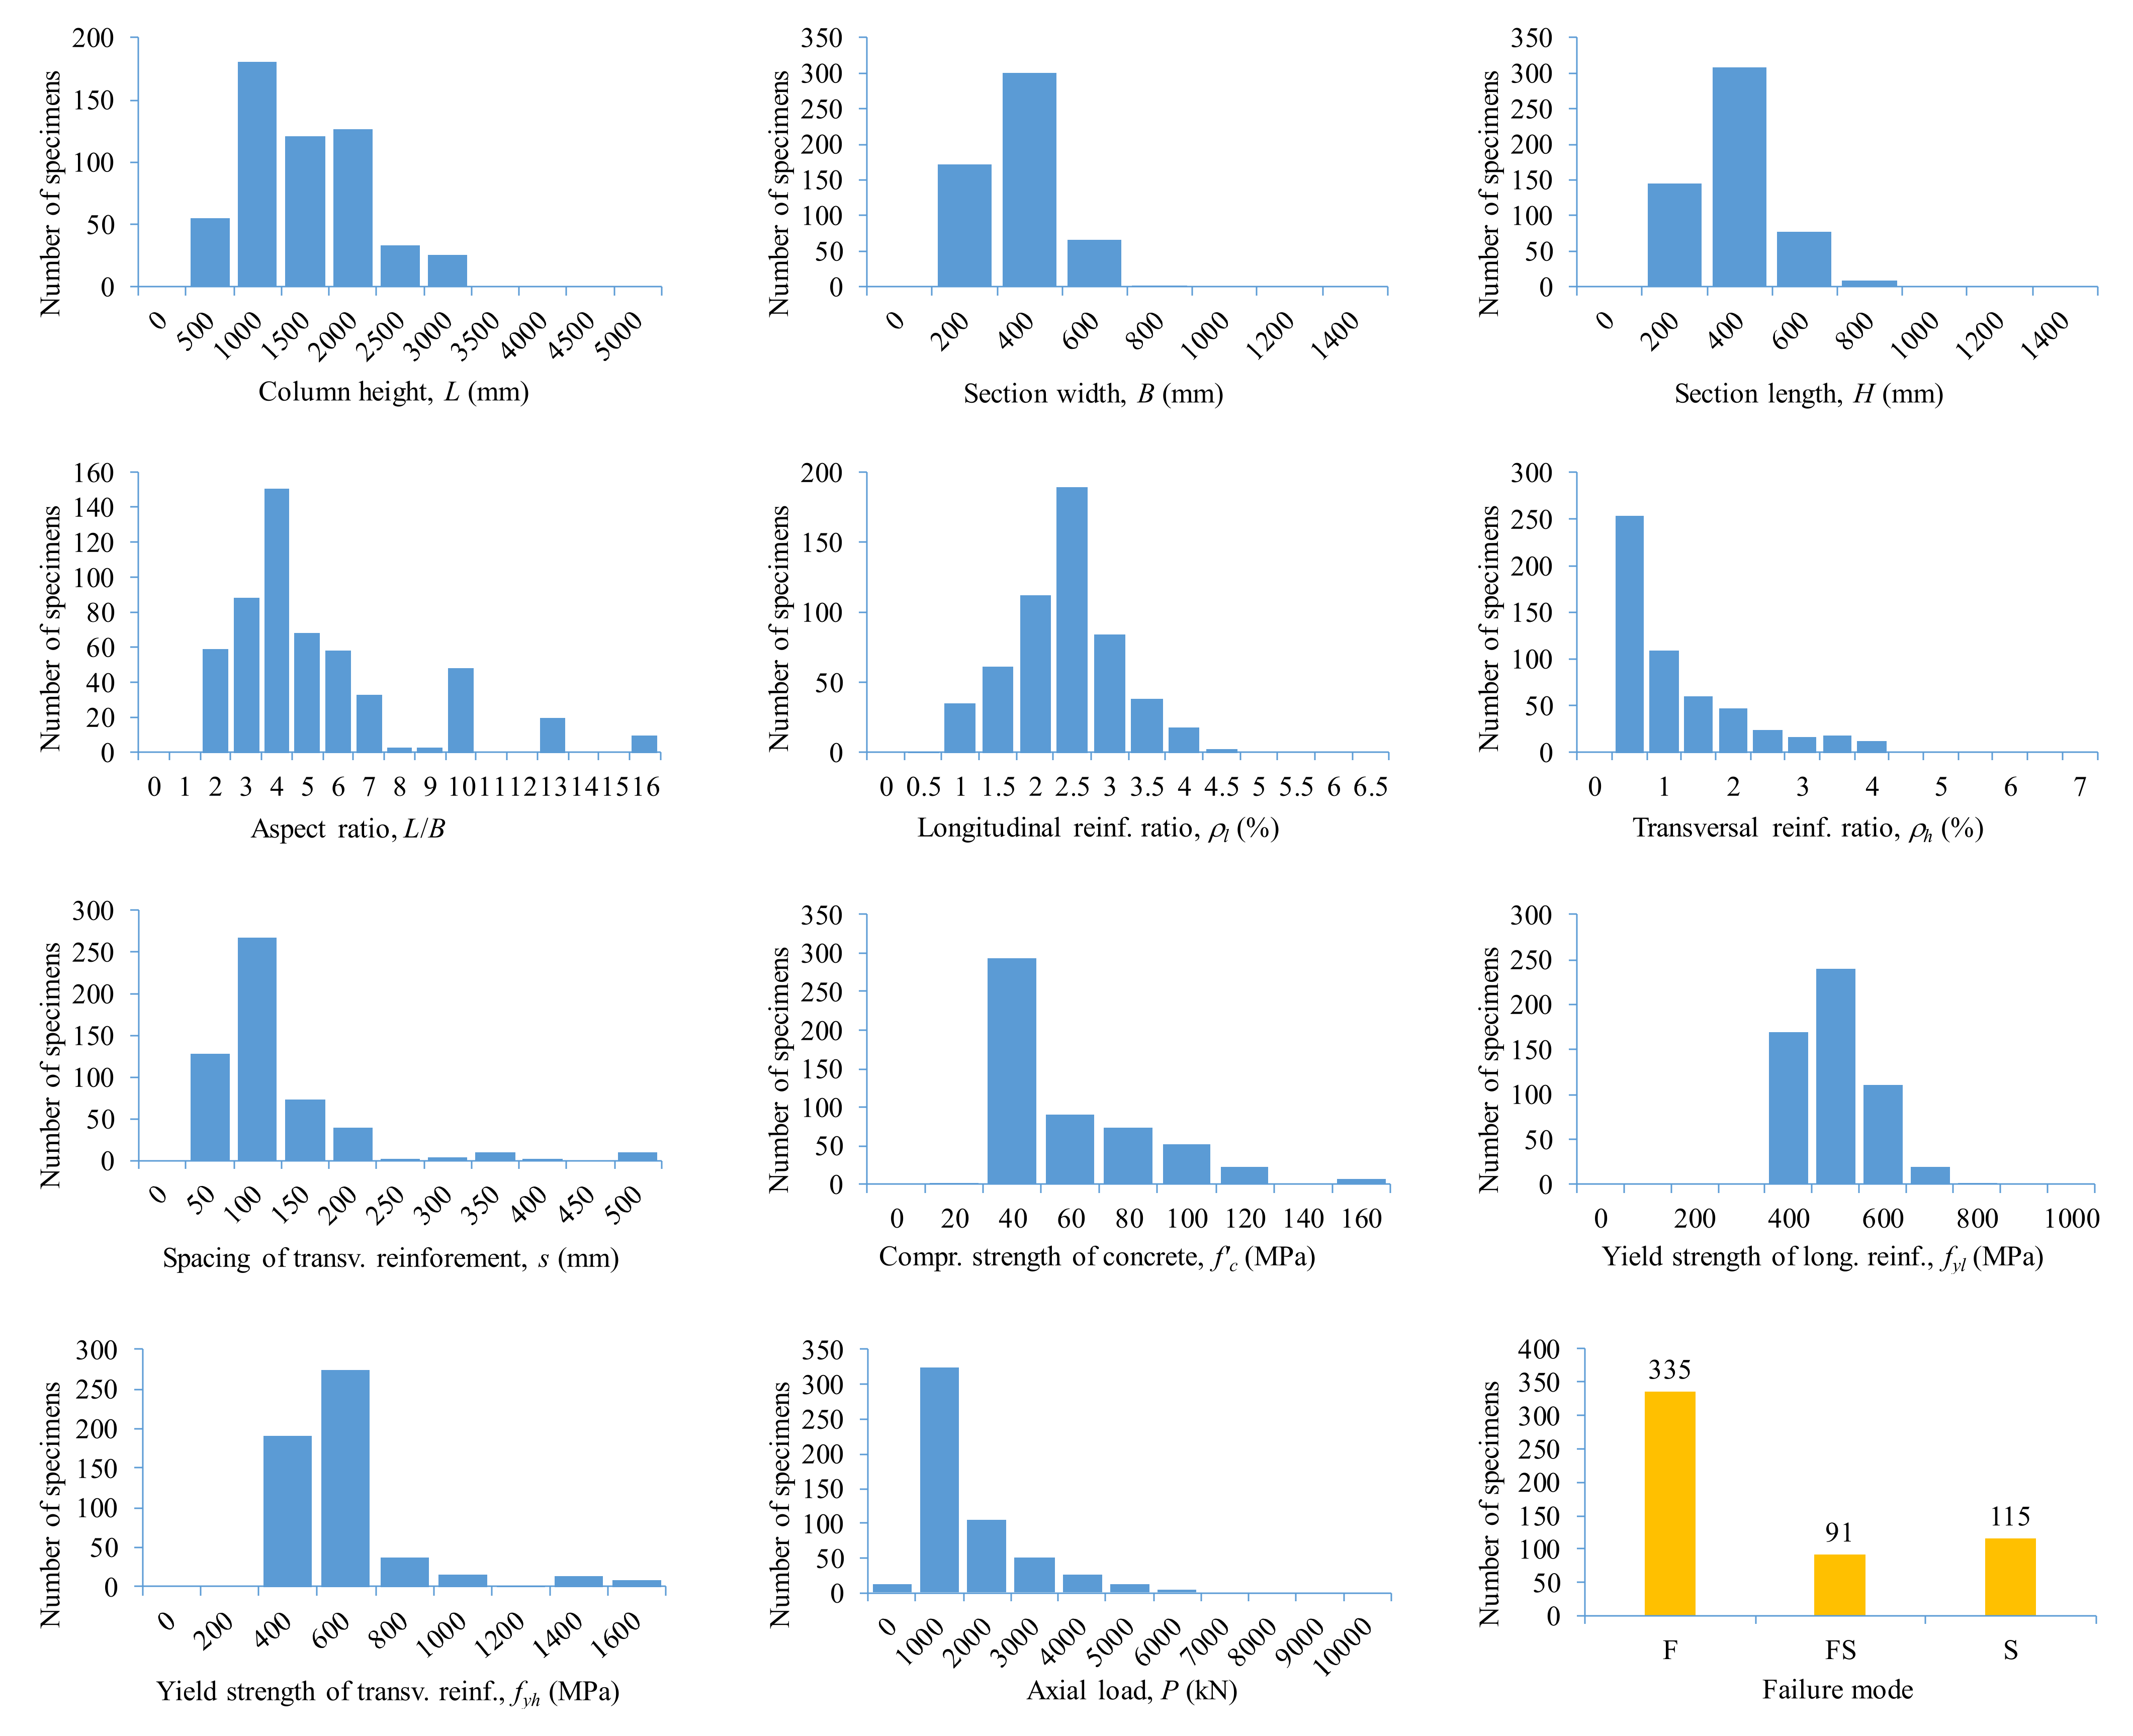
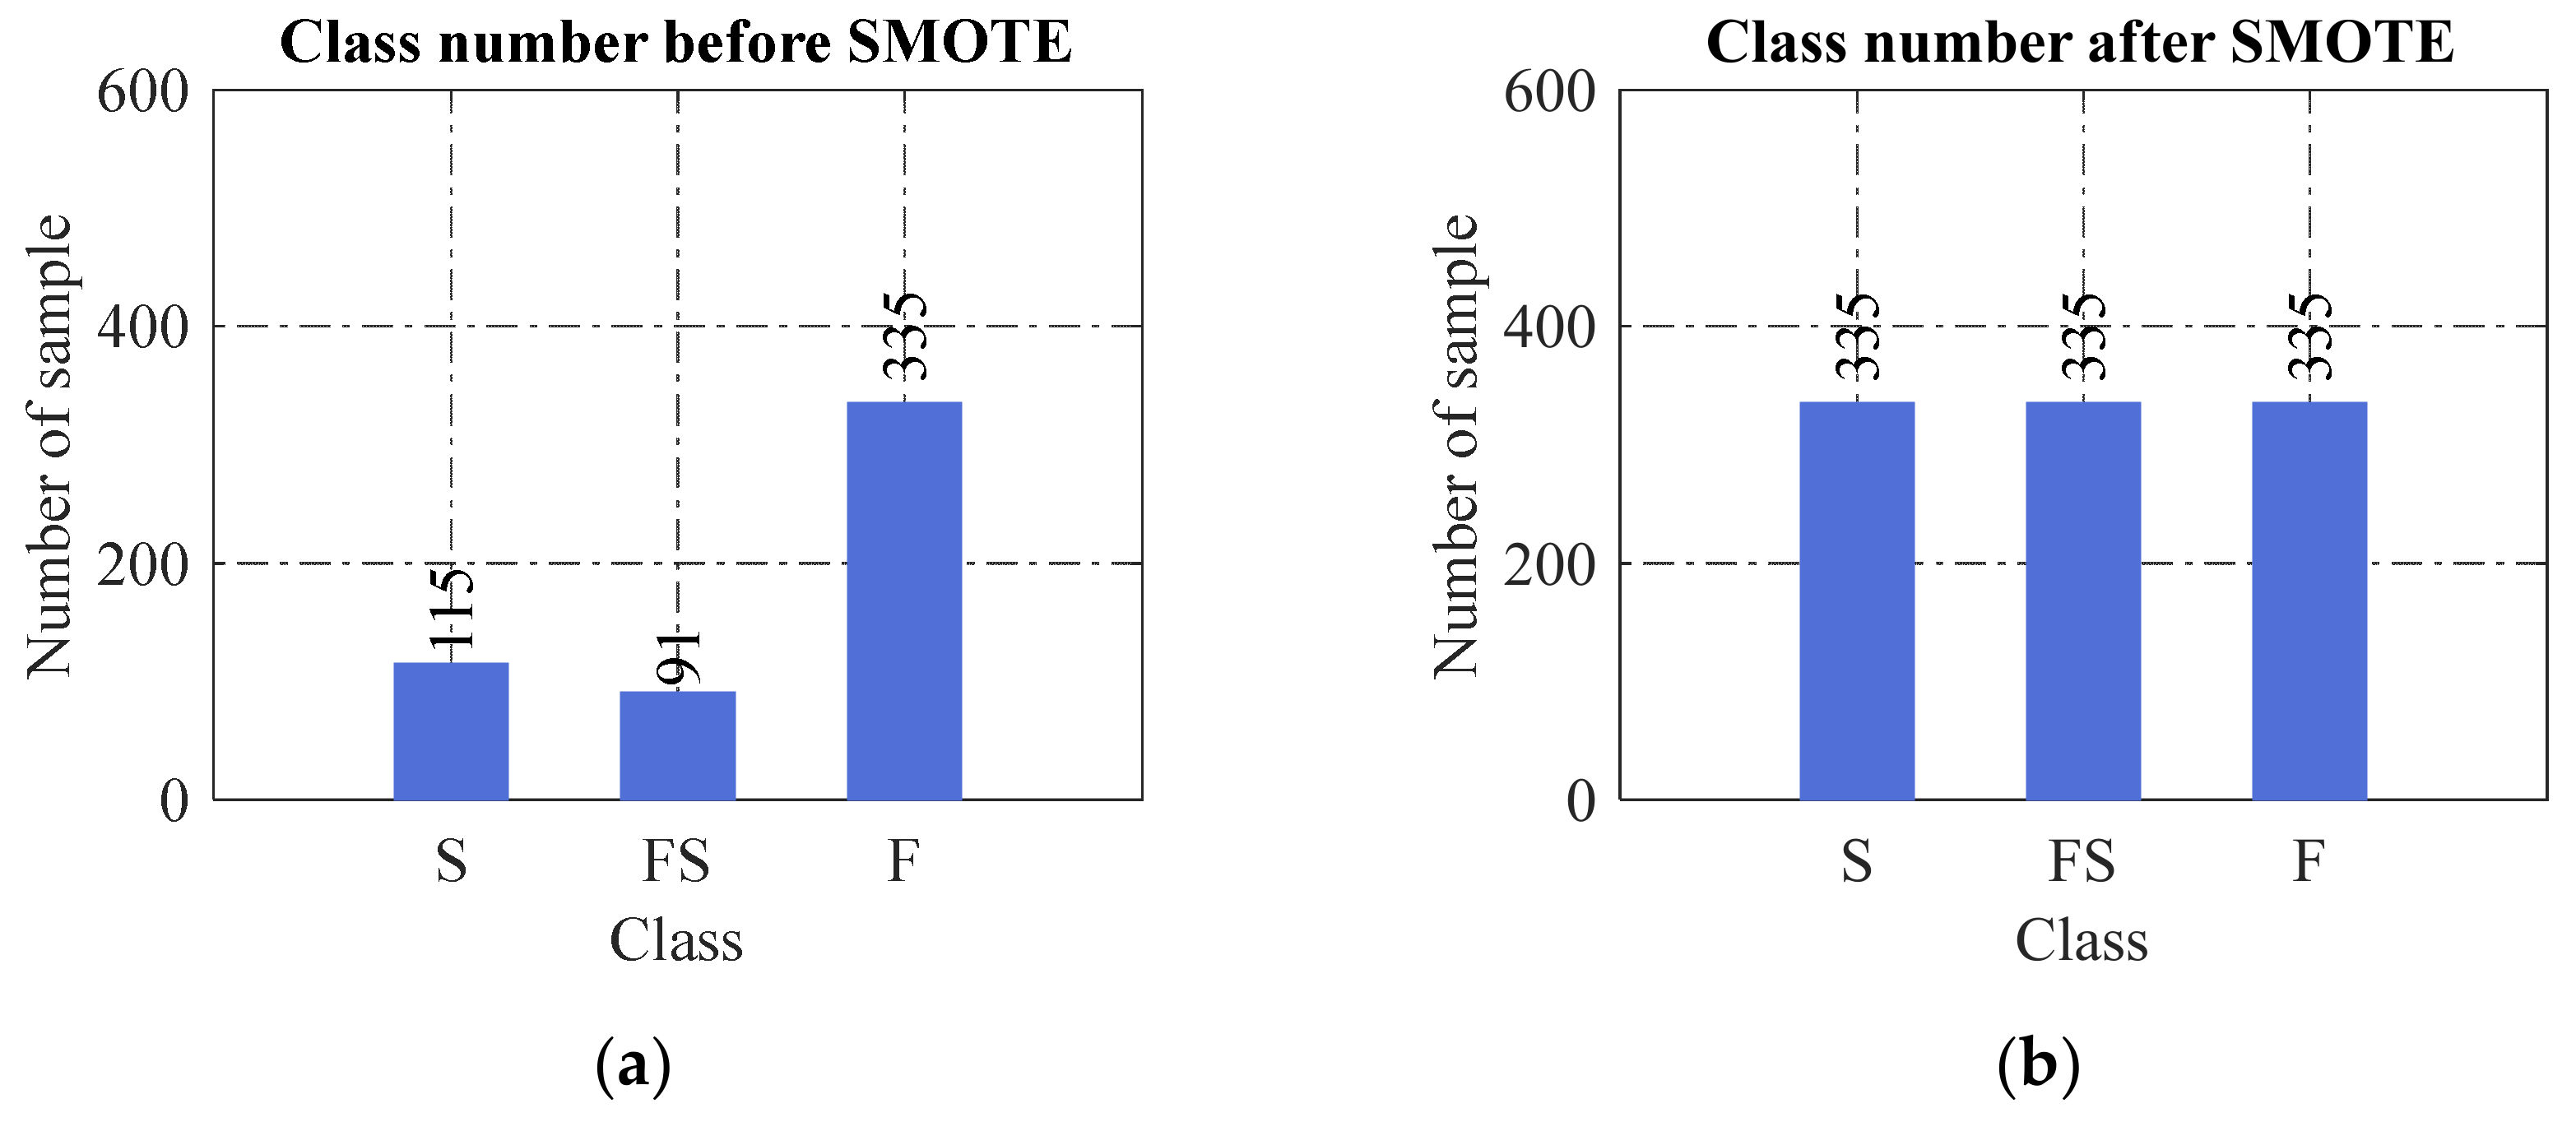
Figure 1 depicts the configurations and reinforcement properties of the rectangular RC column. The statistical properties of the experimental results are described in Table 1. In this table, ten input parameters, numbered as variables from X1 to X10, are involved in training machine learning models. The frequency histograms of input parameters and failure modes of the 541 data samples are shown in Figure 2. For this database, the number of columns that failed in flexure (F), flexure–shear combination (FS), and shear (S) is 335, 91, and 115, respectively. Figure 3 shows the correlation matrix of input and output parameters of the collected data. Based on this figure, it can be found that some parameters had a strong correlation, such as B and H . In addition, the shear strength ( V ) is strongly correlated with the cross-section dimensions ( B and H ). Meanwhile, some others were poorly correlated, such as s and ρ h , B or H , and f c since their physical meanings have no connection. Moreover, the correlation among axial load ( P ) , column height ( L ), and the output ( V ) showed to be medium.

3. Background of Machine Learning Models

So far, there are numerous ML models, which can be applied for regression and classification problems in structural engineering. Each algorithm contains advantages and limitations. In this study, the authors selected some typical single ML models for predicting shear strength and classifying failure modes of rectangular RC columns, in which NBs, MARSs, KNNs, DT, SVM, and ANN were used. A brief description of the investigated ML models is provided as follows.

3.1. Naïve Bayes

NBs classifiers are a set of supervised ML algorithms based on the Bayes theorem. The NBs algorithm works very fast and can easily predict the class of a test data set. NBs methods assume that the value of a given class is independent of the feature vector. The Bayes theorem can be expressed as
P y | x 1 , , x n = P y P x 1 , , x n | y P x 1 , , x n
where y is the given class variable; xi is the dependent feature vector; P y is the prior probability (i.e., the class probability); P x i | y is the conditional probability, and P x i is the evidence. The various Naïve Bayes classifiers differ mostly due to the assumptions of the distribution of P x i | y . In this study, we used Gaussian naïve Bayes for classifying failure modes of rectangular RC columns. However, it should be noted that if the data sets have a categorical variable of a category that is not included in the training data set, the NBs model will assign it zero probability and will not be able to make any predictions in this regard. Thus, a smoothing technique is required to solve this problem.

3.2. K-Nearest Neighbors

KNNs, a nonparametric supervised ML method, classifies data based on K samples that are nearest to it. The K parameter is determined as the square root of the number of the training data set. This algorithm does not make any assumption about the data, and it can be applied both for classification and regression problems Additionally, KNNs is very simple to perform for multiclass problems. However, the KNNs algorithm is very sensitive to outliers as it simply chooses the neighbors based on distance criteria. Moreover, the KNNs model does not perform well on imbalanced data.
To apply KNNs for classification, it can be implemented through three main steps:
  • Firstly, the KNNs determines the distance between a new data point to all other points of training data. This space can be calculated using Euclidean distance, i.e., i K x i y i 2 or Manhattan distance, i.e., i K x i y i , where xi and yi are coordinates of data points.
  • Next, the KNNs algorithm randomly selects the K nearest data points ( K is an integer). The selection is based on the proximity to other data points regardless of what feature the values.
  • Finally, the algorithm allocates the data point to the class where similar data points lie down.

3.3. Decision Tree

DT, a supervised ML algorithm, is known as one of the most effective techniques for prediction and classification [104]. This ML technique is a tree-like flowchart, in which each nonleaf node (i.e., internal node) represents a test on a feature. The training data from the root node are recursively partitioned into subsets or branches using the Gini or entropy index criterion [105]. Each branch denotes an output of the test, and each leaf node (i.e., terminal node) indicates a classification. The advantages of DT are easy to understand and interpret, and it has no assumptions about data sets. Additionally, this algorithm can operate with numerical and categorical features. However, this model can easily create the overfitting problem during training process.

3.4. Support Vector Machine

SVM is a supervised ML algorithm, which is popularly used in performing classification and regression [106]. SVM is also a fast and dependable classification technique. It is effective in high dimensional spaces and works well with a clear margin of separation. SVM can perform very well with a limited amount of used data. However, SVM does not work well when the database is large and has more noise, i.e., target classes are overlapping. Normally, the procedure for classification using SVM can be implemented by the following steps:
  • Creating a hyperplane or decision boundary that separates the features (i.e., classes). It can be a linear or nonlinear hyperplane. A good decision boundary is achieved when it contains the largest space to the adjacent training data point of classes.
  • Using a kernel function, K x , y , to facilitate the computation of dot products of pairs of input data vectors, which are designed by mapping from the original finite-dimensional space to a higher-dimensional space.
Kernel functions play a crucial role in SVM to connect from linearity to nonlinearity. Three typical kernel functions, which are Linear, Gaussian, and Polynomial, can be employed to evaluate the classification performance. Those functions defined on Euclidean space, d, are expressed as
Linear   kernel   function :   K x , y = x T y ,     x ,   y d
Gaussian   kernel   function :   K x , y = e x y 2 2 σ 2 ,   ( x ,   y d ,   σ > 0 )
Polynomial   kernel   function :   K x , y = x T y + r n ,     x ,   y d ,     r 0 ,     n 1

3.5. Artificial Neural Networks

ANNs are flexible and can be used for both regression and classification problems. It is good to work with nonlinear data containing a large number of inputs. Neural networks can be trained with any number of inputs and layers, and the predictions are obtained very fast. However, ANNs depend on training data significantly, and sometimes this can create an overfitting problem.
An ANN model comprises three components:
  • Input layer, where input parameters are entered;
  • Hidden layer(s);
  • Output layer, where the predicted result is obtained.
The neurons in the network are bridged in some forms, in which the signal is transferred from neurons to other neurons. These connections hold a weight, and each neuron has a bias and an activation. The input vector (i.e., signal) of the neuron is represented by x = x 1 , x 2 , , x m , while the weighted sum of the input vector is determined by z as follows:
z = i = 1 d w i x i = w T x + b
where w = w 1 , w 2 , , w d d denotes the weight vector in the d -dimension; b is the bias. To consider the nonlinear relationship between the input and output vectors, a nonlinear processing with respect to z is performed in the form of
y = f z
where f represents the activation function; y denotes the activation value of the neuron. In this study, the t a n s i g and p u r e l i n functions were employed for making a smooth transition during training the network [107], expressed by Equations (7) and (8). This approach is also consistent with studies elsewhere [108,109,110,111,112,113,114,115,116,117].
y = t a n s i g x = 2 1 + e 2 x 1
y = p u r e l i n x = x
To perform the ANN algorithm, the following processes are required:
  • Firstly, the input signals (i.e., data) are entered to the input layer, and the signals are transferred from one node (neuron) to another through the connections in the network. This is called the forward pass.
  • Secondly, after obtaining the output from the forward pass, it is required to evaluate this output by comparing it with the target using the Mean Squared Error ( M S E ), as expressed in Equation (9). This is called the backward pass.
  • Moreover, it is needed to minimize the error by iteratively updating those processes until the M S E is converged.
    M S E = 1 N i = 1 N ( p i t i ) 2
    where N is the number of samples; t i and p i are the target and predicted values of the i t h sample, respectively.

3.6. Multivariate Adaptive Regression Splines

MARSs is a flexible nonparametric regression method, which was proposed by Friedman [118]. This model is more flexible than linear regression ones. In addition, it is simple to understand and interpret. Moreover, MARSs can deal with both numerical and categorical databases. However, the disadvantage of MARSs is that the fitting function is not smooth. The general expression of nonparametric regression is represented by the following form:
y i = f ( x i 1 ,   x i 2 , , x i j ) + ε i = f X + ε i
where X = ( x i 1 ,   x i 2 , , x i j ) is an i × j matrix of j input variables and i samples; ε i is the error of the i t h sample. A MARSs model is constructed using basis functions to approximate the f X , expressed by
f X = c 0 + n = 1 N c n B n x
where c 0 is a constant; c n is the coefficients of basis functions B n x ; N is the number of basis functions. Basic functions are splines, which normally have piece-wise linear functions. A a basis function can be one of the three forms: (1) a constant, (2) a hinge function, which yields the kink, and (3) a product of two or more hinge functions. A hinge function is expressed in the forms of max 0 ,   x c or max 0 ,   c x , in which c is a constant, the so-called k n o t or cutpoint value. Generally, to perform MARSs, the following steps are conducted [119]:
  • Construct a forward stepwise algorithm to select spline basis functions.
  • Develop a backward stepwise algorithm to delete unnecessary basis functions until the optimal set is obtained.

4. Prediction of Shear Strength of Rectangular RC Columns

4.1. Existing Formulas for Calculating Shear Strength of RC Columns

So far, numerous studies have proposed equations for calculating the shear strength of RC columns [1,2,3,4,5,6,7,8,9,10]. In this study, we employed six typical equations for calculating the shear strength of RC columns, in which equations in current design codes and well-known previous studies are considered. Six formulas included ACI 318 [2], Eurocode-8 (EC-8) [3], CSA [4], FEMA 273 [5], Ascheim and Moehle [6], and Sezen and Moehle [9] (ASCE/SEI 41-06 [1]), as described in Table 2.

4.2. Performance of ML Models

Five ML models, which are MARSs, DT, KNNs, SVM, and ANN, were employed to predict the shear strength of RC columns. For each ML model, large and wide-ranging training–testing ratios were tested to identify the optimal model. The ratios include 0.6–0.4, 0.65–0.35, 0.7–0.3, 0.75–0.25, 0.8–0.2, 0.85–0.15, and 0.9–0.1. In the current study, we used three statistical parameters, which are the coefficient of determination ( R 2 ), root-mean-square error ( R M S E ), and a 20 i n d e x , to evaluate the performance of the ML models. The definitions of these indicators are expressed by following equations:
R 2 = 1 i = 1 N t i o i 2 i = 1 N t i o ¯ 2
R M S E = 1 N i = 1 N t i o i 2
a 20 i n d e x = n 20 N
where t i and o i represent the target and output of i t h data point, respectively; o ¯ is the mean of output data samples; N is the total number of data set; n 20 is the number of data statisfied 0.8 V e x p V p r e d i c t 1.2, in which V e x p and V p r e d i c t are the shear strengths obtained from experiments and predictions, respectively.
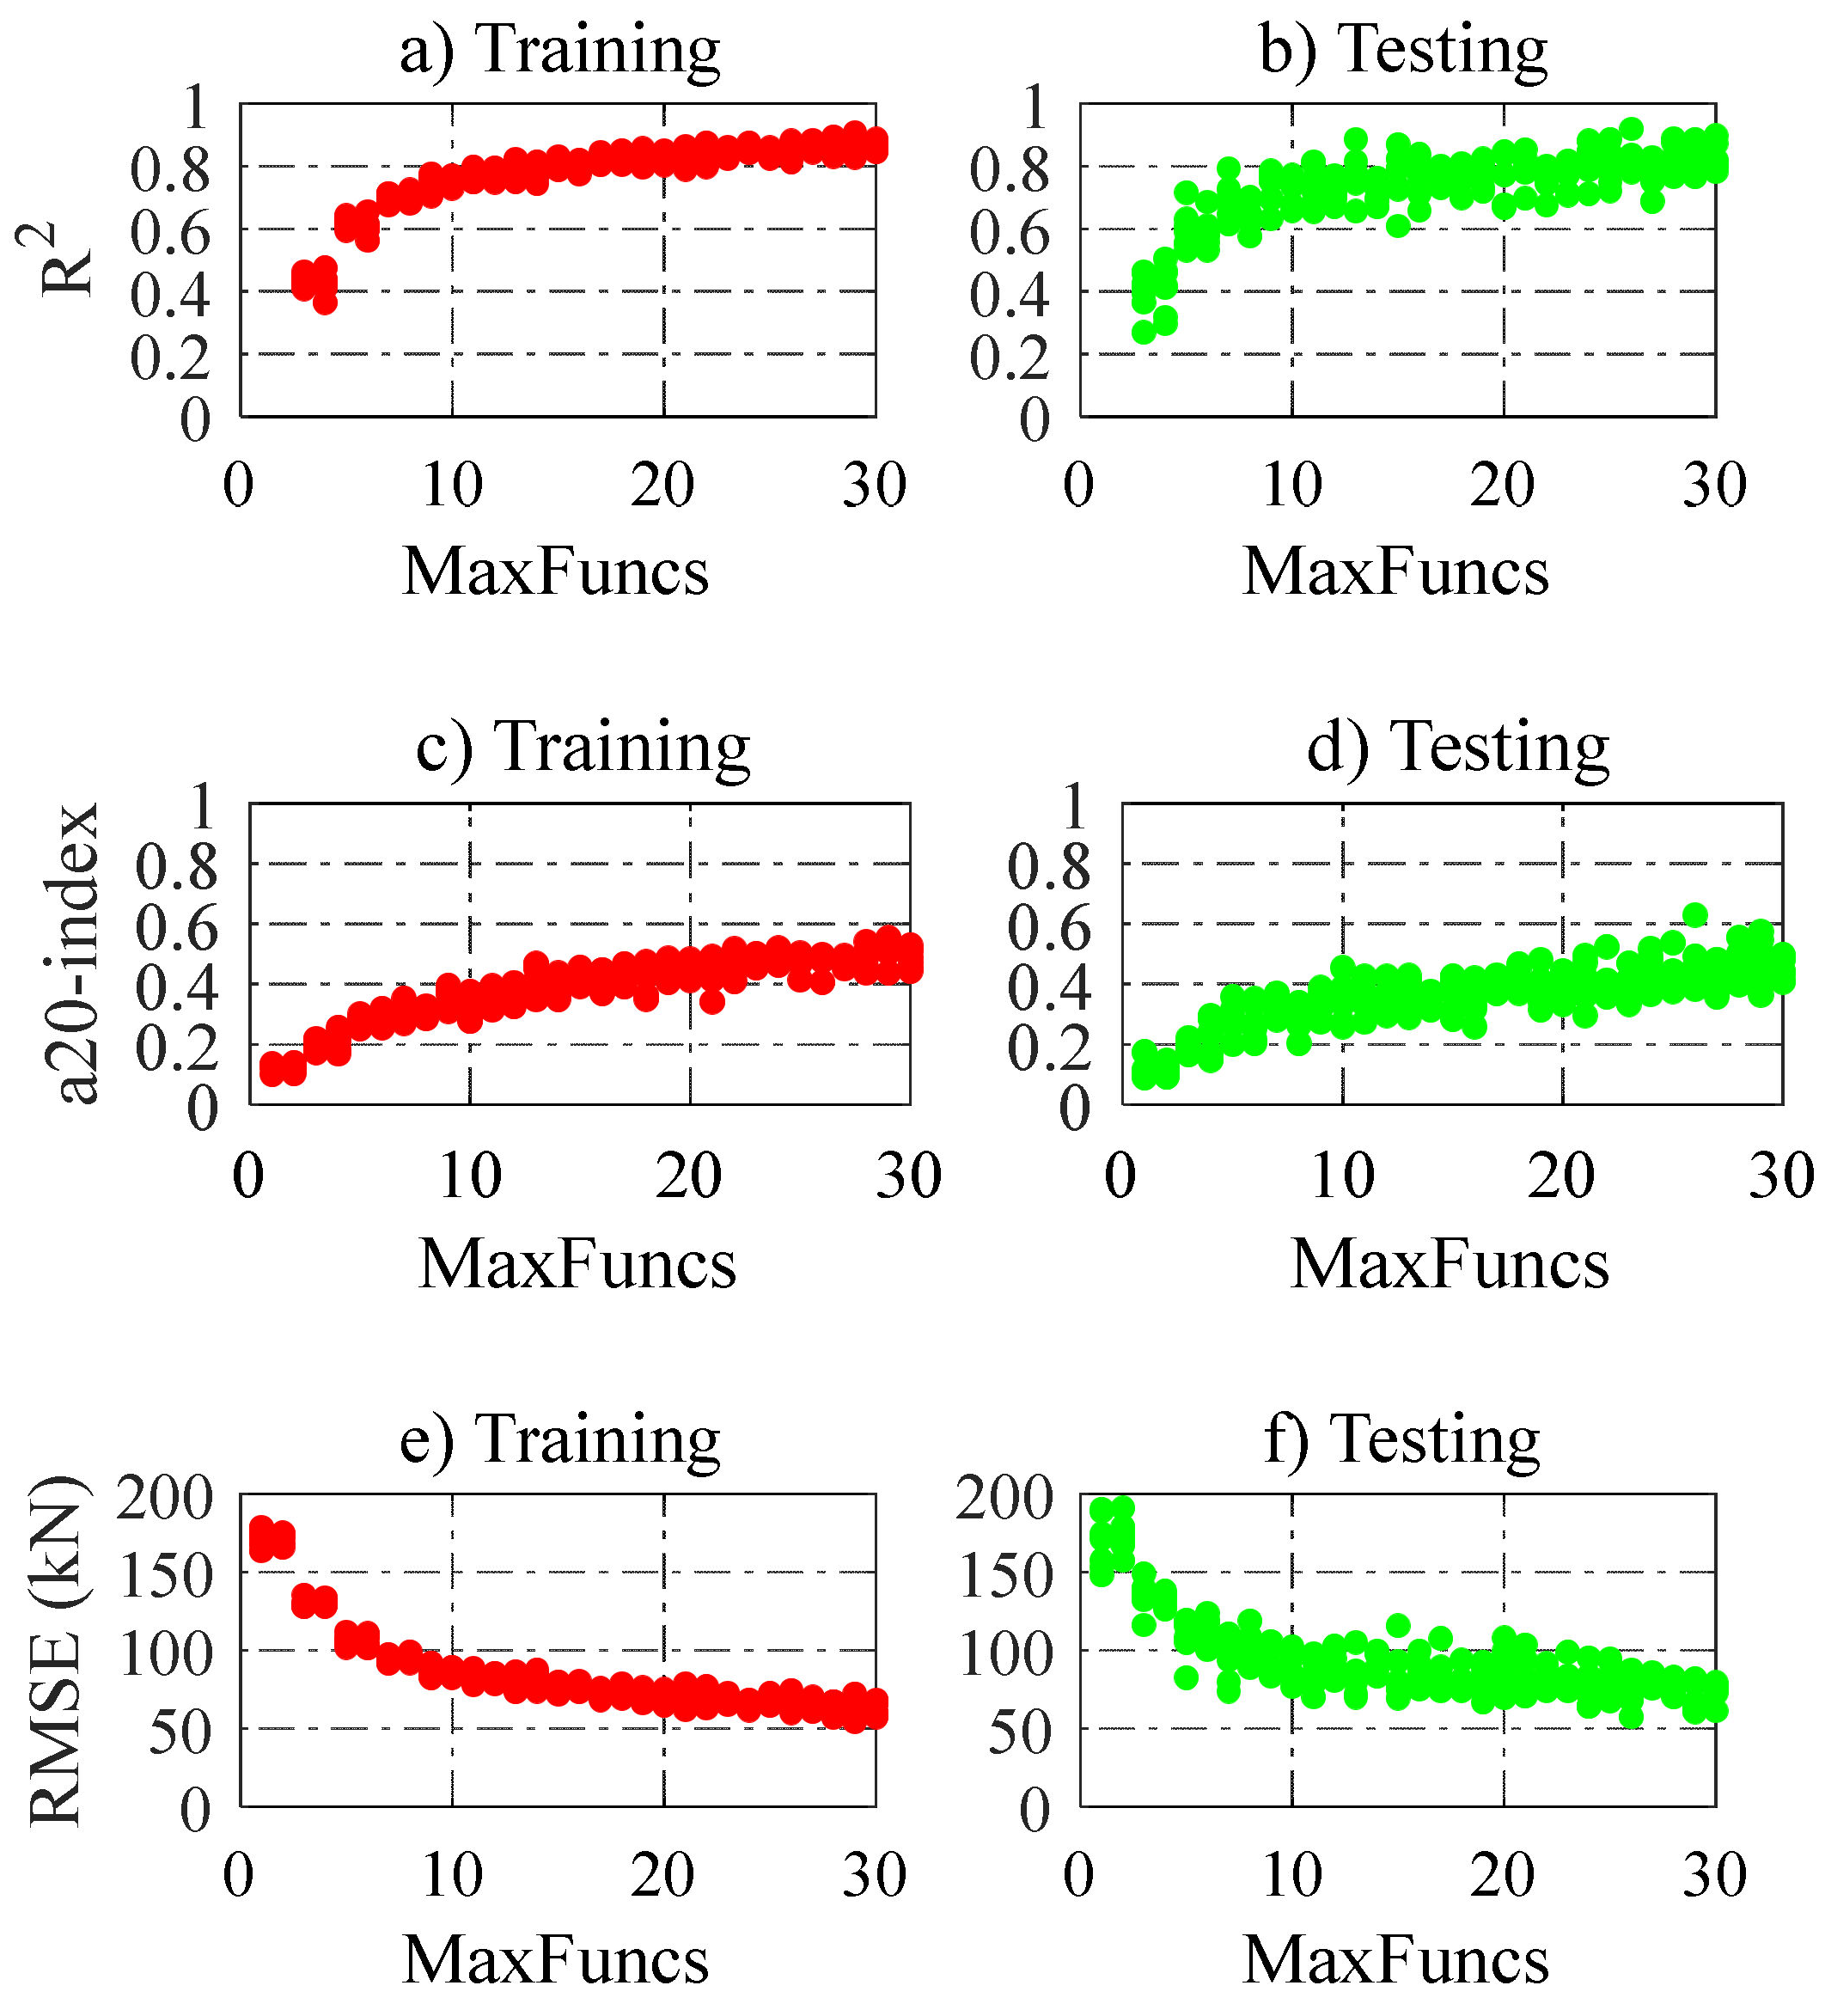
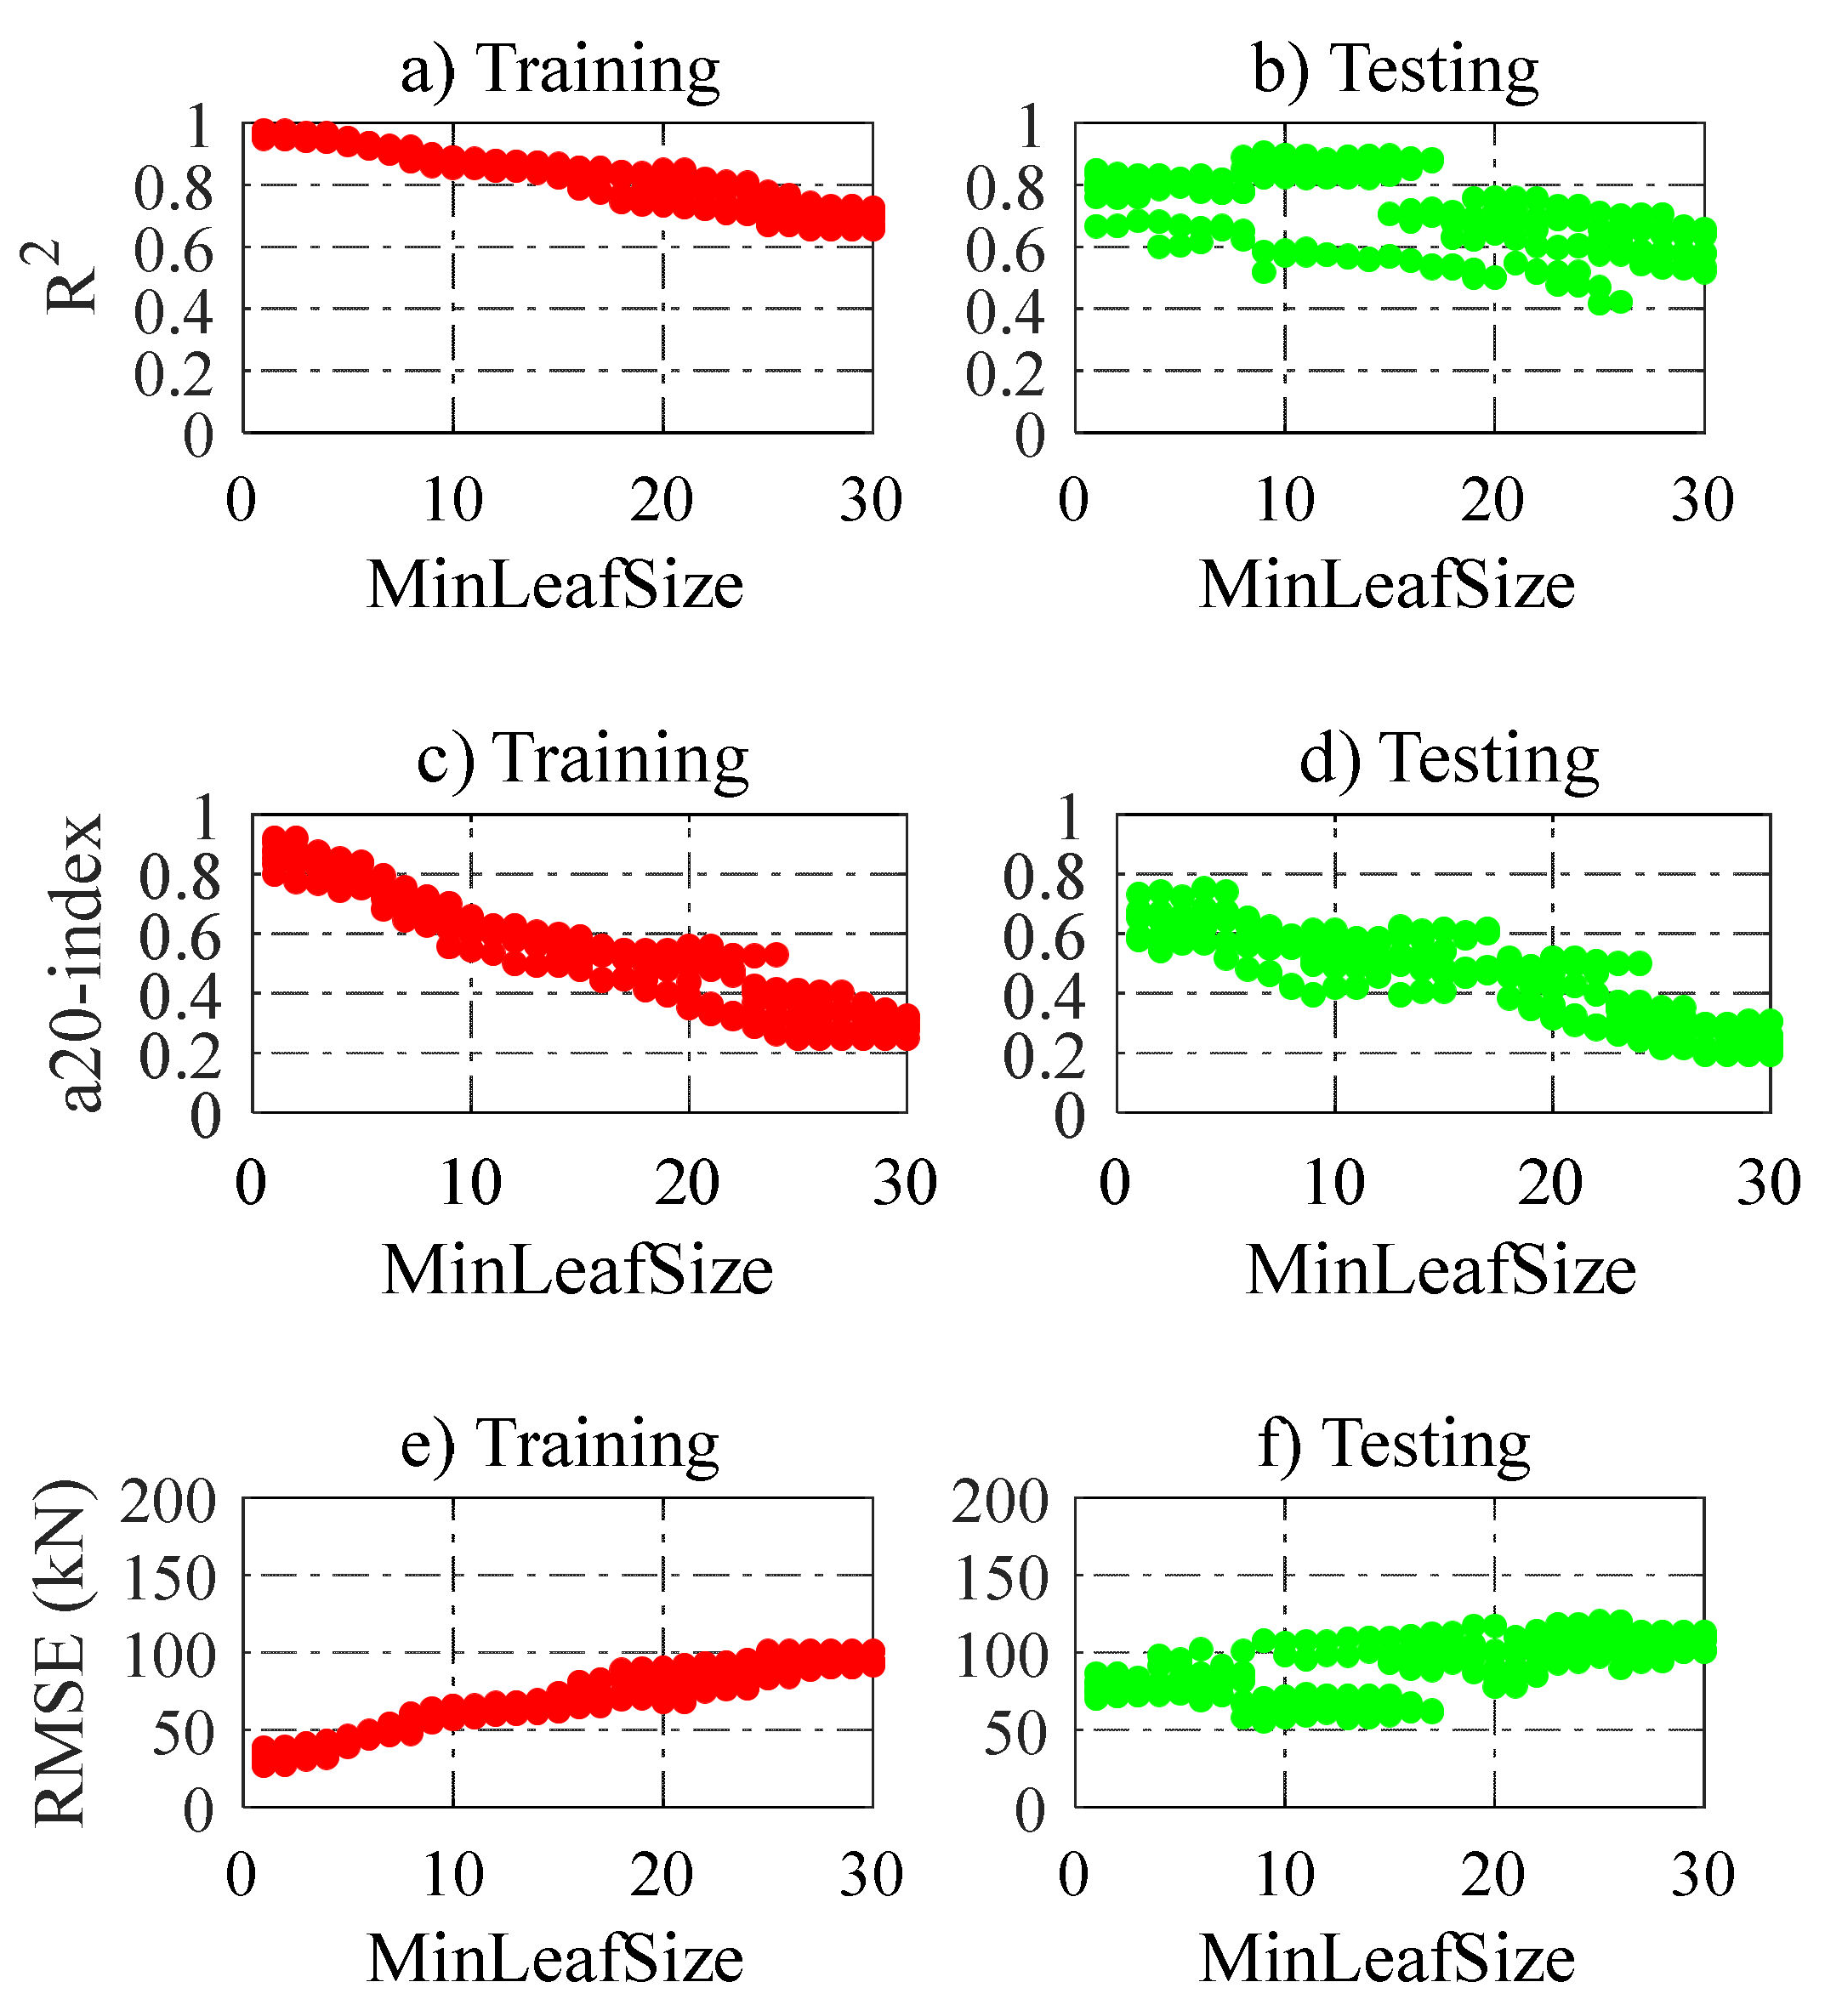
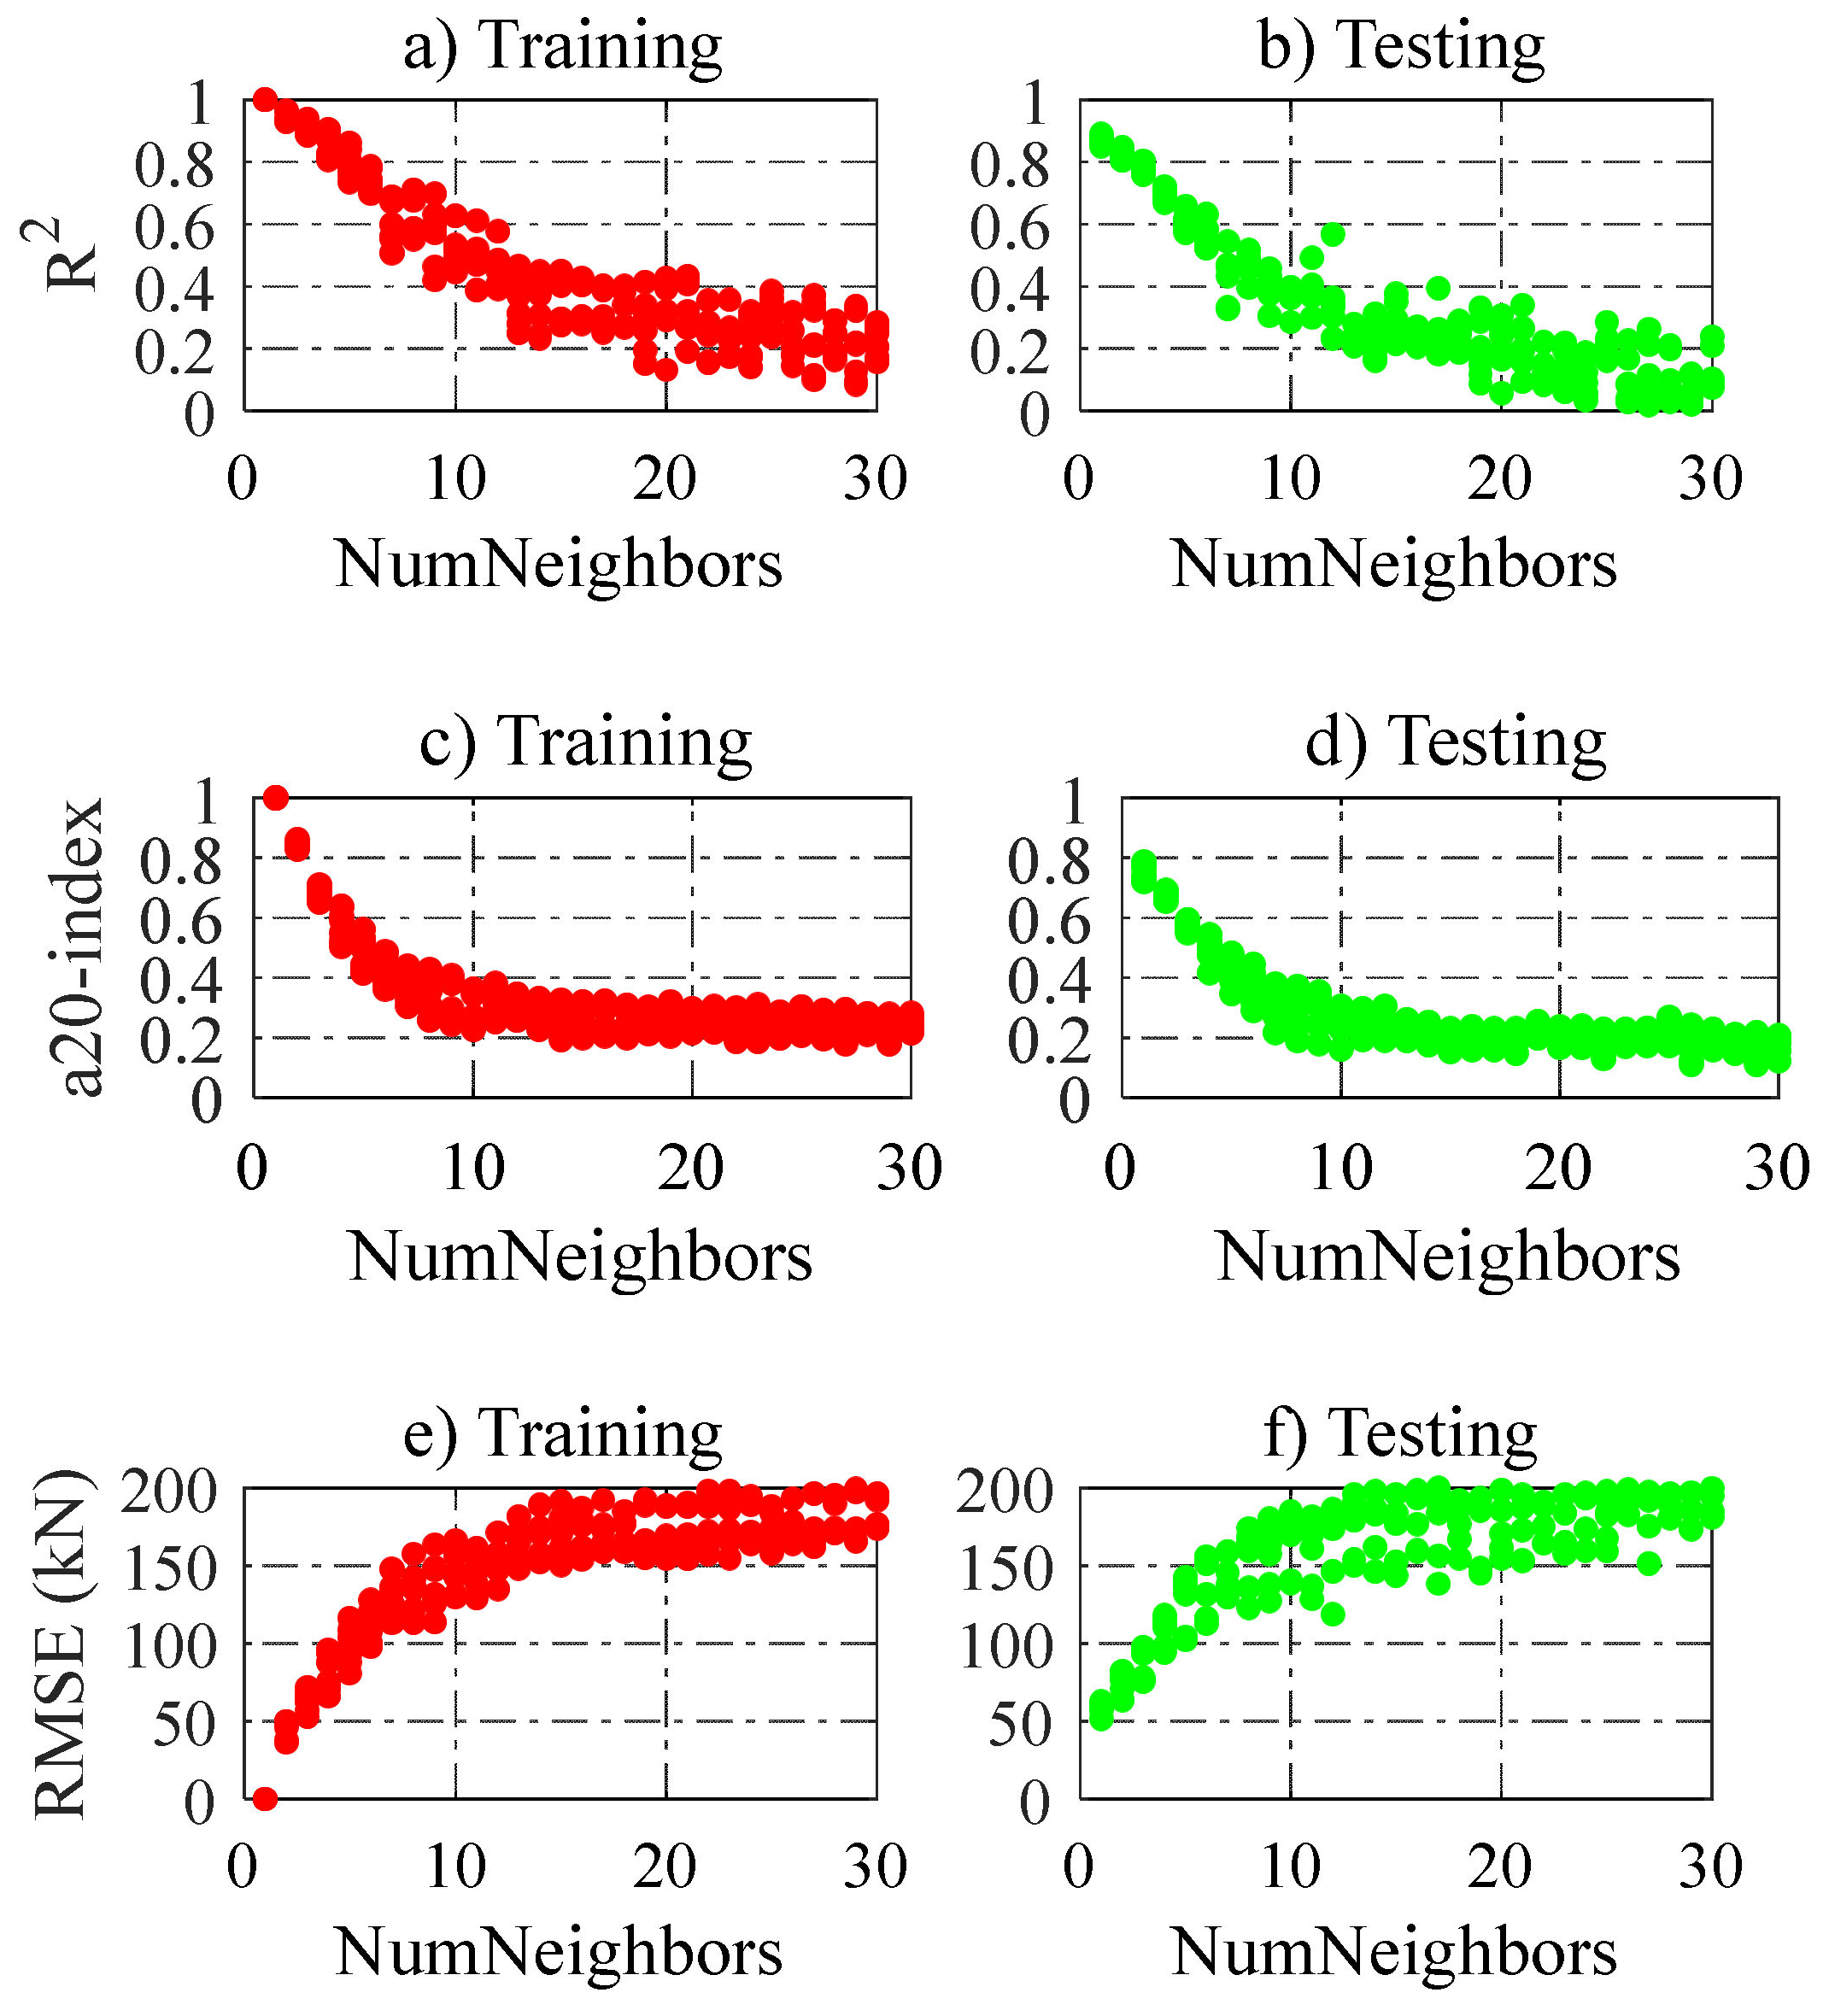
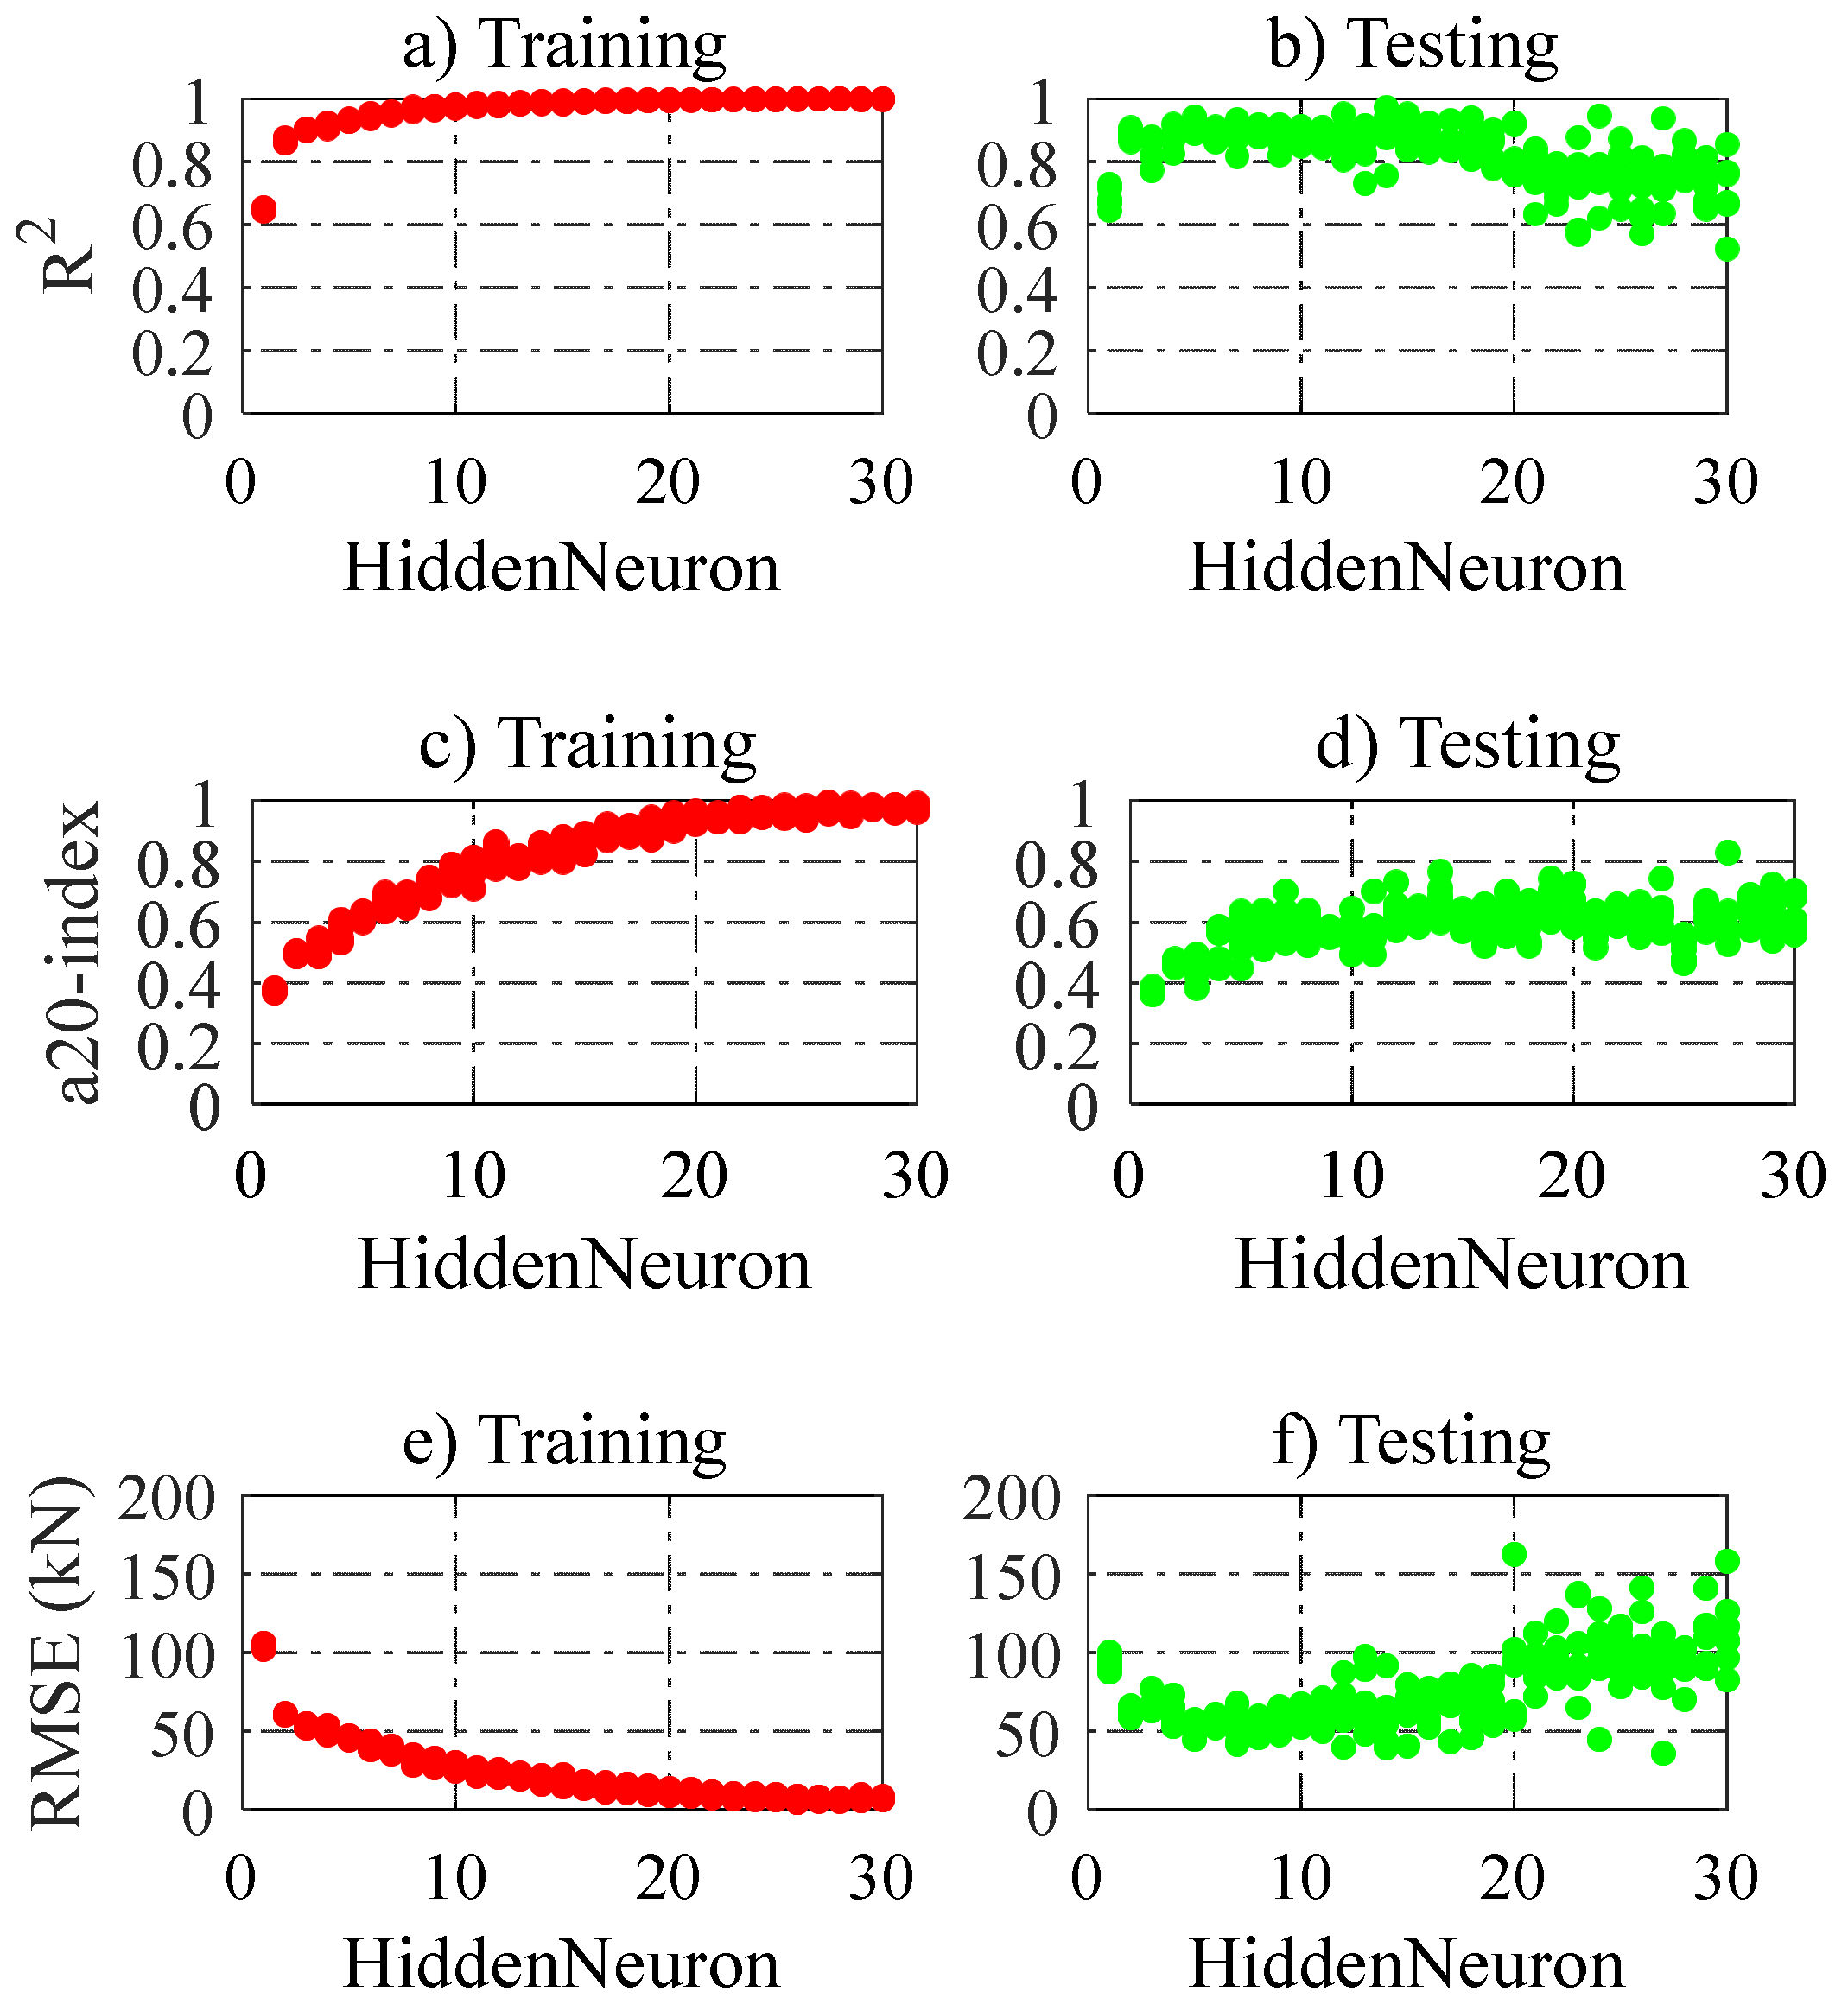
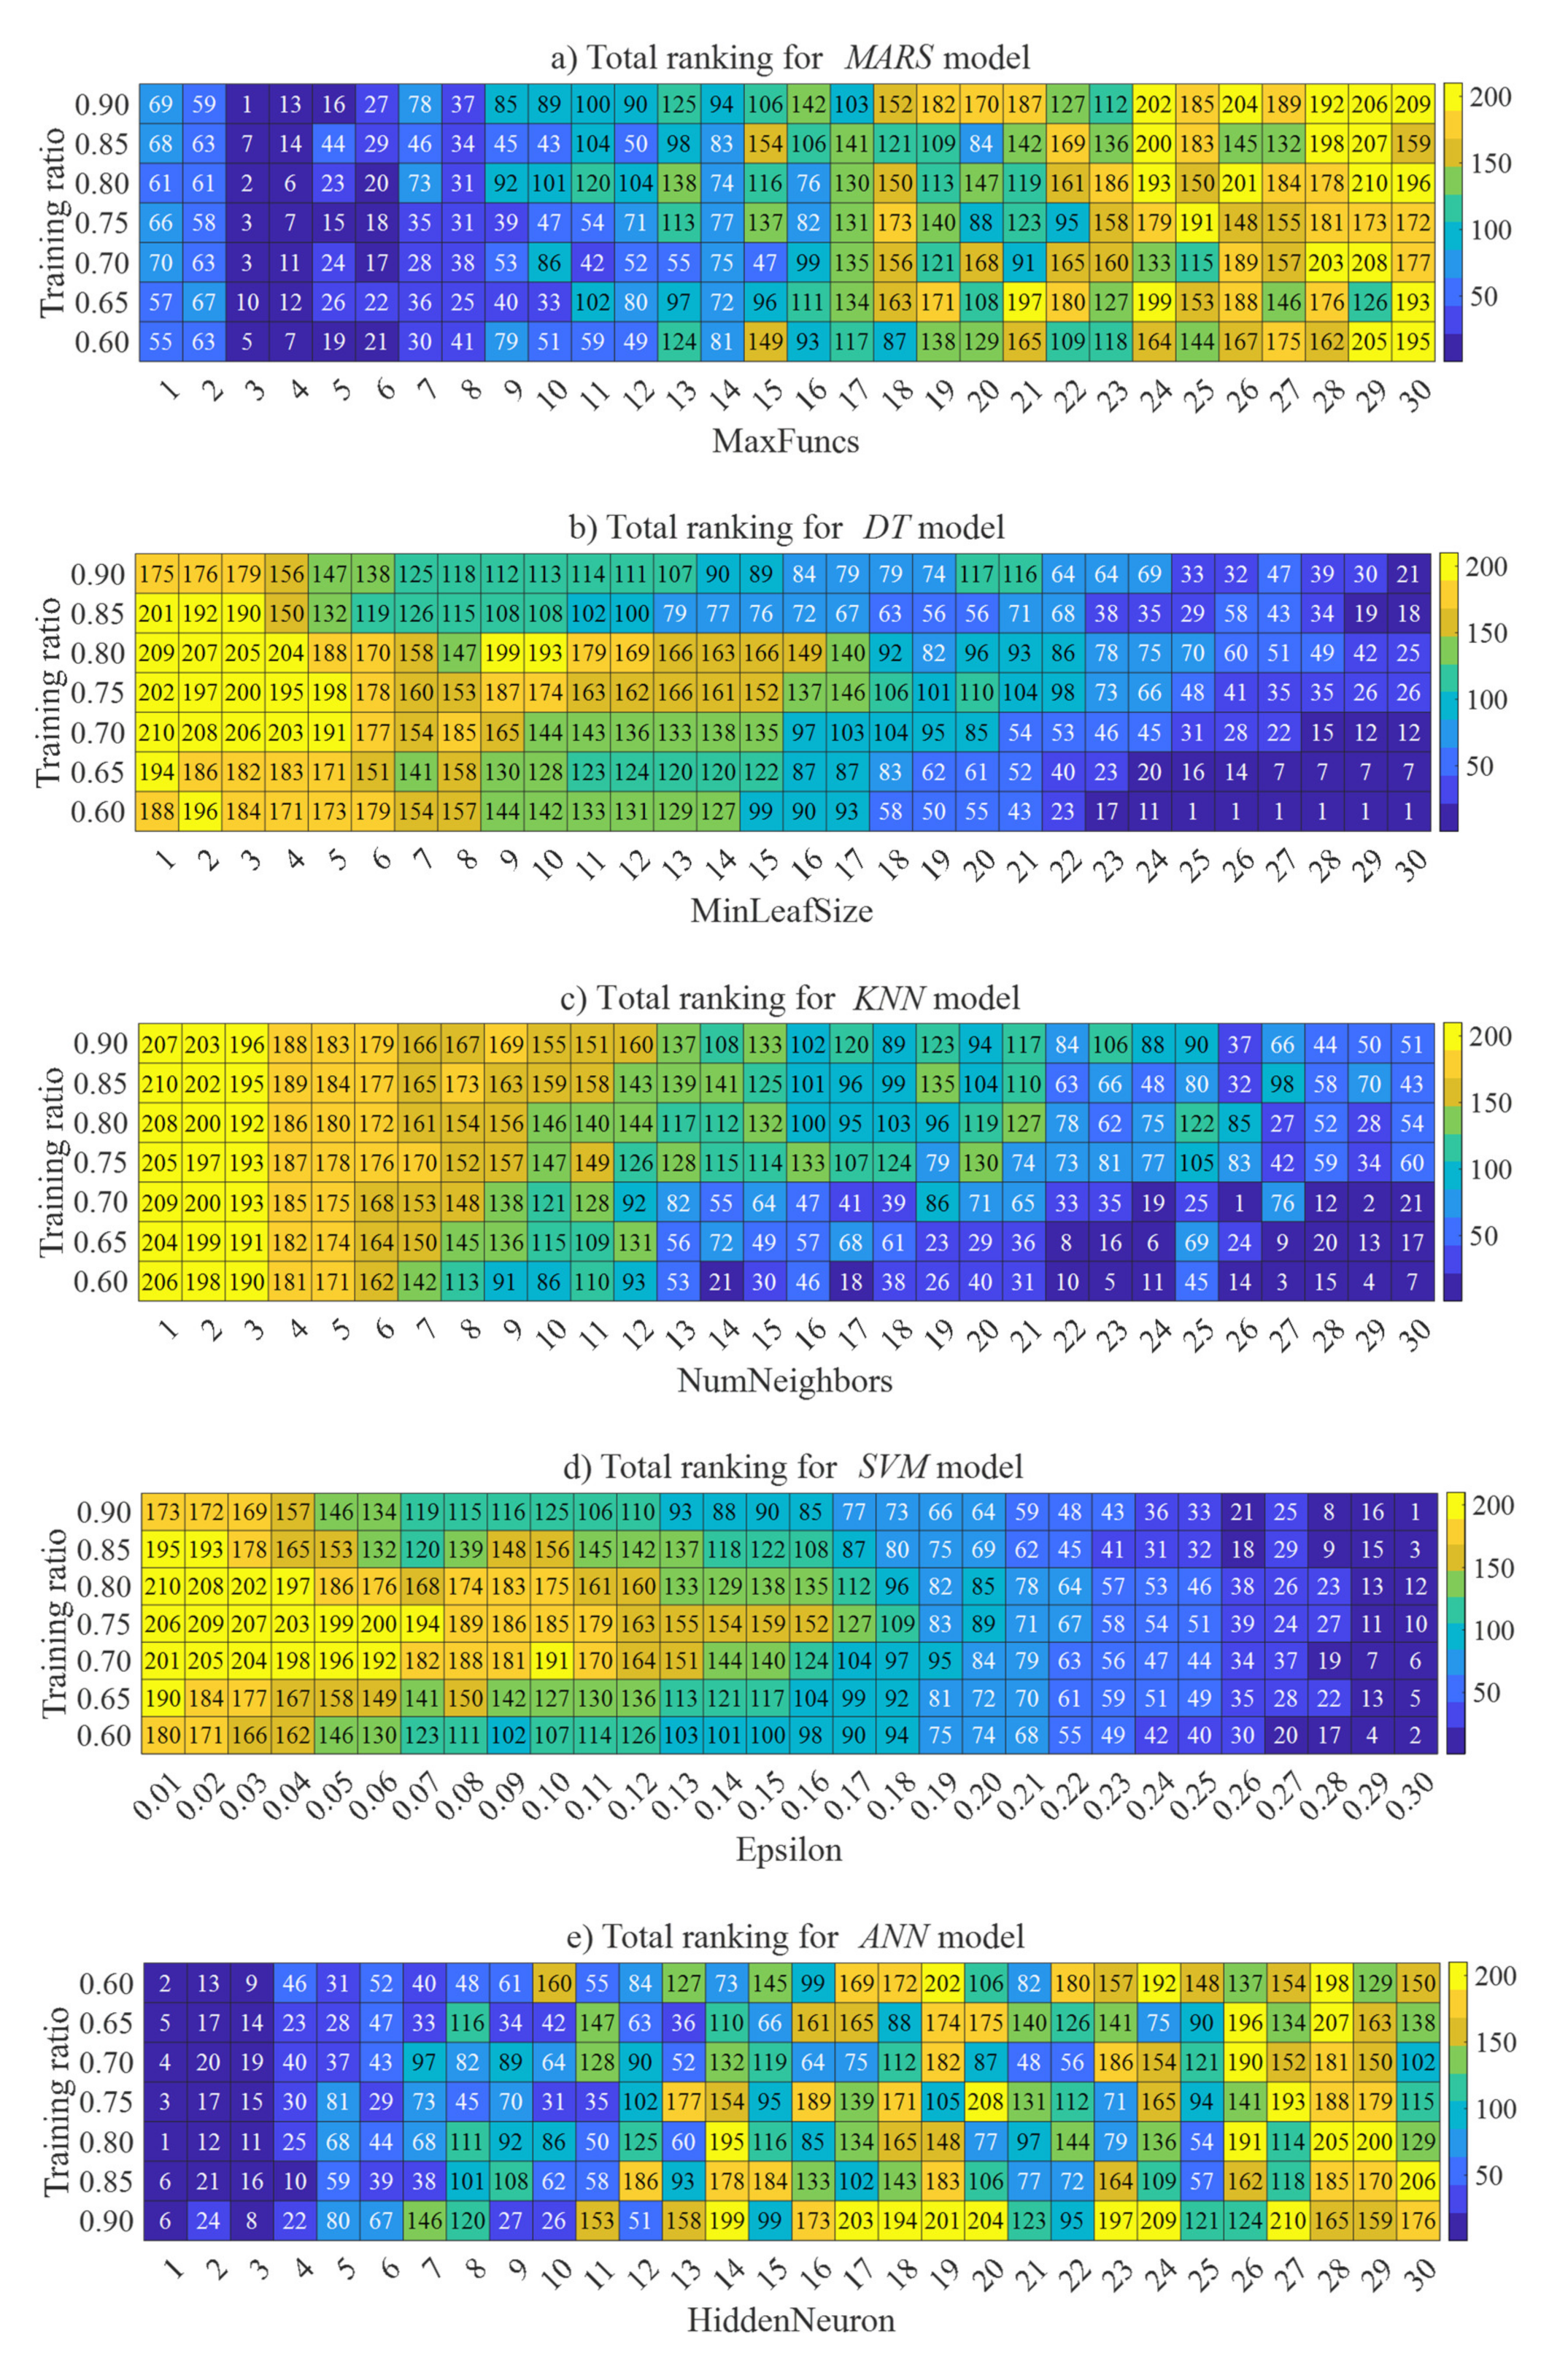
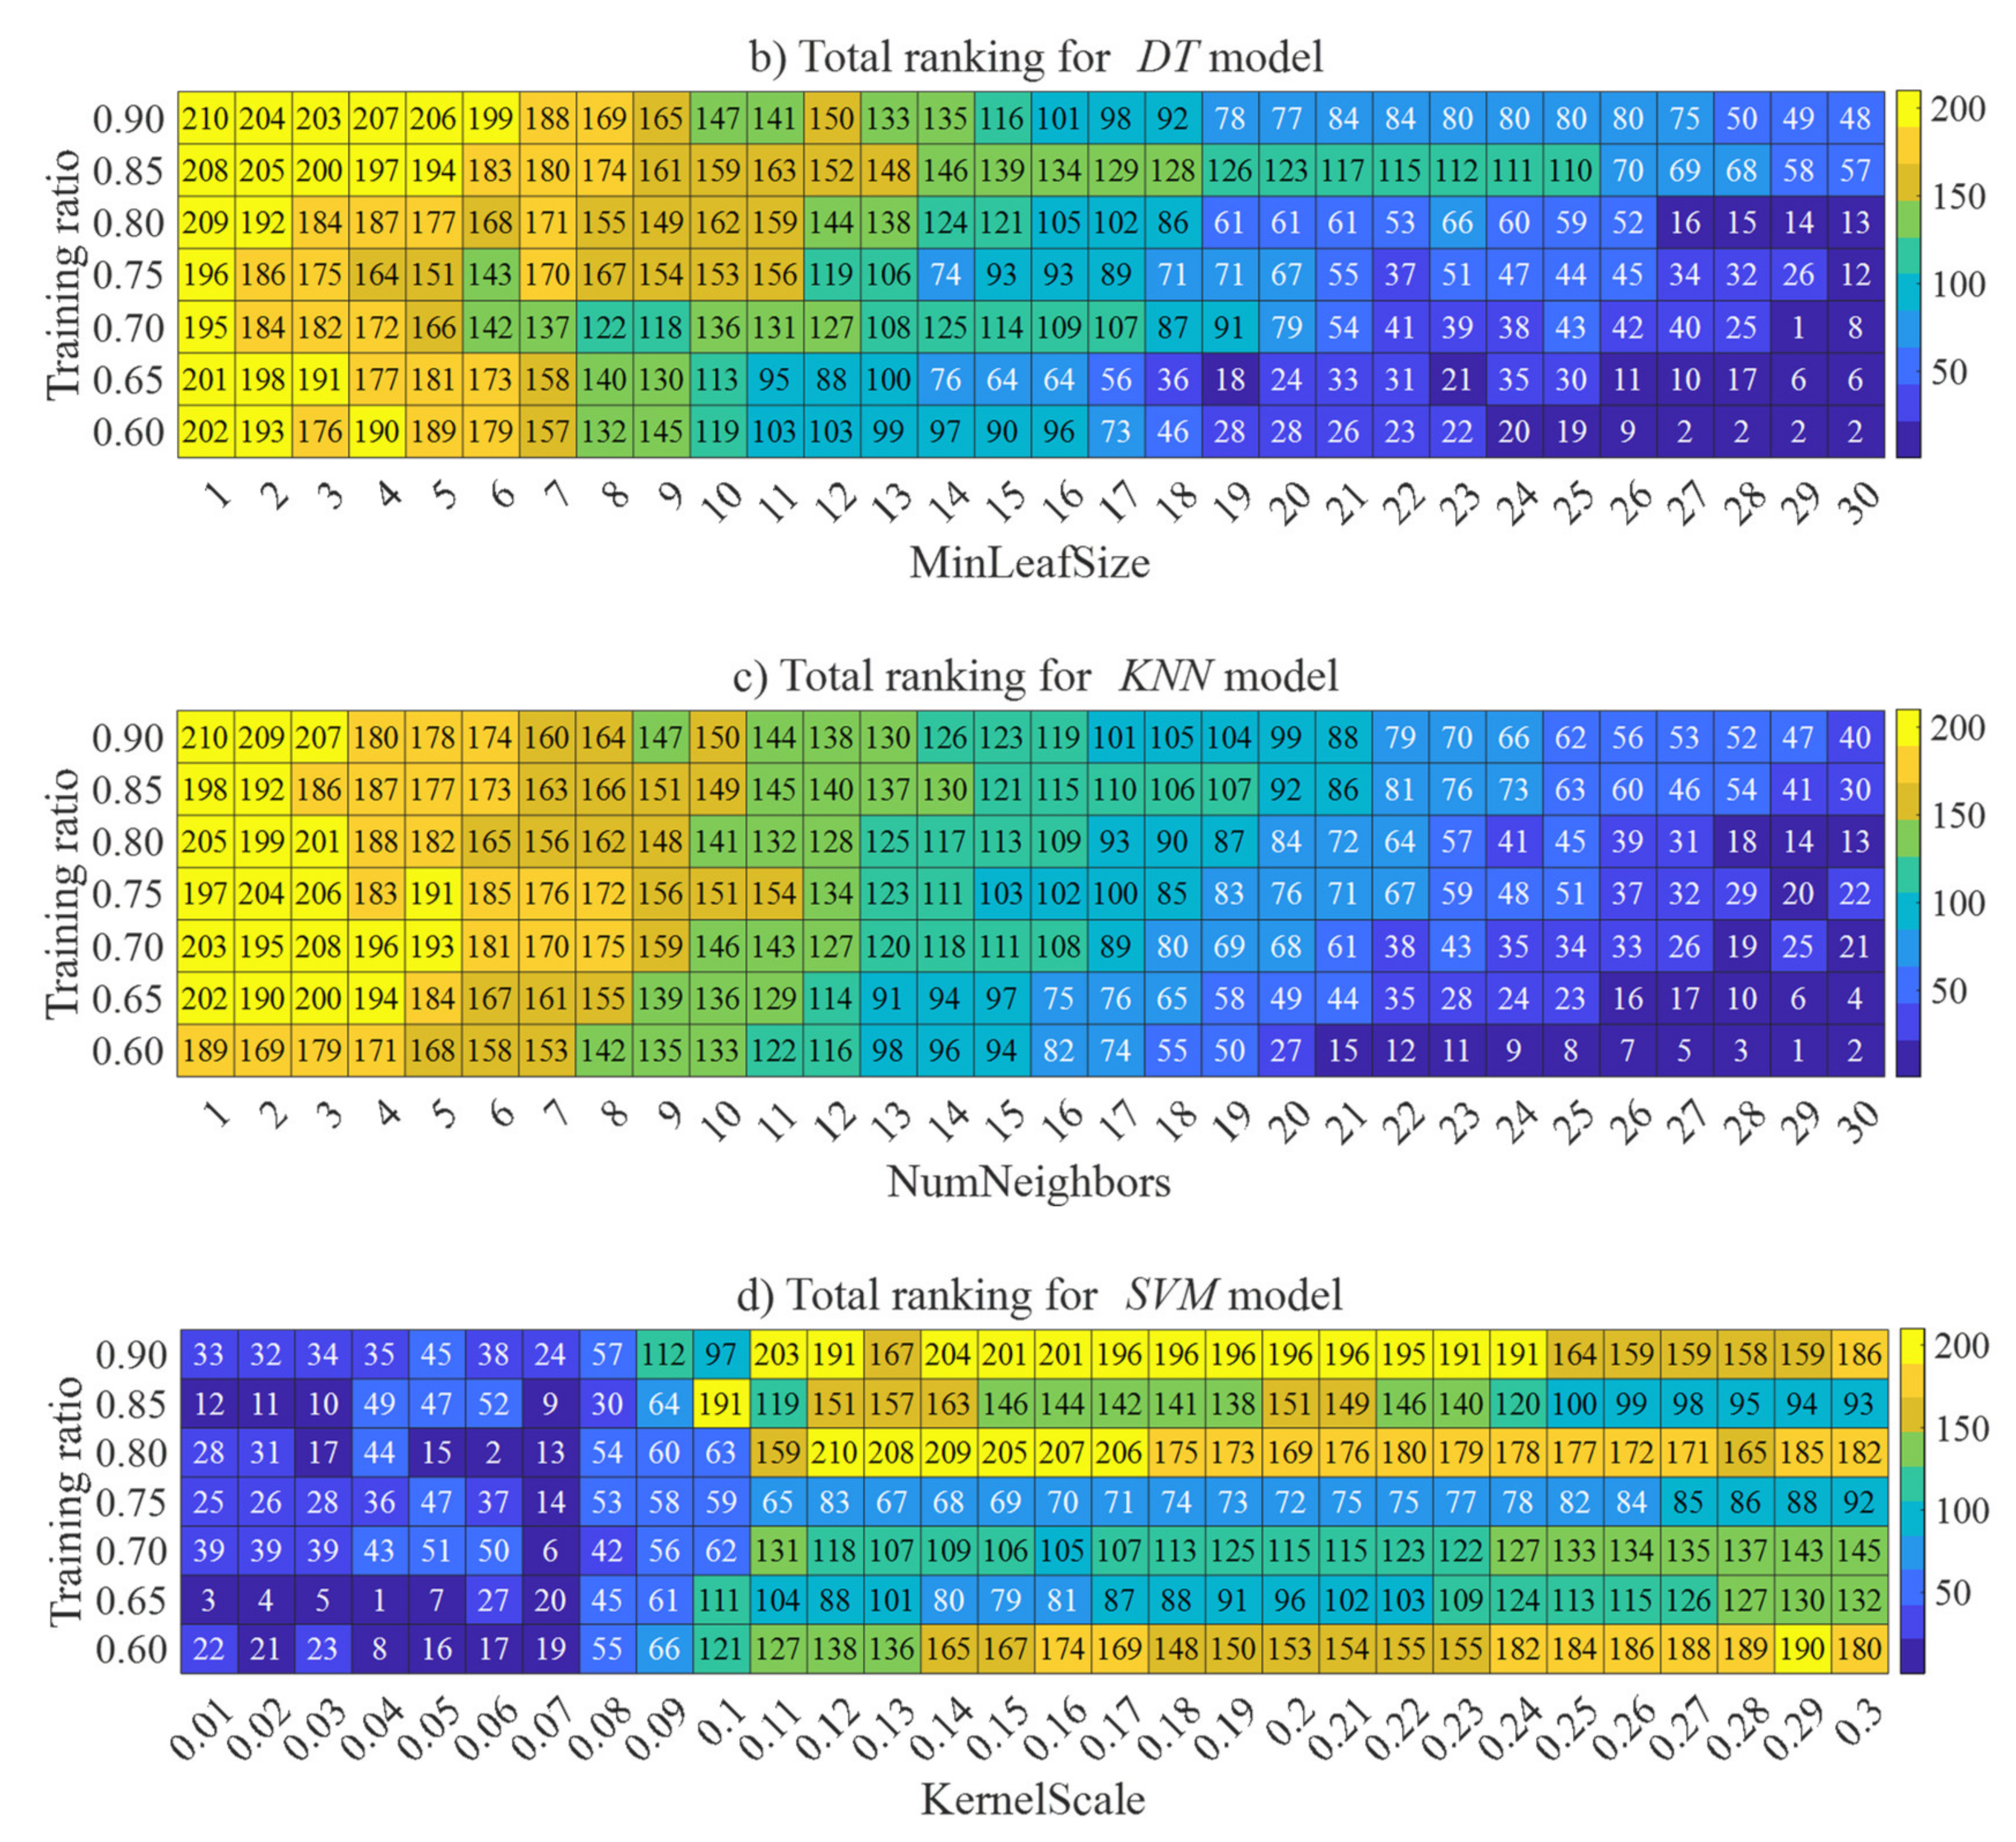
Figure 4, Figure 5, Figure 6, Figure 7 and Figure 8 show the performance of ML models, in which R 2 , R M S E , and a 20 i n d e x are measured for various scenarios in training ML models. It should be noted that 210 cases, which combine 7 training ratios (i.e., 0.6, 0.65, 0.7, 0.75, 0.8, 0.85, and 0.9) and 30 values of the model parameter, were trained for each ML model. The ranking of 210 training–testing ratios in each ML model is shown in Figure 9. For MARSs, 30 basis functions were tested, and the best model was obtained with 29 basis functions and a training data ratio of 0.8. For DT, the minimum leaf size ranged from 1 to 30, and the best model was achieved at a leaf size of 1, and the training data ratio was 0.7. For KNNs, the number of nearest neighbors were tested up to 30, and the best model was found with 1-nearest neighbor and a training data ratio of 0.85. For SVM, the ε -insensitive zone, which determines the deviation margin of the predicted point, ranged from 0.01 to 0.3 with an interval of 0.01. As a result, the optimum SVM model achieved at ε was 0.01, and the training data ratio was 0.8. Meanwhile, the best ANN model was obtained when the number of neurons in the hidden layer were 27 and the training data ratio was 0.9. Figure 4, Figure 5, Figure 6, Figure 7 and Figure 8 also demonstrate that the accuracy of the ANN and MARSs models is improved as the number of key parameters of ML models increased. By contrast, the predicting performance of the other ML models was lessened as the number of key parameters increased.

4.3. Comparison of Performance between ML Models and Existing Equations

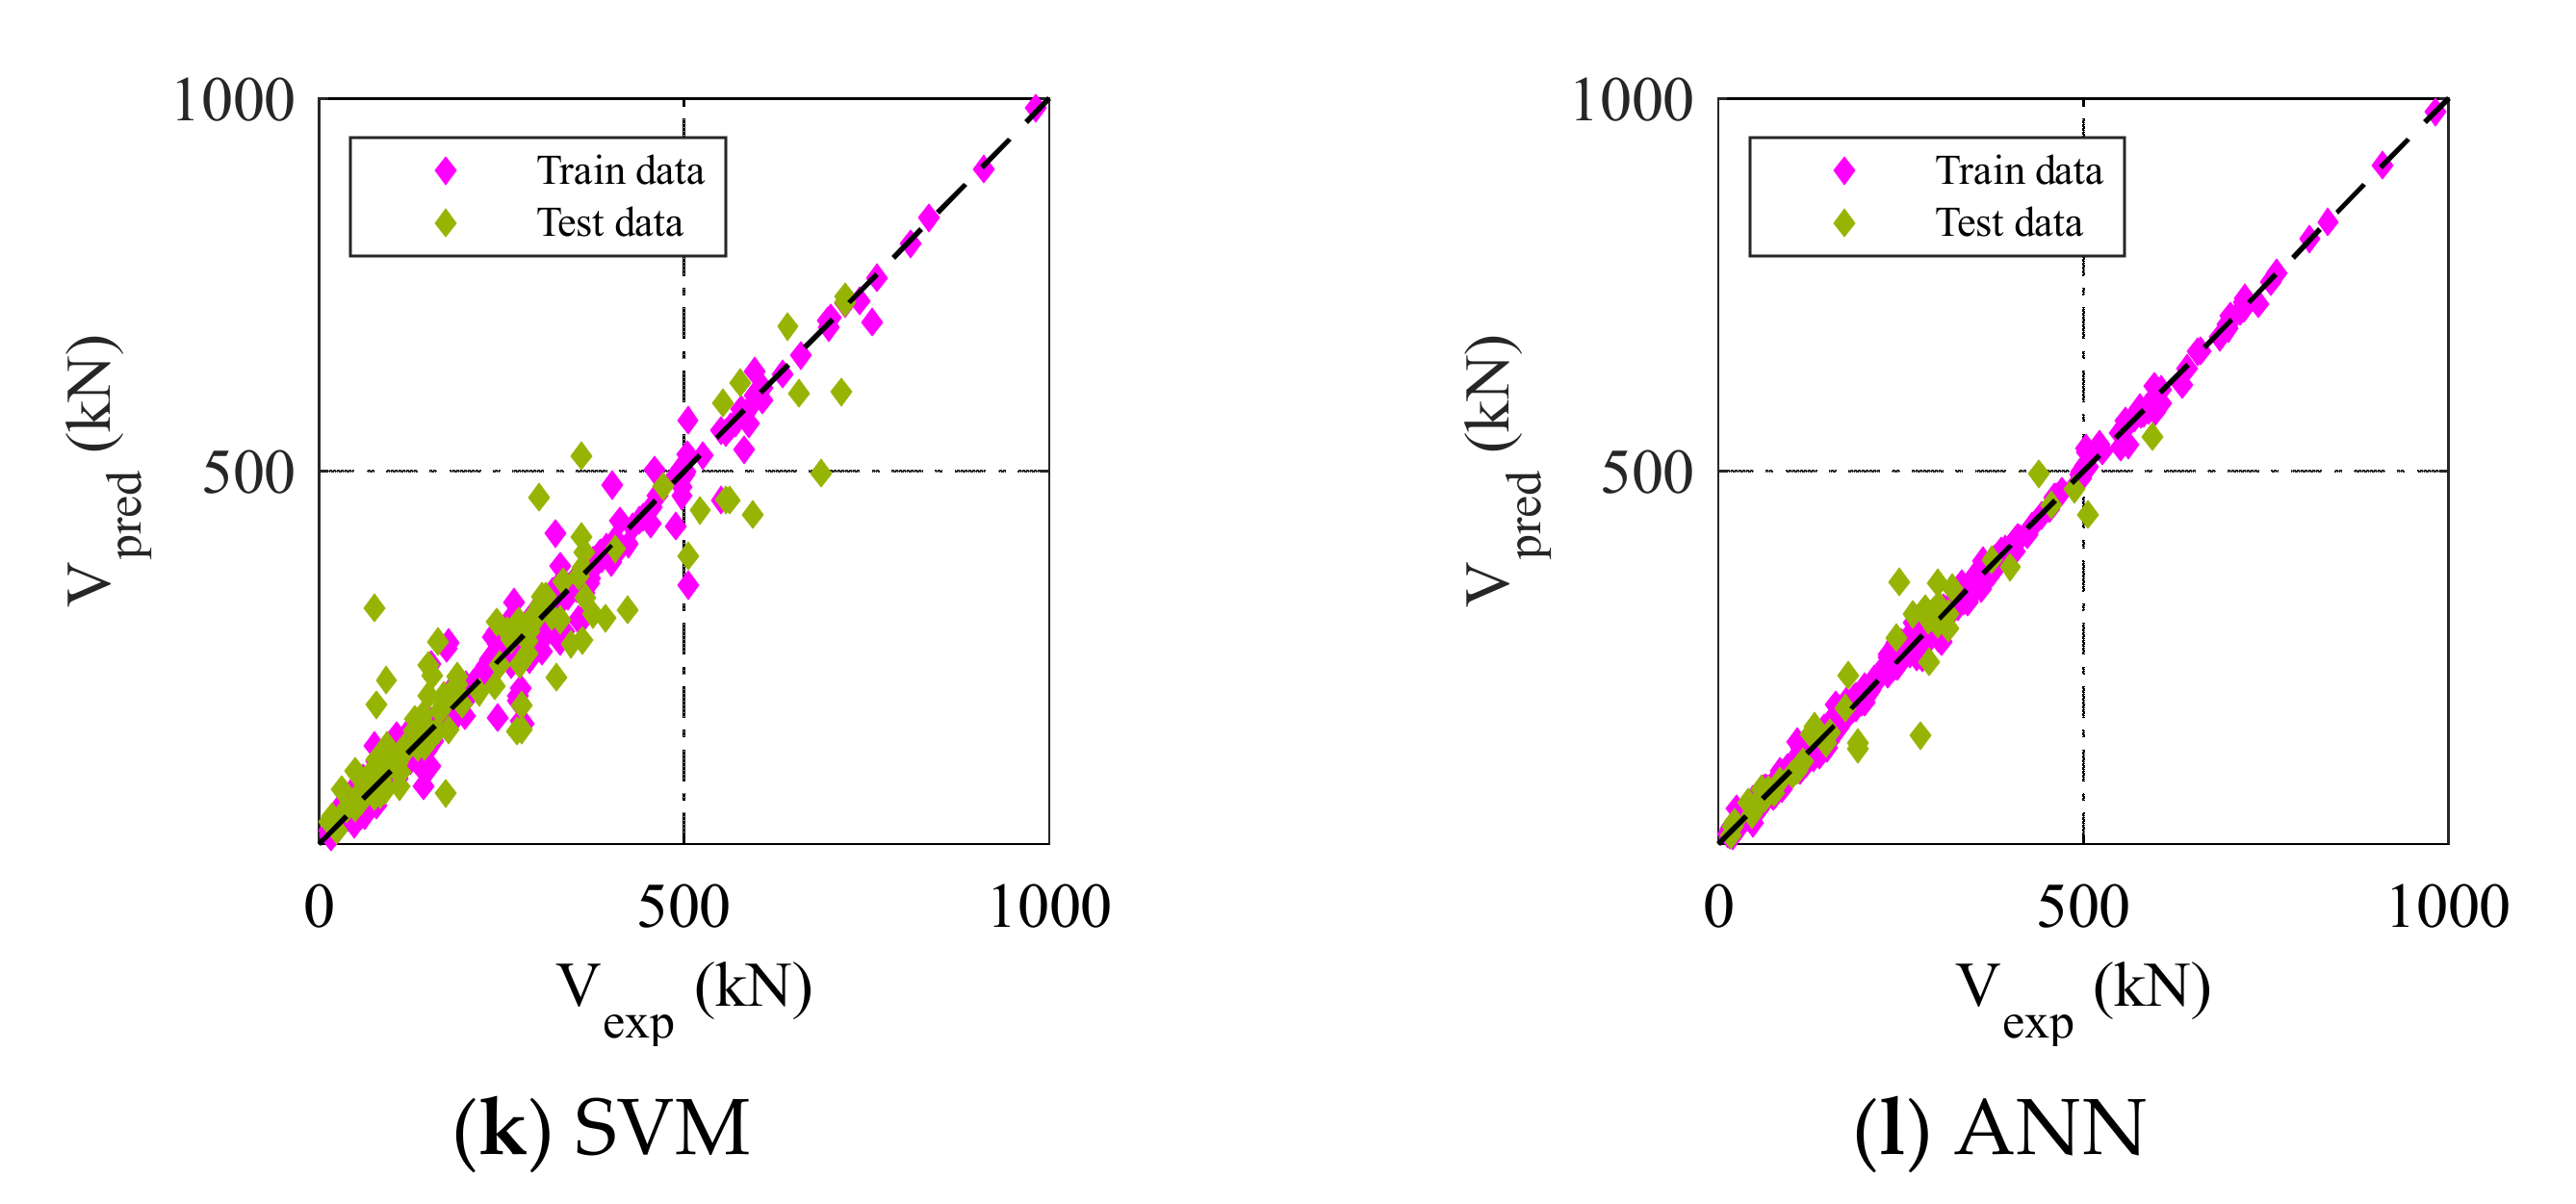
The comparisons of predictive models (i.e., existing equations and ML models) and experimental results are shown in Figure 10. In this figure, the horizontal axis represents the shear strength provided by the experiments, while the calculated and predicted values are shown in the vertical axis. It was obviously demonstrated that the ML models outperformed the empirical equations, which are proposed by design codes and previous studies. The data scattering of ML models is significantly smaller than that obtained by existing formulas. Among these, the ANN and KNNs models showed to be the best options in predicting the shear strength of rectangular RC columns, followed by the SVM and DT models.
Table 3 shows the calculated statistical indicators ( R 2 , a 20 i n d e x , R M S E ) from eleven predicted models in this study. It should be noted that the values in parentheses are for the testing data. The values of R 2 and a 20 i n d e x obtained from the ML models showed to be noticeably higher than those from existing equations. Both the ANN and KNNs models had a superior performance among the used ML models with an R 2 of 0.998 and 1.0 for training data, respectively, and an R 2 of 0.938 and 0.876 for testing data, respectively. Additionally, the R M S E values calculated from the ML techniques were significantly smaller compared to those from empirical equations, specifically ANN and KNNs had the smallest errors. This again implies that ANN and KNNs are the efficient models in predicting the shear strength of RC columns.

5. Failure Mode Classification Using Machine Learning Models

Four ML techniques including NBs, DT, KNNs, and SVM were applied for classifying the failure modes of rectangular RC columns. Ten input parameters in Table 1 were used for implementing those ML algorithms. All ML algorithms in this study were developed using MATLAB. For that, the trial-and-error method was also employed for training models. Again, it is noted that the number of experimental columns that failed in flexure (F), flexure–shear combination (FS), and shear (S) was 335, 115, and 91, respectively. Figure 11a shows the distribution of failure modes in the collected data set. It can be found that the data points of three failure modes were not balanced, in which the number of flexural failure modes predominated in the data samples. The imbalanced data set affects the decision boundary of ML models during the learning process. To overcome this problem, the synthetic minority oversampling technique (SMOTE) [120] was employed to balance the distribution of classes by replicating samples of the minority classes. As a result, the instances of failure modes were equal after balancing, as shown in Figure 11b. The duplicating process was conducted using Scikit-learn module with following steps:
(1)
Randomly select a data point (i.e., sample) from the minority class.
(2)
Determine the nearest neighbors (e.g., 5 data points) of the selected sample.
(3)
Create synthetic samples between two data points in the feature space.
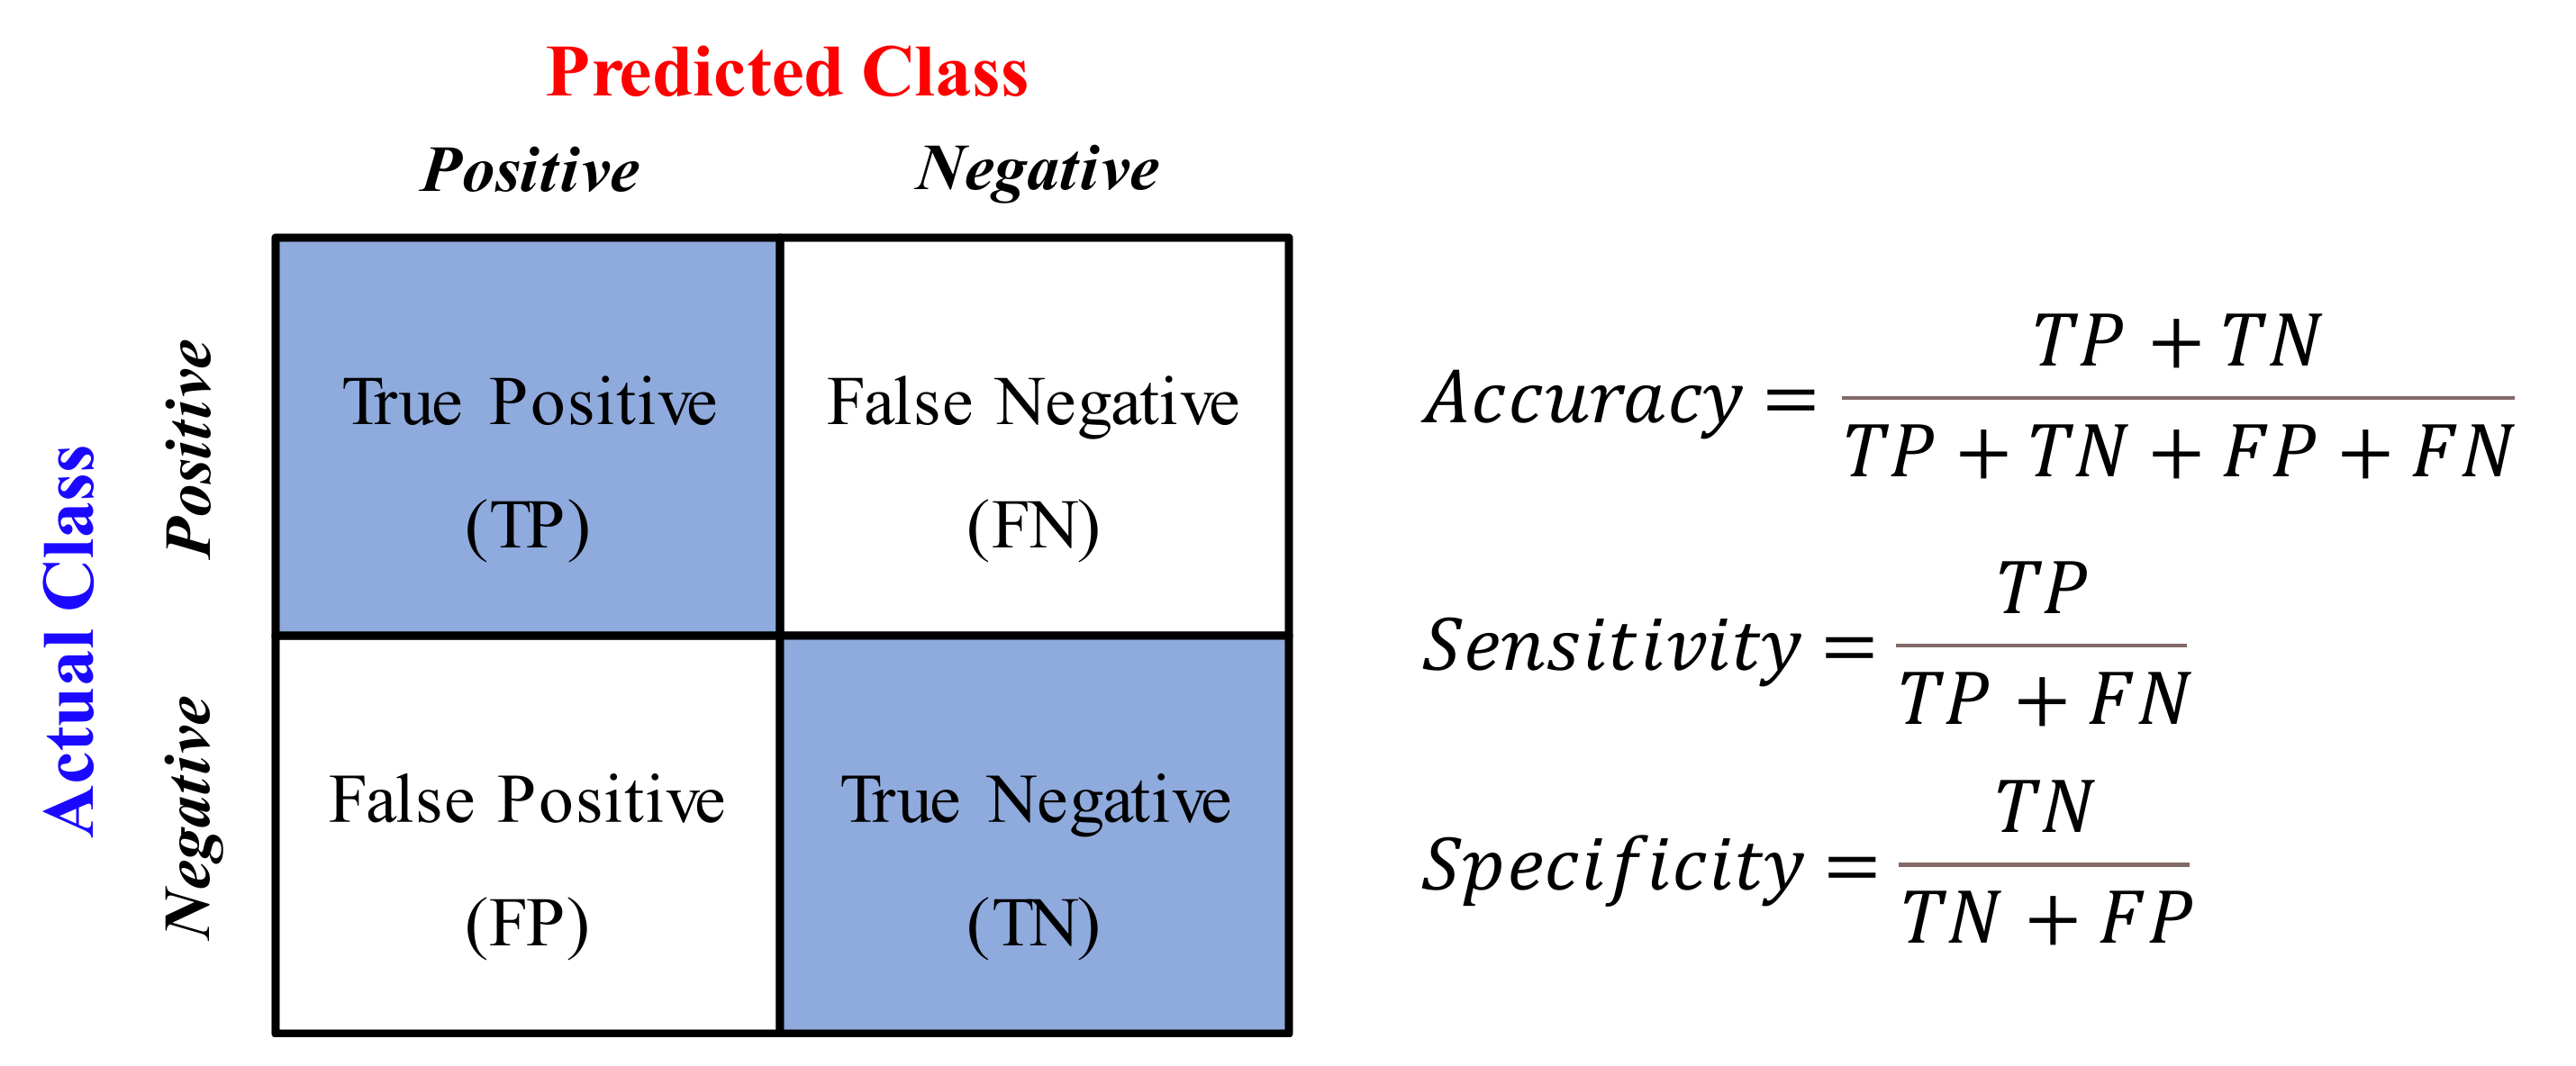
To evaluate the performance of the ML techniques, typical measures consisting of accuracy, sensitivity, specificity, and area under the curve (AUC) were used.
  • Accuracy is expressed as the ratio of the sum of correct classifications to the total number of classes.
  • Specificity represents the proportion of the negative class correctly classified.
  • Sensitivity (i.e., recall) is measured as the ratio of the number of accurately predicted failure modes to the total number of failure modes considered in the data.
  • AUC is the indicator for measuring the ability of an ML model to distinguish between classes. AUC is the area under the Receiver Operating Characteristic (ROC) curve, which is plotted by S e n s i t i v i t y in the y-axis against 1 - S p e c i f i c i t y in the x-axis. The higher the AUC, the better the performance of an ML model.
Figure 12 depicts the concept of the confusion matrix and how to calculate those measuring indicators. It should be noted that the higher values of accuracy, sensitivity, specificity, F1-score, and AUC, the better the performance of the machine learning techniques. However, the sensitivity and specificity should be simultaneously going up to indicate the good performance of the models.
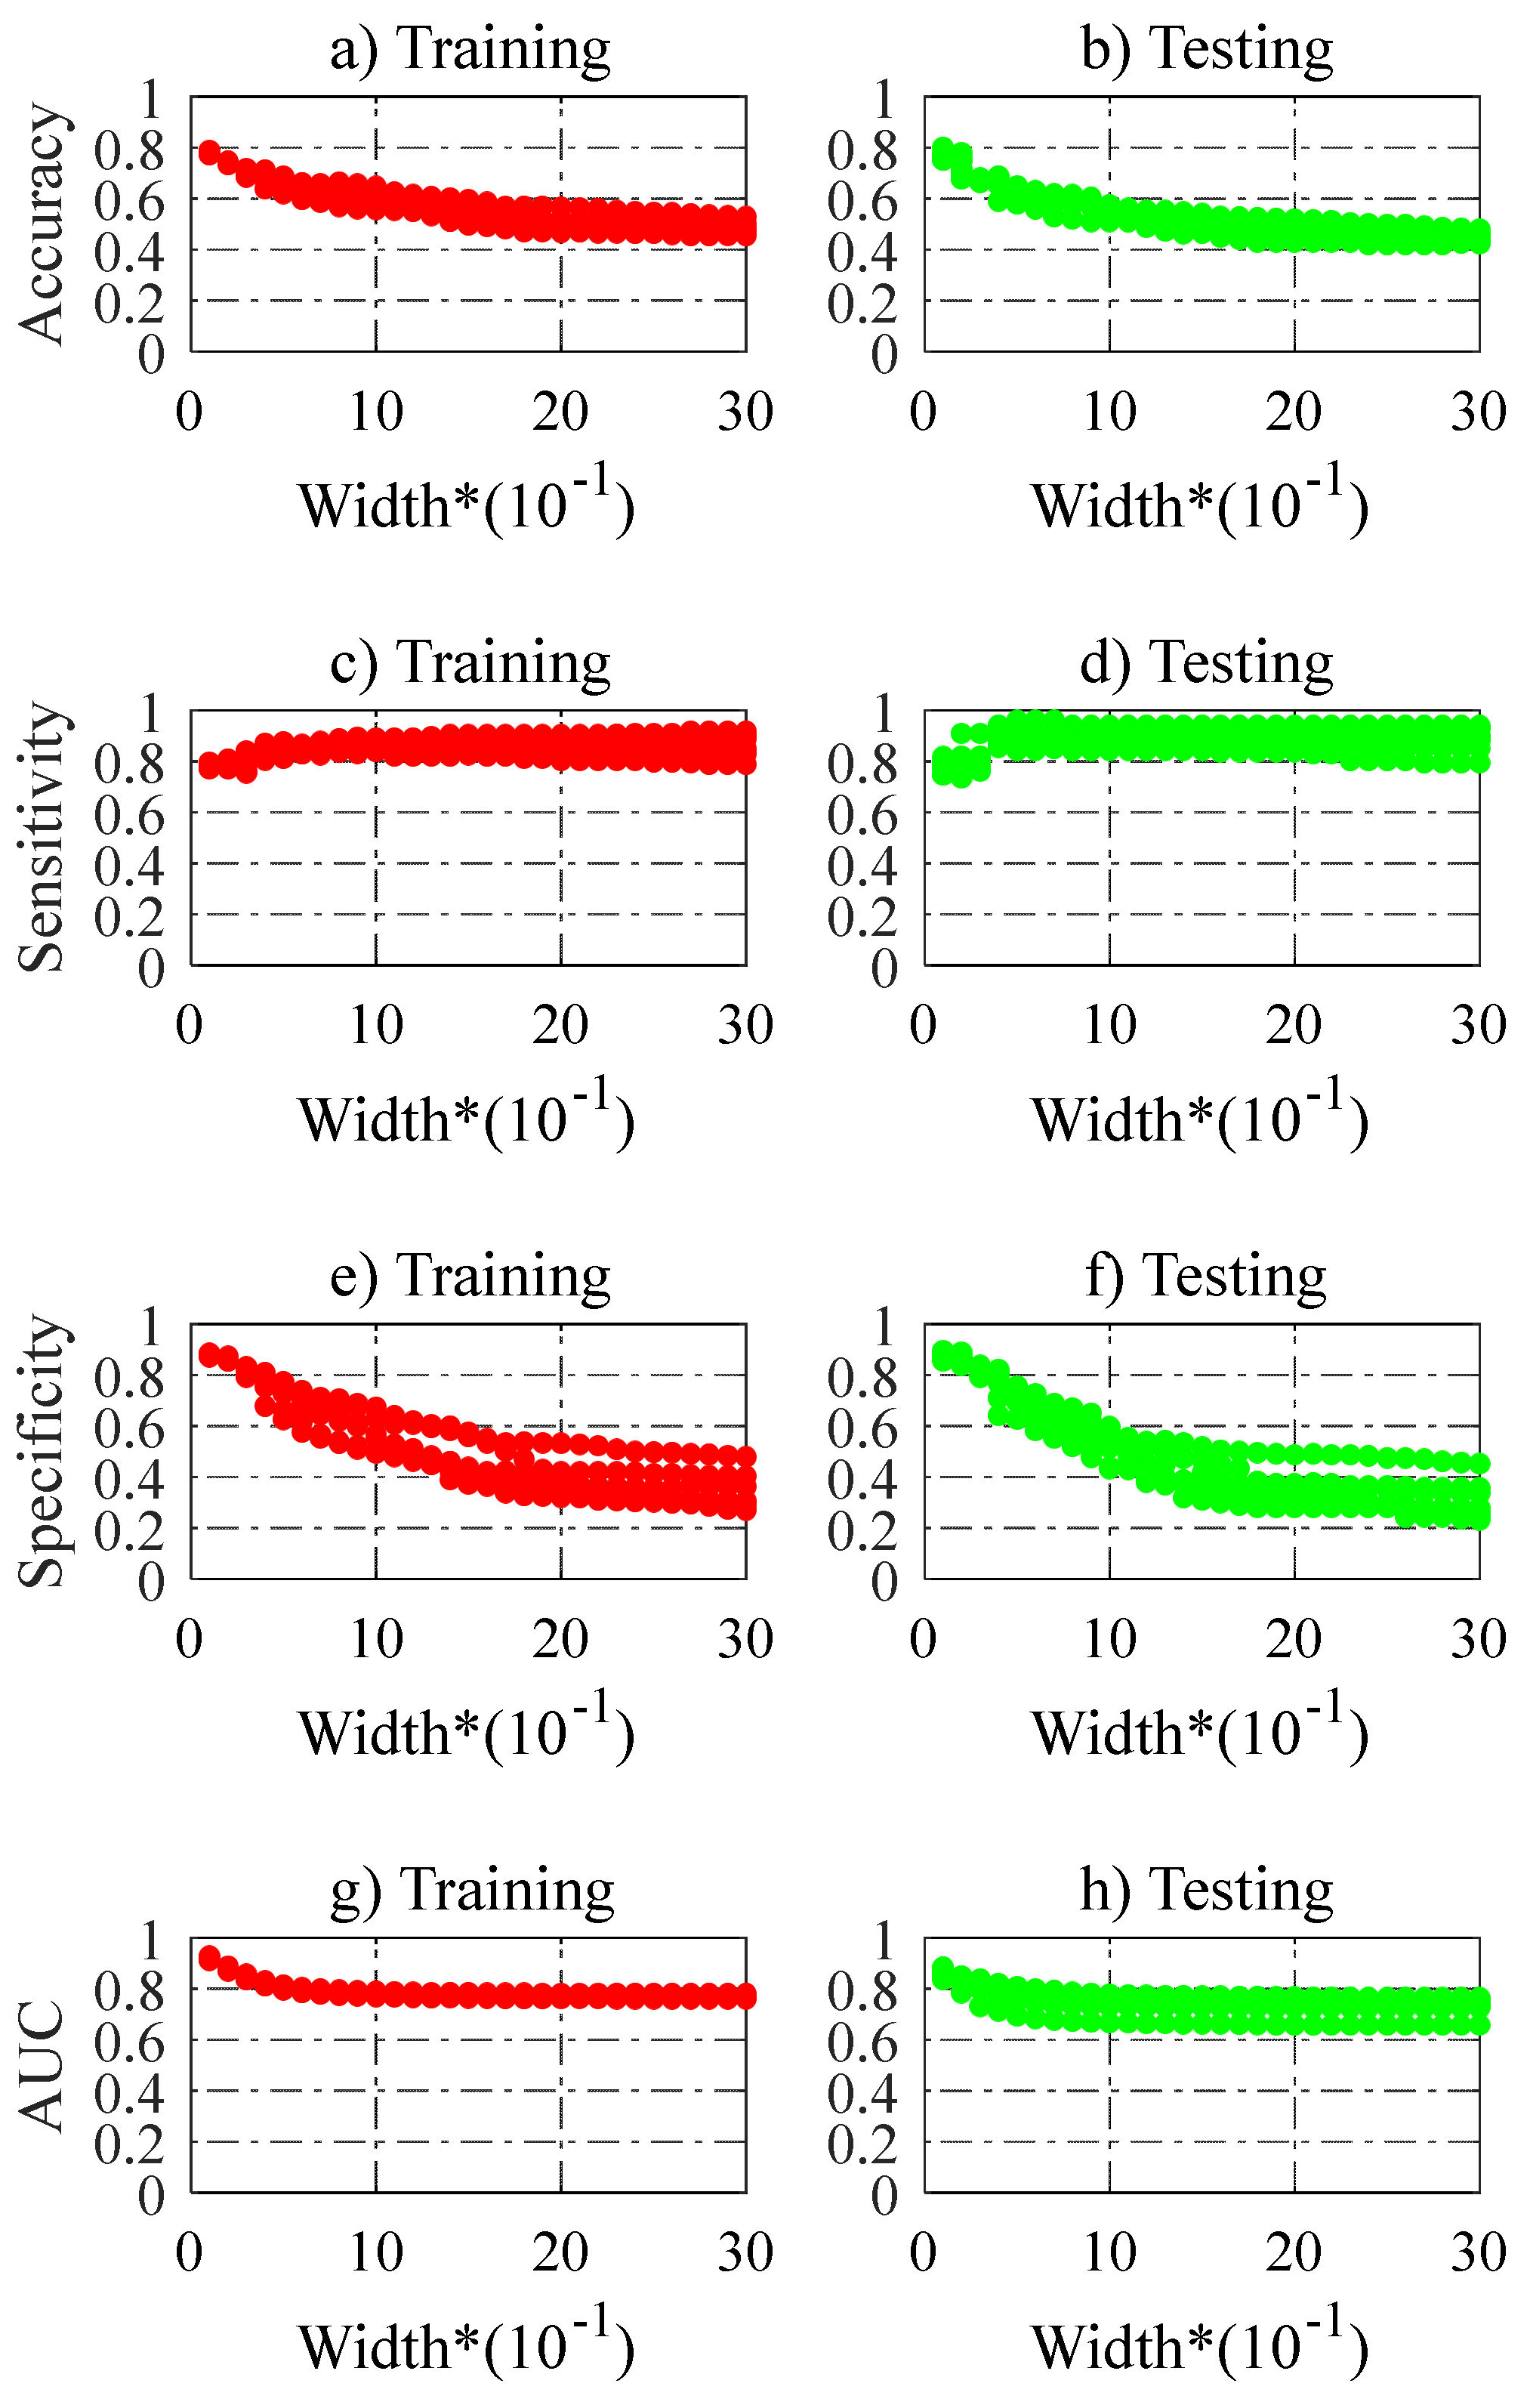
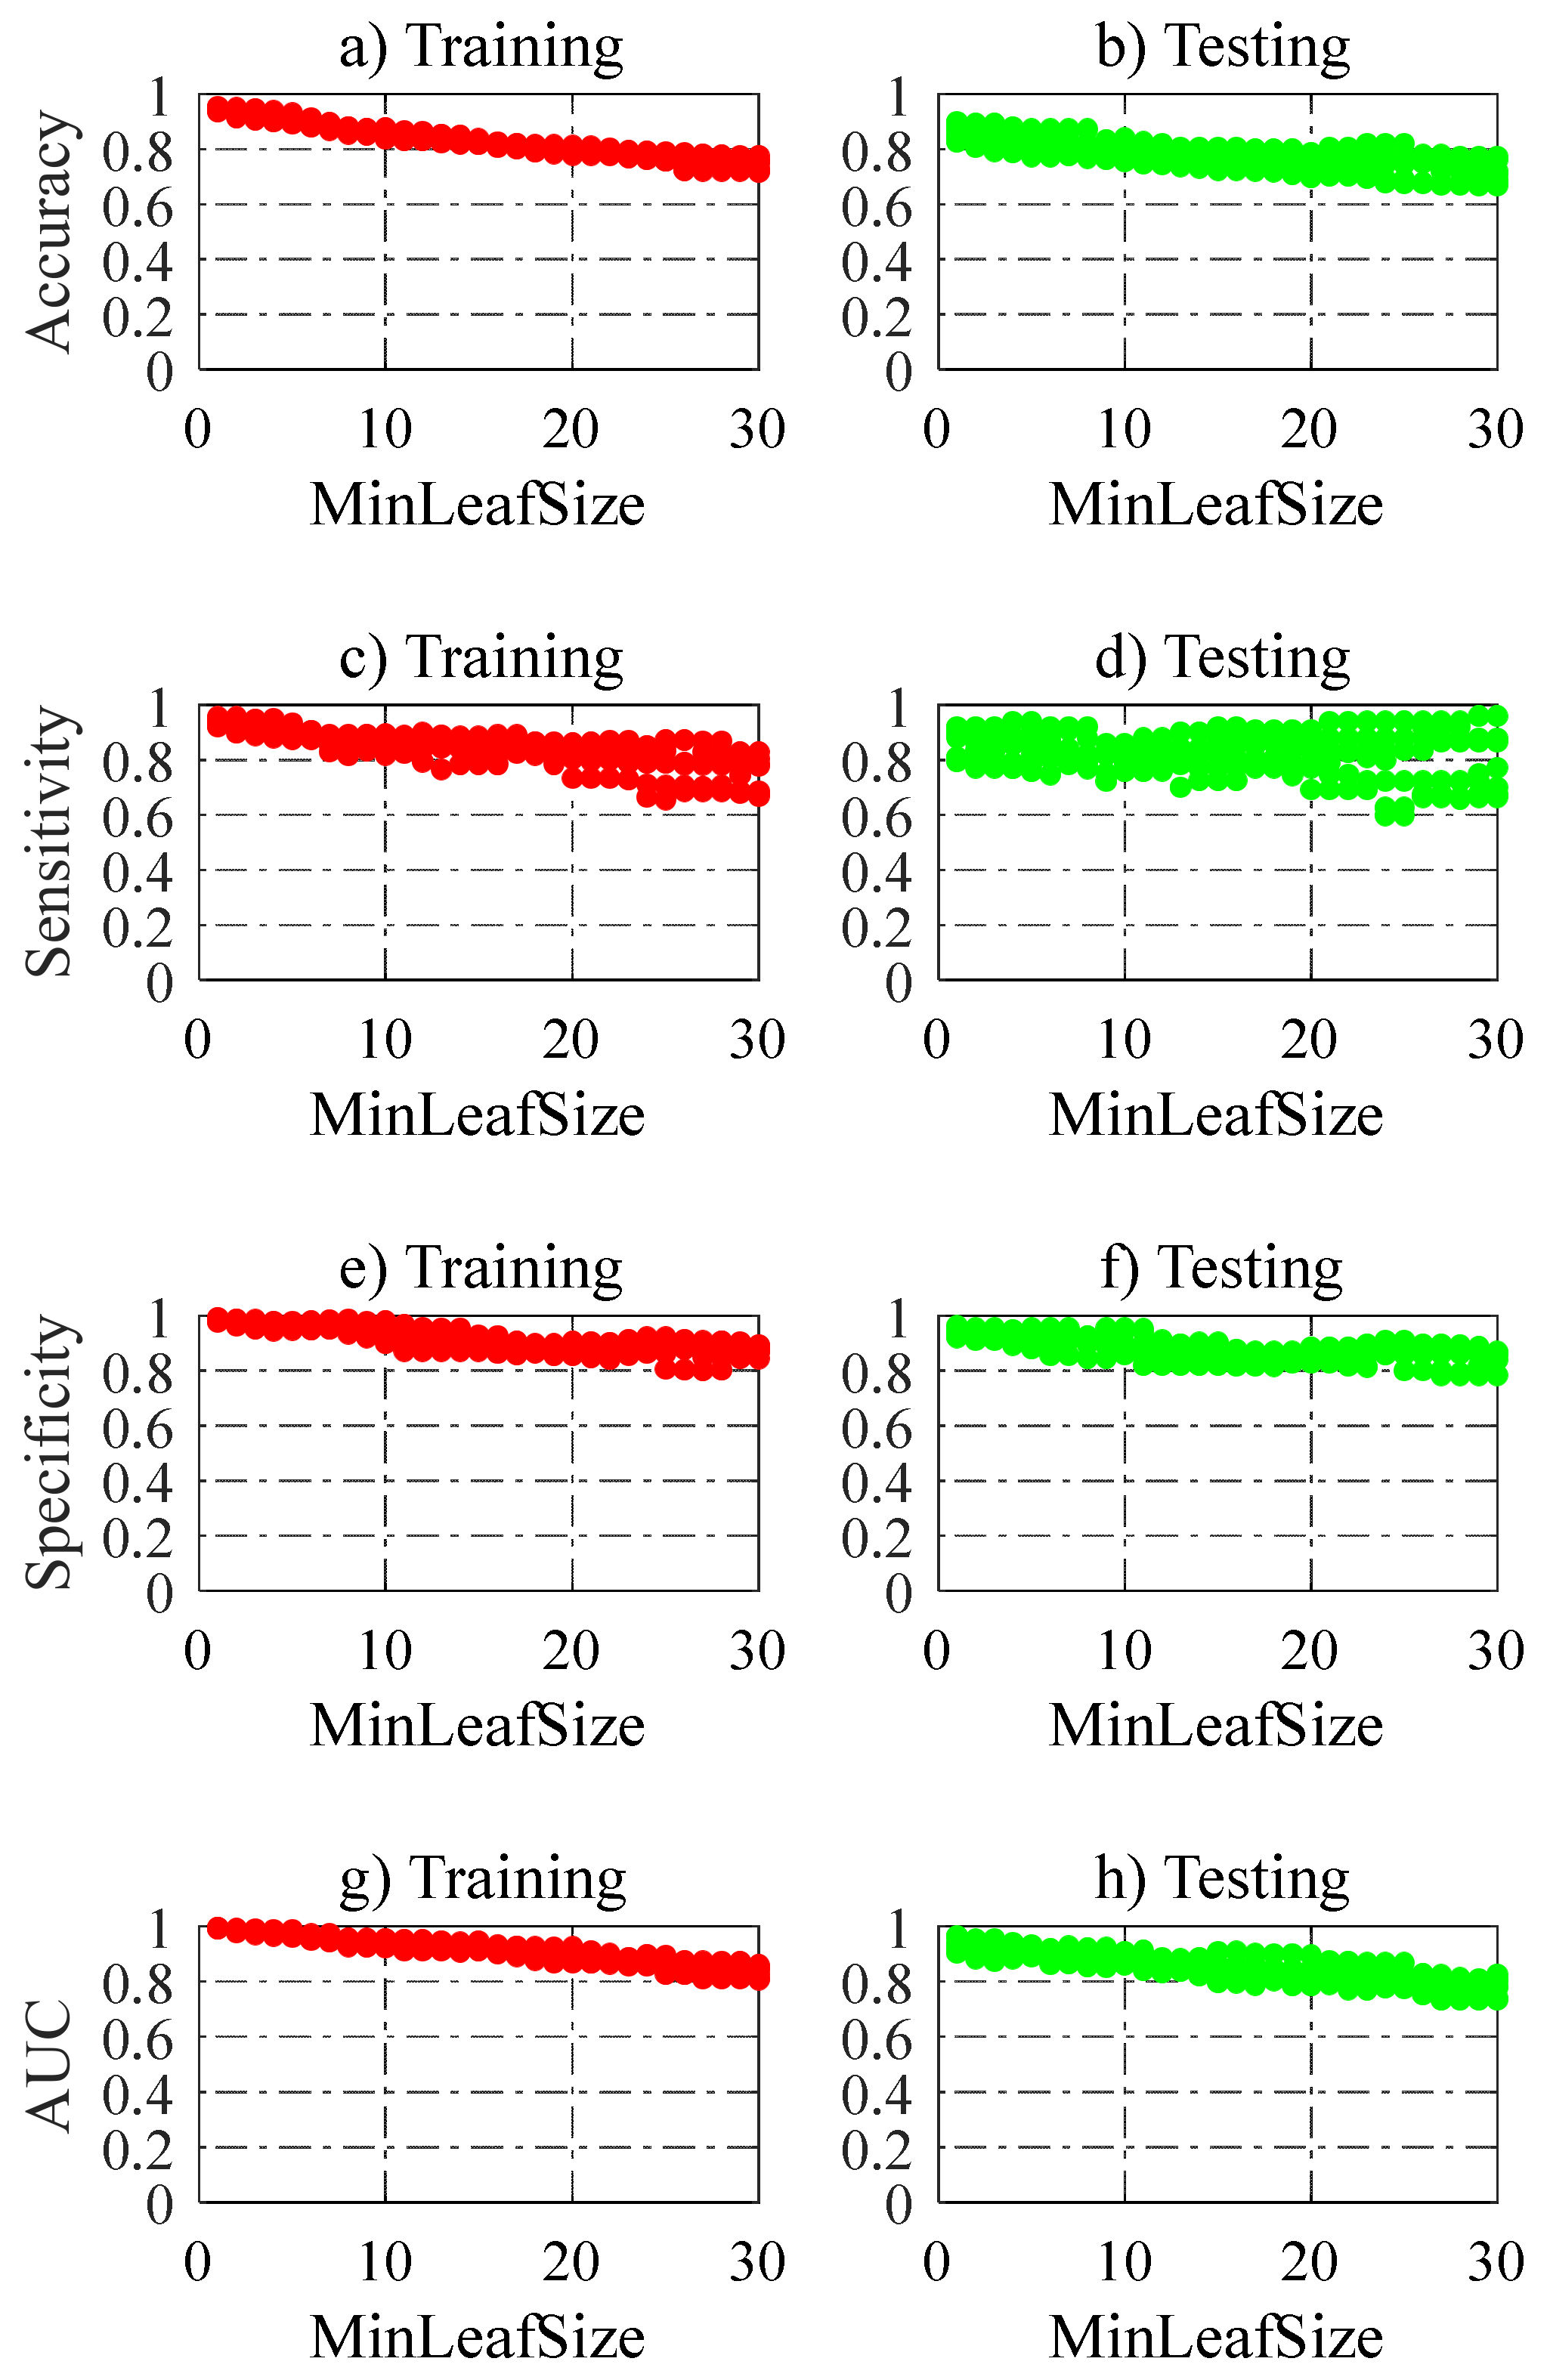
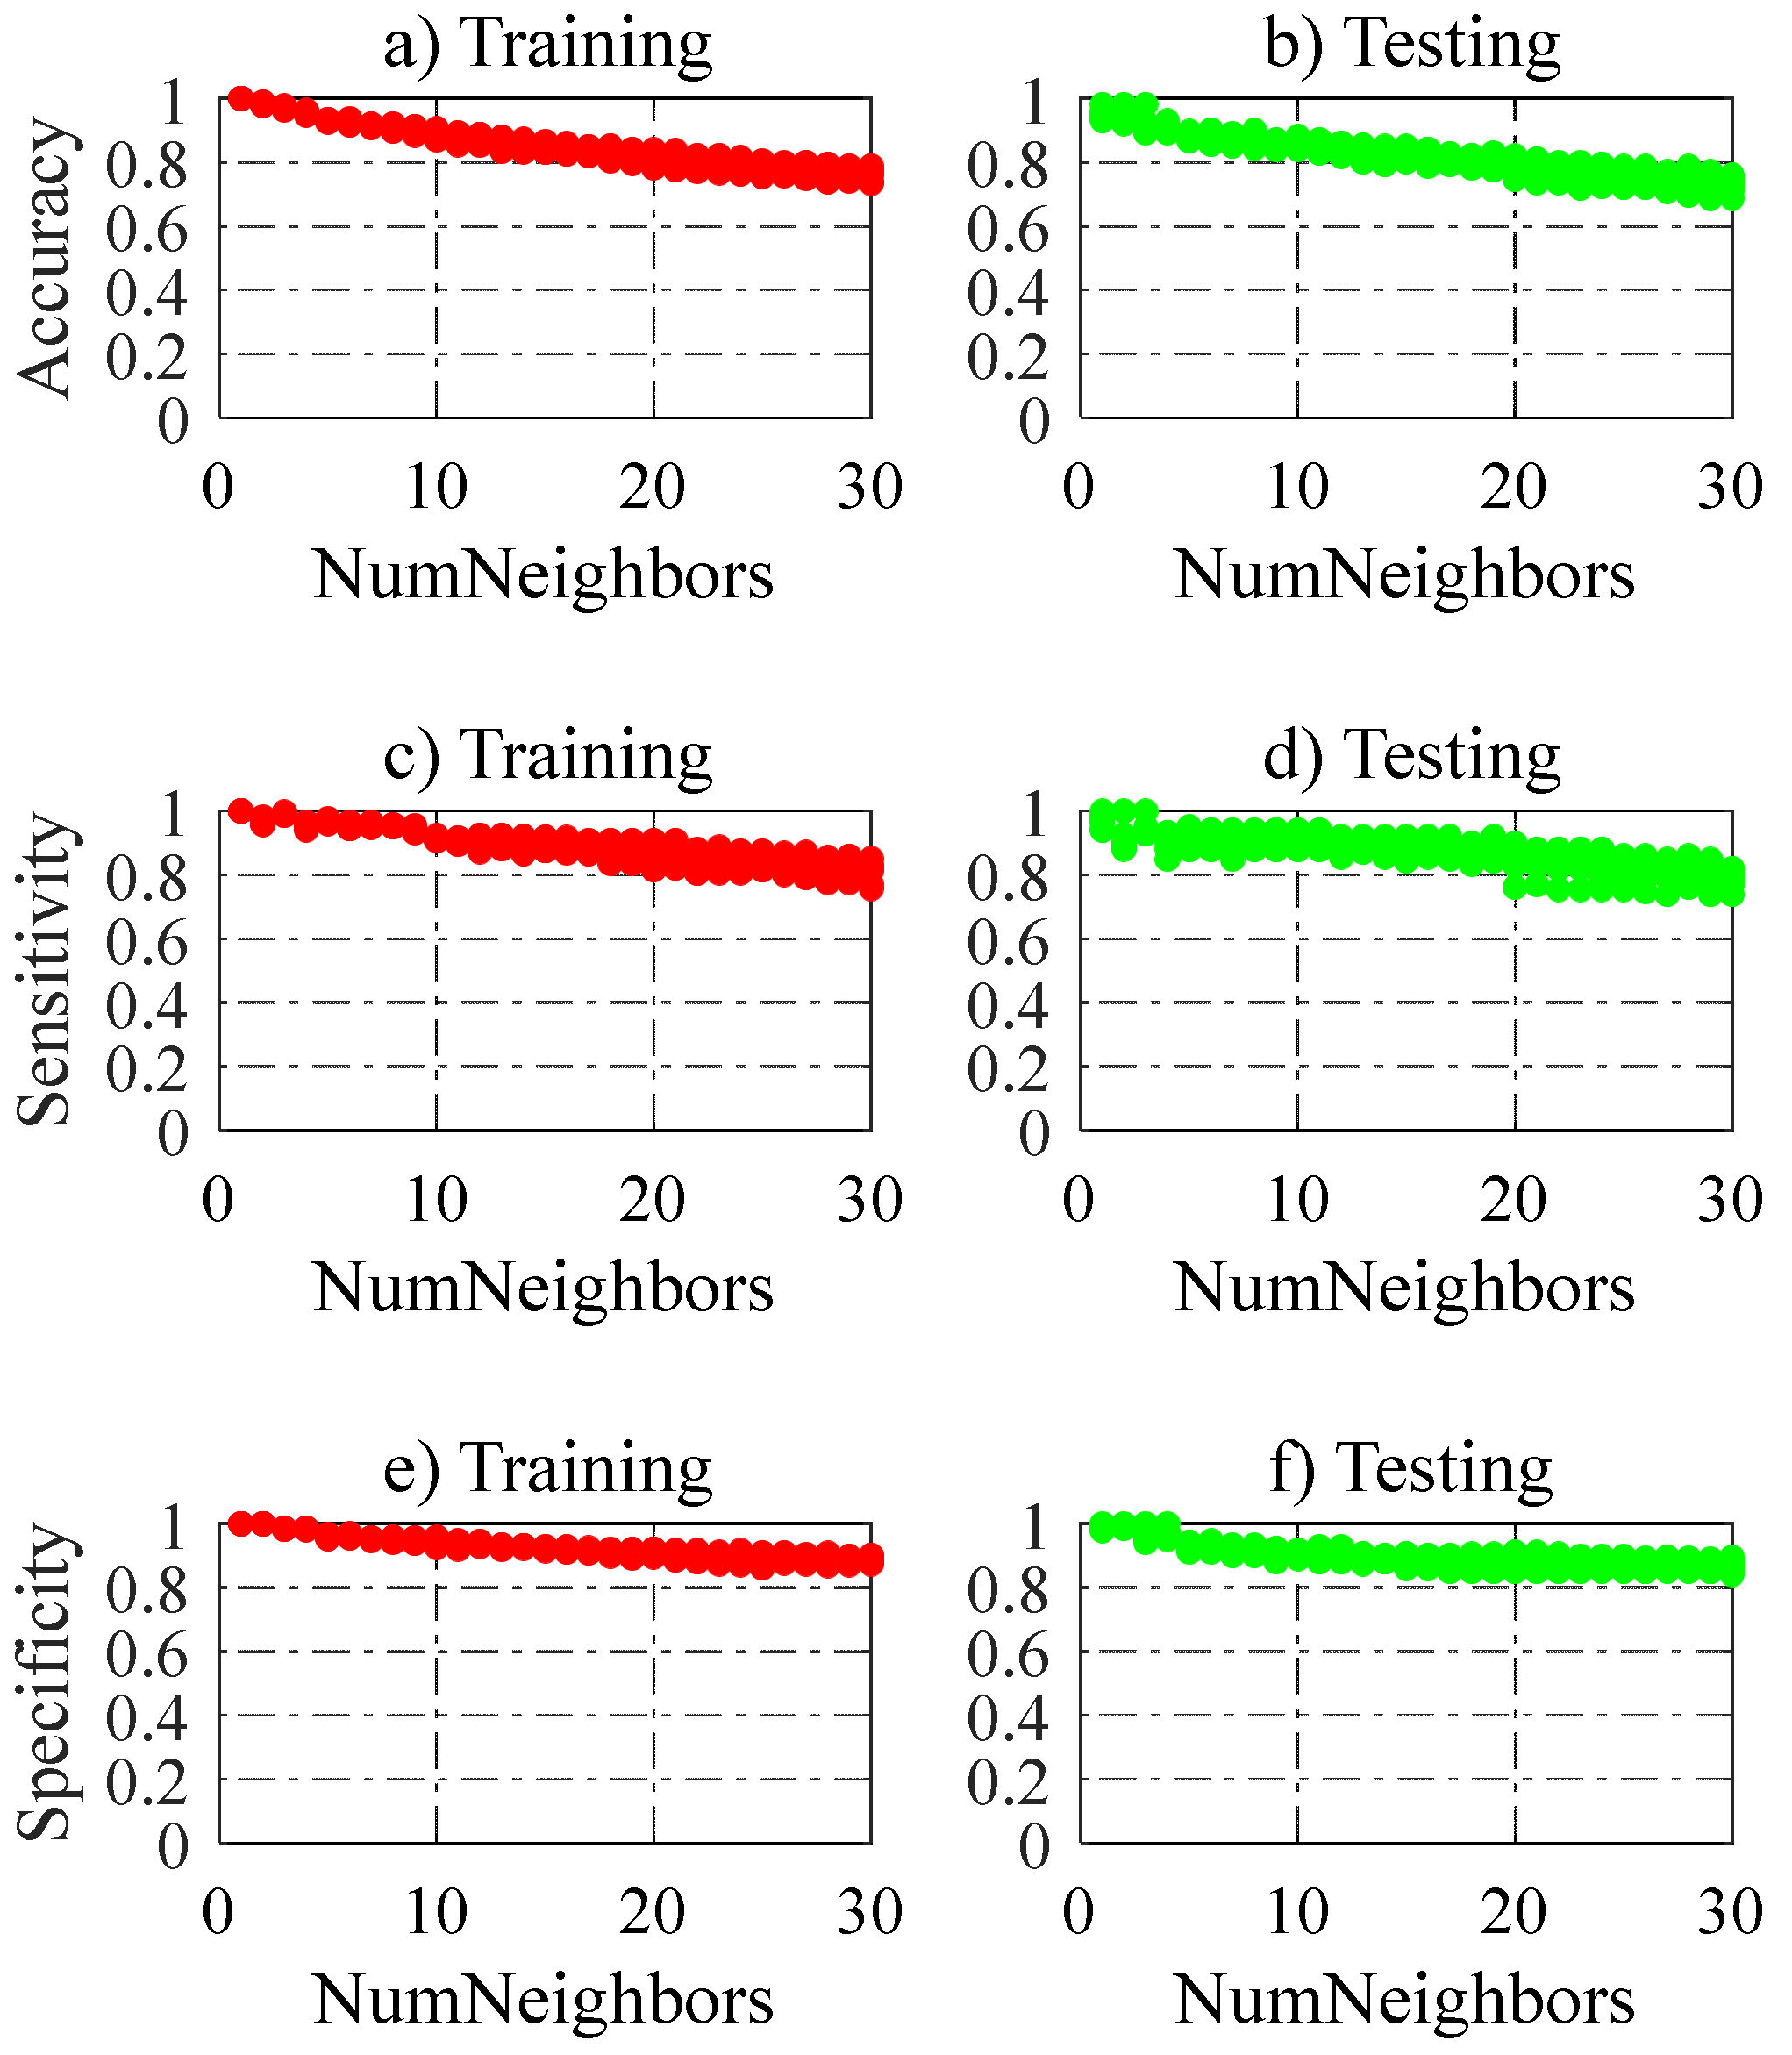
Figure 13, Figure 14, Figure 15 and Figure 16 show the performance of four classifying ML models, in which 210 cases were investigated for each model. It should be noted that the key parameter for optimizing NBs is the equal bin width value. Meanwhile, the minimum leaf size was used for DT; the number of nearest neighbors was for KNNs; the kernel scale was for SVM, and the number of neurons in the hidden layer was for ANN. It can be observed that the highest accuracy of the NBs, DT, and KNNs models was obtained at the smallest value of the model parameters, whereas SVM was optimized at the kernel scale of 0.12 and the training data ratio of 0.8.
The ranking of 210 cases in each classifying model is shown in Figure 17. For NBs, 30 bin width values were tested, and the best model was obtained with 0.4 and at a training data ratio of 0.85. For DT, the minimum leaf size ranged from 1 to 30, and the best model was achieved at the leaf size of 1, and the training data ratio was 0.9. For KNNs, the number of nearest neighbors was tested up to 30, and the best model was found with 1-nearest neighbor and a training data ratio of 0.9. For SVM, the kernel scale ranged from 0.01 to 0.3 with an interval of 0.01. As a result, the optimum SVM model was achieved at a scale of 0.12 and a training ratio of 0.8.
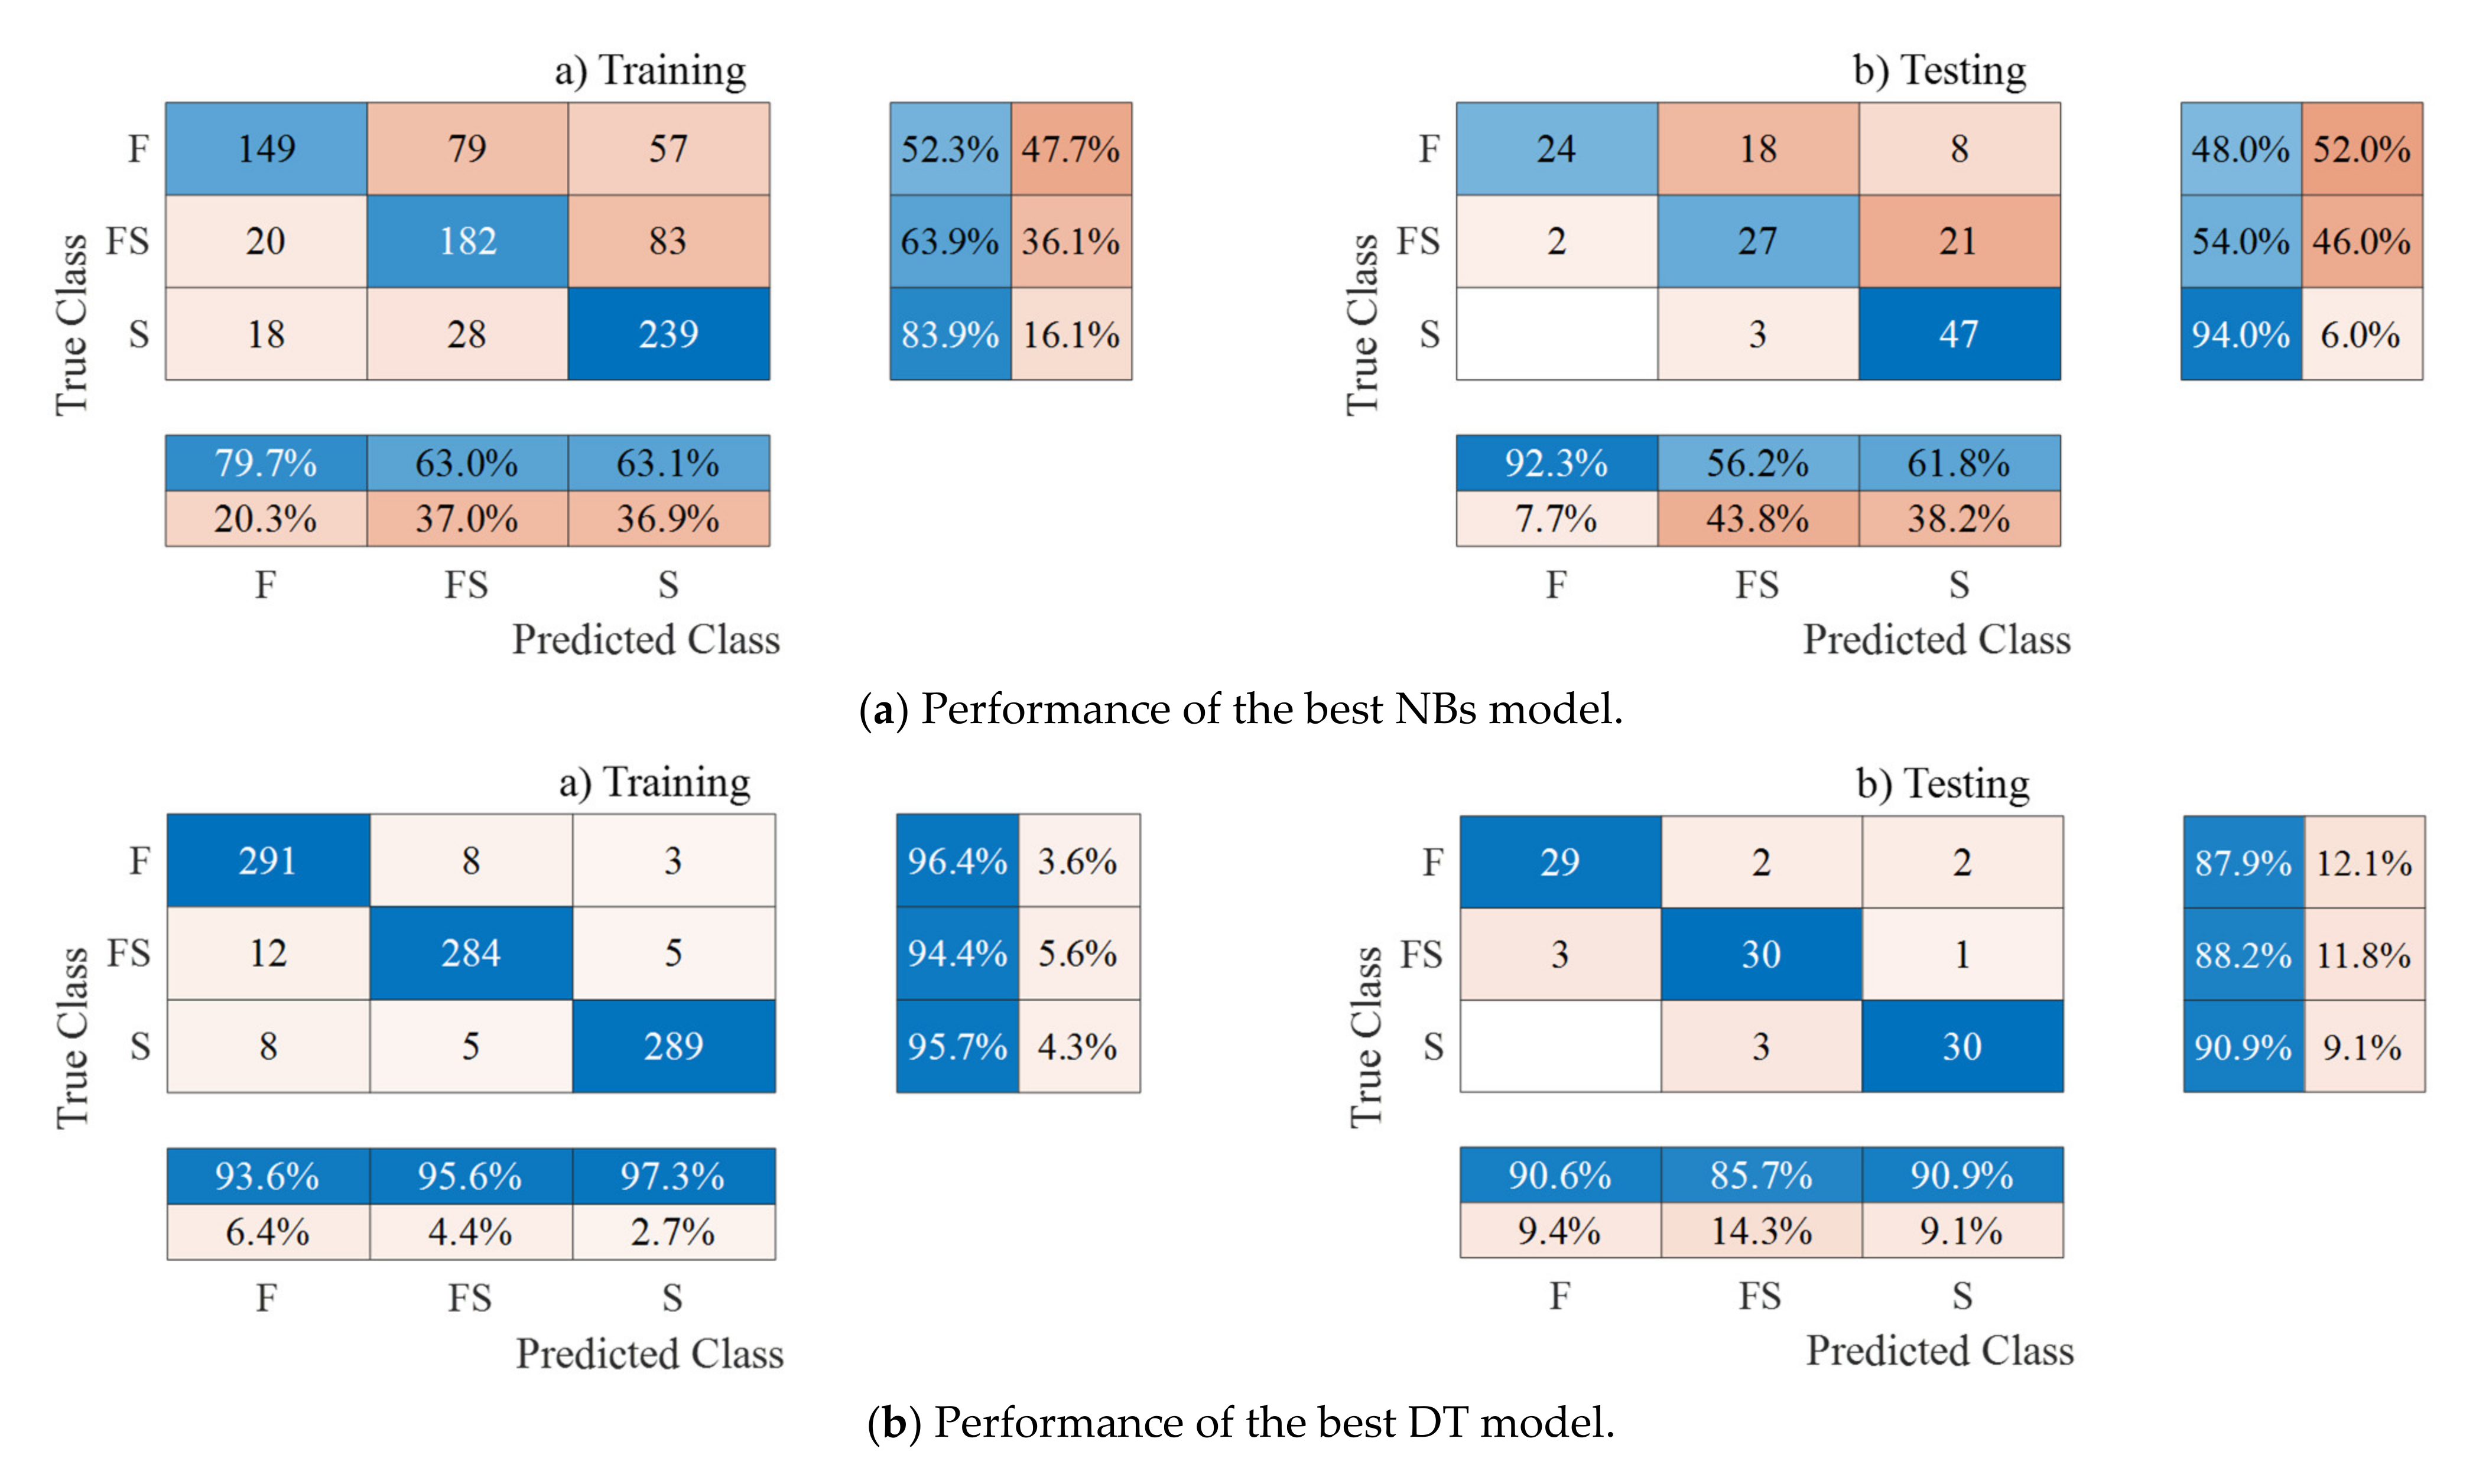
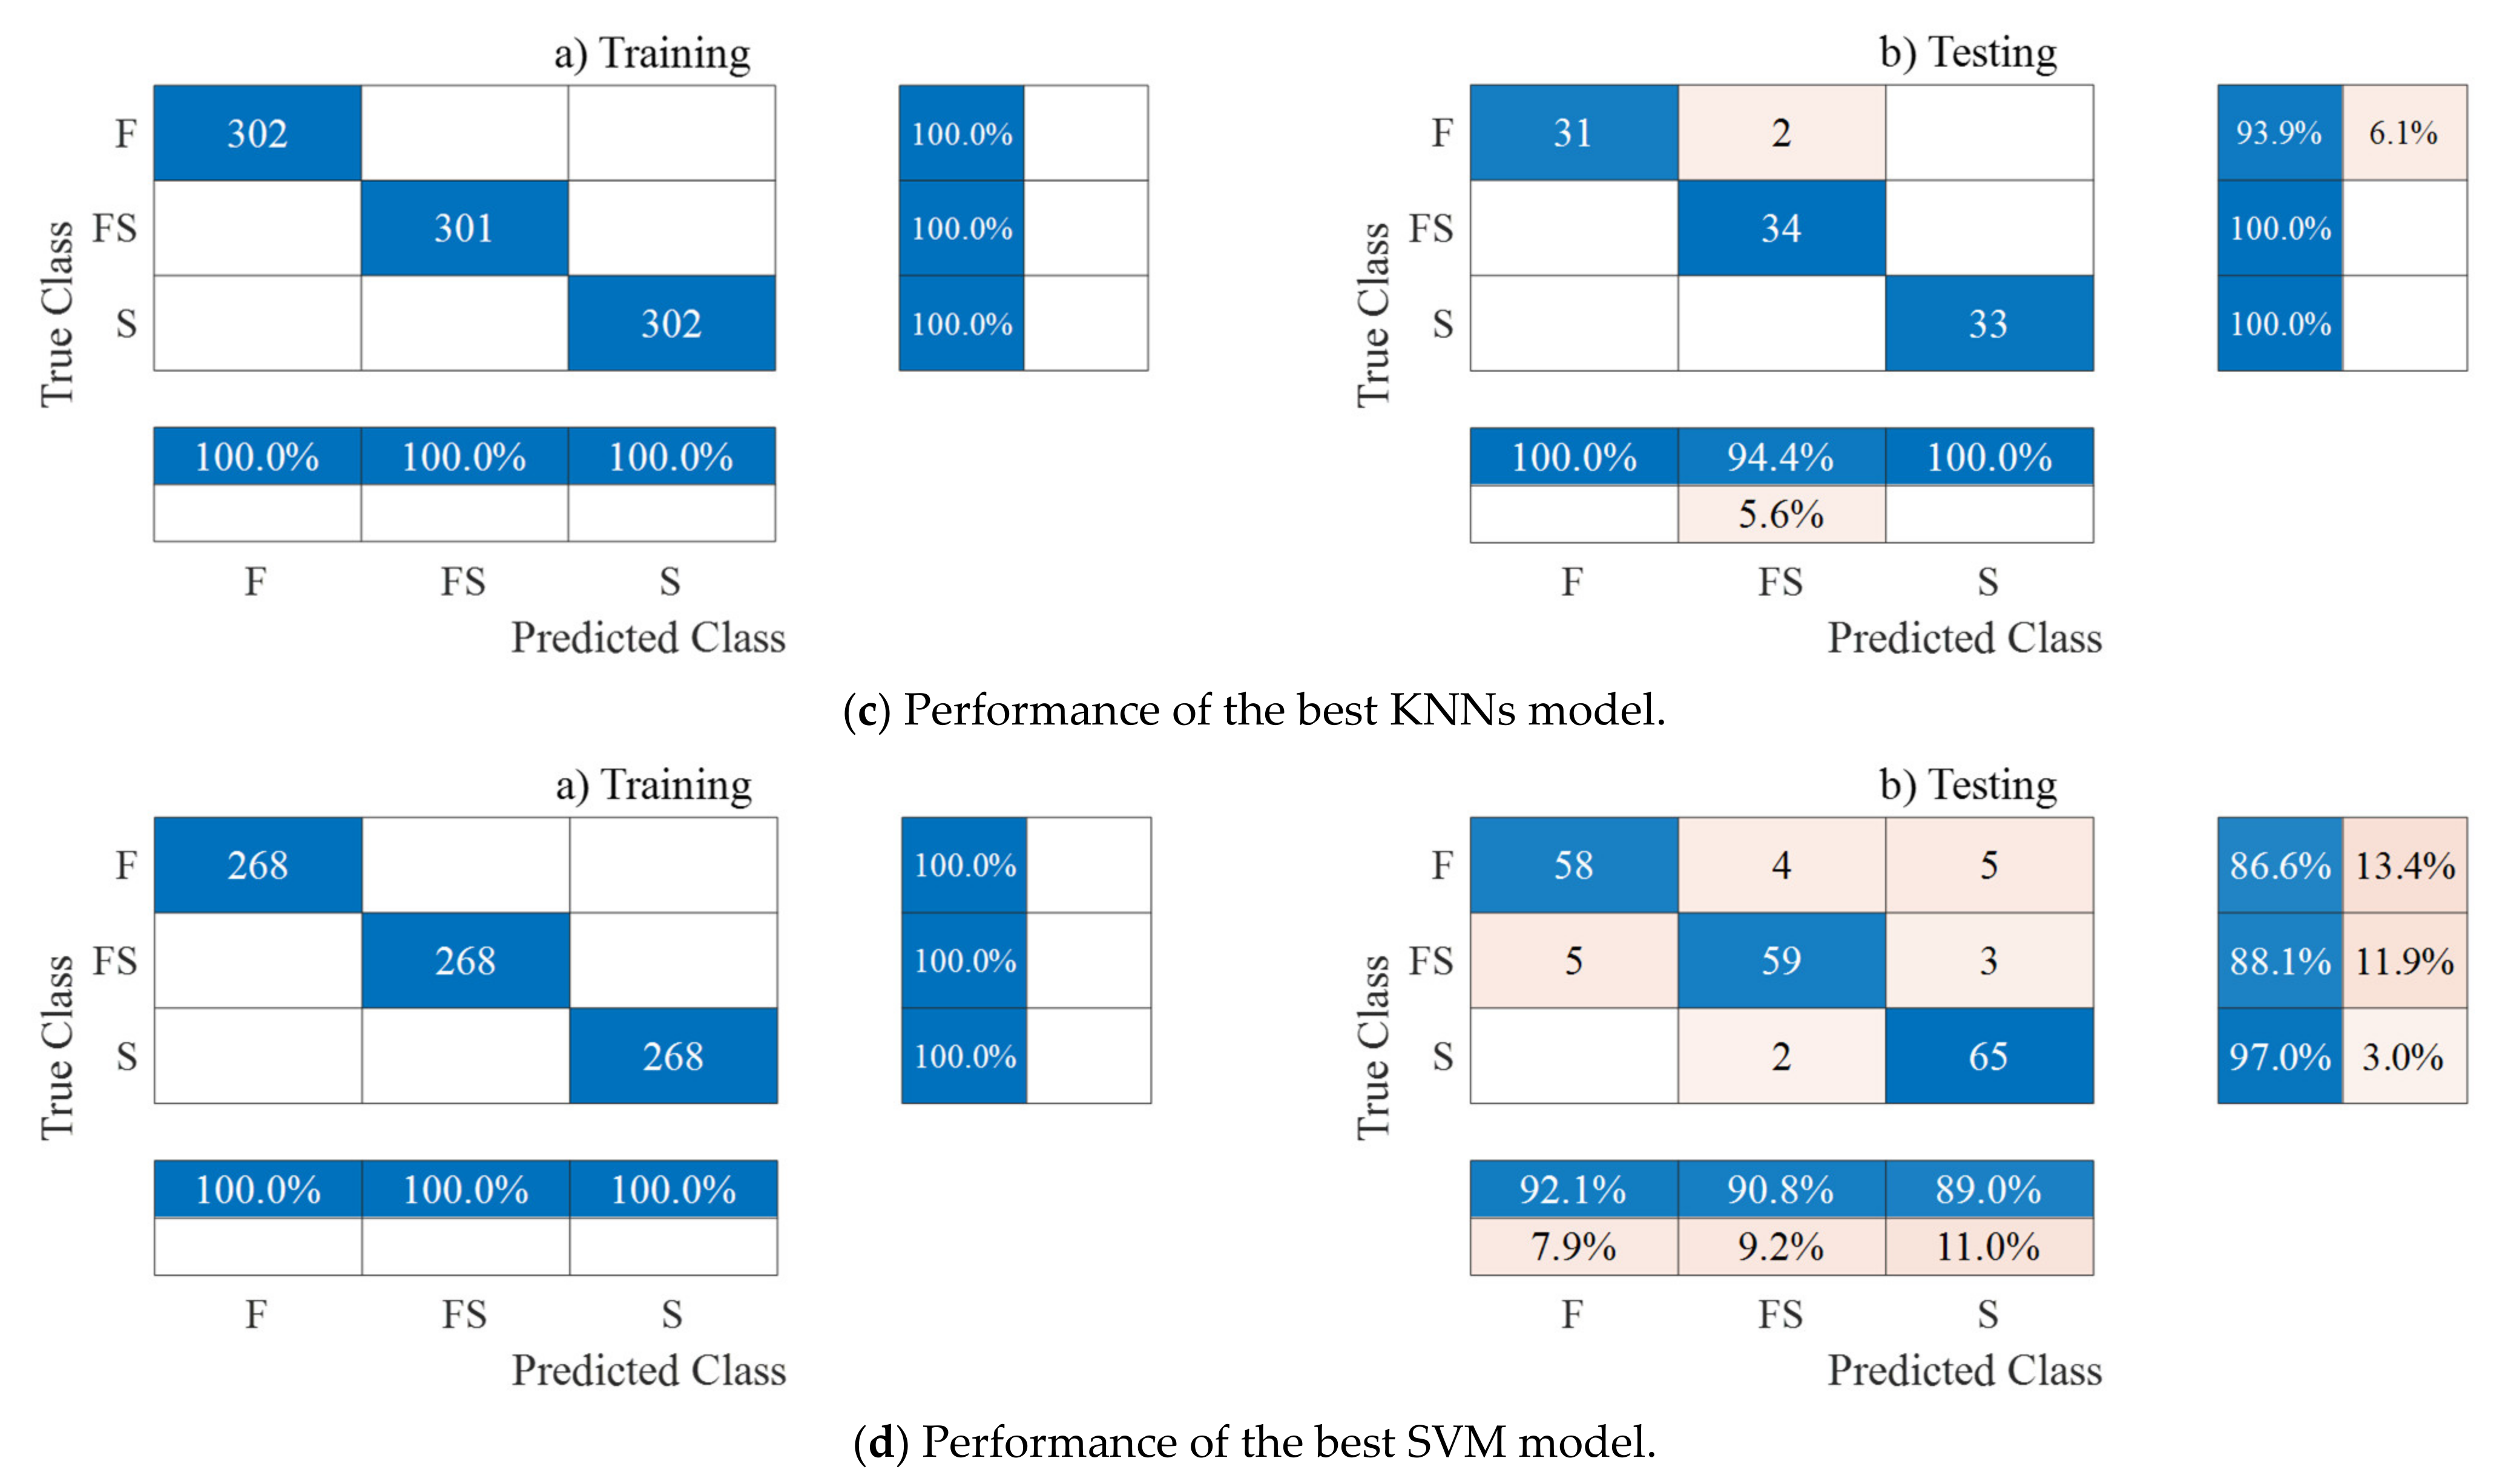
Figure 18 shows the performance of the best ML models in terms of confusion matrices for identifying failure modes of rectangular RC columns after performing SMOTE. The confusion matrix represents the number of correctly and incorrectly predicted classes for each class and based on observed experiment results (i.e., true class) are plotted versus the predicted failure modes (i.e., predicted class) in the confusion matrix. Each element in the matrix, A i j , expresses the number of true classes i , but predicted to class j . As a result, the diagonal elements of the matrix (from the upper left to the lower right) are failure modes, which were accurately predicted by the ML techniques. In other words, the off-diagonal elements denote failure modes, which were misclassified. Among the investigated ML techniques, KNNs showed to be the best model for classifying failure modes of rectangular RC columns with a very high accuracy, mostly reaching 100%. Furthermore, the SVM and DT models also demonstrated a good prediction of failure modes with an accuracy greater than 87%. Meanwhile, the NBs model was not a good option for identifying failure modes of rectangular RC columns.
Table 4 summarizes the calculated indicators for measuring the performance of different ML models in identifying the failure modes of RC columns. Noting that the values outside parentheses were for the training phase, while the values in parentheses were for the testing phase. Once again, it can be observed that the KNNs model showed to be the optimal technique with the accuracy, sensitivity, specificity, and AUC mostly close to 1.0. Additionally, SVM was also a good model for identifying failure modes of the columns.

6. GUI Tool for Predicting Shear Strength and Failure Modes of Rectangular RC Columns

To apply the proposed ML models in specific problems, a convenient tool needs to be established. We developed a Graphical User Interface (GUI) in MATLAB for facilitating failure mode identification as well as for the prediction of the shear strength of rectangular RC columns, as shown in Figure 19. Ten input parameters need to be provided. The shear strength and failure modes of the column are readily obtained by clicking on the ‘Start Predict’ button after entering the input parameters. It takes a few seconds to achieve the predictive results. It should be noted that the GUI tool is provided freely at the link: https://github.com/duyduan1304/GUI_RC_Columns (accessed on 12 July 2022).

7. Conclusions

The shear strength and failure modes of rectangular reinforced concrete (RC) columns were predicted using six novel Machine Learning (ML) techniques, which were developed based on a set of 541 experimental results. The six used ML models included Multivariate Adaptive Regression Splines (MARSs), Naïve Bayes (NBs), K-nearest Neighbors (KNNs), Decision Tree (DT), and Support Vector Machine (SVM), and Artificial Neural Network (ANN). Among these, the MARSs, KNN, DT, SVM, and ANN models were employed to predict the shear strength, while the NBs, KNNs, DT, and SVM models were used for classifying failure modes. The following conclusions are drawn:
  • The ANN and KNNs models predicted the shear strength of rectangular RC columns more accurately than that of existing formulas with an R 2 value larger than 0.99.
  • Used ML models in this study identified the failure modes of rectangular RC columns precisely. Among them, the KNNs algorithm showed to be the optimal method in classifying the failure modes of rectangular RC column with a high accuracy of almost 100%.
  • A practical GUI tool was developed and readily applied for predicting the shear strength and identifying failure modes of rectangular RC columns in the design process and structural performance evaluation.
It should be noted that the findings of this study focus on the rectangular columns. A consideration of circular columns should be conducted in a future work.

Author Contributions

Conceptualization, V.-L.T. and D.-D.N.; methodology, V.-L.T. and D.-D.N.; software, V.-L.T.; validation, D.-D.N., V.-T.P. and V.-Q.N.; formal analysis, V.-L.T. and V.-T.P.; investigation, V.-Q.N.; resources, D.-D.N.; data curation, V.-L.T. and V.-Q.N.; writing—original draft preparation, V.-L.T. and D.-D.N.; writing—review and editing, V.-L.T. and D.-D.N.; visualization, V.-T.P. and V.-Q.N.; supervision, D.-D.N.; project administration, D.-D.N. All authors have read and agreed to the published version of the manuscript.

Funding

This research was supported by the Ministry of Education and Training of Vietnam, grant number B2022-TDV-09.

Data Availability Statement

All the data supporting the key findings of this paper are presented in the figures and tables of the article. The list of databases can be downloaded at: https://github.com/duyduan1304/recRC-Columns_541data, accessed on 12 July 2022. Requests for other data will be considered by the corresponding author.

Acknowledgments

The authors acknowledge the support of the Ministry of Education and Training of Vietnam, grant number B2022-TDV-09.

Conflicts of Interest

The authors declare no conflict of interest.

References

  1. ASCE/SEI-41-06; Seismic Rehabilitation of Existing Buildings. Seismic Rehabilitation Standards Committee, American Society of Civil Engineers: Reston, VA, USA, 2007.
  2. ACI-318-14; Building Code Requirements for Structural Concrete and Commentary. American Concrete Institute: Farmington Hills, MI, USA, 2014.
  3. EC8; Eurocode 8: Design of Structures for Earthquake Resistance—Part 1: General Rules. Seismic Actions and Rules for Buildings. European Committee for Standardization: Brussels, Belgium, 2004.
  4. CSA. Design of Concrete Structures A23 3-14; Canadian Standards Association: Rexdale, ON, Canada, 2014. [Google Scholar]
  5. FEMA. NEHRP 273: Guidelines for the Seismic Rehabilitation of Buildings; Federal Emergency Management Agency: Washington, DC, USA, 1997.
  6. Ascheim, M.; Moehle, J. Shear Strength and Deformability of RC Bridge Columns subjected to Inelastic Cyclic Displacements; Technical report no. UCB/EERC-92/04; University of California at Berkeley: Berkeley, CA, USA, 1992. [Google Scholar]
  7. Priestley, M.N.; Verma, R.; Xiao, Y. Seismic shear strength of reinforced concrete columns. J. Struct. Eng. 1994, 120, 2310–2329. [Google Scholar] [CrossRef]
  8. Kowalsky, M.J.; Priestley, M.N. Improved analytical model for shear strength of circular reinforced concrete columns in seismic regions. ACI Struct. J. 2000, 97, 388–396. [Google Scholar]
  9. Sezen, H.; Moehle, J.P. Shear strength model for lightly reinforced concrete columns. J. Struct. Eng. 2004, 130, 1692–1703. [Google Scholar] [CrossRef]
  10. Biskinis, D.E.; Roupakias, G.K.; Fardis, M.N. Degradation of shear strength of reinforced concrete members with inelastic cyclic displacements. ACI Struct. J. 2004, 101, 773–783. [Google Scholar]
  11. Cassese, P.; De Risi, M.T.; Verderame, G.M. A modelling approach for existing shear-critical RC bridge piers with hollow rectangular cross section under lateral loads. Bul. Earthq. Eng. 2019, 17, 237–270. [Google Scholar] [CrossRef]
  12. Tran, C.T.N.; Li, B. Shear strength model for reinforced concrete columns with low transverse reinforcement ratios. Adv. Struct. Eng. 2014, 17, 1373–1385. [Google Scholar] [CrossRef]
  13. Caglar, N. Neural network based approach for determining the shear strength of circular reinforced concrete columns. Constr. Build. Mater. 2009, 23, 3225–3232. [Google Scholar] [CrossRef]
  14. Ketabdari, H.; Karimi, F.; Rasouli, M. Shear strength prediction of short circular reinforced-concrete columns using soft computing methods. Adv. Struct. Eng. 2020, 23, 3048–3061. [Google Scholar] [CrossRef]
  15. Fiore, A.; Marano, G.C.; Laucelli, D.; Monaco, P. Evolutionary modeling to evaluate the shear behavior of circular reinforced concrete columns. Adv. Civil. Eng. 2014, 2014, 1–14. [Google Scholar] [CrossRef]
  16. Said, A.; Gordon, N. Predicting Shear Strength of RC Columns Using Artificial Neural Networks. J. Build. Mater. Struct. 2019, 6, 64–76. [Google Scholar] [CrossRef]
  17. Aval, S.B.; Ketabdari, H.; Gharebaghi, S.A. Estimating shear strength of short rectangular reinforced concrete columns using nonlinear regression and gene expression programming. Structures 2017, 12, 13–23. [Google Scholar] [CrossRef]
  18. Yu, B.; Liu, S.; Li, B. Probabilistic calibration for shear strength models of reinforced concrete columns. J. Struct. Eng. 2019, 145, 04019026. [Google Scholar] [CrossRef]
  19. Inel, M. Modeling ultimate deformation capacity of RC columns using artificial neural networks. Eng. Struct. 2007, 29, 329–335. [Google Scholar] [CrossRef]
  20. Naderpour, H.; Mirrashid, M. Moment capacity estimation of spirally reinforced concrete columns using ANFIS. Complex Intell. Syst. 2020, 6, 97–107. [Google Scholar] [CrossRef]
  21. Naderpour, H.; Parsa, P.; Mirrashid, M. Innovative Approach for Moment Capacity Estimation of Spirally Reinforced Concrete Columns Using Swarm Intelligence–Based Algorithms and Neural Network. Pract. Period. Struct. Des. Constr. 2021, 26, 04021043. [Google Scholar] [CrossRef]
  22. Feng, D.-C.; Cetiner, B.; Azadi Kakavand, M.R.; Taciroglu, E. Data-driven approach to predict the plastic hinge length of reinforced concrete columns and its application. J. Struct. Eng. 2021, 147, 04020332. [Google Scholar] [CrossRef]
  23. Lee, C.S.; Park, Y.; Jeon, J.-S. Model parameter prediction of lumped plasticity model for nonlinear simulation of circular reinforced concrete columns. Eng. Struct. 2021, 245, 112820. [Google Scholar] [CrossRef]
  24. Aldabagh, S.; Hossain, F.; Alam, M.S. Simplified Predictive Expressions of Drift Limit States for Reinforced Concrete Circular Bridge Columns. J. Struct. Eng. 2022, 148, 04021285. [Google Scholar] [CrossRef]
  25. Azadi Kakavand, M.R.; Sezen, H.; Taciroglu, E. Data-driven models for predicting the shear strength of rectangular and circular reinforced concrete columns. J. Struct. Eng. 2021, 147, 04020301. [Google Scholar] [CrossRef]
  26. Feng, D.-C.; Liu, Z.-T.; Wang, X.-D.; Jiang, Z.-M.; Liang, S.-X. Failure mode classification and bearing capacity prediction for reinforced concrete columns based on ensemble machine learning algorithm. Adv. Eng. Inf. 2020, 45, 101126. [Google Scholar] [CrossRef]
  27. Asteris, P.G.; Armaghani, D.J.; Hatzigeorgiou, G.D.; Karayannis, C.G.; Pilakoutas, K. Predicting the shear strength of reinforced concrete beams using Artificial Neural Networks. Comput. Concr. 2019, 24, 469–488. [Google Scholar]
  28. Cakiroglu, C.; Islam, K.; Bekdaş, G.; Kim, S.; Geem, Z.W. Interpretable Machine Learning Algorithms to Predict the Axial Capacity of FRP-Reinforced Concrete Columns. Materials 2022, 15, 2742. [Google Scholar] [CrossRef] [PubMed]
  29. Marani, A.; Nehdi, M.L. Predicting shear strength of FRP-reinforced concrete beams using novel synthetic data driven deep learning. Eng. Struct. 2022, 257, 114083. [Google Scholar] [CrossRef]
  30. Wakjira, T.G.; Ebead, U.; Alam, M.S. Machine learning-based shear capacity prediction and reliability analysis of shear-critical RC beams strengthened with inorganic composites. Case Stud. Construct. Mater. 2022, 16, e01008. [Google Scholar] [CrossRef]
  31. De Domenico, D.; Ricciardi, G. Shear strength of RC beams with stirrups using an improved Eurocode 2 truss model with two variable-inclination compression struts. Eng. Struct. 2019, 198, 109359. [Google Scholar] [CrossRef]
  32. Quaranta, G.; De Domenico, D.; Monti, G. Machine-learning-aided improvement of mechanics-based code-conforming shear capacity equation for RC elements with stirrups. Eng. Struct. 2022, 267, 114665. [Google Scholar] [CrossRef]
  33. Zhu, L.; Elwood, K.; Haukaas, T. Classification and seismic safety evaluation of existing reinforced concrete columns. J. Struct. Eng. 2007, 133, 1316–1330. [Google Scholar] [CrossRef]
  34. Qi, Y.-l.; Han, X.-l.; Ji, J. Failure mode classification of reinforced concrete column using Fisher method. J. Cent. South Univ. 2013, 20, 2863–2869. [Google Scholar] [CrossRef]
  35. Pekelnicky, R.; Engineers, S.; Chris Poland, S.; Engineers, N. ASCE 41-13: Seismic evaluation and retrofit rehabilitation of existing buildings. In Proceedings of the SEAOC 2012, Santa Fe, NM, USA, 12–15 September 2012. [Google Scholar]
  36. Ma, Y.; Gong, J.-X. Probability identification of seismic failure modes of reinforced concrete columns based on experimental observations. J. Earthq. Eng. 2018, 22, 1881–1899. [Google Scholar] [CrossRef]
  37. Ghee, A.B.; Priestley, M.N.; Paulay, T. Seismic shear strength of circular reinforced concrete columns. ACI Struct. J. 1989, 86, 45–59. [Google Scholar]
  38. Ning, C.-L.; Feng, D.-C. Probabilistic indicator to classify the failure mode of reinforced-concrete columns. Mag. Concr. Res. 2019, 71, 734–748. [Google Scholar] [CrossRef]
  39. Berry, M.; Parrish, M.; Eberhard, M. PEER Structural Performance Database User’s Manual (Version 1.0); University of California: Berkeley, CA, USA, 2004. [Google Scholar]
  40. Mangalathu, S.; Jeon, J.-S. Machine learning–based failure mode recognition of circular reinforced concrete bridge columns: Comparative study. J. Struct. Eng. 2019, 145, 04019104. [Google Scholar] [CrossRef]
  41. Mangalathu, S.; Hwang, S.-H.; Jeon, J.-S. Failure mode and effects analysis of RC members based on machine-learning-based SHapley Additive exPlanations (SHAP) approach. Eng. Struct. 2020, 219, 110927. [Google Scholar] [CrossRef]
  42. Lundberg, S.M.; Lee, S.-I. A unified approach to interpreting model predictions. Adv. Neural Inf. Process. Syst. 2017, 30, 4765–4774. [Google Scholar]
  43. Naderpour, H.; Mirrashid, M.; Parsa, P. Failure mode prediction of reinforced concrete columns using machine learning methods. Eng. Struct. 2021, 248, 113263. [Google Scholar] [CrossRef]
  44. Ghannoum, W.; Sivaramakrishnan, B.; Pujol, S.; Catlin, A.; Fernando, S.; Yoosuf, N. ACI 369 rectangular column database. Network for Earthquake Engineering Simulation (Database), Dataset. 2012. Available online: https://datacenterhub.org/dataviewer/view/neesdatabases:db/aci_369_rectangular_column_database/ (accessed on 13 February 2021).
  45. Belkacem, M.A.; Bechtoula, H.; Bourahla, N.; Belkacem, A.A. Effect of axial load and transverse reinforcements on the seismic performance of reinforced concrete columns. Front. Struct. Civ. Eng. 2019, 13, 831–851. [Google Scholar] [CrossRef]
  46. Wang, D.; Li, H.-N.; Li, G. Experimental study on dynamic mechanical properties of reinforced concrete column. J. Reinf. Plast. Compos. 2013, 32, 1793–1806. [Google Scholar] [CrossRef]
  47. Xiao, J.; Zhang, C. Seismic behavior of RC columns with circular, square and diamond sections. Constr. Build. Mater. 2008, 22, 801–810. [Google Scholar] [CrossRef]
  48. Rodrigues, H.; Furtado, A.; Arêde, A. Behavior of rectangular reinforced-concrete columns under biaxial cyclic loading and variable axial loads. J. Struct. Eng. 2016, 142, 04015085. [Google Scholar] [CrossRef]
  49. Melo, J.; Varum, H.; Rossetto, T. Experimental cyclic behaviour of RC columns with plain bars and proposal for Eurocode 8 formula improvement. Eng. Struct. 2015, 88, 22–36. [Google Scholar] [CrossRef]
  50. Yun, H.W. Full-Scale Experimental and Analytical Studies on High-Strength Concrete Columns; University of Southern California: Los Angeles, CA, USA, 2003. [Google Scholar]
  51. Ongsupankul, S.; Kanchanalai, T.; Kawashima, K. Behavior of reinforced concrete bridge pier columns subjected to moderate seismic load. Sci. Asia 2007, 33, 175–185. [Google Scholar] [CrossRef]
  52. Ho, J.C.M. Experimental tests on high-strength concrete columns subjected to combined medium axial load and flexure. Adv. Struct. Eng. 2012, 15, 1359–1374. [Google Scholar] [CrossRef]
  53. Mo, Y.-L.; Wang, S. Seismic behavior of RC columns with various tie configurations. J. Struct. Eng. 2000, 126, 1122–1130. [Google Scholar] [CrossRef]
  54. Wu, D.; Ding, Y.; Su, J.; Li, Z.-X.; Zong, L.; Feng, K. Effects of tie detailing configurations on reinforcement buckling and seismic performance of high-strength RC columns. Soil Dyn. Earthq. Eng. 2021, 147, 106791. [Google Scholar] [CrossRef]
  55. Woodward, K.A.; Jirsa, J.O. Influence of reinforcement on RC short column lateral resistance. J. Struct. Eng. 1984, 110, 90–104. [Google Scholar] [CrossRef]
  56. Lam, S.S.E.; Wu, B.; Wong, Y.; Wang, Z.; Liu, Z.; Li, C. Drift capacity of rectangular reinforced concrete columns with low lateral confinement and high-axial load. J. Struct. Eng. 2003, 129, 733–742. [Google Scholar] [CrossRef]
  57. Hwang, S.-K.; Yun, H.-D. Effects of transverse reinforcement on flexural behaviour of high-strength concrete columns. Eng. Struct. 2004, 26, 1–12. [Google Scholar] [CrossRef]
  58. Ahn, J.-M.; Shin, S.-W. An evaluation of ductility of high-strength reinforced concrete columns subjected to reversed cyclic loads under axial compression. Mag. Conc. Res. 2007, 59, 29–44. [Google Scholar] [CrossRef]
  59. Woods, J.M.; Kiousis, P.D.; Ehsani, M.R.; Saadatmanesh, H.; Fritz, W. Bending ductility of rectangular high strength concrete columns. Eng. Struct. 2007, 29, 1783–1790. [Google Scholar] [CrossRef]
  60. Marefat, M.; Khanmohammadi, M.; Bahrani, M.; Goli, A. Experimental assessment of reinforced concrete columns with deficient seismic details under cyclic load. Adv. Struct. Eng. 2006, 9, 337–347. [Google Scholar] [CrossRef]
  61. Xiao, X.; Guan, F.; Yan, S. Use of ultra-high-strength bars for seismic performance of rectangular high-strength concrete frame columns. Mag. Conc. Res. 2008, 60, 253–259. [Google Scholar] [CrossRef]
  62. Bae, S.; Bayrak, O. Plastic hinge length of reinforced concrete columns. ACI Struct. J. 2008, 105, 290. [Google Scholar]
  63. Tran, C.T.N. Experimental and Analytical Studies on the Seismic Behavior of Reinforced Concrete Columns with Light Transverse Reinforcement; Nanyang Technological University Singapore: Singapore, 2010. [Google Scholar]
  64. Ou, Y.-C.; Kurniawan, D.P.; Handika, N. Shear behavior of reinforced concrete columns with high-strength steel and concrete under low axial load. ACI Spec. Publ. 2013, 293, 1–12. [Google Scholar]
  65. Martirossyan, A.; Xiao, Y. Flexural-shear behavior of high-strength concrete short columns. Earthq. Spectra 2001, 17, 679–695. [Google Scholar] [CrossRef]
  66. Li, Y.-A.; Huang, Y.-T.; Hwang, S.-J. Seismic response of reinforced concrete short columns failed in shear. ACI Struct. J. 2014, 111, 945. [Google Scholar] [CrossRef]
  67. Nakamura, T.; Yoshimura, M. Gravity load collapse of reinforced concrete columns with brittle failure modes. J. Asian Archit. Build. Eng. 2002, 1, 21–27. [Google Scholar] [CrossRef]
  68. Nakamura, T.; Yoshimura, M. Gravity load collapse of reinforced concrete columns with decreased axial load. In Proceedings of the 2nd European Conference on Earthquake Engineering and Seismology, Istanbul, Turkey, 25–29 August 2014. [Google Scholar]
  69. Popa, V.; Cotofana, D.; Vacareanu, R. Effective stiffness and displacement capacity of short reinforced concrete columns with low concrete quality. Bull. Earthq. Eng. 2014, 12, 2705–2721. [Google Scholar] [CrossRef]
  70. Jin, C.; Pan, Z.; Meng, S.; Qiao, Z. Seismic behavior of shear-critical reinforced high-strength concrete columns. J. Struct. Eng. 2015, 141, 04014198. [Google Scholar] [CrossRef]
  71. EL-Attar, M.M.; El-Karmoty, H.Z.; EL-Moneim, A.A. The behavior of ultra-high-strength reinforced concrete columns under axial and cyclic lateral loads. HBRC, J. 2016, 12, 284–295. [Google Scholar] [CrossRef]
  72. Eom, T.-S.; Kang, S.-M.; Park, H.-G.; Choi, T.-W.; Jin, J.-M. Cyclic loading test for reinforced concrete columns with continuous rectangular and polygonal hoops. Eng. Struct. 2014, 67, 39–49. [Google Scholar] [CrossRef]
  73. Elwood, K.J.; Moehle, J.P. Drift capacity of reinforced concrete columns with light transverse reinforcement. Earthq. Spectra. 2005, 21, 71–89. [Google Scholar] [CrossRef]
  74. Sezen, H. Seismic Response and Modeling of Reinforced Concrete Building Columns. Ph.D. Thesis, Department of Civil and Environmental Engineering, University of California, Berkeley, CA, USA, 2002. [Google Scholar]
  75. Esaki, F. Reinforcing effect of steel plate hoops on ductility of R/C square columns. In Proceedings of the 11th World Conference on Earthquake Engineering, Acapulco, Mexico, 23–28 June 1996; pp. 23–29. [Google Scholar]
  76. Li, X.; Park, R.; Tanaka, H. Effects of variations in axial load level on the strength and ductility of reinforced concrete columns. In Proceedings of the Pacific Conference on Earthquake Engineering, Auckland, New Zealand, 20–23 November 1991. [Google Scholar]
  77. Yalcin, C. Seismic evaluation and retrofit of existing reinforced concrete bridge columns. Ph.D. Thesis, Department of Civil Engineering, University of Ottawa, Ottawa, ON, USA, 1997. [Google Scholar]
  78. Opabola, E.A.; Elwood, K.J.; Oliver, S. Deformation capacity of reinforced concrete columns with smooth reinforcement. Bull. Earthq. Eng. 2019, 17, 2509–2532. [Google Scholar] [CrossRef]
  79. Goksu, C.; Yilmaz, H.; Chowdhury, S.; Orakcal, K.; Ilki, A. The effect of lap splice length on the cyclic lateral load behavior of RC members with low-strength concrete and plain bars. Adv. Struct. Eng. 2014, 17, 639–658. [Google Scholar] [CrossRef]
  80. Zhang, Y.; Zheng, S.; Rong, X.; Dong, L.; Zheng, H. Seismic performance of reinforced concrete short columns subjected to freeze–thaw cycles. Appl. Sci. 2019, 9, 2708. [Google Scholar] [CrossRef]
  81. Verderame, G.M.; Fabbrocino, G.; Manfredi, G. Seismic response of rc columns with smooth reinforcement. Part I: Monotonic tests. Eng. Struct. 2008, 30, 2277–2288. [Google Scholar] [CrossRef]
  82. Verderame, G.M.; Fabbrocino, G.; Manfredi, G. Seismic response of rc columns with smooth reinforcement. Part II: Cyclic tests. Eng. Struct. 2008, 30, 2289–2300. [Google Scholar] [CrossRef]
  83. Bousias, S.; Spathis, A.-L.; Fardis, M.N. Seismic retrofitting of columns with lap spliced smooth bars through FRP or concrete jackets. J. Earthq. Eng. 2007, 11, 653–674. [Google Scholar] [CrossRef]
  84. Arani, K.K.; Di Ludovico, M.; Marefat, M.S.; Prota, A.; Manfredi, G. Lateral response evaluation of old type reinforced concrete columns with smooth bars. ACI Struct. J. 2014, 111, 827–838. [Google Scholar] [CrossRef]
  85. Di Ludovico, M.; Verderame, G.; Prota, A.; Manfredi, G.; Cosenza, E. Cyclic behavior of nonconforming full-scale RC columns. J. Struct. Eng. 2014, 140, 04013107. [Google Scholar] [CrossRef]
  86. Ilki, A.; Demir, C.; Bedirhanoglu, I.; Kumbasar, N. Seismic retrofit of brittle and low strength RC columns using fiber reinforced polymer and cementitious composites. Adv. Struct. Eng. 2009, 12, 325–347. [Google Scholar] [CrossRef]
  87. Pham, T.P.; Li, B. Seismic performance of reinforced concrete columns with plain longitudinal reinforcing bars. ACI Struc. J. 2014, 111, 561. [Google Scholar] [CrossRef]
  88. Arani, K.K.; Marefat, M.S.; Amrollahi-Biucky, A.; Khanmohammadi, M. Experimental seismic evaluation of old concrete columns reinforced by plain bars. The Struct. Des. Tall Spec. Build. 2013, 22, 267–290. [Google Scholar] [CrossRef]
  89. Shi, Q.; Ma, L.; Wang, Q.; Wang, B.; Yang, K. Seismic performance of square concrete columns reinforced with grade 600 MPa longitudinal and transverse reinforcement steel under high axial load. Structures 2021, 32, 1955–1970. [Google Scholar] [CrossRef]
  90. Zhang, J.; Cai, R.; Li, C.; Liu, X. Seismic behavior of high-strength concrete columns reinforced with high-strength steel bars. Eng. Struct. 2020, 218, 110861. [Google Scholar] [CrossRef]
  91. Dinh, N.H.; Park, S.-H.; Choi, K.-K. Seismic performance of reinforced concrete columns retrofitted by textile-reinforced mortar jackets. Struct. Infrastruct. Eng. 2020, 16, 1364–1381. [Google Scholar] [CrossRef]
  92. Kim, C.-G.; Park, H.-G.; Eom, T.-S. Effects of Type of Bar Lap Splice on Reinforced Concrete Columns Subjected to Cyclic Loading. ACI Struct. J. 2019, 116, 183–194. [Google Scholar] [CrossRef]
  93. Hwang, H.-J.; Noh, J.-O.; Park, H.-G. Structural capacity of reinforced concrete columns with U-shaped transverse bars. Eng. Struct. 2020, 216, 110686. [Google Scholar] [CrossRef]
  94. Choi, K.-K.; Truong, G.T.; Kim, J.-C. Seismic performance of lightly shear reinforced RC columns. Eng. Struct. 2016, 126, 490–504. [Google Scholar] [CrossRef]
  95. Kim, C.-G.; Eom, T.-S.; Park, H.-G. Cyclic Load Test of Reinforced Concrete Columns with V-Shaped Ties. ACI Struct. J. 2020, 117, 91–102. [Google Scholar]
  96. Sezen, H.; Moehle, J.P. Seismic tests of concrete columns with light transverse reinforcement. ACI Struct. J. 2006, 103, 842. [Google Scholar]
  97. Li, Y.; Cao, S.; Jing, D. Concrete Columns Reinforced with High-Strength Steel Subjected to Reversed Cycle Loading. ACI Struct. J. 2018, 115, 10378–11048. [Google Scholar] [CrossRef]
  98. Barrera, A.; Bonet, J.; Romero, M.L.; Miguel, P. Experimental tests of slender reinforced concrete columns under combined axial load and lateral force. Eng. Struct. 2011, 33, 3676–3689. [Google Scholar] [CrossRef]
  99. Melek, M.; Wallace, J.W. Cyclic behavior of columns with short lap splices. ACI Struct. J. 2004, 101, 802–811. [Google Scholar]
  100. Kim, C.-G.; Park, H.-G.; Eom, T.-S. Seismic performance of reinforced concrete columns with lap splices in plastic hinge region. ACI Struct. J. 2018, 115, 235–245. [Google Scholar] [CrossRef]
  101. Yang, W.X.; Shi, Q.X.; Sun, H.X. Experimental Studies on Seismic Performance of High Strength Reinforced Concrete Columns. Appl. Mech. Mater. Trans. Tech. Publ. 2012, 166, 919–926. [Google Scholar] [CrossRef]
  102. Zhang, X.; Li, T.; ZHang, L. Experimental study on the seismic behavior of reinforced concrete short columns with high-strength longitudinal reinforcements. In Proceedings of the 2011 Second International Conference on Mechanic Automation and Control Engineering, Inner Mongolia, China, 15–17 July 2011; IEEE: Piscataway, NJ, USA, 2011; pp. 5807–5810. [Google Scholar]
  103. Nojavan, A. Performance of Full-Scale Reinforced Concrete Columns Subjected to Extreme Earthquake Loading; University of Minnesota: Minneapolis, MN, USA, 2015. [Google Scholar]
  104. Kotu, V.; Deshpande, B. Data Science: Concepts and Practice; Morgan Kaufmann: Campbridge, MA, USA, 2018. [Google Scholar]
  105. Breiman, L.; Friedman, J.; Stone, C.J.; Olshen, R.A. Classification and Regression Trees; CRC Press: Boca Raton, FL, USA, 1984. [Google Scholar]
  106. Vapnik, V. The support vector method of function estimation. In Nonlinear Modeling; Springer: Berlin/Heidelberg, Germany, 1998; pp. 55–85. [Google Scholar]
  107. Nikbin, I.M.; Rahimi, S.; Allahyari, H. A new empirical formula for prediction of fracture energy of concrete based on the artificial neural network. Eng. Fract. Mech. 2017, 186, 466–482. [Google Scholar] [CrossRef]
  108. Tran, V.-L.; Thai, D.-K.; Kim, S.-E. Application of ANN in predicting ACC of SCFST column. Compos. Struct. 2019, 228, 111332. [Google Scholar] [CrossRef]
  109. Tran, V.-L.; Thai, D.-K.; Kim, S.-E. A new empirical formula for prediction of the axial compression capacity of CCFT columns. Steel Compos. Struct. 2019, 33, 181–194. [Google Scholar]
  110. Tran, V.-L.; Kim, S.-E. A practical ANN model for predicting the PSS of two-way reinforced concrete slabs. Eng. Comput 2021, 37, 2303–2327. [Google Scholar] [CrossRef]
  111. Tran, V.-L.; Thai, D.-K.; Nguyen, D.-D. Practical artificial neural network tool for predicting the axial compression capacity of circular concrete-filled steel tube columns with ultra-high-strength concrete. Thin-Walled Struct. 2020, 151, 106720. [Google Scholar] [CrossRef]
  112. Nguyen, M.-S.T.; Thai, D.-K.; Kim, S.-E. Predicting the axial compressive capacity of circular concrete filled steel tube columns using an artificial neural network. Steel Compos. Struct. 2020, 35, 415–437. [Google Scholar]
  113. Nguyen, D.-D.; Tran, V.-L.; Ha, D.-H.; Nguyen, V.-Q.; Lee, T.-H. A machine learning-based formulation for predicting shear capacity of squat flanged RC walls. Structures 2021, 29, 1734–1747. [Google Scholar] [CrossRef]
  114. Silva, F.A.; Delgado, J.M.; Cavalcanti, R.S.; Azevedo, A.C.; Guimarães, A.S.; Lima, A.G. Use of nondestructive testing of ultrasound and artificial neural networks to estimate compressive strength of concrete. Buildings 2021, 11, 44. [Google Scholar] [CrossRef]
  115. Sirimontree, S.; Keawsawasvong, S.; Ngamkhanong, C.; Seehavong, S.; Sangjinda, K.; Jearsiripongkul, T.; Thongchom, C.; Nuaklong, P. Neural Network-Based Prediction Model for the Stability of Unlined Elliptical Tunnels in Cohesive-Frictional Soils. Buildings 2022, 12, 444. [Google Scholar] [CrossRef]
  116. Almasabha, G.; Alshboul, O.; Shehadeh, A.; Almuflih, A.S. Machine Learning Algorithm for Shear Strength Prediction of Short Links for Steel Buildings. Buildings 2022, 12, 775. [Google Scholar] [CrossRef]
  117. Luat, N.V.; Lee, K.; Thai, D.K. Application of artificial neural networks in settlement prediction of shallow foundations on sandy soils. Geomech. Eng. 2020, 20, 385–397. [Google Scholar]
  118. Friedman, J.H. Multivariate adaptive regression splines. Ann. Stat. 1991, 19, 1–67. [Google Scholar] [CrossRef]
  119. Luat, N.V.; Nguyen, V.Q.; Lee, S.; Woo, S.; Lee, K. An evolutionary hybrid optimization of MARS model in predicting settlement of shallow foundations on sandy soils. Geomech. Eng. 2020, 21, 583–598. [Google Scholar]
  120. Chawla, N.V.; Bowyer, K.W.; Hall, L.O.; Kegelmeyer, W.P. SMOTE: Synthetic minority over-sampling technique. J. Artif. Intell. Res. 2002, 16, 321–357. [Google Scholar] [CrossRef]
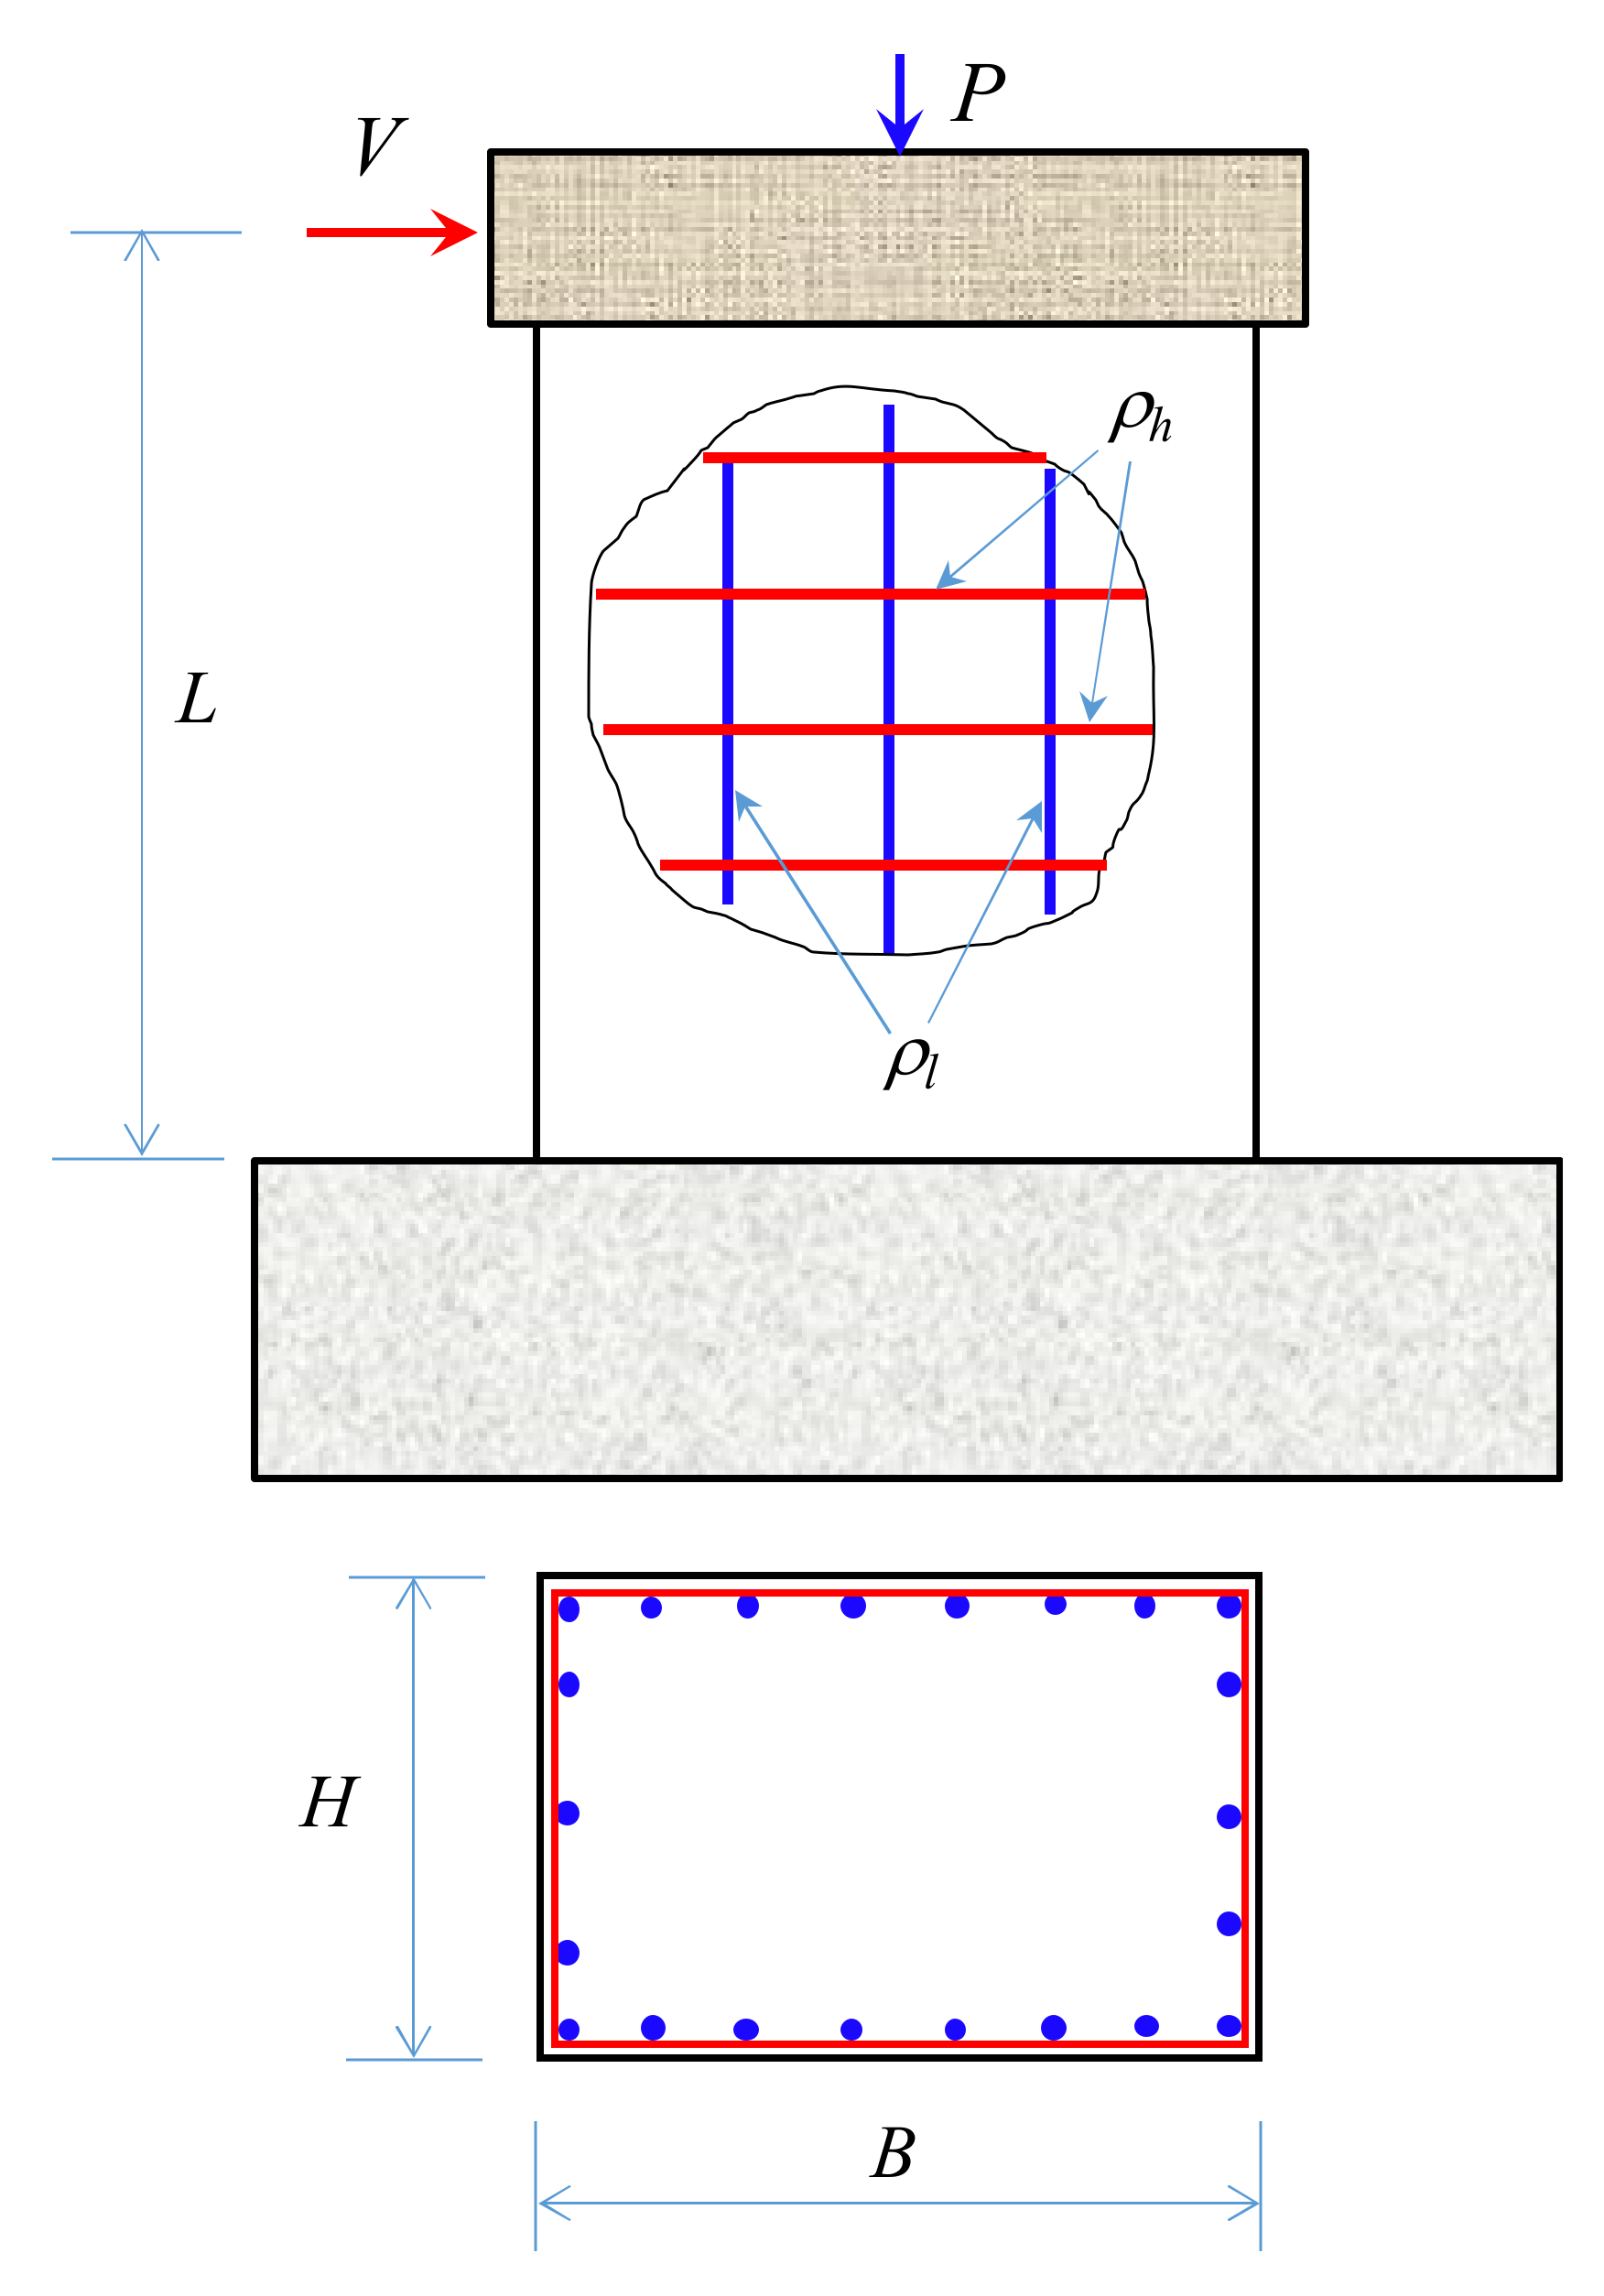
Figure 1. Configurations and properties of rectangular RC columns.
Buildings 12 01493 g001
Figure 2. Frequency of input parameters and observed failure modes of database.
Buildings 12 01493 g002
Figure 3. Correlation matrix of input and output parameters.
Buildings 12 01493 g003
Figure 4. The performance of 210 MARSs models.
Buildings 12 01493 g004
Figure 5. The performance of 210 DT models.
Buildings 12 01493 g005
Figure 6. The performance of 210 KNNs models.
Buildings 12 01493 g006
Figure 7. The performance of 210 SVM models.
Buildings 12 01493 g007
Figure 8. The performance of 210 ANN models.
Buildings 12 01493 g008
Figure 9. The ranking of ML models with 210 training-testing ratios.
Buildings 12 01493 g009
Figure 10. Comparison of shear strengths between experiments and various predicted models.
Buildings 12 01493 g010aBuildings 12 01493 g010b
Figure 11. Distribution of failure modes in the database (a) before and (b) after performing SMOTE.
Buildings 12 01493 g011
Figure 12. Concept of confusion matrix and definition of measuring indicators.
Buildings 12 01493 g012
Figure 13. Performance of 210 NBs models for classifying failure modes.
Buildings 12 01493 g013
Figure 14. Performance of 210 DT models for classifying failure modes.
Buildings 12 01493 g014
Figure 15. Performance of 210 KNNs models for classifying failure modes.
Buildings 12 01493 g015aBuildings 12 01493 g015b
Figure 16. Performance of 210 SVM models for classifying failure modes.
Buildings 12 01493 g016
Figure 17. The ranking of 210 cases in each ML model for classifying failure modes.
Buildings 12 01493 g017aBuildings 12 01493 g017b
Figure 18. Confusion matrix of classified failure modes using different models.
Buildings 12 01493 g018aBuildings 12 01493 g018b
Figure 19. GUI for predicting the shear strength and identifying failure modes of rectangular RC columns.
Buildings 12 01493 g019
Table 1. Summary of input parameters of database.
Input Parameter L
(mm)
B
(mm)
H
(mm)
s
(mm)
f c
(MPa)
f y l
(MPa)
f y h
(MPa)
ρ l
(%)
ρ h
(%)
P
(kN)
(Variable)(X1)(X2)(X3)(X4)(X5)(X6)(X7)(X8)(X9)(X10)
Min22515010020203132150.200.010.0
Mean1286284301101494484962.150.941130
Max300061061045714174514704.504.005492
  S D 6471091157727772220.690.941069
  C O V 0.530.380.380.760.550.170.450.320.990.95
Table 2. Formulas for calculating shear strength of rectangular RC columns.
IDModelExpressionEquation
1ACI 318 [2] V 1 = 0.166 1 + P 13.8 A g b w d f c + A s h f y h d s (12)
2CSA [4] V 2 = min β b w d ν f c + A s h f y h d s cot θ ;   0.25 f c b d
d ν = 0.9 d
(13)
3FEMA 273 [5] V 3 = 0.29 λ k + P 13.8 A g b d f c + A s h f y h d s
k = 1.0 for low ductility demand.
k = 0 for moderate and high ductility demand.
(14)
4EC8 [3] V 4 = k V c + V w + V P
V c = 0.16 max ( 0.5 ; 100 ρ l 1 0.16 min 5 ; a d A c f c
V w = A s w s d d f y w
V P = D x 2 a m i n N ; 0.55 A c f c
(15)
5Ascheim and Moehle [6] V 5 = 0.3 k + P 13.8 A g 0.8 A g f c + A s h f y h d s   tan 30 0
k = 4 μ 3 , μ is the displacement ductility
d = 0.8 H
(16)
6Sezen and Moehle [9] (ASCE/SEI 41-06 [1]) V 6 = k 0.5 f c a / d   1 + P 0.5 A g f c 0.8 A g + k A s h f y h d s   ;
d = D cover
k = 1 for μ < 2.0 ;   k = 0.7 for μ > 6.0 ;
0.7   k = 1.15 0.075 μ   1.0 for 2.0   μ   6.0
a is the shear span, (i.e., the distance from loading point to the boundary).
(17)
Table 3. Statistical indicators of different predictive models.
Model R 2 a 20 I n d e x R M S E   ( kN )
ACI 318 [2]0.2540.197133.8
CSA [4]0.4630.211136.9
FEMA 273 [5]0.1800.187149.0
EC8 [3]0.6270.174128.3
Ascheim and Moehle [6]0.1860.194208.5
Sezen and Moehle [9]0.5290.338108.5
MARSs0.897 (0.845)0.503 (0.537)54.65 (71.99)
DT0.962 (0.847)0.855 (0.660)33.59 (70.18)
KNNs1.000 (0.876)1.000 (0.765)0.000 (51.54)
SVM0.982 (0.874)0.894 (0.602)22.78 (63.86)
ANN0.998 (0.938)0.976 (0.830)8.08 (36.00)
Table 4. Measuring indicators of classifying models.
ModelAccuracySensitivitySpecificityAUC
NBs0.667 (0.653)0.838 (0.940)0.754 (0.710)0.666 (0.807)
DT0.954 (0.890)0.957 (0.909)0.986 (0.955)0.954 (0.966)
KNNs1.000 (0.980)1.000 (1.000)1.000 (1.000)1.000 (0.970)
SVM1.000 (0.905)1.000 (0.970)1.000 (0.940)1.000 (0.951)
Publisher’s Note: MDPI stays neutral with regard to jurisdictional claims in published maps and institutional affiliations.