1. Introduction
In Japan, there have been gradually increasing residents’ complaints about low-frequency noise, not only from industrial facilities but also from household heat pumps for air conditioning and water heaters [
1,
2,
3]. To mitigate the residents’ annoyance to low-frequency noise, soundproofing of houses is one of the important measures, especially for common Japanese wooden houses with a lightweight façade structure. However, the effects of soundproofing measures are still not clear in the low-frequency range below 100 Hz, although some experimental [
4] and numerical studies [
5,
6,
7] were reported. In practice, the measurements of airborne sound insulation of buildings and their elements are normally performed above 100 Hz, regardless of laboratory and field measurements, according to the methods specified by ISO or national standards. Basically, the measurements in the low-frequency range involve difficult issues of accuracy and uncertainty.
In the conventional measurements of airborne sound insulation, indoor average sound pressure level is usually determined with five microphone positions in the central zone of the room, which could lead to adverse significant deviation at low frequencies due to low-order normal modes. Pedersen et al. [
8] addressed the poor reproducibility in the frequency range from 50 to 80 Hz in laboratory measurements. Moorhouse and Ramadorai [
9] proposed an alternative procedure where microphone positions were placed along one diagonal of the room. Recently, the ISO 16283 series were published for field measurements of sound insulation, where a low-frequency procedure has been specified for determining the indoor average sound pressure level [
10,
11], based on the intensive study by Hopkins and Turner [
12]. In the low-frequency procedure that is the so-called corner method, additional microphone positions are required in the corners in addition to the default positions in the central zone, and the indoor average level is corrected with the highest level in the corners. In the ISO series, the low-frequency procedure is applied for the 50 Hz, 63 Hz, and 80 Hz one-third octave bands, and for rooms with a volume of smaller than 25 m
3. However, this procedure was empirically proposed, and its validity is not fully examined for various cases although measurements of insulation between rooms were intensively carried out [
12,
13,
14,
15]. Regarding façade insulation, we have recently performed a 1/4-scale model measurement using a small house model installed in a semi-anechoic chamber [
7], and the low-frequency procedure was roughly validated using the measured sound pressure levels at multiple grid points [
16].
In this paper, field measurements of façade sound insulation are performed above 25 Hz for an empty room with a volume of about 20 m3 in a mock lightweight wooden house, in order to validate and possibly modify the low-frequency procedure in ISO 16283-3. In the measurements, two loudspeakers for lower and higher frequency ranges were used as outdoor sound sources, and a number of grid points and additional points for the microphone were arranged indoor and outdoor for detailed examination. Regarding the wooden house, two kinds of soundproofing measures: weight increasing of walls/ceiling, and double window systems, were implemented step-by-step, and the measurements were also performed under different conditions.
Firstly, the behaviors of outdoor and indoor sound pressure distributions at low frequencies are examined, especially around the corner of the room, which will suggest a reasonable instruction on the microphone positions. Secondly, regarding the energy-average level of all grid points indoor as a reference, the deviations of the estimates by the default and low-frequency procedures are determined. More specifically, alternative ways of correction in the low-frequency procedure are tested for reducing systematic error and uncertainty. Finally, based on the above examination, the global sound insulation performances of different façade conditions are evaluated with normalized level difference that is accompanied by reverberation time measurements, and the effects of the typical soundproofing measures are demonstrated.
2. Experimental Setup
2.1. Mock Wooden House
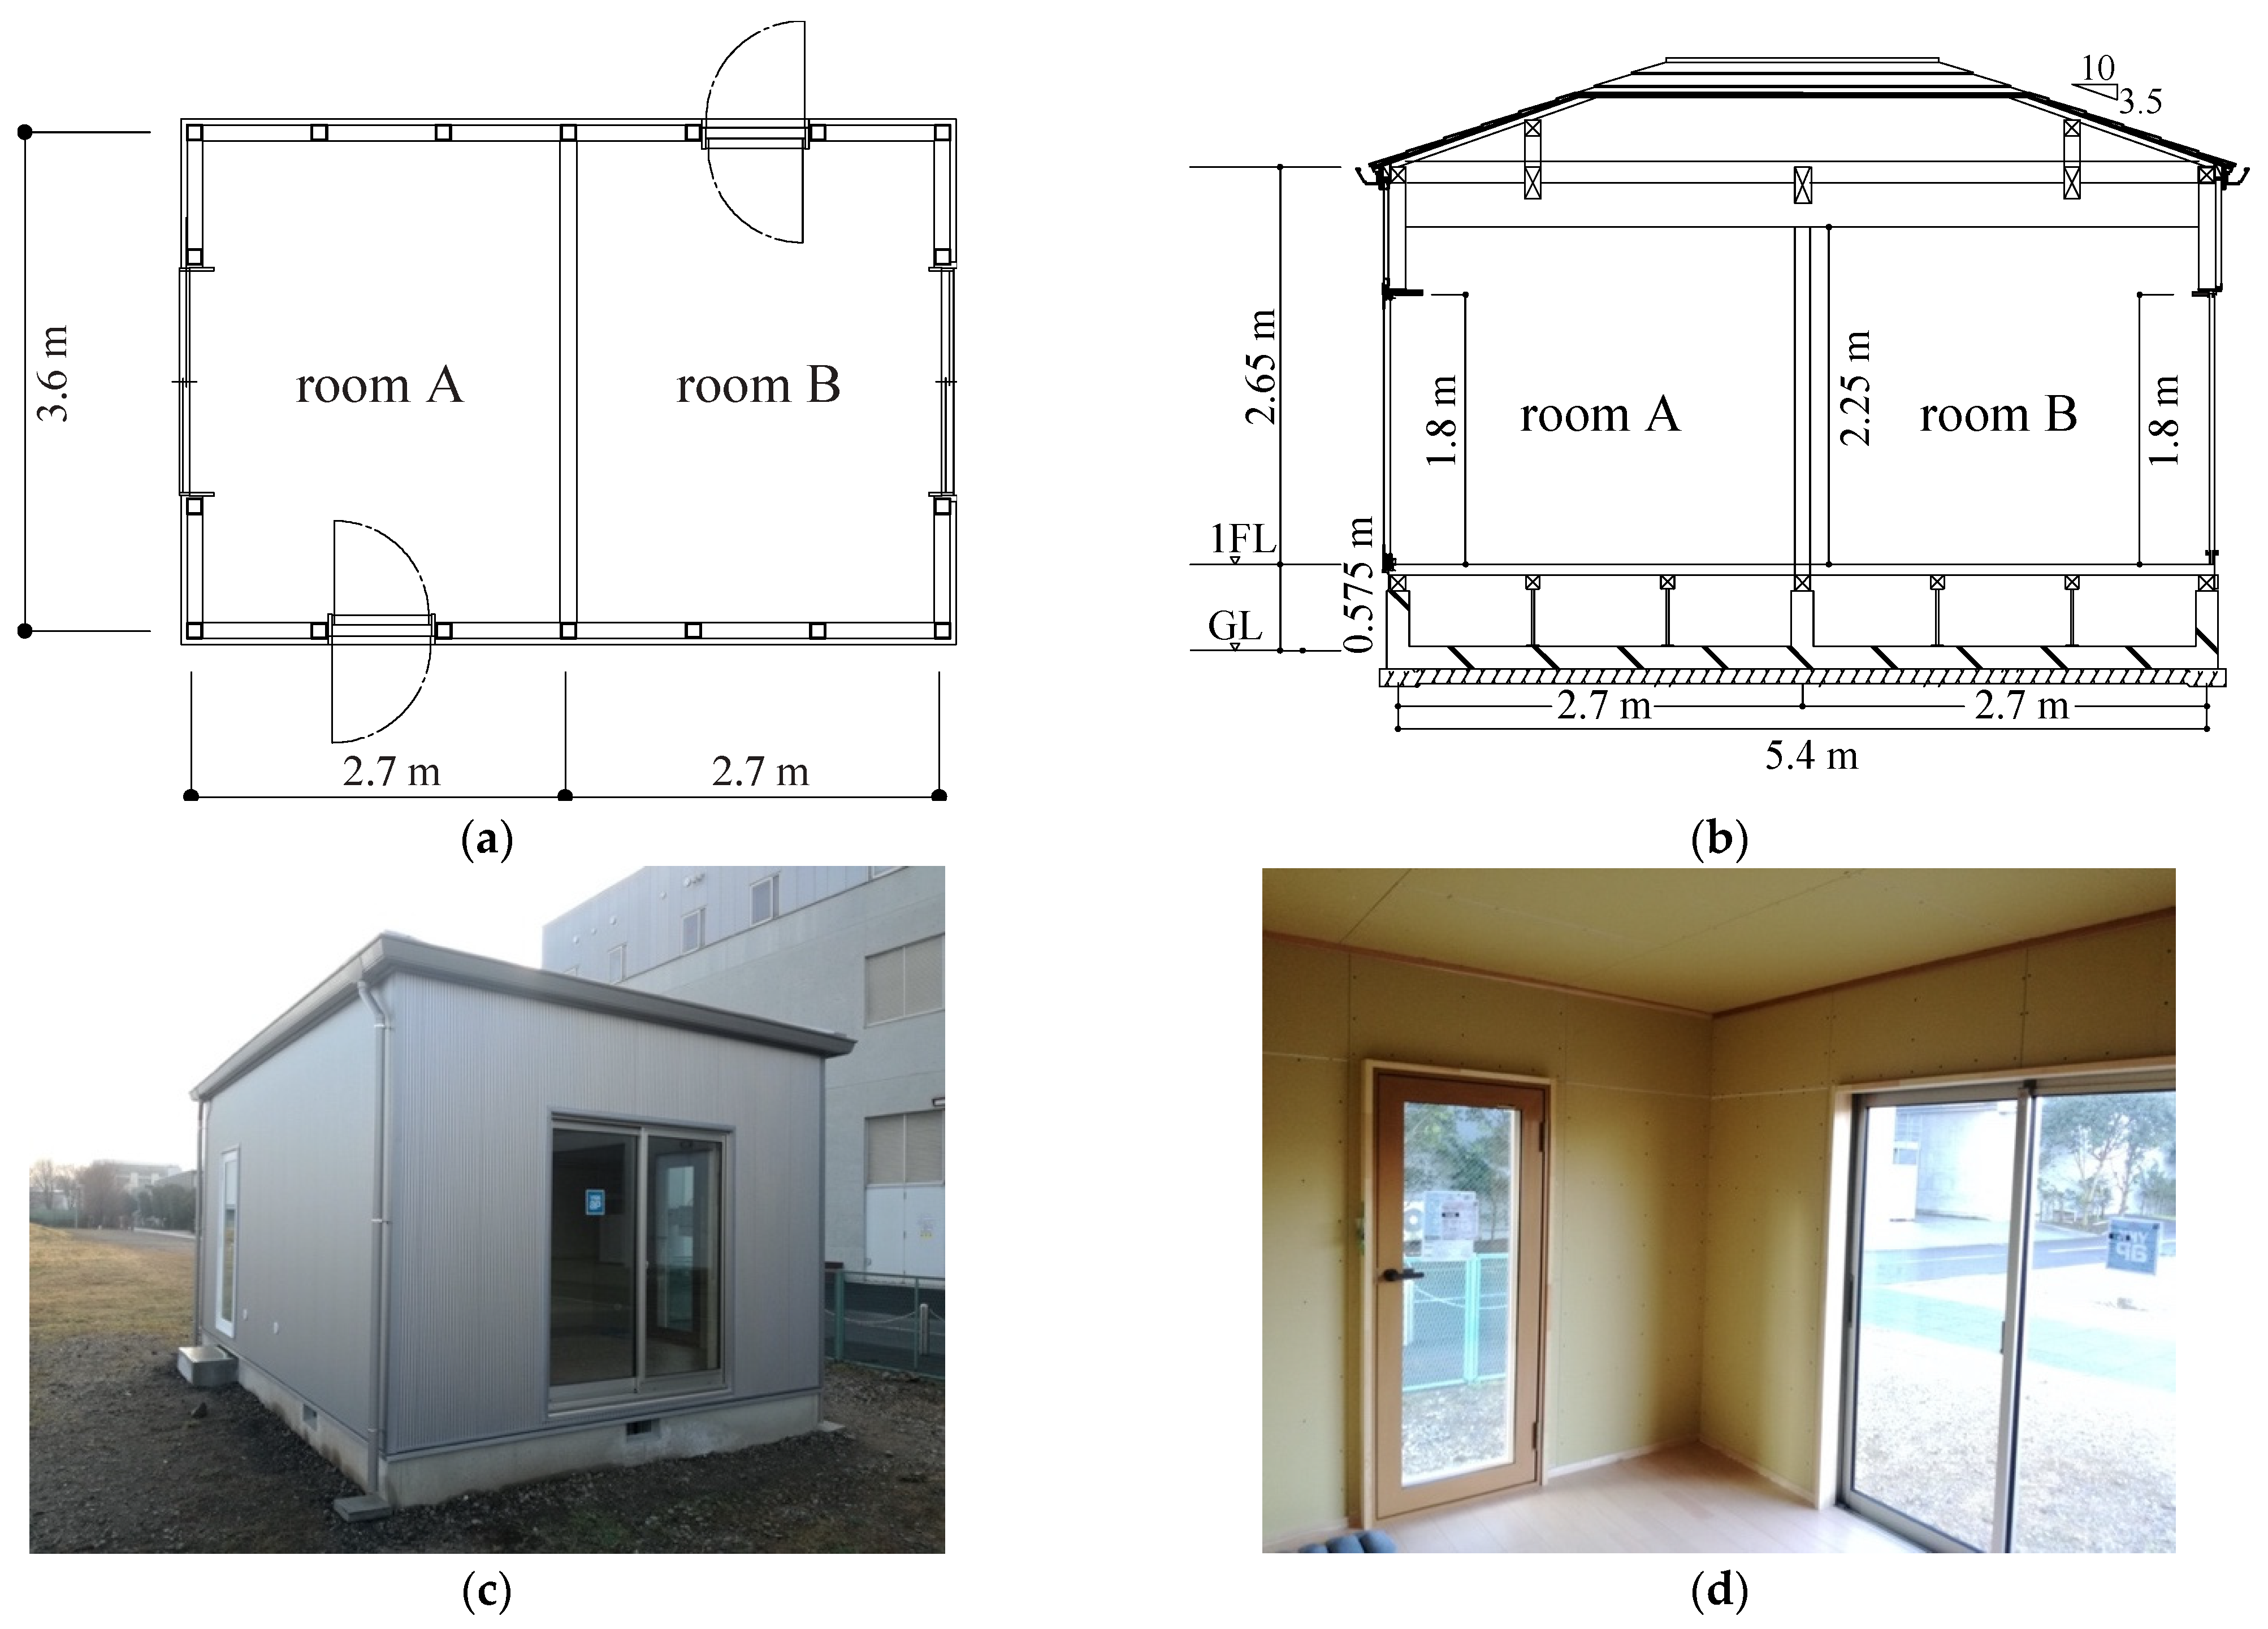
Figure 1 shows the mock wooden house constructed by the Japanese traditional timber framework method in the field without obstacles nearby. This house has two rooms (rooms A and B) with a volume of about 20 m
3, of which plan layout is rotationally symmetrical, and each room has an aluminum sliding terrace window. For room A, a standard sash with 5 mm thick single glazing was installed, while a soundproof sash with double glazing of a total thickness of 10 mm was installed for room B. The façade walls and the roof/ceiling were lightweight structures with a surface density of about 25 kg/m
2 (including frames), the partition wall was a hollow double wall, the floor was wooden, and a double door with high sound transmission loss was installed for each room. In the four sides of the concrete foundation (
h = 575 mm), four underfloor ventilations (
w = 275 mm,
h = 155 mm) were installed under the windows and on the opposite side of the doors. The roof was a hipped roof, and no ventilation was installed for the attic space. The detailed components of the house are shown in
Table 1.
Façade airborne sound insulation measurements were conducted in room A, under three conditions without and with two kinds of soundproofing measures. Case 1 is the original condition as described above. In Case 2, for weight increasing of walls and ceiling, two layers of hard gypsum board (12.5 mm thick, surface density of about 15 kg/m2) were put on the existing inner gypsum board, thus roughly doubling the surface density from 25 to 55 kg/m2. In addition to Case 2, a double window system was installed in Case 3, which is made of an exterior window (double glazing: 3 mm + A6 mm + 3 mm), an air layer with a thickness of 190 mm, and an interior window (single glazing: 5 mm).
Note that in
Section 4 and
Section 5, the measurement procedures are examined in detail using the measured results in Case 1, and the sound insulation performances of the façades in Cases 1 to 3 are compared in
Section 6.
2.2. Measurement Setup
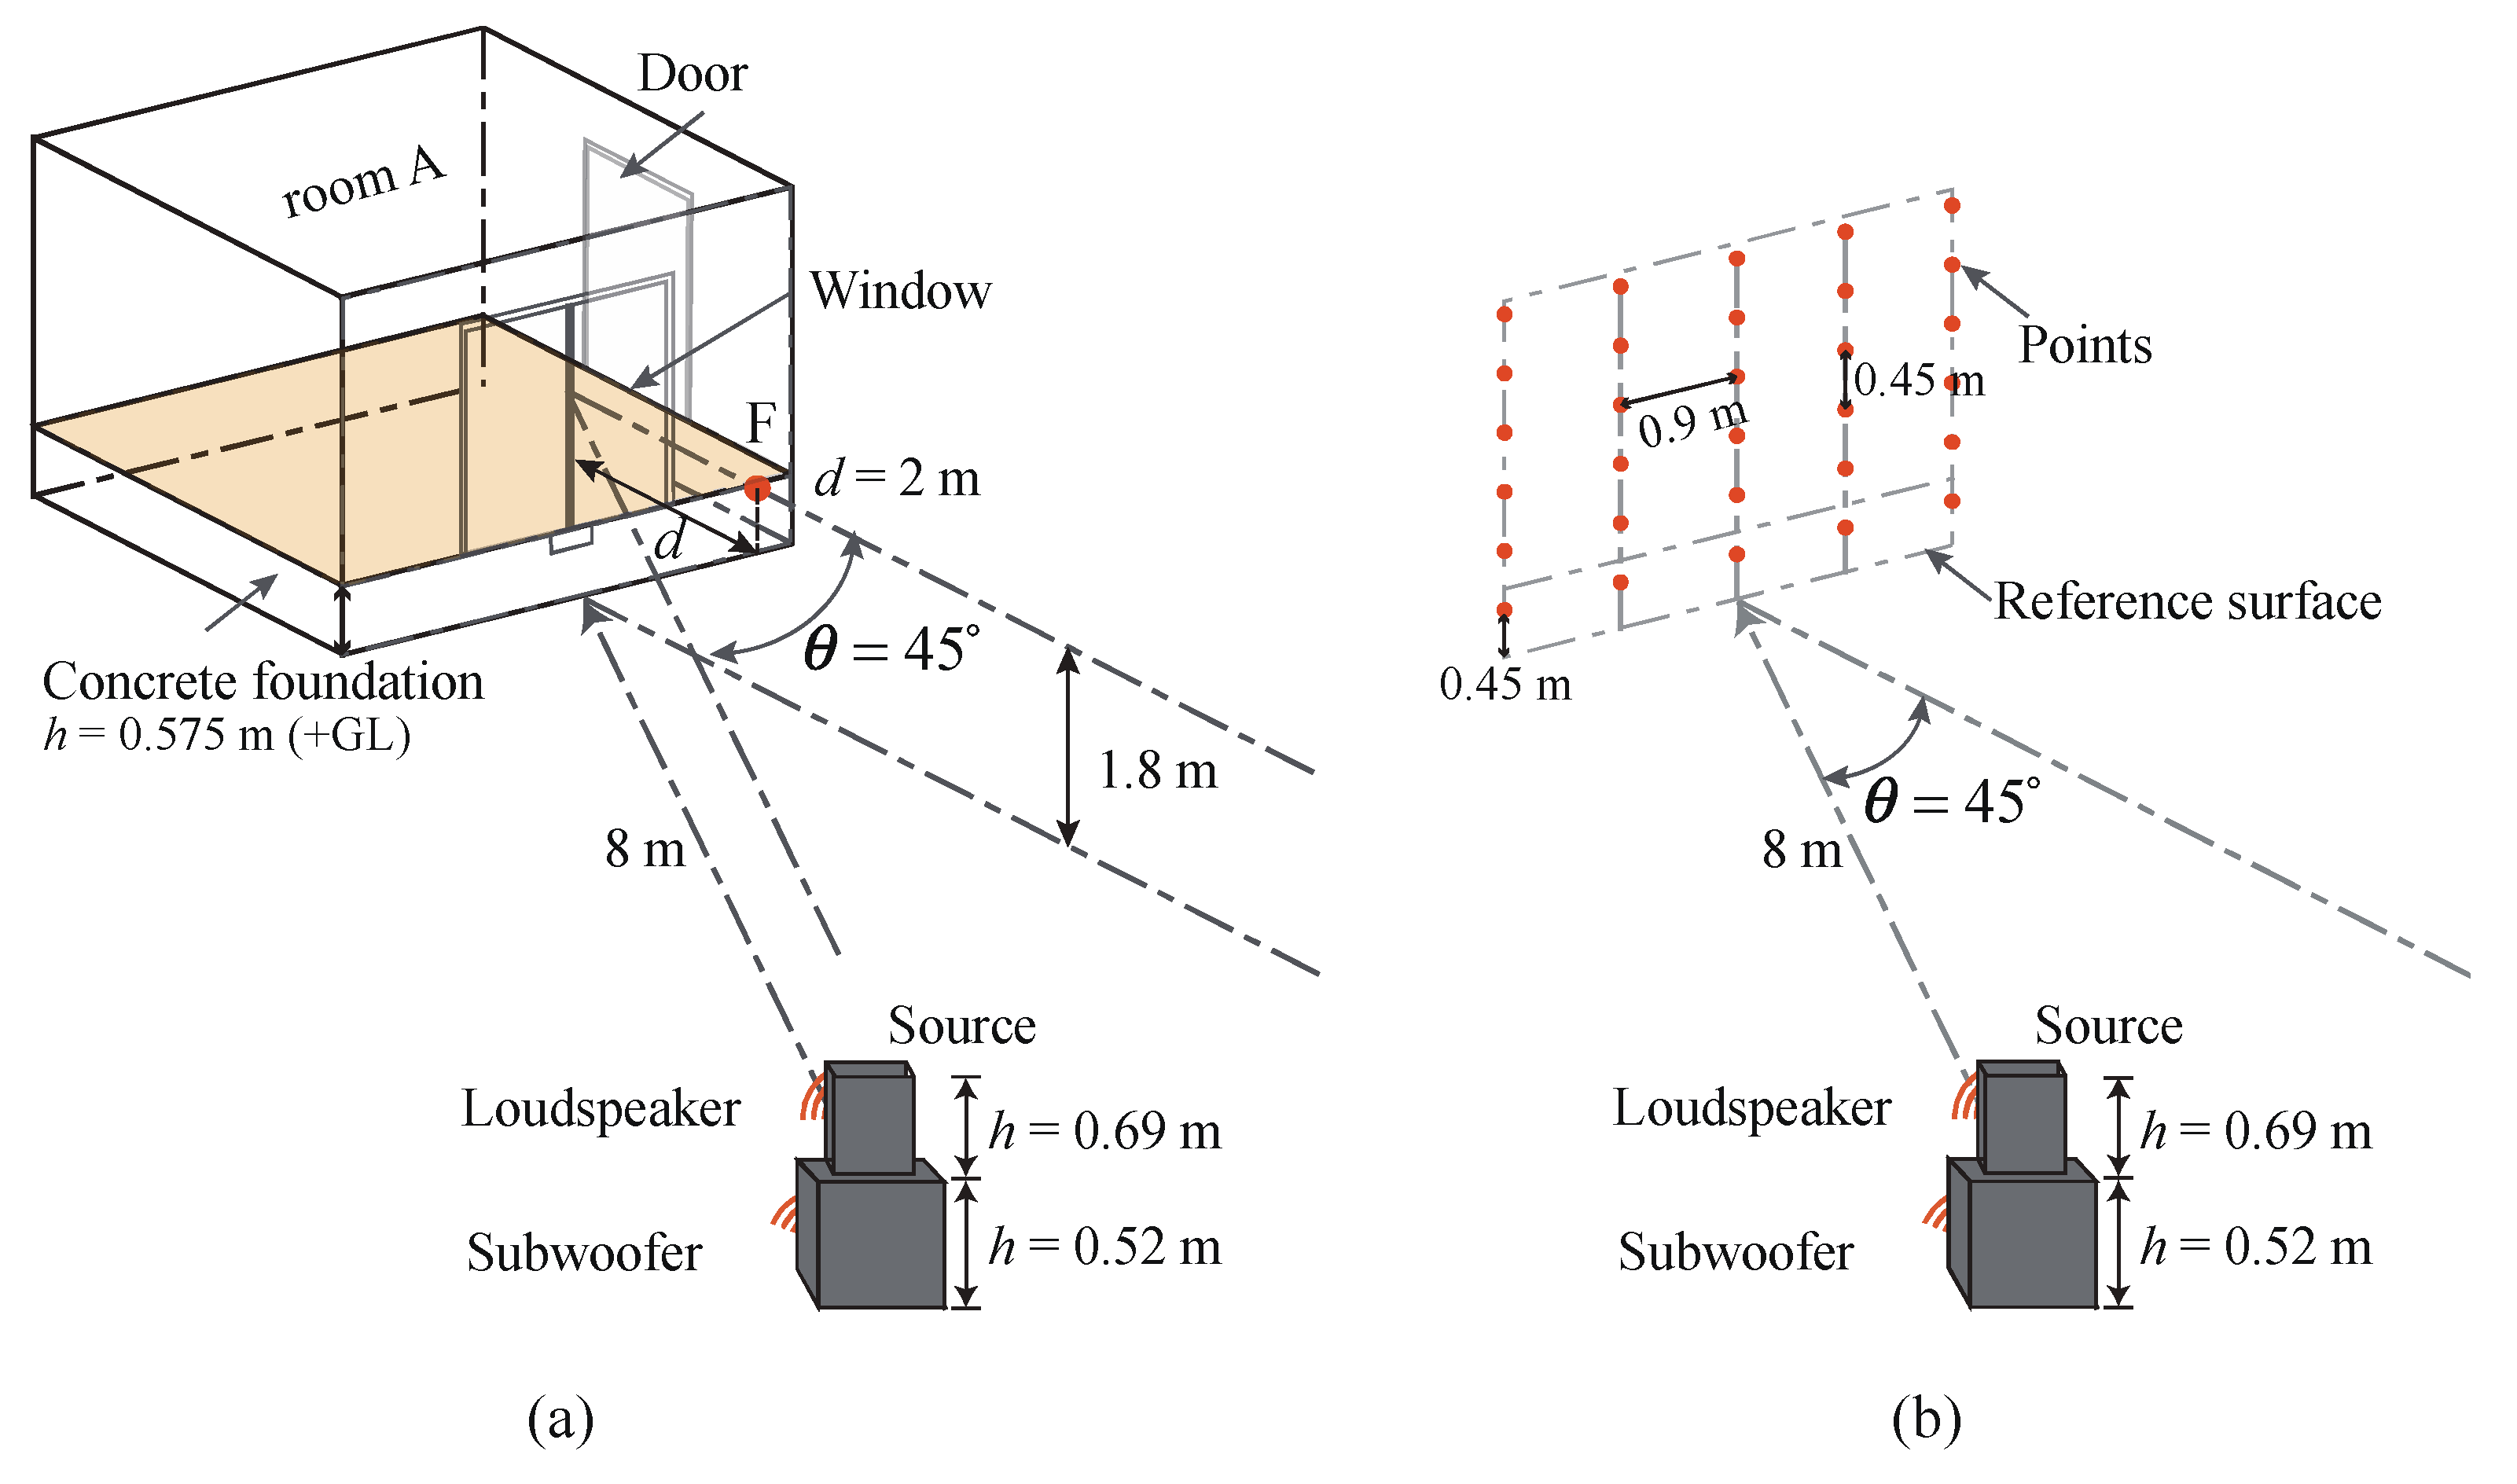
Façade airborne sound insulation measurements were conducted in room A, where a number of microphones and two loudspeakers were arranged as shown in
Figure 2 and
Figure 3. A subwoofer (Electro-Voice EKX18SP) was set on the round for the pink noise in the one-third octave bands from 25 Hz to 160 Hz with an average time of 20 s, and another loudspeaker (JBL EON15 G2) was set above the subwoofer for the noise from 200 Hz to 5 kHz bands with an average time of 10 s, both of which were placed at a distance 8 m away from the center of the window in the direction of 45 degrees. The measurements were conducted under windless condition, and it was confirmed that the signal-to-noise ratio was about 10 dB at 25 Hz, and greater than 20 dB above 31.5 Hz.
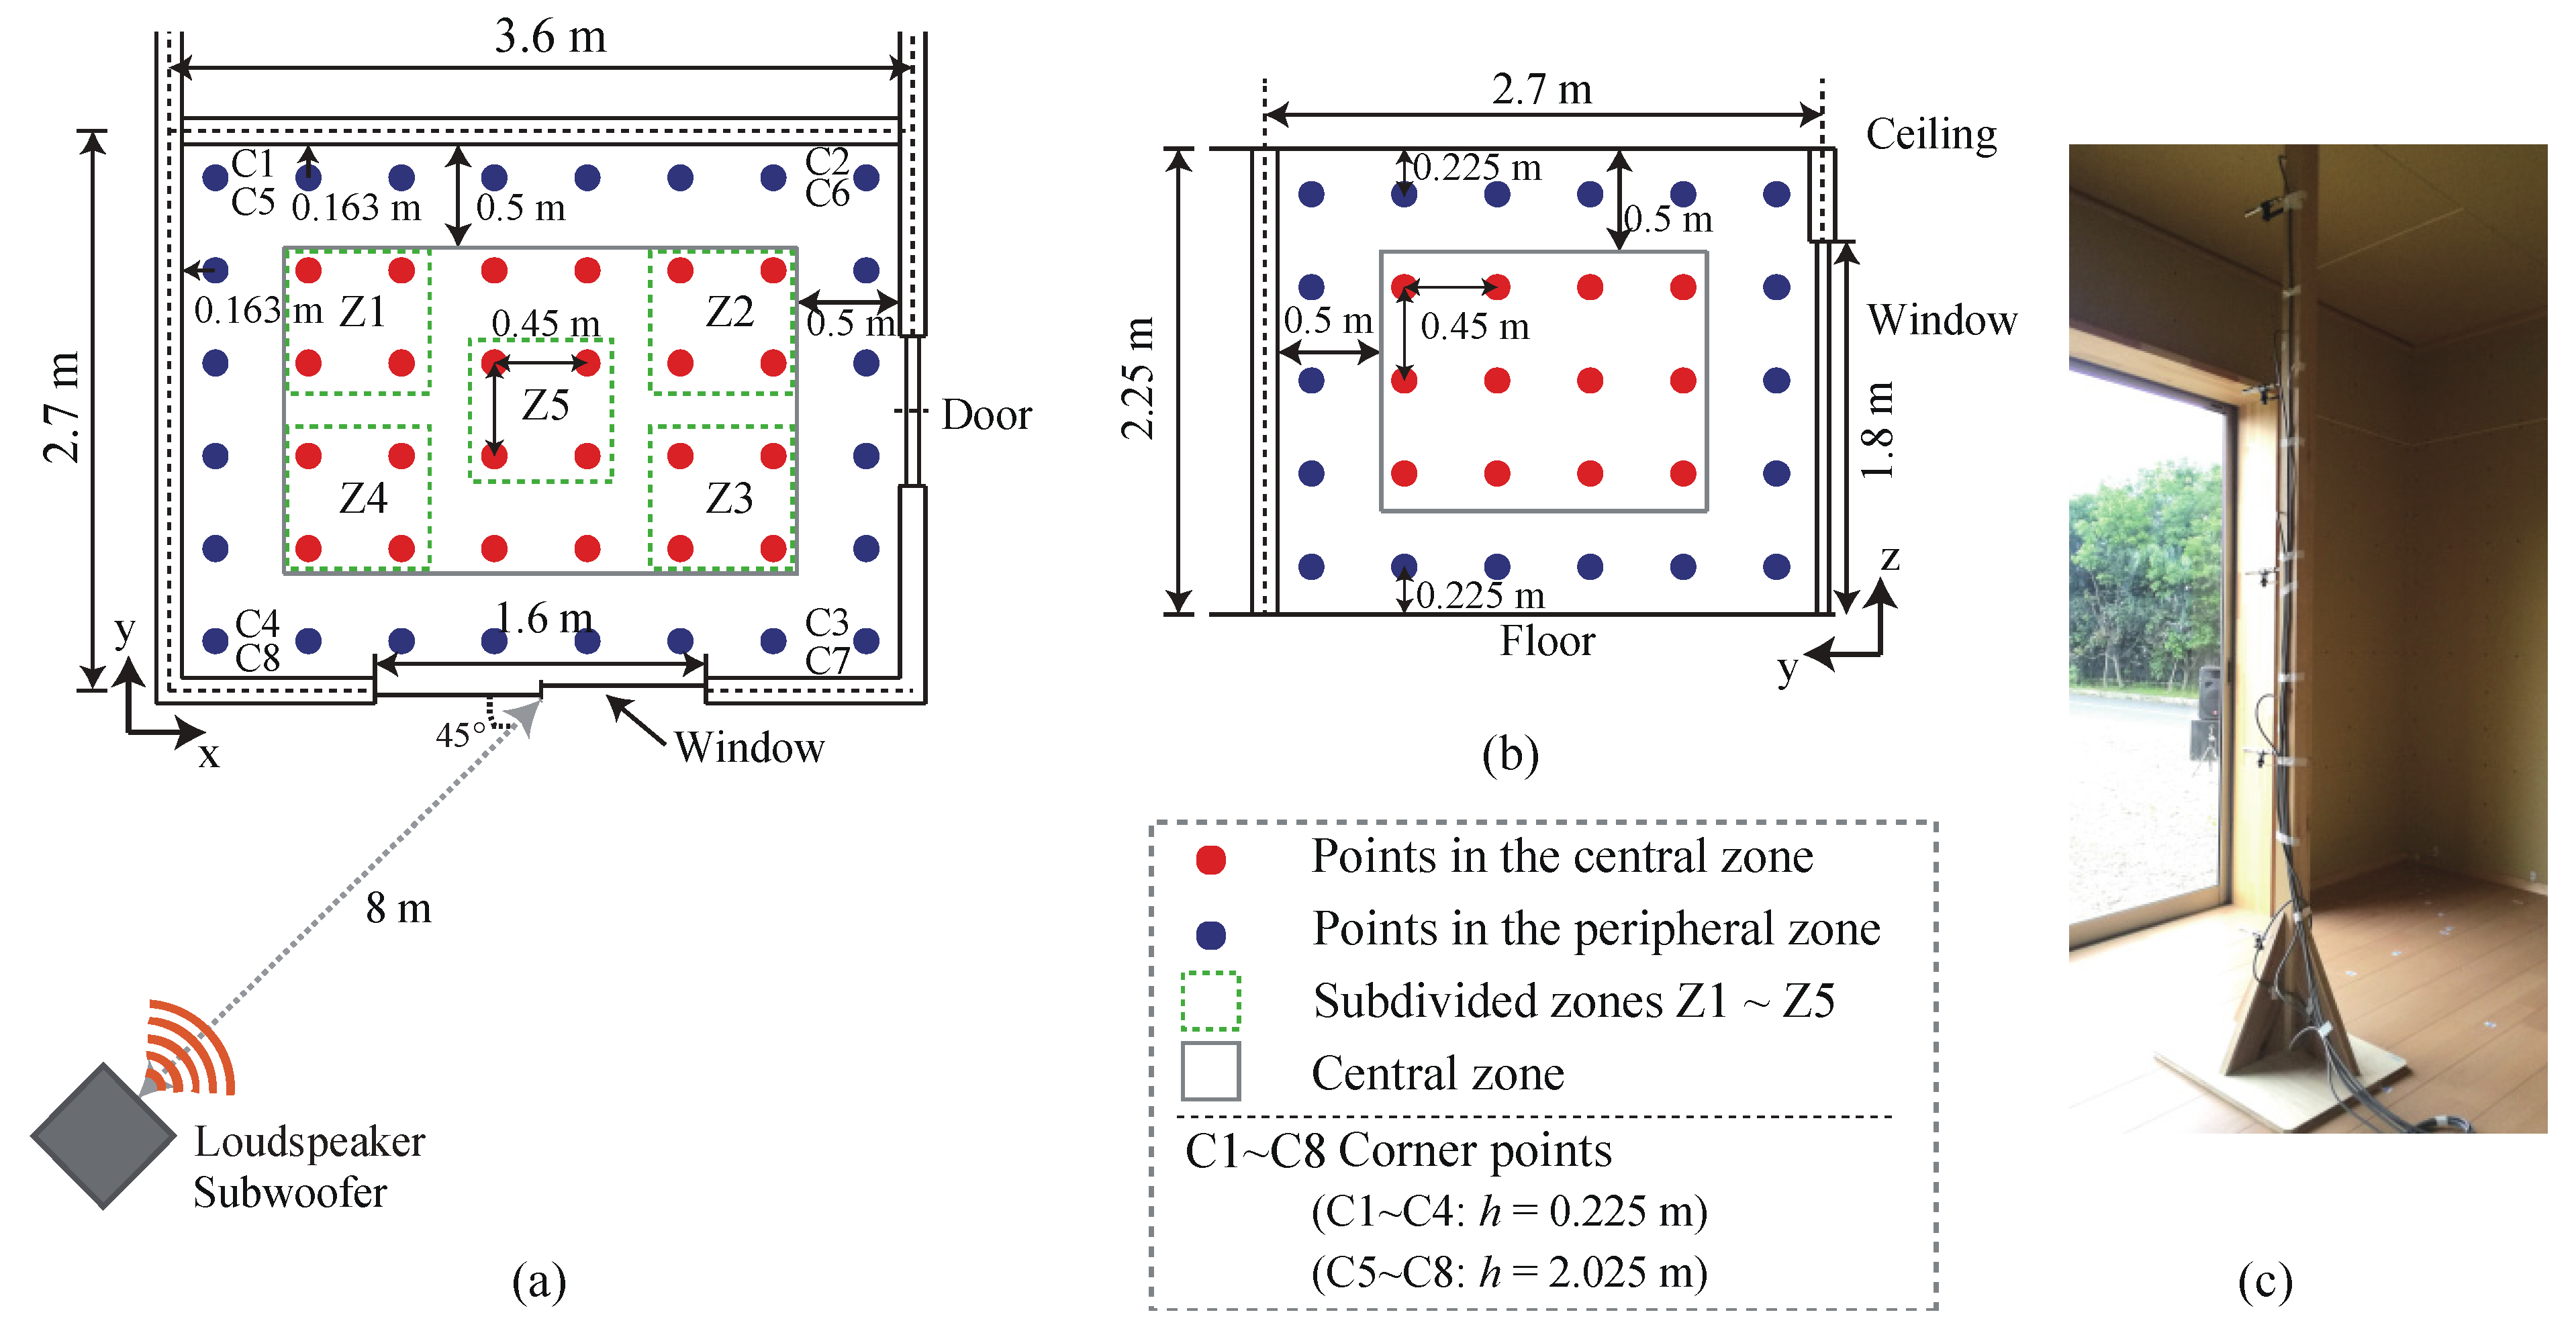
In
Figure 2, 240 grid points for microphone were arranged with an interval of 0.45 m in the room. In blue, 168 points were arranged with a distance of 0.163 m to 0.225 m away from the boundaries, in which the corner points C1~C4 were near the floor, and C5~C8 were near the ceiling. On the other hand, 72 points (red) were arranged in the central zone. In the measurement, a vertical array of five 1/2-inch microphones was moved at each horizonal position, and the five-channel signals were recorded. One set of measurements took less than two hours.
In
Figure 3, according to the element and global methods in the ISO, 10 points were arranged on the window glazing surface evenly and asymmetrically, and one point (F) was set at a distance 2 m in front of the window, at a height of 1.2 m above the floor (1.8 m (+GL)). In addition, as a reference for outdoor sound pressure level, free-field measurements were conducted at a number of grid points on the ground without obstacles nearby, within the area corresponding to the front façade (
w = 3.6 m and
h = 0.45 m~2.7 m (+GL)), where the horizontal and vertical intervals were 0.45 m and 0.9 m, respectively.
3. Estimation of Indoor Average Sound Pressure Level
3.1. Implementation of the Default Procedure
In ISO 16283-3, the default procedure is specified for determining the indoor sound pressure levels on one-third octave bands from 100 Hz to 5 kHz. In the procedure, a minimum of five microphone positions are distributed in the central zone that is 0.5 m apart from the boundaries, and at least 0.7 m apart from each other. In addition, those are not in the same plane and regular grid. However, it is well known that the selection of microphone positions leads to a significant deviation for estimating the indoor energy-average level at low frequencies. Accordingly, this deviation can also affect more or less the estimated level by the low-frequency procedure.
In order to determine the measurement deviation, five microphone positions were selected from the 72 points in the central zone of the room as follows: (1) The central zone was divided into five subdivided zones Z1~Z5 as shown in
Figure 2a, and in each zone one microphone position was selected. (2) In x-axis, five positions were not in the same plane, while in y-axis and z-axis, those are distributed in all planes, allowing up to two positions in the same plane. (3) The distance of any two positions was at least 0.7 m. The arrangements satisfying the above requirements were 4752 sets, and the energy-average sound pressure level of each set was calculated as
L2,5pt. On the other hand, as a reference indoor sound pressure level, the energy-average level of all grid points was calculated as
L2,all.
3.2. Implementation of the Low-Frequency Procedure
In the ISO, the low-frequency procedure is specified for one-third octave bands in 50 Hz, 63 Hz and 80 Hz, where the indoor energy-average level by the default procedure is corrected with additional measurements in the corners. Specifically, the low-frequency energy-average level is calculated by combining
L2,5pt from the default procedure and the maximum level among the corners,
L2,Corner, in each band using the following equation:
In the measurements, L2,Corner is identified from a minimum of four corners of a room, where two corners should be at ground level and at the ceiling level, respectively, and the microphone positions are fixed at a distance of 0.3 m to 0.4 m from each boundary. These requirements were empirically provided based on the previous studies, however, which seems to be intuitively questionable in some aspects.
According to the instruction in the ISO, 36 sets of four corners are possible to be selected, regardless of horizontal position. This could lead to increased uncertainty for detecting the maximum level among the corners in the low-frequency procedure. In
Section 5.1, the deviation of selecting four corners on the corrected indoor average level is evaluated from all combinations of
L2,5pt and
L2,Corner.
Regarding the value of
L2,Corner, there seems to be no theoretical basis for the use of the maximum level, and it is also not reasonable in the aspect of uncertainty accompanied with the above four-corner selection. In a simple manner, one possible value is the energy-average level over all corner points,
Lcn,ave, instead of the maximum level
Lcn,max. Therefore, the two kinds of low-frequency indoor sound pressure levels,
L2,LF,max and
L2,LF,ave, were calculated from
Lcn,max and
Lcn,ave, respectively, and the agreement with the average level
L2,all are quantitatively compared in
Section 5.2.
Considering the additional effort for the low-frequency procedure, the measurement in four corners is certainly practical rather than in all corners. However, for reducing the uncertainty with the four-corner selection, a more specific selection scheme may be preferable. In the study of sound insulation measurements between rooms by Hopkins and Turner [
12], it was suggested that the maximum level can be detected in the four corners opposite to the partition wall. On the other hand, the selection of non-adjacent corners would be a promising scheme for steadily estimating the average level. A case study on the four-corner selection is demonstrated in
Section 5.3.
Regarding the microphone position in the corner, Hopkins [
17] also originally proposed a position at a distance of 0.3 m to 0.6 m from each boundary, but the upper distance was reduced to 0.4 m in the ISO, not overlapping with the central zone for the default procedure. It is also noted in the ISO that the distance from each boundary that forms the corner does not have to be identical, giving an example of the combination of 30 cm, 35 cm and 40 cm. However, considering that the wavelength below 100 Hz is greater than 3 m, the limitation and the additional note on the microphone position seem to be rather less convincing. In order to clarify the influence of the microphone position, sound pressure levels are measured around the corners in
Section 4.3, where the microphone position is shifted from 2 cm to 60 cm identically to each boundary, and also fixed at the ISO recommendation point.
4. Behavior of Outdoor and Indoor Sound Pressure Level Distributions
4.1. Outdoor Sound Pressure Levels
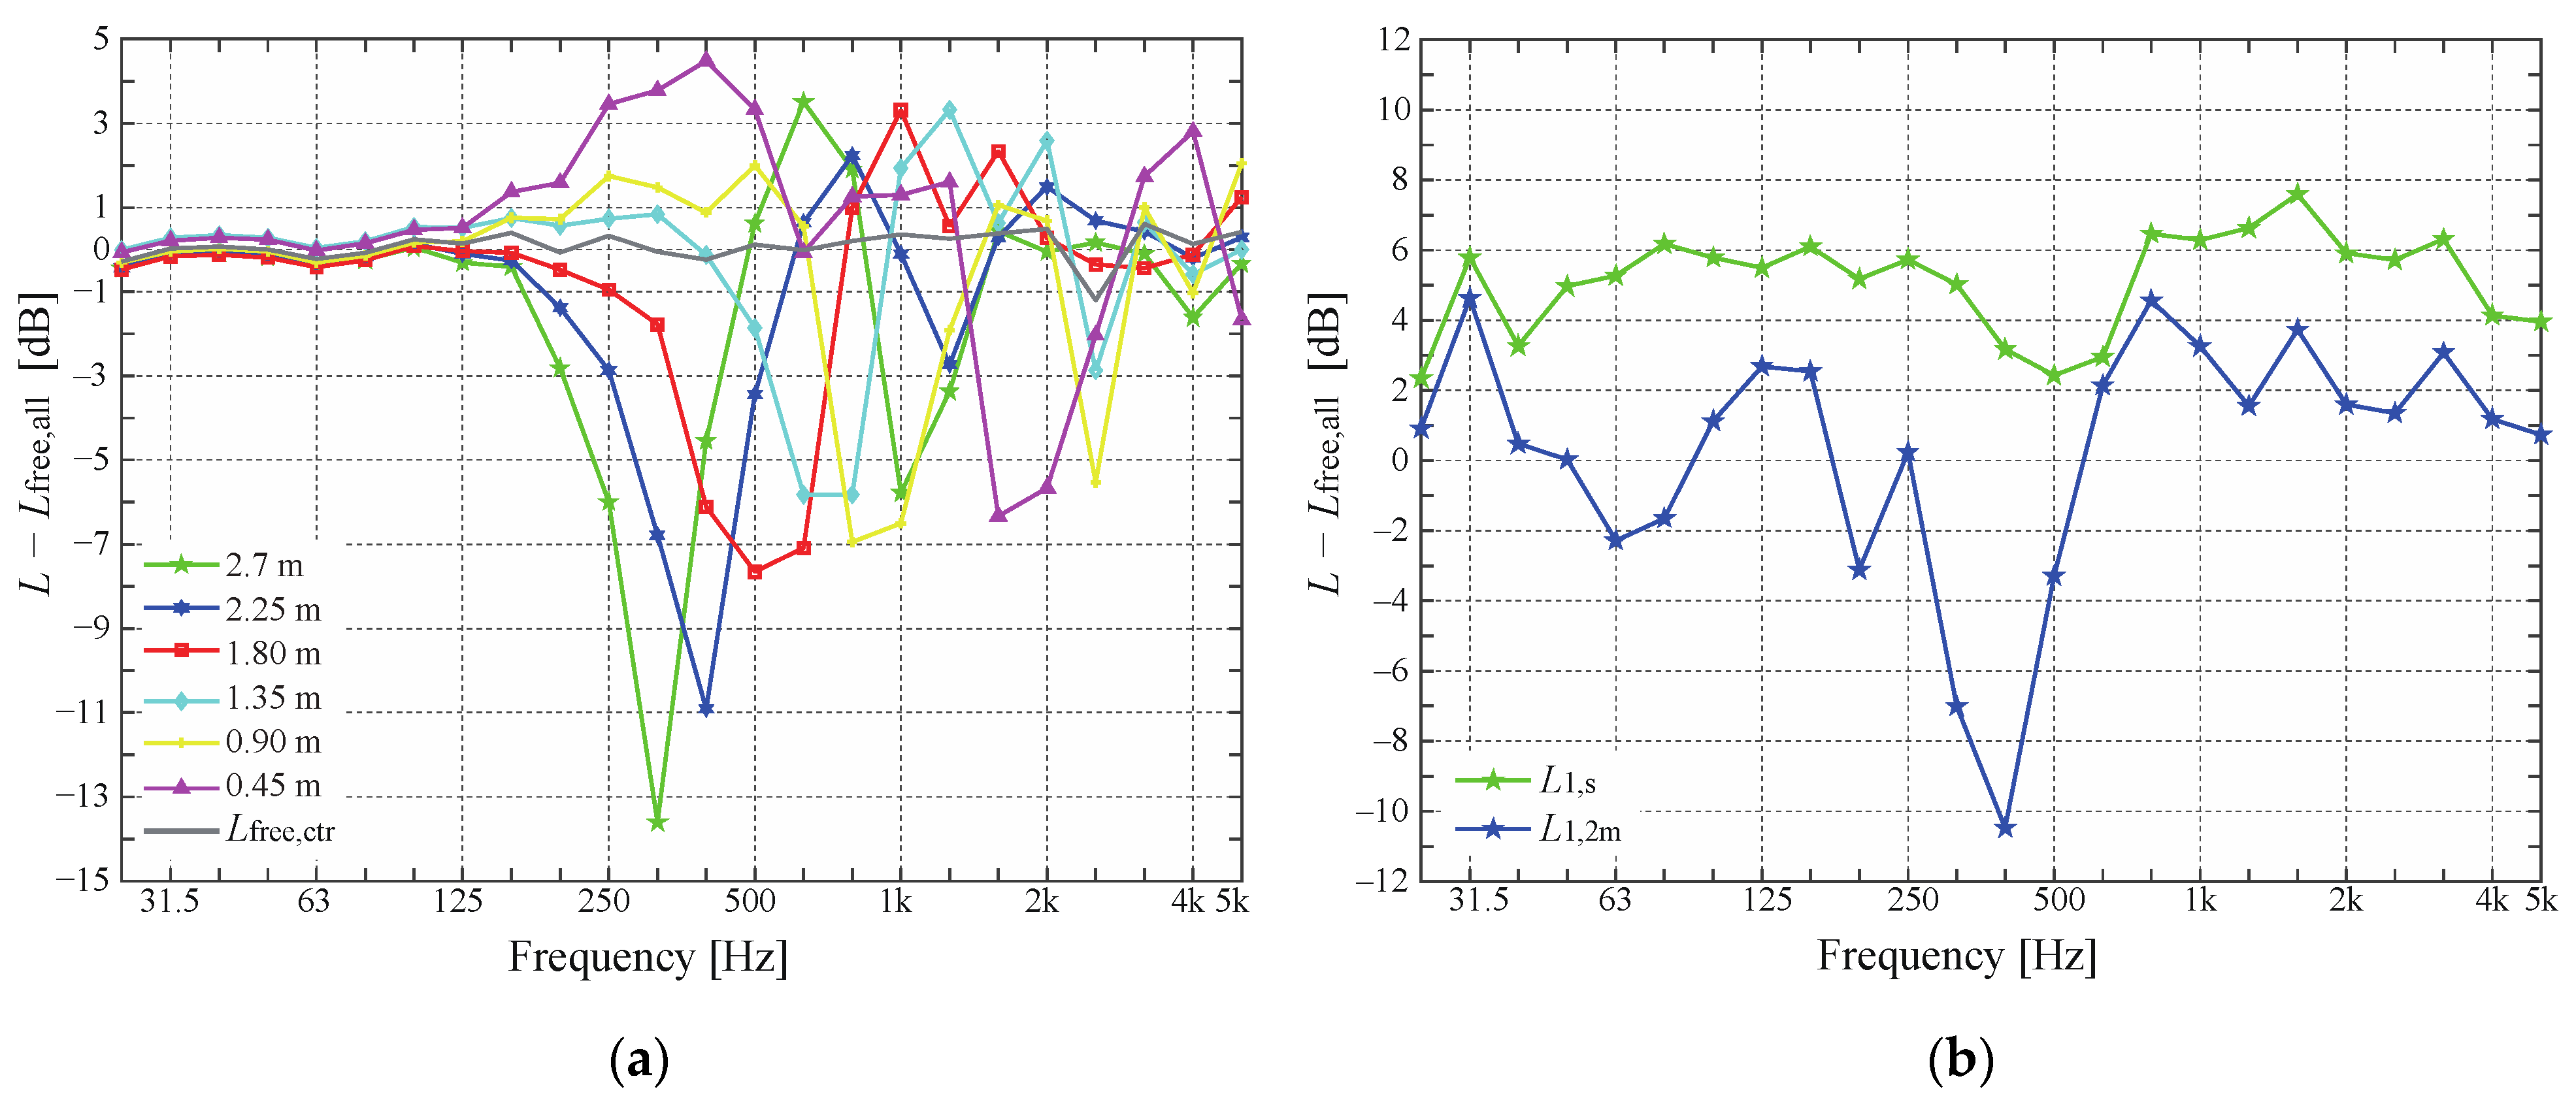
Figure 4a shows the measured sound pressure levels of the free-field points on the middle vertical line with six different heights, relative to the average level of all grid points,
Lfree,all. It is seen that the influence of the height of microphone position is negligible below 125 Hz, whereas above 160 Hz, violent fluctuation appears due to the interference with a reflected sound from the ground. In the figure, the energy-average level on the middle vertical line,
Lfree,ctr, is additionally depicted. It shows that the average on the vertical line fully eliminates the fluctuation, and
Lfree,ctr is in very good agreement with
Lfree,all. Hence, in the free-field measurement, one microphone position is sufficient for the low-frequency procedure, whereas a vertical array of microphone positions is required for the default procedure.
Figure 4b shows the outdoor sound pressure levels measured by the global and element methods in the ISO. At the point F for the global method,
Ll,2m greatly fluctuates below 500 Hz, due to the interference with reflected waves from the façade and the ground. Specifically, the dip around 63 Hz is caused by the reflection from the façade, which roughly corresponds to the theoretical estimates [
18]. Thus, as Berardi [
19] pointed out, one microphone position 2 m away from the façade must be unsuitable for reliable evaluation of outdoor level in the low-frequency procedure. On the other hand, regarding the energy-average sound pressure level over the window,
Ll,s, by the element method, the relative levels to
Lfree,all are relatively close to a theoretical value of 6 dB, except for around 500 Hz. Below 250 Hz, the fluctuation is fairly moderate, and one microphone position is probably sufficient for the low-frequency procedure as well as in the free-field measurement.
In view of the above results, the outdoor-to-indoor level difference, relative to the free-field level
Lfree,ctr, is calculated as
Dfree in
Section 6.
4.2. Indoor Sound Pressure Levels
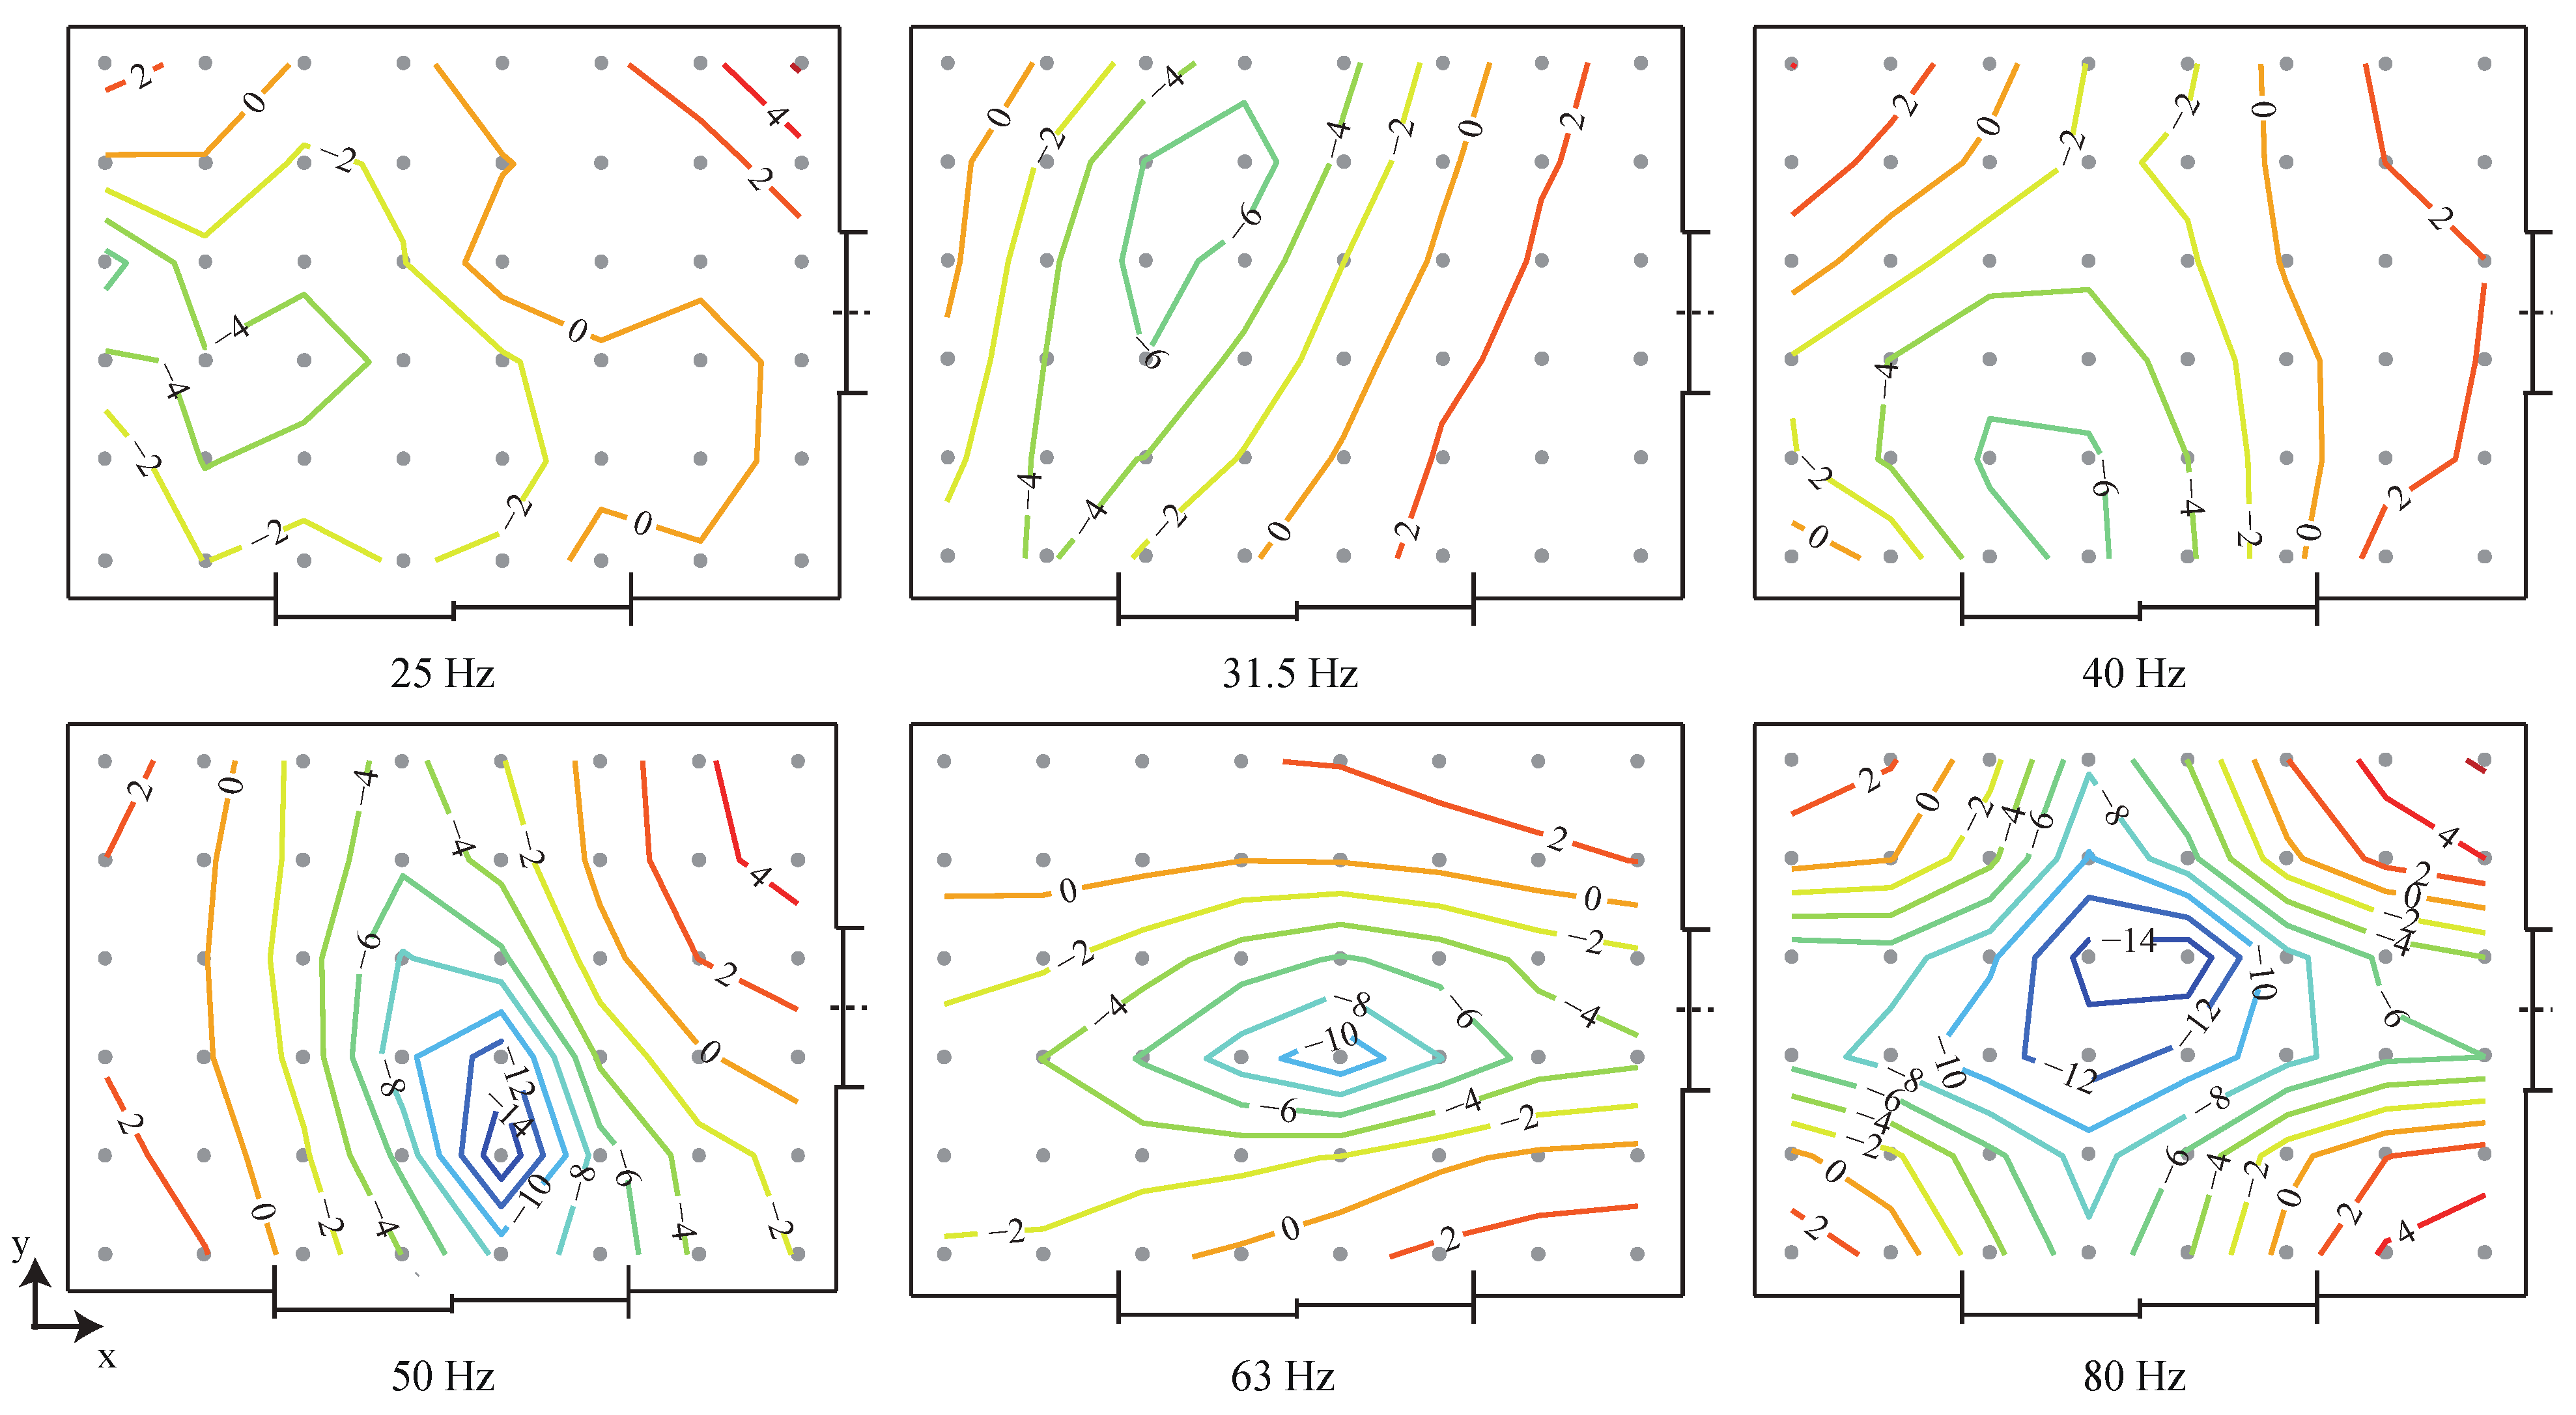
Figure 5 shows the sound pressure level distributions in the horizonal plane of z = 1.125 m, relative to
L2,all over all grid points in the room, at low-frequency bands. A large deviation occurs in each band from 50 Hz to 80 Hz, roughly corresponding to the normal mode. Moreover, even below the lowest natural frequency of 50 Hz, a negligible deviation occurs.
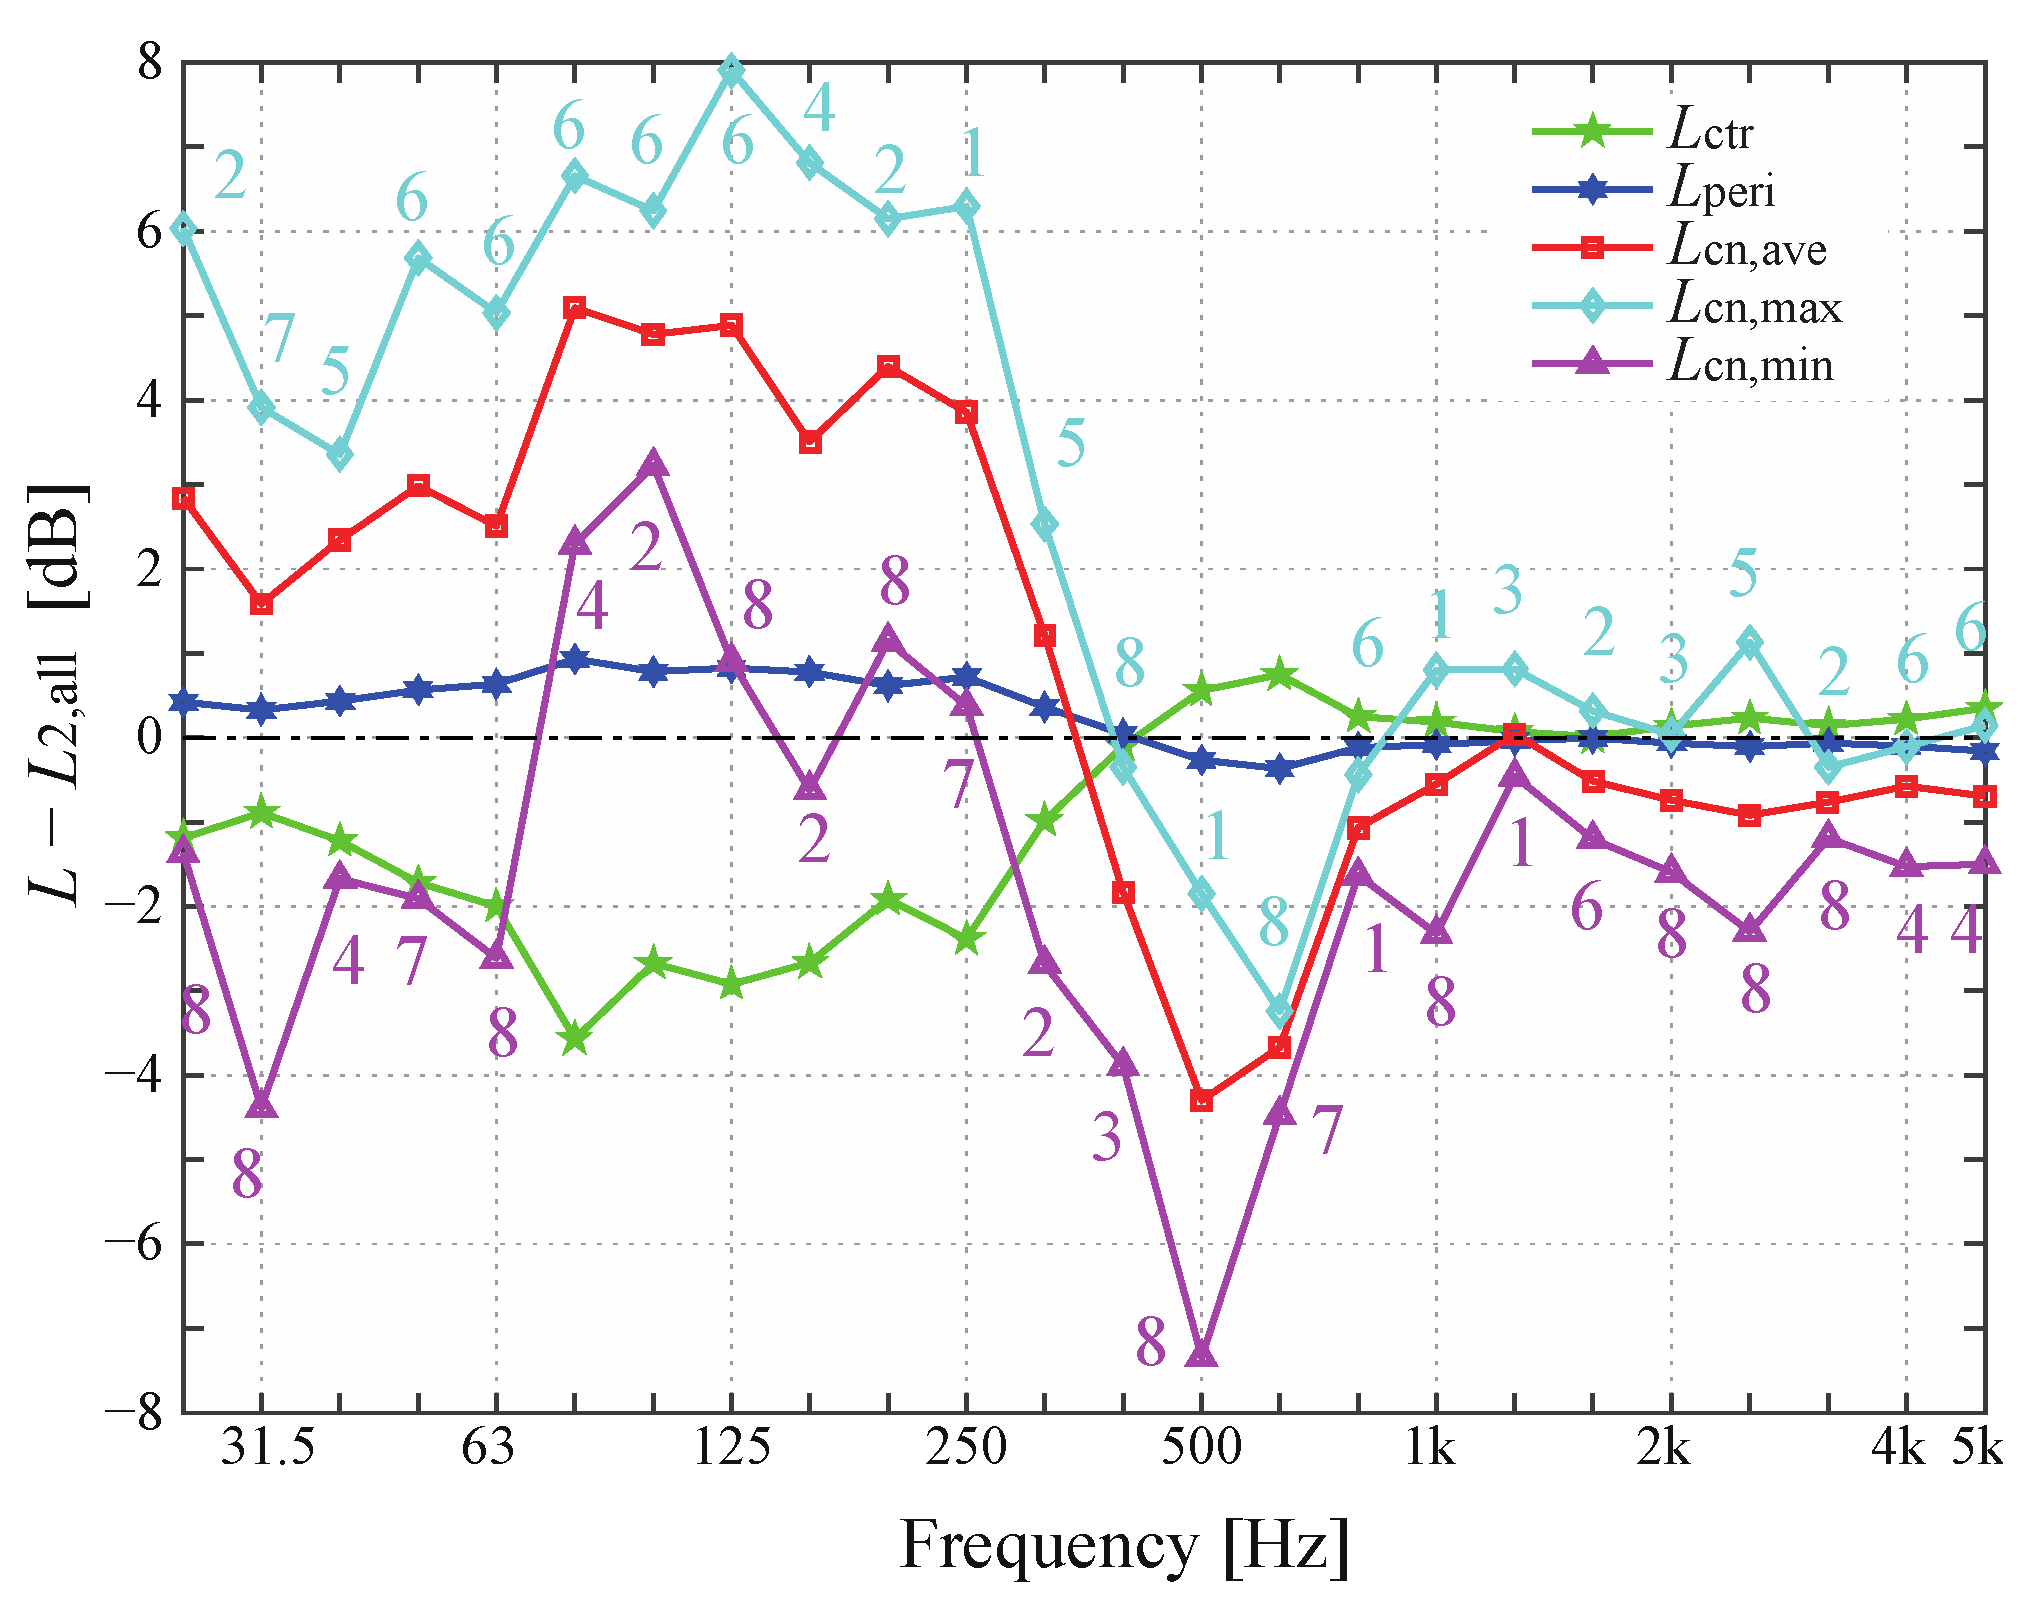
In order to clarify the tendency of the distribution, the energy-average levels in the central zone
Lctr, in the peripheral zone
Lperi, and in all corners
Lcn,ave, were calculated relative to
L2,all.
Figure 6 shows these average levels and the maximum/minimum levels among the corners,
Lcn,max, and
Lcn,min. Below 250 Hz, decreases of 1 dB to 4 dB occur in
Lctr, whereas increases of 2 dB to 5 dB occur in
Lcn,ave, and those of 4 dB to 8 dB in
Lcn,max. In particular, from 50 Hz to 125 Hz, the maximum level appears at the corner C6, which is far from the source and near the ceiling, and oppositely, the minimum level often appears at the near corner C8. Consequently, deviations of up to 8 dB arise among the corners in low frequency bands. This tendency is consistent with the results for sound insulation measurements between rooms by Hopkins and Turner [
12], which suggest that a certain number of microphone positions should be set in the corners opposite to a façade wall. In addition, it is noted that a remarkable dip occurs around 500 Hz at all corners, which is due to the interference with reflected waves from the boundaries as explained in the following.
4.3. Sound Pressure Levels around Corners
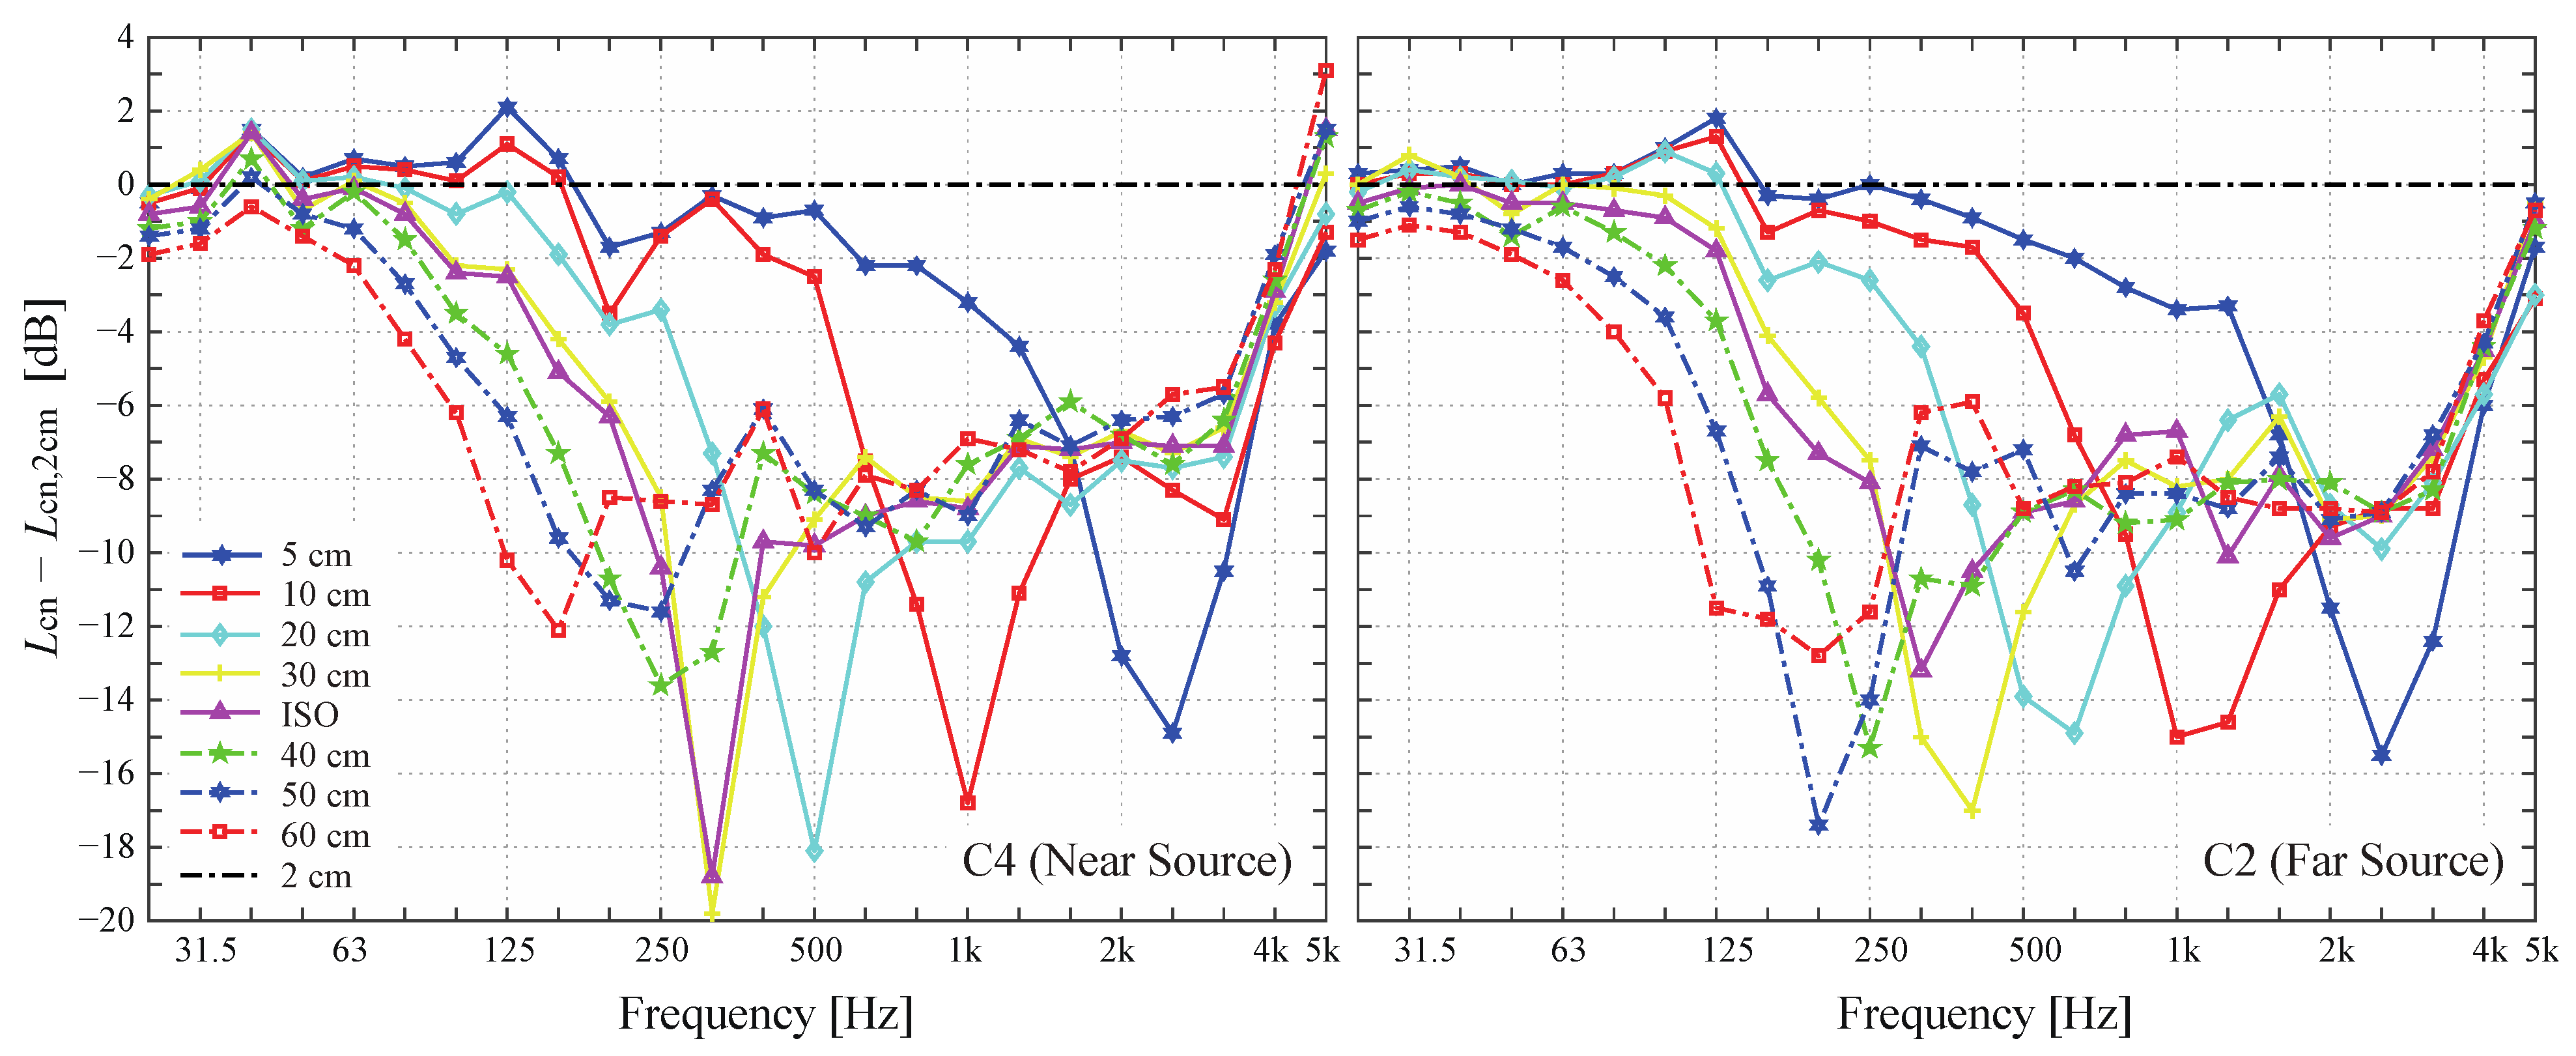
Figure 7 shows the sound pressure levels with shifting the microphone position around the two near and far corners, C4 and C2, relative to those at the nearest point 2 cm away (
Lcn,2cm). As the distance from the corner increases, a remarkable dip shifts to lower frequency, which gradually lowers the level below 100 Hz. Theoretically, this dominant dip is considered due to the destructive interference, which occurs when the distance from the boundaries roughly corresponds with a quarter of the wavelength. This tendency related to the microphone position was also observed in the measurements of insulation between rooms [
20].
Regarding the range of 30 cm to 40 cm specified in the ISO instruction, the decrease level is within 2 dB from 50 Hz to 80 Hz in both corners, which almost validates the instruction. However, no considerable difference was observed at the point with unequal distances from the three boundaries. Finally, the results suggest that the lower limit of microphone distance and the avoidance of identical distance are not necessarily required, and the upper limit is preferably shortened.
5. Validation of the Low-Frequency Procedure
5.1. Correction by ISO 16283-3
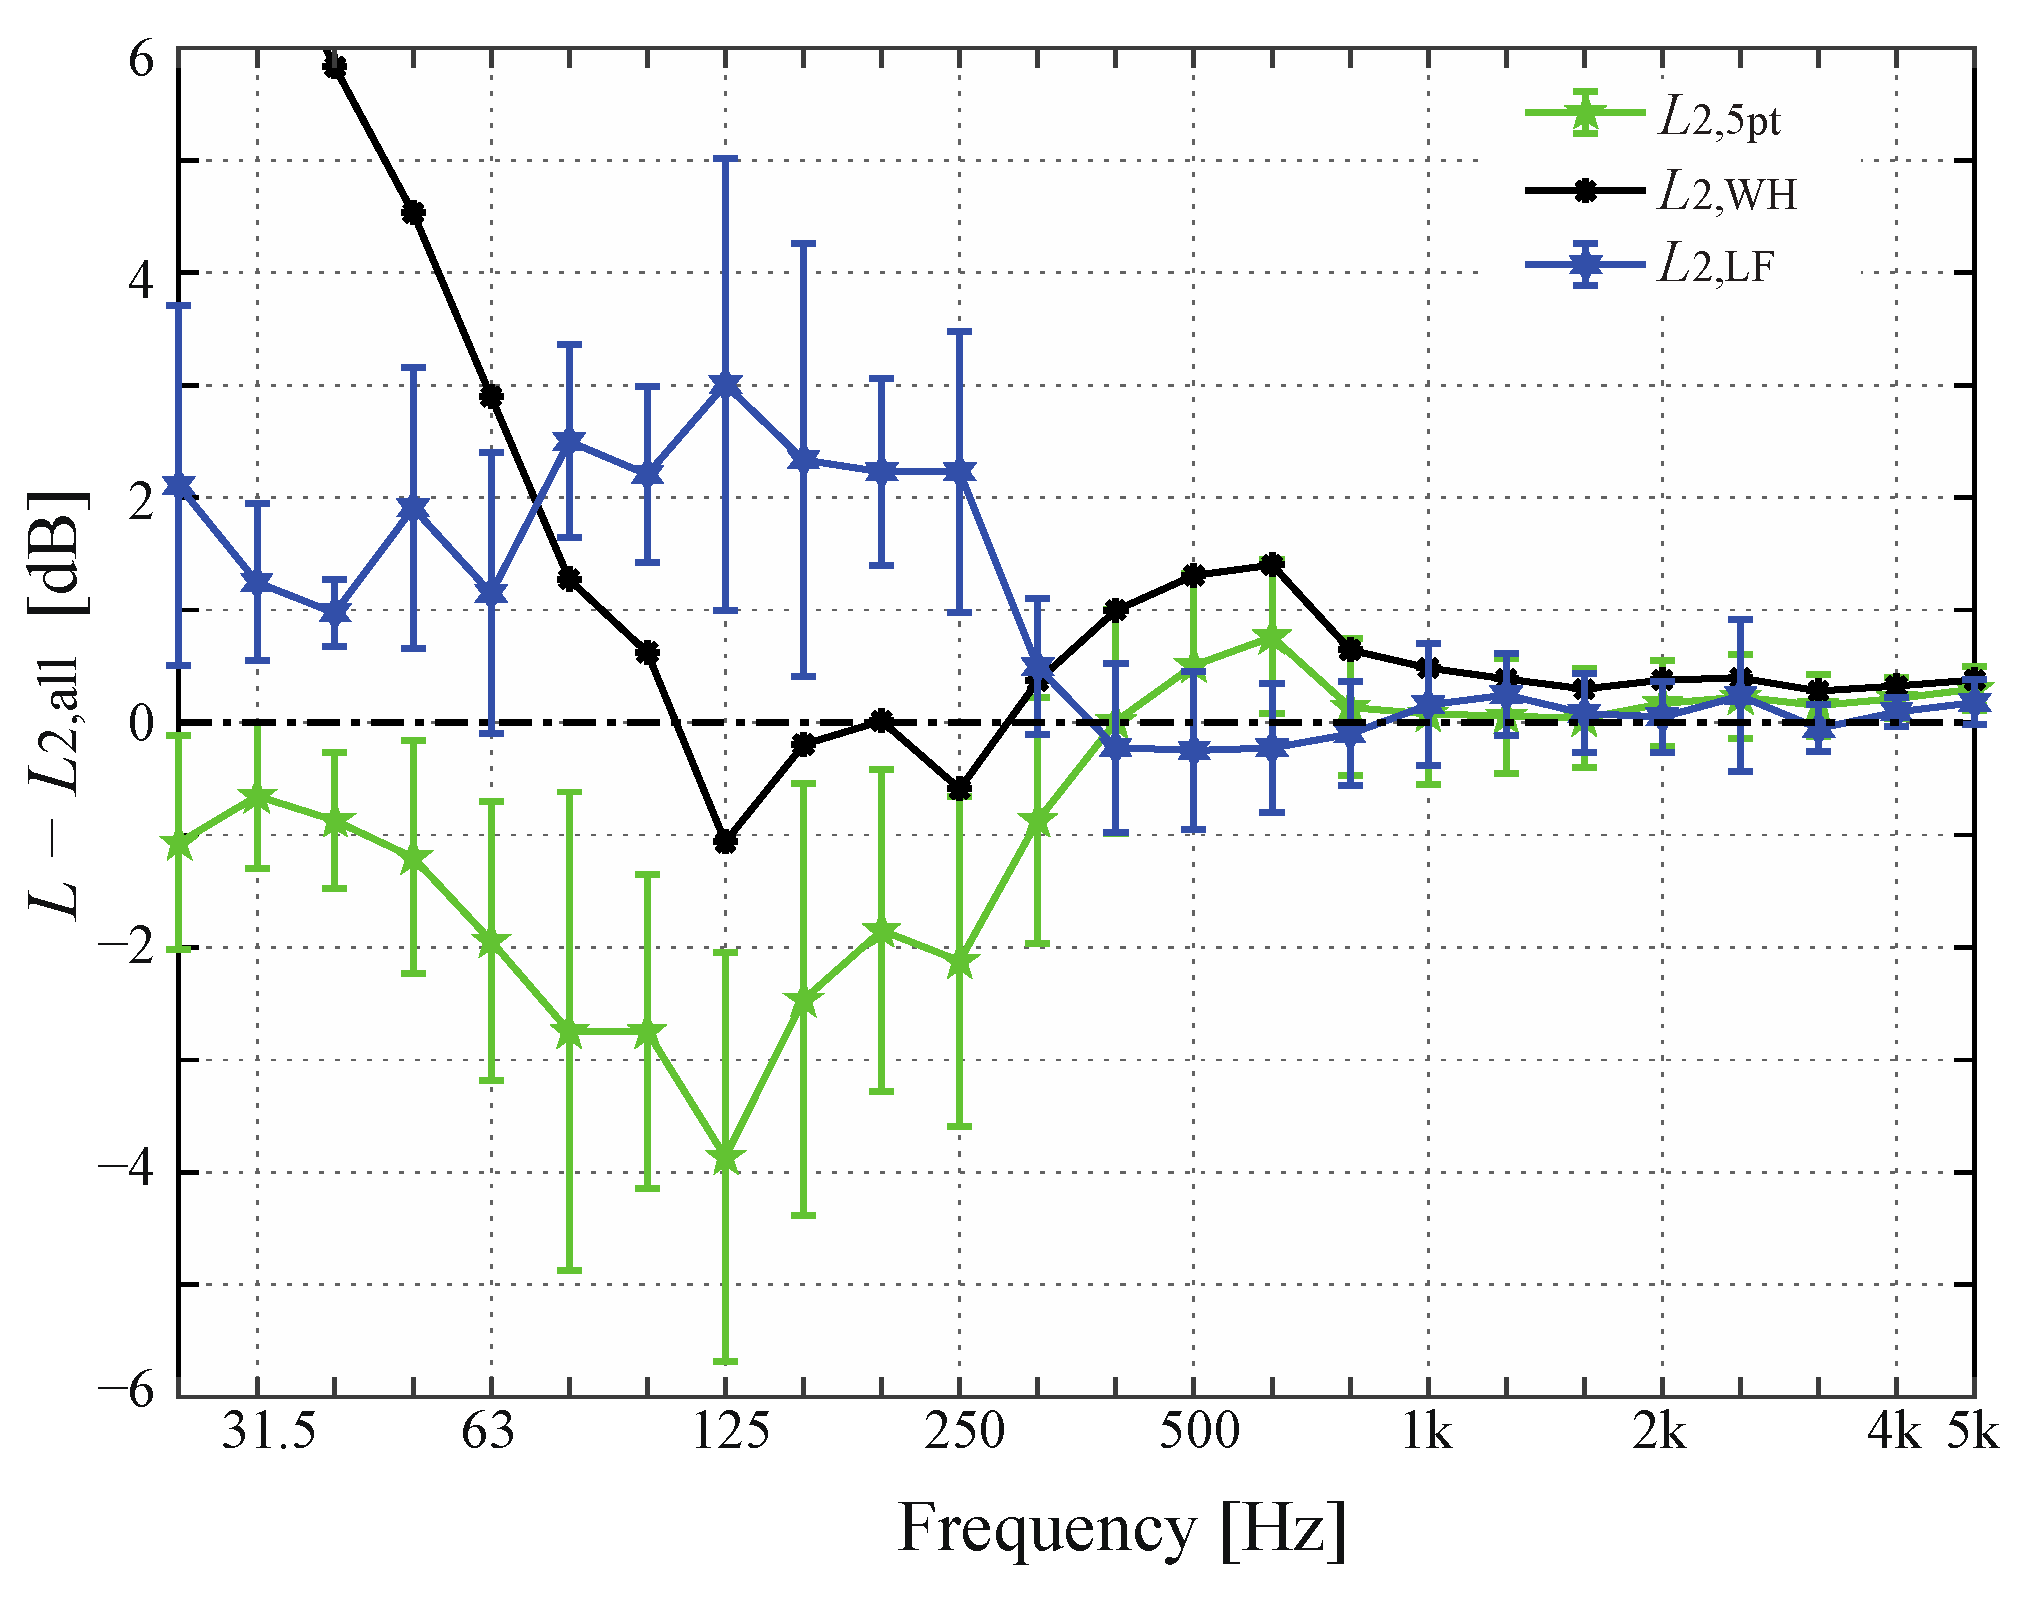
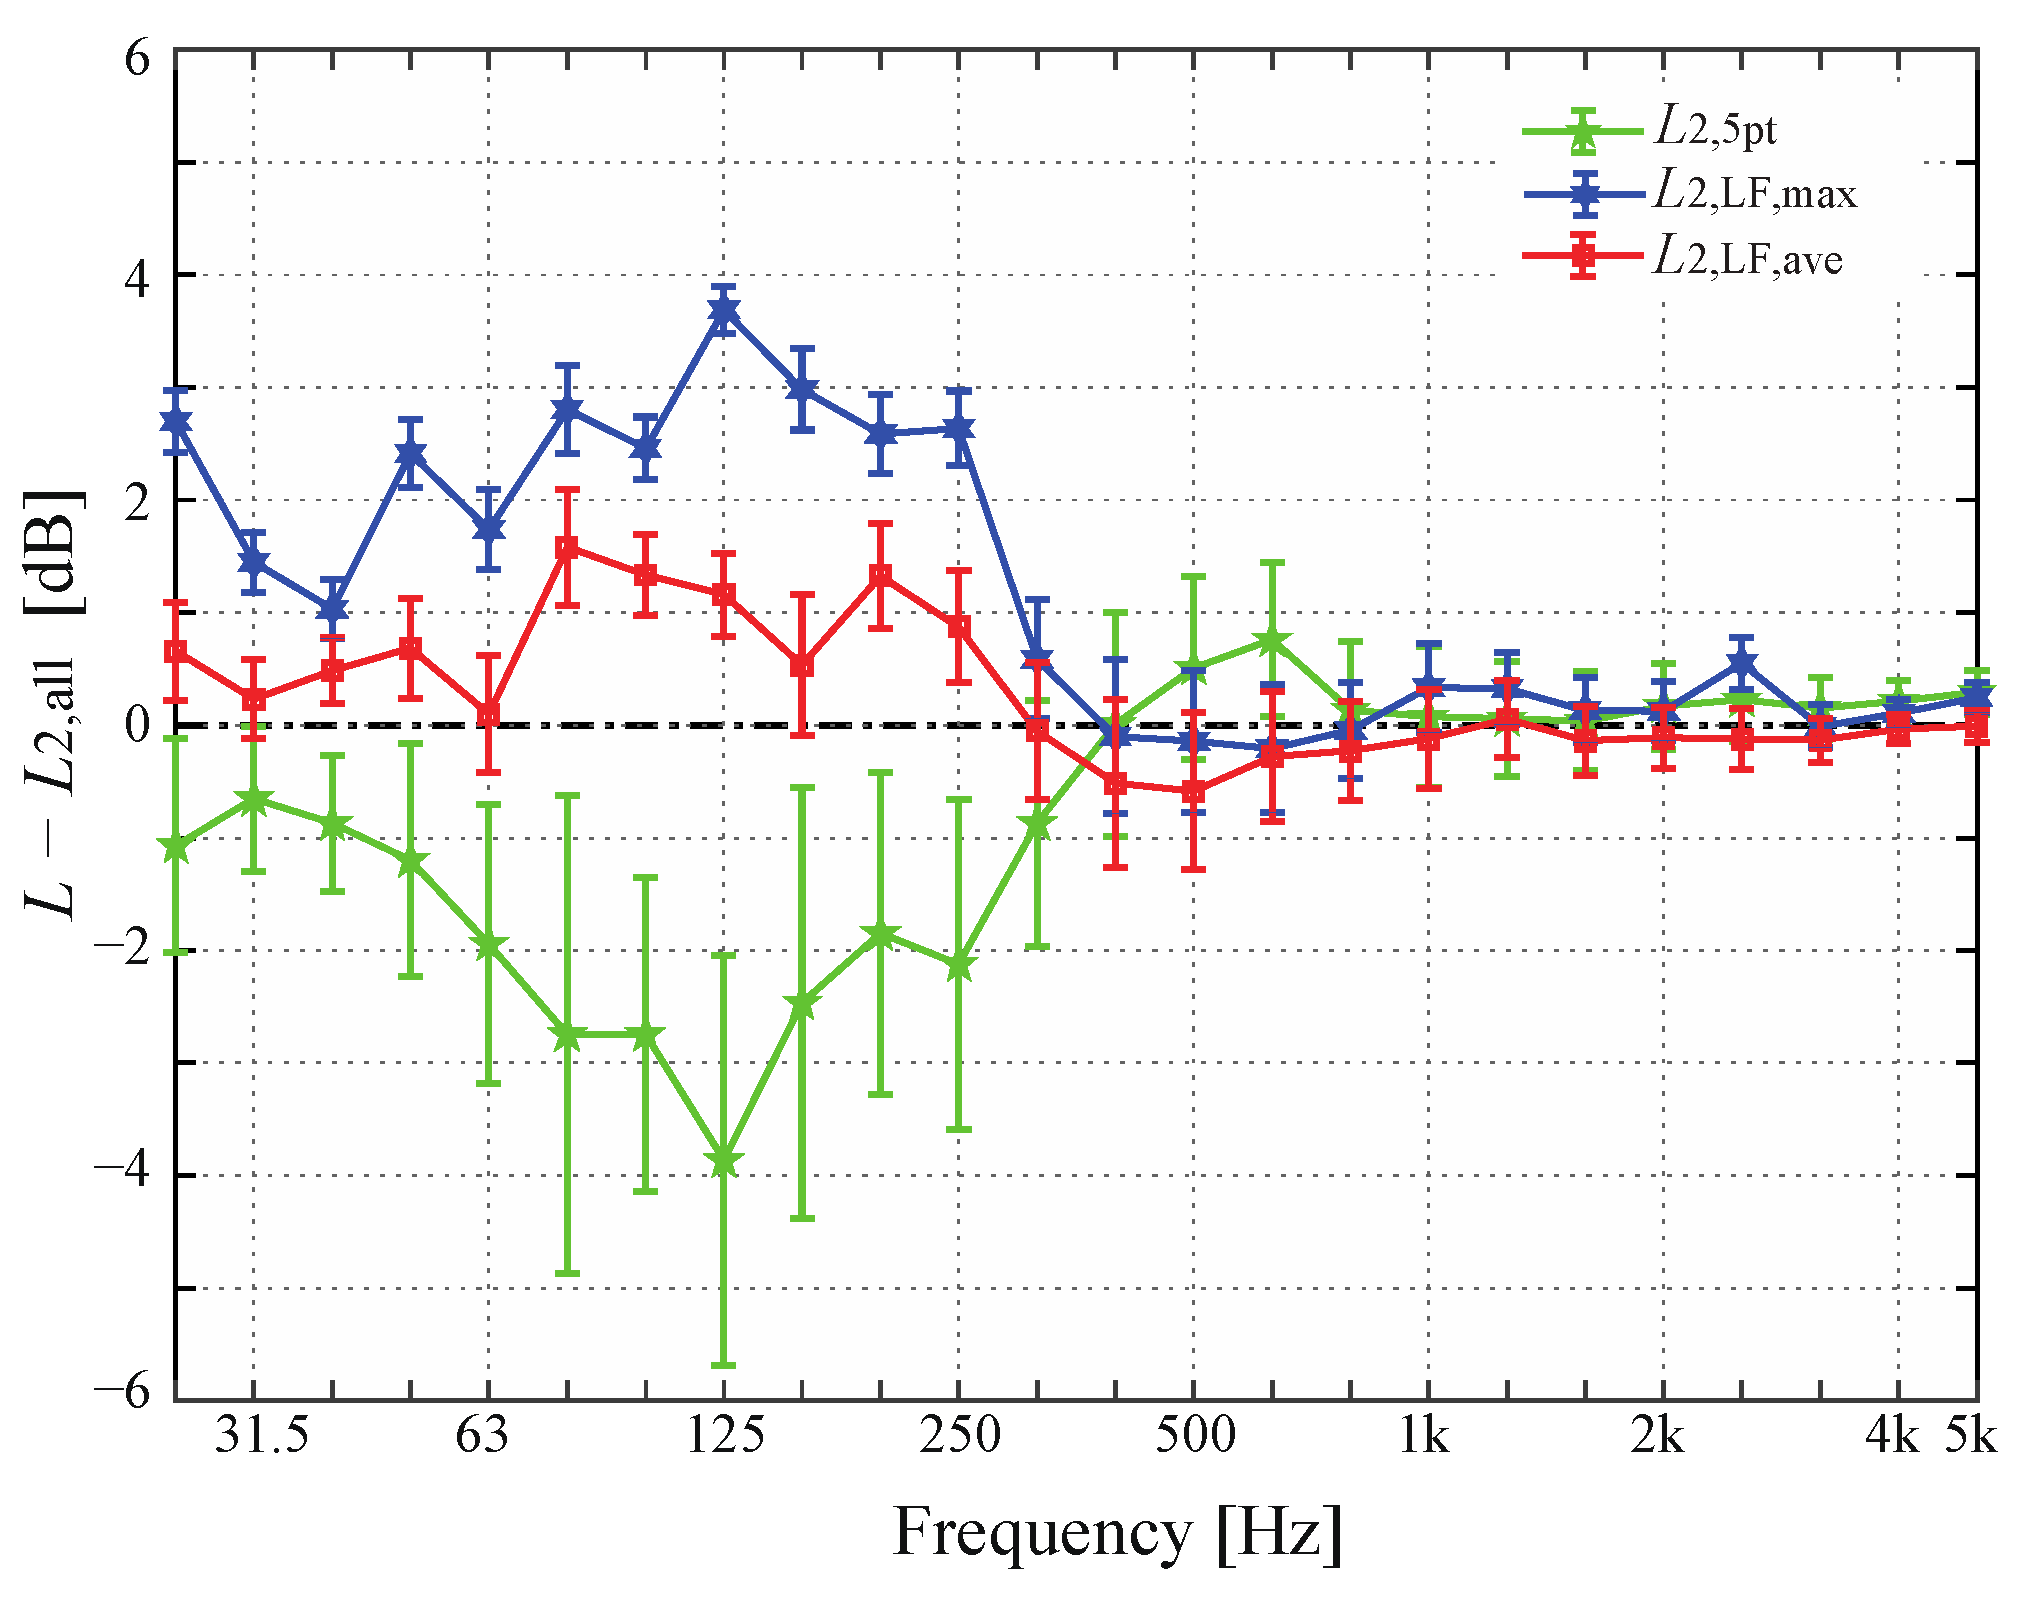
Firstly, in order to evaluate the accuracy of
L2,5pt by the default procedure, all possible sets of
L2,5pt were arithmetically averaged, and the difference from
L2,all is shown in
Figure 8. Above 315 Hz, the systematic error was within 1 dB, which validates the default procedure. On the other hand, below 250 Hz, the systematic error was up to minus 4 dB, and the deviations due to the five-point selection were quite large. The results imply that any correction is necessary to reduce the underestimation of the indoor average level, not only below 100 Hz but also up to 250 Hz.
A well-known theoretical correction for the low frequency range is the Waterhouse correction [
21], which is related with the modal density of a room. In the figure, the corrected results are depicted as
L2,WH. Certainly, the systematic error is well reduced from 100 Hz to 250 Hz, but a significant overestimation occurs below 80 Hz, in which the modal density is quite low or zero. Thus, it is difficult to apply the Waterhouse correction directly for the low-frequency procedure.
The corrected results by the low-frequency procedure in the ISO are also depicted as L2,LF, where it is applied for all frequency bands. The deviations of L2,LF are calculated from all possible combinations of five central positions and four corner positions. The results show that the discrepancies are negligible above 315 Hz, but below 250 Hz, a systematic overestimation of 1 dB to 3 dB occurs, and the deviation due to the microphone position selection is not well suppressed. Although it is a limited case study, the correction of the low-frequency procedure could not be fully validated.
5.2. Correction with the Average Level of Corners
For suppressing the overestimation and the deviation by the ISO procedure, as an alternative correction, the energy-average level over all corner points,
Lcn,ave, was used for the value of
L2,Corner in Equation (1).
Figure 9 shows the results of
L2,LF,max and
L2.LF,ave, corrected from
Lcn,max and
Lcn,ave, respectively. It is observed that
L2,LF,max overestimates the indoor average level by 1 dB to 4 dB below 250 Hz, as well as in
Figure 8. On the other hand,
L2,LF,ave is in better agreement, reducing the overestimation within 2dB. In addition, both corrections do not involve the uncertainty due to corner selection, thus significantly reducing the deviation in the default procedure. In light of the nature that
Lcn,ave reflects the states of all corners, and also is robust if reducing the number of corners for measurement, it is considered more suitable for the correction in the low-frequency procedure.
5.3. Four-Corner Selection for Additional Measurements
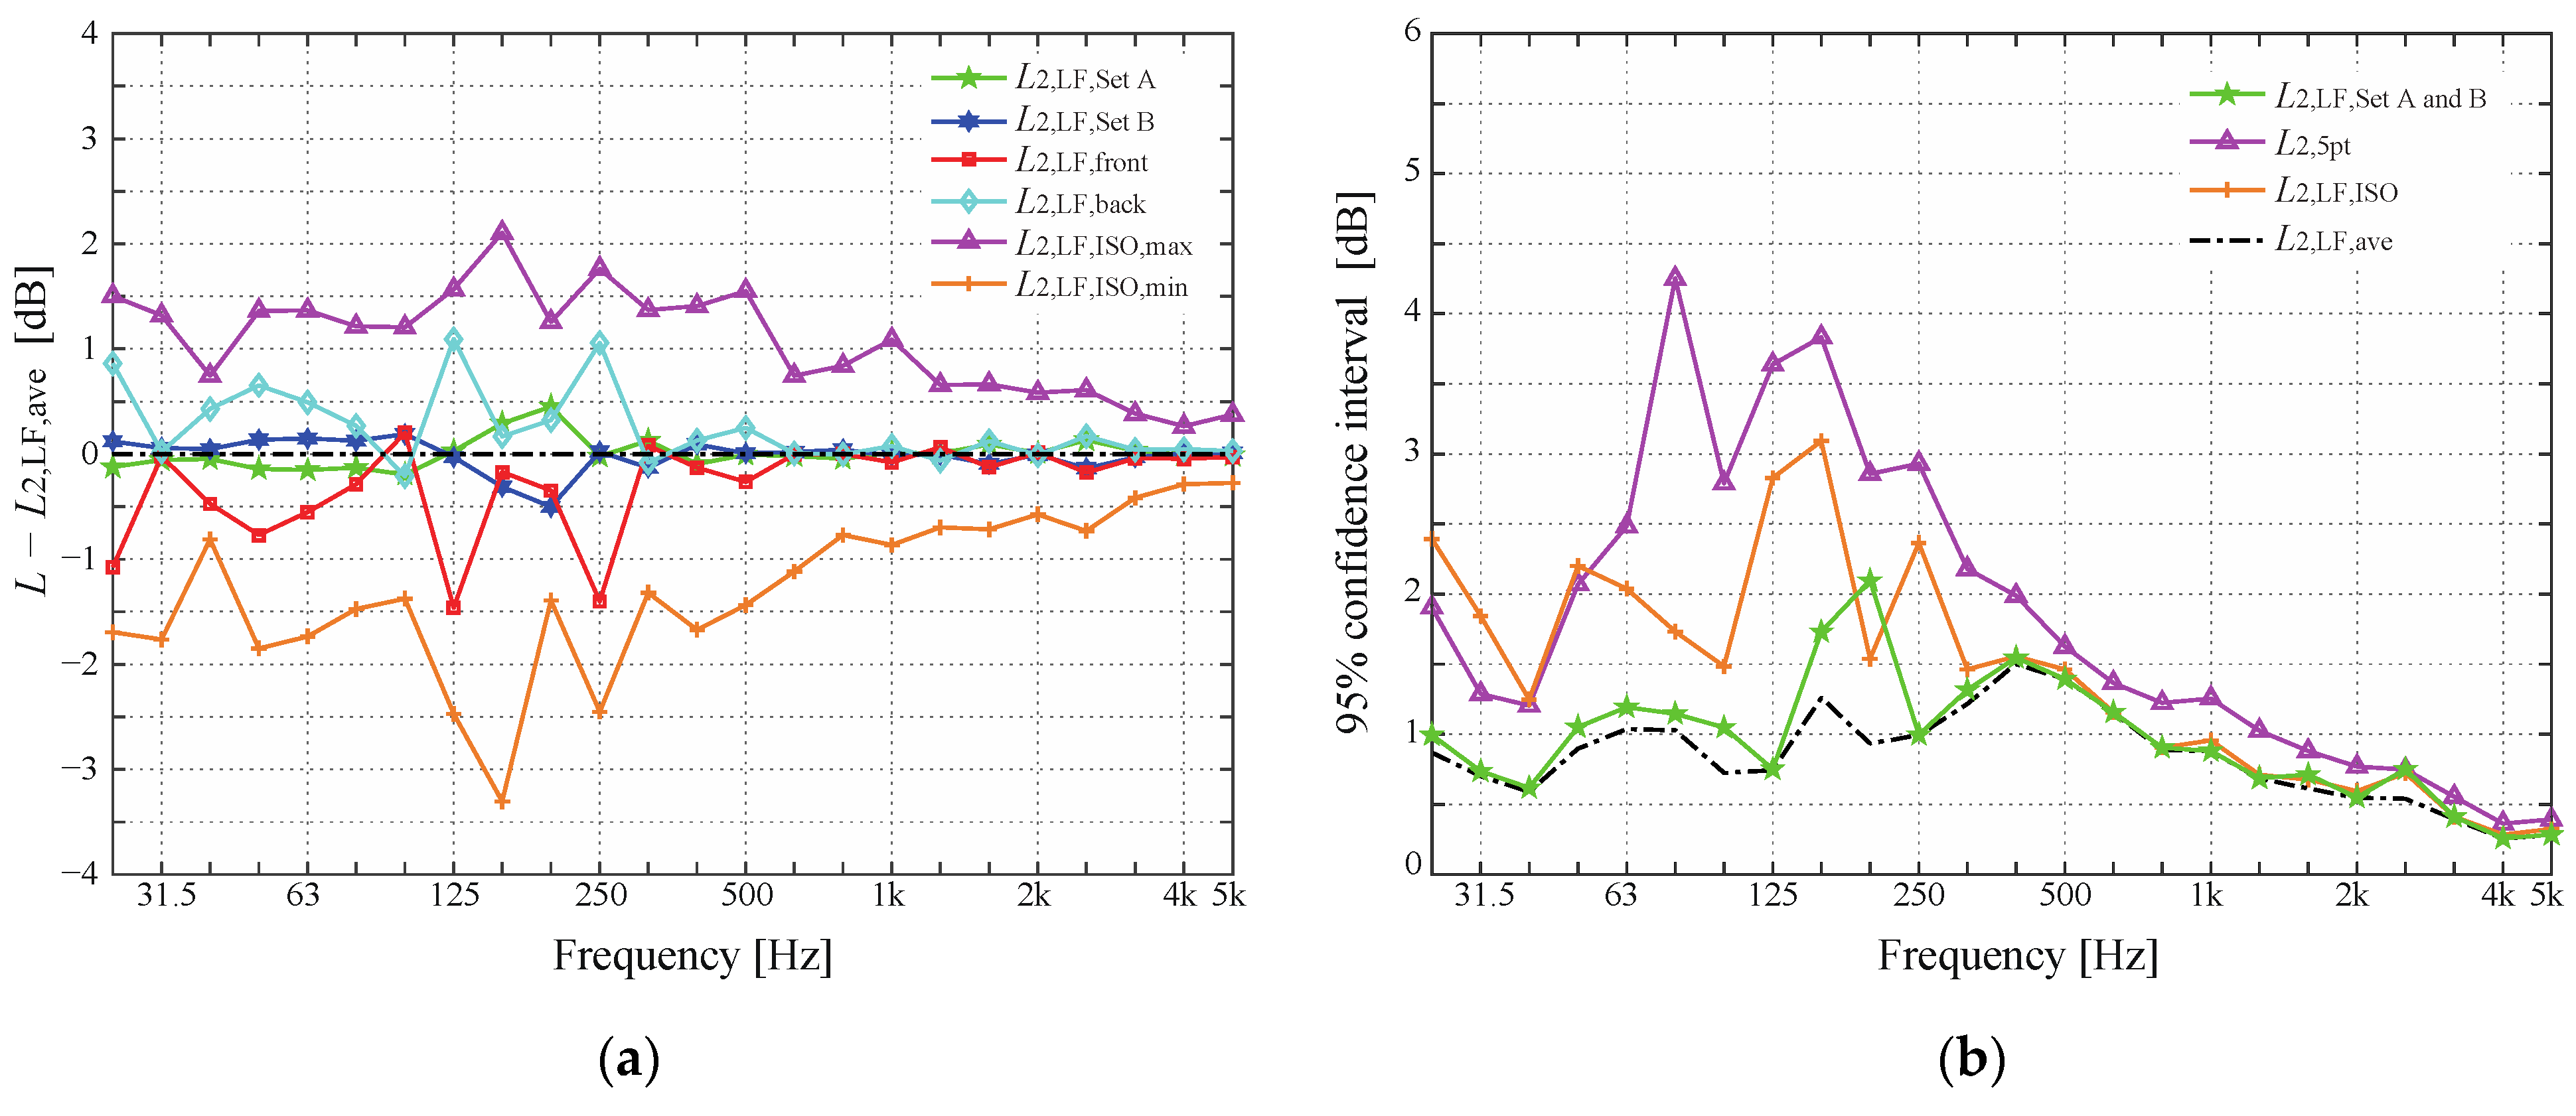
Following the discussion in the previous section, a couple of four-corner selection schemes were tested in the low-frequency procedure using the modified correction with the average level of corners. The tested four-corner selections were two sets of non-adjacent corners (Set A: C2, C4, C5, C7; Set B: C1, C3, C6, C8), two sets of corners on the front wall (C3, C4, C7, C8) and the back wall (C1, C2, C,5, C6), and also all the 36 sets according to the ISO instruction.
Figure 10a shows the differences relative to
L2,LF,ave that was calculated from all eight corners. It is seen that a discrepancy of −3 dB to +2 dB can occur according to the ISO instruction, and the difference between the front and back walls arises up to 2.5 dB. On the other hand, either set of non-adjacent corners yields small discrepancies within 0.5 dB.
Figure 10b shows the deviations caused by the selection of microphone positions for the default and low-frequency procedures. The ISO corner selection leaves a deviation of up to 3 dB, whereas the non-adjacent corner selection suppresses the deviations less than 2 dB, as well as with the correction from all corners. The above results certainly support the effectiveness of the proposed selection scheme for additional measurements.
6. Evaluation of Sound Insulations Performance of Façades
The low-frequency procedure using the above modified correction was applied to evaluate the sound insulation performances of the façades in Cases 1 to 3. As the evaluation indicator, normalized outdoor-to-indoor level difference was calculated according to the definition, Dfree,n = Dfree − 10 log10(A/A0), where Dfree is the difference relative to the free-field level, and A is the equivalent absorption area of the room including air absorption, with the reference absorption area, A0 = 10 m2. In addition to outdoor and indoor sound pressure level measurements, reverberation time measurements were performed in the room. The equivalent absorption areas were estimated by Sabine’s formula, where the speed of sound is given corresponding to the indoor temperature in each case.
6.1. Reverberation Time Measurement
The ISO 16283 series require at least three microphone positions and one source position with two repetitions in the reverberation time measurement. Regarding its measurement uncertainty, Ljunggren et al. [
22] experimentally investigated the spatial variation of the measured values in octave bands in rooms of about 30 m
3, which revealed that the standard deviations were significantly greater than the theoretical estimates by ISO 3382-2 [
23] in the low frequency range. Furthermore, it was suggested that the minimum number of microphone positions should be increased to five for ensuring the uncertainty of the normalized level within 1 dB. In the following measurements,
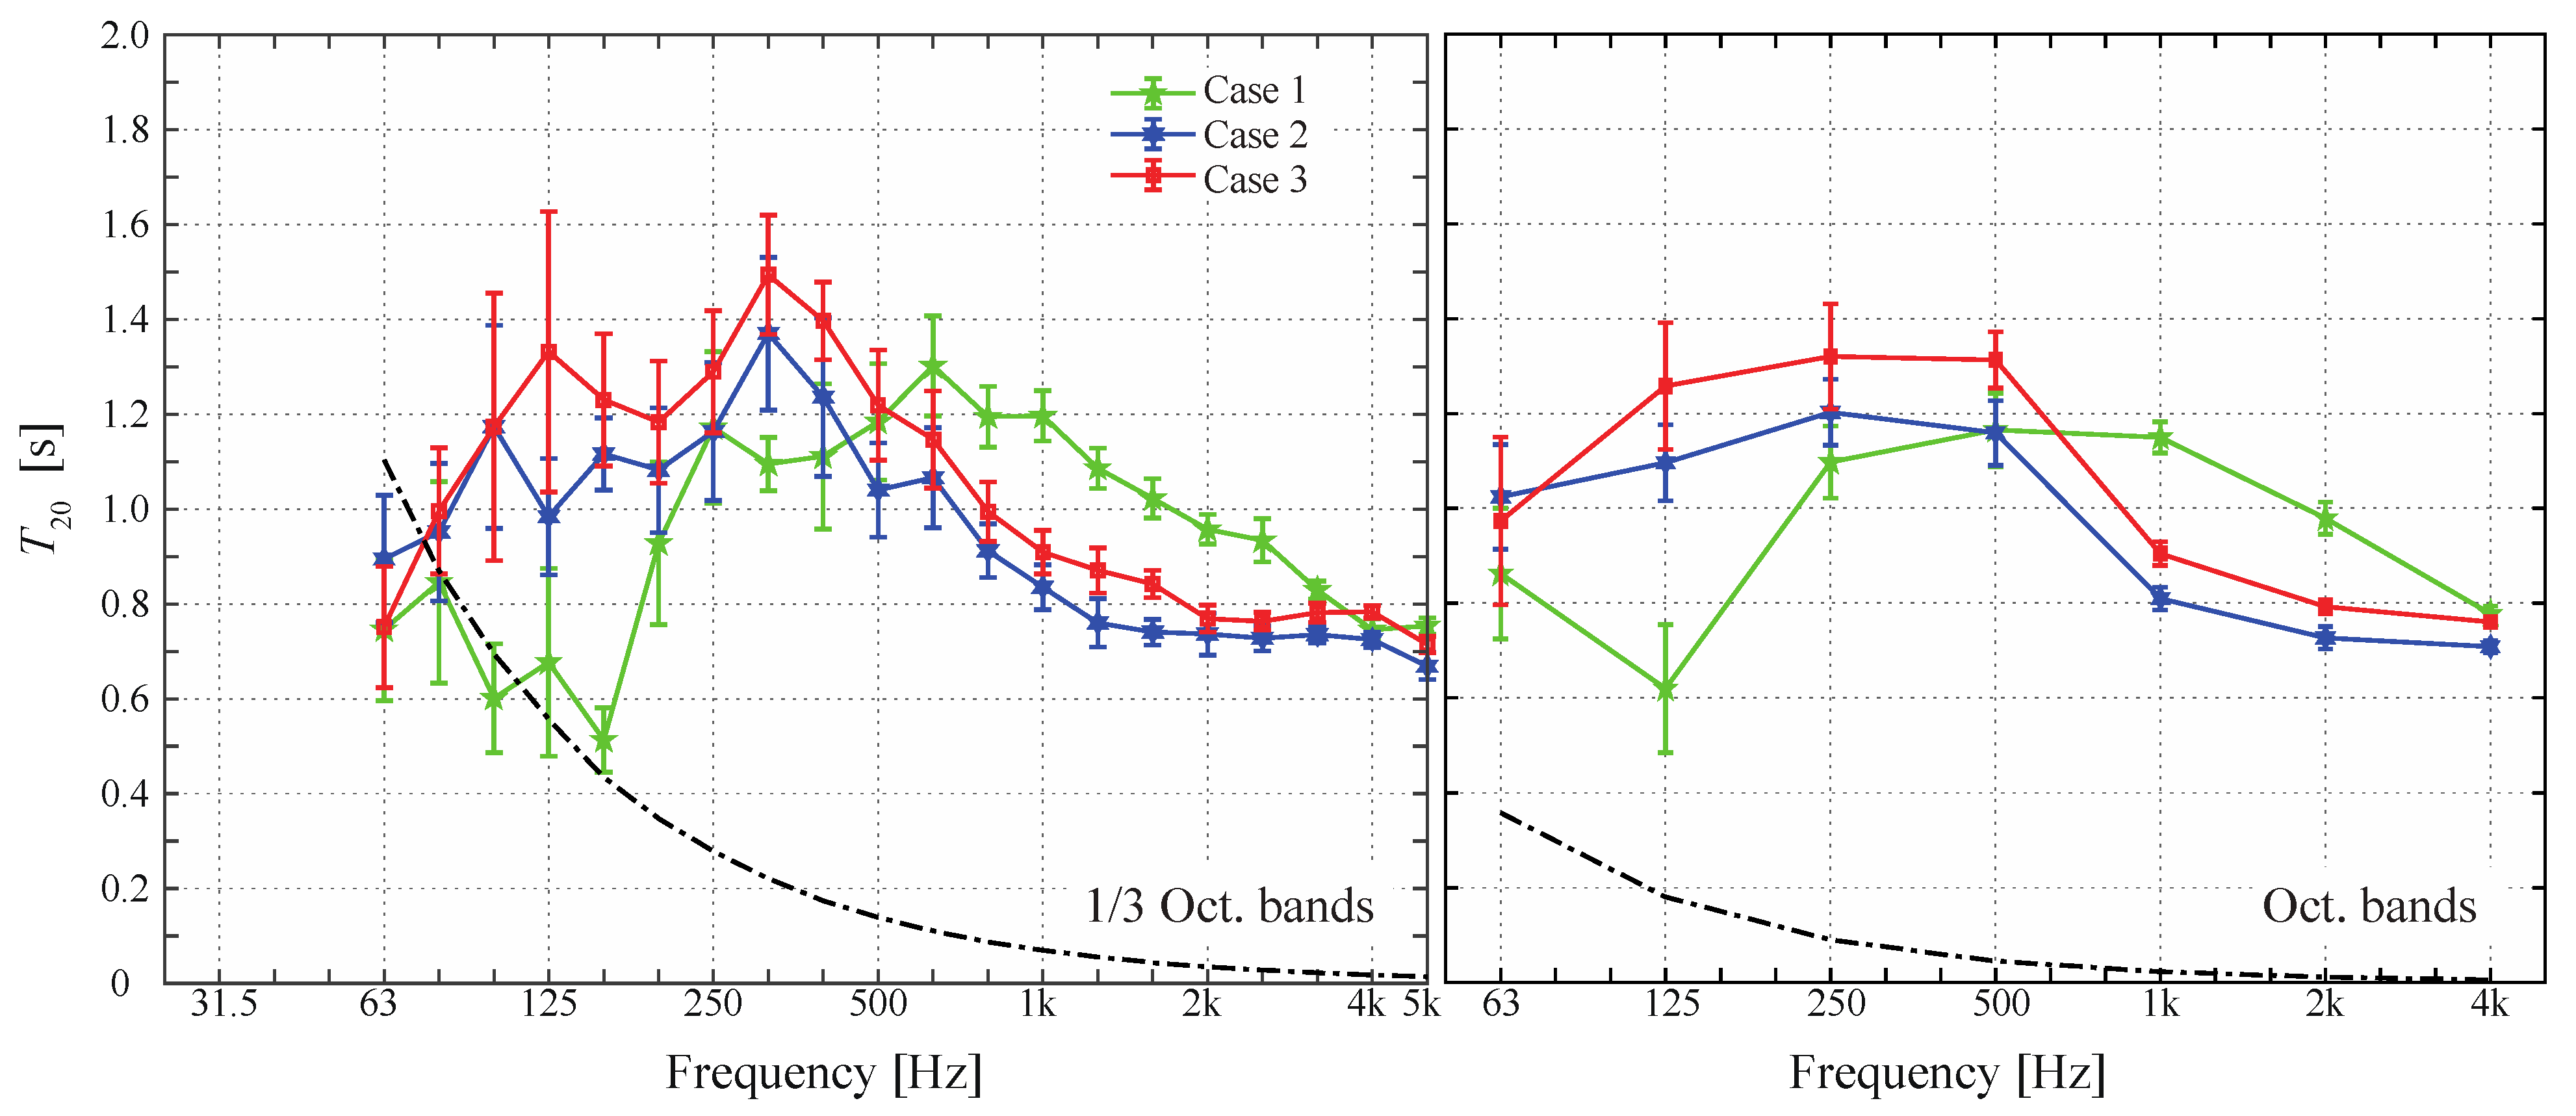
T20 is determined by the interrupted noise method from 63 Hz to 4 kHz bands, setting a loudspeaker at the two corners, C2 and C4 in turn, and four microphone points in the central zone for each source position. For each of the eight systems, measurements were performed five times, thus resulting in 40 measurements in total.
Figure 11 shows the measured values of
T20 in 1/3 and 1/1 octave bands in the three cases. Additionally, the lower limits for reliable measurements are depicted, which is given by
BT > 16 with the filter band width
B [
23]. Regarding the results in 1/3 octave bands below 125 Hz, the variance for measurements is relatively greater, and the reverberation time is comparable to the lower limit. On the other hand, those in 1/1 octave bands are sufficiently reliable. These results support the ISO instruction that reverberation time is to be determined in 1/3 octave band for the default procedure, while in the 63 Hz octave band for the low-frequency procedure.
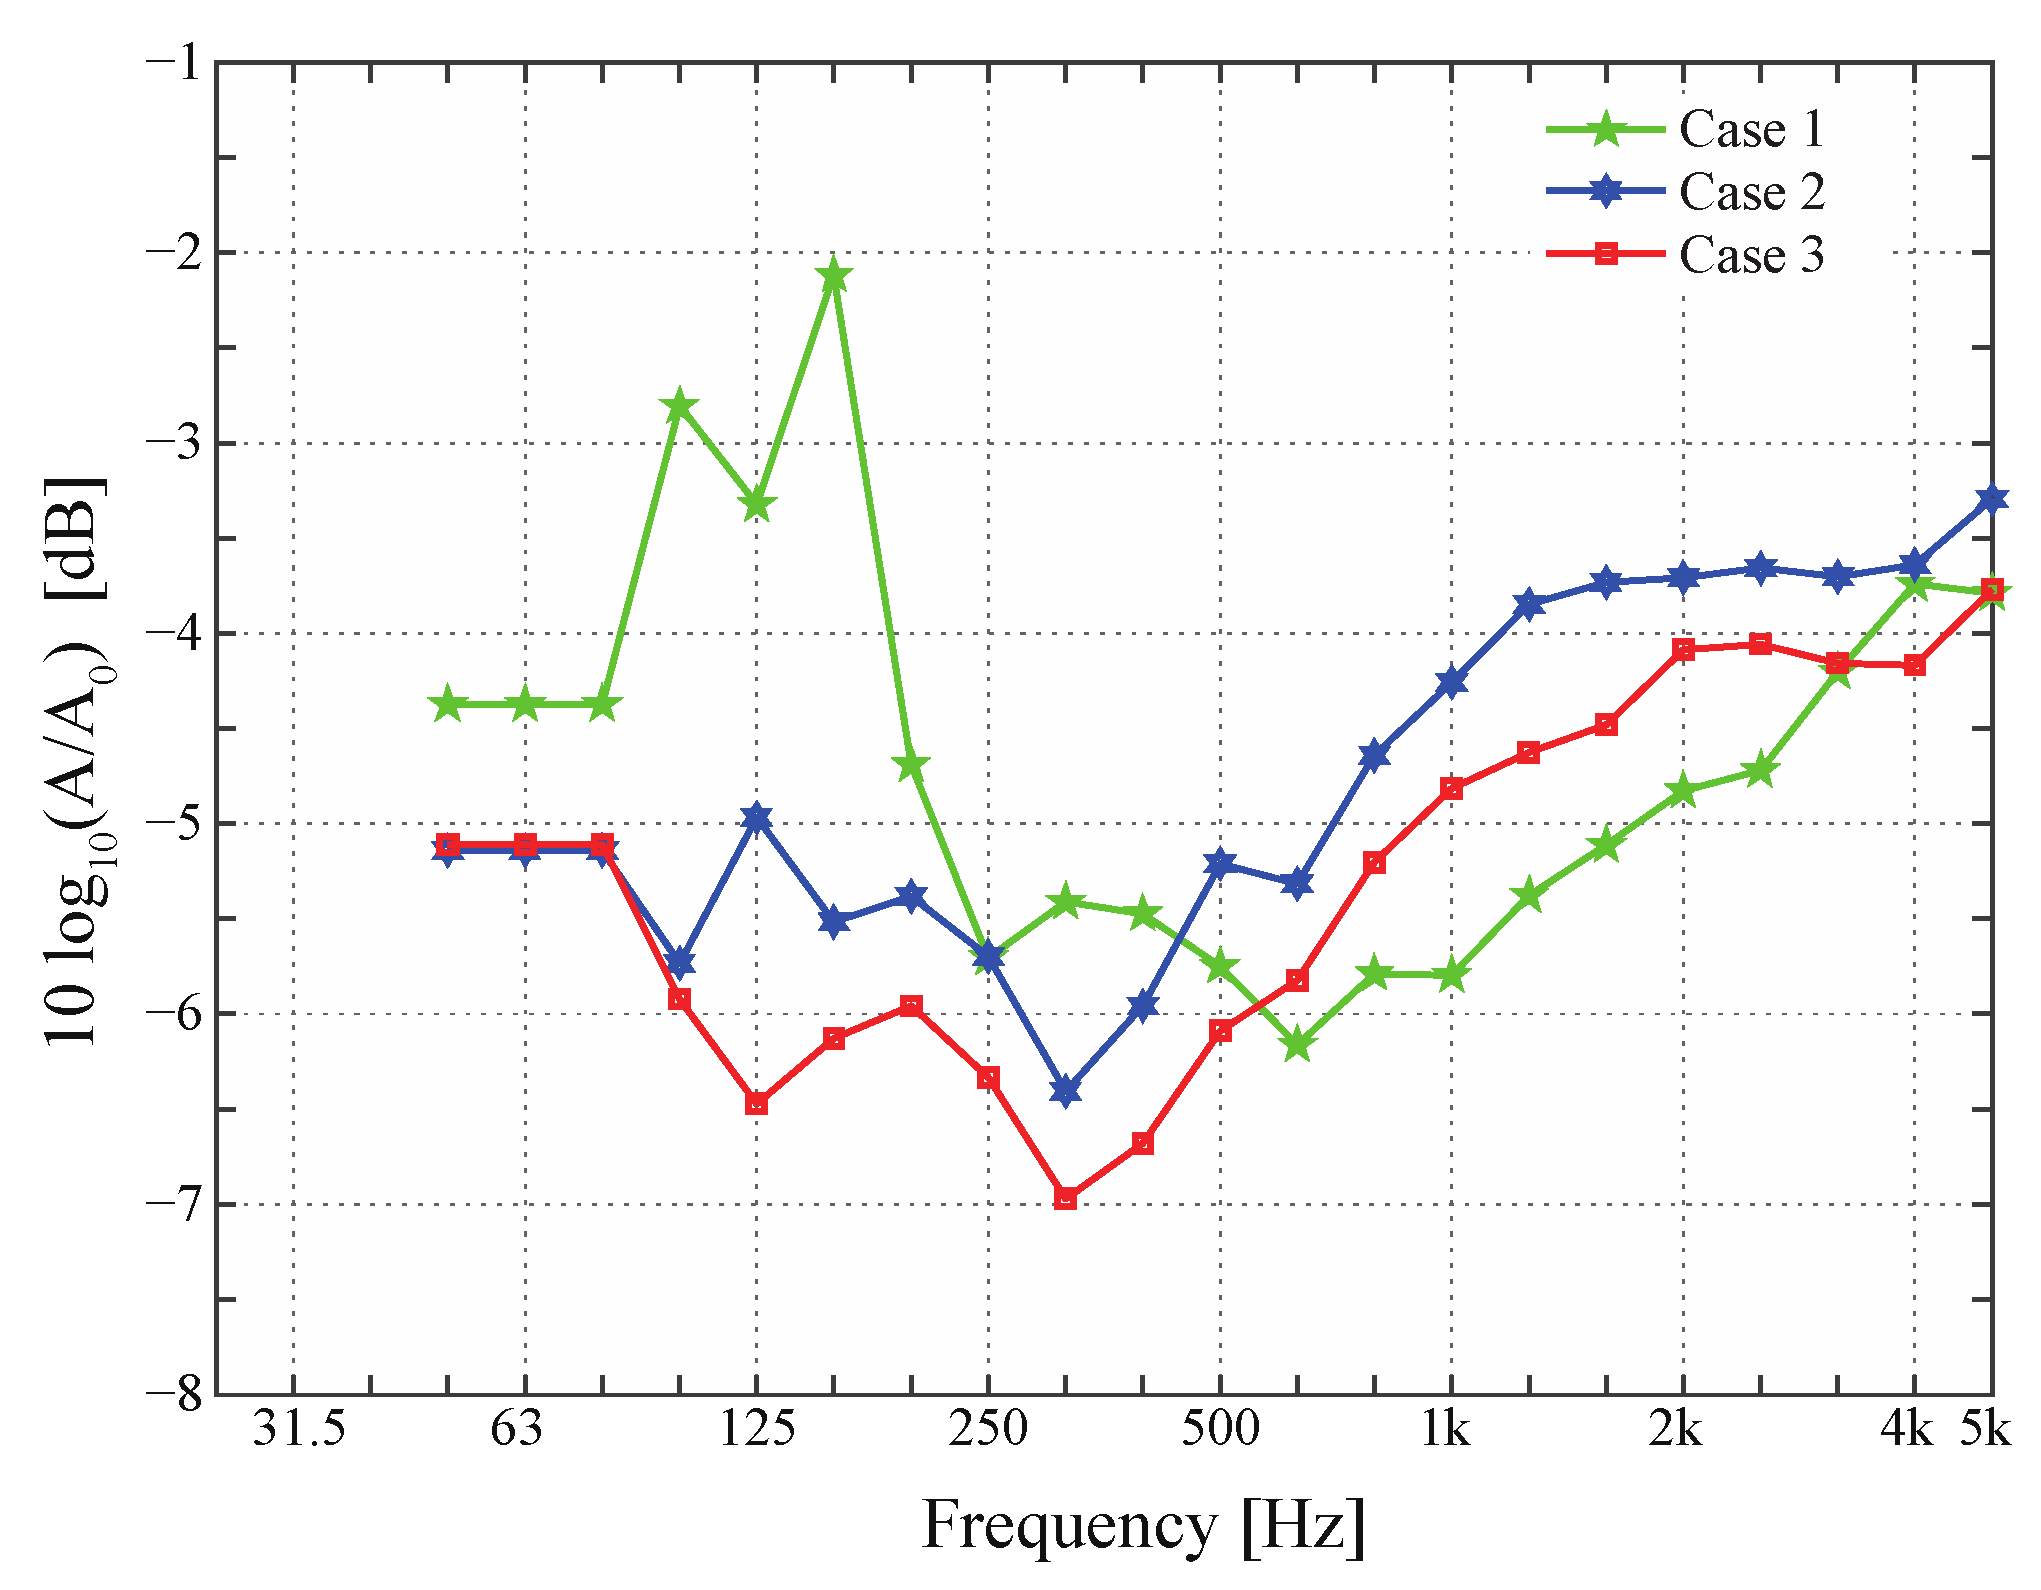
Figure 12 shows the relative levels of equivalent absorption areas that are estimated by Sabine’s formula, where giving the value at the 63 Hz octave band for those from 50 to 80 Hz. Comparing the three cases, the frequency characteristics in Case 1 of the original condition are obviously different from those in Cases 2 and 3 after soundproofing. In Case 1, the single-layer gypsum board for inner walls and ceiling had a certain absorption capability due to plate vibration around 125 Hz. On the other hand, in Cases 2 and 3, the low-frequency absorption was suppressed by putting the two layers of hard gypsum board on existing walls and ceiling. Furthermore, compared with Case 2, the absorption areas in Case 3 were a little reduced by the installation of the double window system.
6.2. Determination of Normalized Outdoor-to-Indoor Level Difference
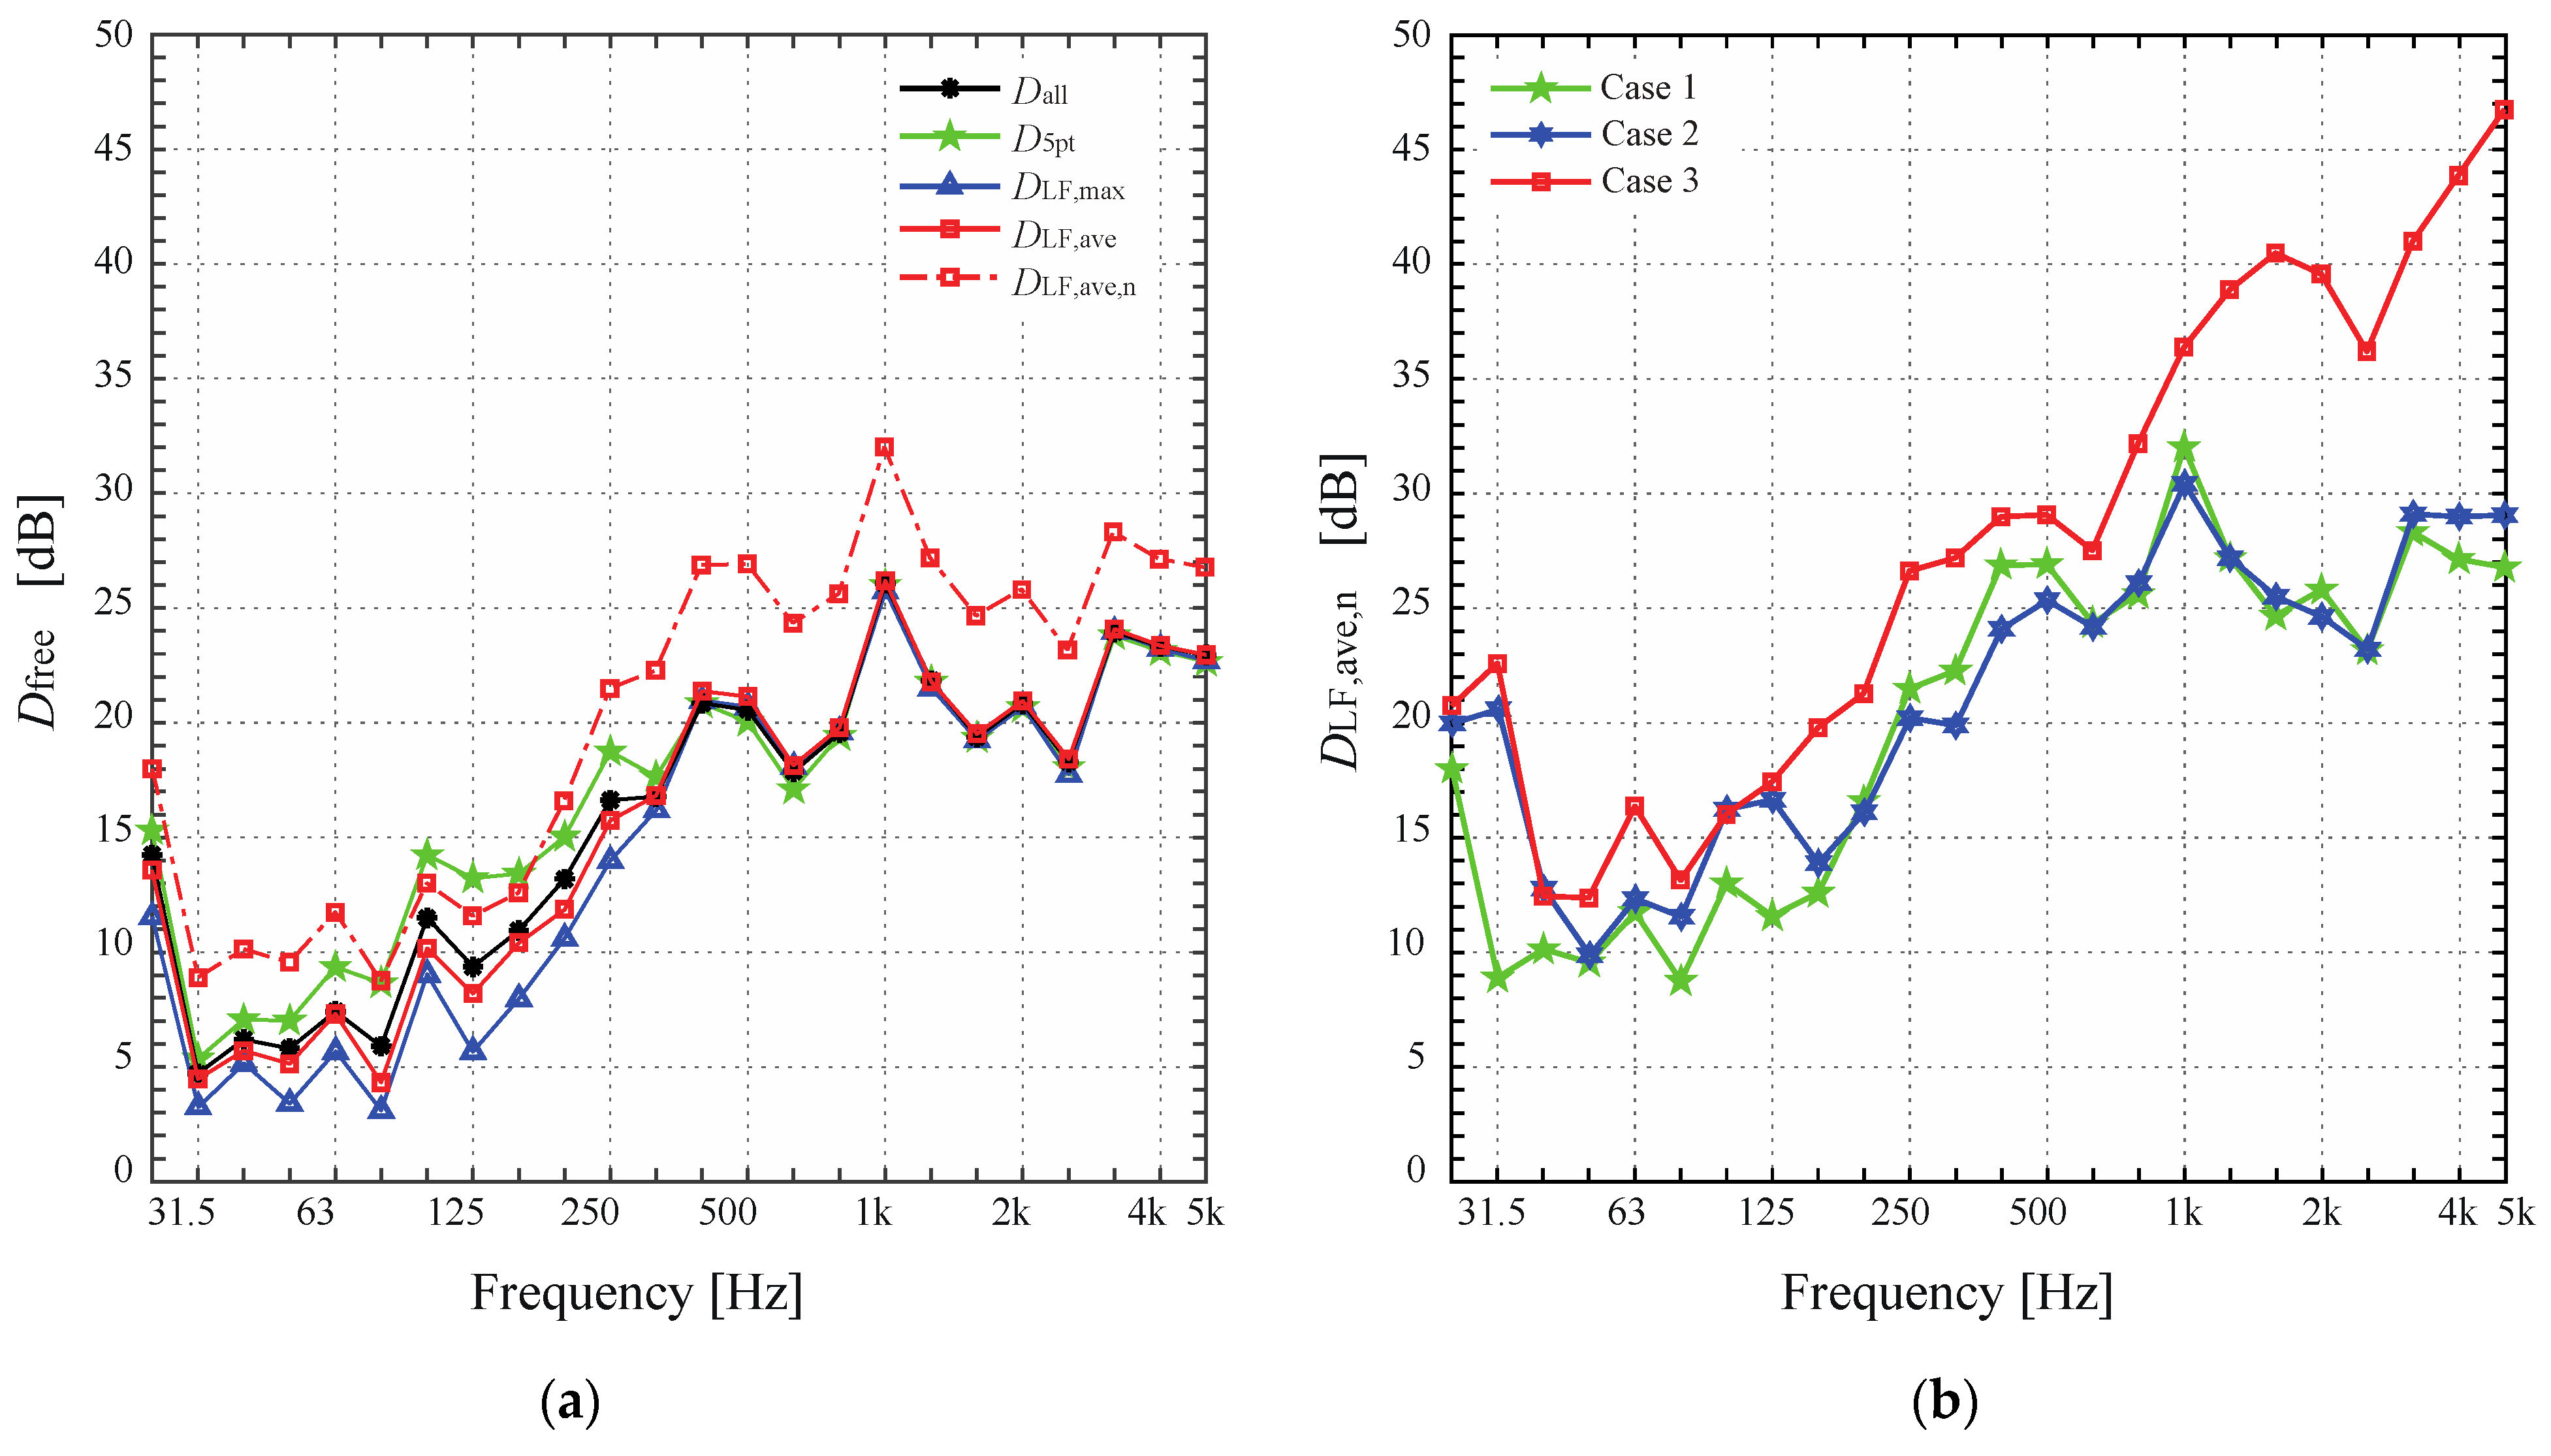
Figure 13a shows the outdoor-to-indoor level differences,
Dfree, calculated with different averaging schemes in Case 1, where
Dall,
D5pt,
DLF,max and
DLF,ave were determined from
L2,all,
L2,5pt,
L2,LF,max and
L2,LF,ave, respectively. As observed in
Figure 9, the deviation of
DLF,ave from
Dall is smaller than
L2,5pt and
L2,LF,max, and within only 1 dB at all frequency bands. In the figure, the normalized level difference,
DLF,ave,n, is also depicted, subtracting the relative levels in
Figure 12, where the value at the 63 Hz octave band is tentatively given below 50 Hz. As a result, the normalized level differences in the low frequency range became only around 10 dB in Case 1 with the original lightweight façade structure.
Figure 13b shows the normalized level differences corrected with the average level of corners in Cases 1 to 3. In Cases 2 and 3 with additional gypsum boards, a remarkable increase is observed around 31.5 Hz, which is certainly due to the increase in the stiffness of the whole house structure. Moreover, in Case 2, a certain increase occurs from 80 to 125 Hz, which may be due to the suppression of inner wall vibration that related to the decrease in the sound absorption area in
Figure 12. On the other hand, Case 3 has a double window system of which mass-air-mass resonance frequency is theoretically estimated to be in the 63 Hz octave band. Nevertheless, the level differences in Case 3 are higher than in Case 2 from 50 Hz to 80 Hz, and the positive effect of the double window system was observed. It is noted that the improvement with the double window system was consistently confirmed above 160 Hz.
7. Conclusions
Field measurements of façade sound insulation were performed in a mock lightweight wooden house, and the low-frequency procedure in ISO 16283-3 was systematically examined from various aspects. Through this experimental study, the following findings were obtained, which suggesting some possible modifications to the low-frequency procedure.
First, as for the measurement of outdoor sound pressure level, it was suggested that one microphone point is sufficient in the free field or on the surface of the façade, but the point 2 m away from the façade, specified for the global method in the ISO, is inappropriate for the low-frequency procedure. Regarding indoor sound pressure level distributions, it was demonstrated that a fairly large deviation occurs among all corners, and the maximum level appears at the corner that is opposite to the outdoor sound source. Furthermore, for the additional measurement around corners in the low-frequency procedure, it was revealed that the lower limit of microphone distance and the avoidance of identical distance are not necessary, and the upper limit should be preferably shortened.
Second, as for the calculation of indoor energy-average level, it was demonstrated that, below 250 Hz, the default procedure yields systematic underestimation up to minus 4 dB and large deviations due to the five-point selection in the central zone. According to the low-frequency procedure in the ISO, the underestimation was compensated by the correction with the maximum level among four corners, but which yielded a little overestimation, and the deviation accompanied by the microphone position selection was still not well suppressed. Therefore, alternative ways of correction were tested, and it was found that the energy-average level over four non-adjacent corners is more appropriate for the correction in the low-frequency procedure.
Third, the normalized level differences of three façade conditions, without and with two soundproofing measures, were determined. In reverberation time measurements, the variation in measured values supported the ISO instruction that the reverberation time is to be determined in 1/3 octave bands above 100 Hz for the default procedure, while in the 63 Hz octave band for the low-frequency procedure. Moreover, the results of the normalized level differences clarified the effects of the weight increase in walls/ceiling and the double window system in the low frequency range.
In summary, the following three modifications are recommended for the low-frequency procedure in ISO 16283-3, which are specifically in the indoor sound pressure level measurements.
- (1)
Microphone positions:
A fixed microphone shall be positioned in room corners at a distance of less than 0.3 m from each room boundary that forms the corner. The distance from each boundary can or cannot be identical.
Two corners should be at ground level and two corners should be at ceiling level, all of which are not adjacent to each other.
- (2)
Calculation of low-frequency energy-average sound pressure levels:
Future studies on the above modifications will be devoted to extending the experimental examination to other various cases: different dimensions of room, different structures of house, and indoor conditions with sound absorption. On the other hand, the correction to indoor average sound pressure level was empirically determined, thus it is preferable to establish the theoretical foundation.
Author Contributions
Conceptualization, J.L. and T.S.; methodology, J.L. and T.S.; software, N.I.; formal analysis, J.L.; investigation, J.L.; data curation, J.L.; writing—original draft preparation, J.L.; writing—review and editing, T.S.; supervision, T.S.; project administration, T.S.; funding acquisition, N.I. and T.S. All authors have read and agreed to the published version of the manuscript.
Funding
This research was funded by the Grant-in-Aid for Scientific Research from Japan Society for the Promotion of Science, No. 17H03350.
Institutional Review Board Statement
Not applicable.
Informed Consent Statement
Not applicable.
Data Availability Statement
The data presented in this study are available on request from the corresponding author.
Conflicts of Interest
The authors declare no conflict of interest.
References
- Ochiai, H. The state of the art of the infra and low frequency noise problem in Japan. In Proceedings of the 2001 International Congress and Exhibition on Noise Control Engineering, Inter–Noise 2001, The Hargue, The Netherlands, 27–30 August 2001; pp. 1495–1498. [Google Scholar]
- Kamigawara, K.; Tokita, Y.; Yamada, S.; Ochiai, H. Community responses to low frequency noise and administrative actions in Japan. In Proceedings of the 32nd International Congress and Exposition on Noise Control Engineering, Inter–Noise 2003, Jeju, Korea, 25–28 August 2003; pp. 1221–1226. [Google Scholar]
- Ministry of the Environment, Government of Japan. Handbook to Deal with Low Frequency Noise; Ministry of the Environment, Government of Japan: Tokyo, Japan, 2004. Available online: https://www.env.go.jp/air/teishuha/tebiki/ (accessed on 13 November 2021). (In Japanese)
- Doi, T.; Iwanaga, K.; Naka, Y. Experimental approach on transmission of low-frequency sound into a building. In Proceedings of the 43rd International Congress and Exposition on Noise Control Engineering, Inter–Noise 2014, Melbourne, Australia, 16–19 November 2014. [Google Scholar]
- Maluski, S.P.S.; Gibbs, B.M. Application of a finite-element model to low-frequency sound insulation in dwellings. J. Acoust. Soc. Am. 2000, 108, 1741–1751. [Google Scholar] [CrossRef] [PubMed]
- Gibbs, B.M.; Maluski, S. Airborne sound level difference between dwellings at low frequencies. Build Acoust. 2004, 11, 61–78. [Google Scholar] [CrossRef]
- Sakuma, T.; Inoue, N.; Kami, K. Numerical simulation and scale model experiment of low-frequency noise transmission into house. In Proceedings of the 46th International Congress and Exposition on Noise Control Engineering, Inter–Noise 2017, Hong Kong, China, 27–30 August 2017; pp. 413–420. [Google Scholar]
- Pedersen, D.B.; Roland, J.; Raabe, G.; Maysenhölder, W. Measurement of the low-frequency sound insulation of building components. Acustica 2000, 86, 495–505. [Google Scholar]
- Moorhouse, A.; Ramadorai, R. Measurement of the average sound pressure level in a room at low frequency. In Proceedings of the 13th International Congress on Sound and Vibration 2006, ICSV 13, Vienna, Austria, 2–6 July 2006. [Google Scholar]
- ISO. 16283-1:2014. Acoustic–Field Measurement of Sound Insulation in Buildings and of Building Elements, Part 1: Airborne Sound Insulation; ISO: Geneva, Switzerland, 2014. [Google Scholar]
- ISO. 16283-3:2016. Acoustic–Field Measurement of Sound Insulation in Buildings and of Building Elements, Part 3: Façade Sound Insulation; ISO: Geneva, Switzerland, 2016. [Google Scholar]
- Hopkins, C.; Turner, P. Field measurement of airborne sound insulation between rooms with non-diffuse sound fields at low frequencies. Appl. Acoust. 2005, 66, 1339–1382. [Google Scholar] [CrossRef]
- Simmons, C. Measurement of Sound Pressure Levels at Low Frequencies in Rooms. Comparison of Available Methods and Standards with Respect to Microphone Positions. Proposal for New Procedures. Nordtest Project No. 1347–97. Available online: http://www.nordtest.info/wp/1997/12/17/measurement-of-sound-pressure-levels-at-low-frequencies-in-rooms-nt-tr-385/ (accessed on 13 November 2021).
- Simmons, C. Measurement of sound pressure levels at low frequencies in rooms. Comparison of available methods and standards with respect to microphone positions. Acta Acustica 1999, 85, 88–100. [Google Scholar]
- Guigou-Carter, C.; Bailhache, S.; Villot, M. Sound level difference at low-frequencies—Comparison of different measurement methods and predicted performance. In Proceedings of the 7th Forum Acusticum, Krakow, Poland, 7–12 September 2014. [Google Scholar]
- Liu, J.; Sakuma, T. Experimental study on the low-frequency measurement of average sound pressure level in room. In Proceedings of the Acoustical Society Japan Spring Meeting, Tokyo, Japan, 5–7 March 2019; pp. 683–684. [Google Scholar]
- Hopkins, C. Revision of international standards on field measurements of airborne, impact and façade sound insulation to form the ISO 16283 series. Build. Environ. 2015, 92, 703–712. [Google Scholar] [CrossRef]
- Berardi, U.; Cirillo, E.; Martellotta, F. Interference effects in field measurements of airborne sound insulation of building facades. Noise Control Eng. J. 2011, 59, 165–176. [Google Scholar] [CrossRef]
- Berardi, U. The position of the instruments for the sound insulation measurement of building façades: From ISO 140-5 to ISO 16283-3. Noise Control Eng. J. 2013, 61, 70–80. [Google Scholar] [CrossRef]
- Schoenwald, S.; Zemp, A.; Pedersoli, S. Applicability of measurement method according to ISO 16283 in small rooms at low frequencies. In Proceedings of the 45th International Congress and Exposition on Noise Control Engineering, Inter–Noise 2016, Hamburg, Germany, 21–24 August 2016. [Google Scholar]
- Waterhouse, R.V. Interference patterns in reverberant sound fields. J. Acoust. Soc. Am. 1955, 27, 247–58. [Google Scholar] [CrossRef]
- Ljunggren, F.; Oqvist, R.; Simmons, C. Uncertainty of in situ low frequency reverberation time measurements from 20 Hz—An empirical study. Noise Control Eng. J. 2016, 64, 706–715. [Google Scholar] [CrossRef]
- ISO. 3382-2:2008. Acoustic–Measurement of Room Acoustic Parameters, Part 2: Reverberation Time in Ordinary Rooms; ISO: Geneva, Switzerland, 2008. [Google Scholar]
Figure 1.
Mock wooden house: (a) plan; (b) section; (c) exterior view; (d) interior view.
Figure 1.
Mock wooden house: (a) plan; (b) section; (c) exterior view; (d) interior view.
Figure 2.
Arrangement of microphones inside the room: (a) plan; (b) section; (c) microphone stand.
Figure 2.
Arrangement of microphones inside the room: (a) plan; (b) section; (c) microphone stand.
Figure 3.
Arrangement of microphones and loudspeakers: (a) outside the room; (b) in the free field.
Figure 3.
Arrangement of microphones and loudspeakers: (a) outside the room; (b) in the free field.
Figure 4.
Outdoor sound pressure levels relative to Lfree,all: (a) on the middle vertical line in the free field; (b) on and in front of window for the global and element methods.
Figure 4.
Outdoor sound pressure levels relative to Lfree,all: (a) on the middle vertical line in the free field; (b) on and in front of window for the global and element methods.
Figure 5.
Distributions of indoor sound pressure level in the horizonal plane of z = 1.125 m, relative to L2,all, in 1/3 octave bands from 25 Hz to 80 Hz.
Figure 5.
Distributions of indoor sound pressure level in the horizonal plane of z = 1.125 m, relative to L2,all, in 1/3 octave bands from 25 Hz to 80 Hz.
Figure 6.
Average sound pressure levels of the center zone, peripheral zone, the eight corners in the room, and the maximum/minimum levels in the eight corners, relative to L2,all. Light blue/purple numbers represent the corresponding corners for maximum/minimum levels, respectively.
Figure 6.
Average sound pressure levels of the center zone, peripheral zone, the eight corners in the room, and the maximum/minimum levels in the eight corners, relative to L2,all. Light blue/purple numbers represent the corresponding corners for maximum/minimum levels, respectively.
Figure 7.
Change in sound pressure level with varying the distance from the corner, relative to the level at the nearest point (Lcn,2cm), around C4 and C2.
Figure 7.
Change in sound pressure level with varying the distance from the corner, relative to the level at the nearest point (Lcn,2cm), around C4 and C2.
Figure 8.
Indoor average sound pressure levels calculated by the ISO and the Waterhouse correction. Bars represent 95 % confidence intervals caused by the selections of microphone positions for the default and low-frequency procedures.
Figure 8.
Indoor average sound pressure levels calculated by the ISO and the Waterhouse correction. Bars represent 95 % confidence intervals caused by the selections of microphone positions for the default and low-frequency procedures.
Figure 9.
Indoor average sound pressure levels corrected with the maximum or average level of the eight corners. Bars represent 95% confidence intervals caused by the selection of microphone positions for the default procedure.
Figure 9.
Indoor average sound pressure levels corrected with the maximum or average level of the eight corners. Bars represent 95% confidence intervals caused by the selection of microphone positions for the default procedure.
Figure 10.
Indoor sound pressure levels corrected with the average level of corners, with different four-corner selection schemes: (a) deviation from the level corrected from all corners; (b) 95% confidence intervals caused by the selection of microphone positions for the default and low-frequency procedures.
Figure 11.
Reverberation time T20 in 1/3 and 1/1 octave bands, measured in Cases 1 to 3. Bars represent the standard deviation for the eight systems. Stitched lines denote the lower limits for reliable measurement.
Figure 11.
Reverberation time T20 in 1/3 and 1/1 octave bands, measured in Cases 1 to 3. Bars represent the standard deviation for the eight systems. Stitched lines denote the lower limits for reliable measurement.
Figure 12.
Relative levels of equivalent absorption areas estimated in Cases 1 to 3.
Figure 12.
Relative levels of equivalent absorption areas estimated in Cases 1 to 3.
Figure 13.
Outdoor-to-indoor level difference relative to the free-field level: (a) Case 1 with different averaging schemes; (b) normalized level difference corrected with the average level of corners in Cases 1 to 3.
Figure 13.
Outdoor-to-indoor level difference relative to the free-field level: (a) Case 1 with different averaging schemes; (b) normalized level difference corrected with the average level of corners in Cases 1 to 3.
Table 1.
Compositions of the mock wooden house: unit [mm].
Table 1.
Compositions of the mock wooden house: unit [mm].
| Elements | Structure |
|---|
| Façade wall | Metal siding (16) + Furring strips (18) + Windproof/moisture-permeable sheet + Plywood (9) + Glass wool 16K (100) + Gypsum board (9.5) |
| Partition wall | Gypsum board (9.5) + Air (100) + Gypsum board (9.5) |
| Floor | Composite flooring (12) + Plywood (12) + Polystyrene foam (25) |
| Ceiling | Gypsum board (9.5) + Glass wool 16K (100) |
| Roof | Metal roofing + Asphalt roofing + Plywood (12) |
| Window | Aluminum double sliding sash (h = 1800, w = 1600)
Glazing: FL5 (room A), FL6 + A6 + FL4 (room B) |
| Door | Resin door (h = 1800, w = 720)
Glazing: W6.8 + A11 + FL4 (exterior), FL6 + A8 + FL4 (interior) |
| Publisher’s Note: MDPI stays neutral with regard to jurisdictional claims in published maps and institutional affiliations. |
© 2021 by the authors. Licensee MDPI, Basel, Switzerland. This article is an open access article distributed under the terms and conditions of the Creative Commons Attribution (CC BY) license (https://creativecommons.org/licenses/by/4.0/).


