
Quantification of the Absorption and Scattering Effects of Diffusers in a Room with Absorbent Ceiling


Abstract
:1. Introduction
Study Objective and Principal Conclusion
2. Materials and Methods
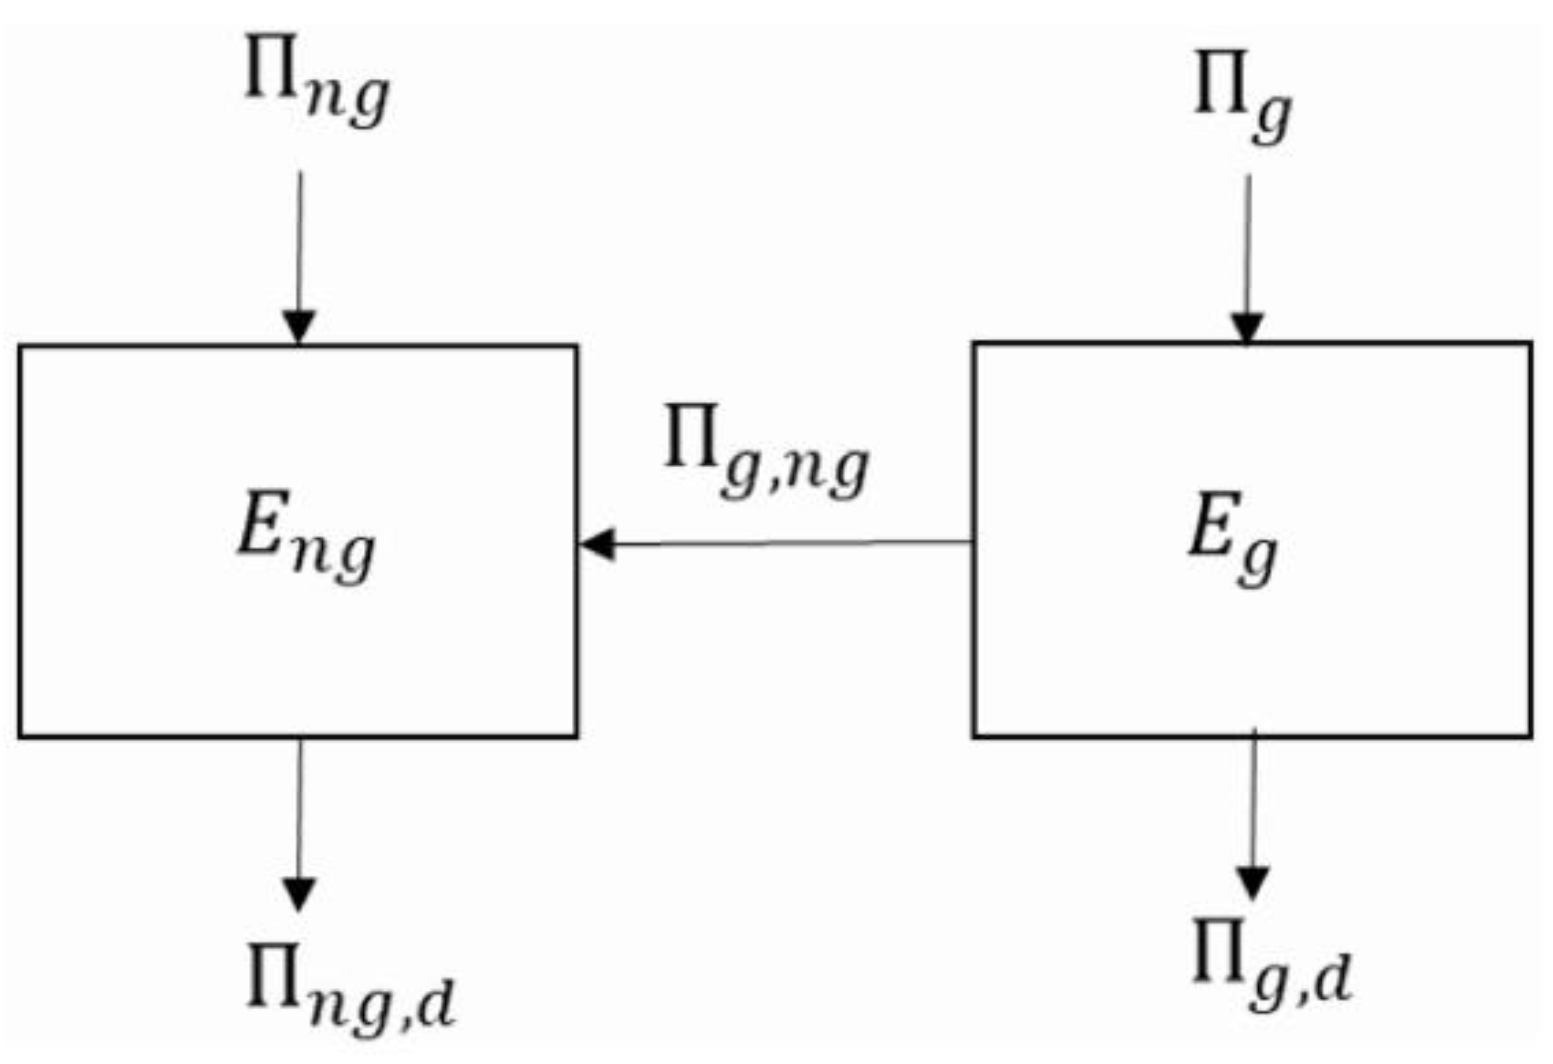
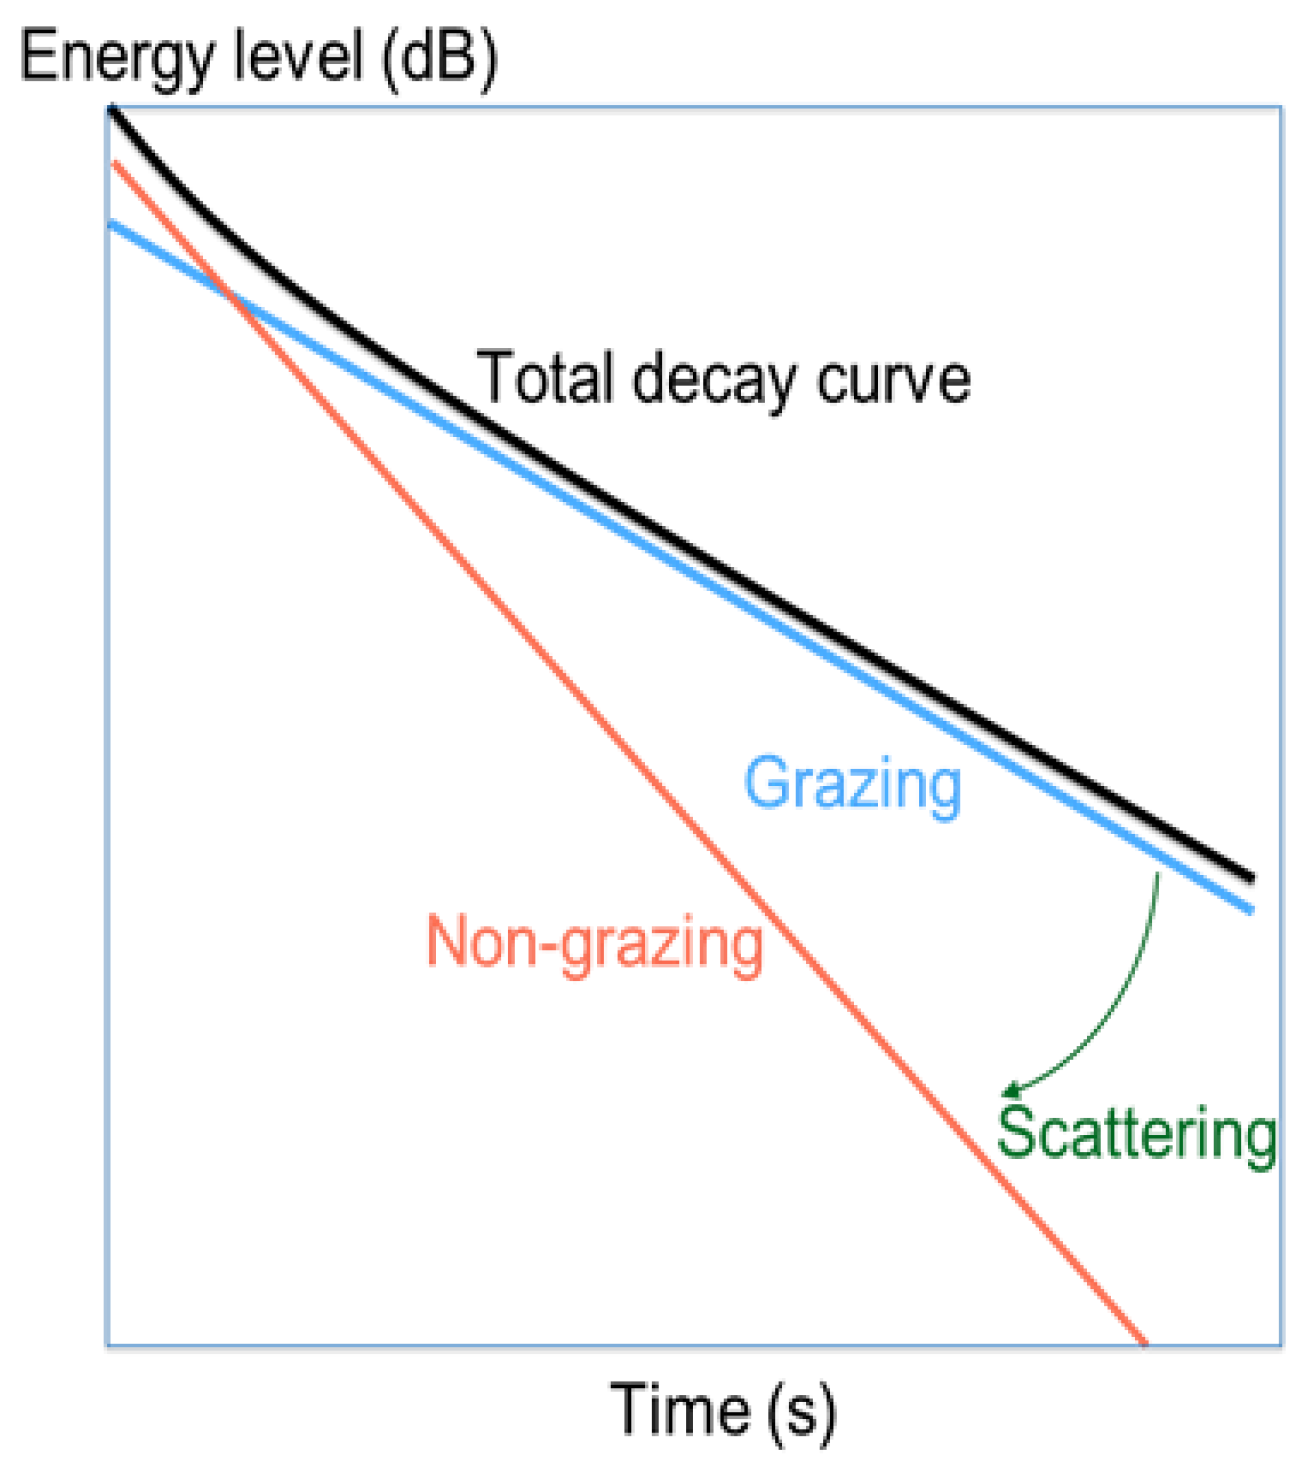
2.1. A Statistical Energy Analysis Model for Ordinary Rooms
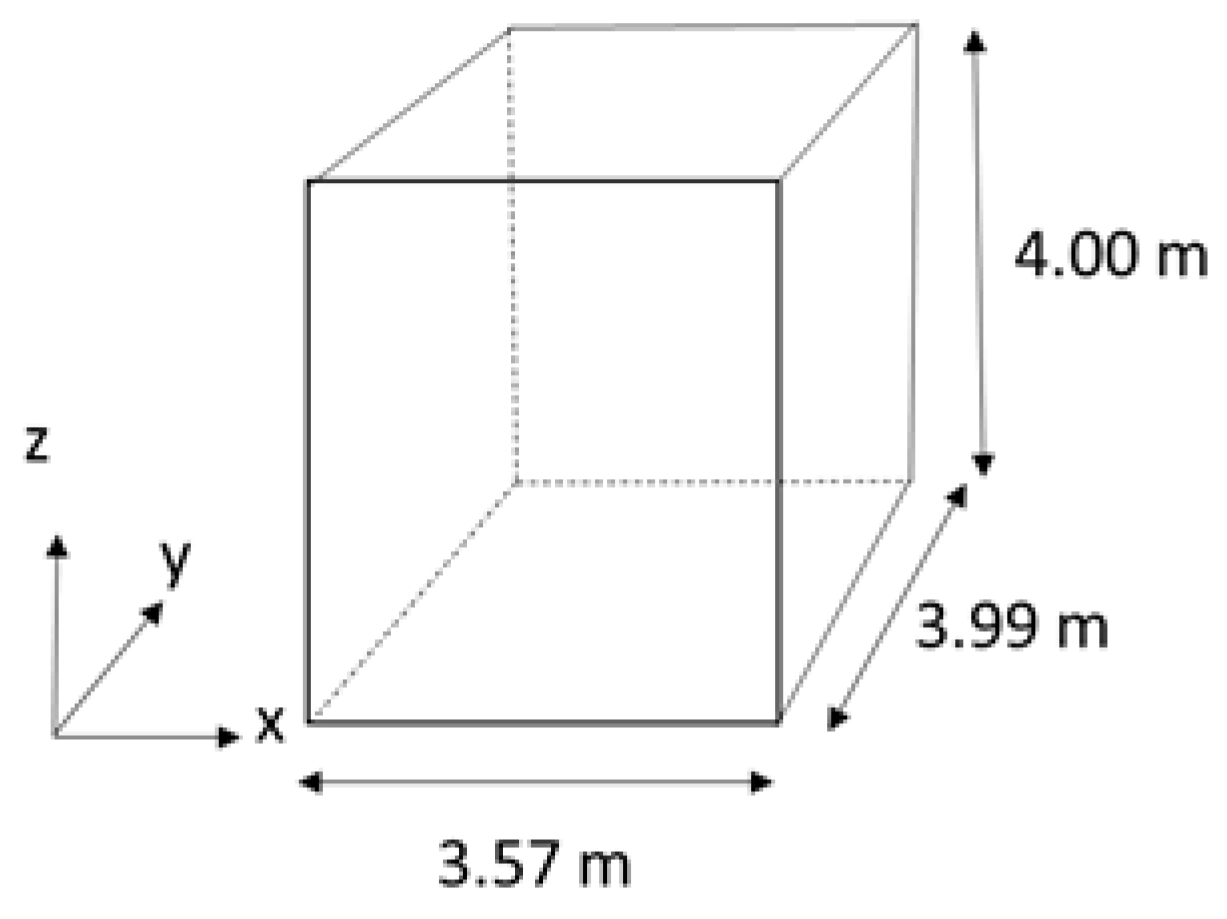
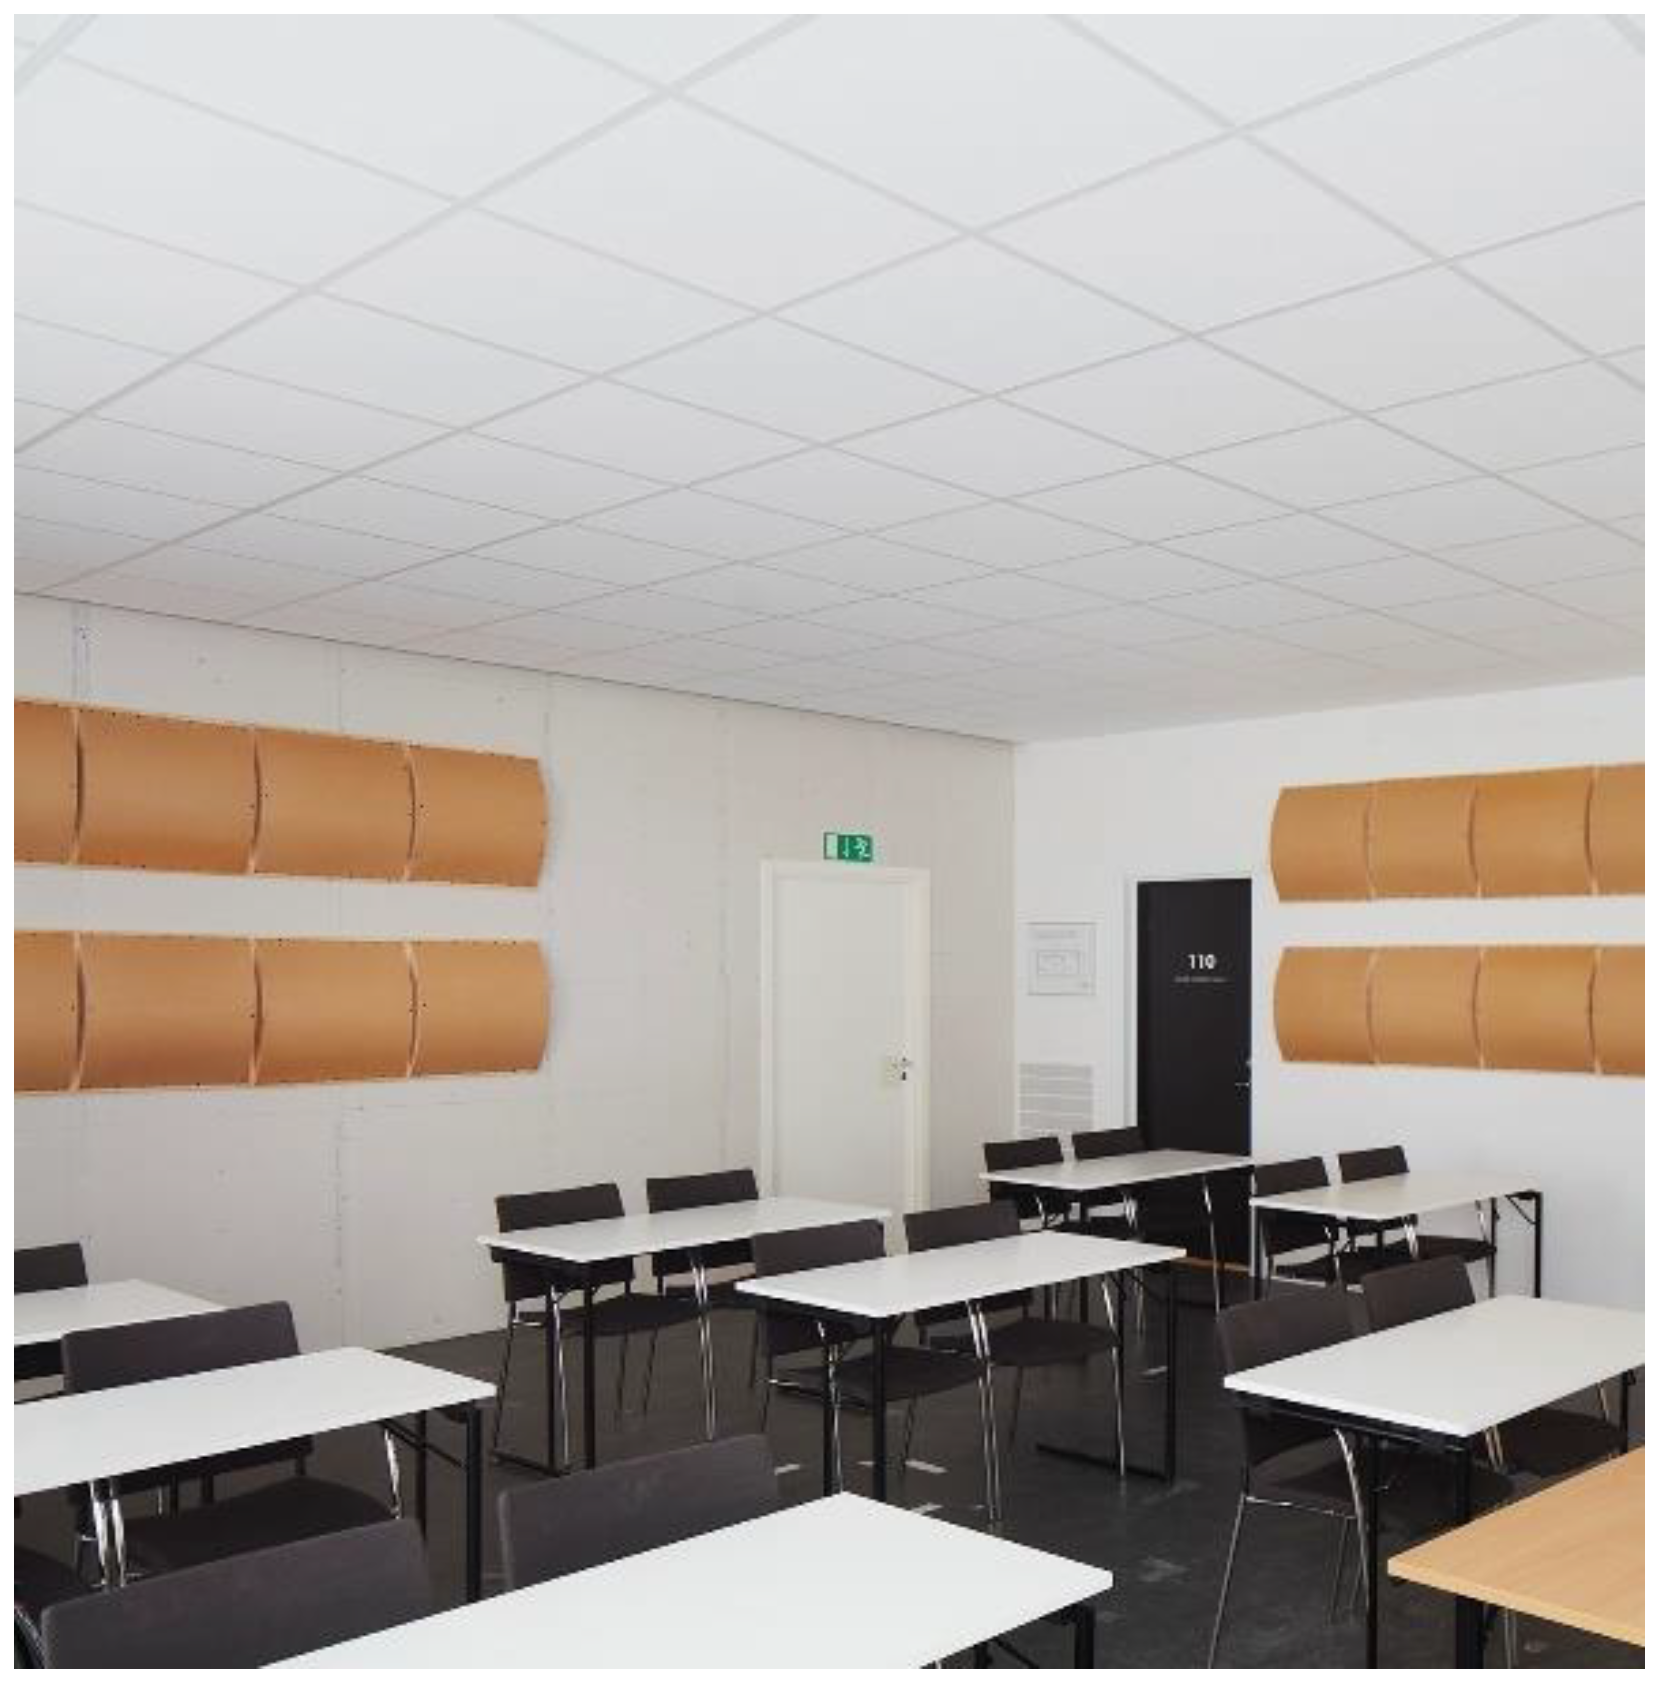
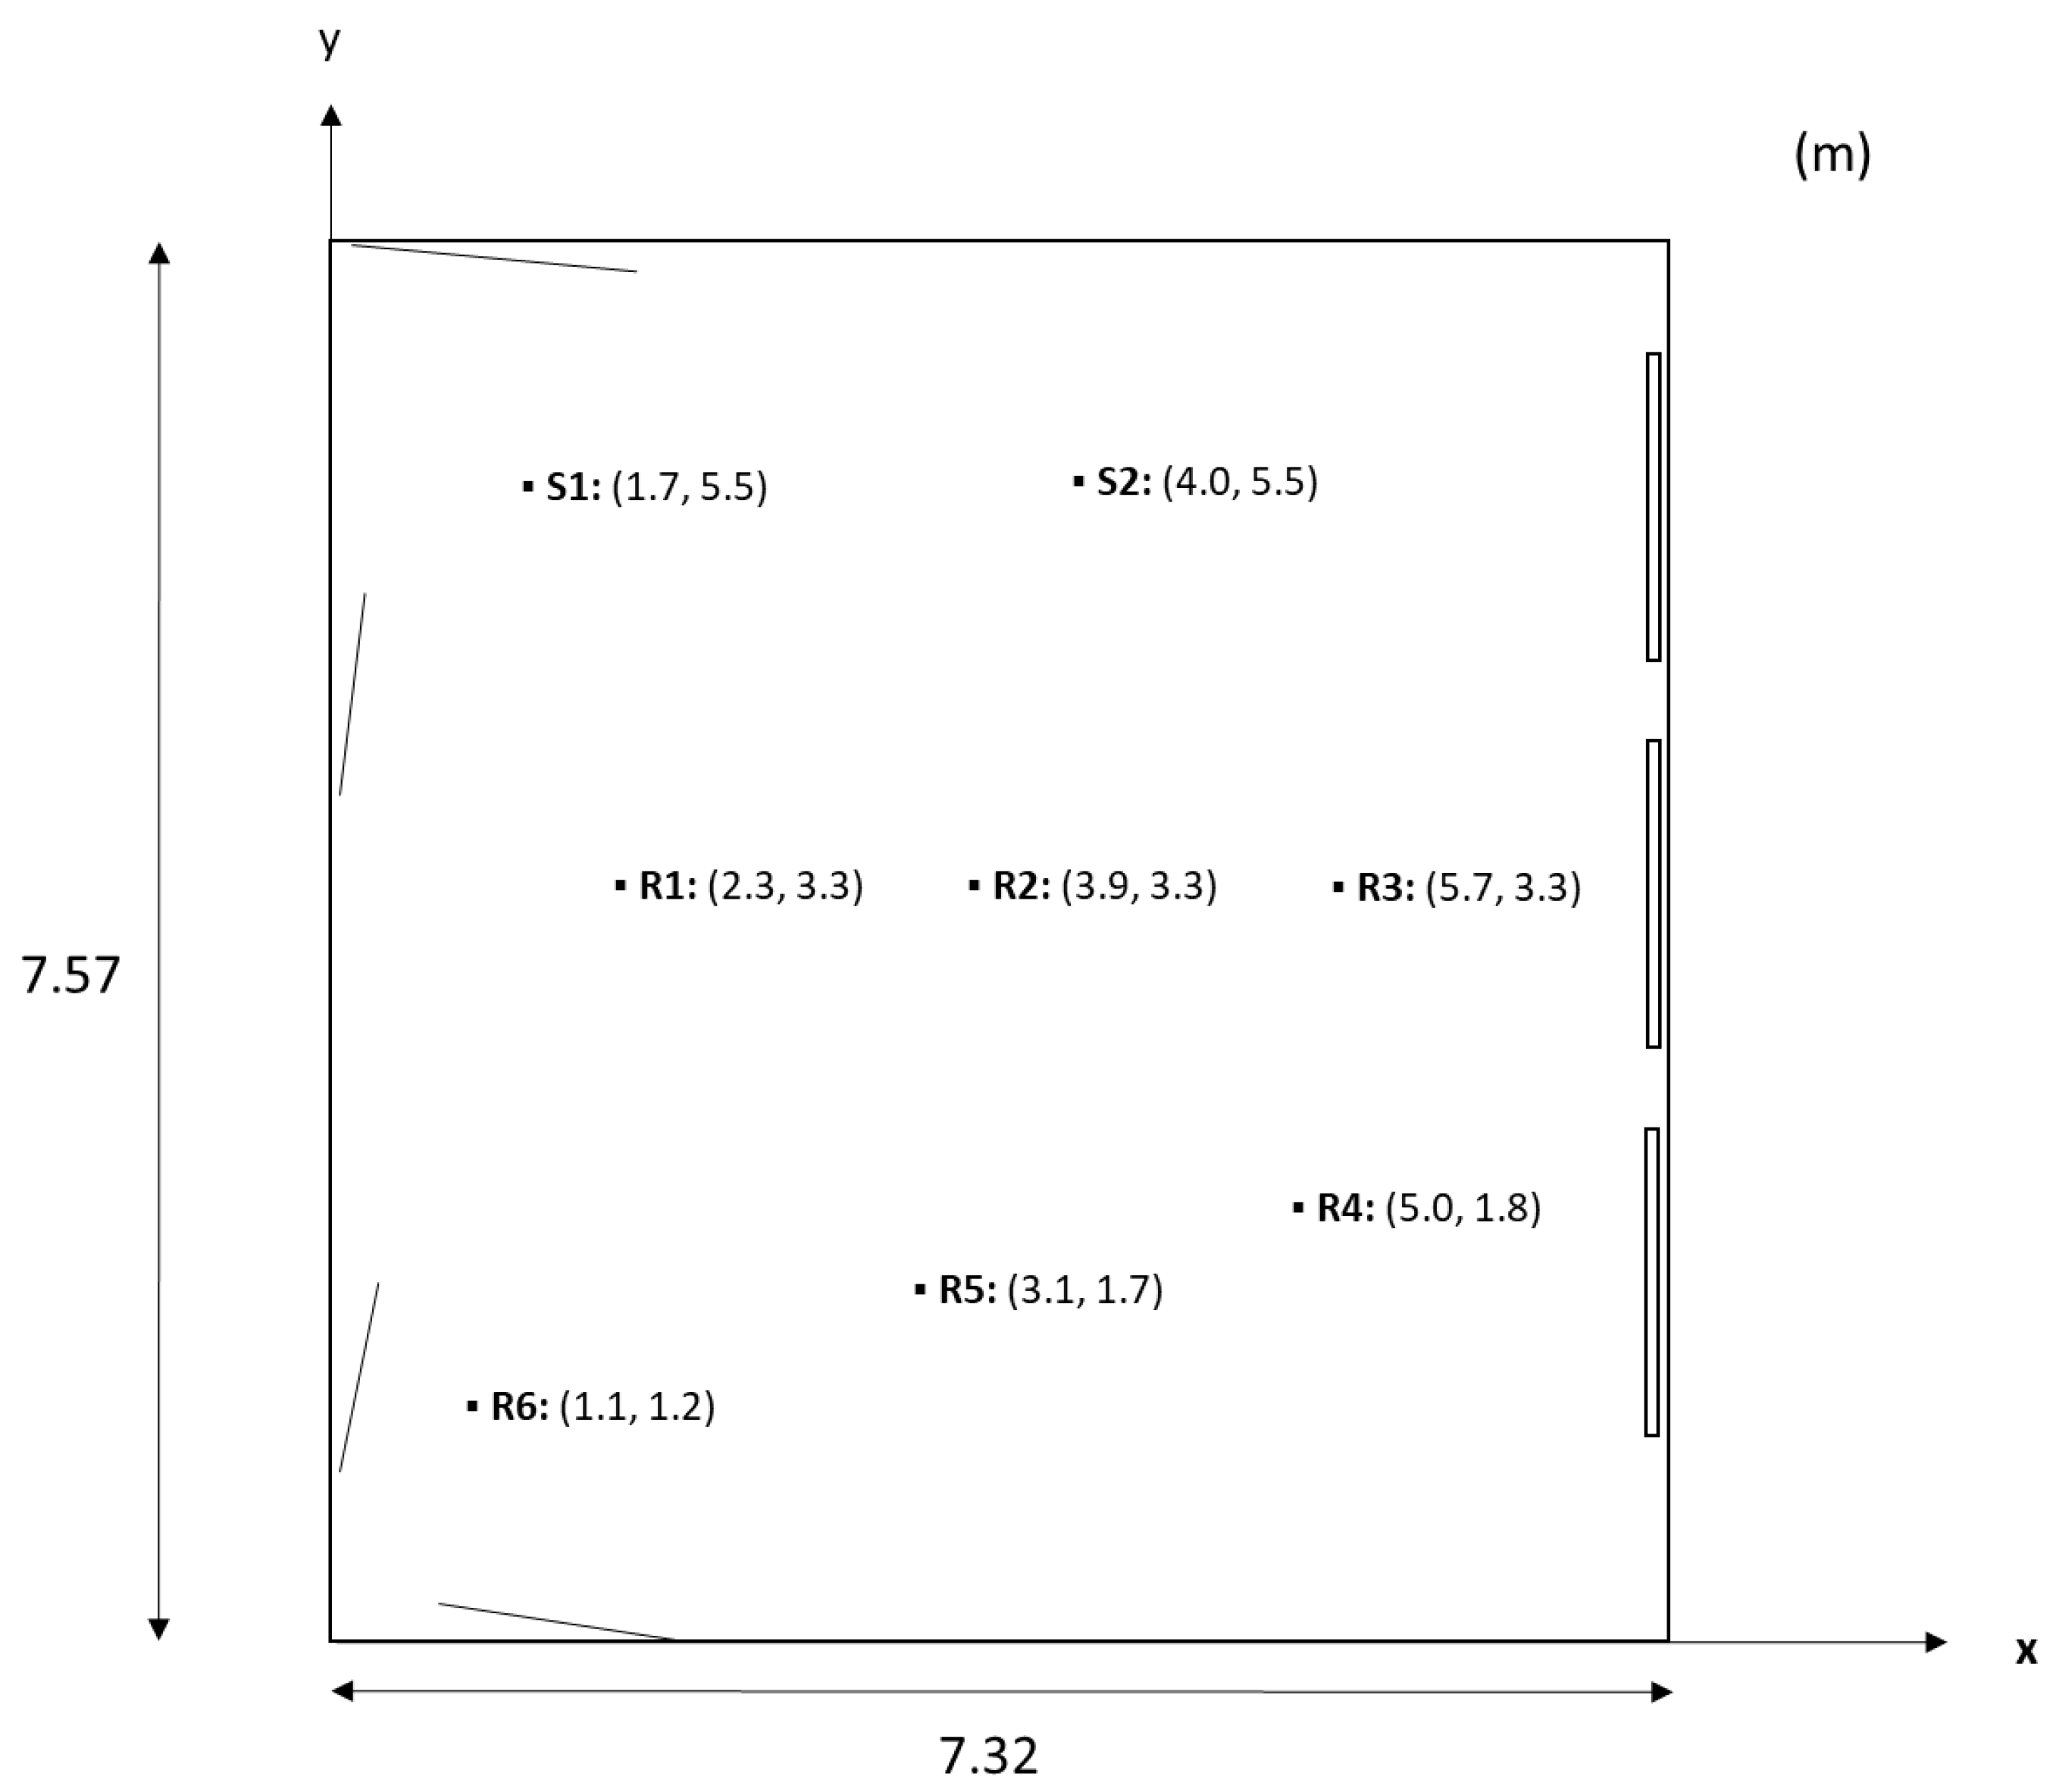
2.2. Test Environment
2.3. Acoustic Treatment
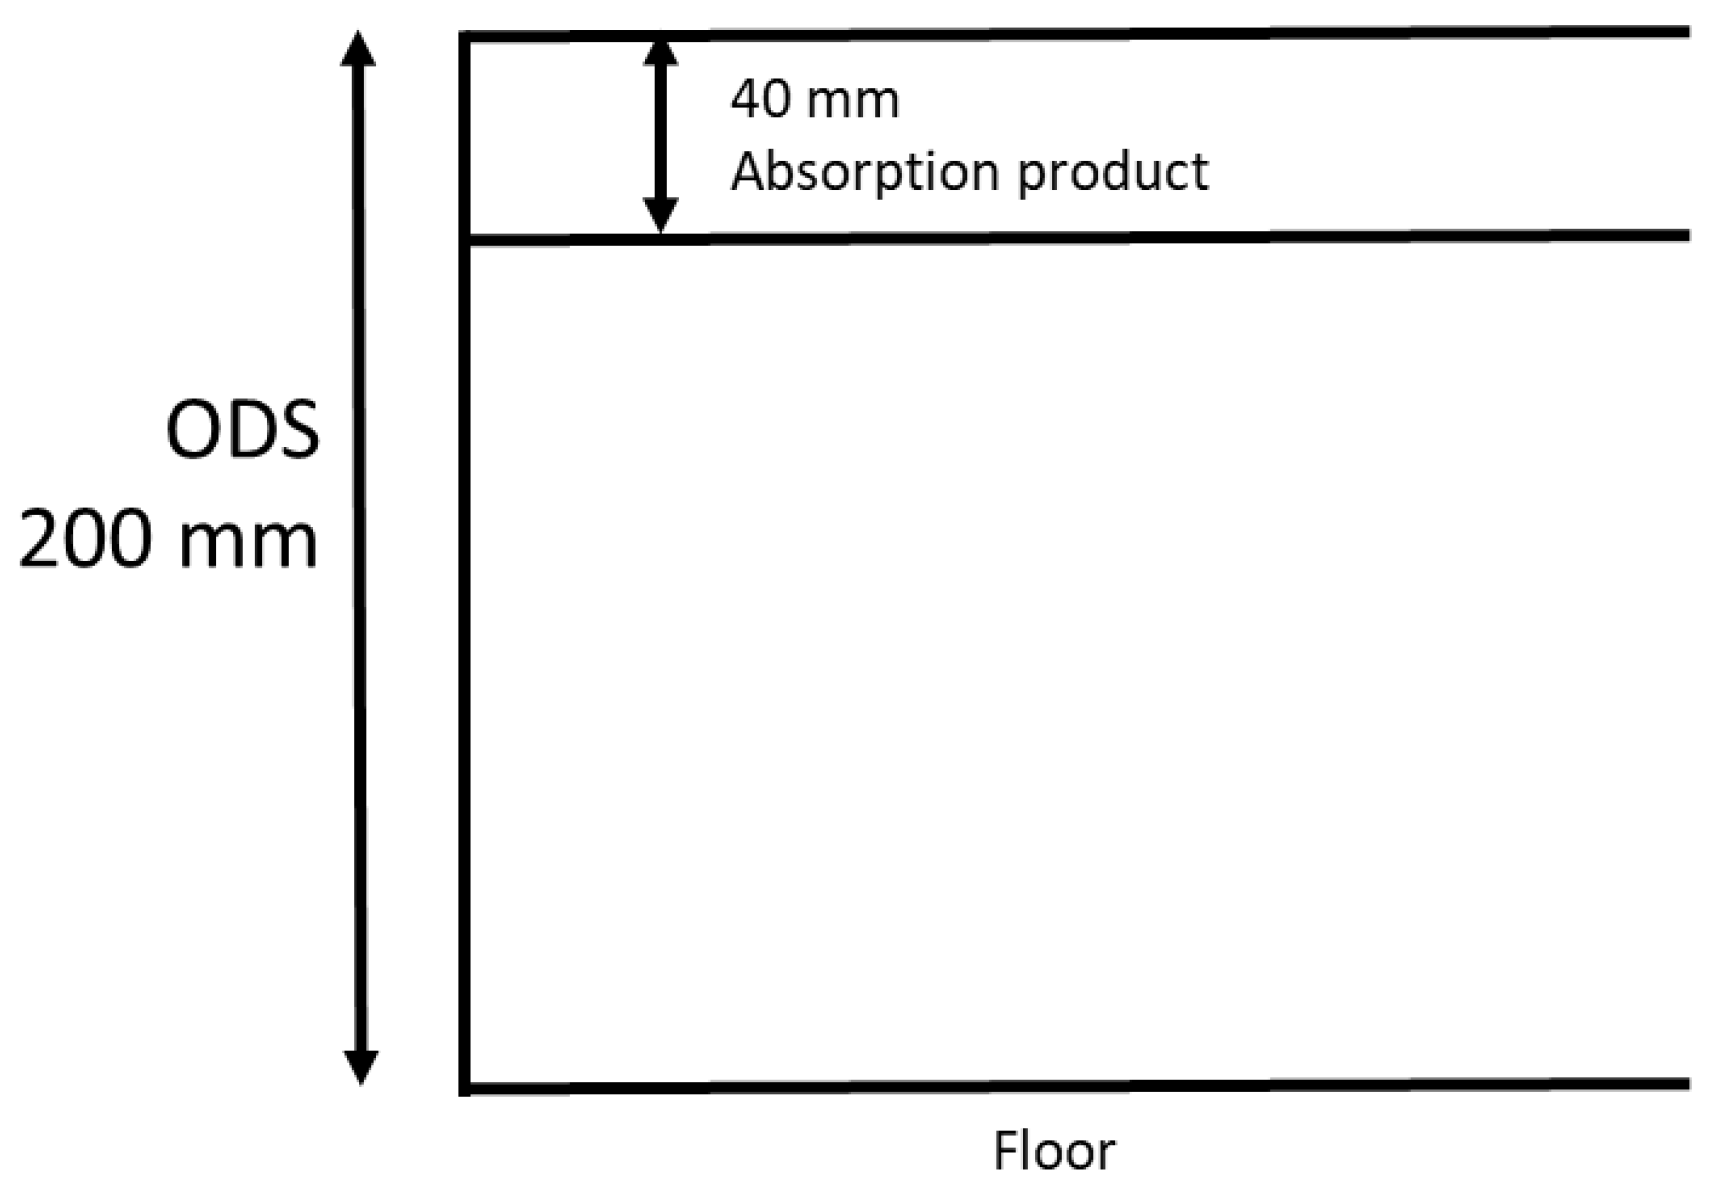
2.3.1. Porous Absorbers
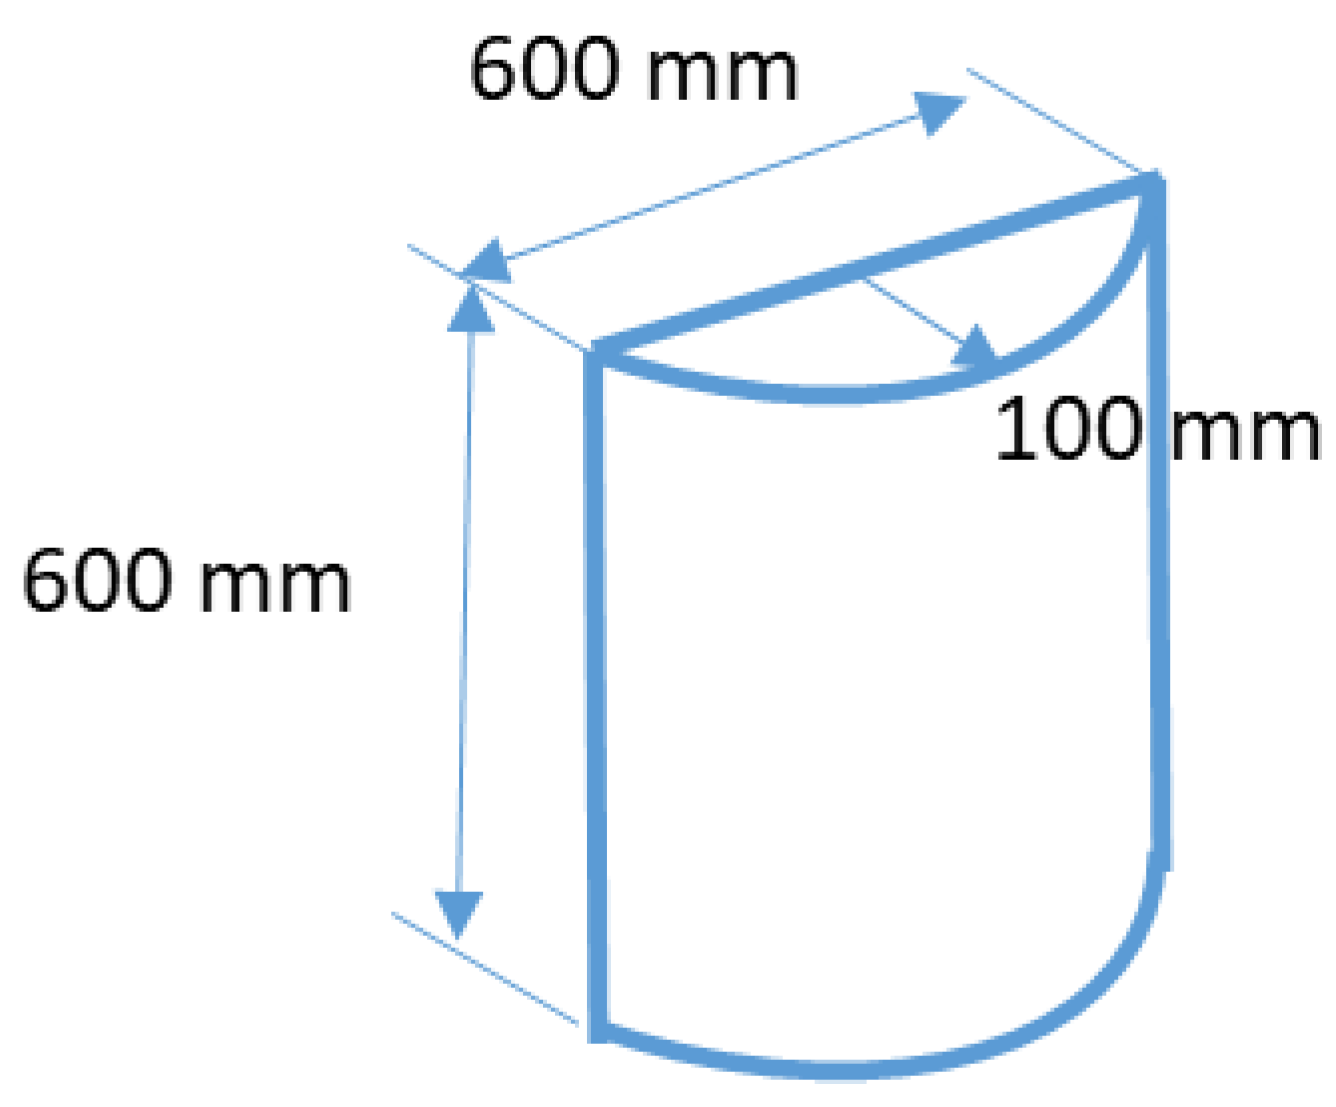
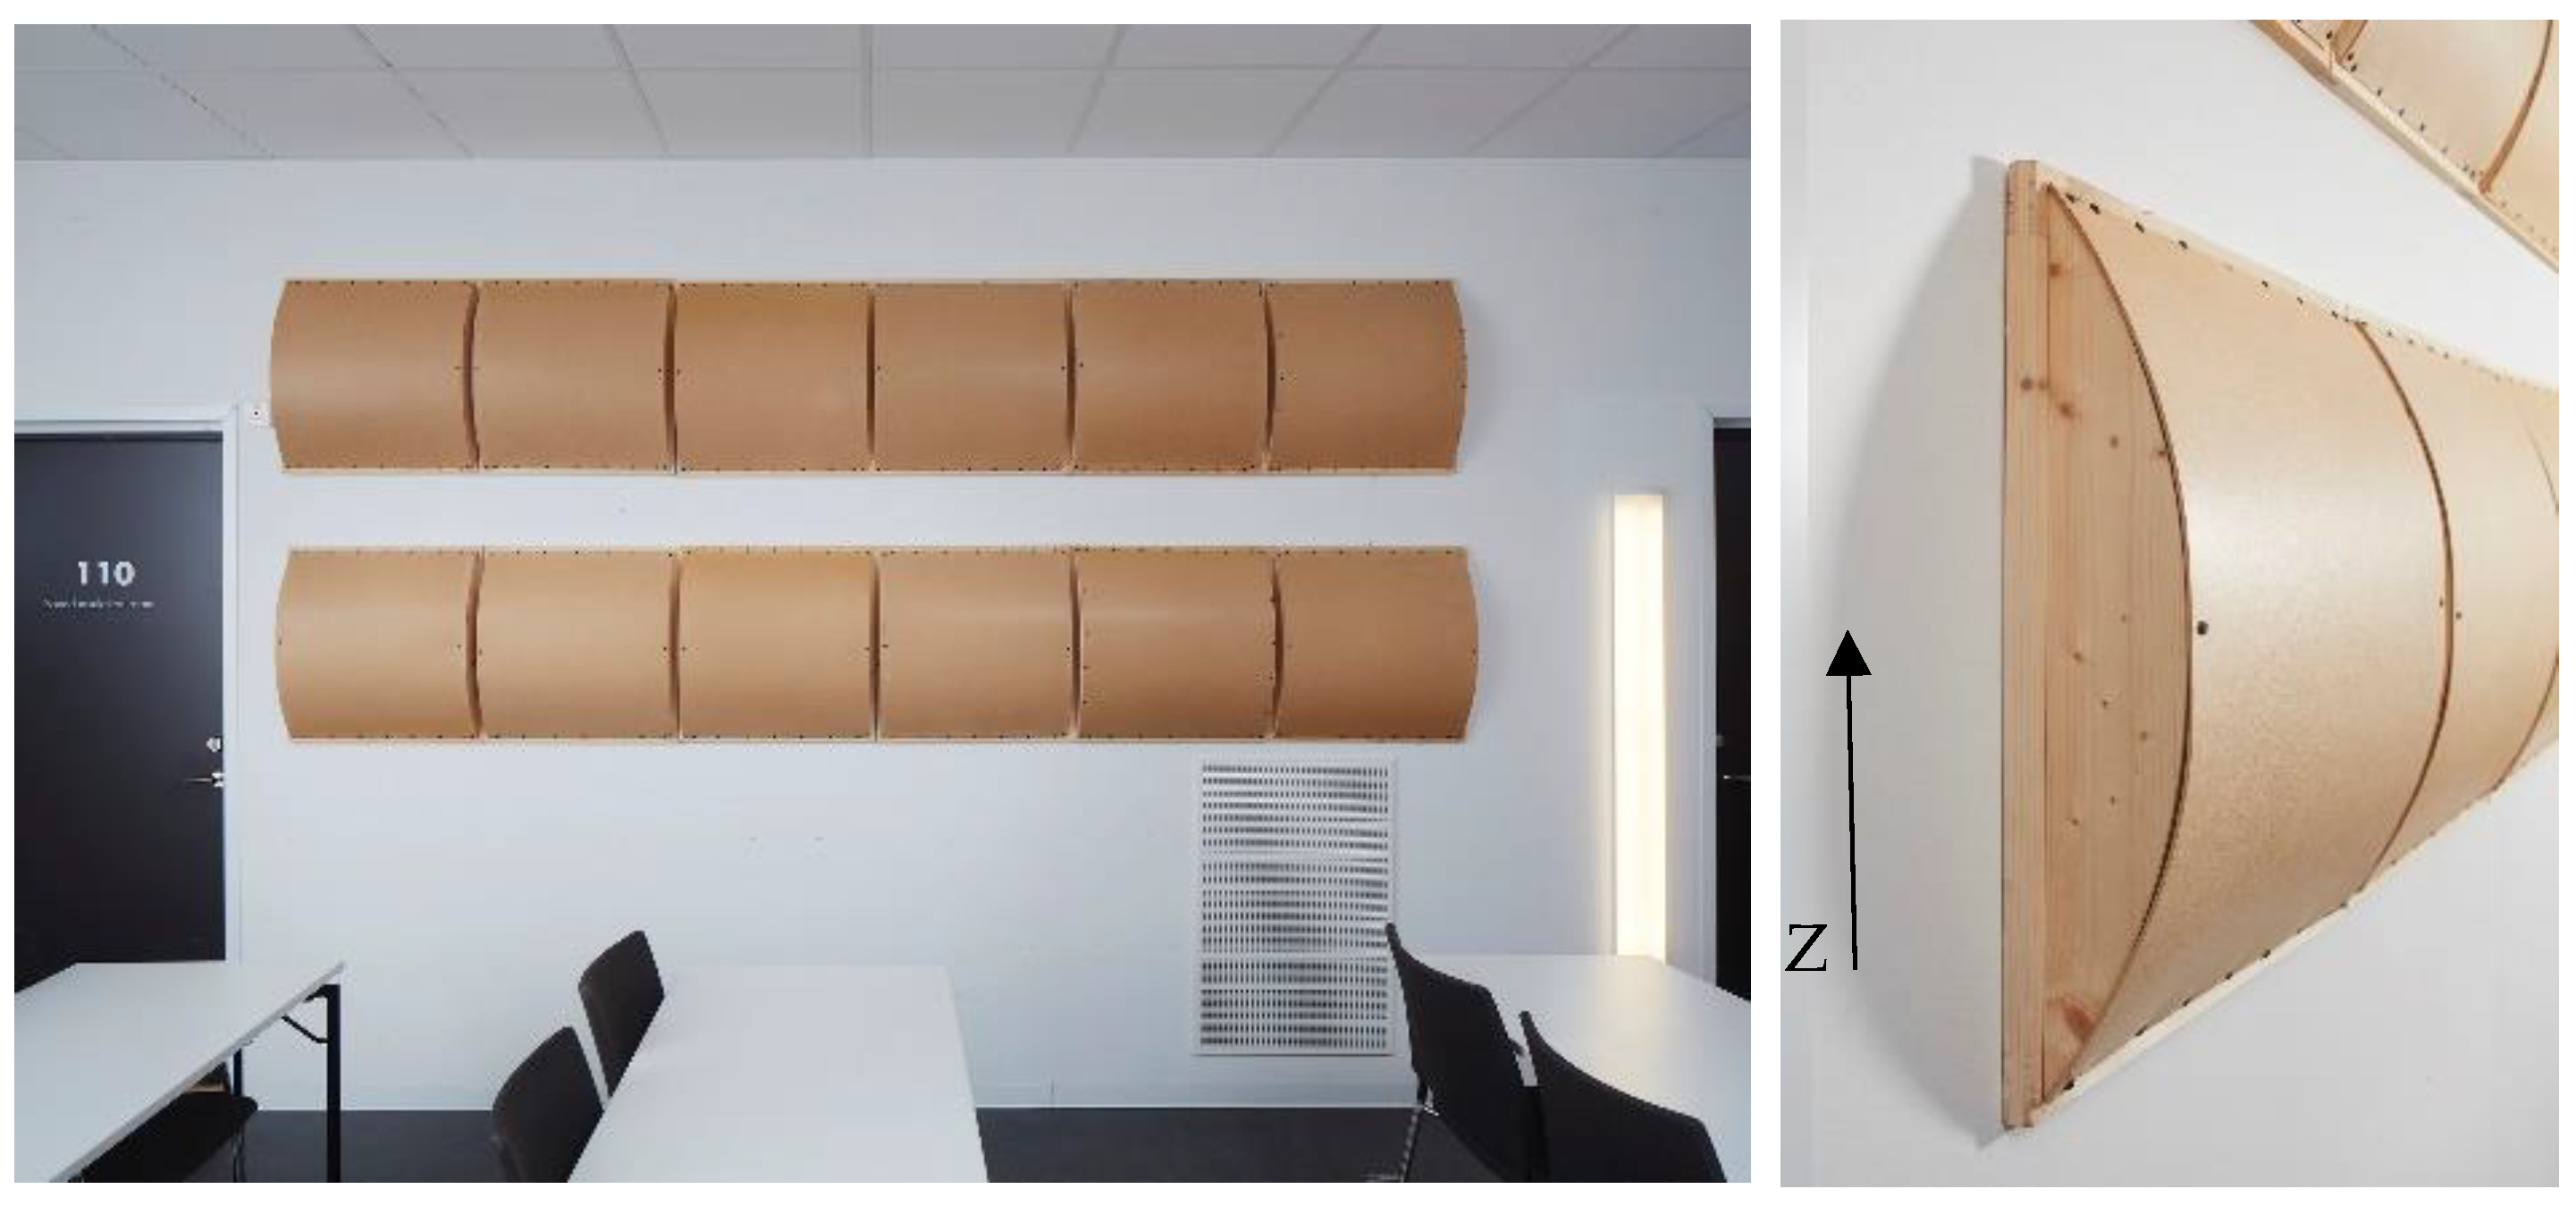
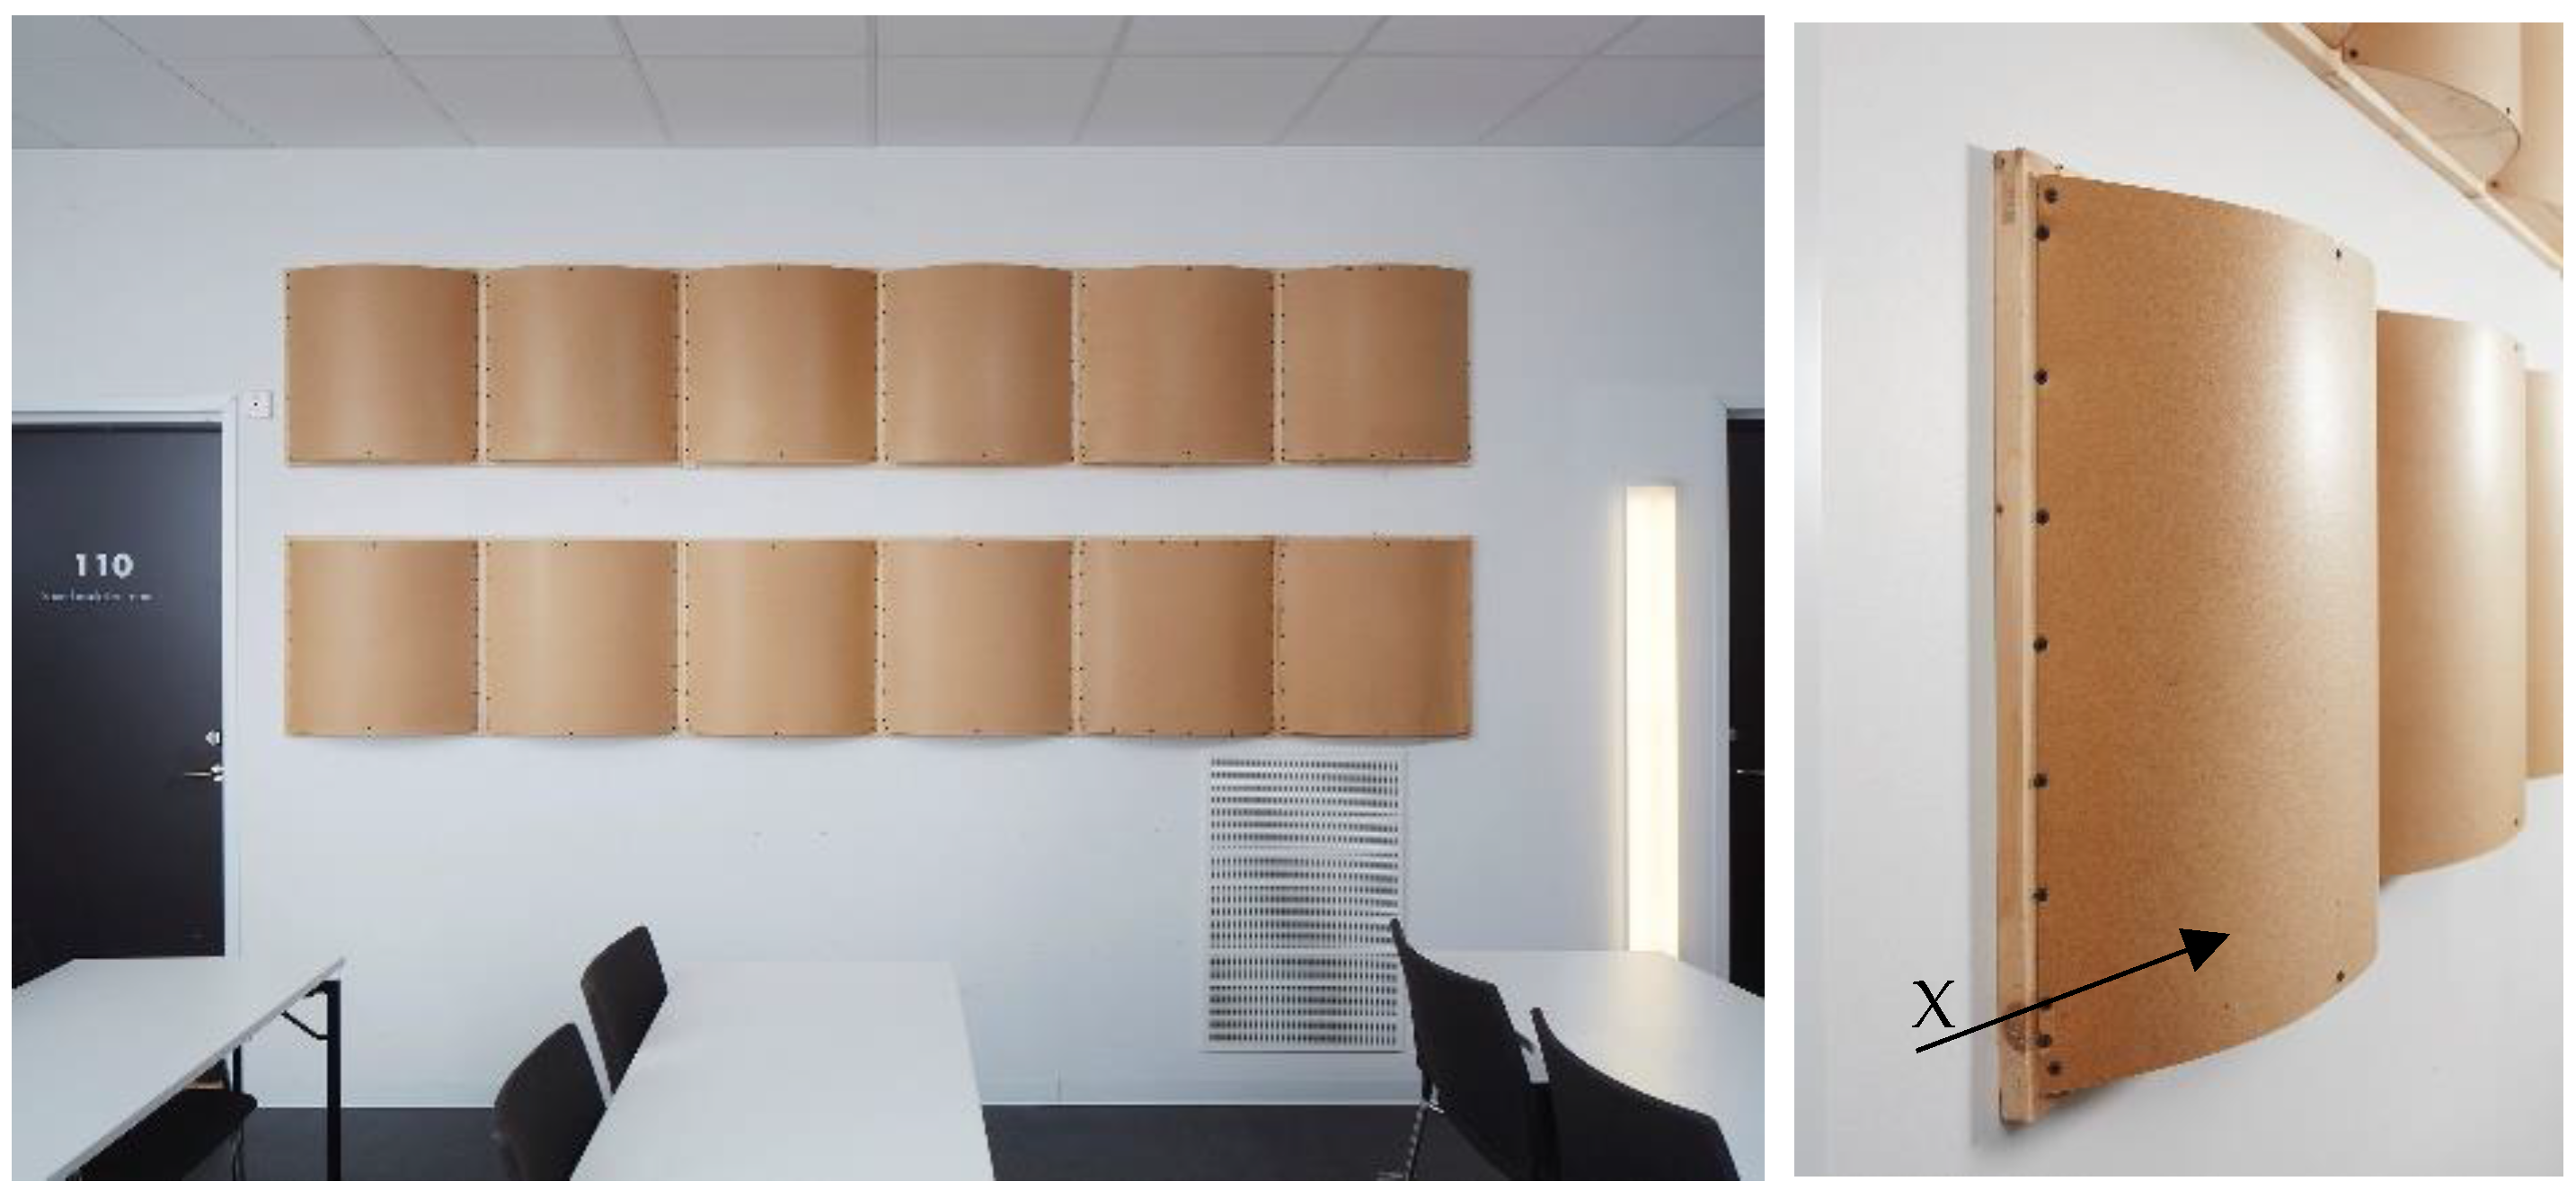
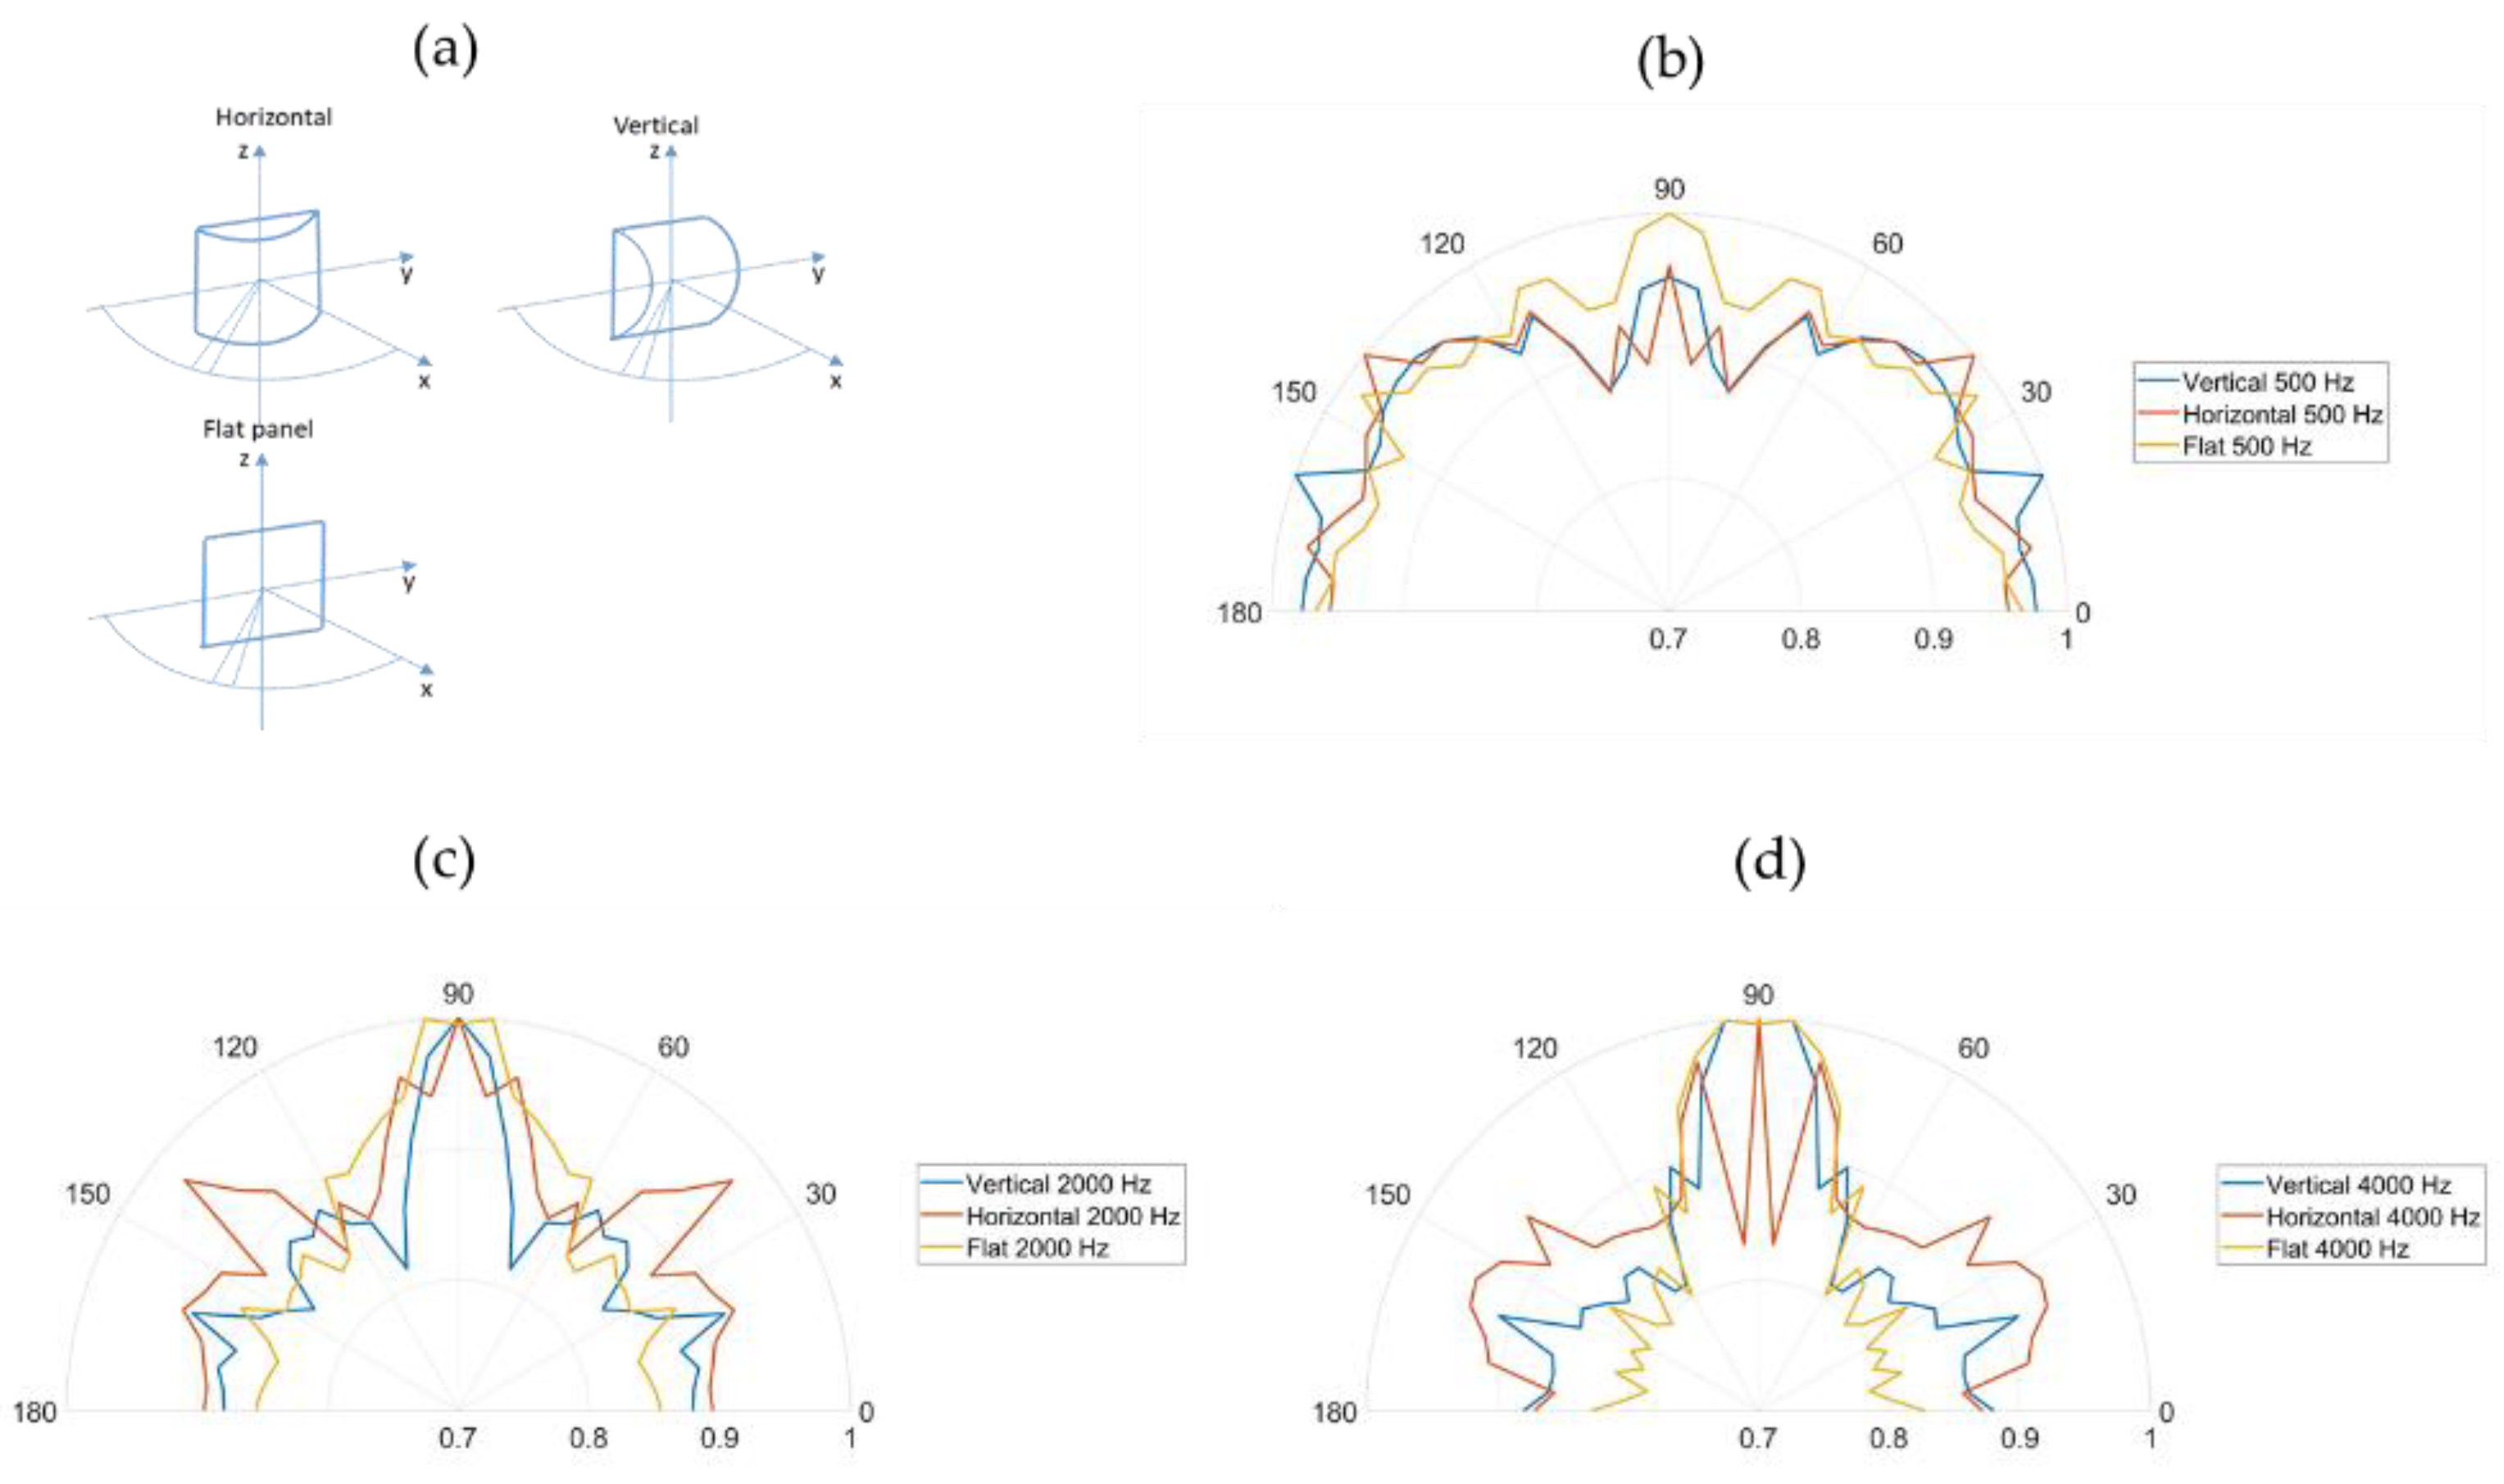
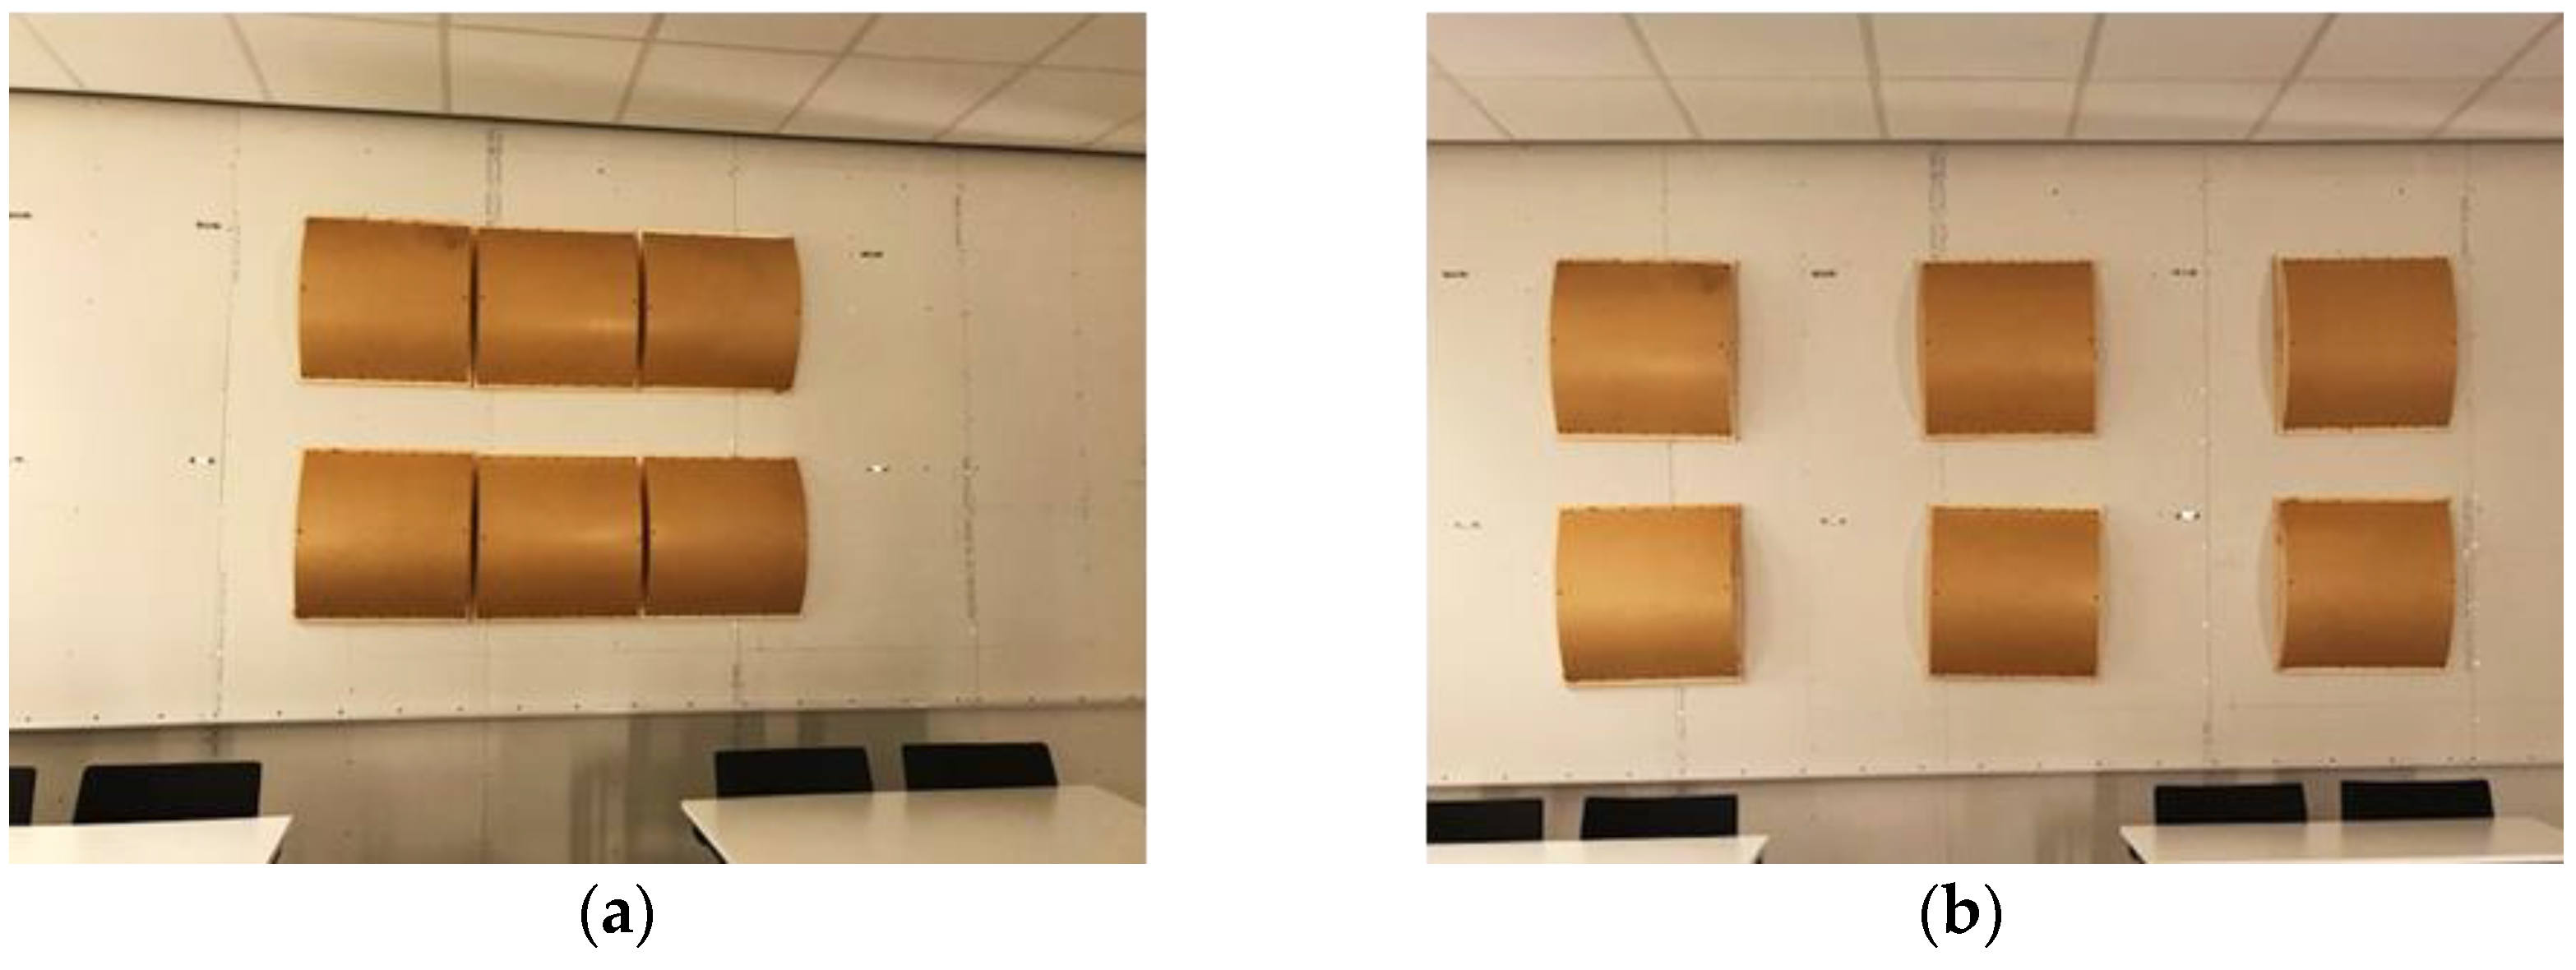
2.3.2. Diffusers
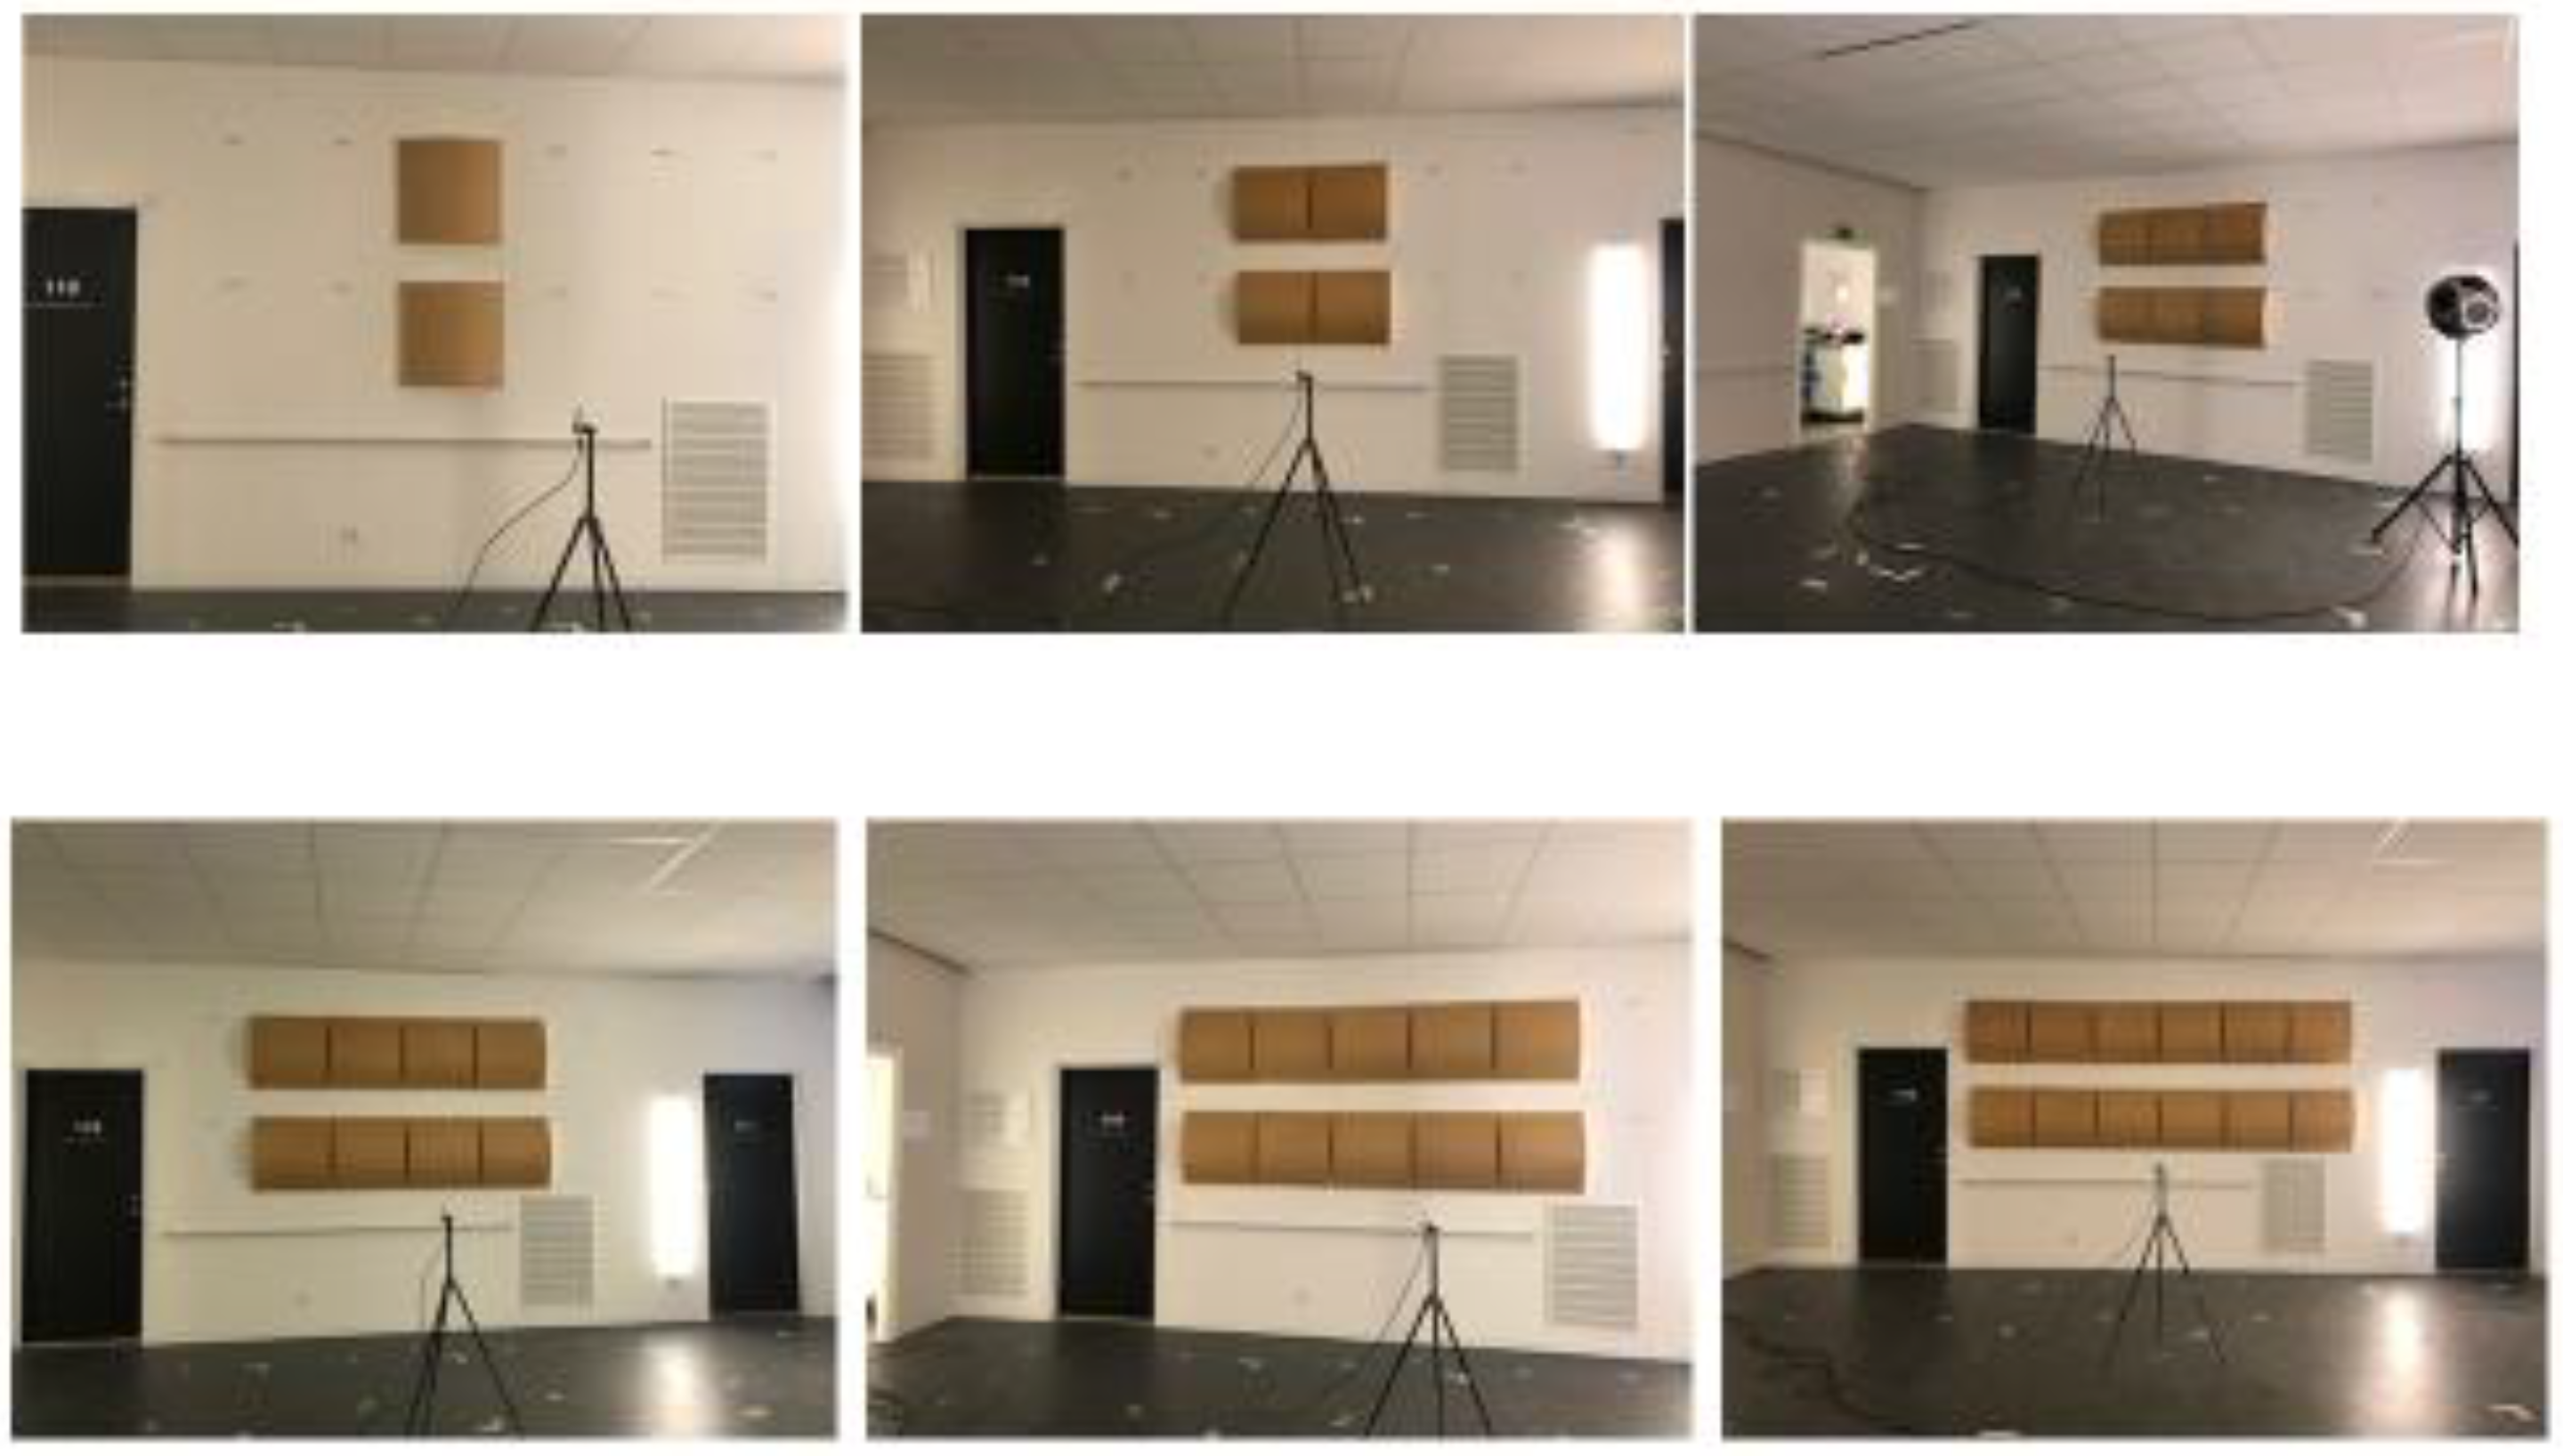
2.4. Configurations
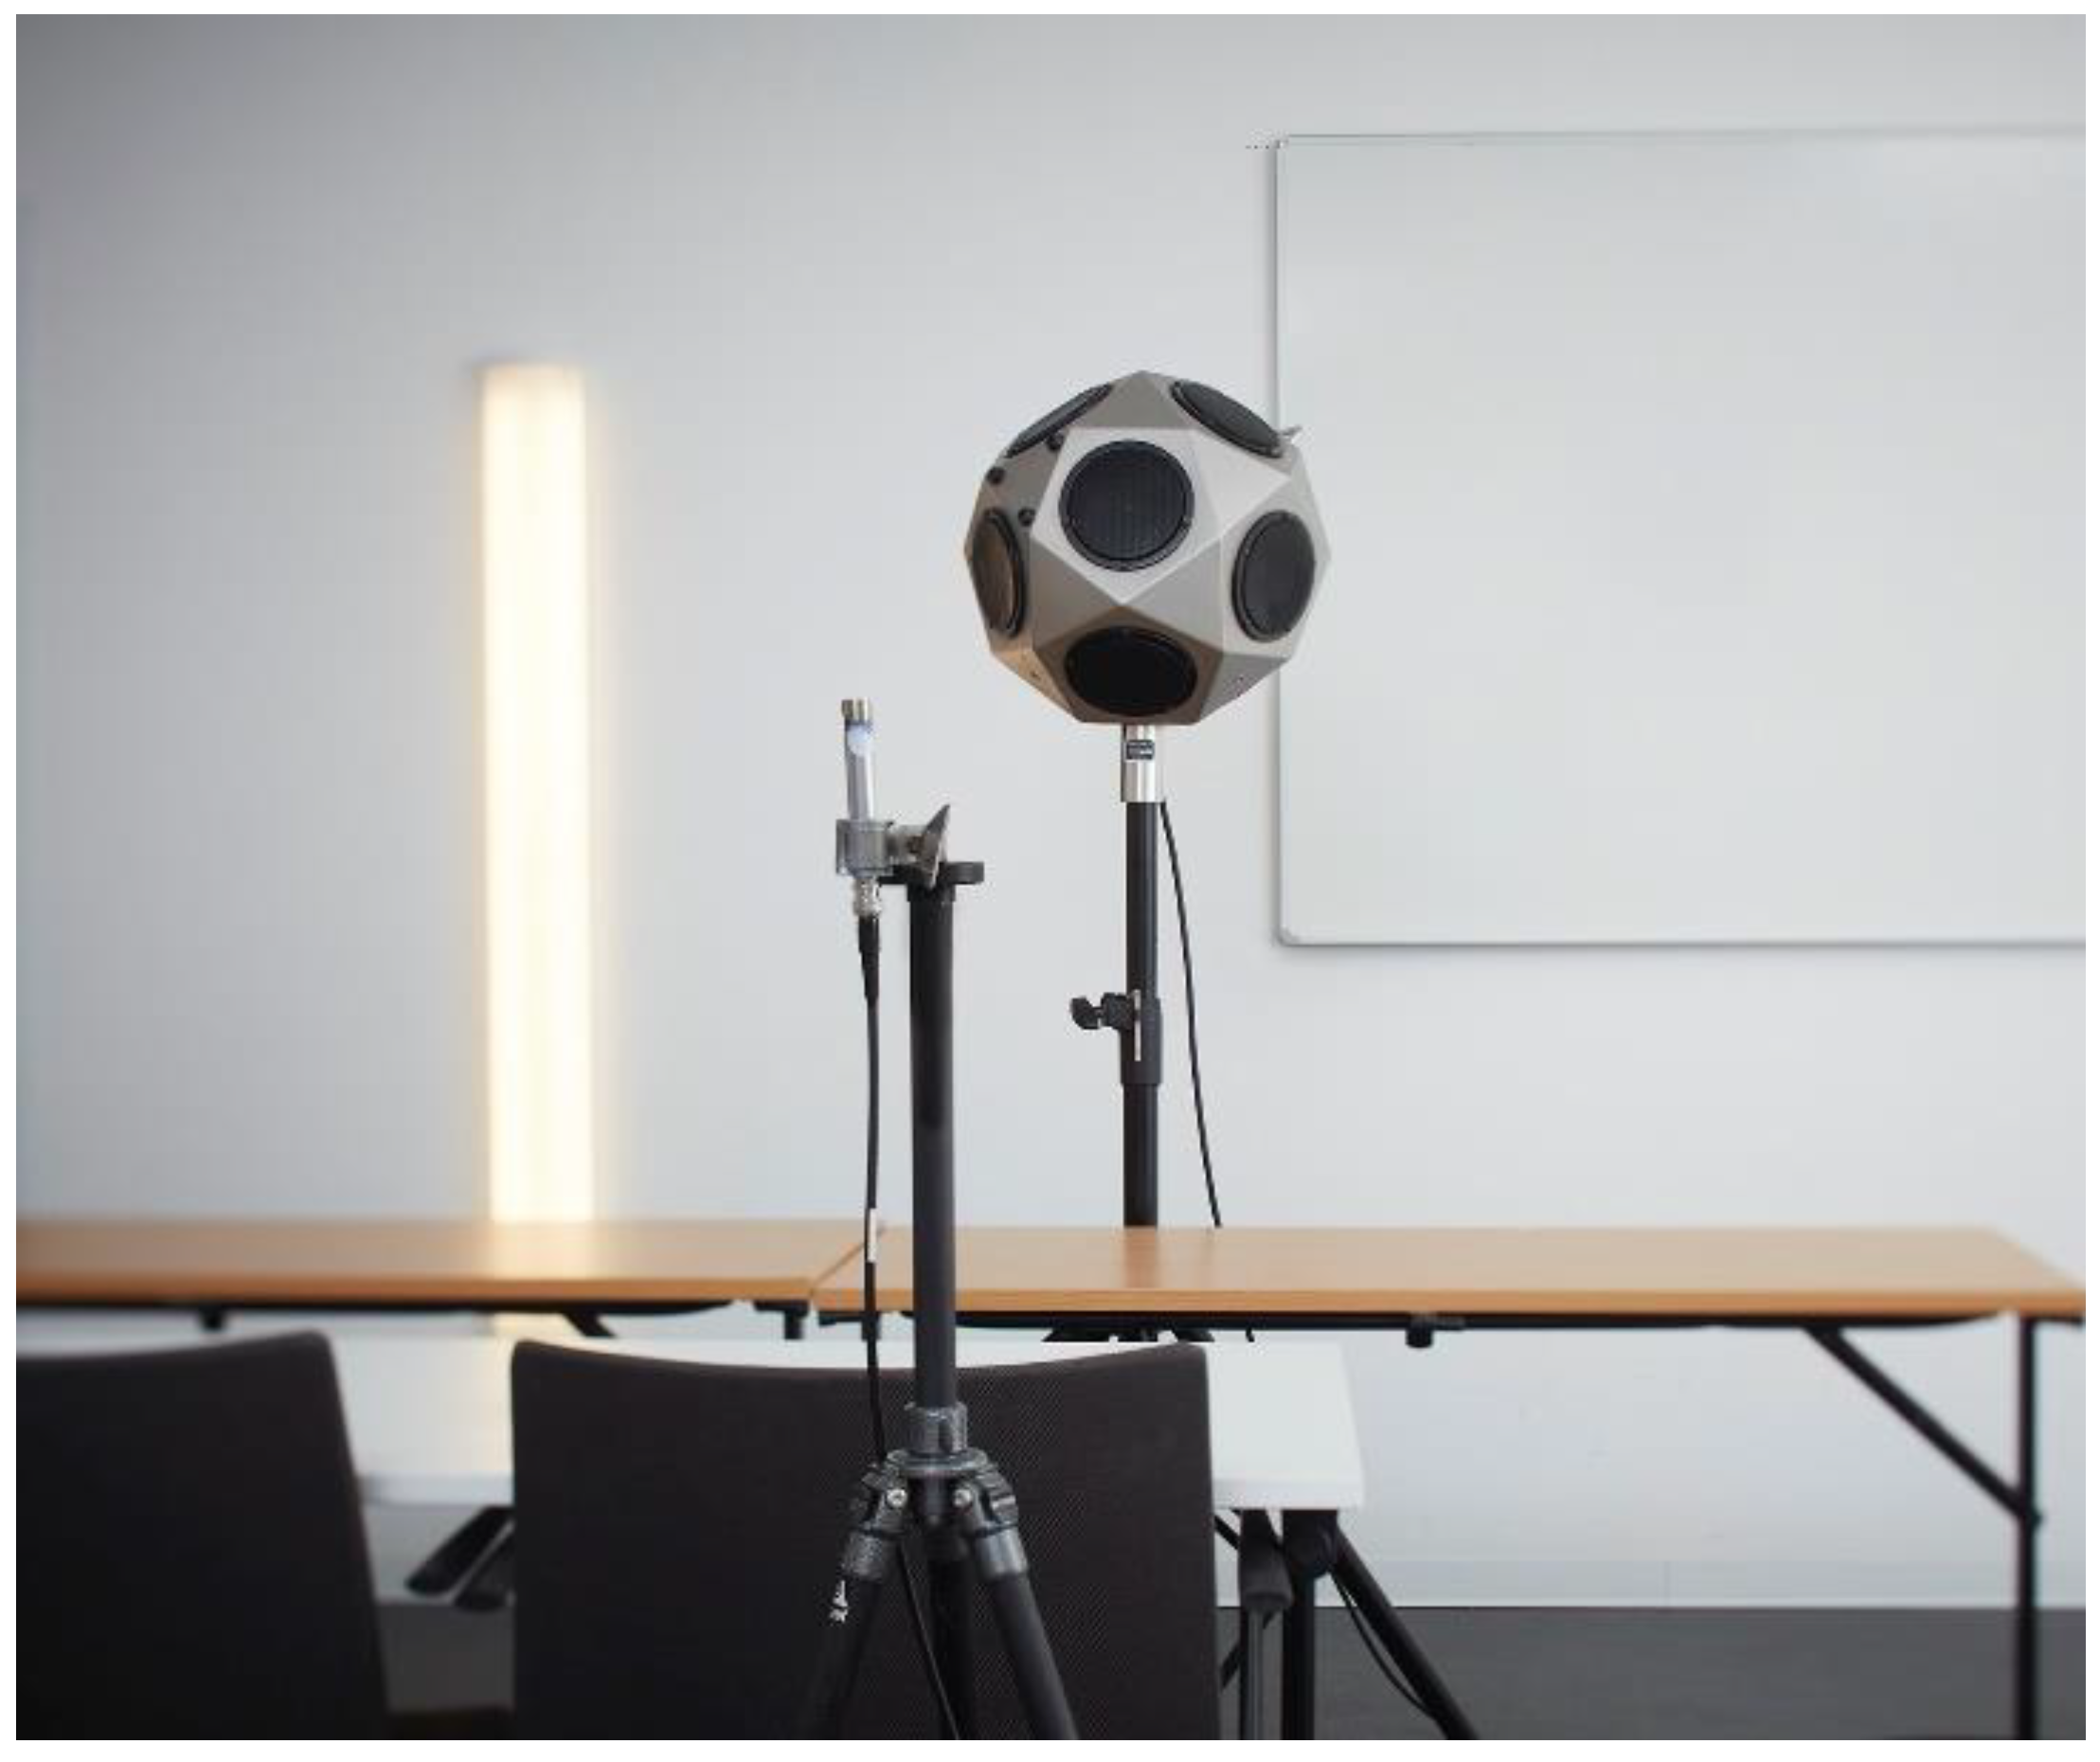
2.5. Measurements
3. Results
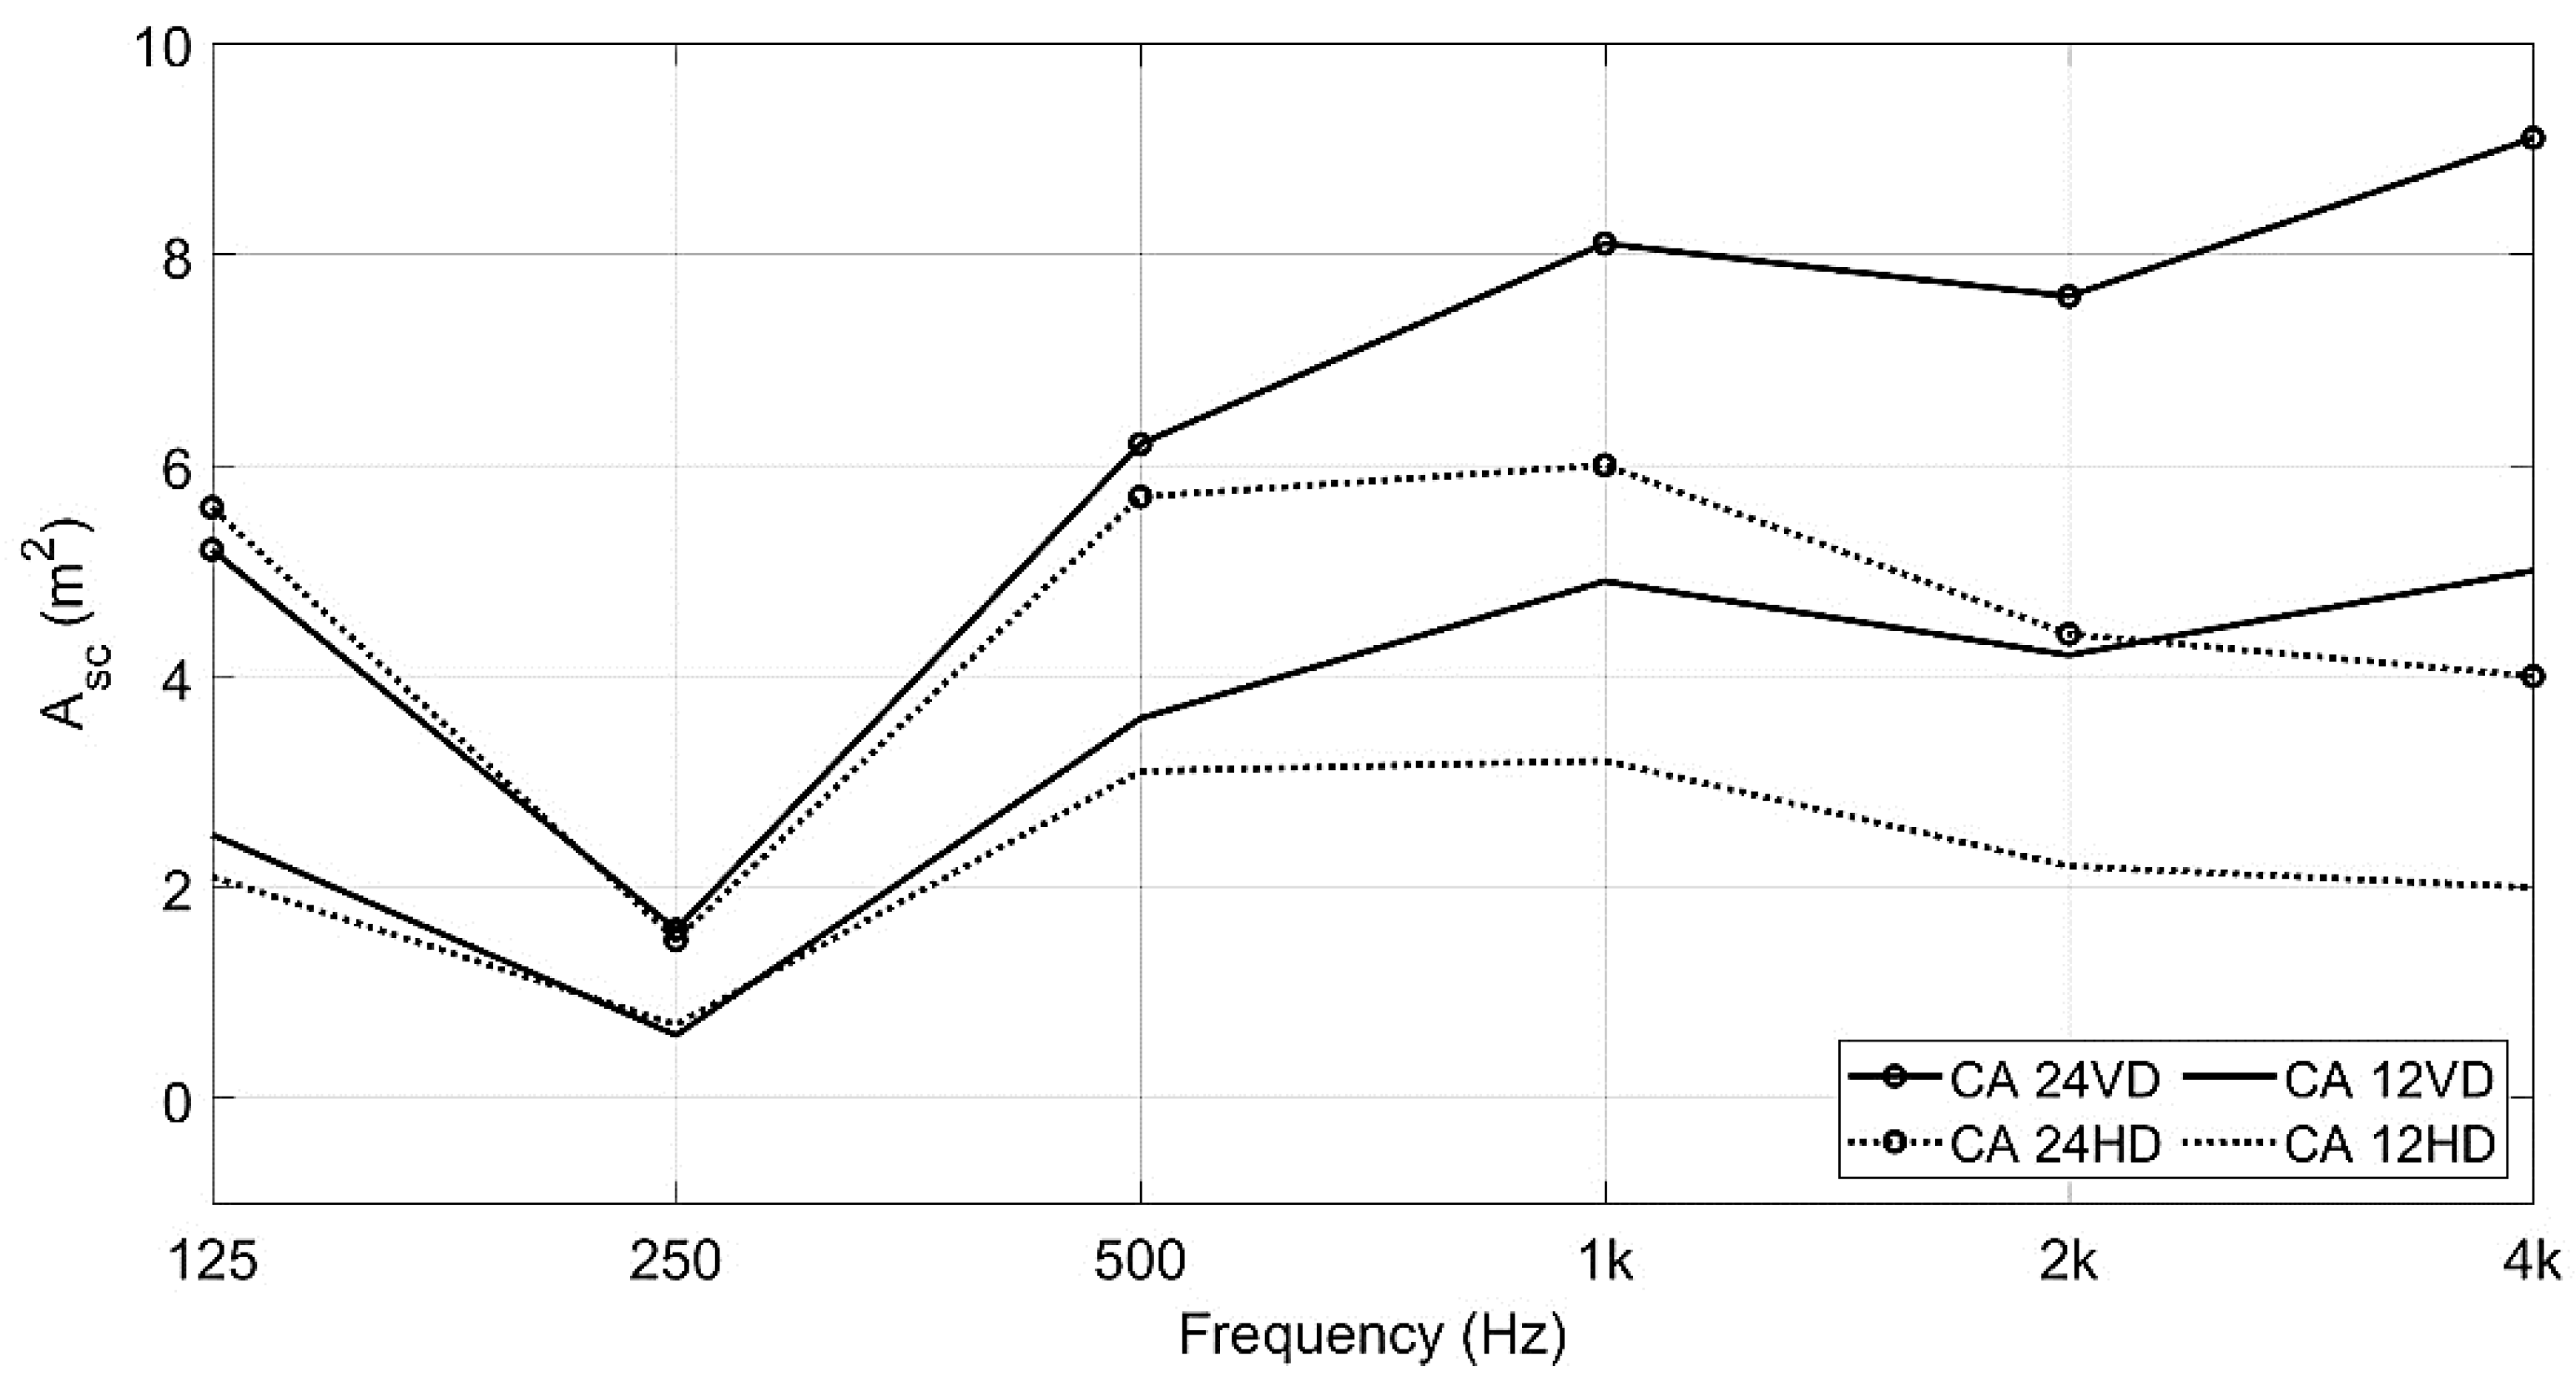
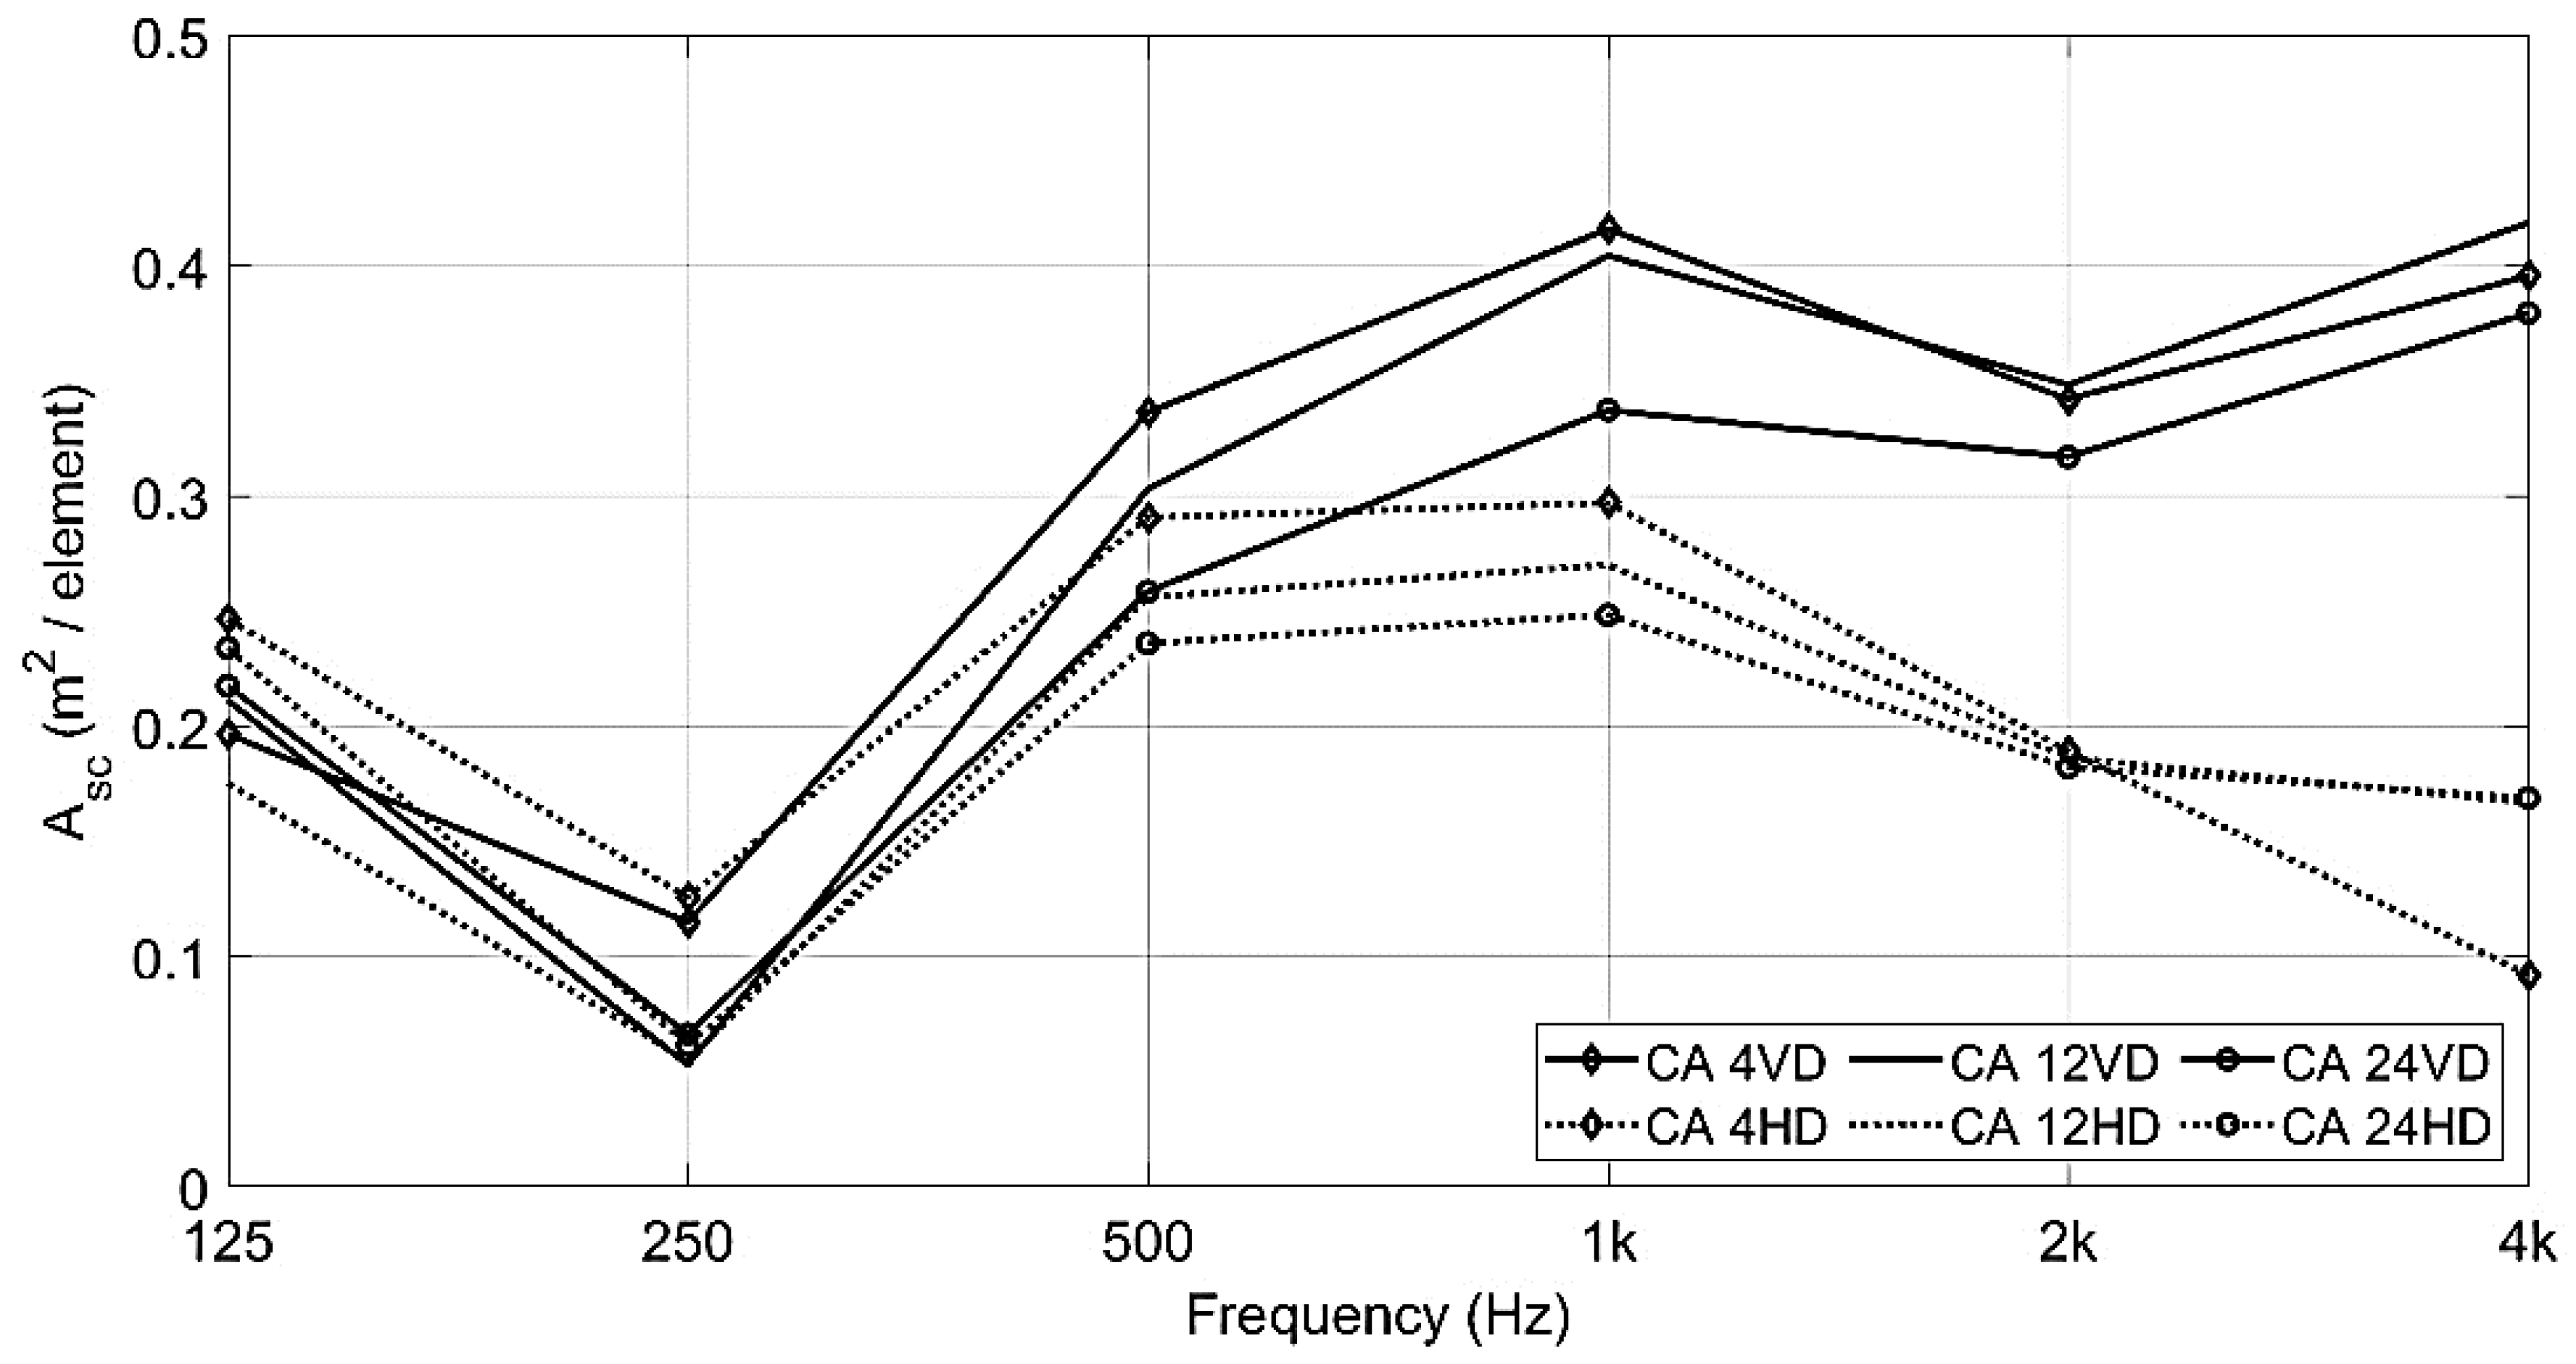
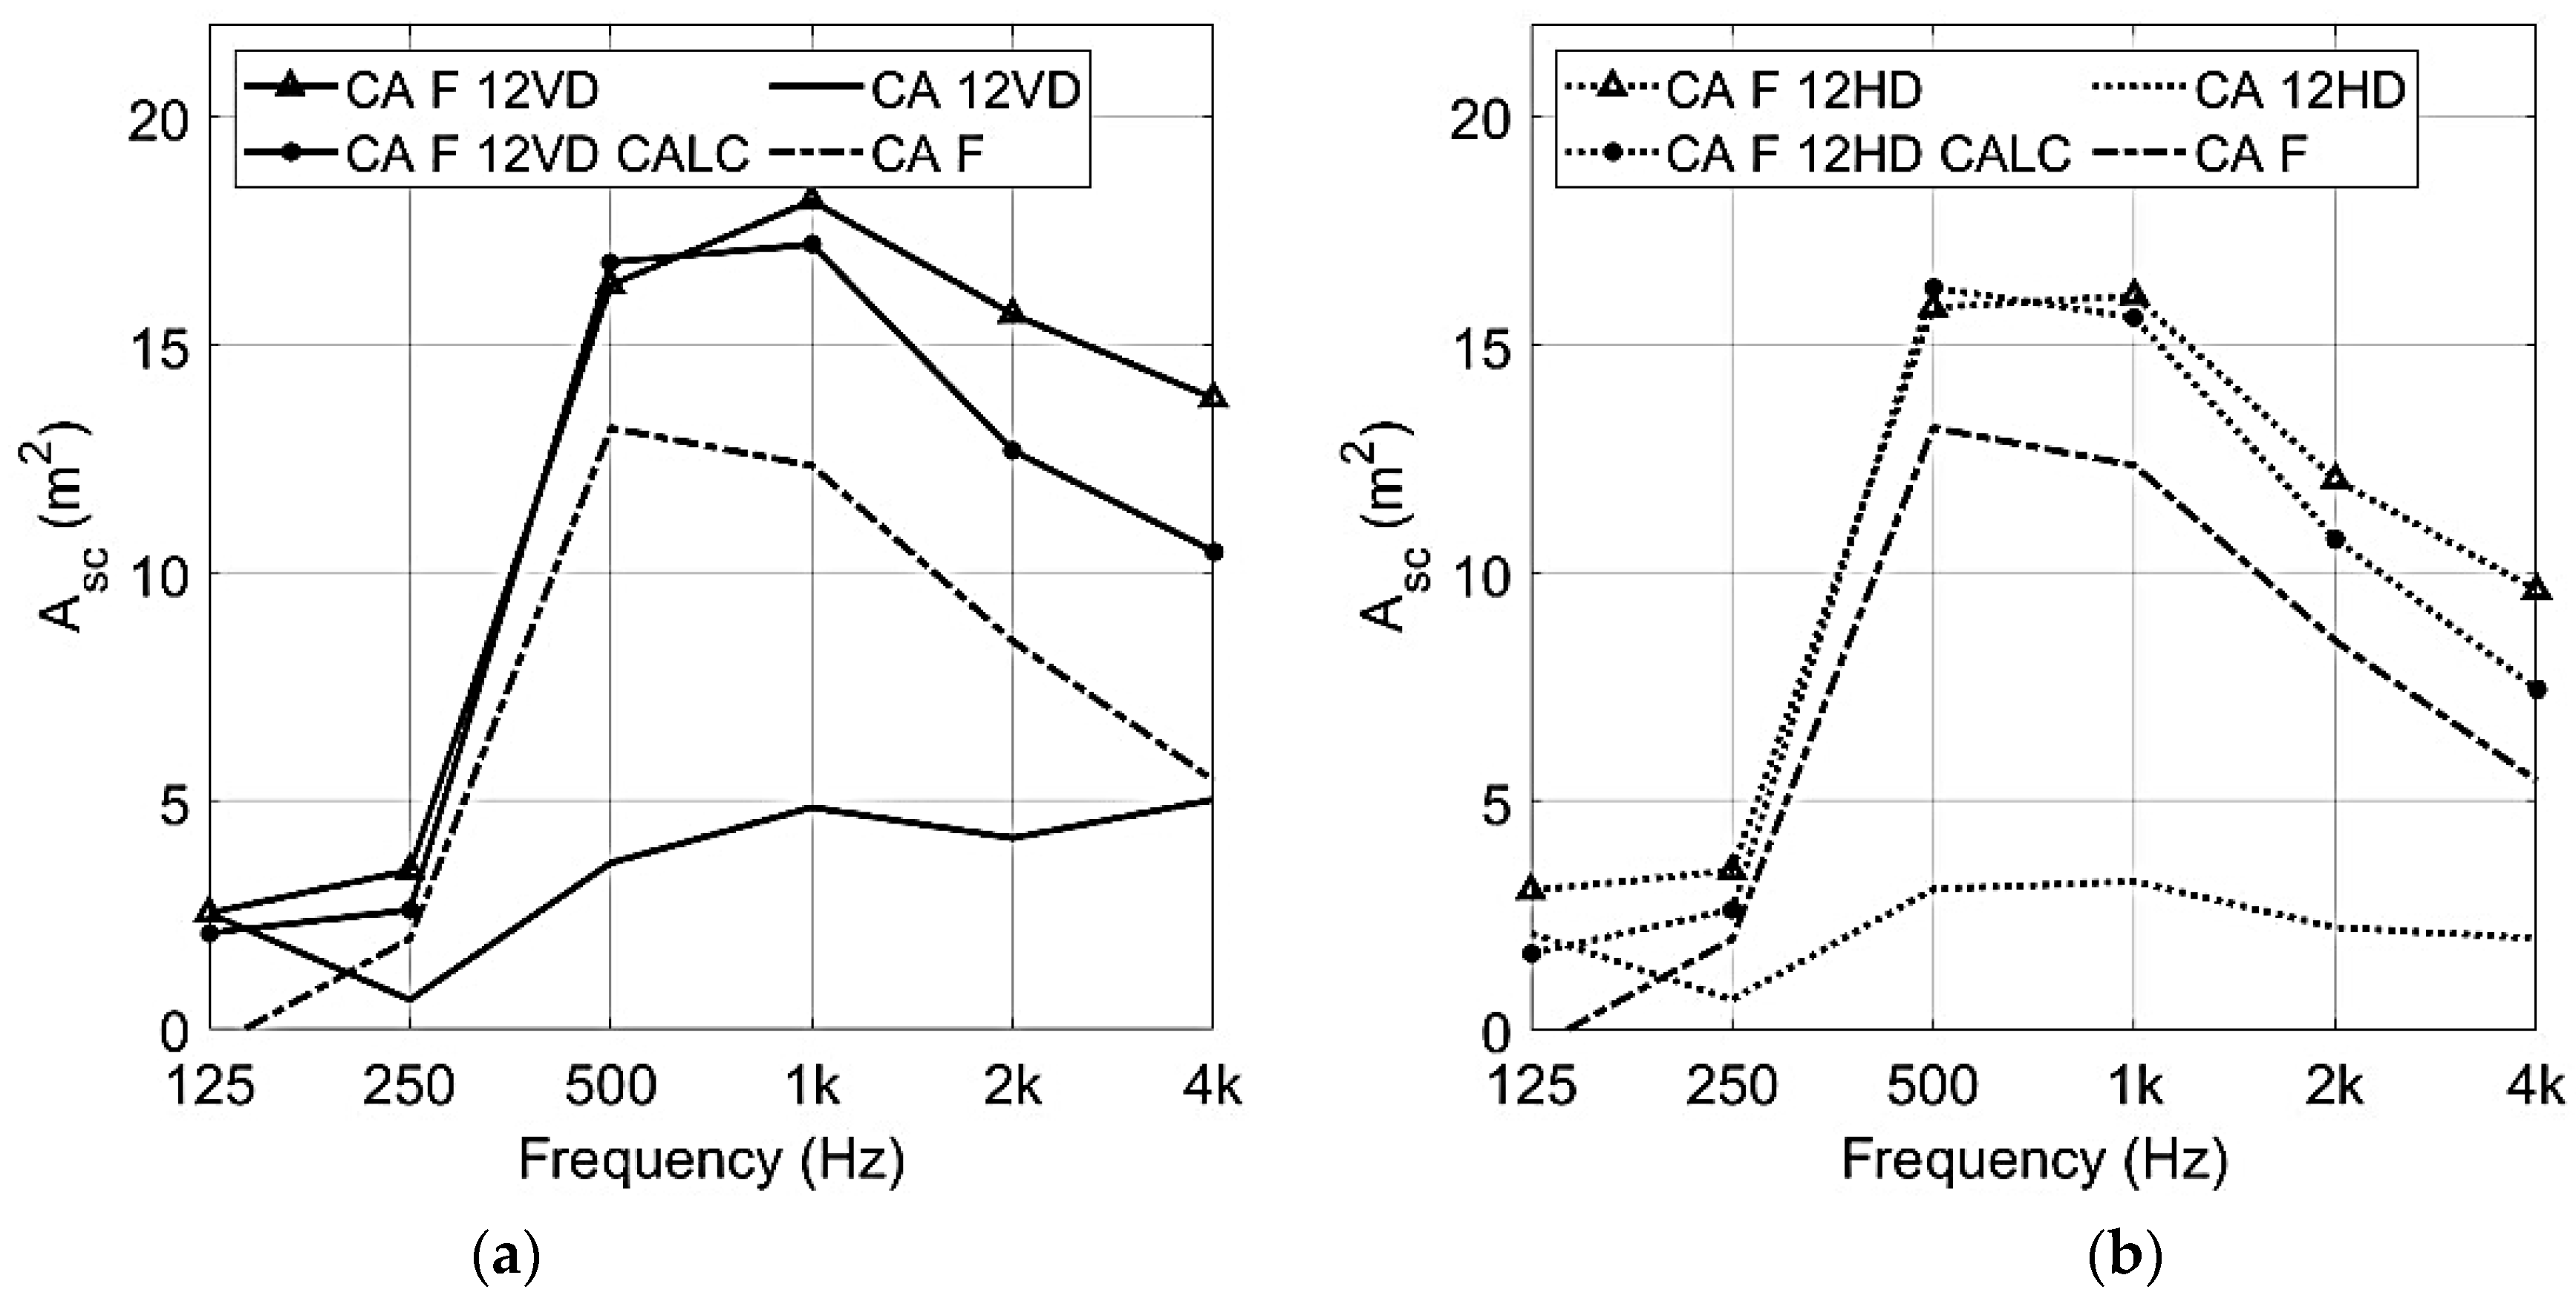
3.1. Equivalent Scattered Absorption Area Depending on the Orientation and Quantity of Diffusers
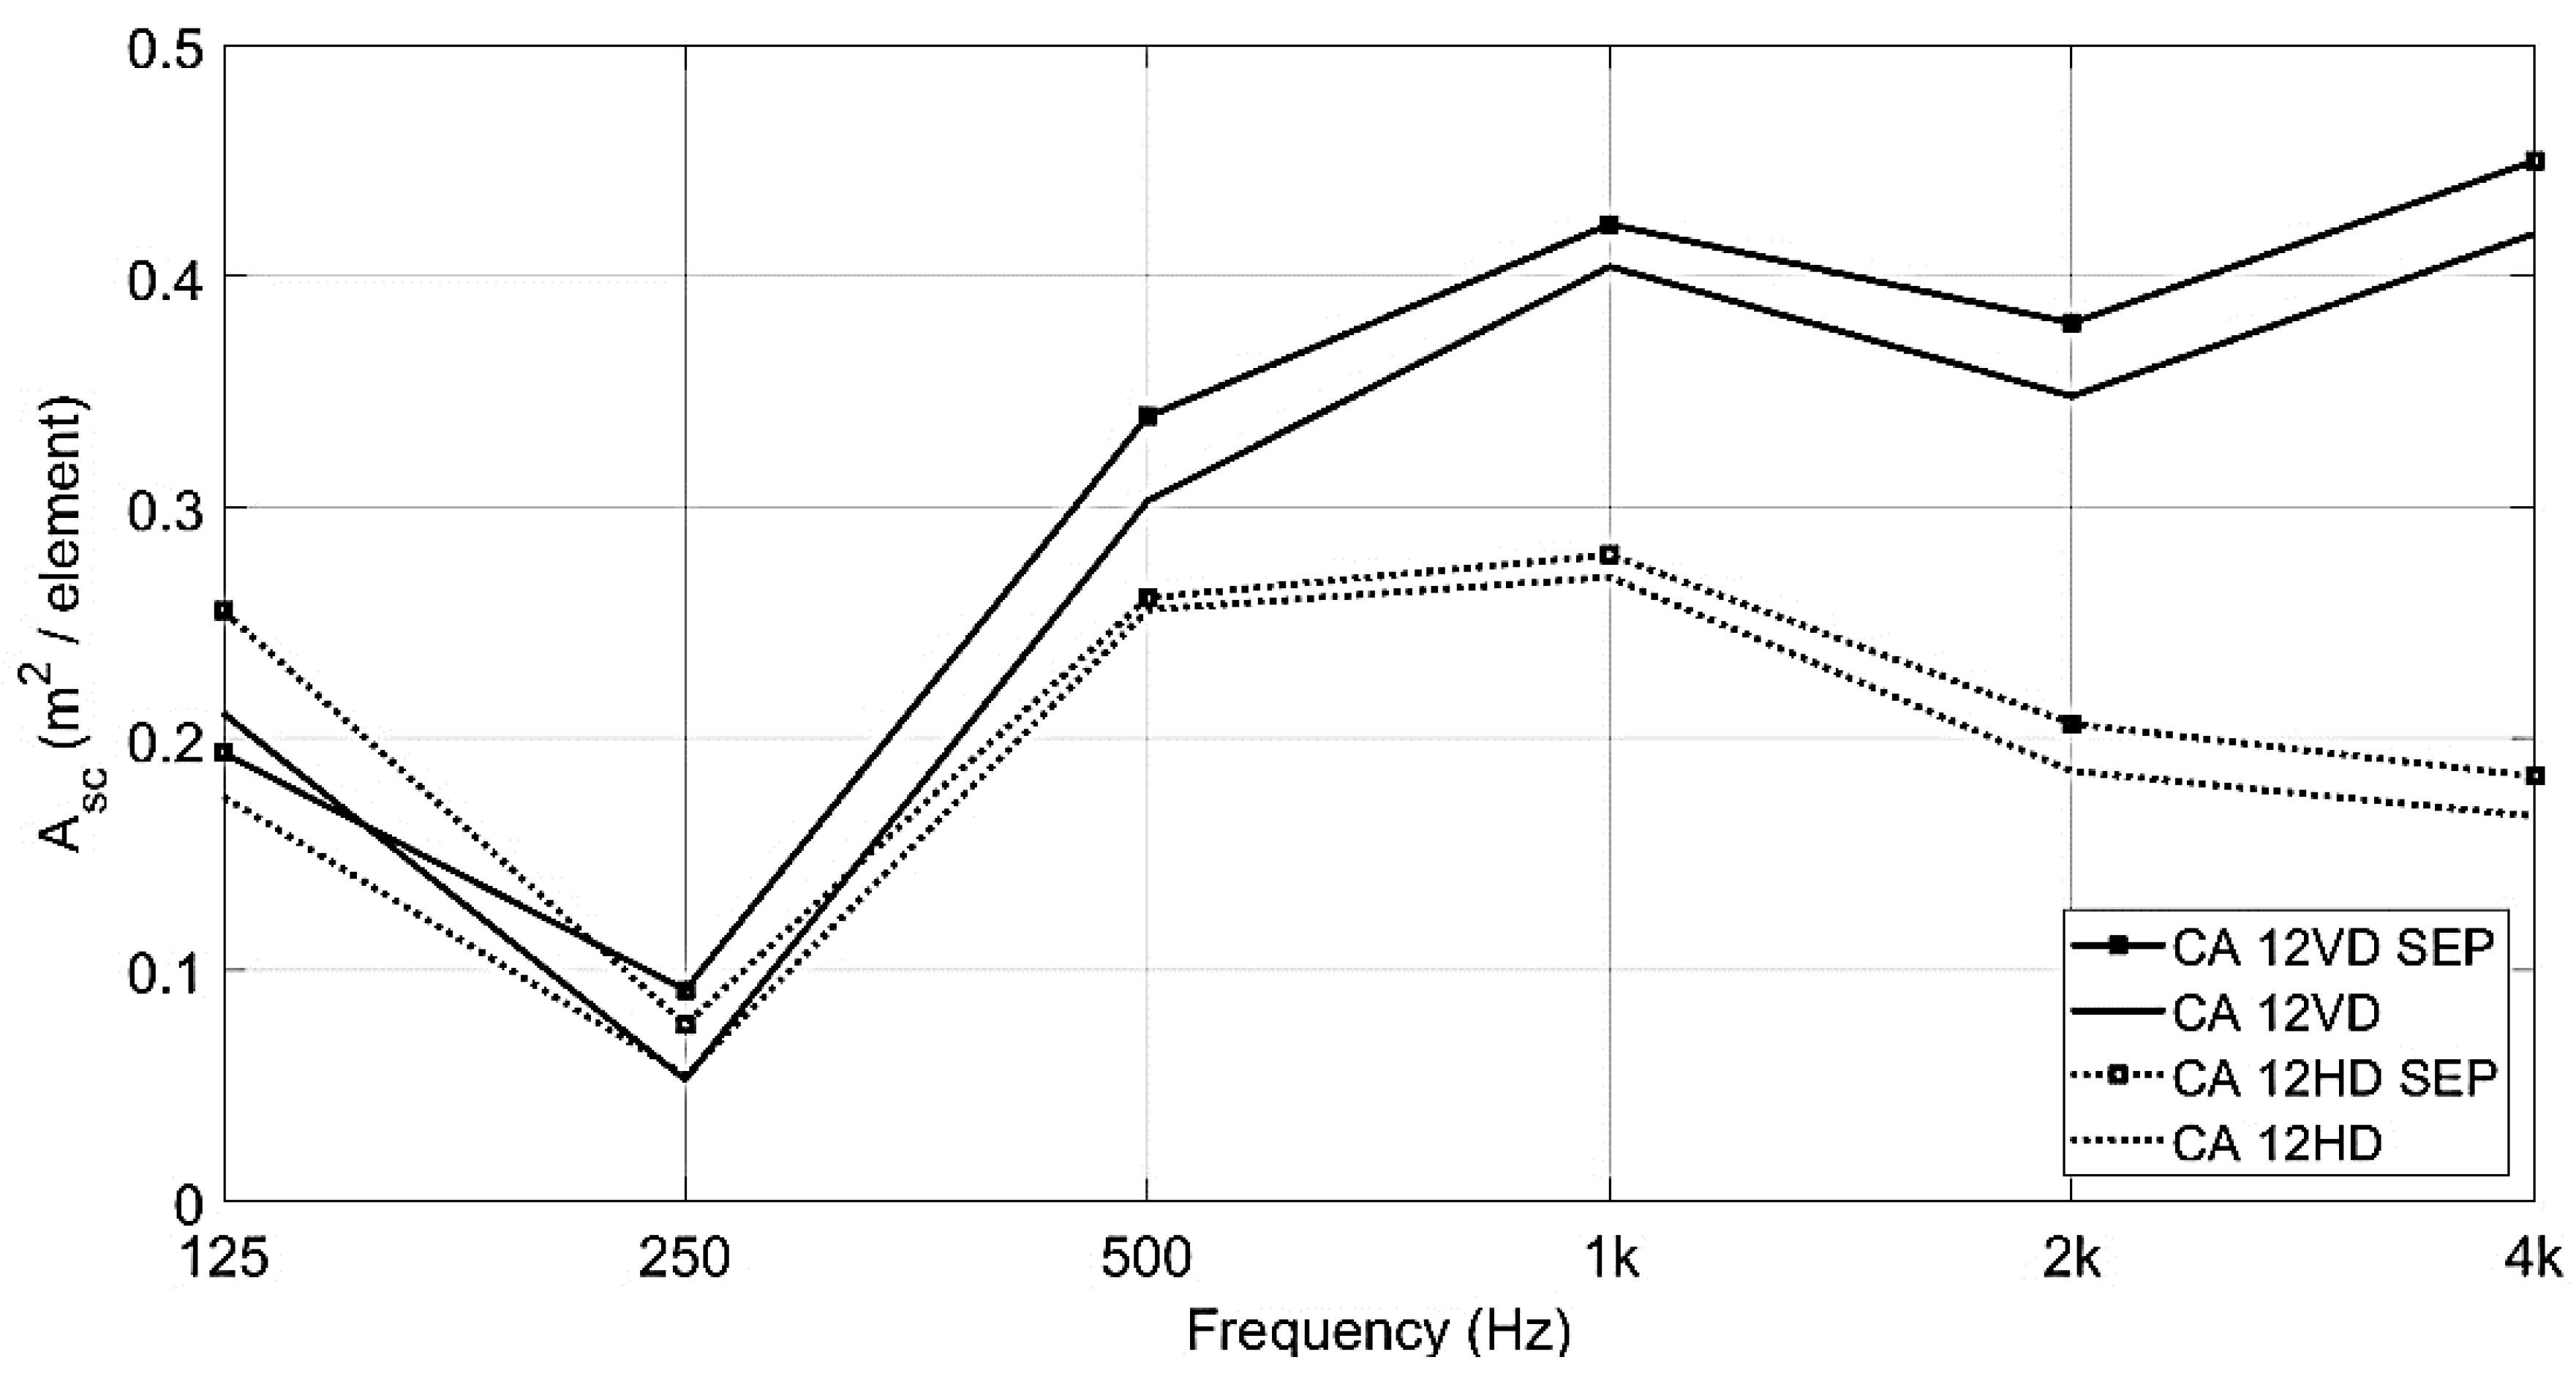
3.2. Effect of Diffuser Mounting Pattern
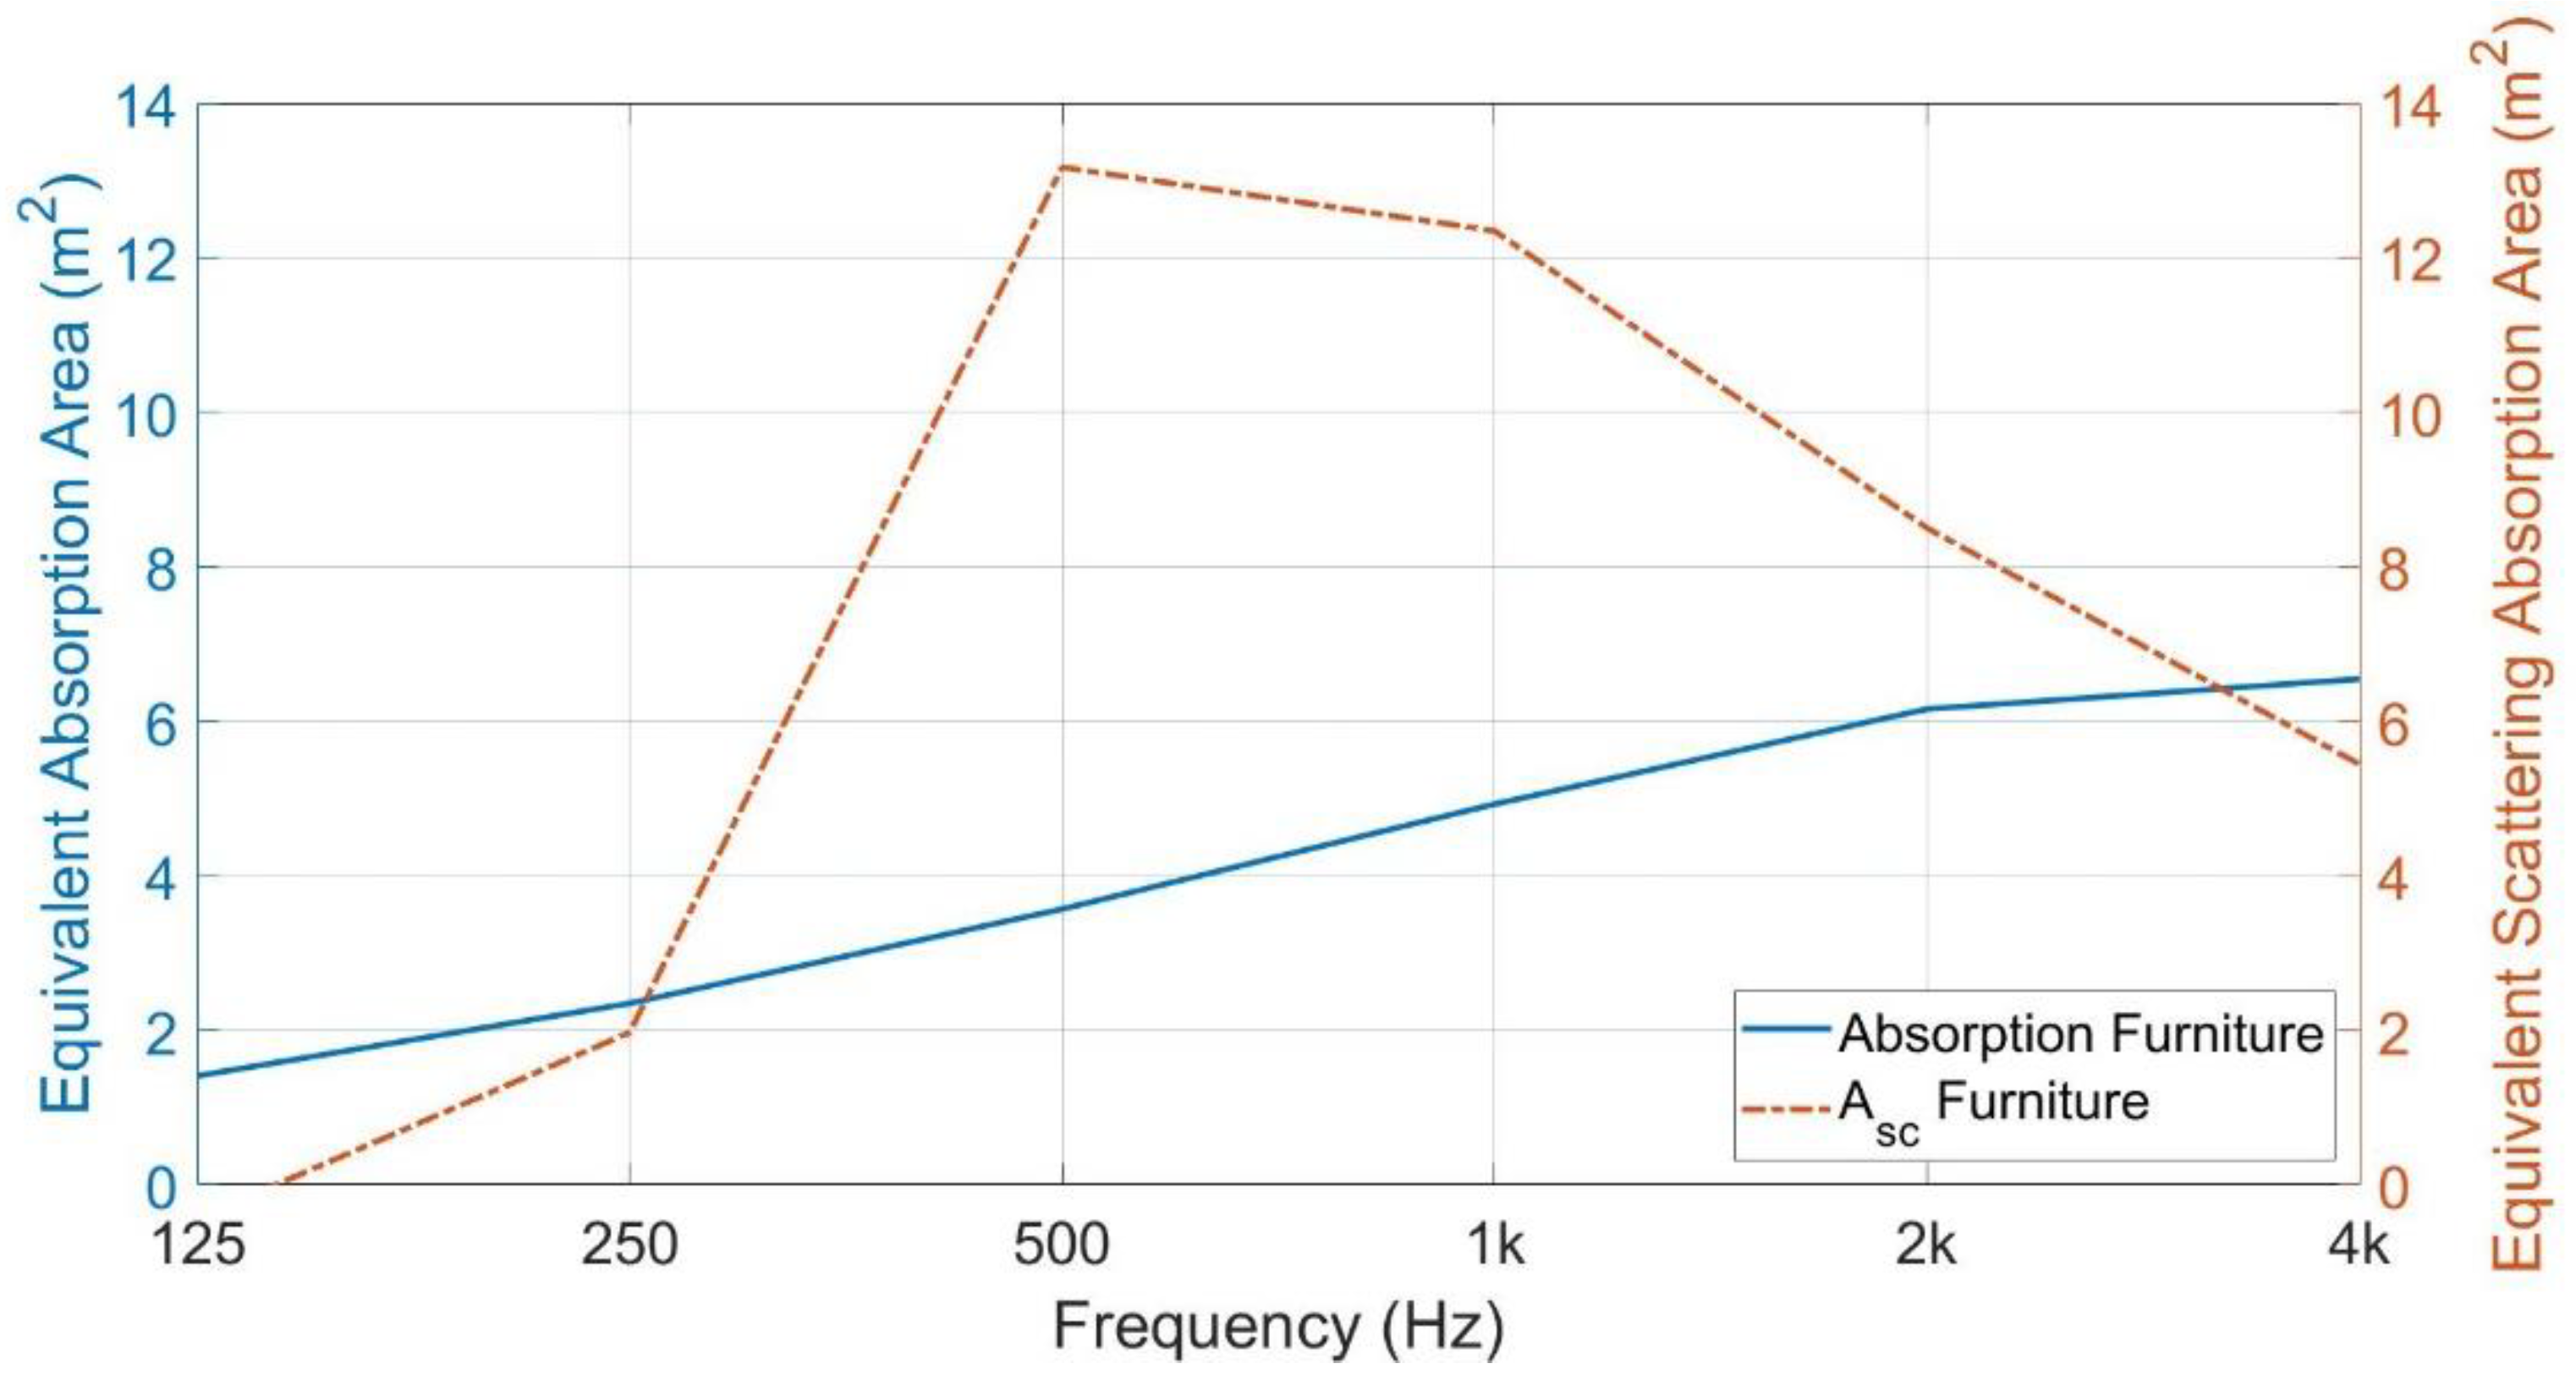
3.3. The Effect of Combining Diffusers and Furniture
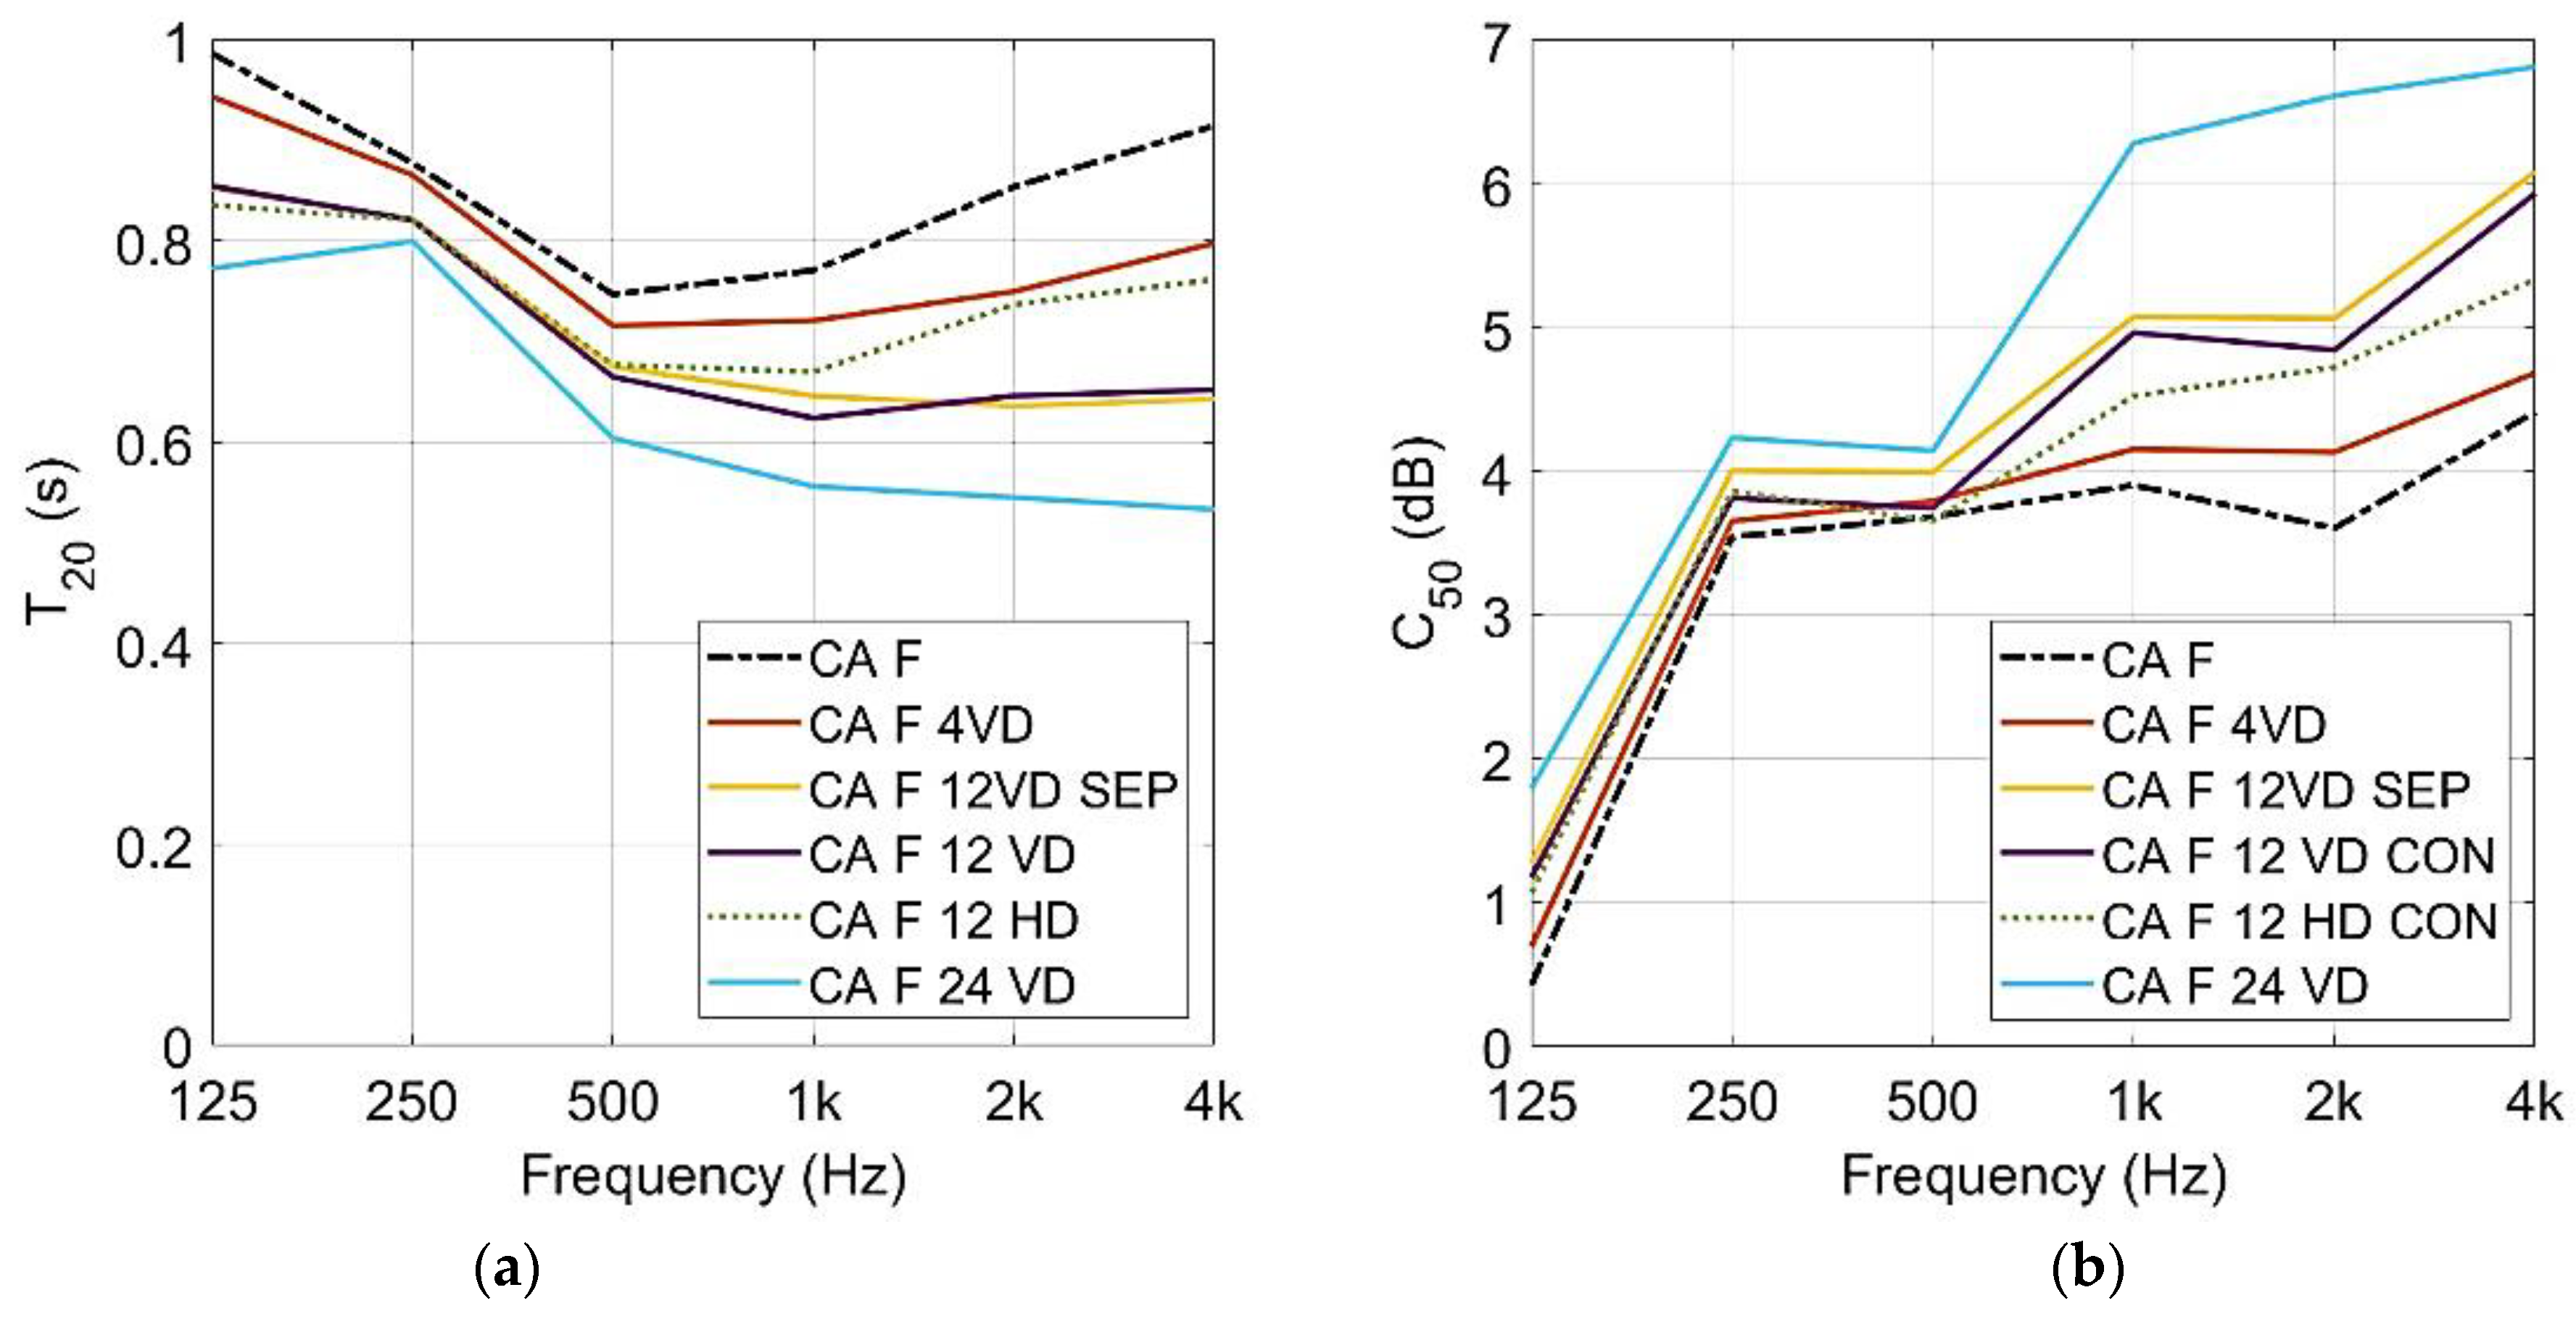
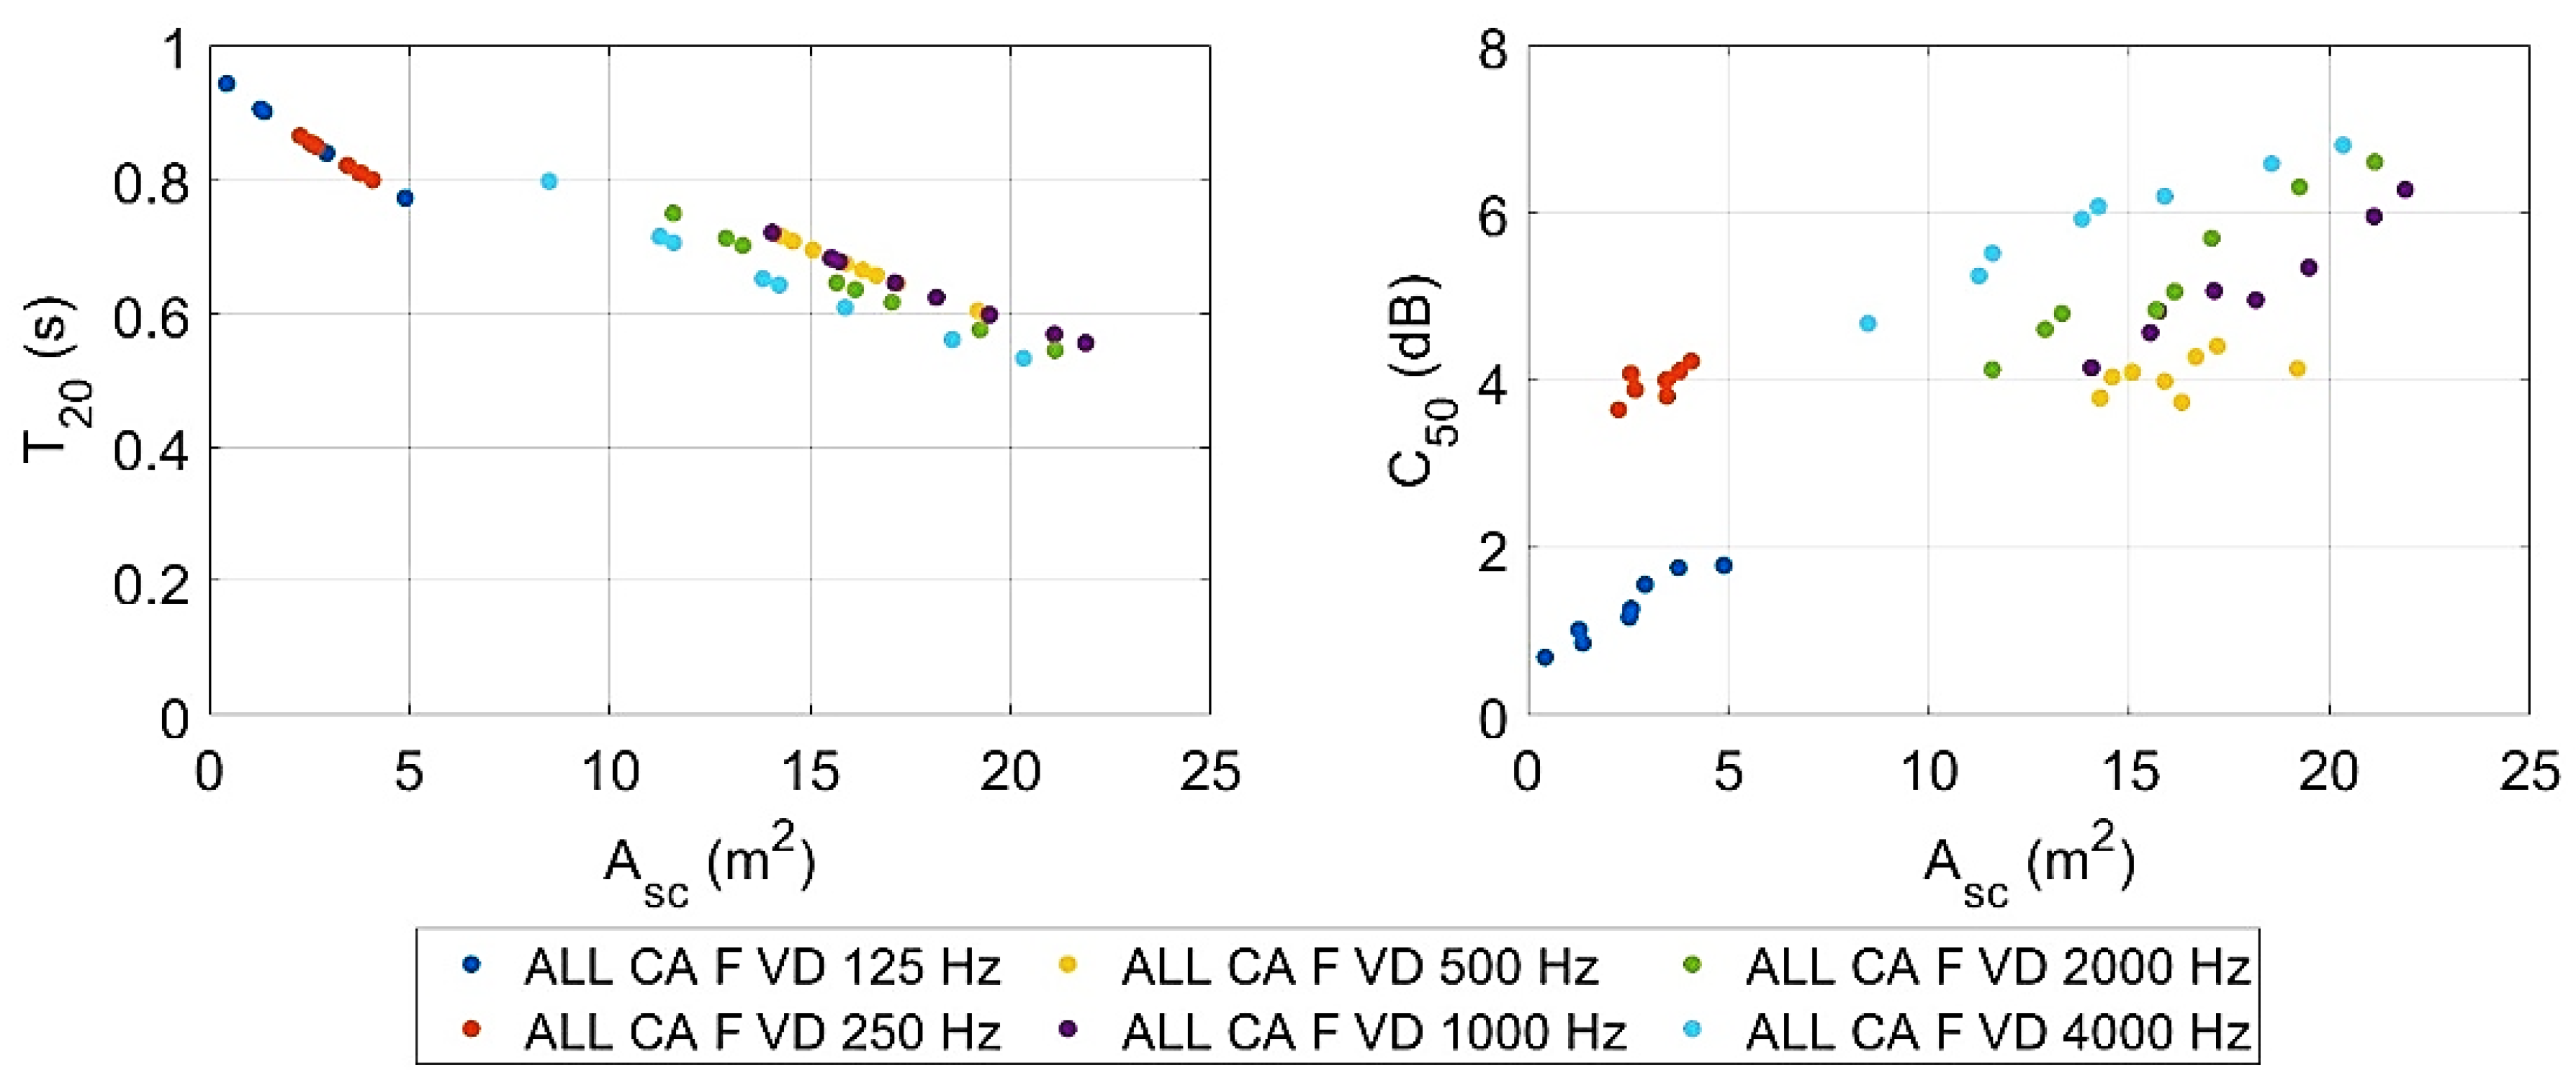
3.4. Effect on Room Acoustic Parameters
3.5. Asc in Classroom Mock-Up versus Reverberation Chamber
4. Discussion
5. Conclusions
Author Contributions
Funding
Data Availability Statement
Acknowledgments
Conflicts of Interest
Abbreviations
| Acoustic Configurations | |
| CA | Ceiling absorptive |
| F | Furniture, the room is sparsely furnished |
| VD | Vertical diffusers |
| HD | Horizontal diffusers |
| SEP | Separated diffuser pattern |
| CALC | Calculated values |
| ClR | Classroom |
| RevC | Reverberation chamber |
Appendix A

| T20 | CA | CA_4VD | CA_8VD_SEP | CA_8VD | CA_12VD_SEP | CA_12VD | CA_16VD | CA_20VD | CA_24VD | |
| Frequency [Hz] | Avg | Avg | Avg | Avg | Avg | Avg | Avg | Avg | Avg | |
| 125 | 0.965 | 0.928 | 0.886 | 0.891 | 0.863 | 0.855 | 0.84 | 0.793 | 0.763 | |
| 250 | 0.966 | 0.944 | 0.924 | 0.951 | 0.915 | 0.936 | 0.926 | 0.911 | 0.894 | |
| 500 | 1.549 | 1.396 | 1.276 | 1.29 | 1.163 | 1.195 | 1.157 | 1.083 | 1.029 | |
| 1000 | 1.545 | 1.361 | 1.218 | 1.218 | 1.094 | 1.108 | 1.058 | 0.976 | 0.932 | |
| 2000 | 1.382 | 1.257 | 1.142 | 1.151 | 1.038 | 1.06 | 1.011 | 0.93 | 0.89 | |
| 4000 | 1.24 | 1.124 | 1.005 | 1.016 | 0.917 | 0.934 | 0.881 | 0.819 | 0.778 | |
| CA | CA_4HD | CA_8HD_SEP | CA_8HD | CA_12HD_SEP | CA_12HD | CA_16HD | CA_20HD | CA_24HD | ||
| Frequency [Hz] | Avg | Avg | Avg | Avg | Avg | Avg | Avg | Avg | Avg | |
| 125 | 0.965 | 0.919 | 0.876 | 0.896 | 0.835 | 0.872 | 0.834 | 0.784 | 0.751 | |
| 250 | 0.966 | 0.942 | 0.923 | 0.944 | 0.923 | 0.935 | 0.934 | 0.913 | 0.899 | |
| 500 | 1.549 | 1.415 | 1.307 | 1.3 | 1.234 | 1.239 | 1.174 | 1.101 | 1.06 | |
| 1000 | 1.545 | 1.409 | 1.312 | 1.281 | 1.214 | 1.223 | 1.16 | 1.096 | 1.041 | |
| 2000 | 1.382 | 1.31 | 1.237 | 1.24 | 1.171 | 1.189 | 1.148 | 1.094 | 1.049 | |
| 4000 | 1.24 | 1.211 | 1.142 | 1.144 | 1.084 | 1.097 | 1.045 | 1.019 | 0.981 | |
| CA_F | CA_F_4VD | CA_F_8VD_SEP | CA_F_8VD | CA_F_12VD_SEP | CA_F_12VD | CA_F_16VD | CA_F_20VD | CA_F_24VD | ||
| Frequency [Hz] | Avg | Avg | Avg | Avg | Avg | Avg | Avg | Avg | Avg | |
| 125 | 0.987 | 0.944 | 0.906 | 0.902 | 0.853 | 0.855 | 0.84 | 0.81 | 0.773 | |
| 250 | 0.878 | 0.866 | 0.854 | 0.85 | 0.822 | 0.821 | 0.821 | 0.81 | 0.8 | |
| 500 | 0.747 | 0.716 | 0.695 | 0.708 | 0.675 | 0.665 | 0.657 | 0.645 | 0.604 | |
| 1000 | 0.771 | 0.721 | 0.678 | 0.683 | 0.646 | 0.624 | 0.598 | 0.569 | 0.556 | |
| 2000 | 0.854 | 0.75 | 0.702 | 0.713 | 0.636 | 0.646 | 0.617 | 0.576 | 0.545 | |
| 4000 | 0.915 | 0.798 | 0.715 | 0.706 | 0.643 | 0.652 | 0.609 | 0.561 | 0.533 | |
| CA_F | CA_F_4HD | CA_F_8HD_SEP | CA_F_8HD | CA_F_12HD_SEP | CA_F_12HD | CA_F_16HD | CA_F_20HD | CA_F_24HD | ||
| Frequency [Hz] | Avg | Avg | Avg | Avg | Avg | Avg | Avg | Avg | Avg | |
| 125 | 0.987 | 0.923 | 0.893 | 0.89 | 0.852 | 0.836 | 0.824 | 0.789 | 0.754 | |
| 250 | 0.878 | 0.875 | 0.845 | 0.85 | 0.833 | 0.821 | 0.816 | 0.813 | 0.794 | |
| 500 | 0.747 | 0.734 | 0.699 | 0.695 | 0.677 | 0.677 | 0.659 | 0.629 | 0.635 | |
| 1000 | 0.771 | 0.734 | 0.711 | 0.715 | 0.676 | 0.67 | 0.643 | 0.631 | 0.622 | |
| 2000 | 0.854 | 0.804 | 0.767 | 0.766 | 0.719 | 0.737 | 0.7 | 0.682 | 0.663 | |
| 4000 | 0.915 | 0.86 | 0.81 | 0.799 | 0.757 | 0.762 | 0.729 | 0.705 | 0.686 | |
| C50 | CA | CA_4VD | CA_8VD_SEP | CA_8VD | CA_12VD_SEP | CA_12VD | CA_16VD | CA_20VD | CA_24VD | |
| Frequency [Hz] | Avg | Avg | Avg | Avg | Avg | Avg | Avg | Avg | Avg | |
| 125 | 0.7 | 1.01 | 1.12 | 1.22 | 1.69 | 1.5 | 1.78 | 1.93 | 2.04 | |
| 250 | 3.23 | 3.51 | 3.2 | 3.16 | 3.13 | 3.28 | 3.03 | 3.35 | 2.96 | |
| 500 | 0.45 | 0.82 | 1.13 | 1,0 | 0.97 | 1.59 | 1.65 | 2.01 | 2.11 | |
| 1000 | 0.38 | 1.17 | 1.75 | 1.67 | 2.21 | 2.65 | 2.73 | 3.7 | 4.06 | |
| 2000 | 1.51 | 2.01 | 2.75 | 2.47 | 3.37 | 3.06 | 3.48 | 3.57 | 4.43 | |
| 4000 | 2.7 | 3.17 | 3.57 | 3.42 | 3.73 | 3.84 | 4.12 | 4.53 | 4.83 | |
| CA | CA_4HD | CA_8HD_SEP | CA_8HD | CA_12HD_SEP | CA_12HD | CA_16HD | CA_20HD | CA_24HD | ||
| Frequency [Hz] | Avg | Avg | Avg | Avg | Avg | Avg | Avg | Avg | Avg | |
| 125 | 0.7 | 0.9 | 1.33 | 1.22 | 1.53 | 1.55 | 1.98 | 2.23 | 2.43 | |
| 250 | 3.23 | 2.94 | 3.07 | 3.12 | 3.1 | 3.19 | 3.25 | 3.1 | 3.3 | |
| 500 | 0.45 | 0.6 | 1.01 | 0.91 | 1.34 | 1.12 | 1.58 | 1.57 | 2.06 | |
| 1000 | 0.38 | 1.01 | 1.12 | 1,0 | 1.74 | 1.64 | 2.06 | 2.44 | 3.16 | |
| 2000 | 1.51 | 1.91 | 2.04 | 2.08 | 2.45 | 2.44 | 2.5 | 2.66 | 3.23 | |
| 4000 | 2.7 | 2.81 | 2.91 | 3.02 | 3.22 | 3.05 | 3.19 | 3.44 | 3.82 | |
| CA_F | CA_F_4VD | CA_F_8VD_SEP | CA_F_8VD | CA_F_12VD_SEP | CA_F_12VD | CA_F_16VD | CA_F_20VD | CA_F_24VD | ||
| Frequency [Hz] | Avg | Avg | Avg | Avg | Avg | Avg | Avg | Avg | Avg | |
| 125 | 0.42 | 0.69 | 1.02 | 0.86 | 1.27 | 1.17 | 1.56 | 1.76 | 1.79 | |
| 250 | 3.54 | 3.65 | 4.08 | 3.89 | 4,0 | 3.81 | 4.01 | 4.11 | 4.23 | |
| 500 | 3.68 | 3.79 | 4.1 | 4.04 | 3.99 | 3.74 | 4.28 | 4.41 | 4.14 | |
| 1000 | 3.9 | 4.15 | 4.83 | 4.57 | 5.07 | 4.96 | 5.35 | 5.96 | 6.28 | |
| 2000 | 3.6 | 4.13 | 4.8 | 4.61 | 5.06 | 4.84 | 5.7 | 6.31 | 6.61 | |
| 4000 | 4.41 | 4.68 | 5.25 | 5.52 | 6.08 | 5.93 | 6.2 | 6.59 | 6.81 | |
| CA_F | CA_F_4HD | CA_F_8HD_SEP | CA_F_8HD | CA_F_12HD_SEP | CA_F_12HD | CA_F_16HD | CA_F_20HD | CA_F_24HD | ||
| Frequency [Hz] | Avg | Avg | Avg | Avg | Avg | Avg | Avg | Avg | Avg | |
| 125 | 0.42 | 0.6 | 1.14 | 0.8 | 1.27 | 1.06 | 1.58 | 1.65 | 1.96 | |
| 250 | 3.54 | 4.05 | 3.81 | 3.59 | 4.16 | 3.86 | 4.07 | 4.32 | 4.25 | |
| 500 | 3.68 | 3.66 | 4.18 | 4.05 | 4.31 | 3.65 | 3.96 | 4.05 | 3.94 | |
| 1000 | 3.9 | 4.16 | 4.71 | 4.44 | 4.92 | 4.52 | 4.52 | 4.86 | 5.3 | |
| 2000 | 3.6 | 4.26 | 4.05 | 4.23 | 4.3 | 4.72 | 4.74 | 4.99 | 5.16 | |
| 4000 | 4.41 | 4.55 | 4.35 | 4.74 | 4.83 | 5.33 | 4.87 | 5.4 | 5.42 | |
| Asc | Frequency [Hz] | CA | CA_4VD | CA_8VD_SEP | CA_8VD | CA_12VD_SEP | CA_12VD | CA_16VD | CA_20VD | CA_24VD |
| 125 | 0.0 | 0.8 | 1.8 | 1.6 | 2.3 | 2.5 | 2.9 | 4.3 | 5.2 | |
| 250 | 0.0 | 0.5 | 0.9 | 0.3 | 1.1 | 0.6 | 0.8 | 1.2 | 1.6 | |
| 500 | 0.0 | 1.3 | 2.6 | 2.5 | 4.1 | 3.6 | 4.2 | 5.3 | 6.2 | |
| 1000 | 0.0 | 1.7 | 3.3 | 3.3 | 5.1 | 4.9 | 5.7 | 7.2 | 8.1 | |
| 2000 | 0.0 | 1.4 | 2.9 | 2.8 | 4.6 | 4.2 | 5.0 | 6.7 | 7.6 | |
| 4000 | 0.0 | 1.6 | 3.6 | 3.4 | 5.4 | 5.0 | 6.2 | 7.9 | 9.1 | |
| Frequency [Hz] | CA | CA_4HD | CA_8HD_SEP | CA_8HD | CA_12HD_SEP | CA_12HD | CA_16HD | CA_20HD | CA_24HD | |
| 125 | 0.0 | 1.0 | 2.0 | 1.5 | 3.1 | 2.1 | 3.1 | 4.5 | 5.6 | |
| 250 | 0.0 | 0.5 | 0.9 | 0.5 | 0.9 | 0.7 | 0.7 | 1.1 | 1.5 | |
| 500 | 0.0 | 1.2 | 2.3 | 2.3 | 3.1 | 3.1 | 3.9 | 5.0 | 5.7 | |
| 1000 | 0.0 | 1.2 | 2.2 | 2.5 | 3.4 | 3.2 | 4.1 | 5.0 | 6.0 | |
| 2000 | 0.0 | 0.8 | 1.6 | 1.6 | 2.5 | 2.2 | 2.8 | 3.6 | 4.4 | |
| 4000 | 0.0 | 0.4 | 1.3 | 1.3 | 2.2 | 2.0 | 2.9 | 3.3 | 4.0 | |
| Frequency [Hz] | CA_F | CA_F_4VD | CA_F_8VD_SEP | CA_F_8VD | CA_F_12VD_SEP | CA_F_12VD | CA_F_16VD | CA_F_20VD | CA_F_24VD | |
| 125 | −0.4 | 0.4 | 1.3 | 1.4 | 2.6 | 2.5 | 2.9 | 3.8 | 4.9 | |
| 250 | 2.0 | 2.3 | 2.6 | 2.7 | 3.4 | 3.5 | 3.5 | 3.8 | 4.1 | |
| 500 | 13.2 | 14.3 | 15.1 | 14.6 | 15.9 | 16.3 | 16.7 | 17.2 | 19.2 | |
| 1000 | 12.3 | 14.1 | 15.7 | 15.5 | 17.1 | 18.2 | 19.5 | 21.1 | 21.9 | |
| 2000 | 8.5 | 11.6 | 13.3 | 12.9 | 16.1 | 15.7 | 17.0 | 19.2 | 21.1 | |
| 4000 | 5.4 | 8.5 | 11.3 | 11.6 | 14.2 | 13.8 | 15.9 | 18.5 | 20.3 | |
| Frequency [Hz] | CA_F | CA_F_4HD | CA_F_8HD_SEP | CA_F_8HD | CA_F_12HD_SEP | CA_F_12HD | CA_F_16HD | CA_F_20HD | CA_F_24HD | |
| 125 | −0.4 | 1.3 | 2.0 | 2.1 | 3.1 | 3.5 | 3.8 | 4.8 | 5.9 | |
| 250 | 2.0 | 0.1 | 0.8 | 0.7 | 1.2 | 1.5 | 1.6 | 1.7 | 2.3 | |
| 500 | 13.2 | 0.5 | 1.7 | 1.9 | 2.6 | 2.6 | 3.4 | 4.8 | 4.5 | |
| 1000 | 12.3 | 1.2 | 2.1 | 1.9 | 3.5 | 3.7 | 4.9 | 5.5 | 5.9 | |
| 2000 | 8.5 | 1.4 | 2.5 | 2.6 | 4.2 | 3.5 | 4.9 | 5.6 | 6.4 | |
| 4000 | 5.4 | 1.3 | 2.7 | 3.0 | 4.3 | 4.2 | 5.3 | 6.2 | 6.9 |
References
- Arvidsson, E.; Nilsson, E.; Bard Hagberg, D.; Karlsson, O.J.I. The effect on room acoustical parameters using a combination of absorbers and Diffusers—An experimental study in a classroom. Acoustics 2020, 2, 505–523. [Google Scholar] [CrossRef]
- Arvidsson, E.; Nilsson, E.; Bard Hagberg, D.; Karlsson, O.J.I. The difference in subjective experience related to acoustic treatments in an ordinary public room: A case study. Acoustics 2021, 3, 442–461. [Google Scholar] [CrossRef]
- Erling, N.; Emma, A. An energy model for the calculation of room acoustic parameters in rectangular rooms with absorbent ceilings. Appl. Sci. 2021, 11, 6607. [Google Scholar]
- Lochner, J.P.A.; Burger, J.F. The influence of reflections on auditorium acoustics. J. Sound Vib. 1964, 1, 426–454. [Google Scholar] [CrossRef]
- Bradley, J.S.; Sato, H.; Picard, M. On the importance of early reflections for speech in rooms. J. Acoust. Soc. Am. 2003, 113, 3233–3244. [Google Scholar] [CrossRef] [Green Version]
- Sato, H.; Morimoto, M.; Wada, M. Relationship between listening difficulty rating and objective measures in reverberant and noisy sound fields for young adults and elderly persons. J. Acoust. Soc. Am. 2012, 131, 4596–4605. [Google Scholar] [CrossRef] [Green Version]
- Sato, H.; Bradley, J.S.; Morimoto, M. Using listening difficulty ratings of conditions for speech communication in rooms. J. Acoust. Soc. Am. 2005, 117, 1157–1167. [Google Scholar] [CrossRef]
- Sato, H.; Bradley, J. Evaluation of acoustical conditions for speech communication in working elementary school classrooms. J. Acoust. Soc. Am. 2008, 123, 2064–2077. [Google Scholar] [CrossRef] [Green Version]
- Yang, W.; Bradley, J. Effects of room acoustics on the intelligibility of speech in classrooms for young children. J. Acoust. Soc. Am. 2009, 125, 922–933. [Google Scholar] [CrossRef] [Green Version]
- Sato, H.; Morimoto, M.; Sato, H.; Wada, M. Relationship between listening difficulty and acoustical objective measures in reverberant sound fields. J. Acoust. Soc. Am. 2008, 123, 2087–2093. [Google Scholar] [CrossRef] [Green Version]
- Puglisi, G.E.; Prato, A.; Sacco, T.; Astolfi, A. Influence of classroom acoustics on the reading speed: A case study on Italian second-graders. J. Acoust. Soc. Am. 2018, 144, 144–149. [Google Scholar] [CrossRef]
- Bradley, J.S.; Reich, R.D.; Norcross, S.G. On the combined effects of signal-to-noise ratio and room acoustics on speech intelligibility. J. Acoust. Soc. Am. 1999, 106, 1820–1828. [Google Scholar] [CrossRef]
- Barron, M.; Lee, L.-J. Energy relations in concert auditoriums. I. J. Acoust. Soc. Am. 1988, 84, 618–628. [Google Scholar] [CrossRef]
- Barron, M. Theory and measurement of early, late and total sound levels in rooms. J. Acoust. Soc. Am. 2015, 137, 3087–3098. [Google Scholar] [CrossRef] [PubMed]
- Beranek, L. The sound strength parameter G and its importance in evaluating and planning the acoustics of halls for music. J. Acoust. Soc. Am. 2011, 129, 3020–3026. [Google Scholar] [CrossRef]
- Kjellberg, A.; Ljung, R.; Hallman, D. Recall of words heard in noise. Appl. Cogn. Psychol. 2008, 22, 1088–1098. [Google Scholar] [CrossRef]
- Ljung, R.; Kjellberg, A. Long reverberation time decreases recall of spoken information. Build. Acoust. 2009, 16, 301–311. [Google Scholar] [CrossRef]
- Ljung, R.; Israelsson, K.; Hygge, S. Speech intelligibility and recall of spoken material heard at different signal-to-noise ratios and the role played by working memory capacity. Appl. Cogn. Psychol. 2013, 27, 198–203. [Google Scholar] [CrossRef]
- Cucharero, J.; Hänninen, T.; Lokki, T. Influence of sound-absorbing material placement on room acoustical parameters. Acoustics 2019, 1, 644–660. [Google Scholar] [CrossRef] [Green Version]
- Berardi, U.; Iannace, G.; Trematerra, A. Acoustic treatments aiming to achieve the Italian minimum environmental criteria (cam) standards in large reverberant. Can. Acoust. 2019, 47, 73–80. [Google Scholar]
- Cucharero, J.; Hänninen, T.; Lokki, T. Angle-dependent absorption of sound on porous materials. Acoustics 2020, 2, 753–765. [Google Scholar] [CrossRef]
- Nolan, M.; Verburg, S.A.; Brunskog, J.; Fernandez-Grande, E. Experimental characterization of the sound field in a reverberation room. J. Acoust. Soc. Am. 2019, 145, 2237–2246. [Google Scholar] [CrossRef] [PubMed] [Green Version]
- Nolan, M. Estimation of angle-dependent absorption coefficients from spatially distributed in situ measurements. J. Acoust. Soc. Am. 2020, 147, 119–124. [Google Scholar] [CrossRef] [Green Version]
- Cox, T.J.; D’Antonio, P. Acoustic Absorbers and Diffusers, 3rd ed.; Taylor & Francis: Boca Raton, FL, USA, 2017. [Google Scholar]
- Choi, Y.J. Effects of periodic type diffusers on classroom acoustics. Appl. Acoust. 2013, 74, 694–707. [Google Scholar] [CrossRef]
- Choi, Y.J. The application of diffusers for classroom acoustical design. Noise Vib. Worldw. 2014, 45, 8–16. [Google Scholar] [CrossRef]
- Choi, Y.J. An optimum combination of absorptive and diffusing treatments for classroom acoustic design. Build. Acoust. 2014, 21, 175–180. [Google Scholar] [CrossRef]
- Choi, Y.J. Predicting classroom acoustical parameters for occupied conditions from unoccupied data. Appl. Acoust. 2017, 127, 89–94. [Google Scholar] [CrossRef]
- Labia, L.; Shtrepi, L.; Astolfi, A. Improved room acoustics quality in meeting rooms: Investigation on the optimal configurations of sound-absorptive and sound-diffusive panels. Acoustics 2020, 2, 451–473. [Google Scholar] [CrossRef]
- ISO. ISO 3382-1:2009. In Acoustics—Measurement of Room Acoustic Parameters—Part 1: Performance Spaces; ISO: Geneva, Switzerland, 2009. [Google Scholar]
- Bradley, J.S.; Reich, R.; Norcross, S.G. A just noticeable difference in C50 for speech. Appl. Acoust. 1999, 58, 99–108. [Google Scholar] [CrossRef]
- Visentin, C.; Pellegatti, M.; Prodi, N. Effect of a single lateral diffuse reflection on spatial percepts and speech intelligibility. J. Acoust. Soc. Am. 2020, 148, 122–140. [Google Scholar] [CrossRef]
- Shtrepi, L.; Di Blasio, S.; Astolfi, A. Listeners sensitivity to different locations of diffusive surfaces in performance spaces: The case of a shoebox concert hall. Appl. Sci. 2020, 10, 4370. [Google Scholar] [CrossRef]
- Shtrepi, L.; Astolfi, A.; D’Antonio, G.; Guski, M. Objective and perceptual evaluation of distance-dependent scattered sound effects in a small variable-acoustics hall. J. Acoust. Soc. Am. 2016, 140, 3651–3662. [Google Scholar] [CrossRef] [PubMed]
- Shtrepi, L.; Astolfi, A.; Puglisi, G.; Masoero, M. Effects of the distance from a diffusive surface on the objective and perceptual evaluation of the sound field in a small simulated variable-acoustics hall. Appl. Sci. 2017, 7, 224. [Google Scholar] [CrossRef] [Green Version]
- Lyon, R.H.; De Jong, R.G. Theory and Application of Statistical Energy Analysis, 2nd ed.; RH Lyon Corp: Cambridge, MA, USA, 1998. [Google Scholar]
- Vigran, T.E. Building Acoustics; Taylor & Francis: New York, NY, USA, 2008. [Google Scholar]
- Prodi, N.; Visentin, C. An experimental evaluation of the impact of scattering on sound field diffusivity. J. Acoust. Soc. Am. 2013, 133, 810–820. [Google Scholar] [CrossRef] [PubMed]
- EN 12354-6:2004. Building Acoustics, Estimation of Acoustic Performance of Buildings from the Performance of Elements—Part 6: Sound Absorption in Enclosed Spaces; CEN: Brussels, Belgium, 2004. [Google Scholar]
- Nilsson, E. Input data for acoustical design calculations for ordinary public rooms. In Proceedings of the 24th International Congress on Sound and Vibration, London, UK, 23–27 July 2017. [Google Scholar]
- ISO. ISO 9053-2:2020 Acoustics—Determination of Airflow Resistance—Part 2: Alternating Airflow Method; ISO: Geneva, Switzerland, 2020. [Google Scholar]
- ISO. ISO 354:2003: Acoustics. Measurement of Sound Absorption in a Reverberation Room; ISO: Geneva, Switzerland, 2003. [Google Scholar]
- ISO. ISO 11654:1997 Acoustics—Sound Absorbers for Use in Buildings—Rating of Sound Absorption; ISO: Geneva, Switzerland, 1997. [Google Scholar]
- ISO. ISO 3382-2:2008 Acoustics—Measurements of Room Acoustic Parameters—Part 2: Reverberation Time in Ordinary Rooms; ISO: Geneva, Switzerland, 2008. [Google Scholar]


| Conf. | Conf. Abbreviation | Configuration Description | Conf. | Conf. Abbreviation | Configuration Description |
|---|---|---|---|---|---|
| 1 | CA | 52 m2 Ceiling absorbers | 18 | CA_F | Conf 1 + furniture |
| 2 | CA_4VD | Conf 1 + 4 vertical diffusers | 19 | CA_F_4VD | Conf 2 + furniture |
| 3 | CA_4HD | Conf 1 + 4 horizontal diffusers | 20 | CA_F_4HD | Conf 3 + furniture |
| 4 | CA_8VD_SEP | Conf 1 + 8 vertical diffusers, separated | 21 | CA_F_8VD_SEP | Conf 4 + furniture |
| 5 | CA_8VD | Conf 1 + 8 vertical diffusers, connected | 22 | CA_F_8VD | Conf 5 + furniture |
| 6 | CA_8HD_SEP | Conf 1 + 8 horizontal diffusers, separated | 23 | CA_F_8HD_SEP | Conf 6 + furniture |
| 7 | CA_8HD | Conf 1 + 8 horizontal diffusers, connected | 24 | CA_F_8HD | Conf 7 + furniture |
| 8 | CA_12VD_SEP | Conf 1 + 12 vertical diffusers, separated | 25 | CA_F_12VD_SEP | Conf 8 + furniture |
| 9 | CA_12VD | Conf 1 + 12 vertical diffusers, connected | 26 | CA_F_12VD | Conf 9 + furniture |
| 10 | CA_12HD_SEP | Conf 1 + 12 horizontal diffusers, separated | 27 | CA_F_12HD_SEP | Conf 10 + furniture |
| 11 | CA_12HD | Conf 1 + 12 horizontal diffusers, connected | 28 | CA_F_12HD | Conf 11 + furniture |
| 12 | CA_16VD | Conf 1 + 16 vertical diffusers, connected | 29 | CA_F_16VD | Conf 12 + furniture |
| 13 | CA_16HD | Conf 1 + 16 horizontal diffusers, connected | 30 | CA_F_16HD | Conf 13 + furniture |
| 14 | CA_20VD | Conf 1 + 20 vertical diffusers, connected | 31 | CA_F_20VD | Conf 14 + furniture |
| 15 | CA_20HD | Conf 1 + 20 horizontal diffusers, connected | 32 | CA_F_20HD | Conf 15 + furniture |
| 16 | CA_24VD | Conf 1 + 24 vertical diffusers, connected | 33 | CA_F_24VD | Conf 16 + furniture |
| 17 | CA_24HD | Conf 1 + 24 horizontal diffusers, connected | 34 | CA_F_24HD | Conf 17 + Furniture |
| T20,avg (s) | C50,avg (dB) | |
|---|---|---|
| 125 Hz | ±0.077 | ±0.56 |
| 250 Hz | ±0.018 | ±0.29 |
| 500 Hz | ±0.010 | ±0.29 |
| 1000 Hz | ±0.006 | ±0.27 |
| 2000 Hz | ±0.010 | ±0.38 |
| 4000 Hz | ±0.008 | ±0.36 |
Publisher’s Note: MDPI stays neutral with regard to jurisdictional claims in published maps and institutional affiliations. |
© 2021 by the authors. Licensee MDPI, Basel, Switzerland. This article is an open access article distributed under the terms and conditions of the Creative Commons Attribution (CC BY) license (https://creativecommons.org/licenses/by/4.0/).
Share and Cite
Arvidsson, E.; Nilsson, E.; Bard Hagberg, D.; Karlsson, O.J.I. Quantification of the Absorption and Scattering Effects of Diffusers in a Room with Absorbent Ceiling. Buildings 2021, 11, 612. https://doi.org/10.3390/buildings11120612
Arvidsson E, Nilsson E, Bard Hagberg D, Karlsson OJI. Quantification of the Absorption and Scattering Effects of Diffusers in a Room with Absorbent Ceiling. Buildings. 2021; 11(12):612. https://doi.org/10.3390/buildings11120612
Chicago/Turabian StyleArvidsson, Emma, Erling Nilsson, Delphine Bard Hagberg, and Ola J. I. Karlsson. 2021. "Quantification of the Absorption and Scattering Effects of Diffusers in a Room with Absorbent Ceiling" Buildings 11, no. 12: 612. https://doi.org/10.3390/buildings11120612
APA StyleArvidsson, E., Nilsson, E., Bard Hagberg, D., & Karlsson, O. J. I. (2021). Quantification of the Absorption and Scattering Effects of Diffusers in a Room with Absorbent Ceiling. Buildings, 11(12), 612. https://doi.org/10.3390/buildings11120612