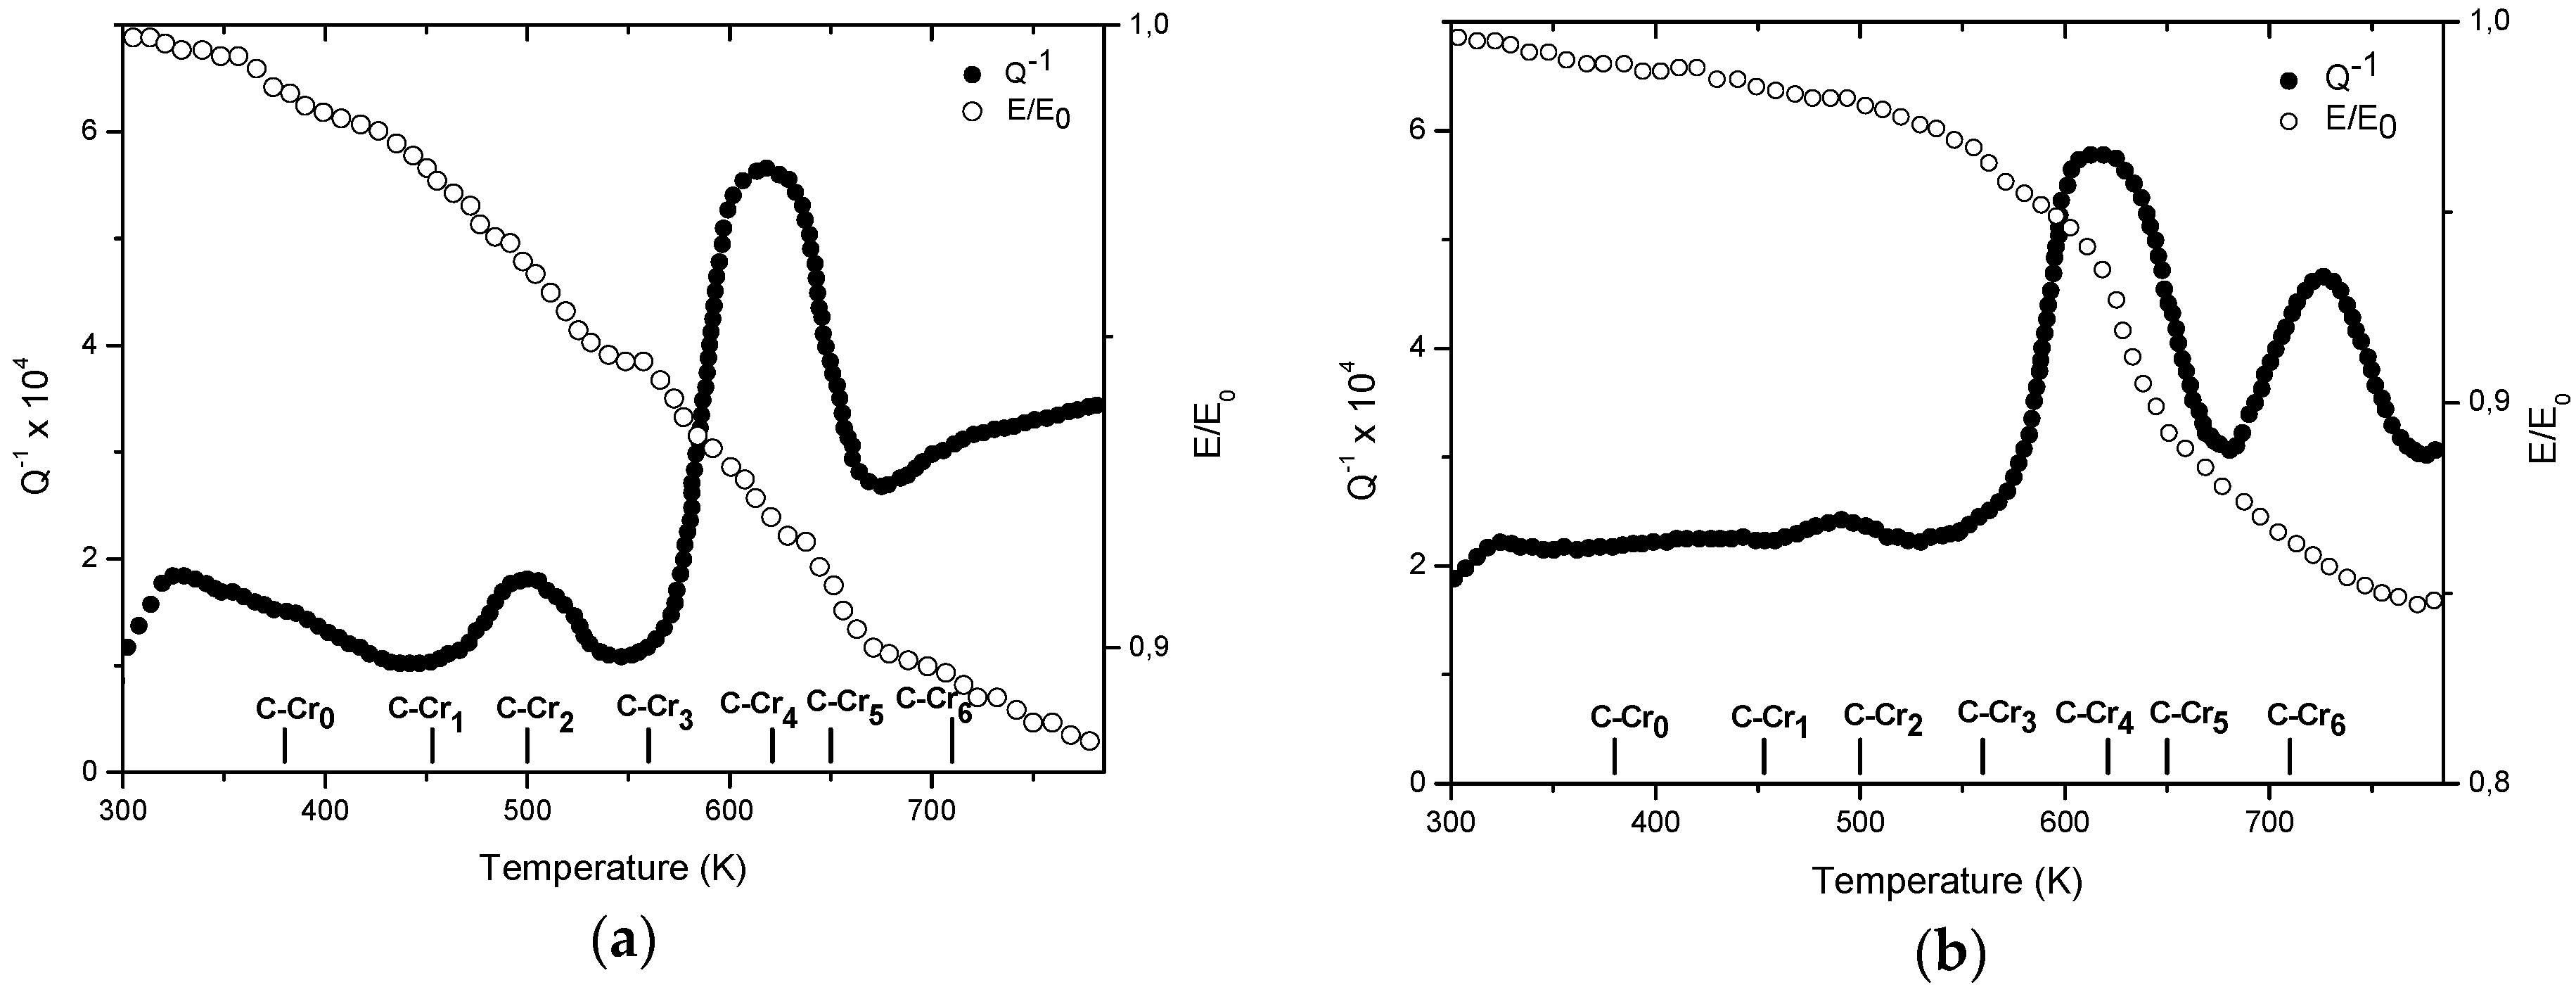
3.1. Q−1 Spectra Analysis
As shown by the examples in
Figure 1, the
Q−1 vs. temperature spectra of the Cr martensitic steel exhibit a complex scenario with more peaks of different position and intensity [
27], depending on the quenching rate from austenitic field. Dynamic modulus
E, normalised to the room temperature value
E0, exhibits slope changes in correspondence of the
Q−1 peaks, indicating that they are relaxation peaks.
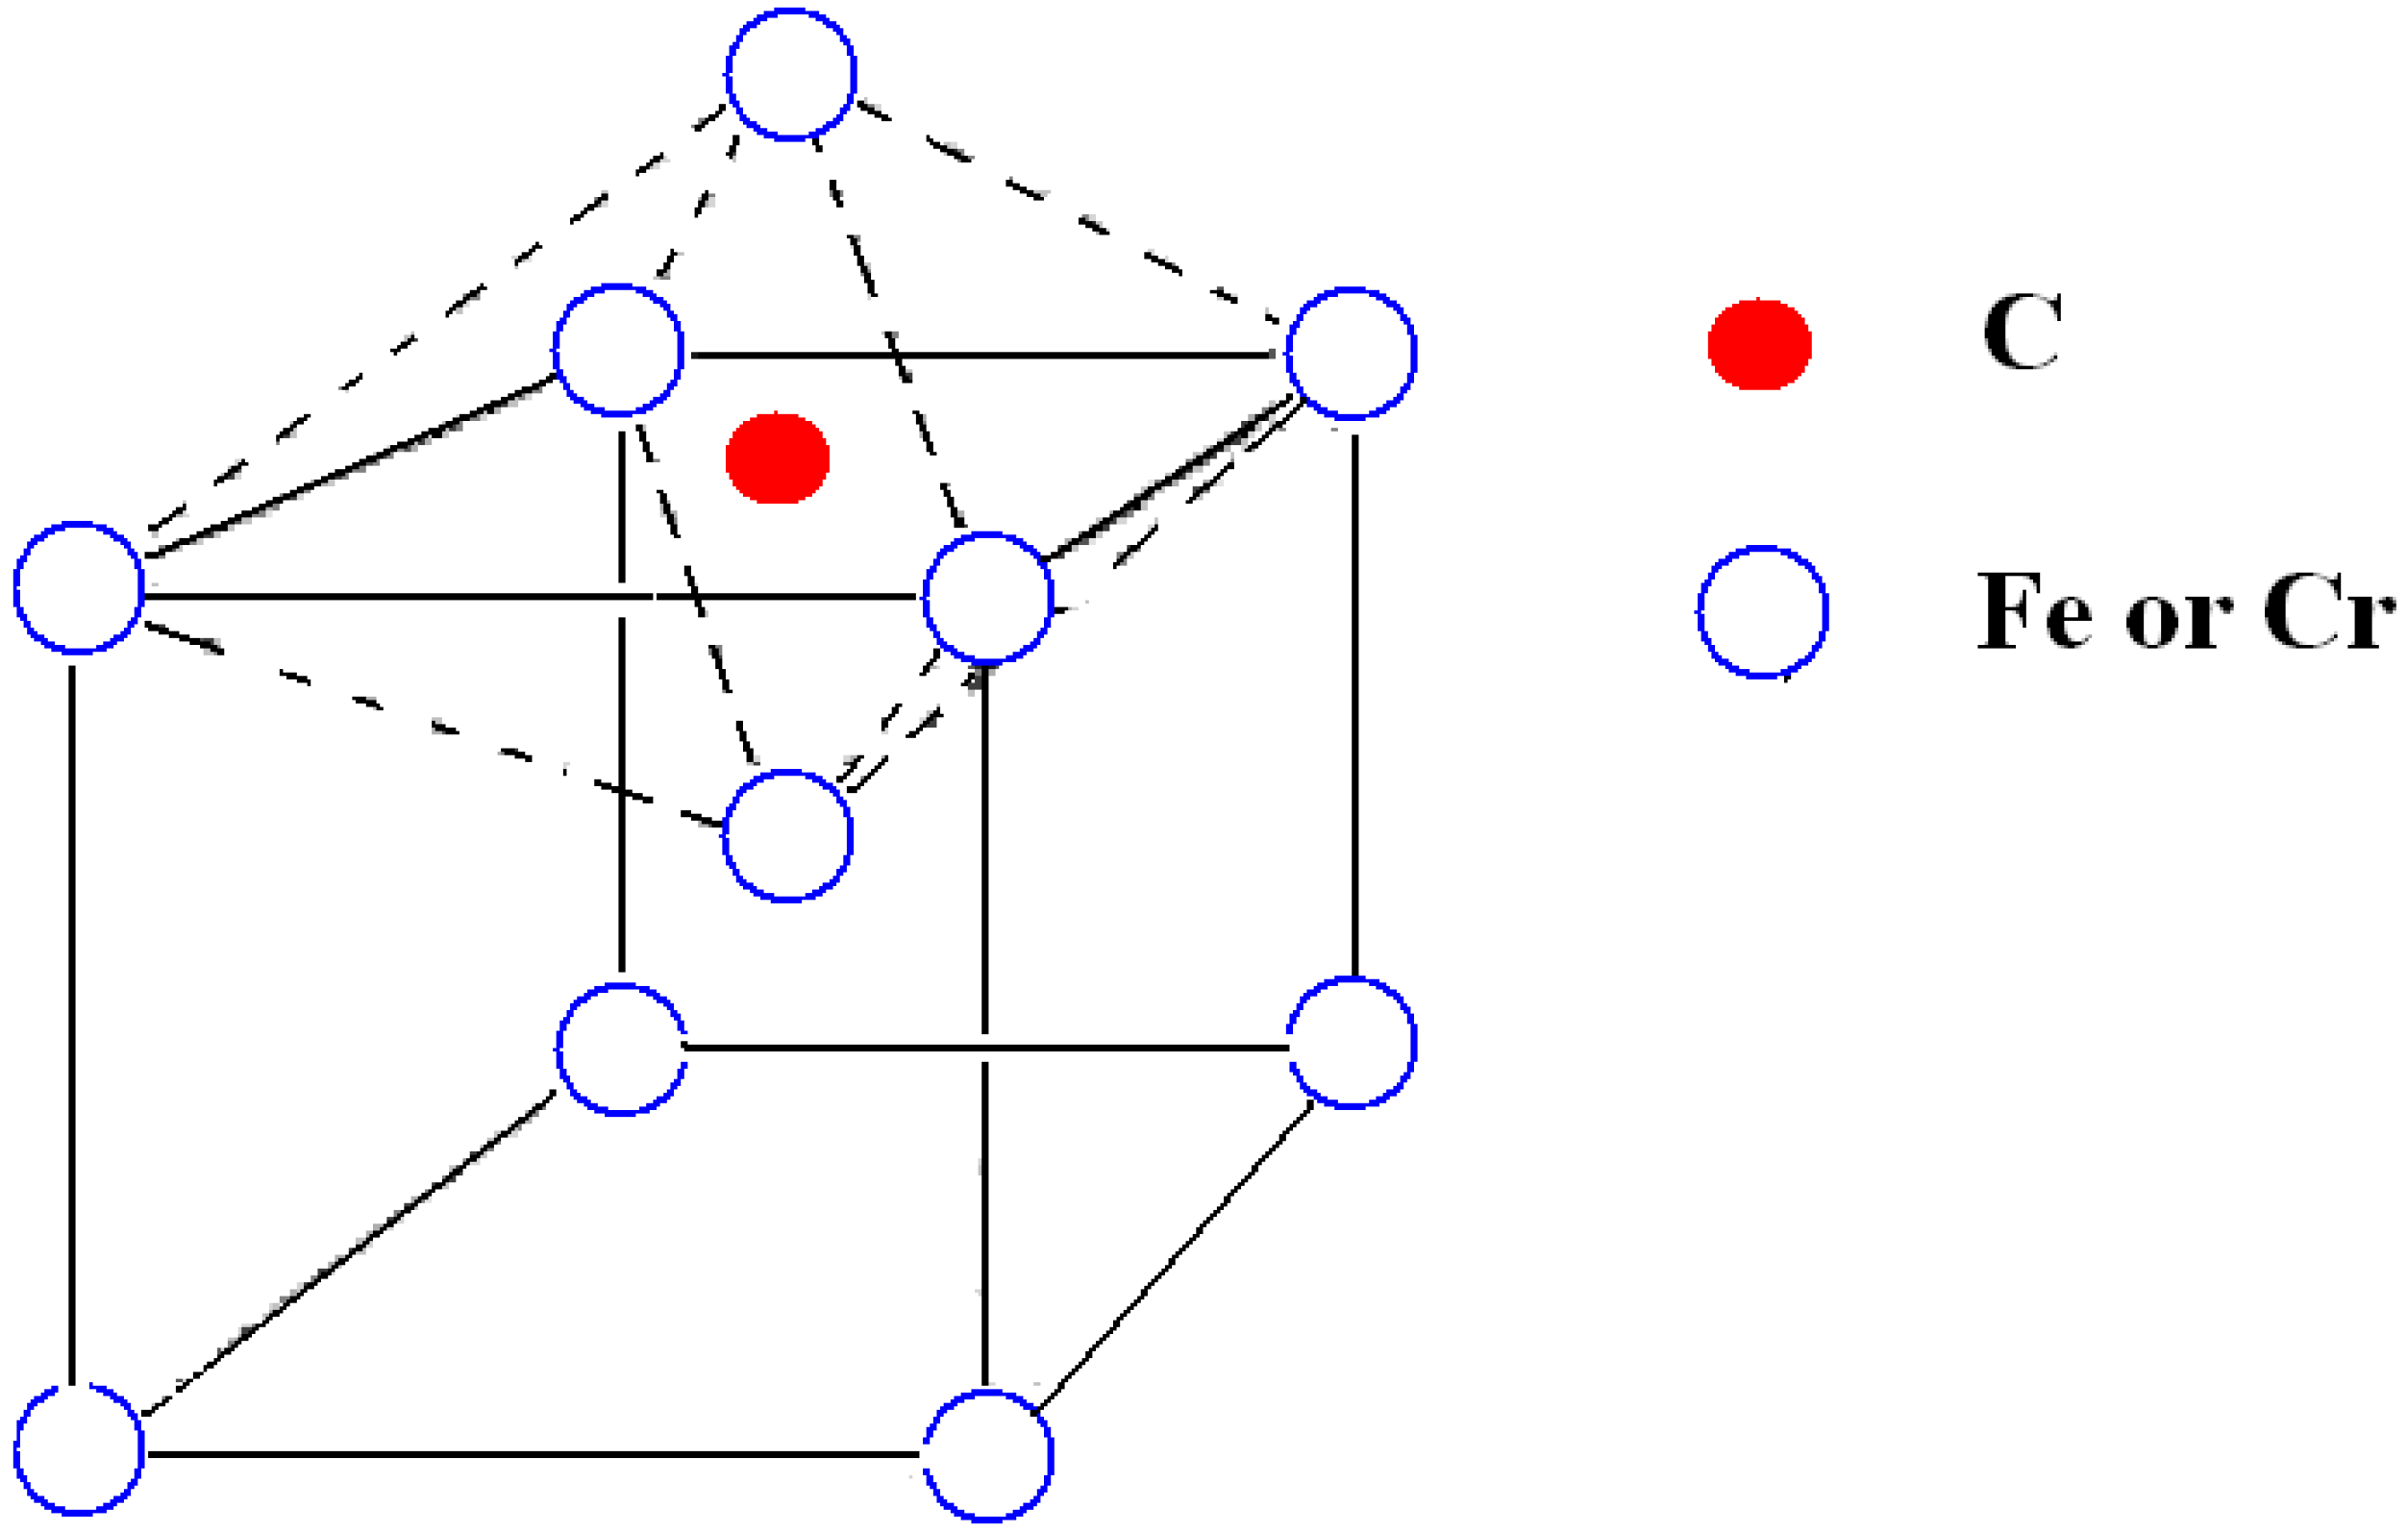
To understand the origin of the damping peaks, the interaction of C atoms in interstitial positions, with the atoms (Fe and Cr) forming the bcc lattice, has been considered. As shown in
Figure 2, C atoms in solid solution are assumed to occupy the octahedral interstices in the bcc lattice of the steel.
In the Fe–C system, all the interstitial positions are energetically equivalent, and any inhomogeneity in C atoms distribution only depends on possible interactions with lattice defects, for instance, dislocations (Cottrell’s atmospheres). If other alloying elements are present, they can substitute Fe atoms at the octahedron corners, giving rise to different configurations. In the Fe–Cr–C system, typical of the investigated steel, the corners of each octahedron can be occupied by a number i of Cr atoms, varying from 0 to 6, thus 7 different C–Cr configurations may occur, each of them with a specific binding energy for the C atom.
Some theoretical models describing the effects of substitutional atoms on the Snoek peak have been developed, and a lot of data can be found in the handbook of Blanter et al. [
28]. One of the first theories describing the effects of Cr atoms in the bcc Fe lattice was proposed by Tomilin et al. [
29]. According to this model,
H0 = 20 kcal/mol is the activation energy when only Fe atoms are present at the corners of the octahedron, and a contribution
ΔH = 3.1 kcal/mol has to be added to
H0 for every Cr atom substituting a Fe atom. On this basis, the
Q−1 curves consist of the overlapping of seven Snoek-type peaks corresponding to the aforesaid configurations. The activation energies and the positions of the peaks calculated for a resonance frequency of 250 Hz, typical of present experiments, are summarised in
Table 2.
On these grounds, the
Q−1 curves can be considered as the sum of seven contributions:
where
R is the gas constant, ω = 2π
f,
Δi the relaxation strength of peak
Q−1i, proportional through a factor λ ≅ 50 to the concentration
Ci of C atoms in octahedral sites with
i Cr atoms,
Ti the peak temperature, and
τi its relaxation time, given by
with
τ0 being about 10
−15 s.
The Tomilin’s model assumes that, at the thermodynamic equilibrium, the number
Pi of configurations with
i atoms of Cr obeys a binomial distribution:
where
N is the Cr molar concentration. The concentration of C atoms in interstices with
i Cr neighbours results in being
where
ξ0 is the probability of occupation of interstices with
i = 0.
Figure 3 shows the
Q−1 curve calculated on the basis of Equation (3) for an alloy with the same Cr and C content of the examined steel, according to the assumptions of Tomilin’s model expressed by Equations (5) and (6).
The comparison between the curves in
Figure 1a,b and that in
Figure 3 (re-drawn from ref. [
27]) clearly shows that both the experimental curves differ from that predicted by the model. The experimental curves substantially exhibit peaks centred at the temperatures foreseen by the model and reported in
Table 2, however, the intensities of the peaks (relaxation strengths
Δi) do not correspond. This means that the distributions of C–Cr associates in both cases are not those of thermodynamic equilibrium, and the different distributions depend on the cooling rate from the austenitic field.
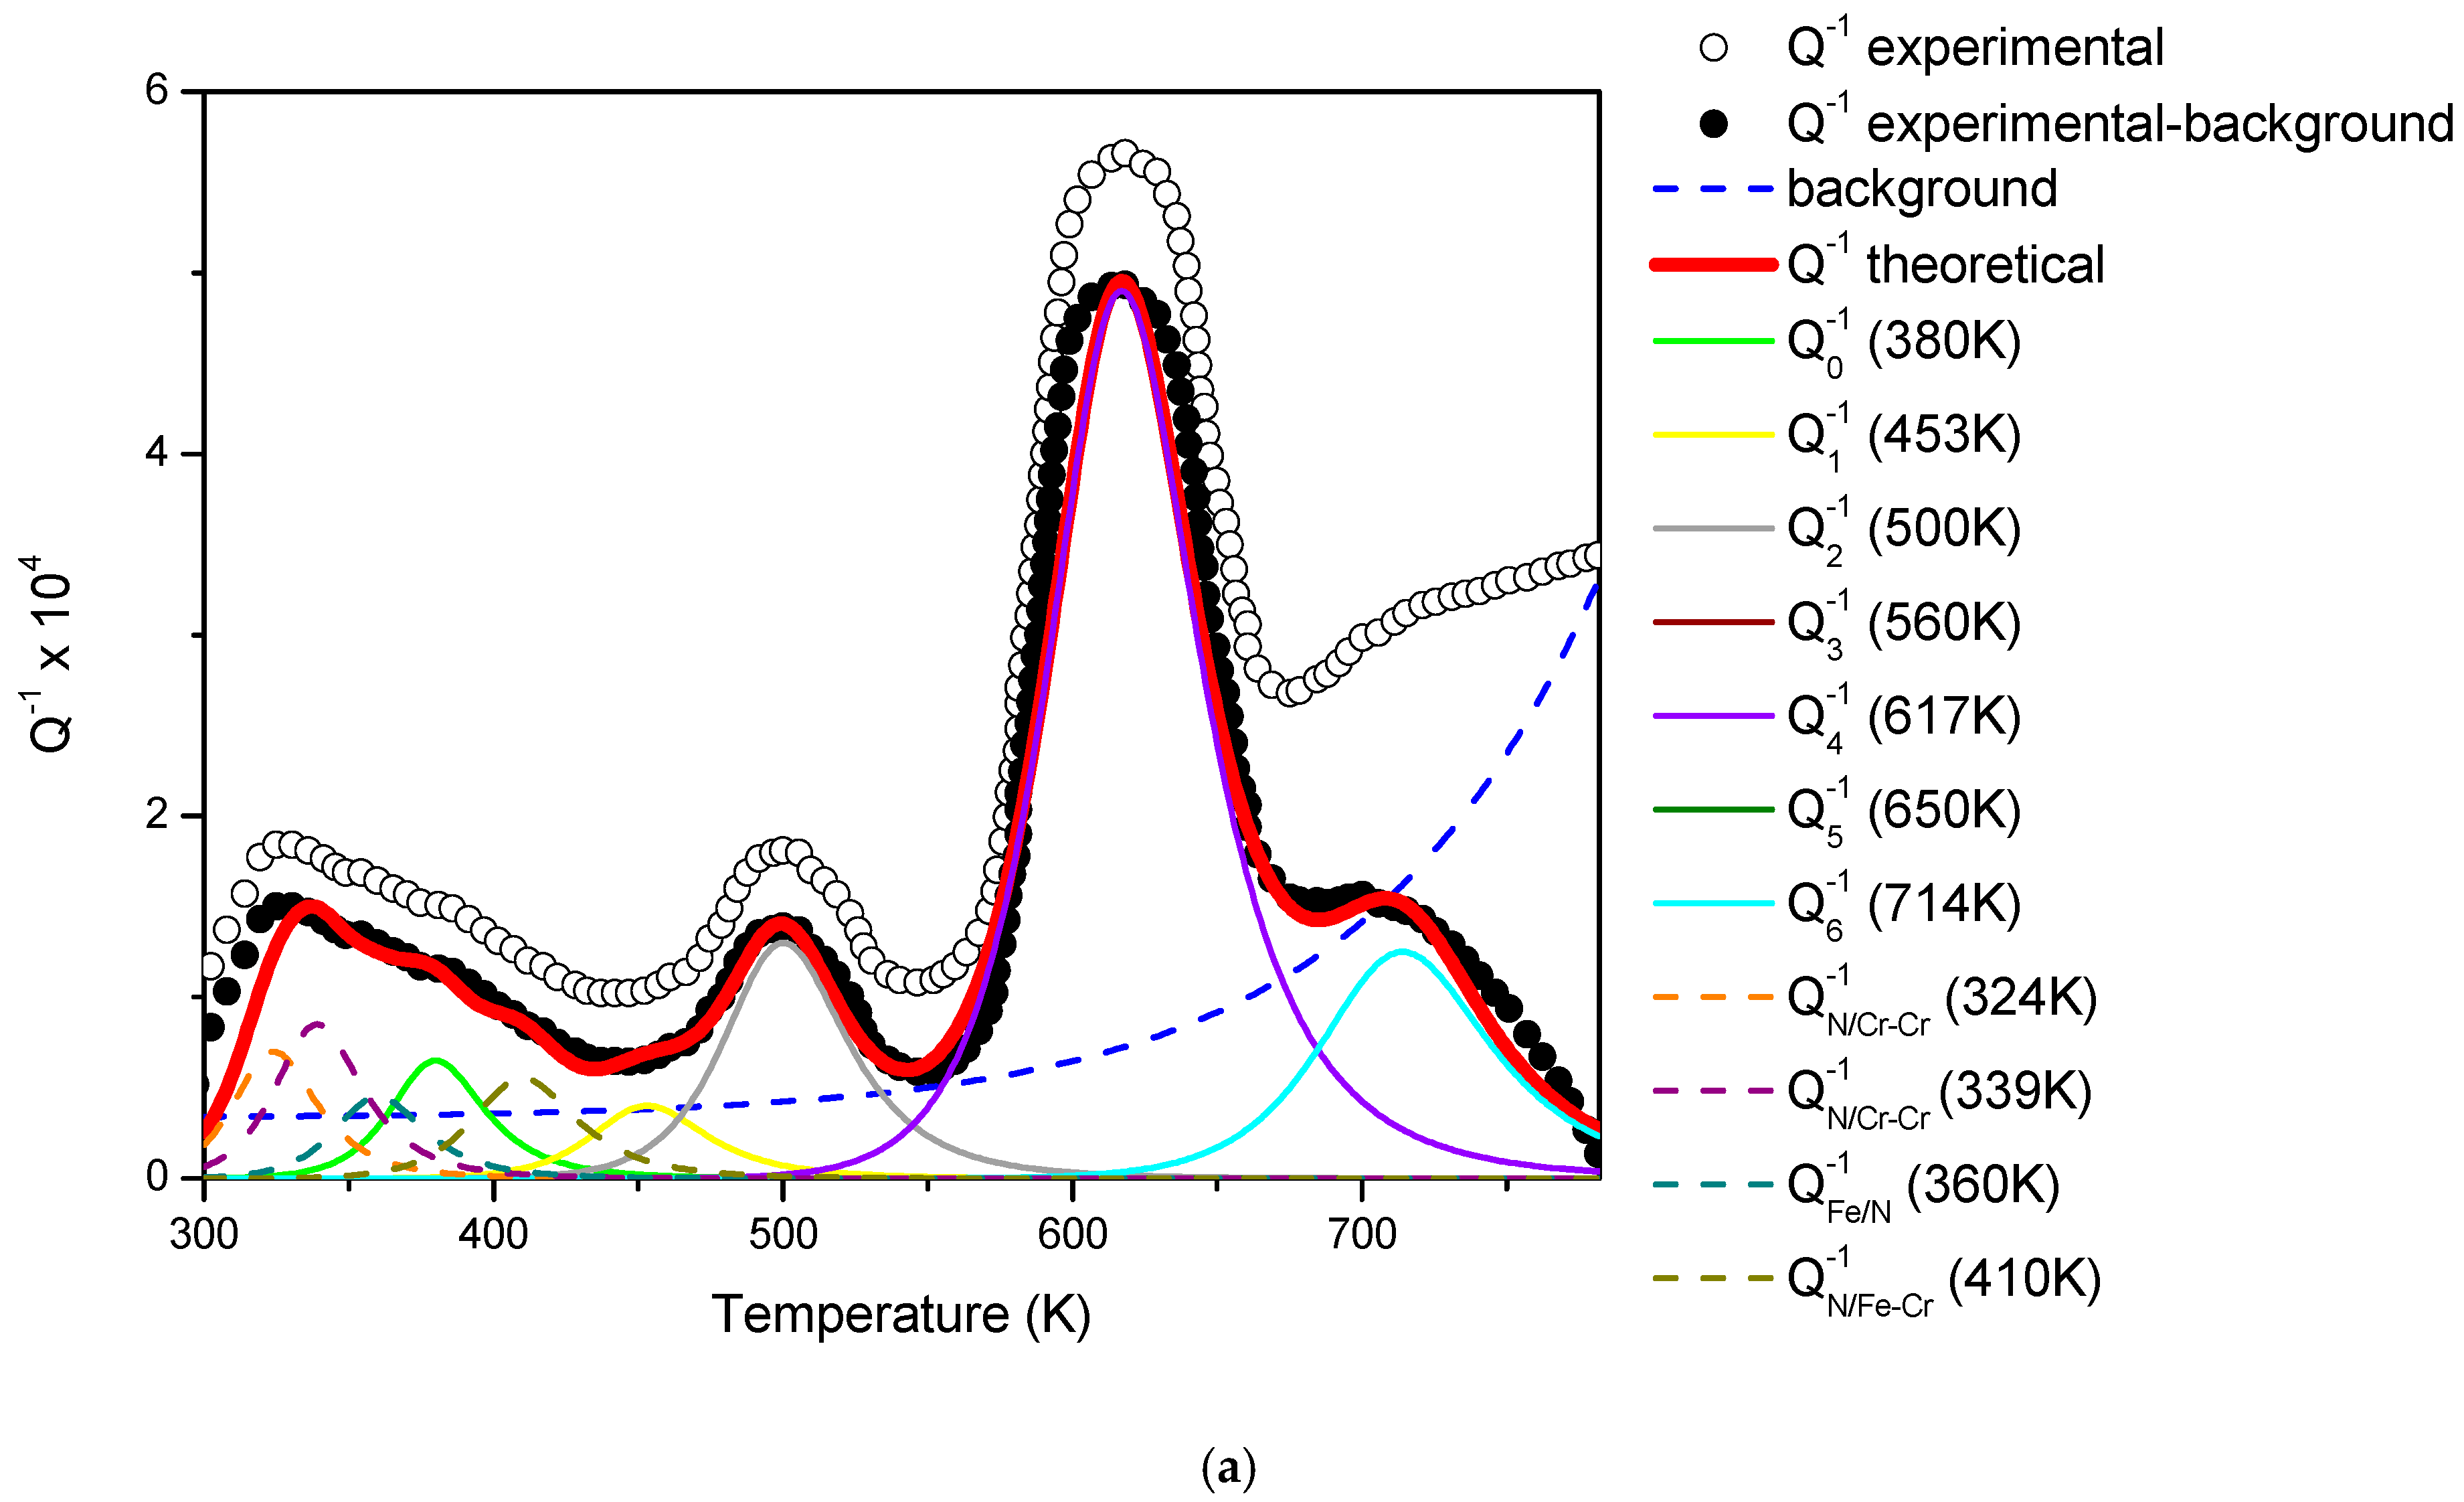
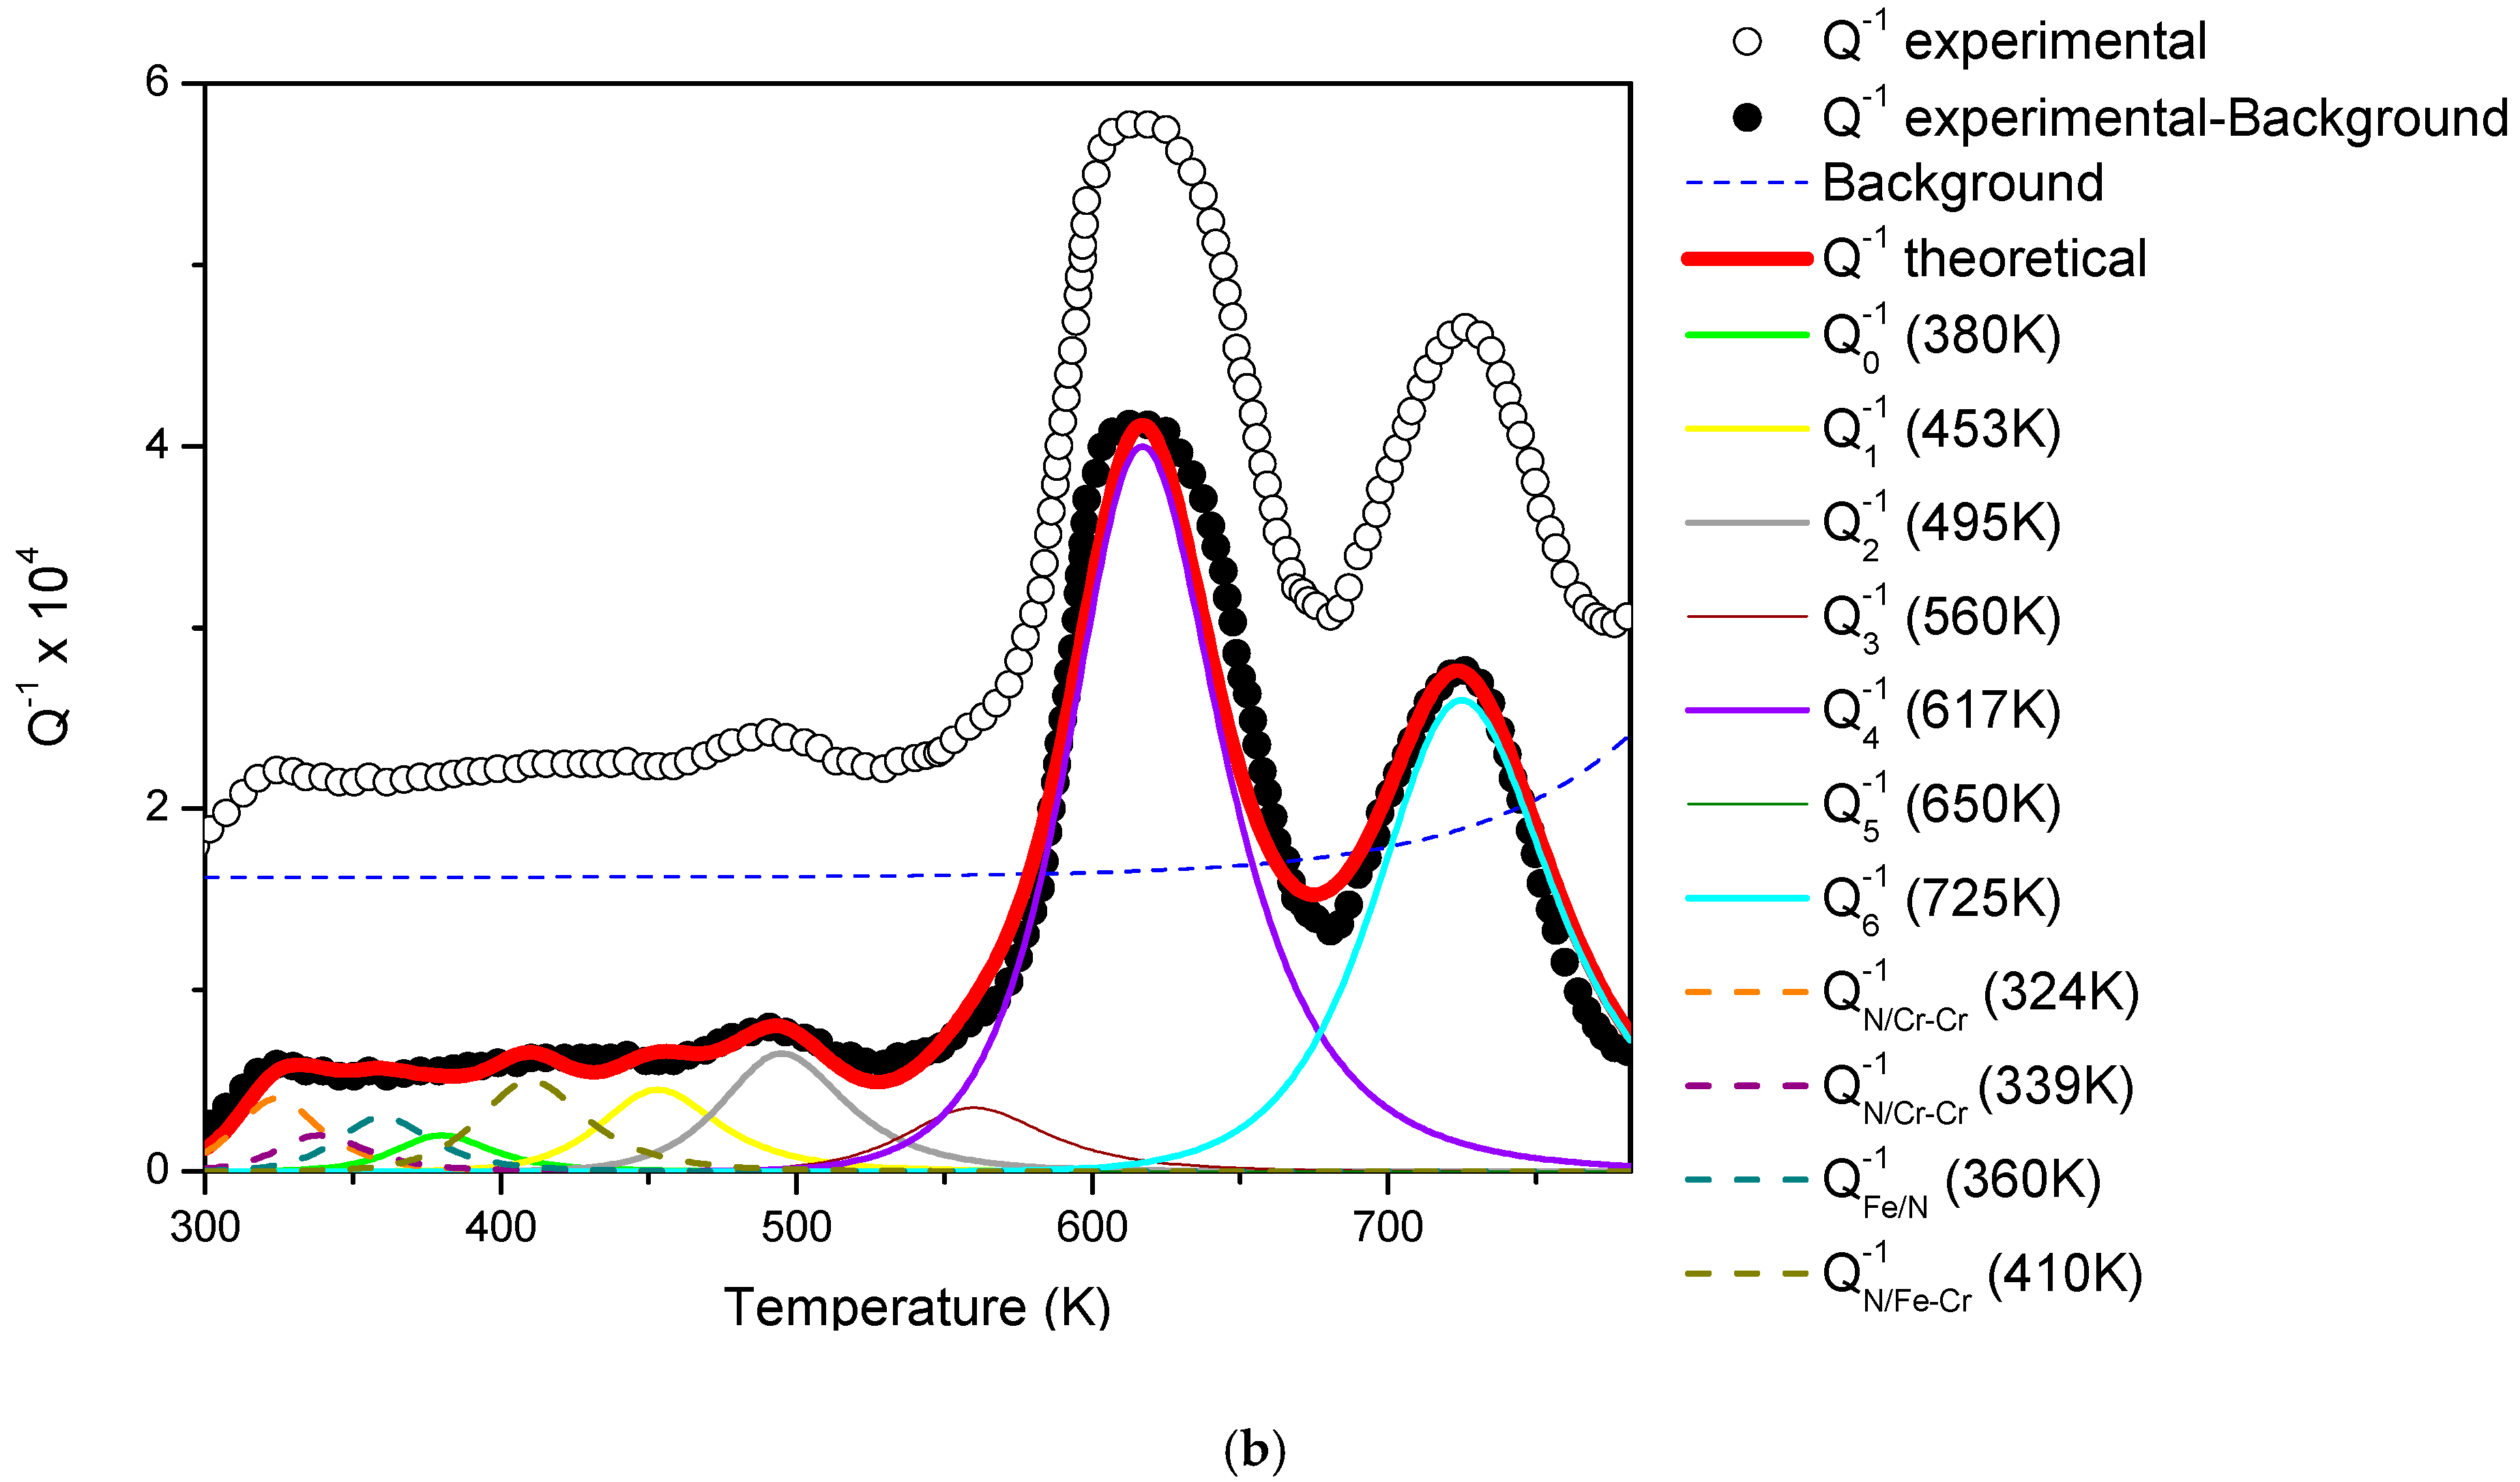
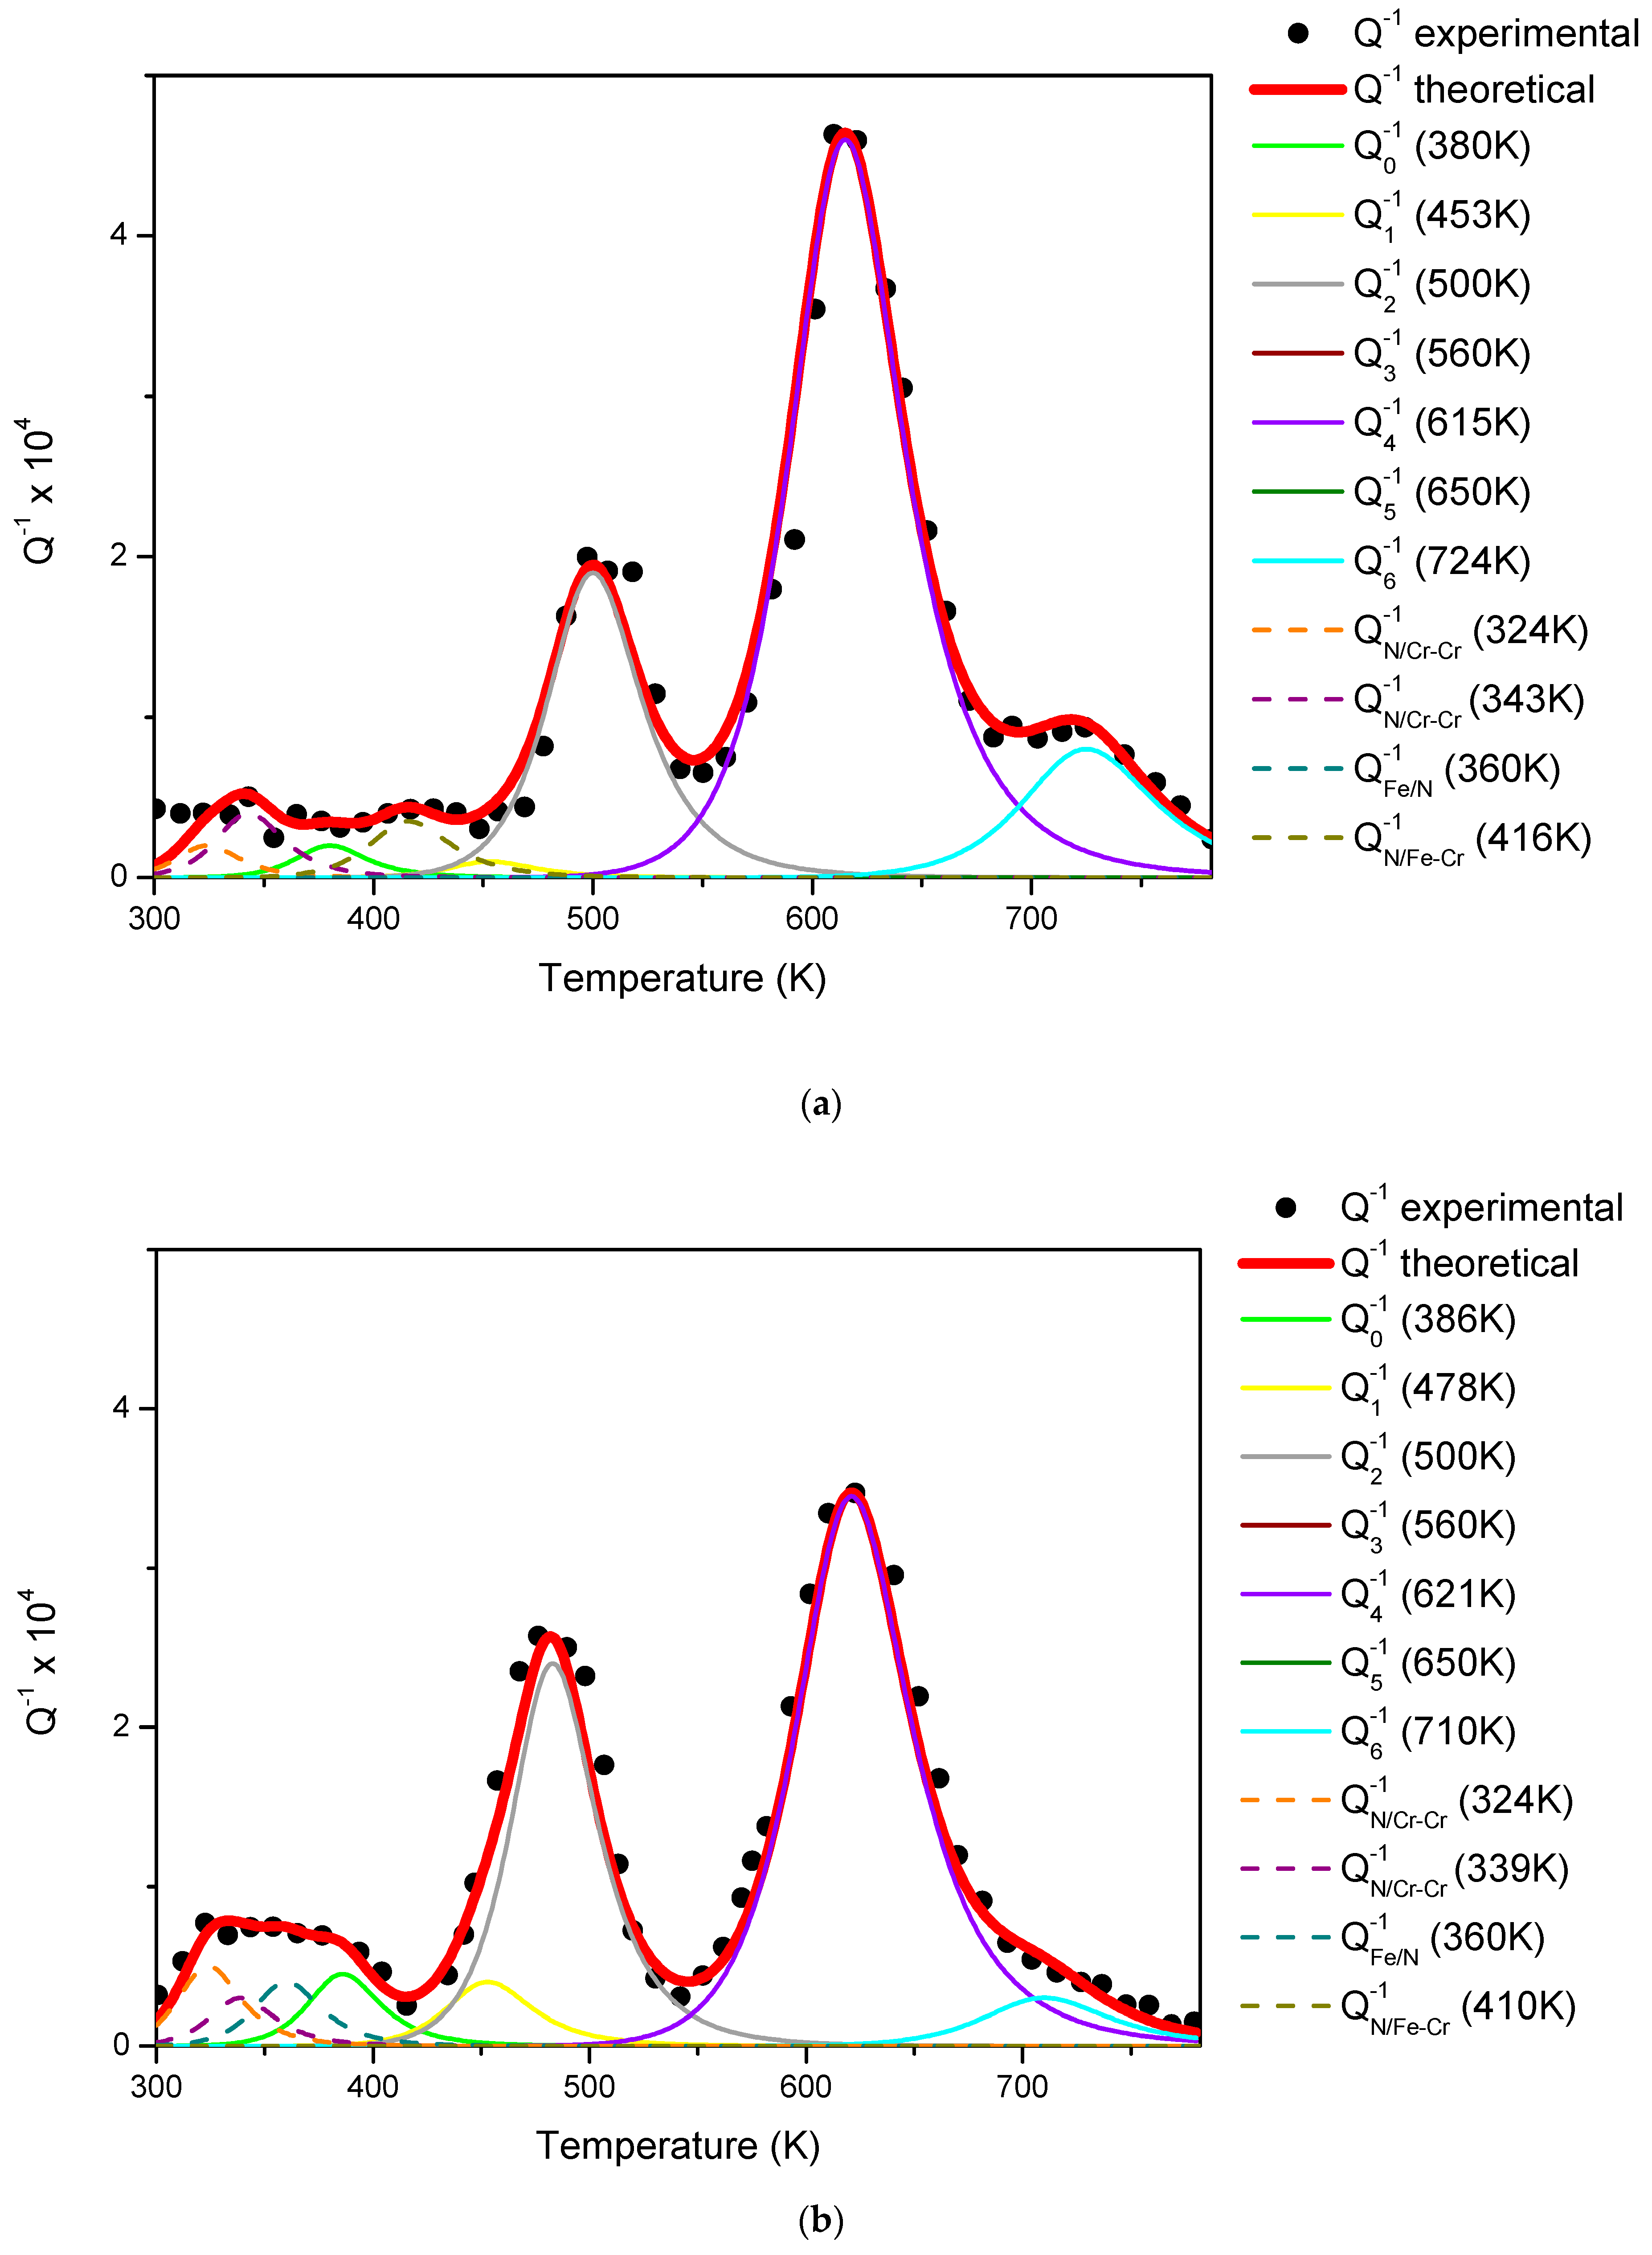
To analyse the Q−1 curves of the steel under different conditions of quenching, heat treatment etc., they have been fitted by considering the possible anelastic processes contributing to the damping. In addition to the relaxation peaks due to C–Cr associates, further contributions to the curves come from background and peaks connected to N relaxation processes.
The background is mainly due to the interactions of dislocations with interstitial atoms (C and N) and exhibits an increasing trend with temperature that can be described by an exponential function.
The damping contributions of N are, in fact, the same
Q−1 peaks observed in Fe–Cr–N alloys by Ritchie and Rawlings [
30]. Four peaks have been observed: the first and second peaks, attributed by these investigators to N/Cr–Cr interactions, have activation energies of 16.19 and 16.98 kcal/mol, respectively, and are centred for our resonance frequency (~250 Hz) at 324 K and 339 K. The third one, ascribed to Fe–N interactions, has an activation energy of 18.58 kcal/mol and is centred at 360 K. The fourth peak, due to N/Fe–Cr interactions, has an activation energy of 20.78 kcal/mol, and its temperature is 410 K.
In fact, Q−1 spectra are mainly affected by N contributions in the low temperature range, and by C contributions in the high temperature range.
The curve fitting of the experimental data is the sum of all the peaks due to C and N, and the background, therefore, it can be written as
where
Hk and
Tk are the activation energies and peak temperatures of N peaks, while
A,
B, and
C are constants.
Since the background depends on microstructural features, such as dislocations and point defects, it is not the same in samples prepared in a different way, thus, the values of A, B, and C have to be determined for each single spectrum.
Once determined, the background curve, the activation energies (Hi and Hk), and the corresponding peak temperatures (Ti and Tk) of C and N peaks, are introduced into Equation (7), and the relaxation strengths Δi and Δk are suitably adjusted to find the best fitting curve.
Moreover, it has been assumed that the activation energy of each single relaxation process could be affected by small variations with respect that considered by the Tomilin’s model, owing to a possible different environment surrounding the octahedra involved in the process, in particular, the number of Cr atoms present in the nearest atomic shells. Therefore, some shifts with respect to the temperatures
Ti, reported in
Table 2, have been considered to get the best fitting.
For example,
Figure 4 displays the analysis of the
Q−1 spectra in
Figure 1.
Table 3 reports the peak positions and relaxation strengths,
Δi, used to calculate the different contributions which allow the best fit. The temperature of C–Cr
4 and C–Cr
6 peaks are a little shifted with respect to the values predicted by the Tomilin’s model; the shifts correspond to variations of activation energies of about 1%.
3.2. Cr Segregation Phenomena
Different cooling rates from the austenitic field (1348 K) do not seem to have effects on the microstructure and mechanical properties of the steel, however, successive steps of tempering treatment determine a quite different behaviour, in particular, of the fracture mode.
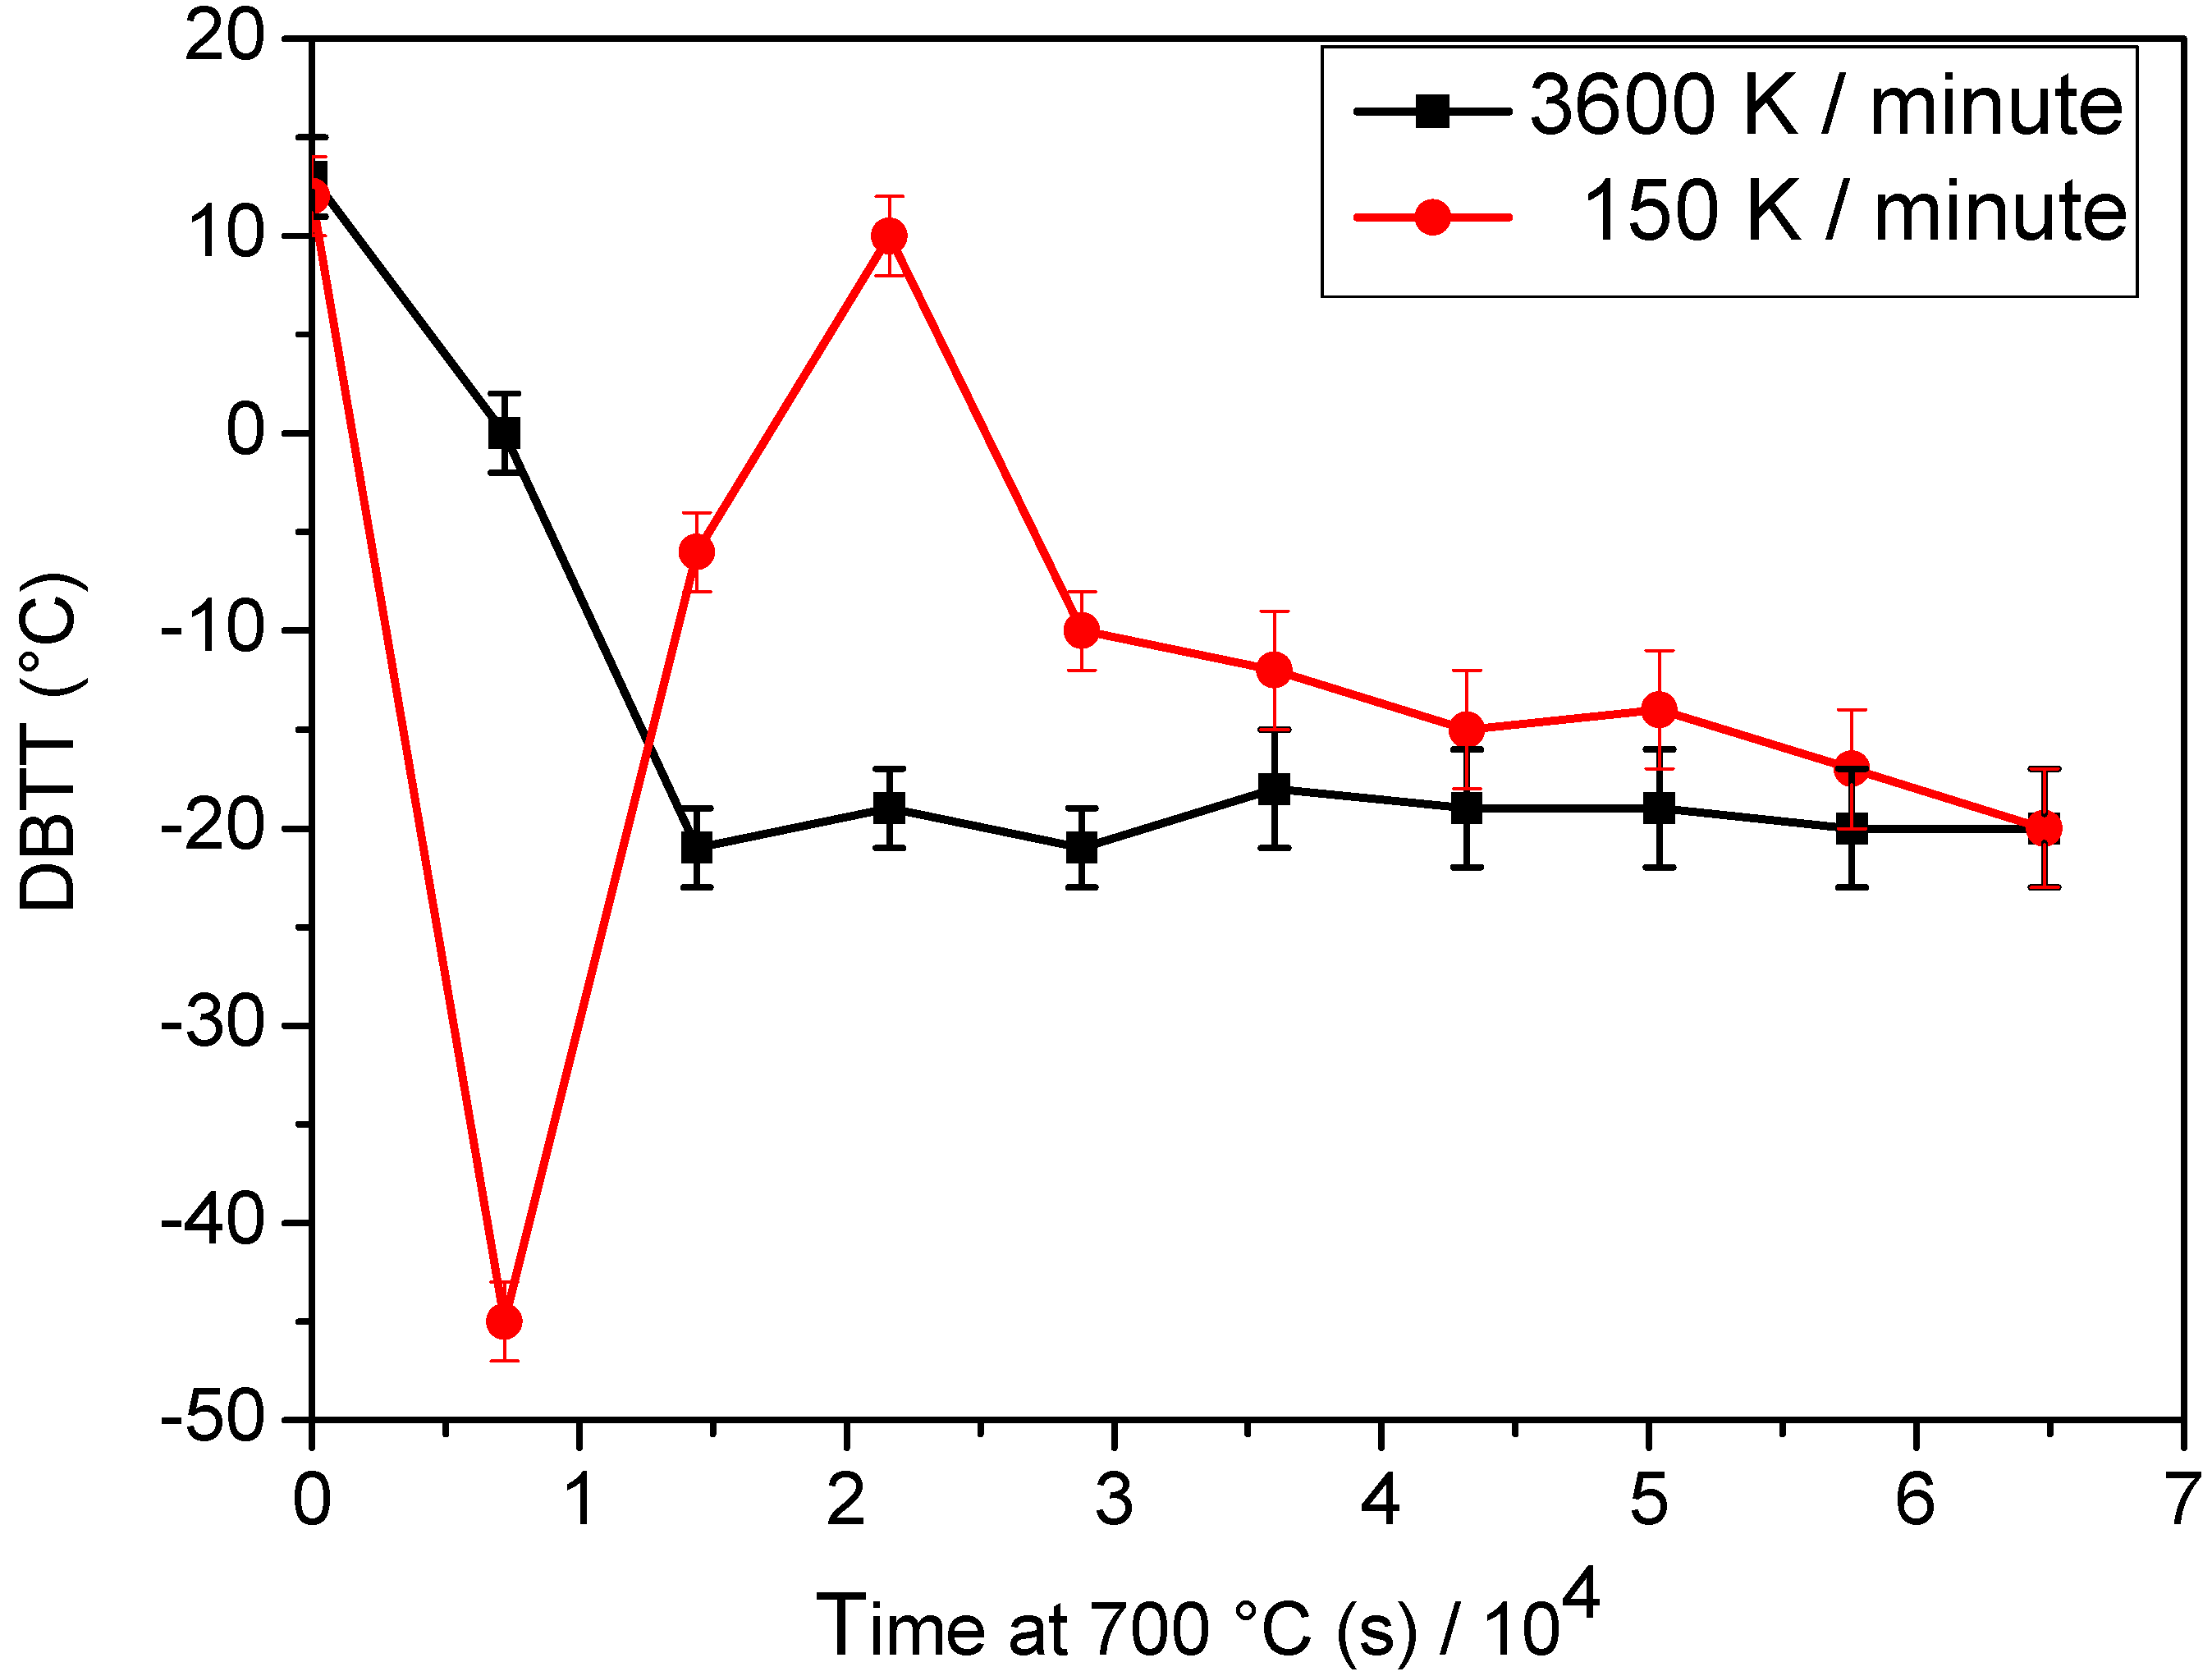
Figure 5, re-drawn from ref. [
22], compares the ductile to brittle transition temperature (DBTT) of samples quenched from 1348 K with cooling rates of 150 and 3600 K/min and, then, submitted to heat treatments at 973 K for increasing time. DBTT was determined from Charpy tests performed on standard V-notched probes in the temperature range from 173 K (−100 °C) to + 423 K (+150 °C).
After quenching, DBTT is 285 K (+12 °C) for both materials, however, the curves exhibit a different trend as the time of tempering treatment at 973 K increases. In the case of the samples quenched at 150 K/min, a minimum is observed after 2 hours, followed by a maximum at 6 hours, and by a progressive decrease for longer tempering time. On the contrary, DBTT of the samples quenched at 3600 K/min shows an initial decrease (up to 4 h), then it remains substantially stable.
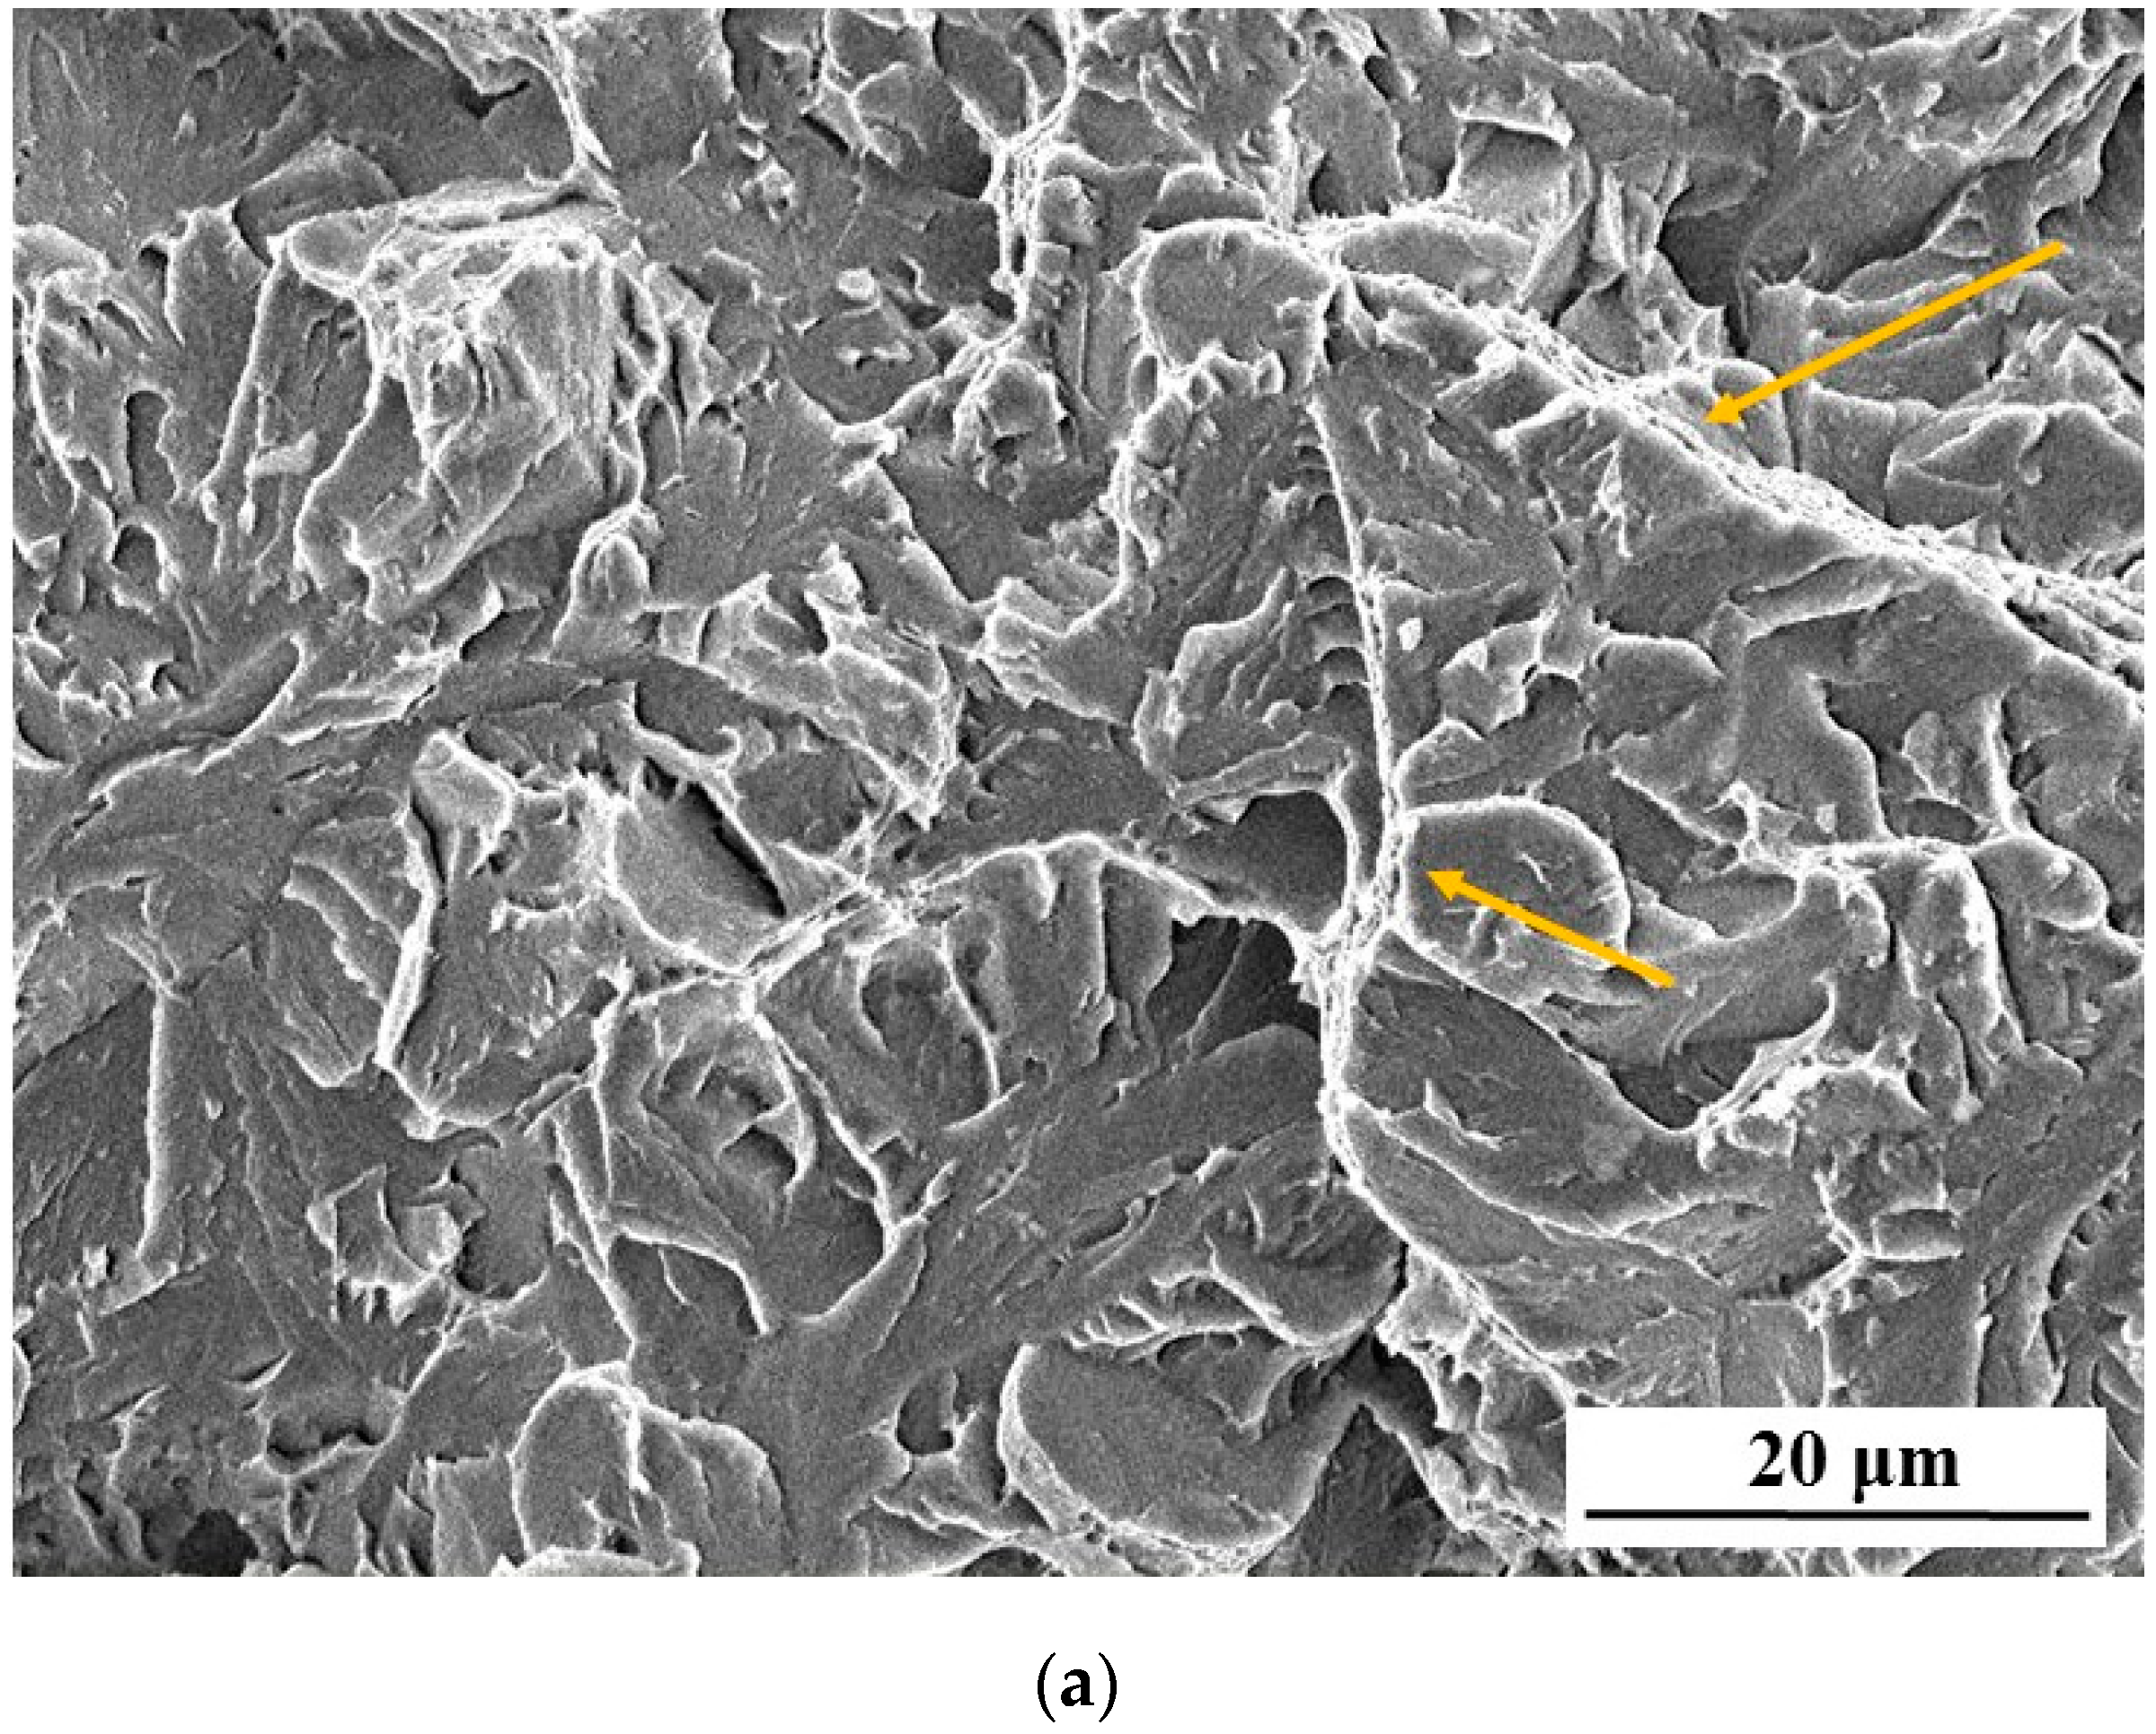
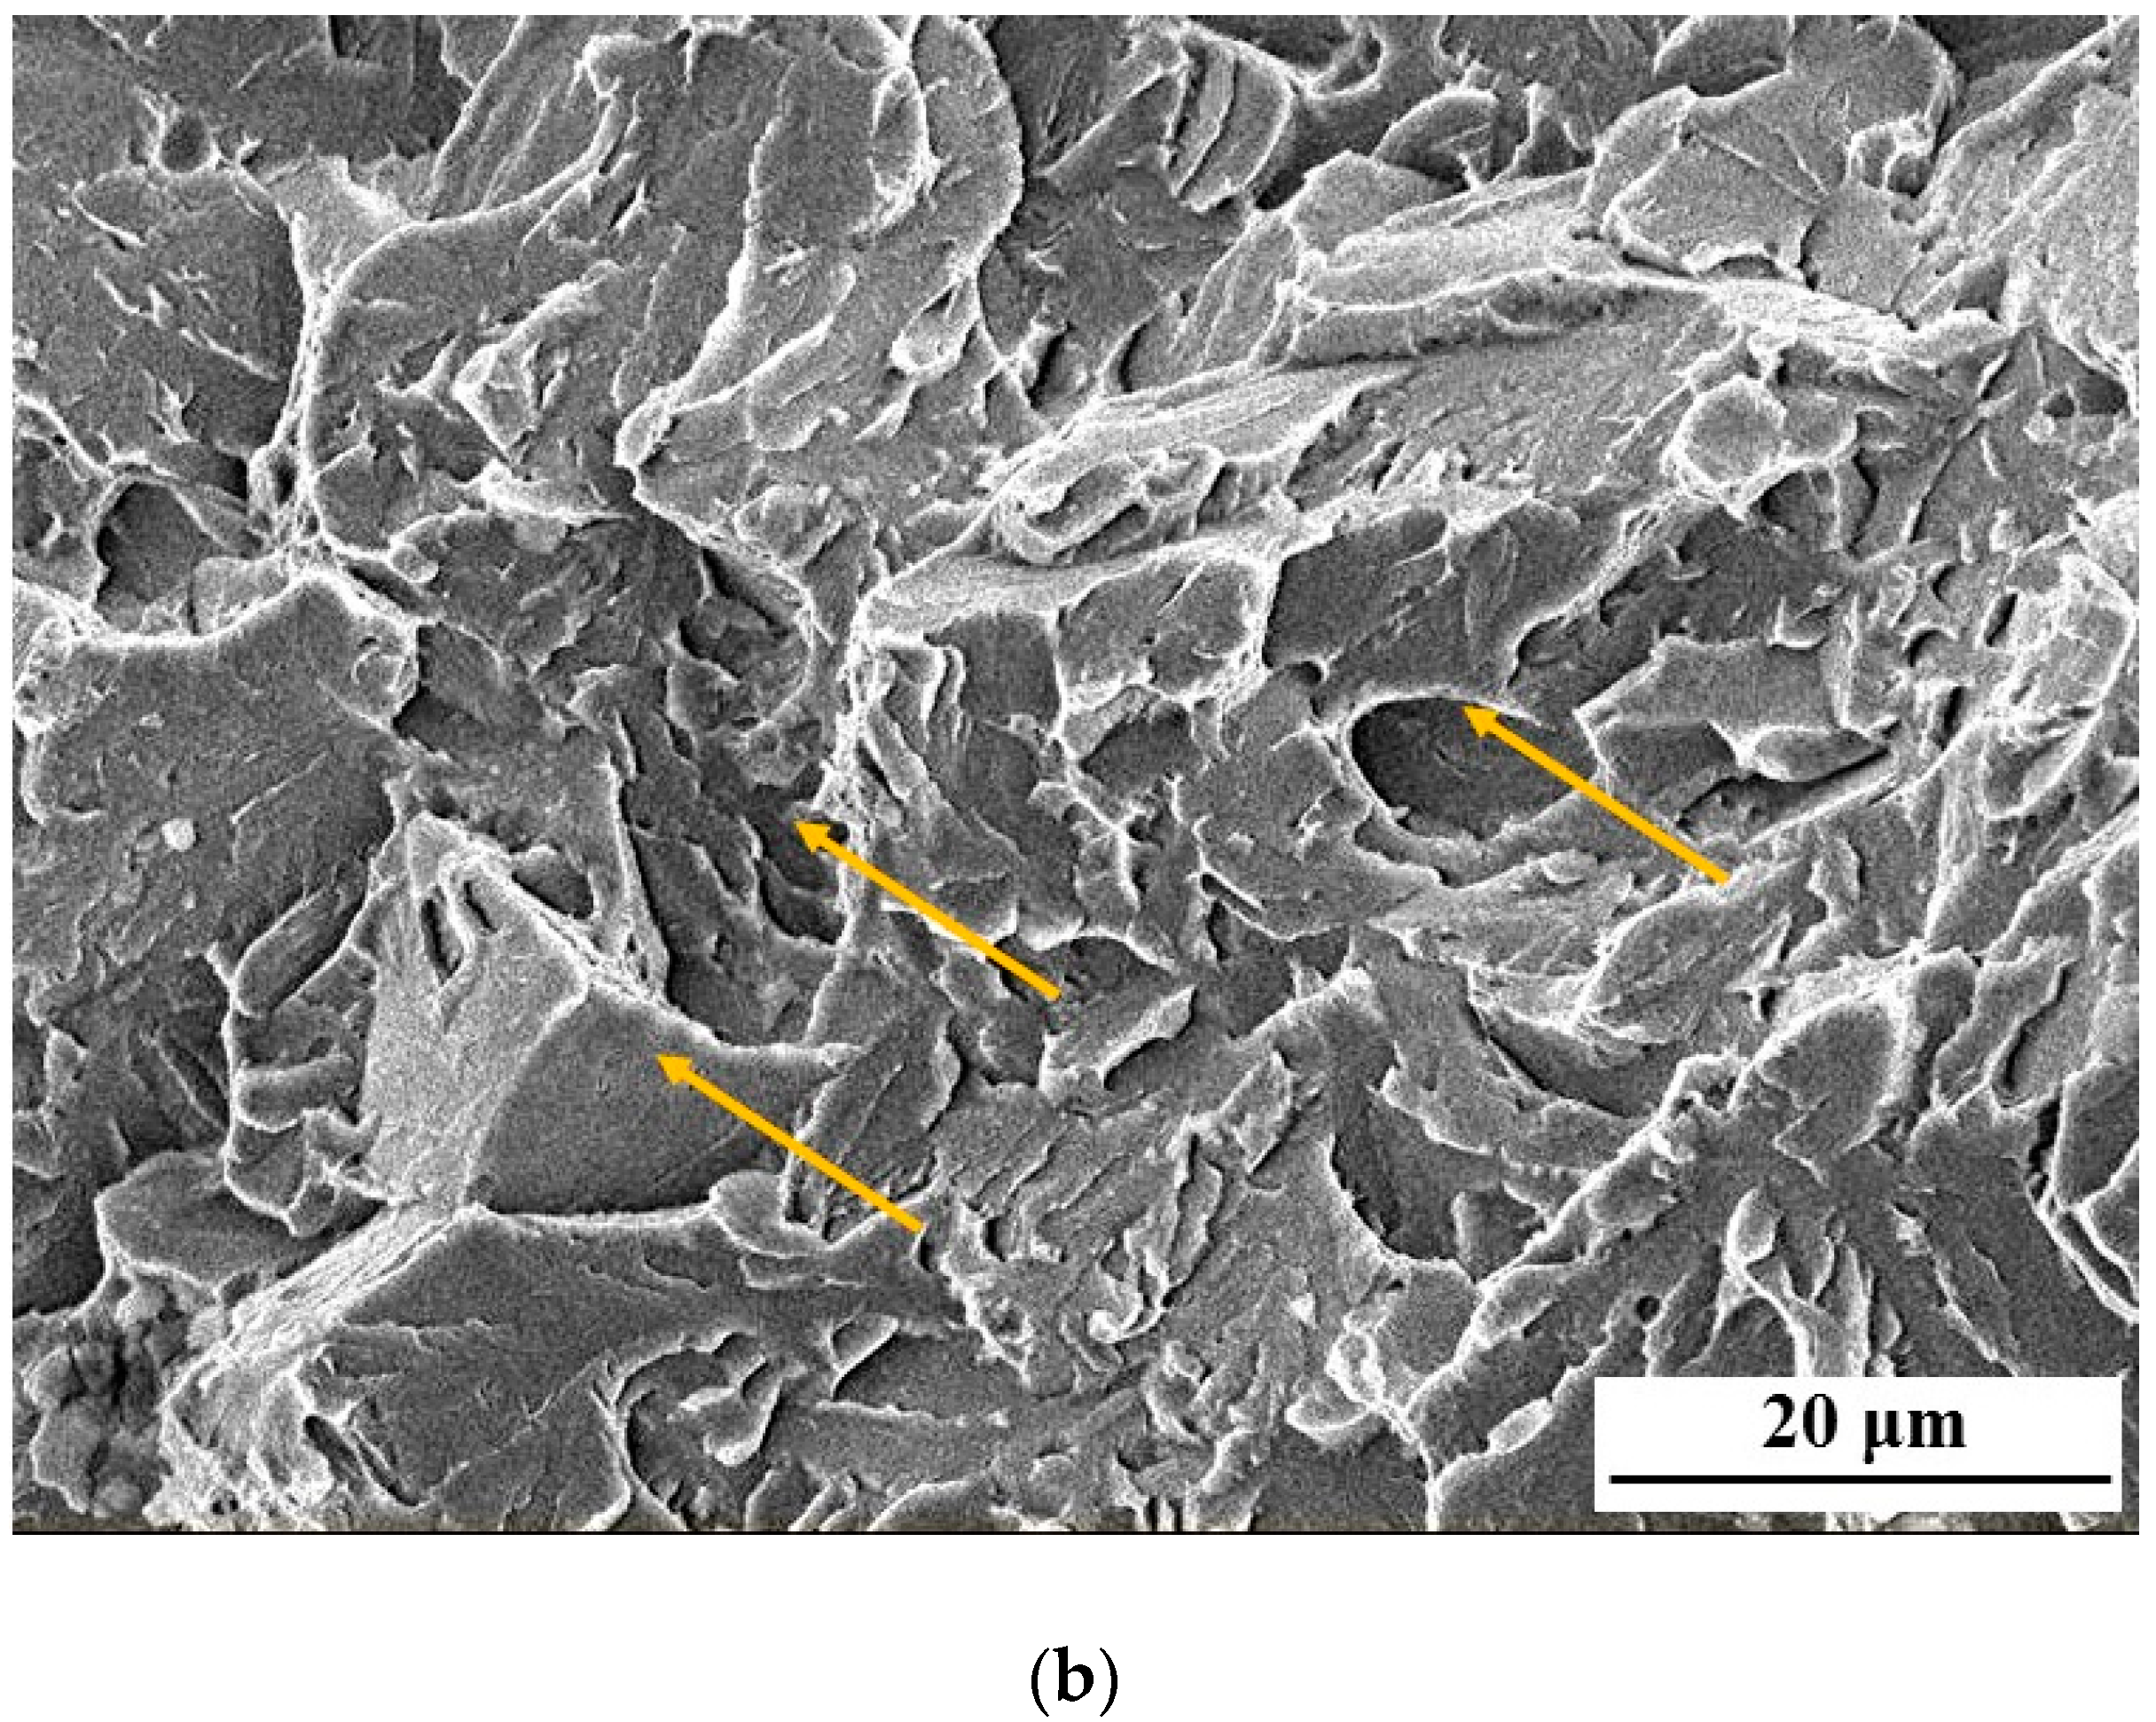
SEM observations on fracture surfaces of probes broken in ductile field showed no significant differences in samples cooled with different rates. In brittle field, the morphological features for both the materials in as-quenched condition are the same, namely, those typical of a quasi-cleavage fracture, but differences arise and become gradually more pronounced at increasing time of tempering. After 7.2 × 10
4 s (20 h) at 973 K, the fracture surfaces of samples cooled at 3600 and 150 K/min show different morphologies (
Figure 6): the fracture mode is always of quasi-cleavage in (
Figure 6a), whereas is mixed (quasi-cleavage plus intercrystalline) in (
Figure 6b).
The image of
Figure 6a shows the typical quasi-cleavage fracture surface: the cracks are multiple and transgranular, with tear ridges in the zones where moving cracks join together. A similar morphology is observed in
Figure 6b, however, in this case, zones are also present where the fracture front travelled along the boundaries of primary austenitic grains (typical features of intercrystalline fracture). In fact, the fracture is mixed, occurring in both quasi-cleavage and intercrystalline modes.
The different evolution of the two materials, whose microstructure and mechanical properties after quenching are apparently similar, has been related to the different C–Cr associates distribution shown in
Figure 1, namely, large numbers of C–Cr associate with
i = 4 and 2 after faster cooling,
i = 4 and 6 after slower cooling. Both cases are consistent with an original Cr clustering in austenitic field (before cooling), which exhibits a specific evolution depending on cooling rate. Cr clustering in austenite was examined in detail in a previous work [
15]. Monte Carlo simulations demonstrated that Cr clustering occurs through a two-step process owing to the different diffusivities of C and Cr: 1st step—rapid diffusion of C atoms to form C–Cr associates, 2nd step—slower diffusion of Cr leading to the C–Cr associates coalescing, giving rise to Cr-rich clusters.
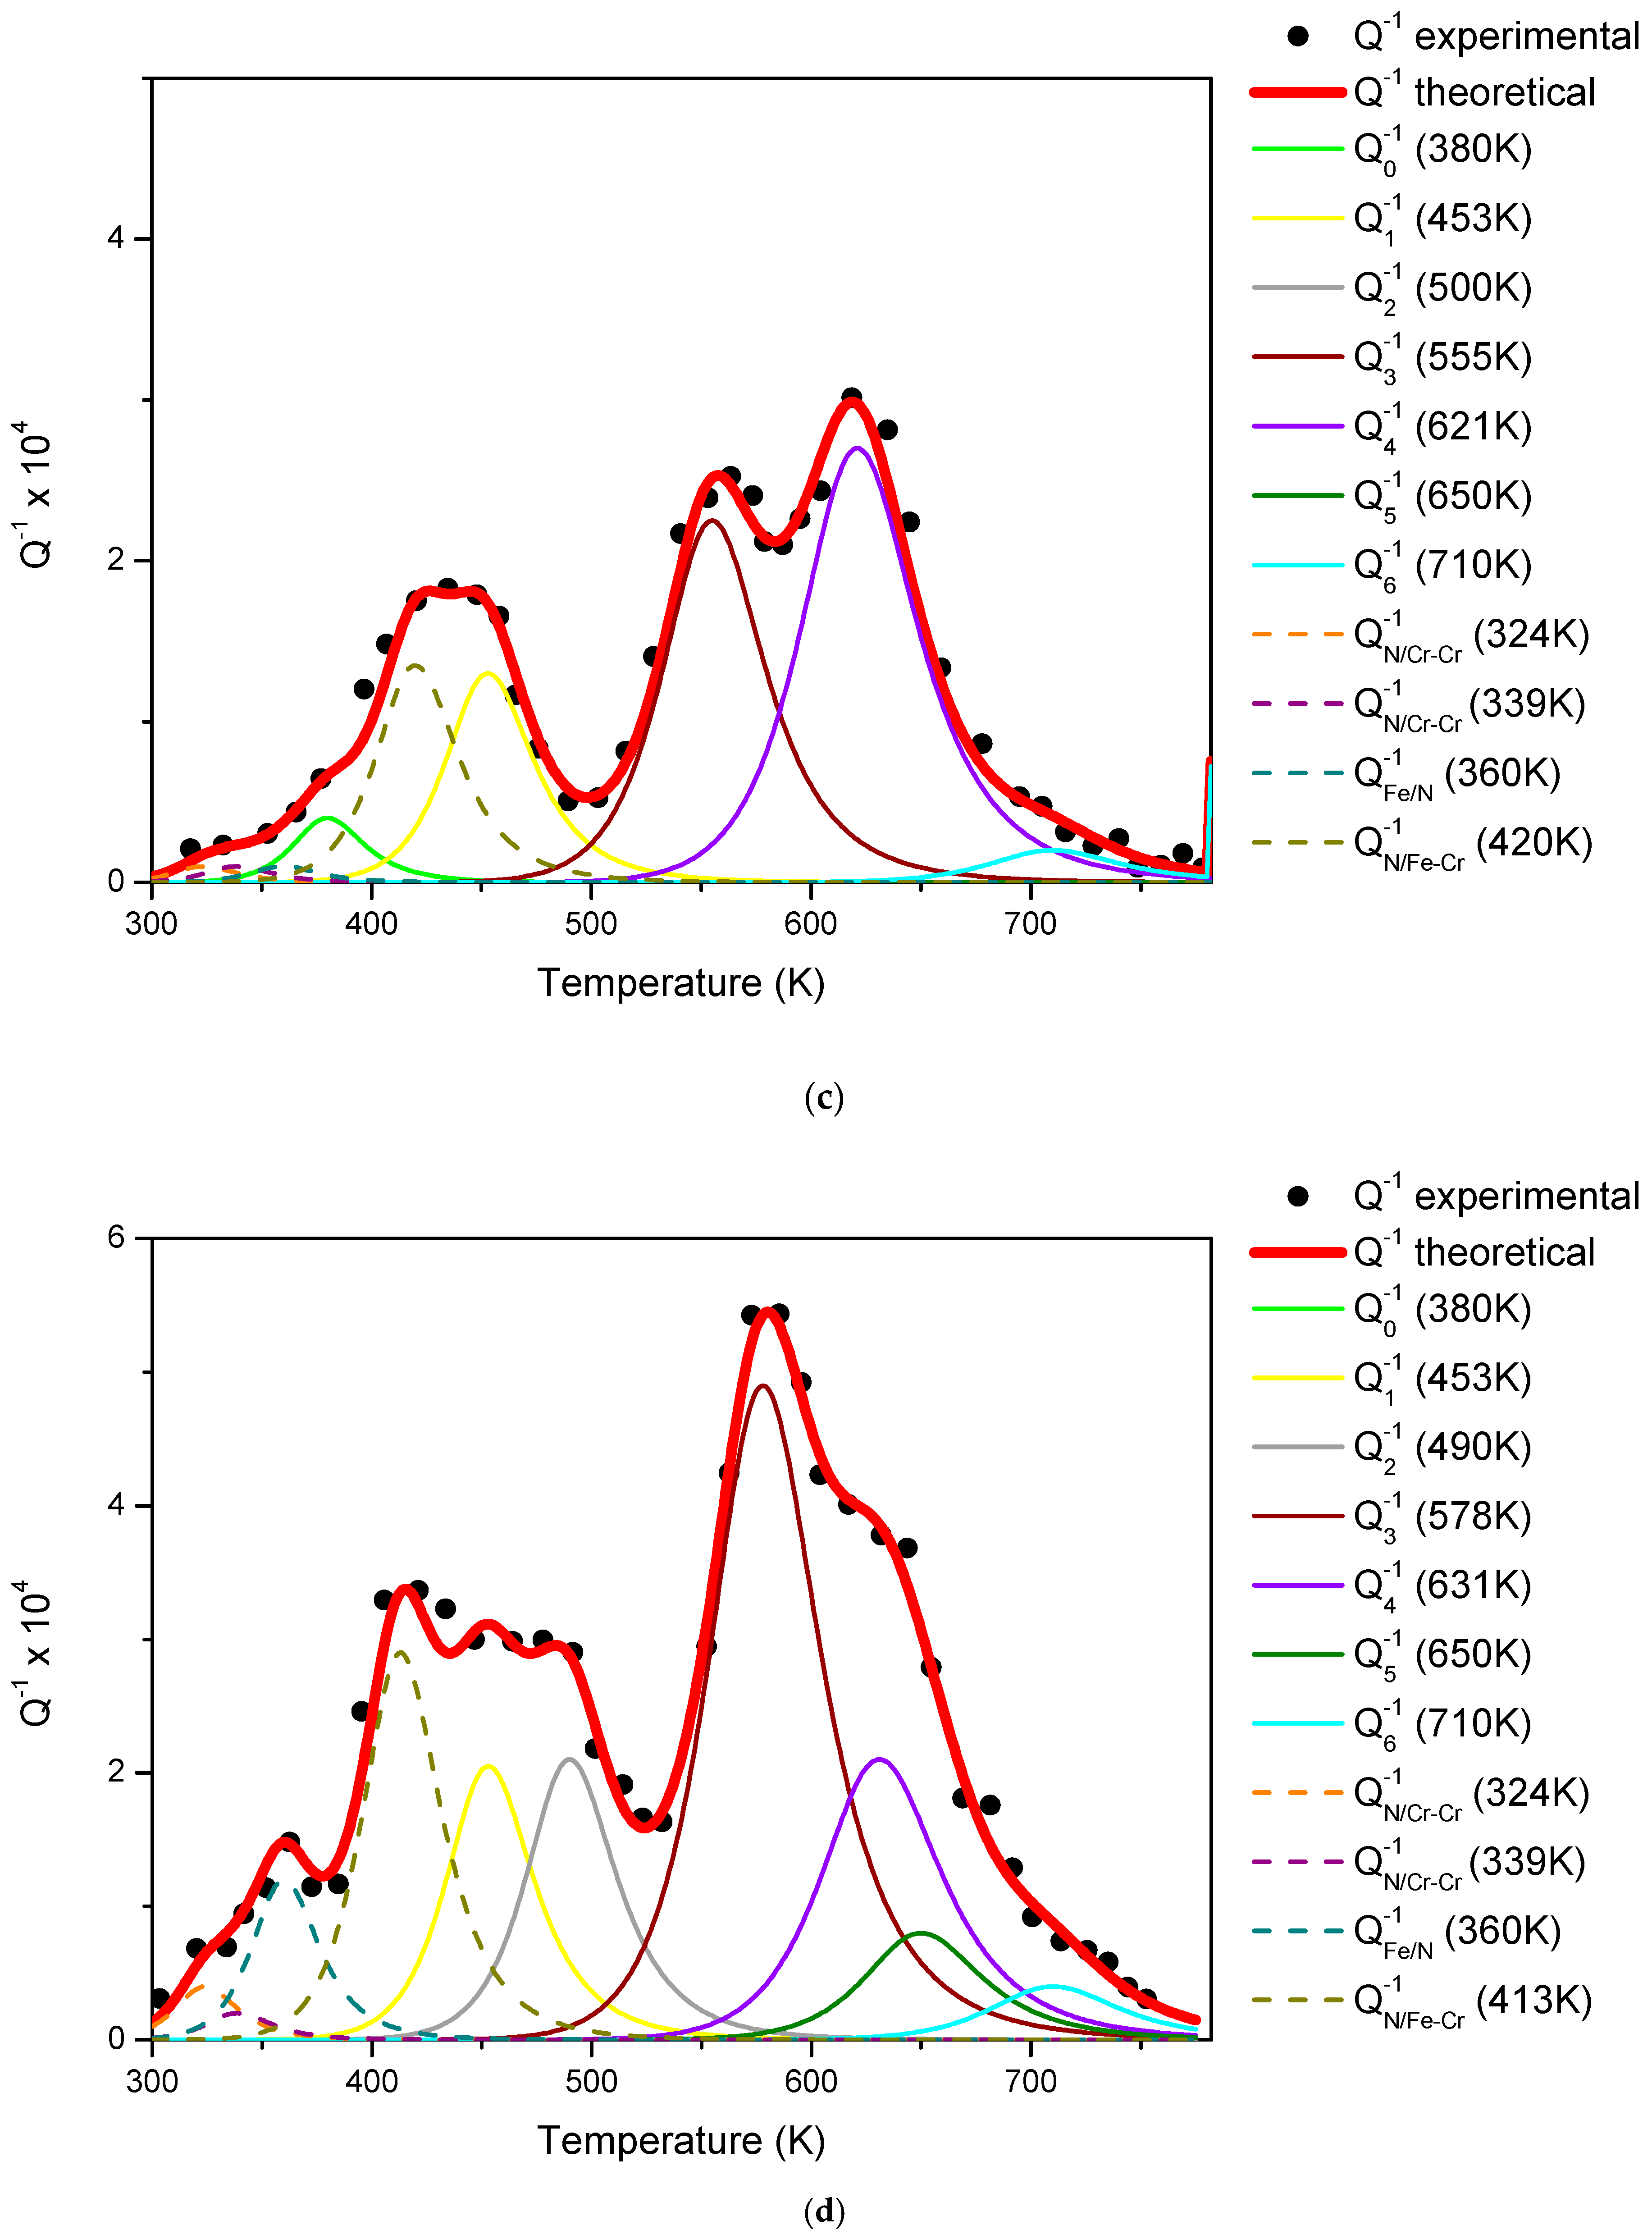
Figure 7 shows the
Q−1 curves of samples quenched at 3600 and 150 K/min, and treated at 973 K for 3.6 × 10
4 s (10 h) and 7.2 × 10
4 s (20 h). The curves of the steel quenched with the faster cooling rate (
Figure 7a,b) do not show relevant variations after the heat treatments, and maintain prevalent peaks referable to C–Cr associates with
i = 2 and
i = 4, like that of as-quenched steel (see
Figure 4a and
Table 3).
On the contrary, those of the steel cooled at a rate of 150 K/min (
Figure 7c,d) significantly change in two particular branches, at lower and higher temperature (substantially below or above 500 K), and can be distinguished referable to the occurrence of Cr-depleted and Cr-enriched zones, respectively (see
Table 4).
From the results, it is clear that the C–Cr associates distribution depends on the cooling rate from austenitic field; the distribution obtained with the lower cooling rate is not stable, and evolves when the material is heat treated at 973 K, giving rise to zones with different Cr content, i.e., Cr segregation. In particular, Cr segregation at grain boundaries is connected to phenomena of embrittlement and DBTT variations (see
Figure 5). The distribution of C–Cr associates in the steel, submitted to the higher cooling rate, is substantially stable, thus, segregation does not take place and, consequently, the mechanical behaviour is not affected by intercrystalline ruptures.
3.3. Interaction of Hydrogen with C–Cr Associates
Hydrogen in steels represents the cause of severe failures in mechanical components. Hydrogen embrittlement (HE) and hydrogen attack (HA) are different phenomena related to the presence of hydrogen in steels, and both of them have detrimental effects.
HE decreases the ductility, toughness, true stress at fracture, and accelerates crack growth [
31,
32,
33,
34], leading to catastrophic failure or delayed rupture of structural materials. Hydrogen can be pre-existing in the matrix, or picked up from the environment; in any case, HE effects depend on the concentration, temperature, composition, and microstructure of the material. Turnbull et al. [
35] analysed the combined effects of reversible and irreversible trap sites on hydrogen transport in Cr martensitic steels. Typical HE mechanisms are bubble formation, reduction in lattice cohesive forces, reduction in surface energy, and hydride formation.
HA is an irreversible process, occurring only above 473 K, and consists in the reaction of H with C to form methane (CH
4). The phenomenon, described and discussed in a classical paper by Shewmon [
36], causes swelling and brittle behaviour in plain carbon steels, whereas it does not occur in Cr steels if the Cr content is higher than 7%. Lacombe et al. [
37] demonstrated by means of autoradiographic technique that HE is suppressed because H concentrates around Cr-enriched grain boundaries and Cr carbides. The problem investigated here regards HA: how do C–Cr associates interact with H introduced into the steel at high temperature?
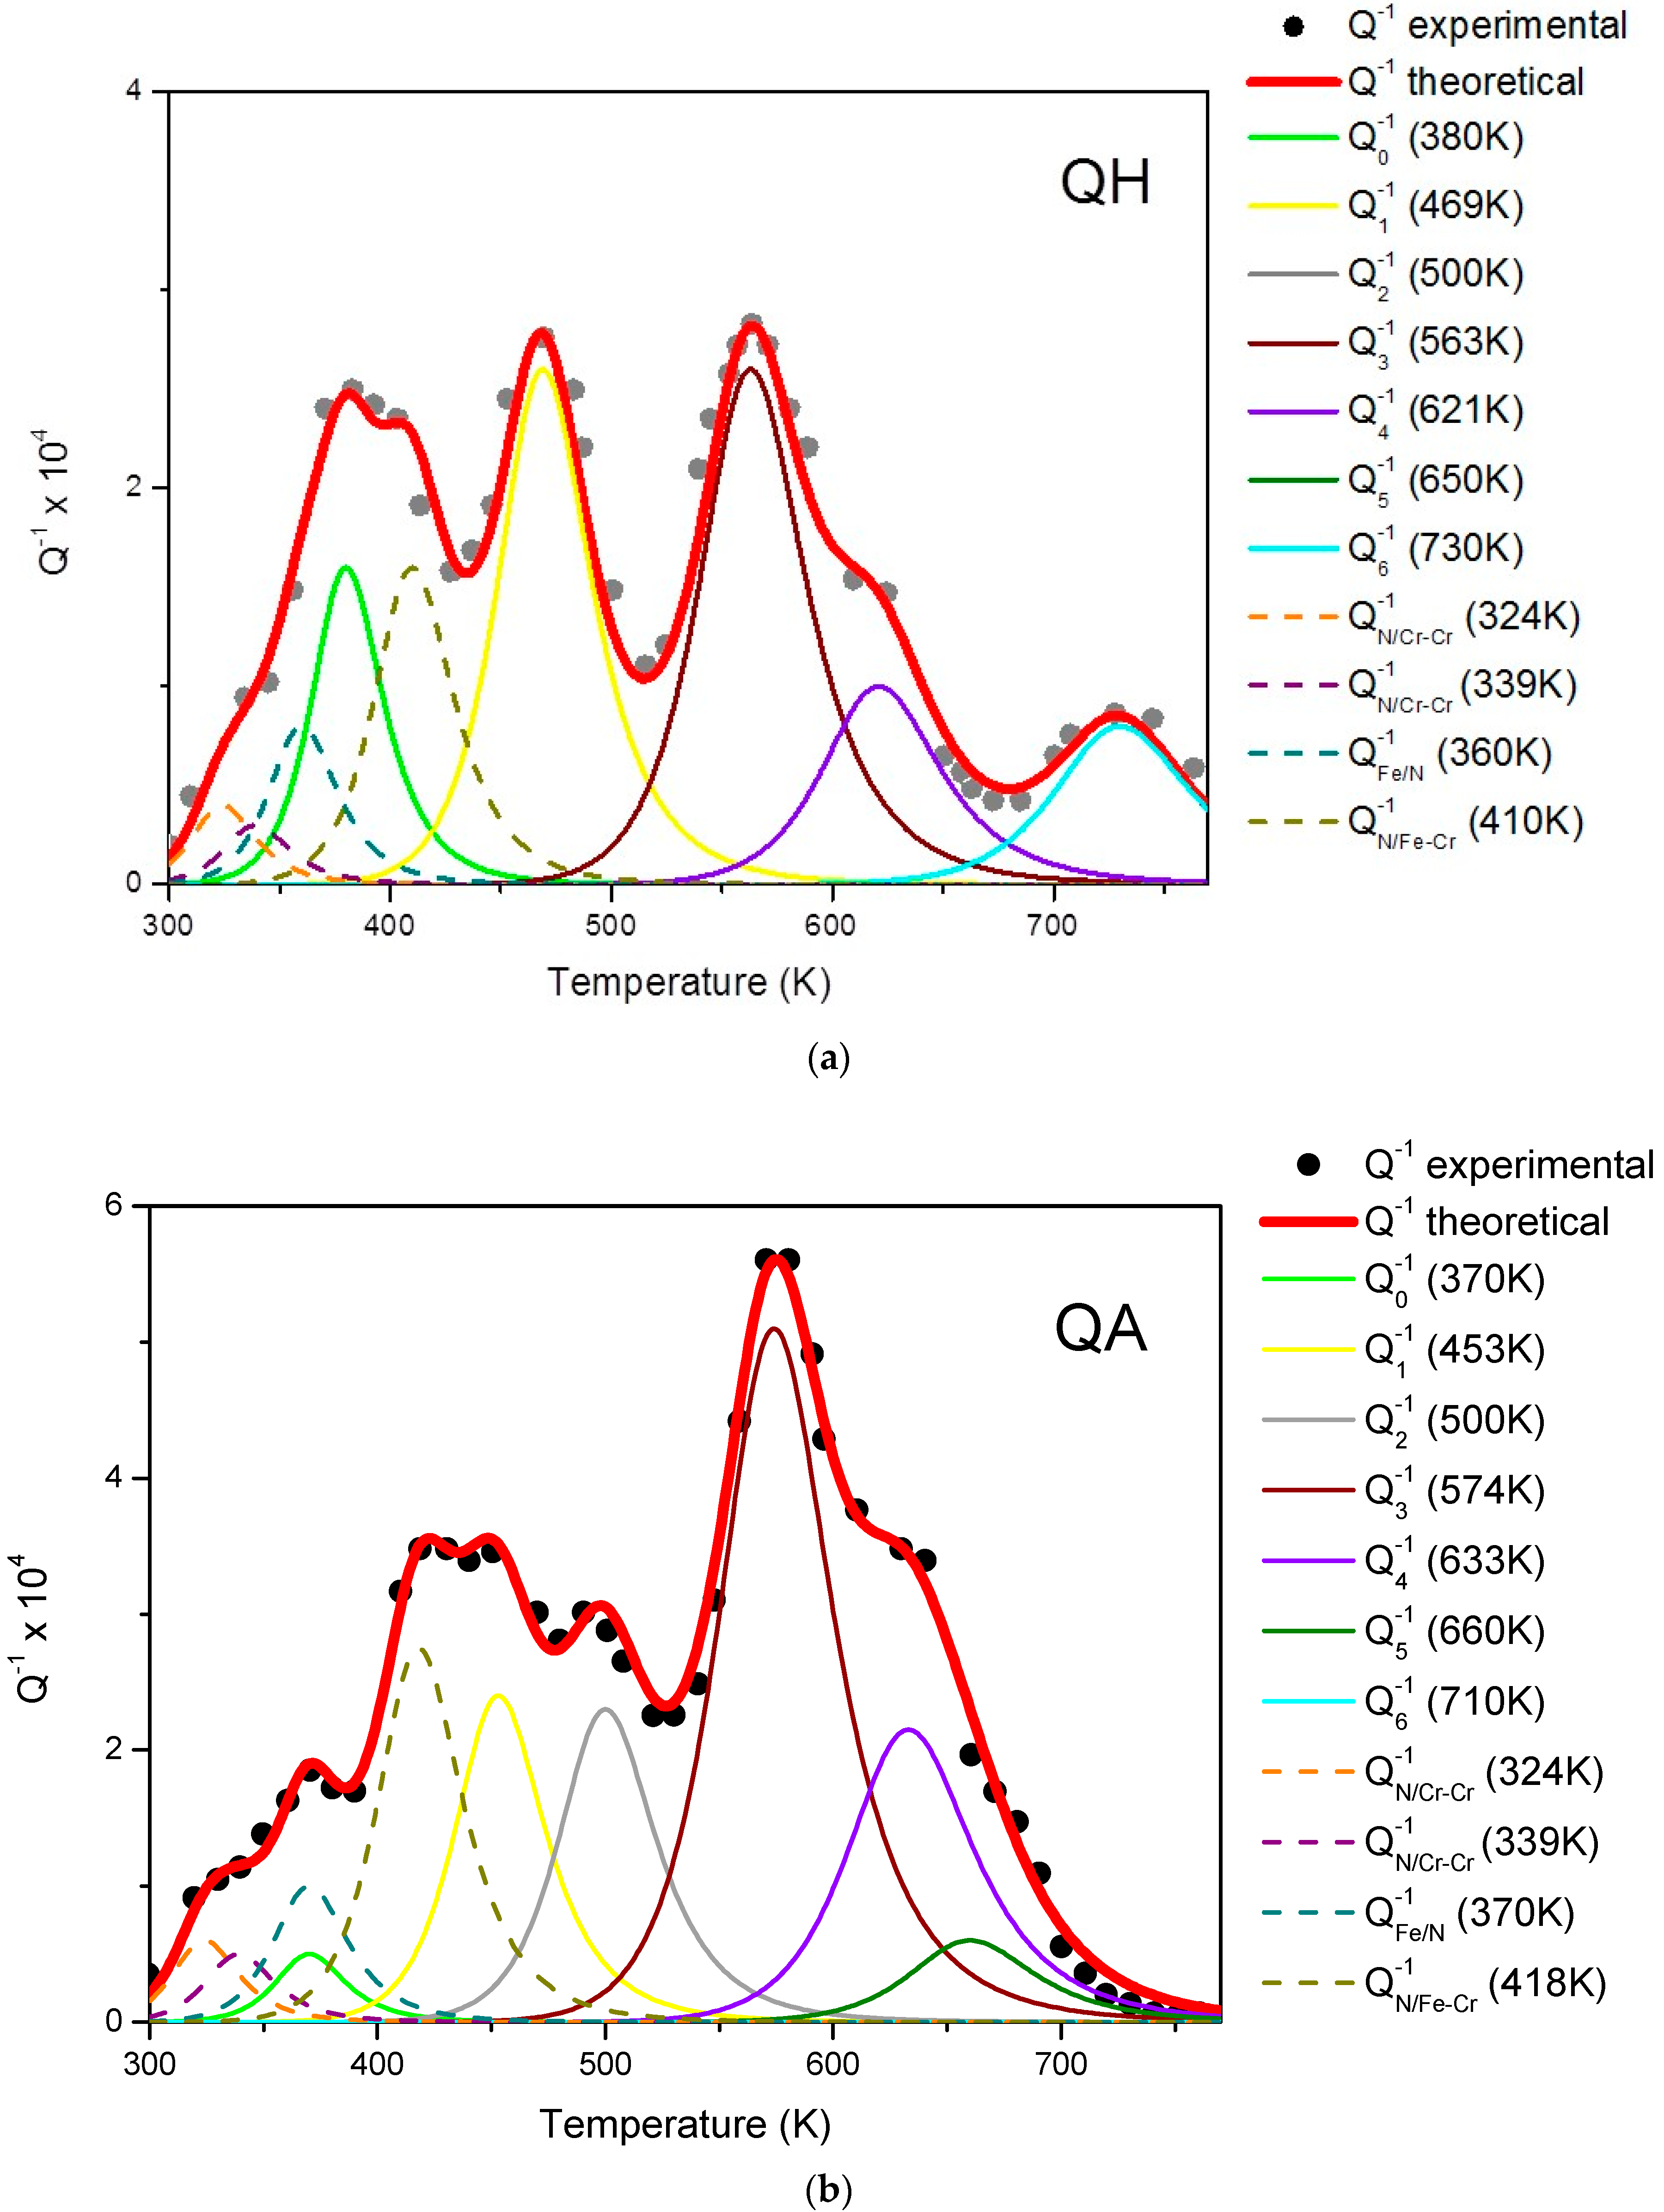
The steel has been submitted to an austenitisation treatment at 1348 K for 7.2 × 10³ s (2 h), and cooled to room temperature with a rate of 150 K/min. To examine the effect of H permeation on the material in different conditions, two sets of samples have been examined by MS measurements: as-quenched and annealed for 7.2 × 10⁴ s (20 h) at 973 K. Both sets have been H-permeated by a three-step treatment consisting of (i) heating up to 873 K at a rate of 6.7 × 10⁻³ K/s, (ii) permeation at 873 K for 8.6 × 10⁵ s in flowing gas with a pressure of 105 Pa, (iii) cooling down to room temperature at the same rate used for heating. MS measurements were carried out on both sets of samples before and after H permeation.
Q−1 curves of the steel, quenched and H-permeated (QH), quenched and annealed (QA), quenched, and annealed and H-permeated (QAH), are reported in
Figure 8. Experimental data are reported after background subtraction.
The relaxation strengths of the peaks used to fit the curves in
Figure 8 are reported in
Table 5. The
Q−1 curve of the quenched (Q) steel is displayed in
Figure 4b, and the corresponding data are reported in
Table 3 and, also, in
Table 5, to make the comparison easier.
As shown in
Figure 8 and
Table 5, H permeation changes the relaxation strengths
Δ of
Q−1 peaks, and the total amount of C and N atoms giving rise to relaxation processes.
From the comparison of the relaxation strengths of the as-quenched steel before and after H permeation, it is evident that the amount of interstitials (C and N) involved in relaxation processes is higher in H-charged samples. The total amount of interstitials contributing to relaxation processes is proportional to the area under the
Q−1 curve, and the ratio between the areas of Q and QH samples is 0.97. The increasing amount of C and N atoms contributing to relaxation processes depends on the martensitic structure evolution. As-quenched martensite consists of laths with a high density of dislocations (~10
11 cm
−2); such microstructure changes if the material is treated at the temperature of 873 K involved in H permeation, in particular, laths disappear, and dislocation density strongly decreases [
38]. Since laths and dislocations are sinks for interstitials, a large number of C and N atoms become free and, consequently, even if a part of them forms carbides and nitrides, and another part is bound by H atoms, the overall effect of H permeation treatment is to increase the amount of interstitial atoms participating in anelastic processes.
A different behaviour is exhibited by the samples annealed for 7.2 × l0
4 s at 973 K: the ratio between the areas under the
Q−1 curves of QA and QAH samples is 2.03. In this case, the material has, in origin, a fully recovered structure, and the precipitation of carbides and nitrides has been substantially completed [
38], therefore, C and N atoms contributing to relaxation peaks decrease, due to the H blocking effect.
It is noteworthy that the relative intensities of Q−1 peaks, due to C–Cr clusters with a higher number of Cr atoms, are strongly reduced after H permeation in both as-quenched (Q) and quenched and annealed steels (QA). In as-quenched steel, the intensities of the Q−16 and Q−14 peaks decrease from 2.6 × 10⁻⁴ and 4.0 × 10⁻⁴ (Q) to 0.8 × 10⁻⁴ and 1.0 × 10⁻⁴ (QH), respectively, while in quenched and annealed samples, the relaxation strengths of Q−14 and Q−13 peaks pass from 2.15 × 10⁻⁴ and 5.1 × 10⁻⁴ (QA) to 0.1 × 10⁻⁴ and 1.1 × 10⁻⁴ (QAH).
Each relaxation process consists of the alternative jumping of a single interstitial atom from an octahedral position to another one. If an atom of C is bound to an atom of H, it is no more able to jump because the process would not involve the single C atom, but the C–H pair with a tremendous lattice distortion. Since C atoms strongly bound by H atoms are hindered to participate in relaxation processes, the intensities of the corresponding Q−16 peaks are expected to decrease. Therefore, MS results indicate that a preferred interaction between H atoms and C–Cr associates with a high number of Cr atoms does exist. These associates play a significant role in HA mechanism because, if H atoms are attracted and bound by C–Cr associates, they are not able to diffuse towards grain boundaries, sub-boundaries, and dislocation tangles where CH4 bubbles could nucleate (first stage of HA), grow, merge and, finally, form fissures and cracks (final stage of HA).
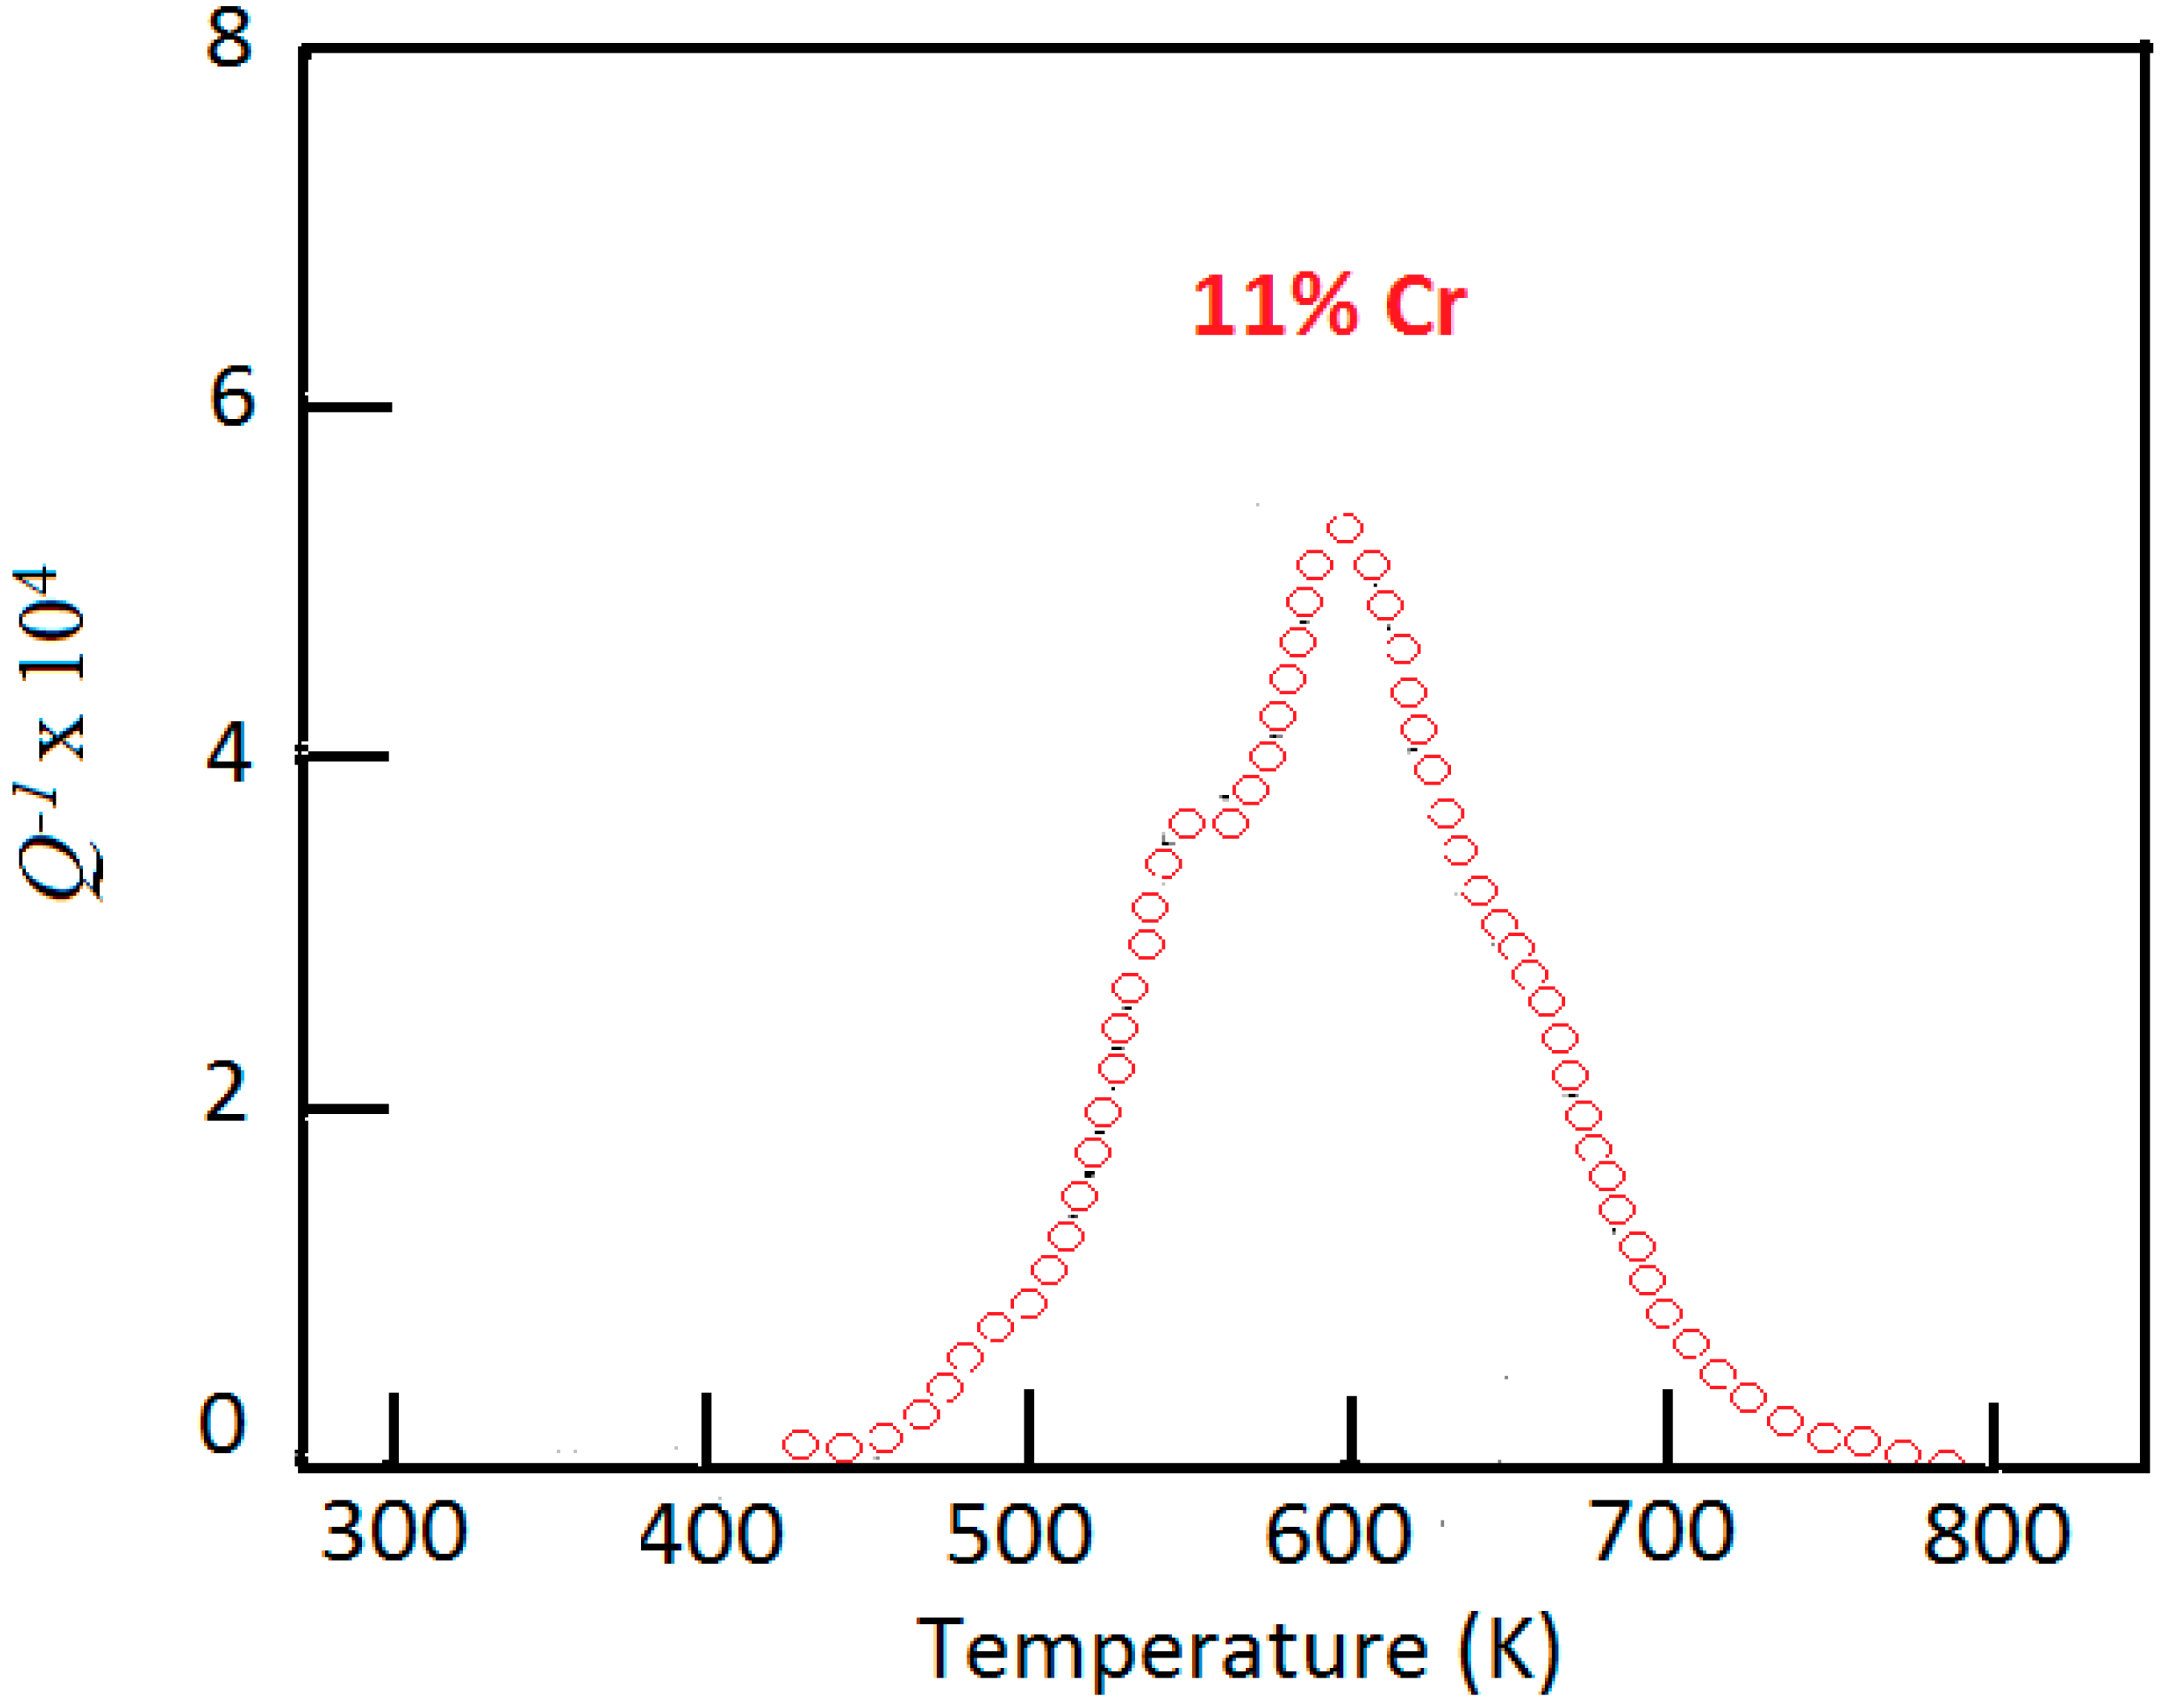
In conclusion, the present experiments demonstrate how C–Cr associates with a high number of Cr atoms contribute, together with Cr carbides and Cr-enriched boundaries, to block H atoms and suppress HA. The result is in agreement with the existence of a critical limit, around 7%, below which the Cr amount is not sufficient to avoid H attack. As a matter of fact, the
Q−1 peaks corresponding to C–Cr associates with a high number of Cr atoms are absent in the curves of low Cr steels (see ref. [
30]).
3.4. Nucleation of Cr Carbides
The aim of the present work is to determine whether the C–Cr associates affect the precipitation of Cr carbides and, in this case, to assess their specific role in the process.
The samples underwent austenitisation treatment (1.8 × 10³ s at 1348 K), then, were cooled to room temperature at a rate of 150 K/min, and subjected to a multi-step heat treatment consisting of successive steps of 3.6 × 10³ s at 673, 773, and 873 K. MS measurements have been carried out on the same samples after each heating step, while a set of different samples were used for destructive tests (carbide extraction). The examined temperature range is that of M7C3 and M23C6 carbides (M = metal, C = carbon) precipitation.
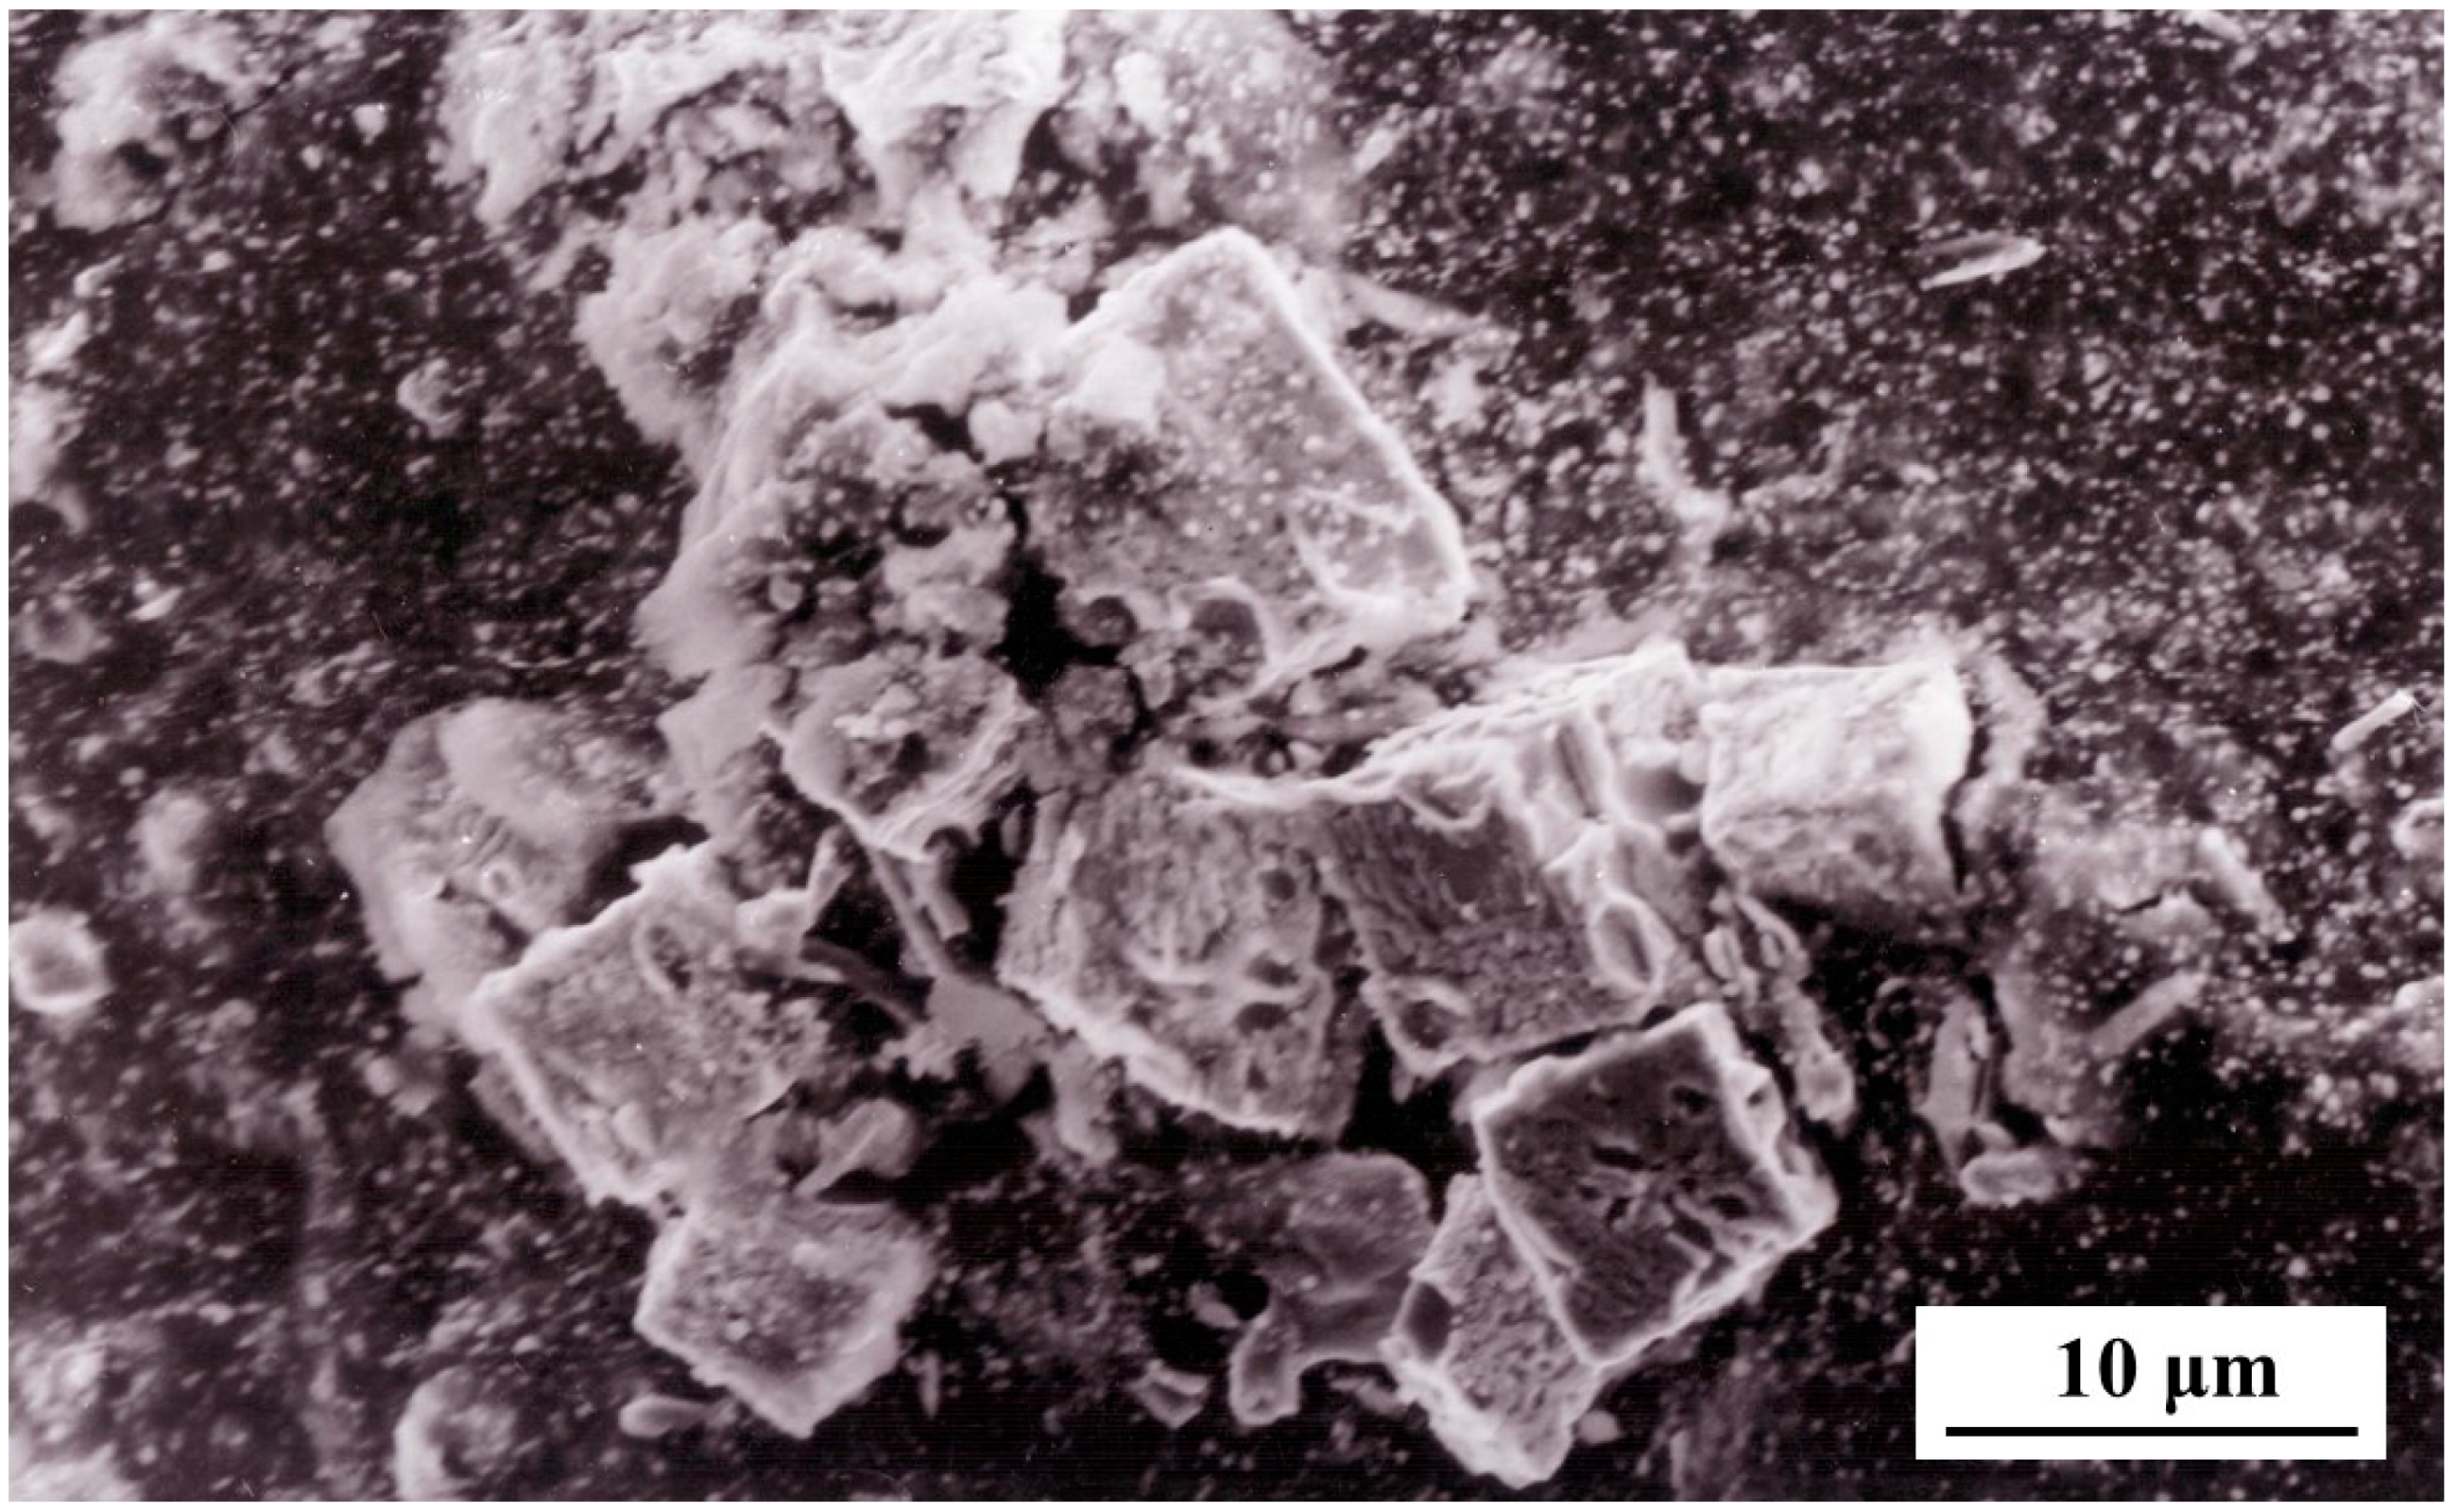
Carbides were extracted from the metallic matrix through an electrochemical method. For example,
Figure 9 shows the carbides extracted after the heating step at 873 K. The SEM image displays some squared particles (side ~7–8 μm), and a lot of small round particles (~0.1 μm); EDS microanalysis showed that the larger particles are rich in Cr, while those of smaller size are rich in Nb.
From XRD spectra, the carbides have been identified using the JCPDS-ICDD database [
39]:
NbC, cubic (a = 0.44698 nm), JCPDS-ICDD file 38–1364,
Nb2C, orthorhombic (a = 1.0920 nm, b = 0.4974 nm, c = 0.3000 nm), JCPDS-ICDD file 19–858,
Cr7C3, hexagonal (a = l.398 nm, c = 0.452 nm), JCPDS-ICDD file 11–550,
Cr23C6, cubic (a = 1.066 nm), JCPDS-ICDD file 35–783.
In fact, the XRD peaks exhibit small shifts with respect to the angular positions reported by the database, because it refers to monometallic carbides whereas, in the present case (see
Table 6), carbides contain also other elements in addition to the main ones (Nb and Cr). Therefore, the crystal structure is the same, but lattice plane distances are a little changed.
Table 7 summarises the XRD results and reports the most intense reflections of the carbides extracted after each heating step and their relative intensities. Only the XRD reflections of Nb-rich carbides (NbC and Nb
2C) are present after the 673 K heating step. These carbides, already present in austenitic field, are retained after quenching, and are substantially unaffected by the treatments in the examined temperature range. After the step at 773 K, M
7C
3 Cr-rich carbides form, whereas M
23C
6 carbides appear after the 873 K step. The change in relative intensities of XRD reflections indicate that the precipitation of M
23C
6 takes place at the expense of M
7C
3 carbides.
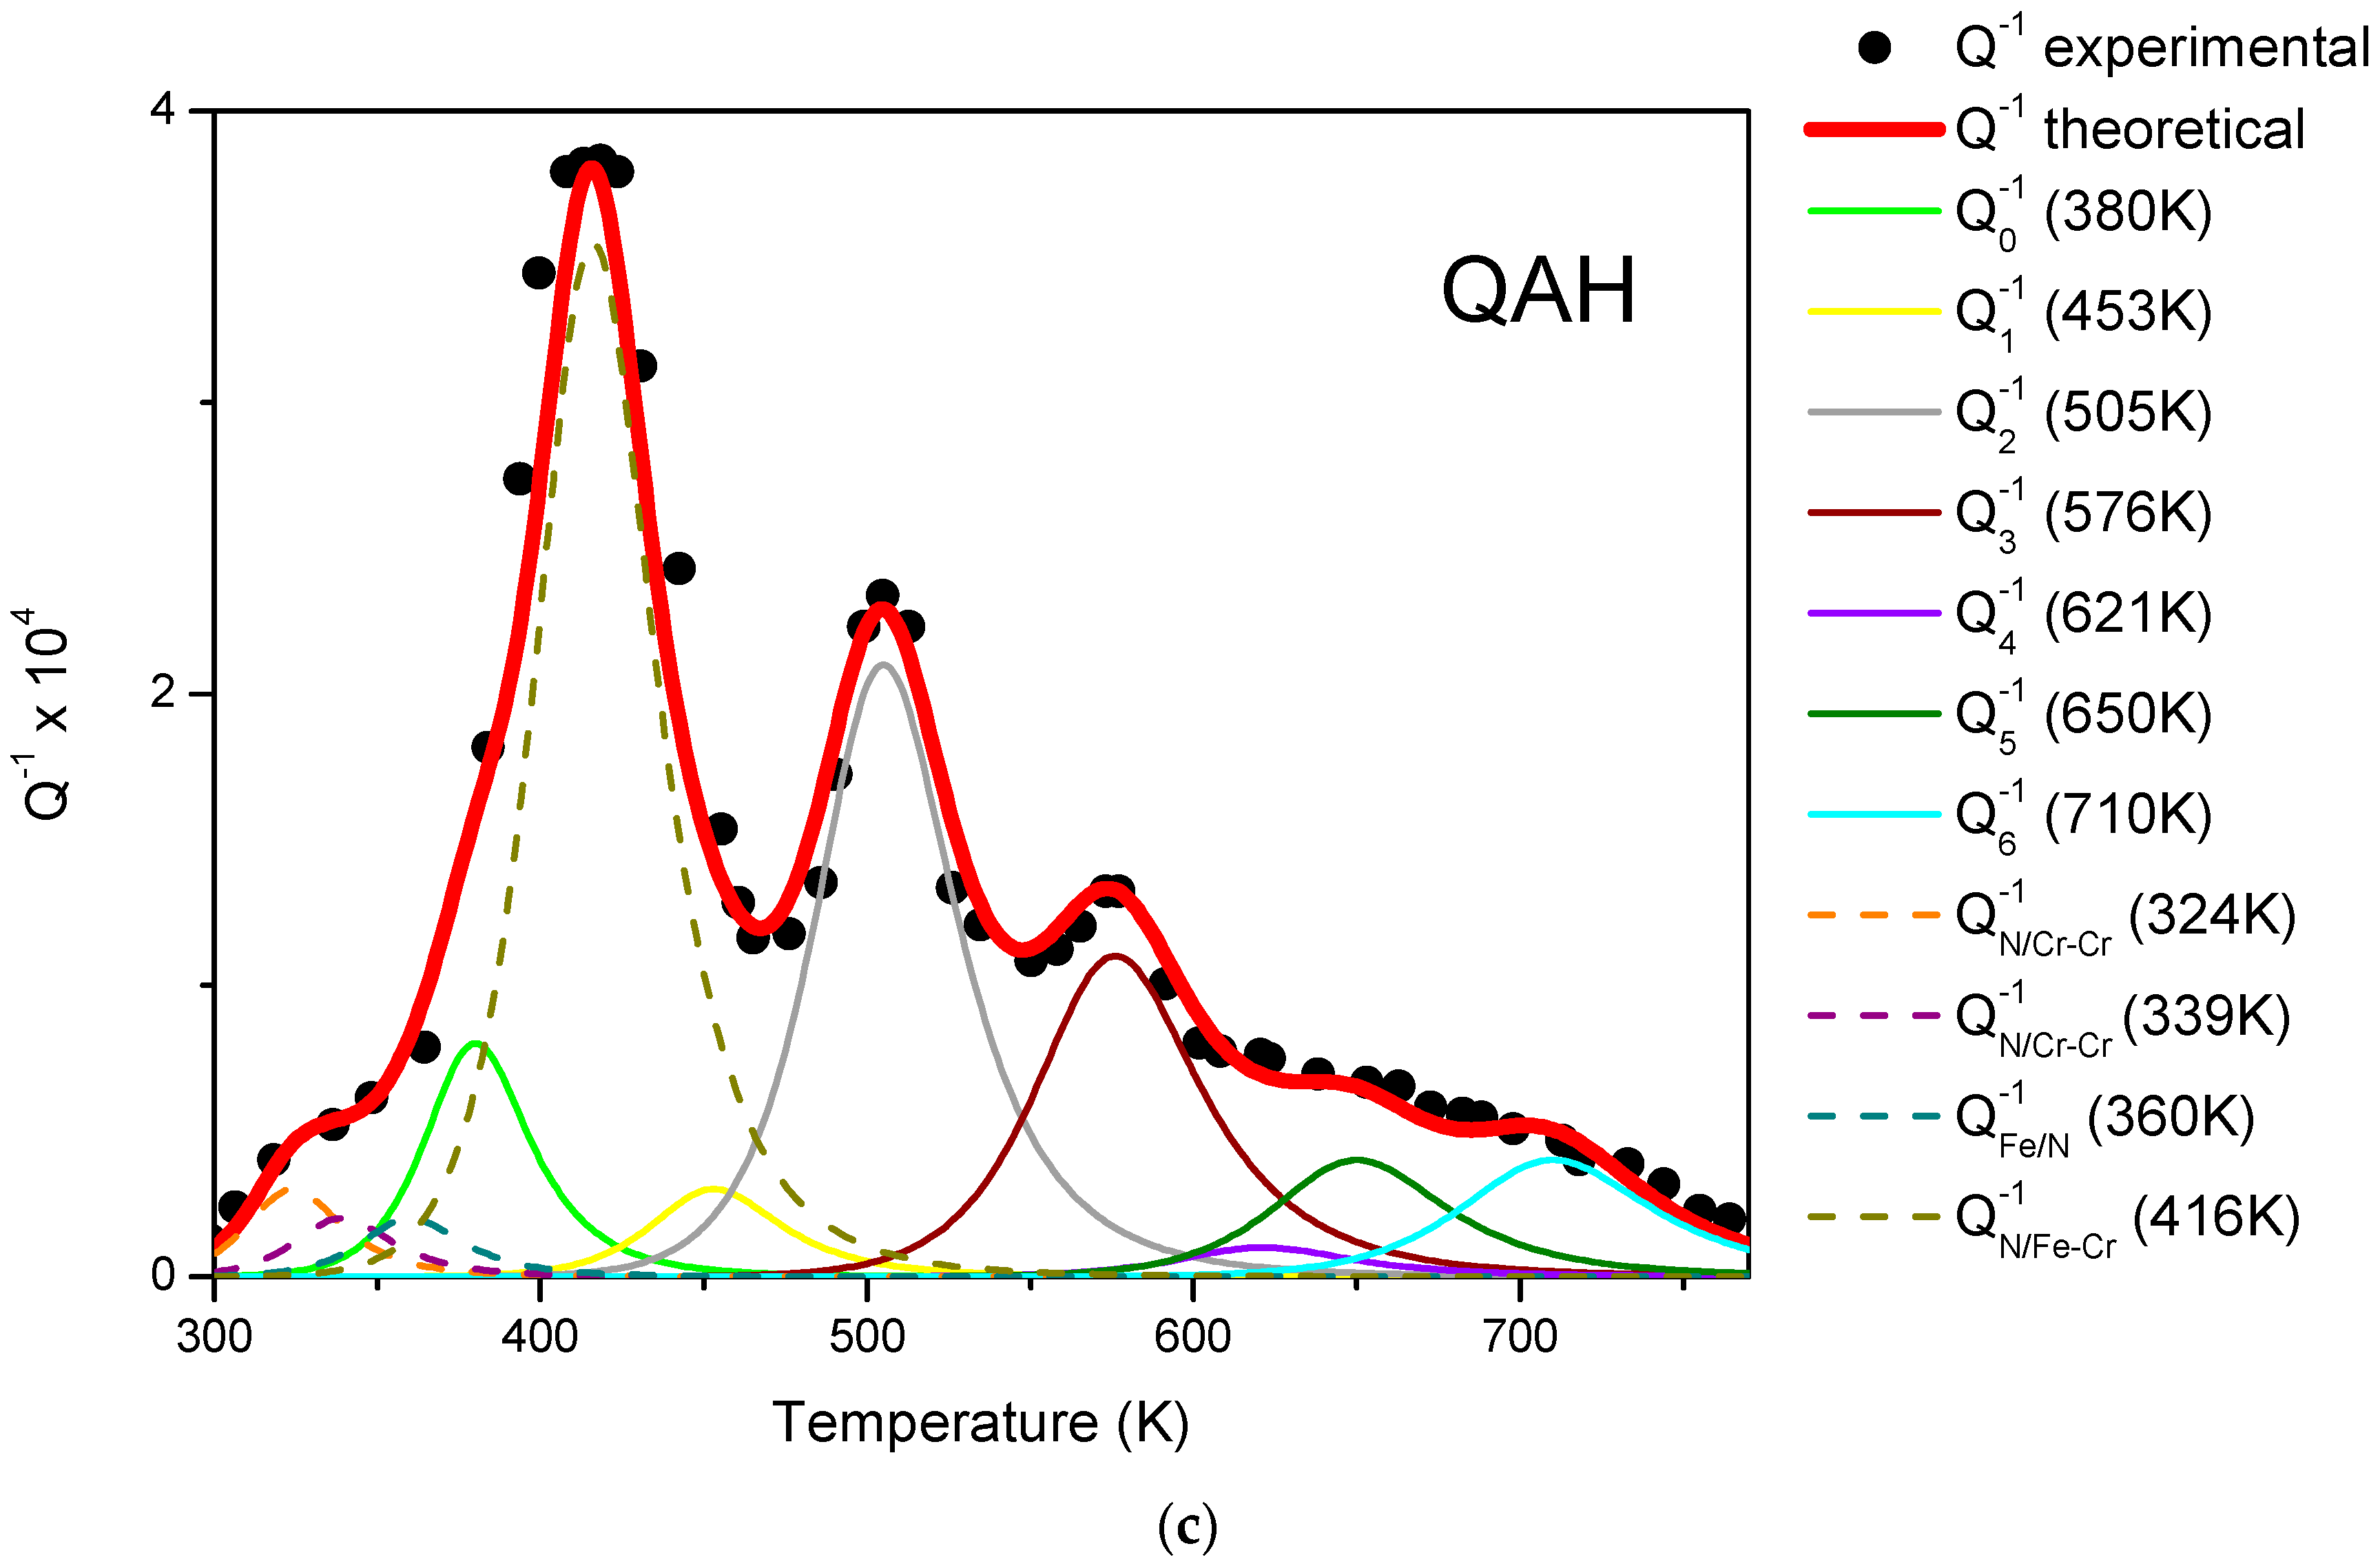
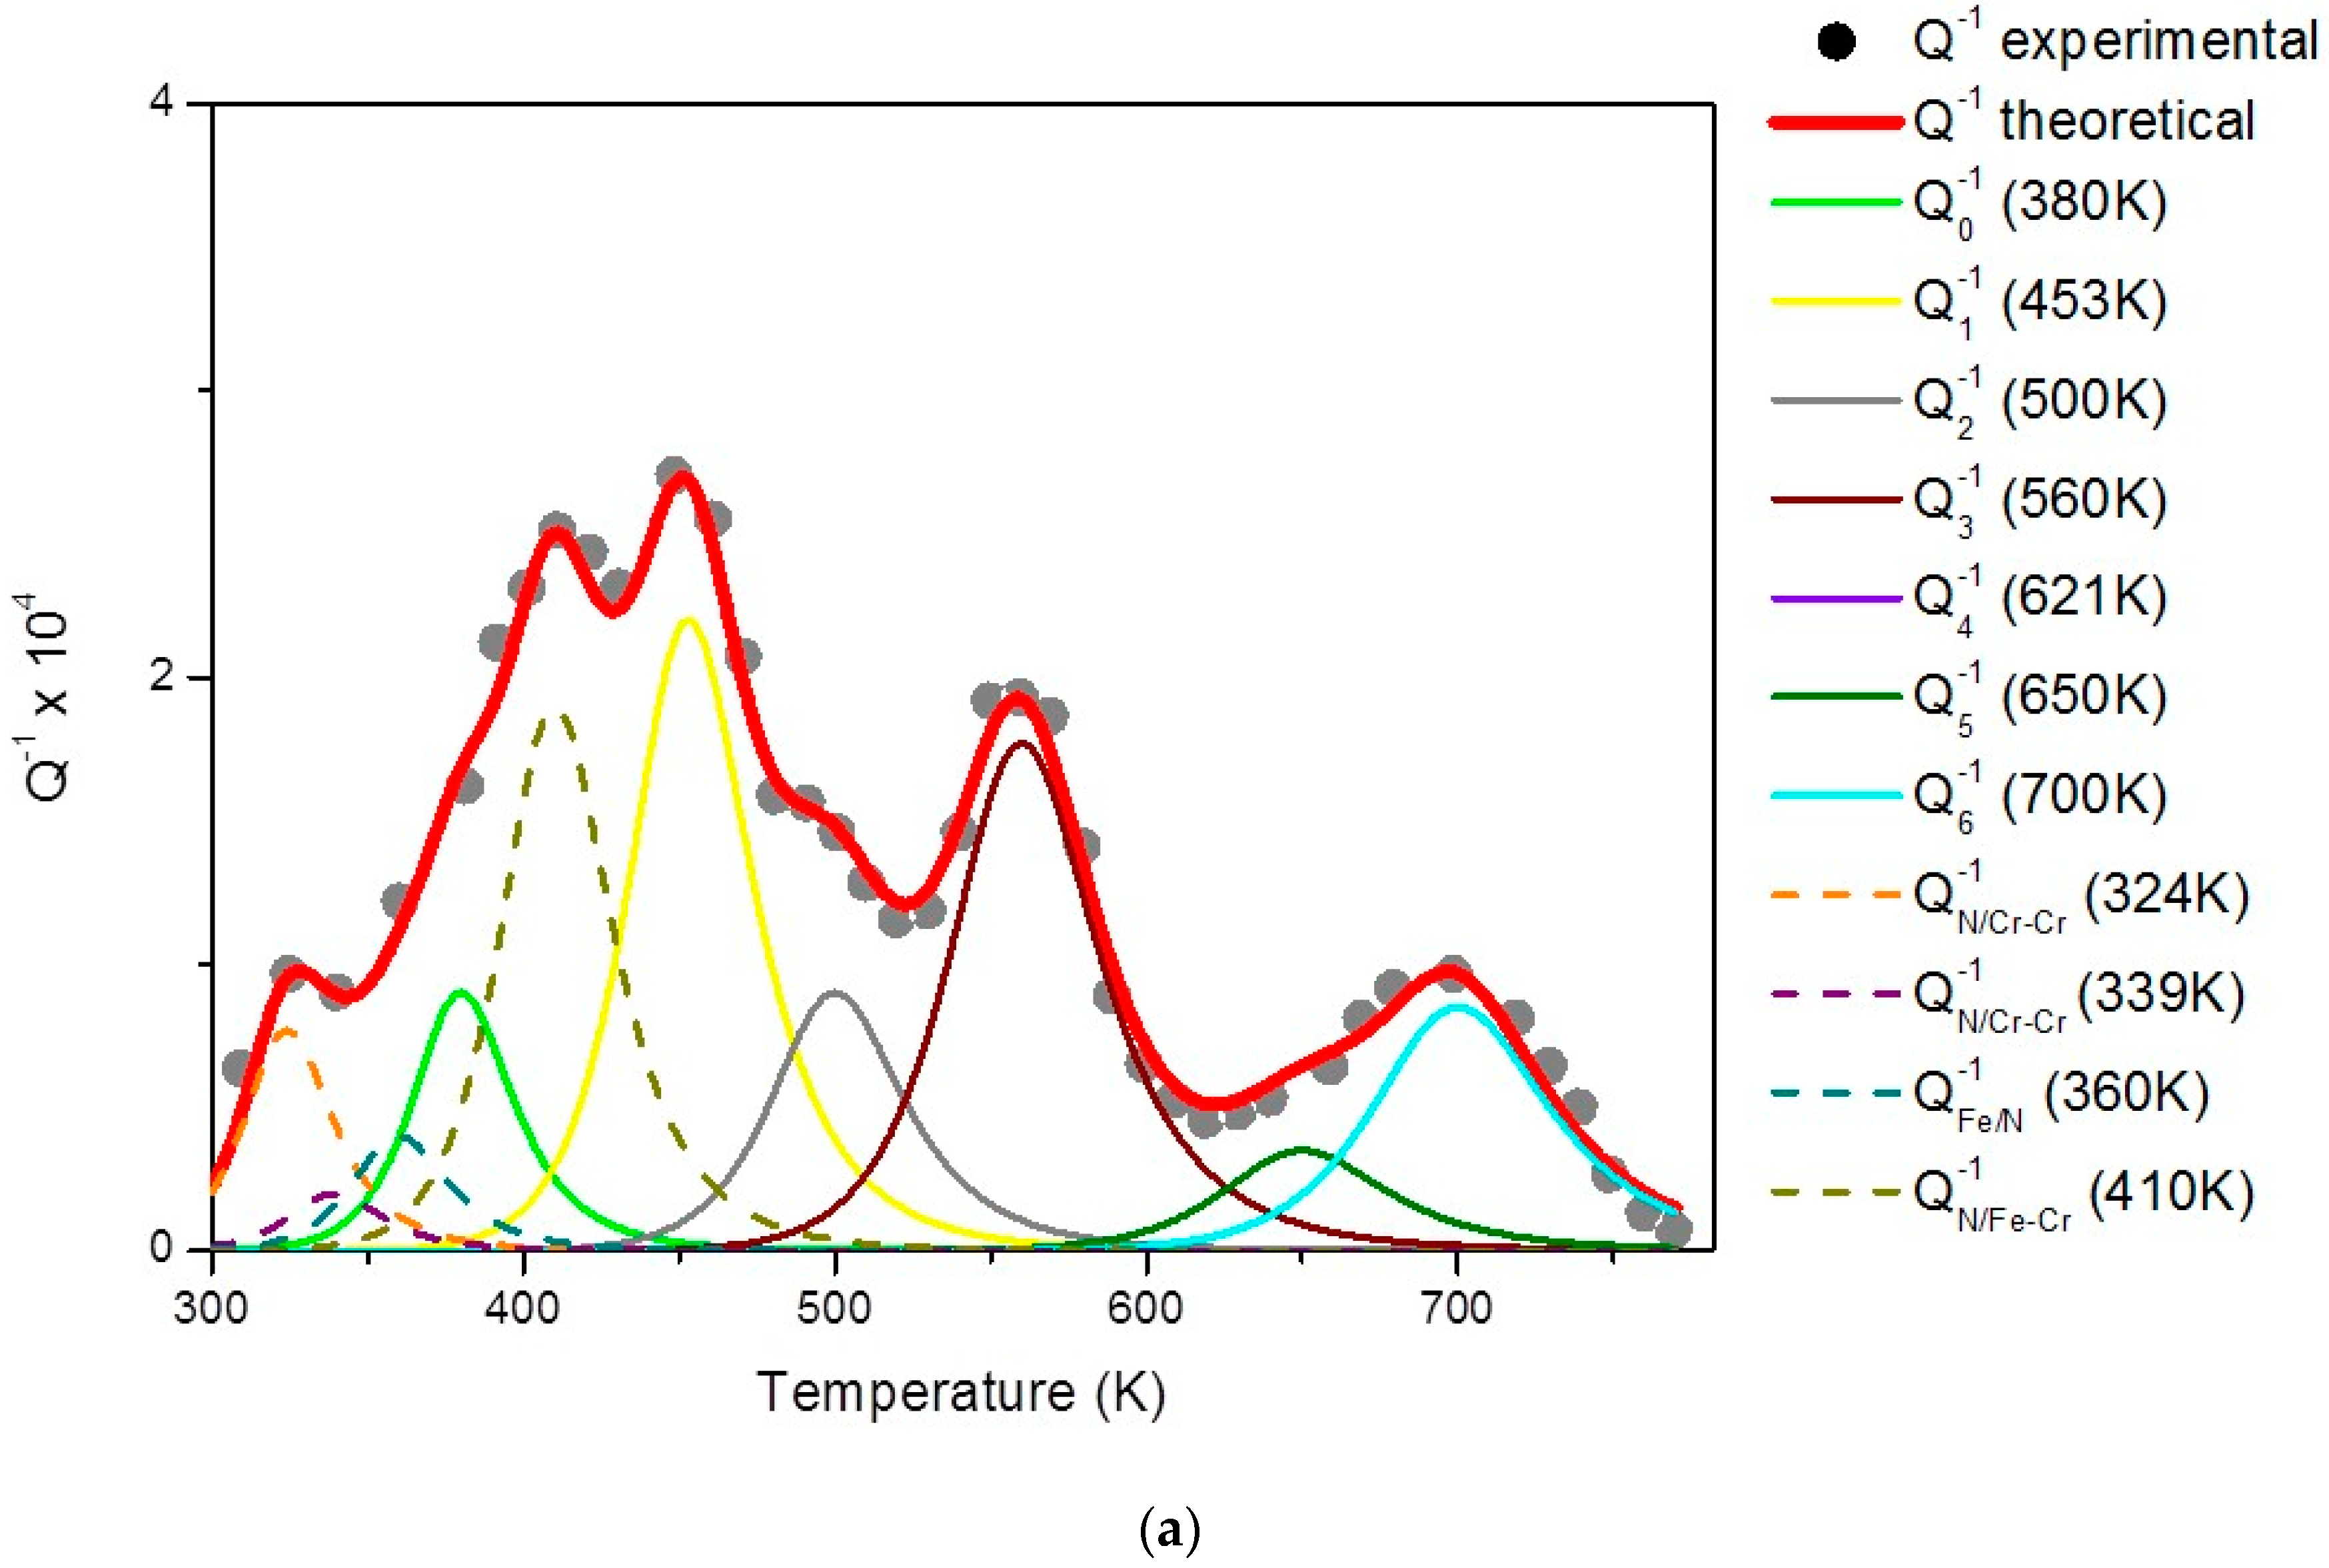
Figure 10a–c compares the
Q−1 spectra after successive heating steps; each spectrum has been fitted according to the aforesaid analysis procedure, and the different relaxation strengths are displayed. Also, in this case, experimental data are reported after background subtraction. In general, it can be observed that the spectra undergo relevant changes depending on the heat treatment temperature with variations of the peak relaxation strengths (see
Table 8).
The results indicate that the distribution of C–Cr associates is altered by treatments at increasing temperature. It is noteworthy that the most intense Q−1 peak after the 673 K treatment, namely, that connected with associates with 1 Cr atom, completely disappears after the successive step at 773 K, and reappears after the 873 K one. Such behaviour is clearly related to the precipitation of Cr-rich carbides in this range of temperatures.
EDS results in
Table 6 show that the composition of Cr
7C
3 carbides consist of 50% Cr atoms, thus, the ratio between C and Cr atoms is about 1:1. In concomitance with Cr
7C
3 carbides precipitation at 773 K, the
Q−1 peak due to relaxation of C–Cr associates with 1 Cr atom, which is the most intense after treatment at 673 K, becomes very low, indicating that these associates do not contribution more to relaxation. Therefore, Cr
7C
3 formation seems to occur through a process involving these types of associates. On these grounds, it is supposed that C–Cr
1 associates may directly aggregate to form Cr
7C
3 carbides.
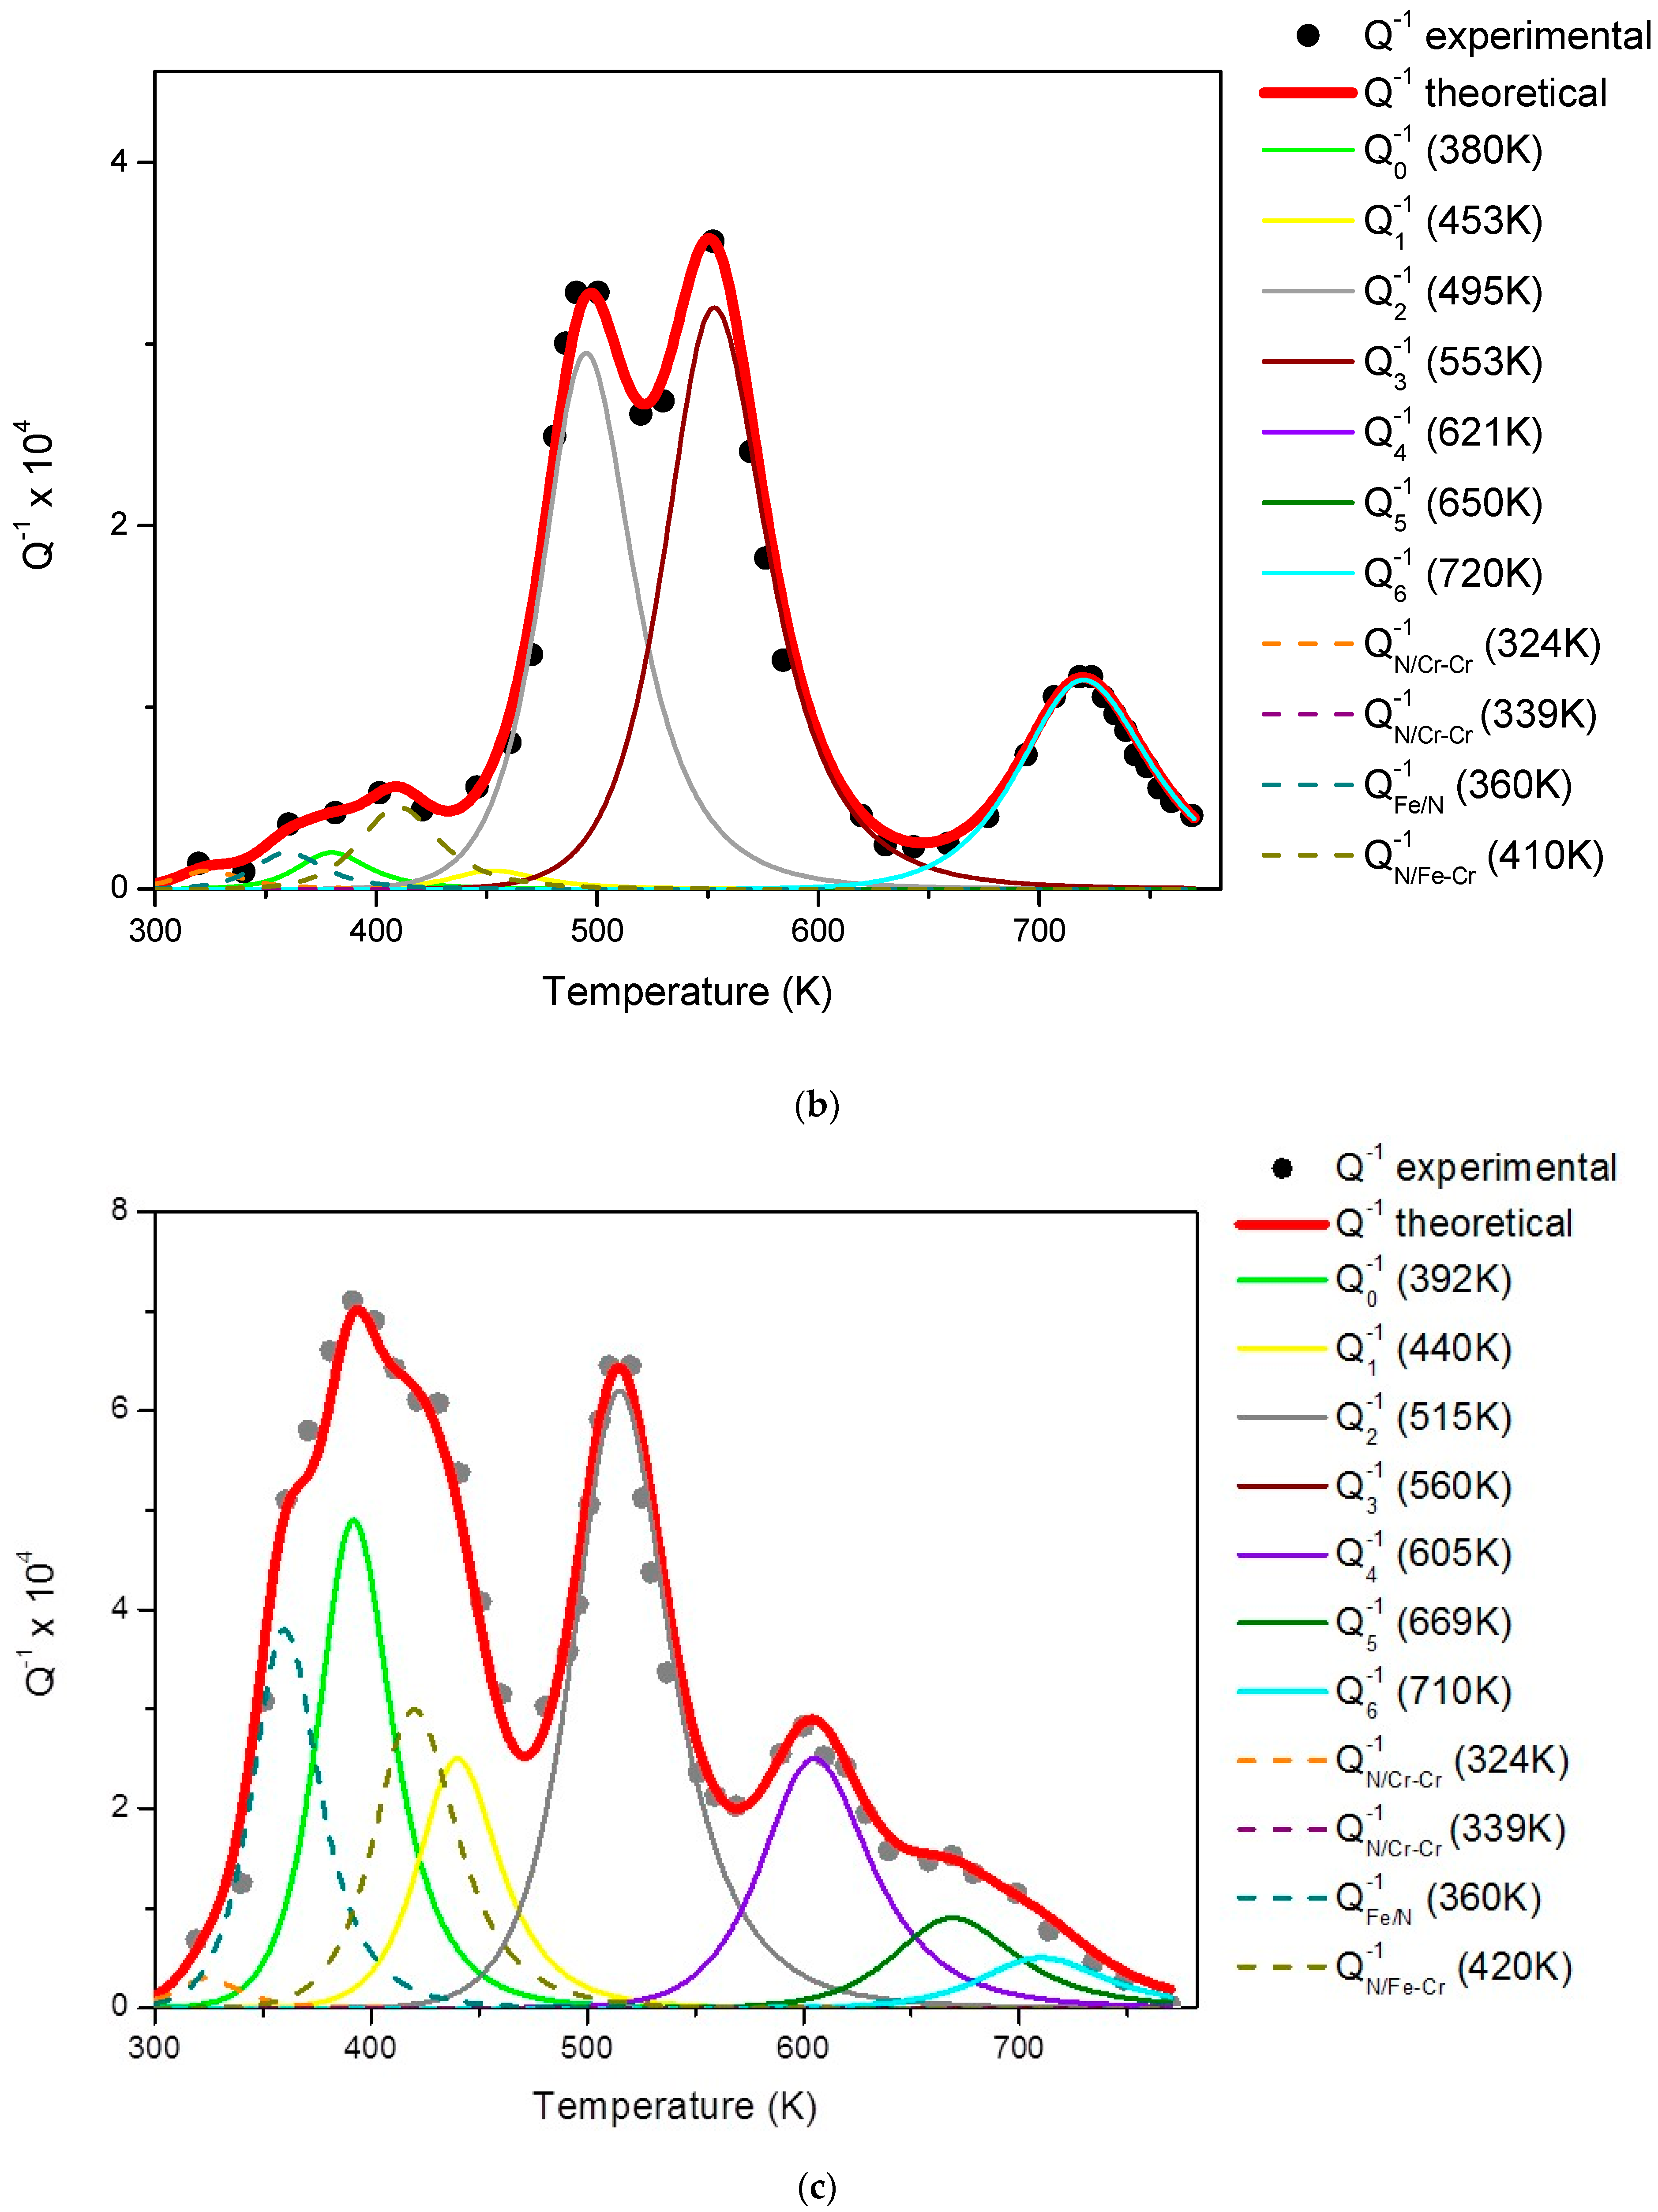
The hypothesis of carbide formation through C–Cr
1 aggregation is consistent with the Cr
7C
3 structure described by Dyson and Andrews [
40]. The positions occupied by metal and C atoms in the Cr
7C
3 carbide cell are displayed in
Figure 11: different atomic layers are indicated by specific symbols, and the complex structure consists of distorted octahedra having a C atom at the centre (one of them is indicated).
Following the 873 K heat step, Cr
23C
6 carbides form at expenses of Cr
7C
3 carbides, but nucleate on different sites [
41]. When Cr
7C
3 carbides solve, C–Cr
1 associates are released in the matrix, can thus participate again to relaxation processes, and the corresponding
Q−1 peak is observed in the spectrum (
Figure 10c).


