Article

Preparation of V-Al-Mo-Fe Intermediate Alloys by Controlled Aluminothermic Method

1
School of Metallurgical Engineering, Jiangxi University of Science and Technology, Ganzhou 341000, China
2
Gannan Laboratory, Ganzhou 341000, China
3
School of Metallurgy and Energy, North China University of Science and Technology, Tangshan 063210, China
*
Author to whom correspondence should be addressed.
Metals 2026, 16(2), 206; https://doi.org/10.3390/met16020206
Submission received: 11 January 2026 / Revised: 5 February 2026 / Accepted: 5 February 2026 / Published: 11 February 2026

Abstract

Vanadium (V), molybdenum (Mo), iron (Fe), and aluminum (Al) are crucial alloying elements in certain high-performance titanium alloys. Traditionally, these elements are added to titanium alloys in the form of binary master alloys such as V-Al, Mo-Al, and Ti-Fe. The preparation and use of multiple master alloys complicates titanium alloy production and increases cost. It is therefore desirable to introduce a single multi-component master alloy containing several alloying elements into the titanium alloy smelting process. This study proposes an aluminothermic co-reduction process for V2O5 and MoO3 to form a V-Al-Mo-Fe alloy with Al and Fe. Thermodynamic analysis indicates that the reduction of MoO3 by aluminum takes precedence over that of Fe2O3 and V2O5. Utilizing metallic iron as the iron source can effectively control the heat release of the system and reduce aluminum consumption. The formation of an Al-Fe alloy prior to the aluminothermic reactions decreases the reducibility of Al. Experiments confirmed that a specific Al/O ratio in the starting materials is necessary to complete the aluminothermic reduction of V2O5 and MoO3. The results show that the recovery rates of V, Mo, and Fe are strongly influenced by the Al/O ratio. When the Al/O ratio exceeds 1.6, recovery rates over 99% can be achieved for all alloying elements, with complete reduction of vanadium oxide and clear slag–alloy separation. This research provides a fundamental basis for preparing V-Al-Mo-Fe multi-component master alloys, demonstrating significant potential for applying the aluminothermic process to the preparation of other alloys.

1. Introduction

The demand for enhanced comprehensive performance of structural materials has escalated in advanced fields such as aerospace, marine engineering, petrochemicals, and weaponry. The service environments for these materials are evolving towards extreme conditions characterized by lightweight, high strength, high reliability, and extended lifespan [1,2,3]. Titanium alloys have become key structural materials underpinning the development of high-end equipment owing to their superior properties, including high specific strength, excellent corrosion resistance, good high-temperature performance, and strong fatigue resistance [4,5,6,7,8].
The properties of titanium alloys are highly dependent on the design and regulation of their alloying elements. Titanium (Ti) serves as the matrix, offering advantages such as low density, high strength, and good corrosion resistance. Aluminum (Al), as an α-phase stabilizing element, significantly enhances the alloy’s strength through solid solution strengthening [9,10,11]. Meanwhile, vanadium (V), molybdenum (Mo), and iron (Fe), acting as β-phase stabilizing elements, critically influence the alloy’s strength, toughness, and high-temperature performance by controlling the α/β phase ratio and refining the grain structure [12,13,14]. Together, these elements regulate the microstructure after heat treatment, thereby optimizing the strength–toughness balance [15,16]. Typical examples include the ASTM Ti-4322 (Ti-4.5Al-3V-2Mo-2Fe) and ASTM Ti-8823 (Ti-3.5Al-10Mo-8V-1Fe) alloys. Ti-4322 is based on the common ASTM GR5 alloy (Ti-6Al-4V) by introducing Fe and Mo to form a β-rich microstructure. Fe promotes diffusion behavior during deformation, while Mo inhibits grain coarsening [17,18,19]. The multi-alloying elements endow the alloy with excellent superplastic forming capability and enhanced hardenability [20,21,22]. Ti-8823 incorporates substantial amounts of β-isomorphous elements (Mo, V) alongside a small quantity of the eutectoid element Fe. This design ensures effective age-hardening while avoiding the precipitation of brittle phases [23], making it particularly suitable for aerospace fastener manufacturing [24,25,26]. Despite these merits, the conventional method of adding V, Mo, and Fe via binary master alloys (e.g., Al-V, Al-Mo, Ti-Fe) complicates the smelting process, increases cost, and risks compositional inhomogeneity. To overcome these limitations, the development of a single, multi-component V-Al-Mo-Fe master alloy is highly desirable. This study focuses on establishing a controlled aluminothermic co-reduction process for synthesizing such an alloy, aiming to clarify the thermodynamic competition among oxides, elucidate the role of metallic iron in heat management, and define the critical Al/O ratio for high elemental recovery and effective slag–metal separation.
The addition of high-melting-point elements such as V and Mo (melting points of 1910 °C for V and 2620 °C for Mo) tends to complicate the melting process and lead to compositional segregation. Currently, binary master alloys such as Al-Mo, Al-V, and Ti-Fe are predominantly used to introduce these elements into titanium alloys. However, this approach suffers from issues like complex raw material preparation and high costs [27]. Su et al. [28] prepared an Al-V-Mo master alloy using V2O5, MoO2, aluminum powder, and auxiliary materials. While this method integrated the three elements (Al, V, and Mo), it still faced challenges such as difficulty in controlling the self-propagating reaction, fluoride pollution, and the need to separately add Fe during titanium alloy smelting. Wang et al. [29] utilized V2O5, MoO3, and aluminum granules as starting materials and adopted an aluminothermic reduction process to synthesize a V-Al-Mo ternary master alloy for titanium alloys. This method addressed issues such as the synchronous and efficient reduction of molybdenum and vanadium oxides, achieving high elemental yields (99% for Mo and 95% for V).
Compared to the conventional use of separate binary master alloys, a single V-Al-Mo-Fe multi-component master alloy offers several key advantages: (1) process simplification—single-step addition reduces handling and melting stages; (2) improved composition control—minimizes segregation and enhances uniformity in the final titanium alloy; (3) cost reduction—lowers raw material, energy, and operational costs; and (4) enhanced reproducibility—reduces variability in alloy performance. These benefits are particularly critical for advanced titanium alloys such as Ti-4322 and Ti-8823, which require the precise and simultaneous addition of multiple β-stabilizing elements. Zhang et al. [30] employed V2O5, MoO3, aluminum, and iron as raw materials to prepare an Al-Mo-V-Fe master alloy by the aluminothermic method. The introduced potassium chlorate (as a heat-supplementing agent), magnesium (as an igniting agent), and CaF2 (as a slag-forming agent) increased production costs and impurity levels, while fluoride slag also raised environmental pollution and safety risks. Qing et al. [31] used aluminum, V2O5, MoO3, Fe2O3, and CaF2 to prepare an Al-V-Mo-Fe alloy in air. They reported that the aluminothermic reductions were completed within 80 s, and heat control is the key to obtaining high-quality alloys. The yields and impurities were not mentioned in this study because graphite crucibles were used, and the products were cooled in air, which can introduce carbon and oxygen into the alloy.
Preparing V-Al-Mo-Fe multi-component master alloys with uniform composition, low impurity content, and low cost enables the precise, single-step addition of multiple alloying elements during the melting of titanium alloys such as Ti-4322 and Ti-8823. Using a multi-component master alloy effectively enhances melting efficiency, improves composition control accuracy, and reduces segregation tendencies. However, current research still faces several critical unresolved issues: (1) the thermodynamic competition mechanism for the co-reduction of V, Mo, and Fe oxides by aluminum remains unclear, making it difficult to achieve high alloy yield; (2) effective means to suppress the intense high-temperature reactivity and splashing behavior are lacking; and (3) technical pathways for achieving compositional uniformity and simultaneous impurity control in multi-component alloys have yet to be established.
This study proposes a process based on the aluminothermic co-reduction of V2O5 and MoO3, accompanied by alloying with Al and Fe to form a multi-component alloy. By combining thermodynamic simulations with experimental validation, it systematically investigates the reduction sequences of multiple oxides, establishes the relationships between aluminum dosage, reaction temperature, and phase composition, and examines the factors influencing slag–metal separation behavior. The aim is to develop a low-cost and compositionally controllable method for preparing V-Al-Mo-Fe alloys. This work not only deepens the understanding of the thermodynamics involved in the aluminothermic reduction of multiple oxides but also offers theoretical and technical foundations for the green, efficient, and controllable preparation of multi-component master alloys for high-end titanium alloys. It is important for promoting the high-quality development of the titanium alloy industry. The key novelties of this work include: (i) the use of metallic iron instead of iron oxide to control heat release and reduce Al consumption; (ii) the systematic investigation of the Al/O ratio as a key parameter governing reduction completeness and slag–metal separation; and (iii) the integration of thermodynamic simulation with experimental validation to guide process design for multi-component master alloys.

2. Research Methodology

2.1. Materials and Formulation

The raw materials used in the experiments included aluminum granules, powders of V2O5, MoO3, and CaO, and iron. The specifications of raw materials are shown in Table 1.
In the preparation of the V-Al-Mo-Fe multi-component master alloys, the vanadium pentoxide and molybdenum trioxide are reduced by aluminum. The resulting metallic vanadium and molybdenum form V-Al-Mo-Fe alloys with excess aluminum and iron. The amount of vanadium, molybdenum, and iron in the alloys is primarily controlled by the amount of excess aluminum. The principal chemical and physical process reactions are:
12Al + 3V2O5 + MoO3 → 6Al2O3 + 6V + Mo
Al + V + Mo + Fe → V-Al-Mo-Fe alloy
Al2O3 + CaO → (CaO-Al2O3) slag
In the aluminothermic process, aluminum acts as both a reducing agent and an alloying element. Therefore, the actual amount of aluminum required is the sum of the quantity participating in the reduction shown in Equation (1) and the quantity forming the alloy shown in Equation (2). The Al/O mass ratio is defined to represent the weight ratio of the added aluminum to the amount of aluminum required as a reducing agent to complete reaction (1). An Al/O mass ratio of 1 means that all added aluminum reacts with the oxides, and no aluminum remains in the alloy. It should be noted that Al/O is defined based on the stoichiometric oxygen content of V2O5 and MoO3. In practice, oxygen may also be present in partially reduced vanadium oxides, dissolved in the alloy, or introduced from the crucible. Therefore, Al/O serves as an effective operational parameter rather than an exact measure of redox balance.
For the experimental preparation of the V-Al-Mo-Fe quaternary alloys, specific experimental conditions are given in Table 2 to maintain a mass ratio of V:Mo:Fe = 3:2:2 in the alloys. The only variable parameter is the aluminum addition, which results in different Al/O ratios and Al content in the alloys.

2.2. Experimental Procedure

The powders of V2O5, MoO3, CaO, and Fe were dried (at 120 °C for 2 h) and then thoroughly mixed with aluminum granules according to the required proportions. The mixture was then pelletized and placed inside a high-purity alumina crucible (purity ≥ 99%, inner diameter × height: 25 mm × 55 mm). The crucible assembly was supported by a thermocouple sheath and positioned within the constant temperature zone of a high-temperature tube furnace for experimentation.
The experiment was performed in a protective argon atmosphere to prevent oxidation of metals and alloys at high temperatures. The temperature inside the crucible was monitored in real time using a high-precision Type B thermocouple to reflect the heat change during the reaction. To obtain a high-quality alloy and achieve effective separation between the slag and the V-Al-Mo-Fe master alloy, the furnace temperature was increased stepwise according to a pre-determined heating curve. The heating rate was strictly controlled at 10 °C/min to avoid inducing temperature fluctuations that could affect the reaction process due to excessively rapid heating. Once the furnace reached the target temperature of 1600 °C, it was held at this temperature for 15 min. This holding treatment was designed to ensure that the reaction system attained equilibrium, to facilitate thorough separation between the alloy and the slag, thereby optimizing the microstructure and chemical composition homogeneity of the alloy. After the aluminothermic reaction was completed, the sample was furnace-cooled to room temperature. The crucible was then broken to retrieve the sample for subsequent microstructural and compositional analyses.

2.3. Sample Characterization

The slag and alloy samples were carefully separated and weighed. Typical samples were mounted in epoxy resin and subjected to sequential grinding and polishing. Microstructural features and polishing quality were examined using a LEICA DMC5400 optical microscope (Leica, Wetzlar, Germany). Phase compositions and microstructures were analyzed with a JXA-ISP100 electron probe microanalyzer (JEOL, Tokyo, Japan). The standards used for EPMA included alumina (Al2O3) for Al, Fe2O3 for Fe, wollastonite (CaSiO3) for Ca and Si, vanadium for V, and molybdenum for Mo. Note that EPMA can only measure elemental composition, and the valence state of each element is assumed by considering the microstructure. Bulk chemical compositions of the alloy and slag were determined using an Agilent ICPOES730 (Agilent, Santa Clara, CA, USA) inductively coupled plasma optical emission spectrometer (ICP-OES).

2.4. Thermodynamic Predictions

The relevant calculations and analysis were carried out using FactSage 8.3 thermodynamic software [32]. The Gibbs free energy and enthalpy changes in the reaction were calculated using the Reaction module within FactSage. Thermodynamic equilibrium calculations were performed using the Equilib module. The FactPS, FToxid, and SGnobl databases were selected, and the solution phases included in the calculations were FToxid-SLAGA, FToxid-SPINC, FToxid-MeO_A, FToxid-CORU, FToxid-VO, SpMCBN-LIQU, and SpMCBN-BCC1.

3. Thermodynamic Analysis of Aluminothermic Reactions

3.1. Gibbs Free Energy and Enthalpy Changes in the Aluminothermic Reaction of a Single Oxide

In the aluminothermic reaction, aluminum reduces various oxides while itself being oxidized. Therefore, the main reactions that may occur in the aluminothermic process are as follows:
Al + 0.3V2O5 = 0.5Al2O3 + 0.6V
Al + 0.5MoO3 = 0.5Al2O3 + 0.5Mo
Al + 0.5Fe2O3 = 0.5Al2O3 + Fe
Al + V + Mo + Fe = Al-V-Mo-Fe
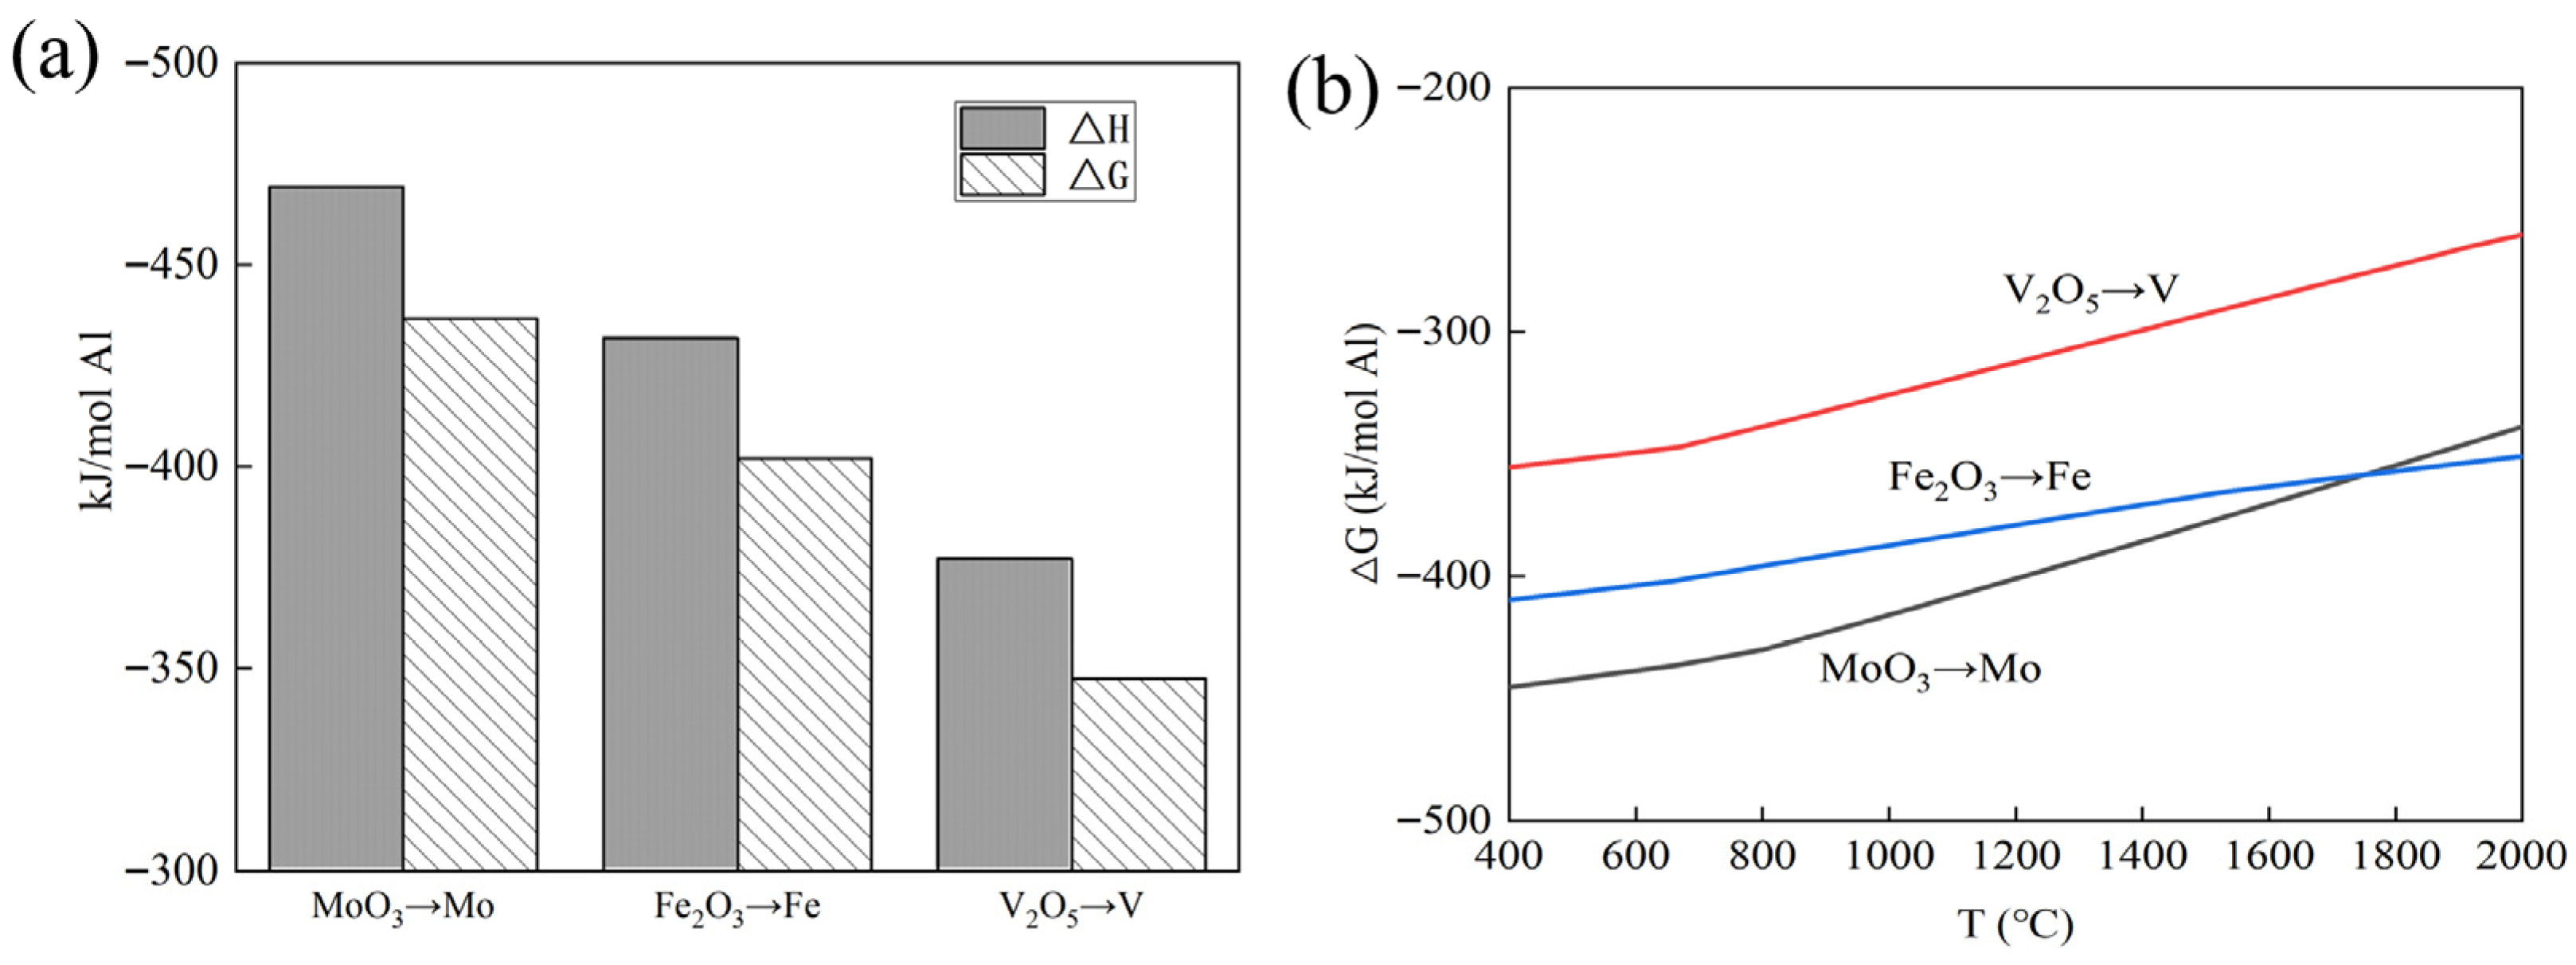
Whether a chemical reaction can theoretically proceed spontaneously and the magnitude of its driving force can be represented by the Gibbs free energy. The reaction module of FactSage software was used, standardizing the reaction based on 1 mol of elemental aluminum (Al) as the reactant, to calculate the Gibbs free energy and enthalpy change for reactions (4) to (6) at different temperatures. The calculated results are shown in Figure 1.
Figure 1a shows the changes in Gibbs free energy and enthalpy at 660 °C (the melting point of aluminum) for the reactions (4) to (6). It can be seen that:
(1)
The Gibbs free energy and reaction enthalpy change for all reactions are negative values, indicating that these reactions can proceed spontaneously and release heat at 660 °C.
(2)
Comparing the Gibbs free energy and enthalpy change for the reduction of different oxides to their corresponding metals, the reduction of MoO3 by aluminum has the greatest tendency and releases maximum heat. The reduction of V2O5 to metallic V has the lowest thermodynamic tendency and releases the minimum heat compared to the reduction of MoO3 and Fe2O3.
Figure 1b illustrates the change in Gibbs free energy as a function of temperature for reactions (4) to (6). Since all the aluminothermic reactions are exothermic, the Gibbs free energy for all reactions decreases with increasing temperature, indicating that higher temperatures are unfavorable for the reactions. At temperatures below 1750 °C, the tendency for MoO3 reduction is the strongest, followed by the reduction of Fe2O3 to metallic Fe. The reduction of V2O5 to metallic V by aluminum has the weakest tendency at whole temperature range. When the temperature exceeds 1750 °C, the tendency for Fe2O3 reduction becomes stronger than that for MoO3. This thermodynamic distinction provides a key rationale for optimizing the aluminothermic process through material selection and combination. It should be noted that, although the thermodynamic driving force decreases with rising temperature, elevated temperatures are practically essential to overcome kinetic barriers, promote complete melting of reactants and products, enhance diffusion, and achieve effective slag–metal separation. This is why the experimental procedure employs a high holding temperature of 1600 °C.

3.2. Thermodynamic Analysis of Reaction System Under Simulated Experimental Conditions

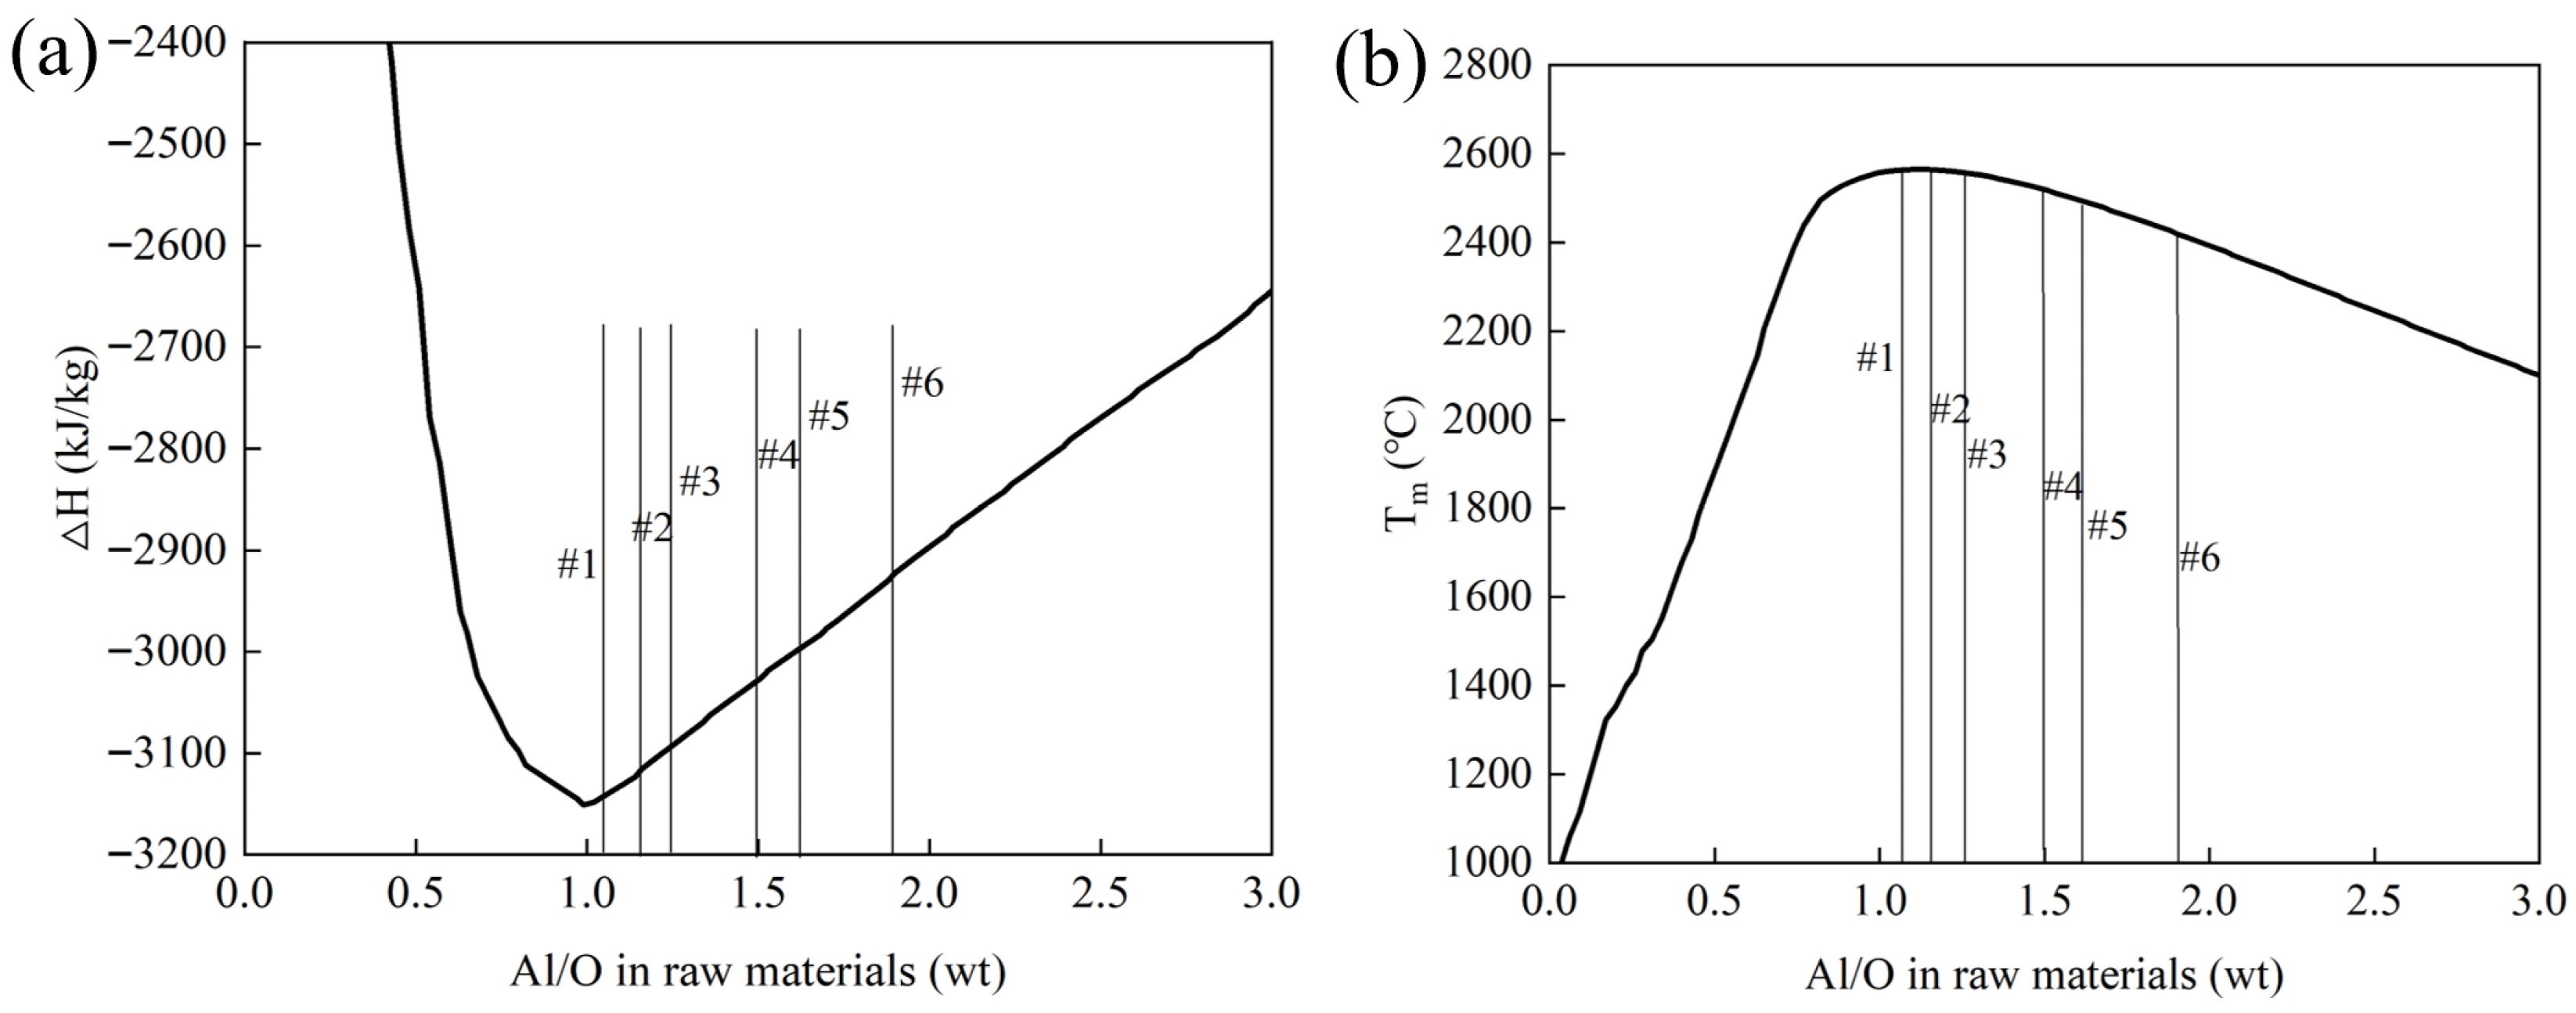
To rationalize the choice of metallic iron over iron oxide as the iron source, a comparative thermodynamic analysis was first performed assuming Fe2O3 as the reactant. This analysis demonstrates that using Fe2O3 would lead to excessively high reaction temperatures and unnecessary Al consumption, justifying the use of metallic Fe in the actual experiments. Based on the experimental design outlined in Table 2 and assuming Fe2O3 as the iron source, thermodynamic calculations were performed to simulate the experiments using the Equilib module in FactSage 8.3. The specific heat release was calculated by the heat change (kJ) per kg of reactants, including reactions (4) to (7). The maximum reaction temperature (Tm) was obtained by assuming ∆H = 0. As can be seen from Figure 2 and Table 3, the heat released by the aluminothermic reaction and the maximum reaction temperature gradually increase with increasing Al/O ratio until Al/O = 1.0. ∆H reaches a maximum of 3148 kJ/kg with a theoretical maximum temperature of 2560 °C at an Al/O ratio of 1.0. After that, the aluminothermic reaction is completed, and the resulting Fe, Mo, and V form an alloy with excess Al. This alloying process absorbs heat, leading to a reduction in the total heat release and theoretical maximum temperature. Ref. [28] reported that in the preparation of V-Al-Mo ternary alloys, combined experimental and theoretical calculation results show that when the theoretical maximum temperature exceeds 2400 °C, excessive heat release causes the alumina crucible to rupture, leading to premature termination of the reaction and a decrease in vanadium recovery. Figure 2b shows that the theoretical maximum temperatures for all reactions planned in Table 3 exceed 2400 °C when using V2O5, MoO3, and Fe2O3 as raw materials. It is therefore not recommended to use all oxides as starting materials from the perspective of heat control. On the other hand, aluminum is more expensive than iron. It is not worthwhile to use aluminum to reduce iron oxide.
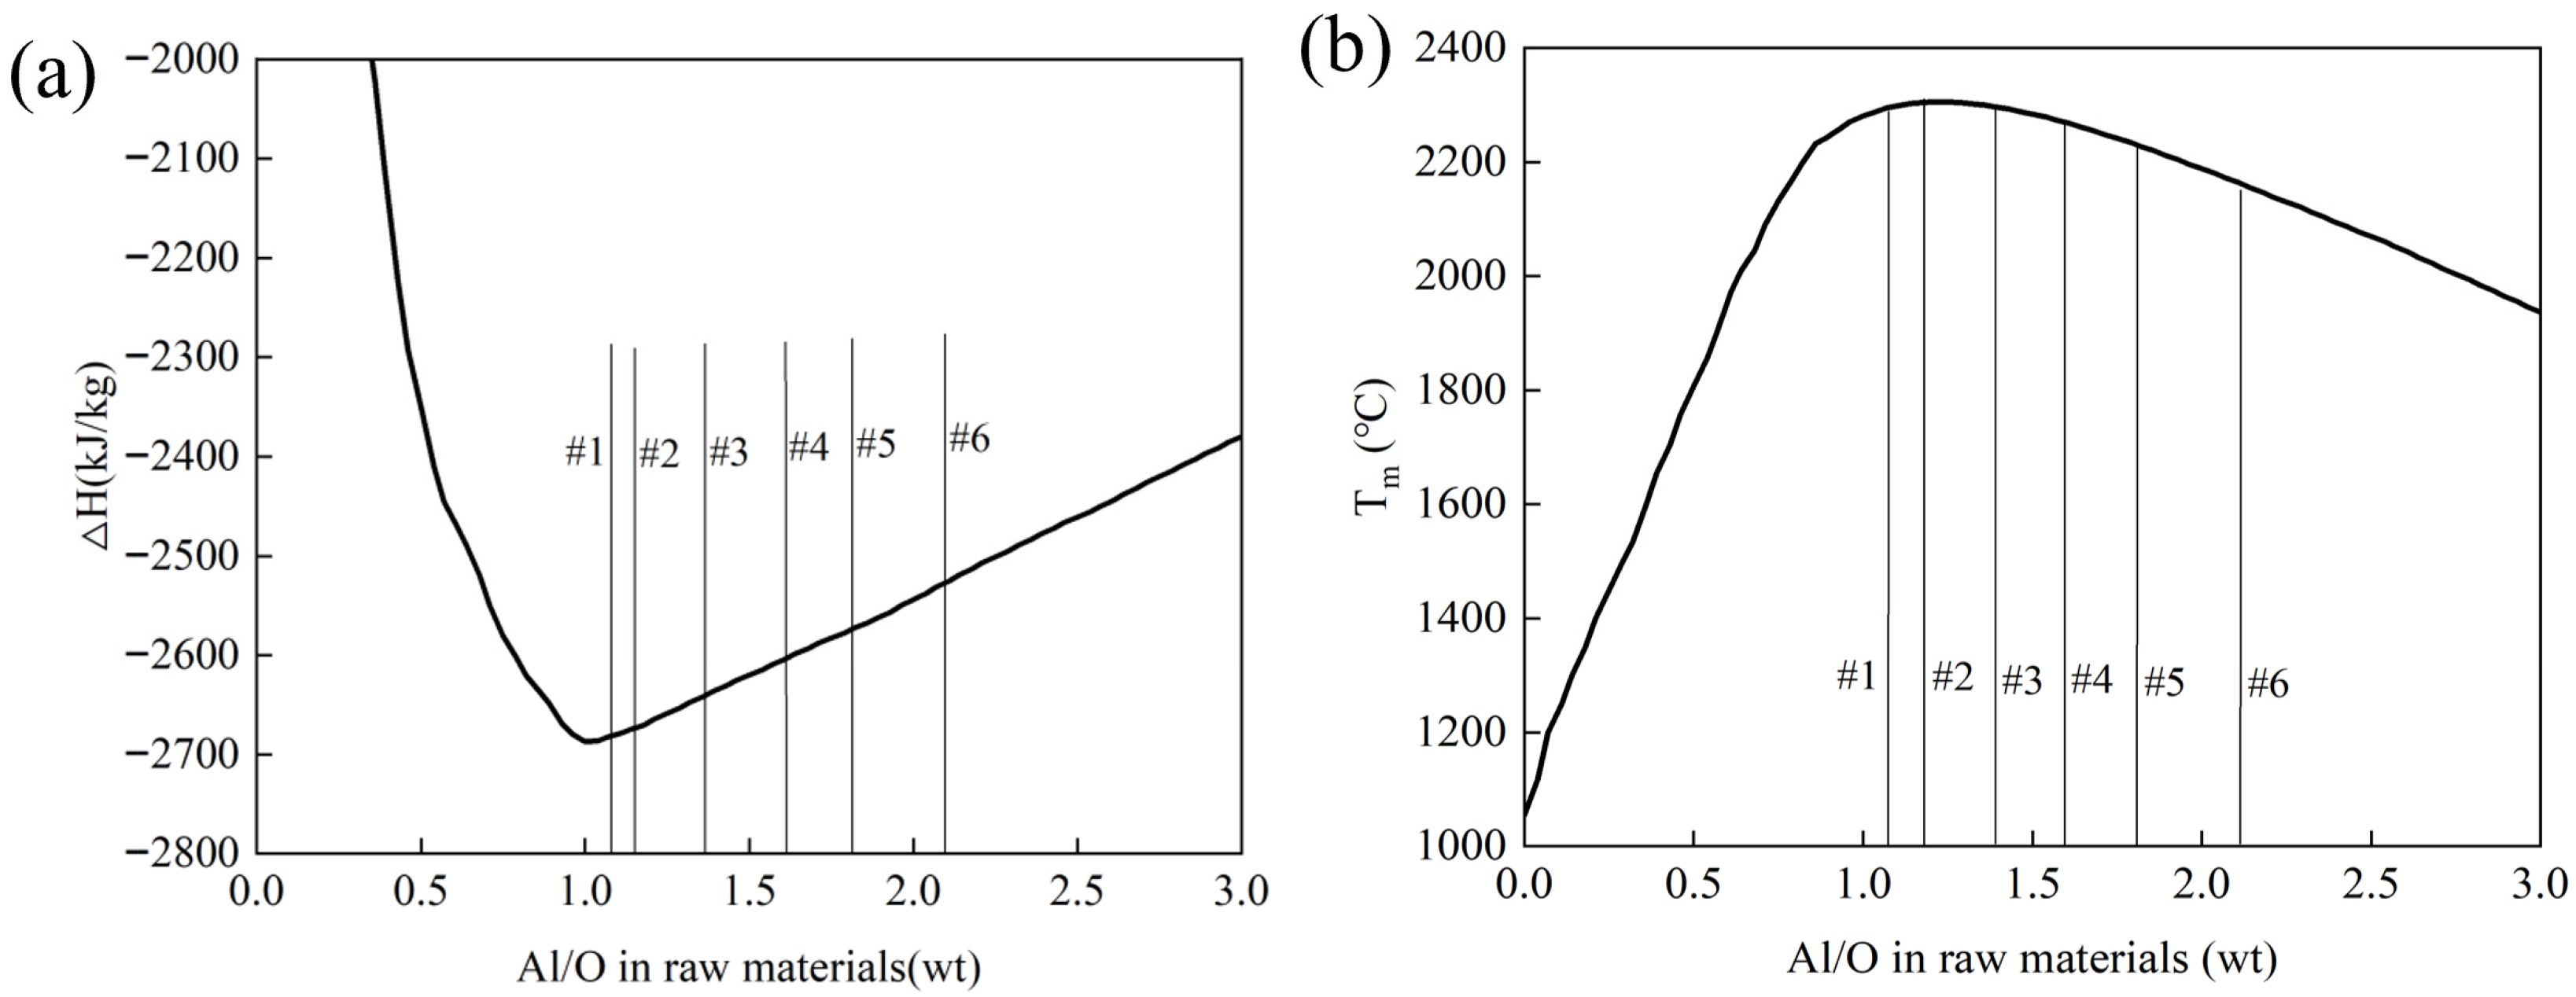
Using metallic iron as the source of Fe reduces both the reaction heat and the amount of aluminum required as a reductant, as no heat is generated from reaction (6). Figure 3 and Table 4 show the specific heat release and maximum reaction temperature as a function of Al/O according to the conditions given in Table 2. The trends of specific heat release and maximum reaction temperature are similar to those shown in Figure 2. However, when Fe2O3 is replaced by Fe as a reactant, the specific heat release and maximum reaction temperature are significantly reduced. At Al/O = 1.1, the ∆H is −2679 kJ/kg, and the theoretical maximum temperature is 2300 °C, which is lower than those shown in Table 3 (−3149 kJ/kg and 2560 °C), where Fe2O3 is used. For all reactions planned in Table 2, the theoretical maximum reaction temperatures are from 2164 °C to 2300 °C. The specific heat release can be efficiently controlled by using different starting materials. The calculated maximum temperatures represent theoretical adiabatic limits under equilibrium assumptions.

4. Experimental Results and Discussion

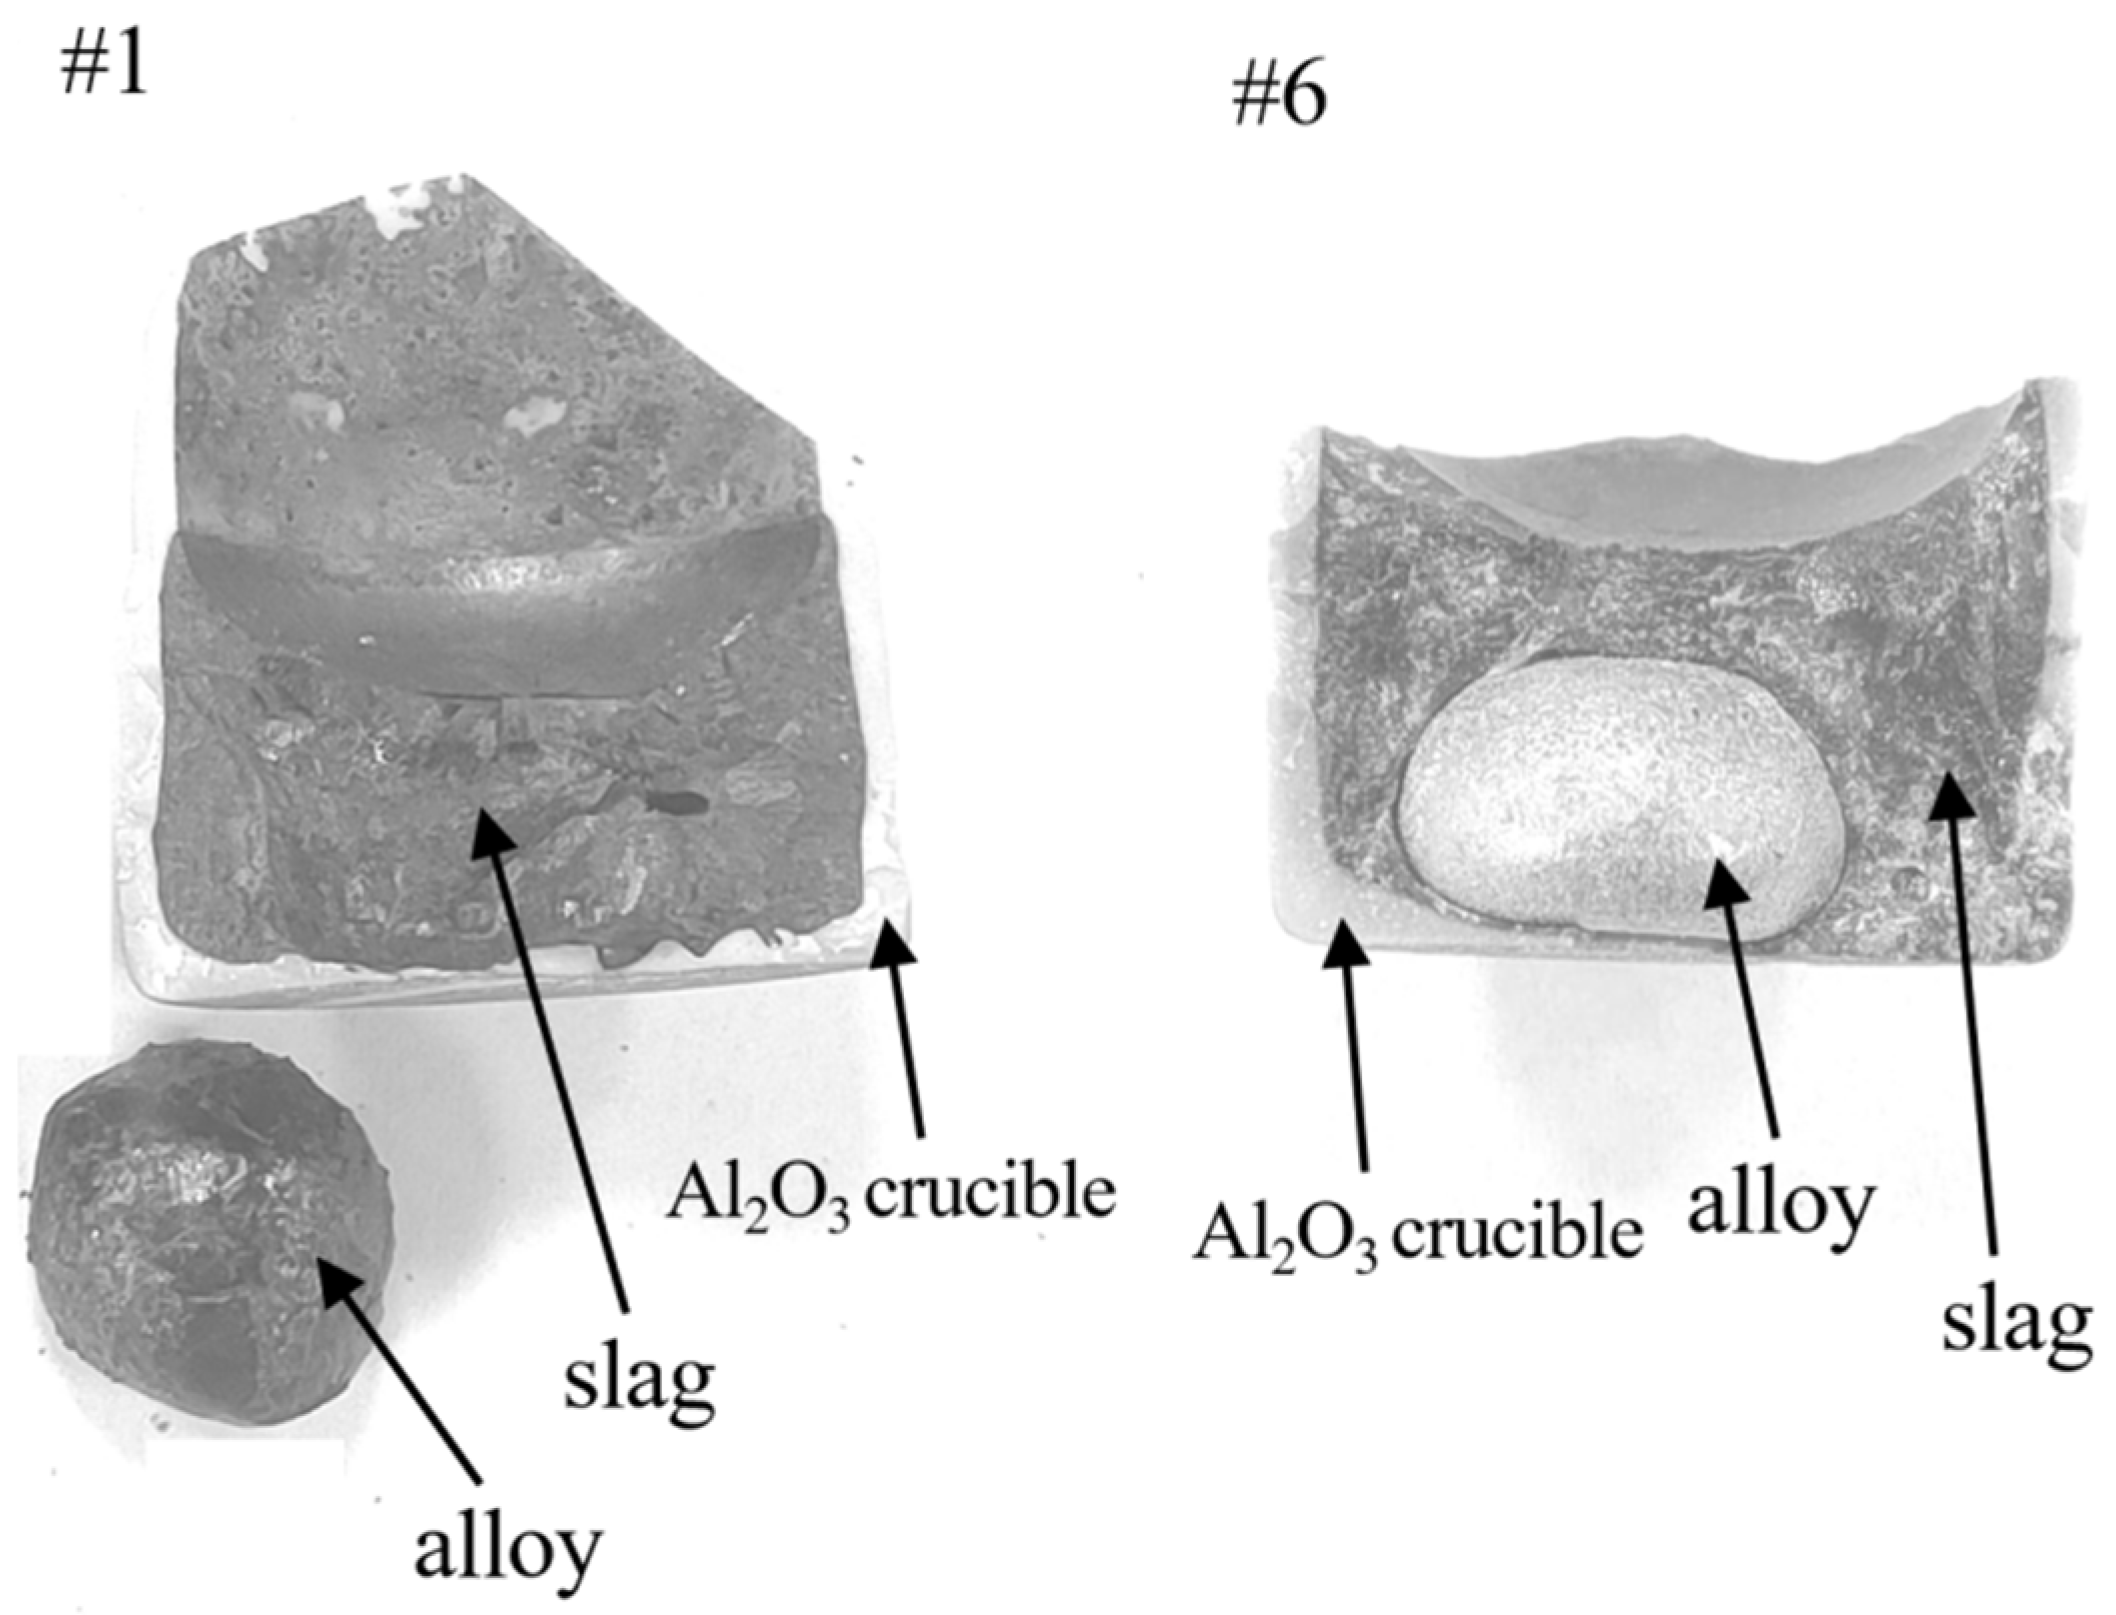
For compositional reporting, all vanadium oxides in the slag are expressed as ‘V2O3’ based on the typical reduction sequence of V2O5 to V via V2O3 in aluminothermic systems. This convention is used for clarity and stoichiometric calculations, though the actual slag may contain mixed-valence vanadium oxides. Figure 4 shows the macroscopic features of the samples from Experiments #1 and #6 after the reaction. The alumina crucibles remained intact in all Experiments, indicating that the reaction heat was well controlled by using metallic iron as the source of Fe. Poor slag–alloy separation and an indistinct interface between the slag and the alloy occurred in experiment #1. It appears that alloy #1 did not melt completely. In contrast, when the aluminum addition was high (experiment #6), resulting in a low-melting-point alloy, the surface of the alloy was smooth. The slag–alloy separation was clear, and the alloy was fully liquid during the reduction.
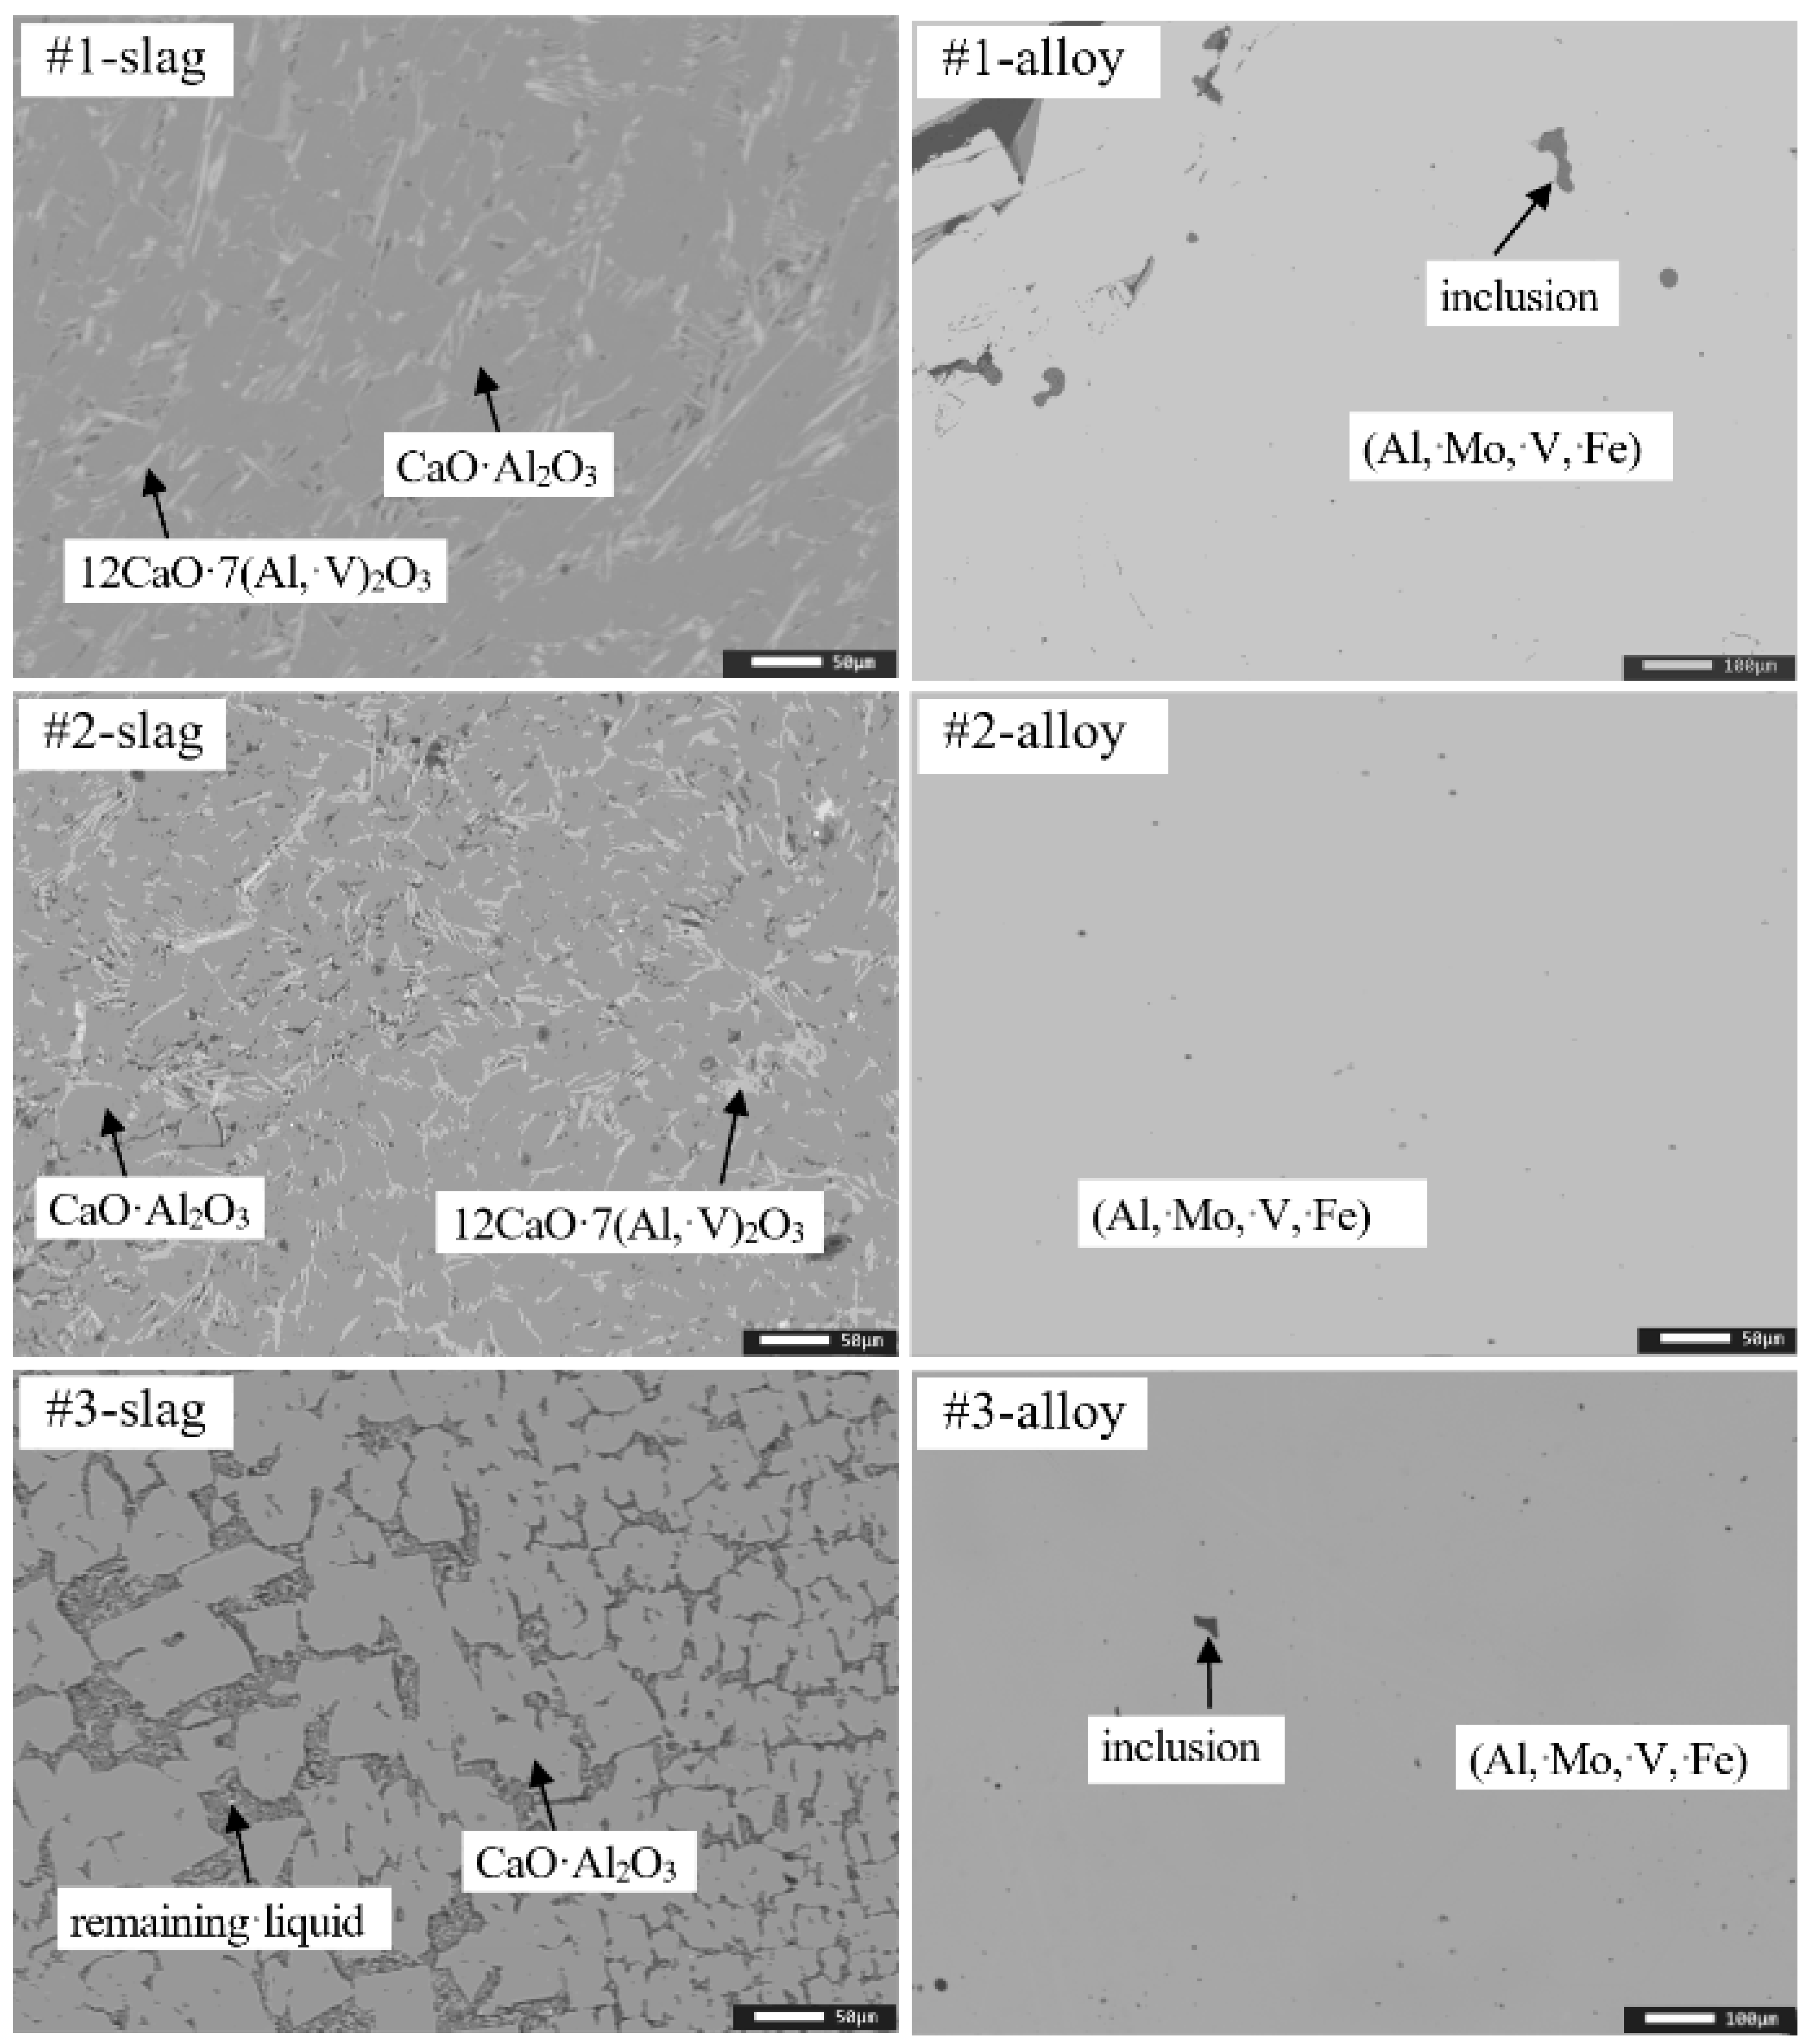
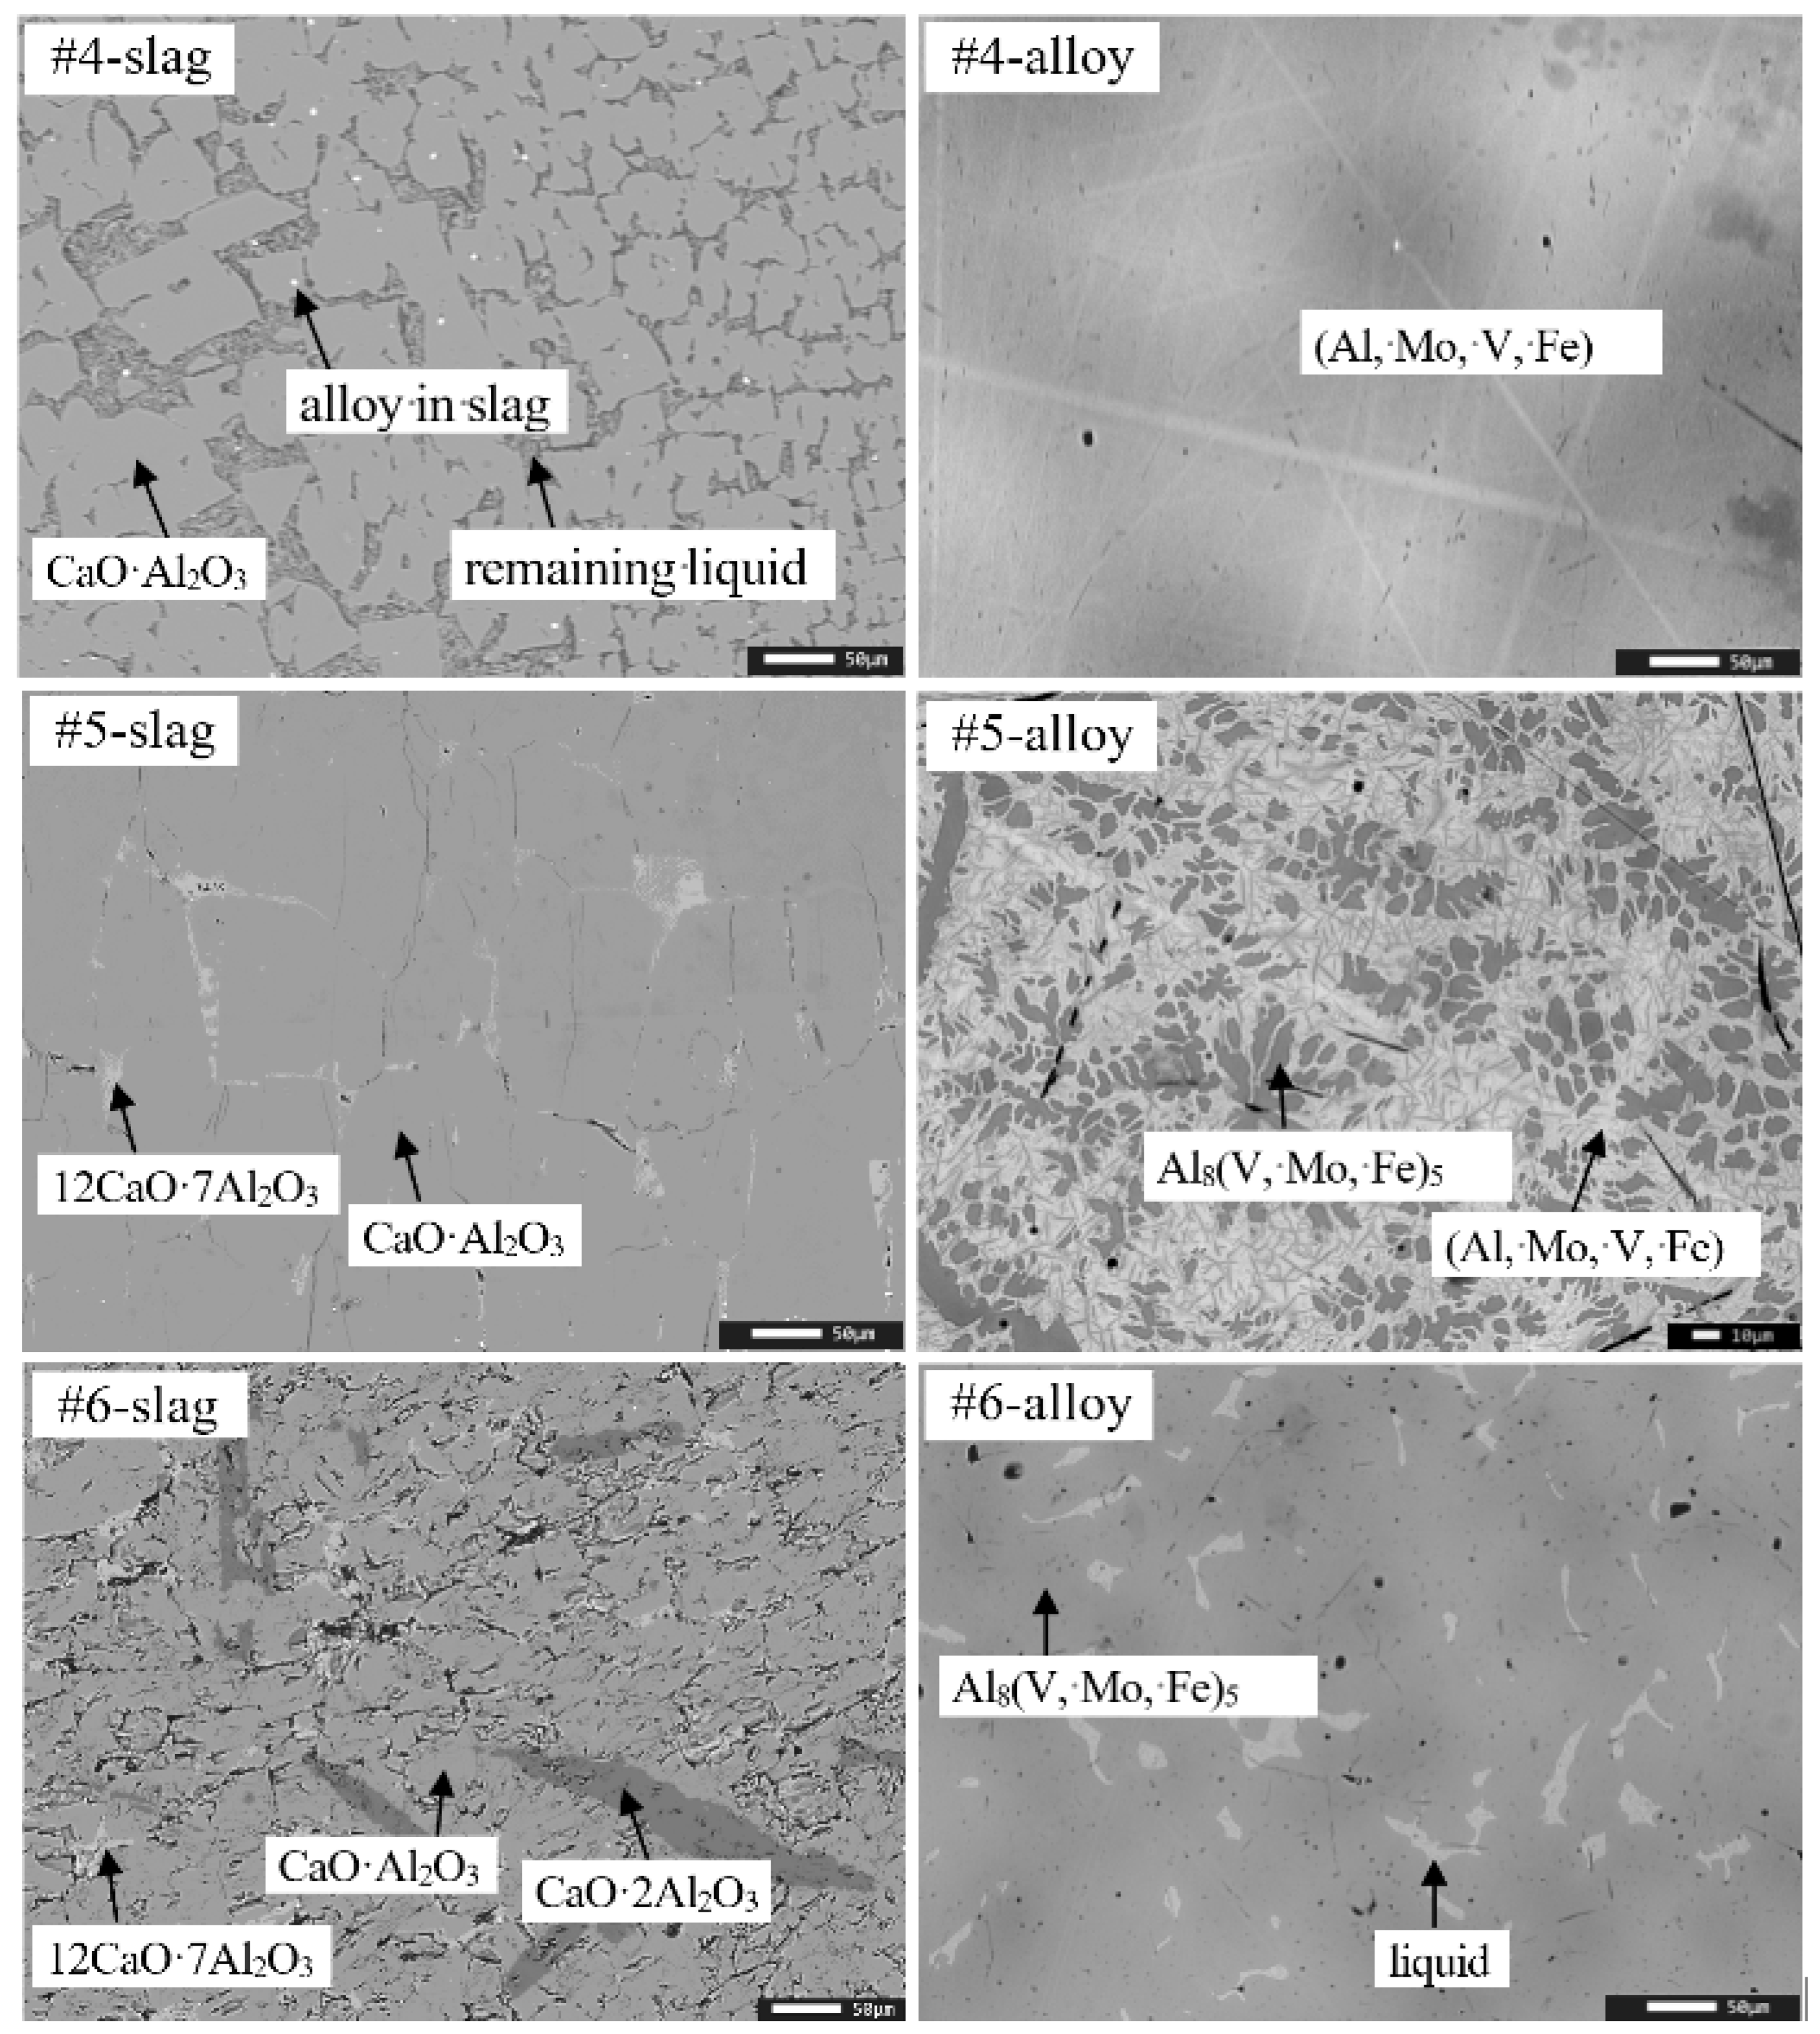
Figure 5 and Figure 6 show the microstructures of the slags and alloys from slow-cooled samples #1–#3 and #4–#6, respectively. Table 5 and Table 6 present the compositions of the oxides and alloys measured by EPMA, respectively. Table 7 and Table 8 present the bulk compositions of the slags and alloys determined by ICP, respectively. All vanadium oxides are calculated as “V2O3” for presentation purposes.
In combination with the microstructures and compositions shown in Figure 5 and Figure 6 and Table 5, Table 6, Table 7 and Table 8, the following observations can be drawn:
(1)
The uniform microstructures and phase compositions indicate that the slags and alloys were most likely to be liquid during the aluminothermic reaction. The phases shown in Figure 5 and Figure 6 were precipitated from liquid slag or alloy on cooling process.
(2)
Two phases are present in slags #1 to #5, and three phases are present in slag #6. CaO·Al2O3 is the primary phase dominating the slags. A small proportion of 12CaO·7Al2O3 is present in the slow-cooled slags #1–#2 and #5–#6. Both CaO·Al2O3 and 12CaO·7Al2O3 are predicted by the phase diagram CaO-Al2O3 [33]. The bulk compositions shown in Table 7 are located between the compositions of CaO·Al2O3 and 12CaO·7Al2O3. Remaining liquid is present in slags #3–#4. Small alloy droplets may be present in the slag (#4), which is mainly composed of vanadium.
(3)
One phase is present in alloys #1 to #4, and two phases are present in alloys #5 and #6. (Al,Mo,V,Fe) dominates alloys #1–#5, and Al8(V,Mo,Fe)5 dominates alloy #6. Al8(V,Mo,Fe)5 is also present in alloy #5. The small proportion of the second phase present in alloy #6 seems to be a remaining liquid. Determination of these phases present in the alloys will be discussed in the following section. Inclusions present in the alloys are liquid oxides containing CaO and Al2O3.
(4)
All MoO3 was completely reduced as it is not present in the slags. 11.1, 6.5 and 2.7 wt% “V2O3” are present in slags #1–#3, which is mainly observed in 12CaO·7Al2O3 or the remaining liquid. From the molar ratios of the oxides in 12CaO·7Al2O3, it seems that most of the vanadium is present as “V2O3” to replace part of Al2O3. The slag compositions confirm the thermodynamic predictions shown in Figure 1, where MoO3 is much easier to reduce than V2O5.
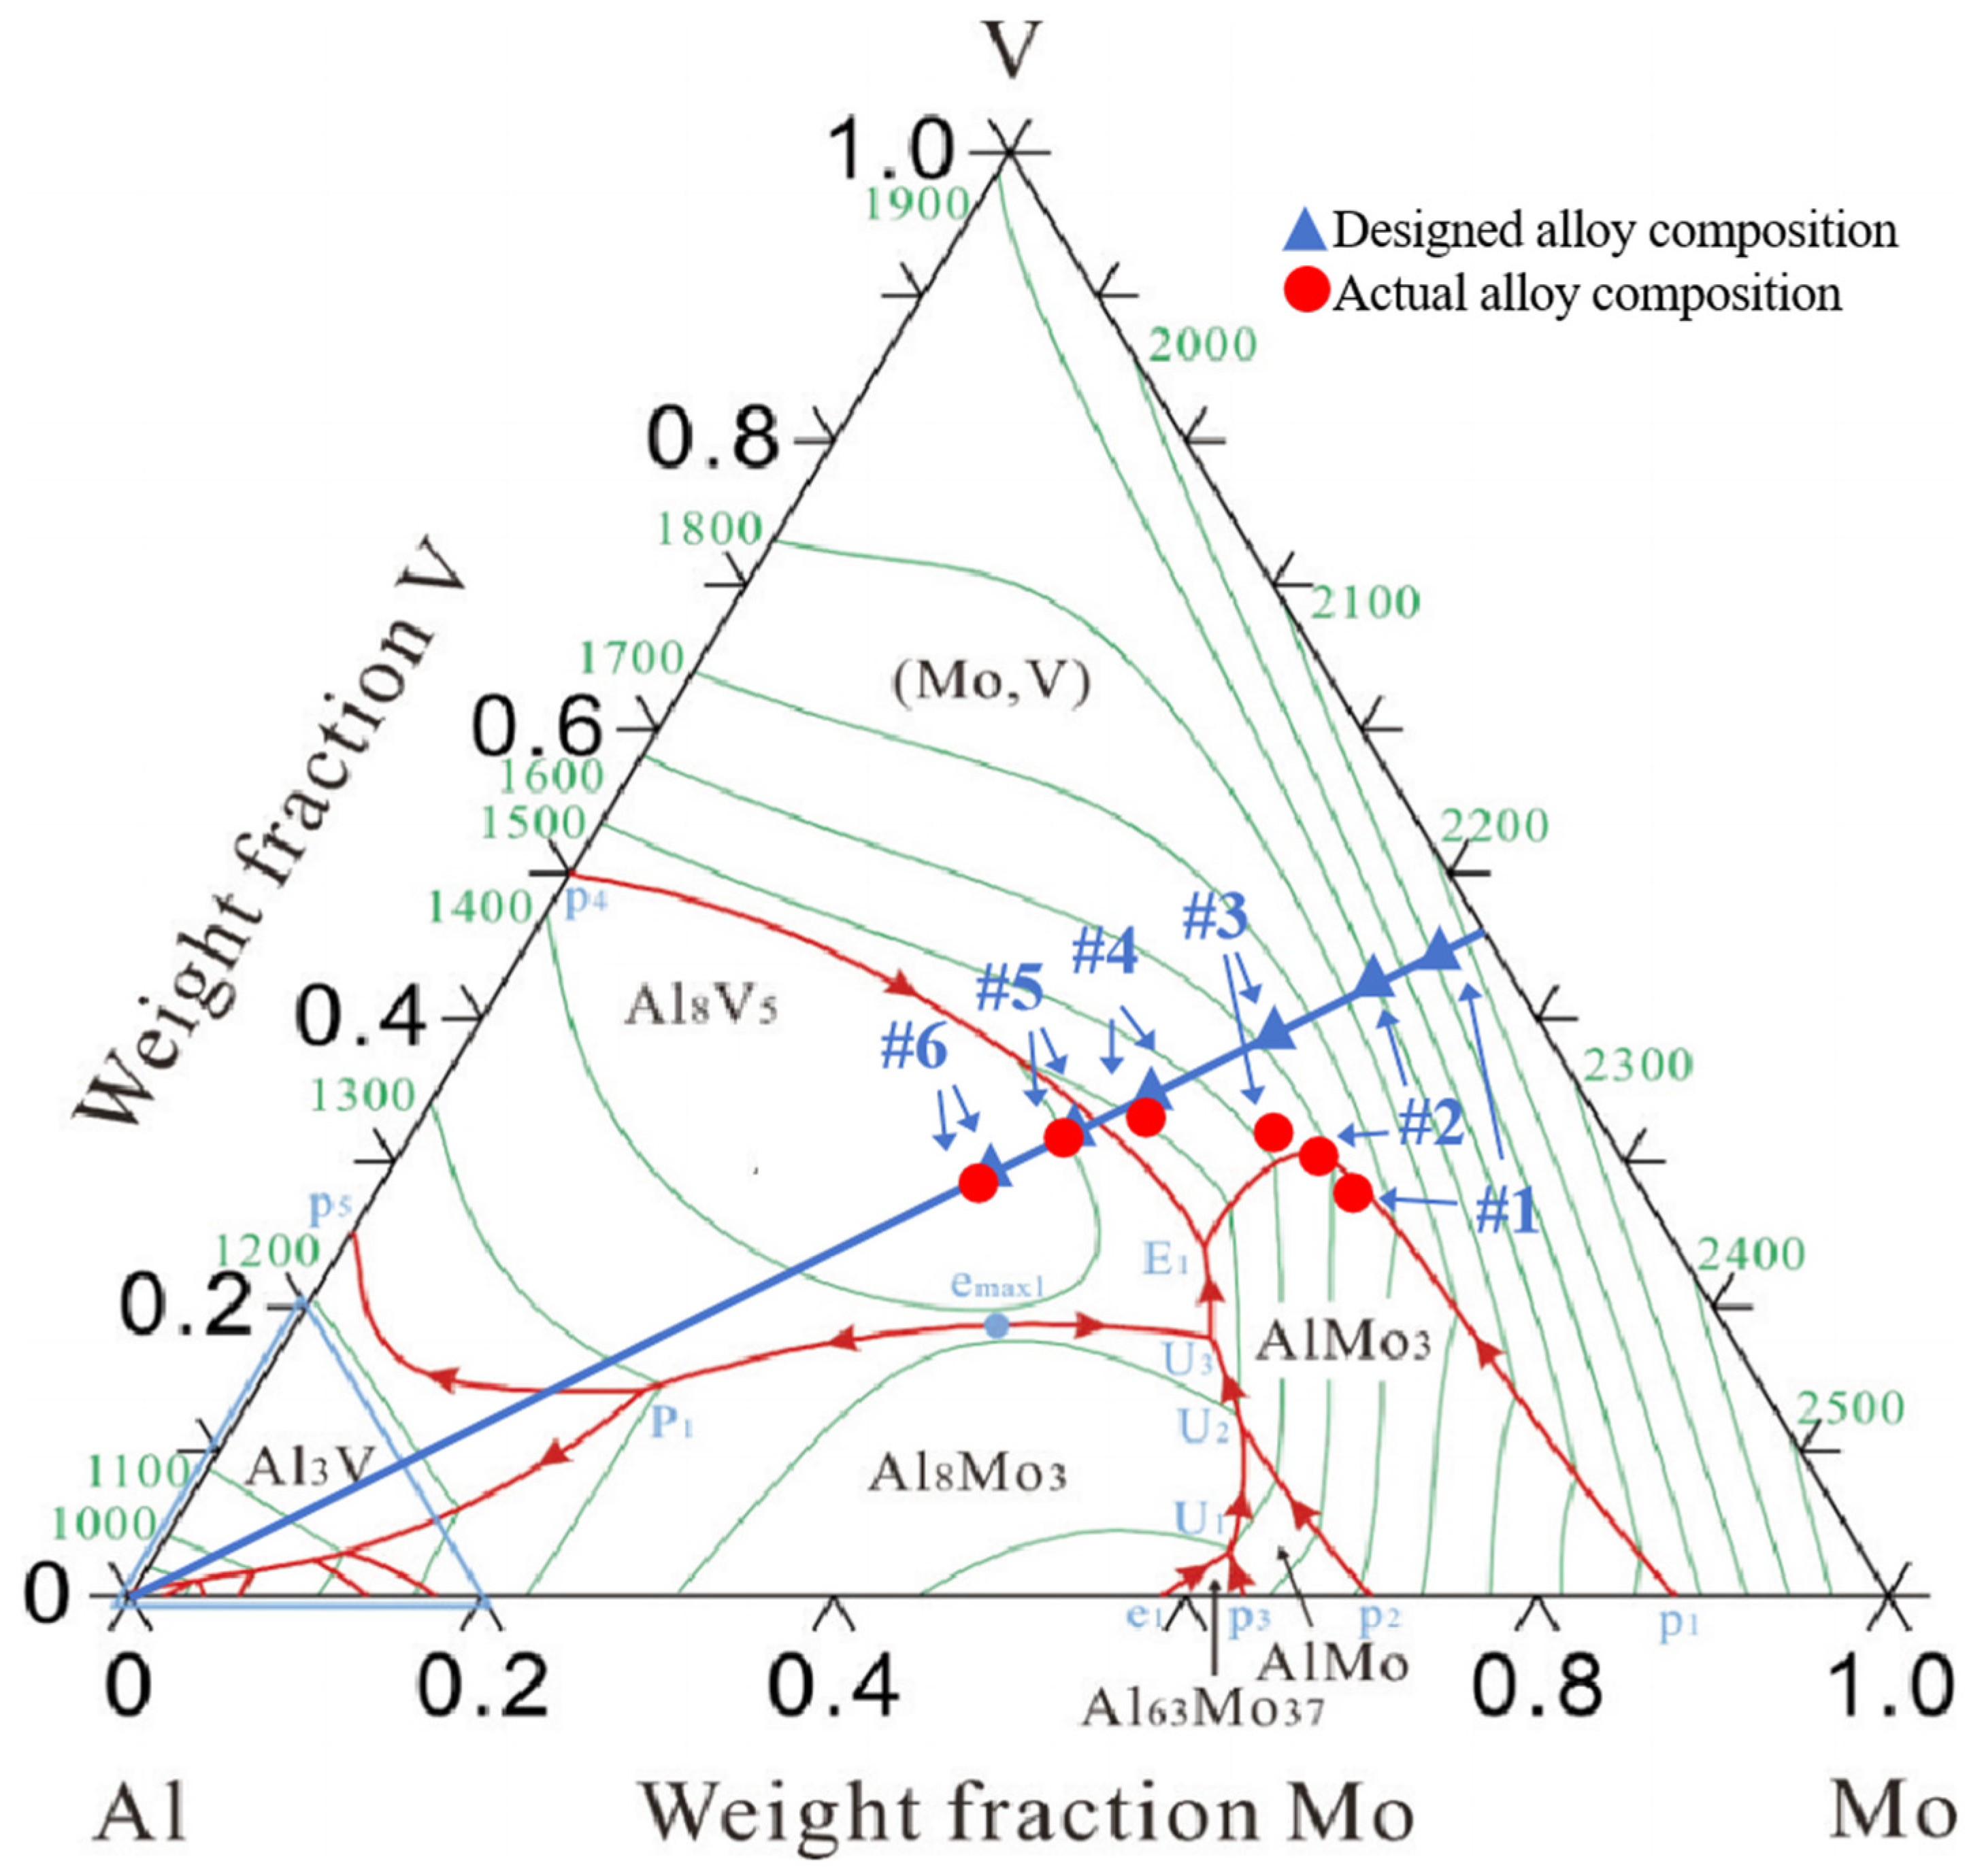
The phases observed in the alloys contain four elements as shown in Table 6. The phase diagram of the V-Al-Mo-Fe system is currently unavailable. Fe and Mo exhibit the same body-centered cubic structure [34] and electronegativity value of 1.8 [35]. They also have close atomic sizes of 136.2 pm for Mo and 124.1 pm for Fe [34]. According to the Hume-Rothery solid solution theory [36], Fe and Mo possess a strong mutual solubility tendency to replace each other in a solid solution. As a first approximation, a preliminary analysis is performed using the V-Al-Mo ternary phase diagram [37,38]. The weight of Fe is calculated as Mo. As shown in Figure 7, the designed alloy compositions (Table 2) and the actual alloy compositions (Table 8) are indicated on the ternary phase diagram. It can be seen that the designed alloy compositions have the same V/Mo ratio but different Al concentrations. Increase of Al concentrations from 2 to 37 wt% decreases the liquidus temperatures of the alloys from 2100 to approximately 1450 °C. Alloys #1 to #4 are located in the (Mo,V) primary phase field. Alloys #5 and #6 are located in the Al8V5 primary phase field. Phase identifications are primarily based on EPMA composition mapping and analogy with the ternary V–Al–Mo system, treating Fe as a Mo-analog due to similar crystal structure and atomic size. These assignments are tentative and would benefit from future crystallographic confirmation (e.g., XRD or EBSD).
However, it can be seen from Figure 7 that the compositions of alloys #1 to #3 are not the same as the designed ones. They seem to have the same Al/Mo ratio but different V concentrations. The Al/O ratios in the raw materials for Experiments #1, #2, and #3 are 1.1, 1.2, and 1.4, respectively. The lower the Al/O ratio in the raw materials, the greater the difference in V concentration in the alloy between the actual and designed values. The actual compositions of alloys #1 to #4 are located in the (Mo,V) primary phase field, and alloys #5 and #6 are located in the Al8V5 primary phase field, which matches the designed ones. It is shown in the binary Al-V phase diagram [39] that up to 38 wt% Al can dissolve in V to form a (V,Al) alloy. It is assumed that Al can dissolve into the (Mo,V) alloy shown in Figure 7 to form a (Al,Mo,V,Fe) alloy. The microstructures shown in Figure 5 and Figure 6 can be explained, where (Al,Mo,V,Fe) dominates alloys #1–#5, and Al8(V,Mo,Fe)5 is present in alloys #5 and #6. Besides insufficient reductant, vanadium loss could also be influenced by mechanisms such as volatilization of sub-oxides, mechanical entrapment of alloy droplets in the slag, or poor interfacial wetting. However, under the present experimental conditions, the strong correlation between Al/O and V recovery suggests that incomplete reduction is the dominant factor.
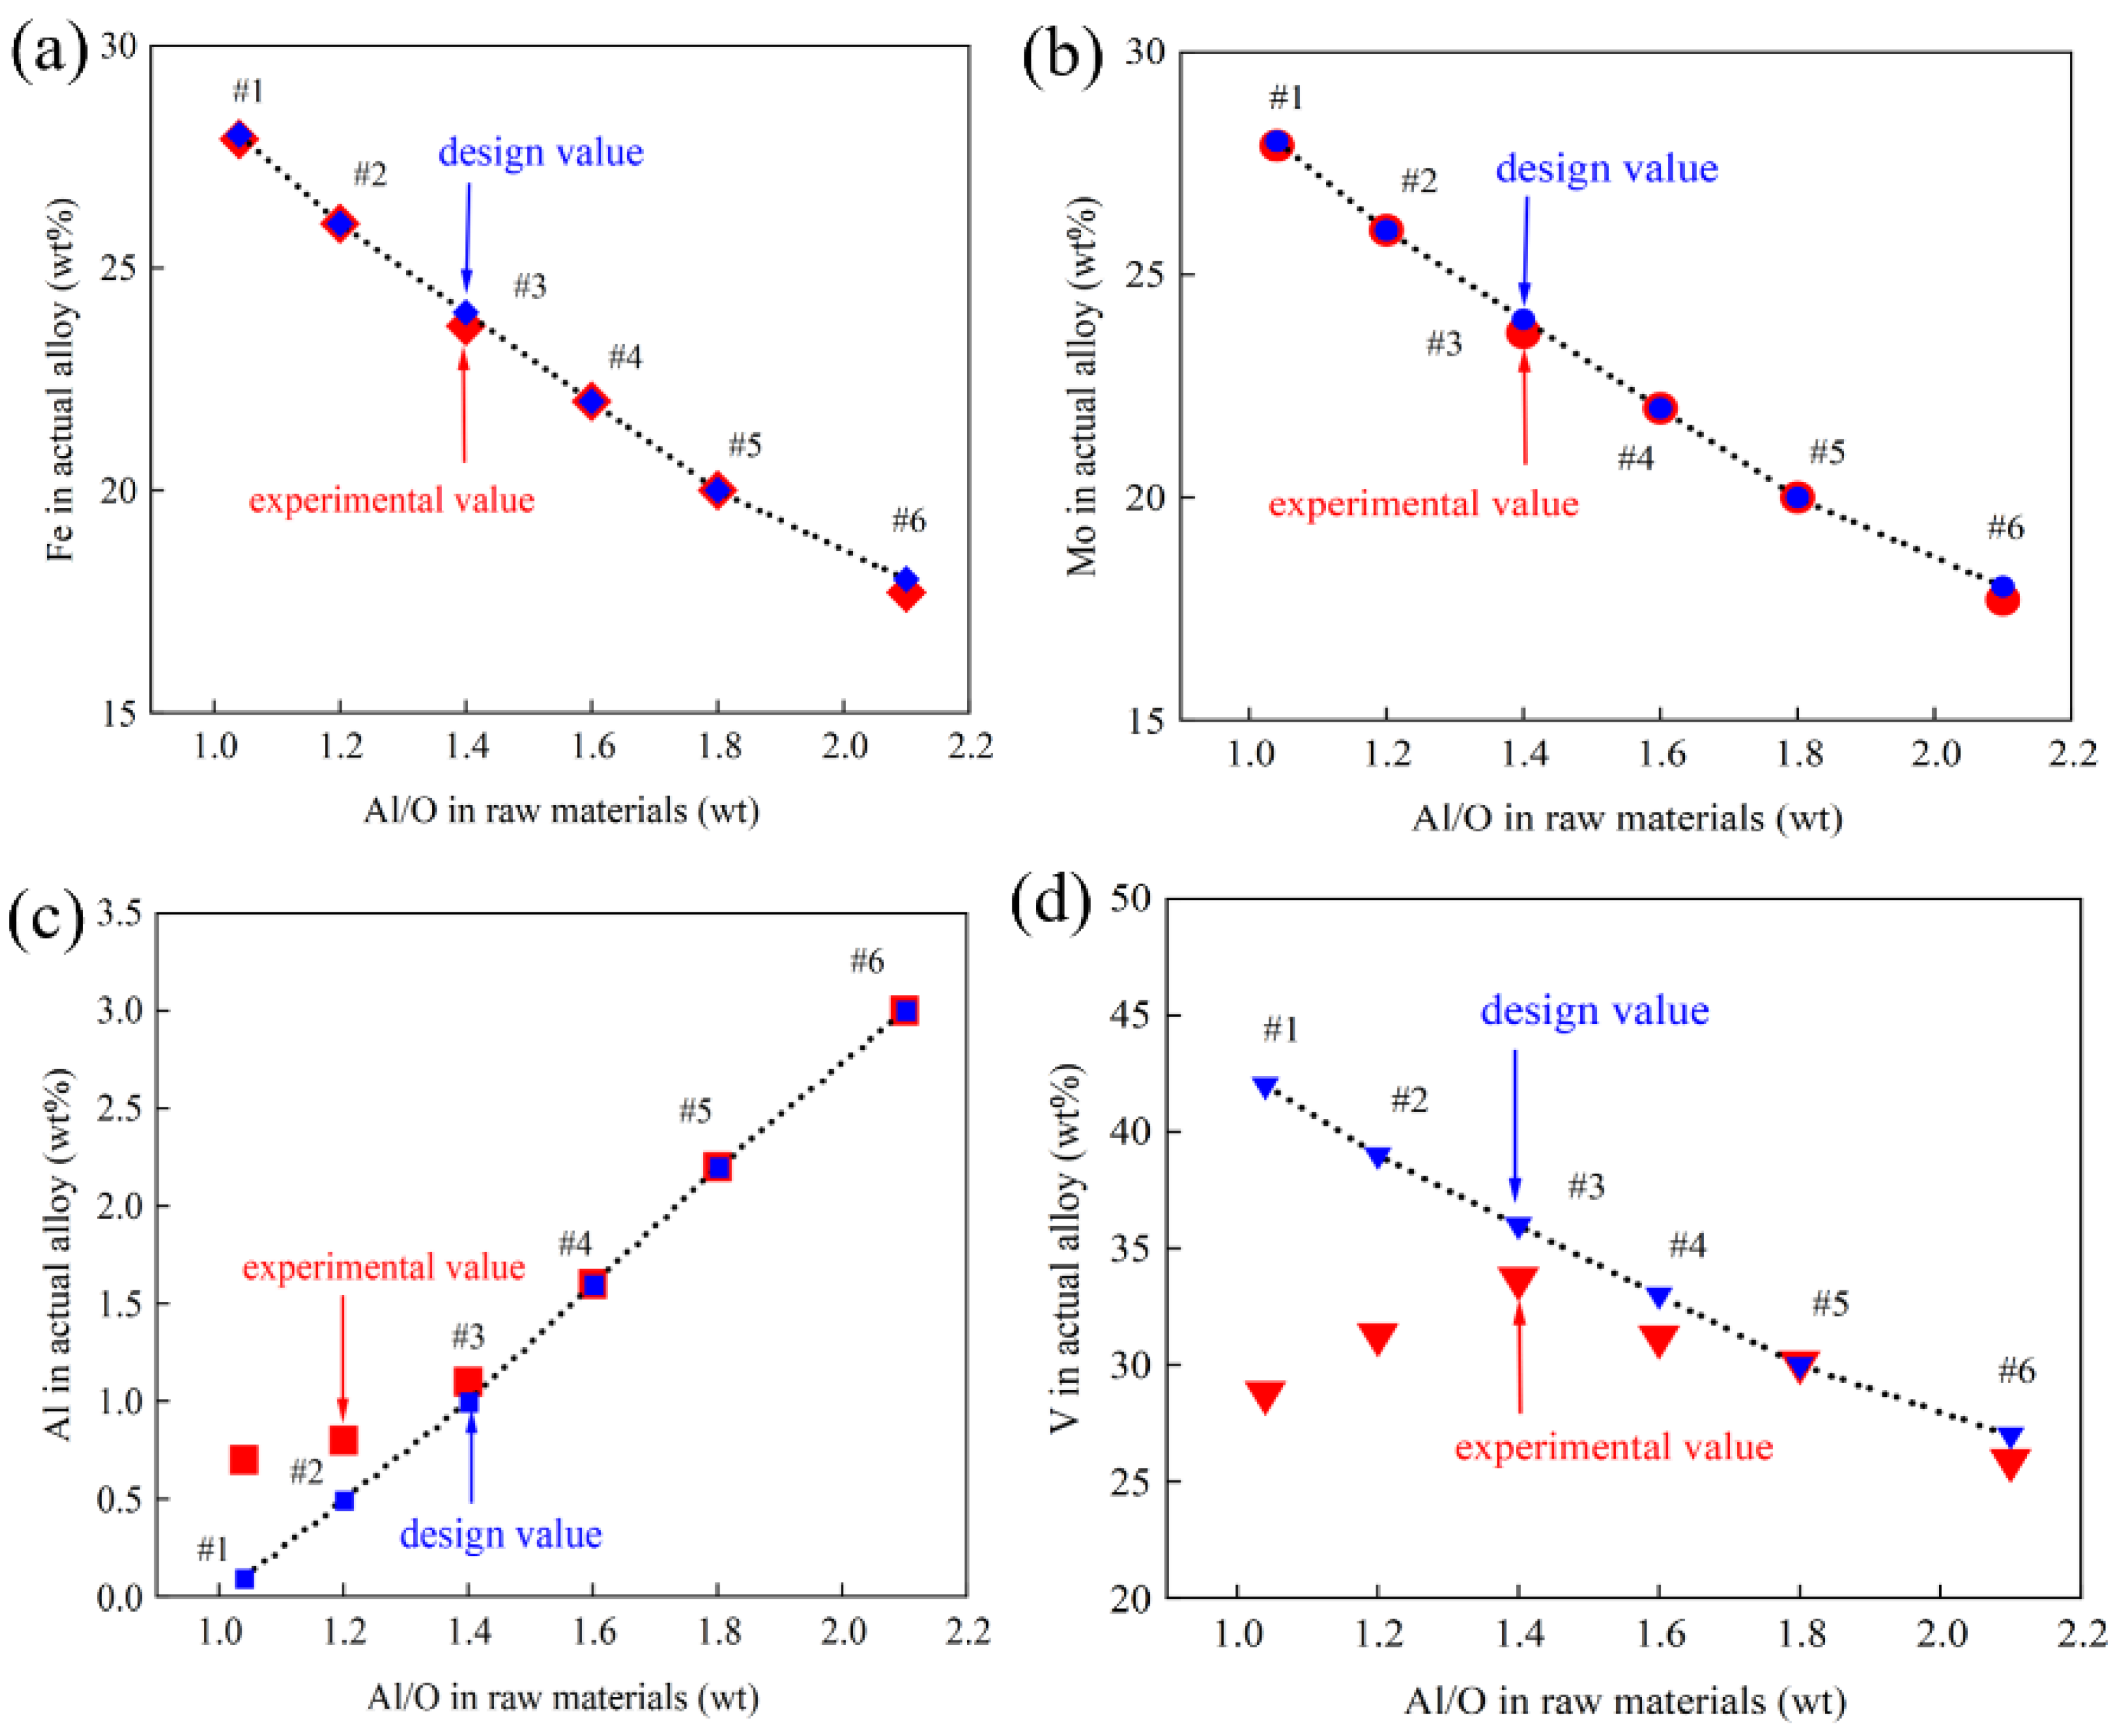
The compositions of the actual alloys and designed alloys are shown in Figure 8 as a function of the Al/O ratio in the raw materials. It is seen that both Fe and Mo concentrations in the alloy products are the same as the designed ones. It is easy to understand that iron concentrations in the alloys are the same between the designed and actual values because metallic iron was added and did not incur losses during smelting. It is shown in Figure 1 that MoO3 has the greatest tendency to be reduced by Al. Table 7 confirms that MoO3 is not detected in the slags, indicating all Mo reported to the alloy. Figure 8c shows that actual Al concentrations are higher than the designed ones in alloys #1 to #3. In contrast, Figure 8d shows that actual V concentrations are lower than the designed ones in alloys #1 to #3. This indicates that the reduction of vanadium oxide by Al was not completed in these Experiments because the reduction tendency of V2O5 is weaker than that of MoO3, as shown in Figure 1. It is reported in Table 7 that 11.1, 6.5, and 2.7 wt% “V2O3” are present in slags #1, #2, and #3, respectively. High “V2O3” concentration present in the slag is caused by a low Al/O ratio in the starting materials. A possible reason is explained below.
The compositions of the actual alloys and designed alloys are shown in Figure 8 as a function of Al/O ratio in the raw materials. It is seen that both Fe and Mo concentrations in the alloy products are the same as the designed ones. It is easy to understand that iron concentrations in the alloys are the same between the designed ones and actual ones because metallic iron was added which did not lose during the smelting. It is shown in Figure 1 that MoO3 has the greatest tendency to be reduced by Al. Table 7 confirms that MoO3 is not detected in the slags indicating all Mo was reported to the alloy. Figure 8c shows that actual Al concentrations are higher than the designed ones in alloys #1 to #3. In contrast, Figure 8d shows that actual V concentrations are lower than the designed ones in alloys #1 to #3. This indicates that the reduction of vanadium oxide by Al did not complete in these experiments because the reduction tendency of V2O5 is weaker than MoO3 as shown in Figure 1. It is reported in Table 7 that 11.1, 6.5 and 2.7 wt% “V2O3” are present in slags #1, #2 and #3 respectively. High “V2O3” concentration present in slag is caused by low Al/O ratio in the starting materials. The possible reason is explained below.
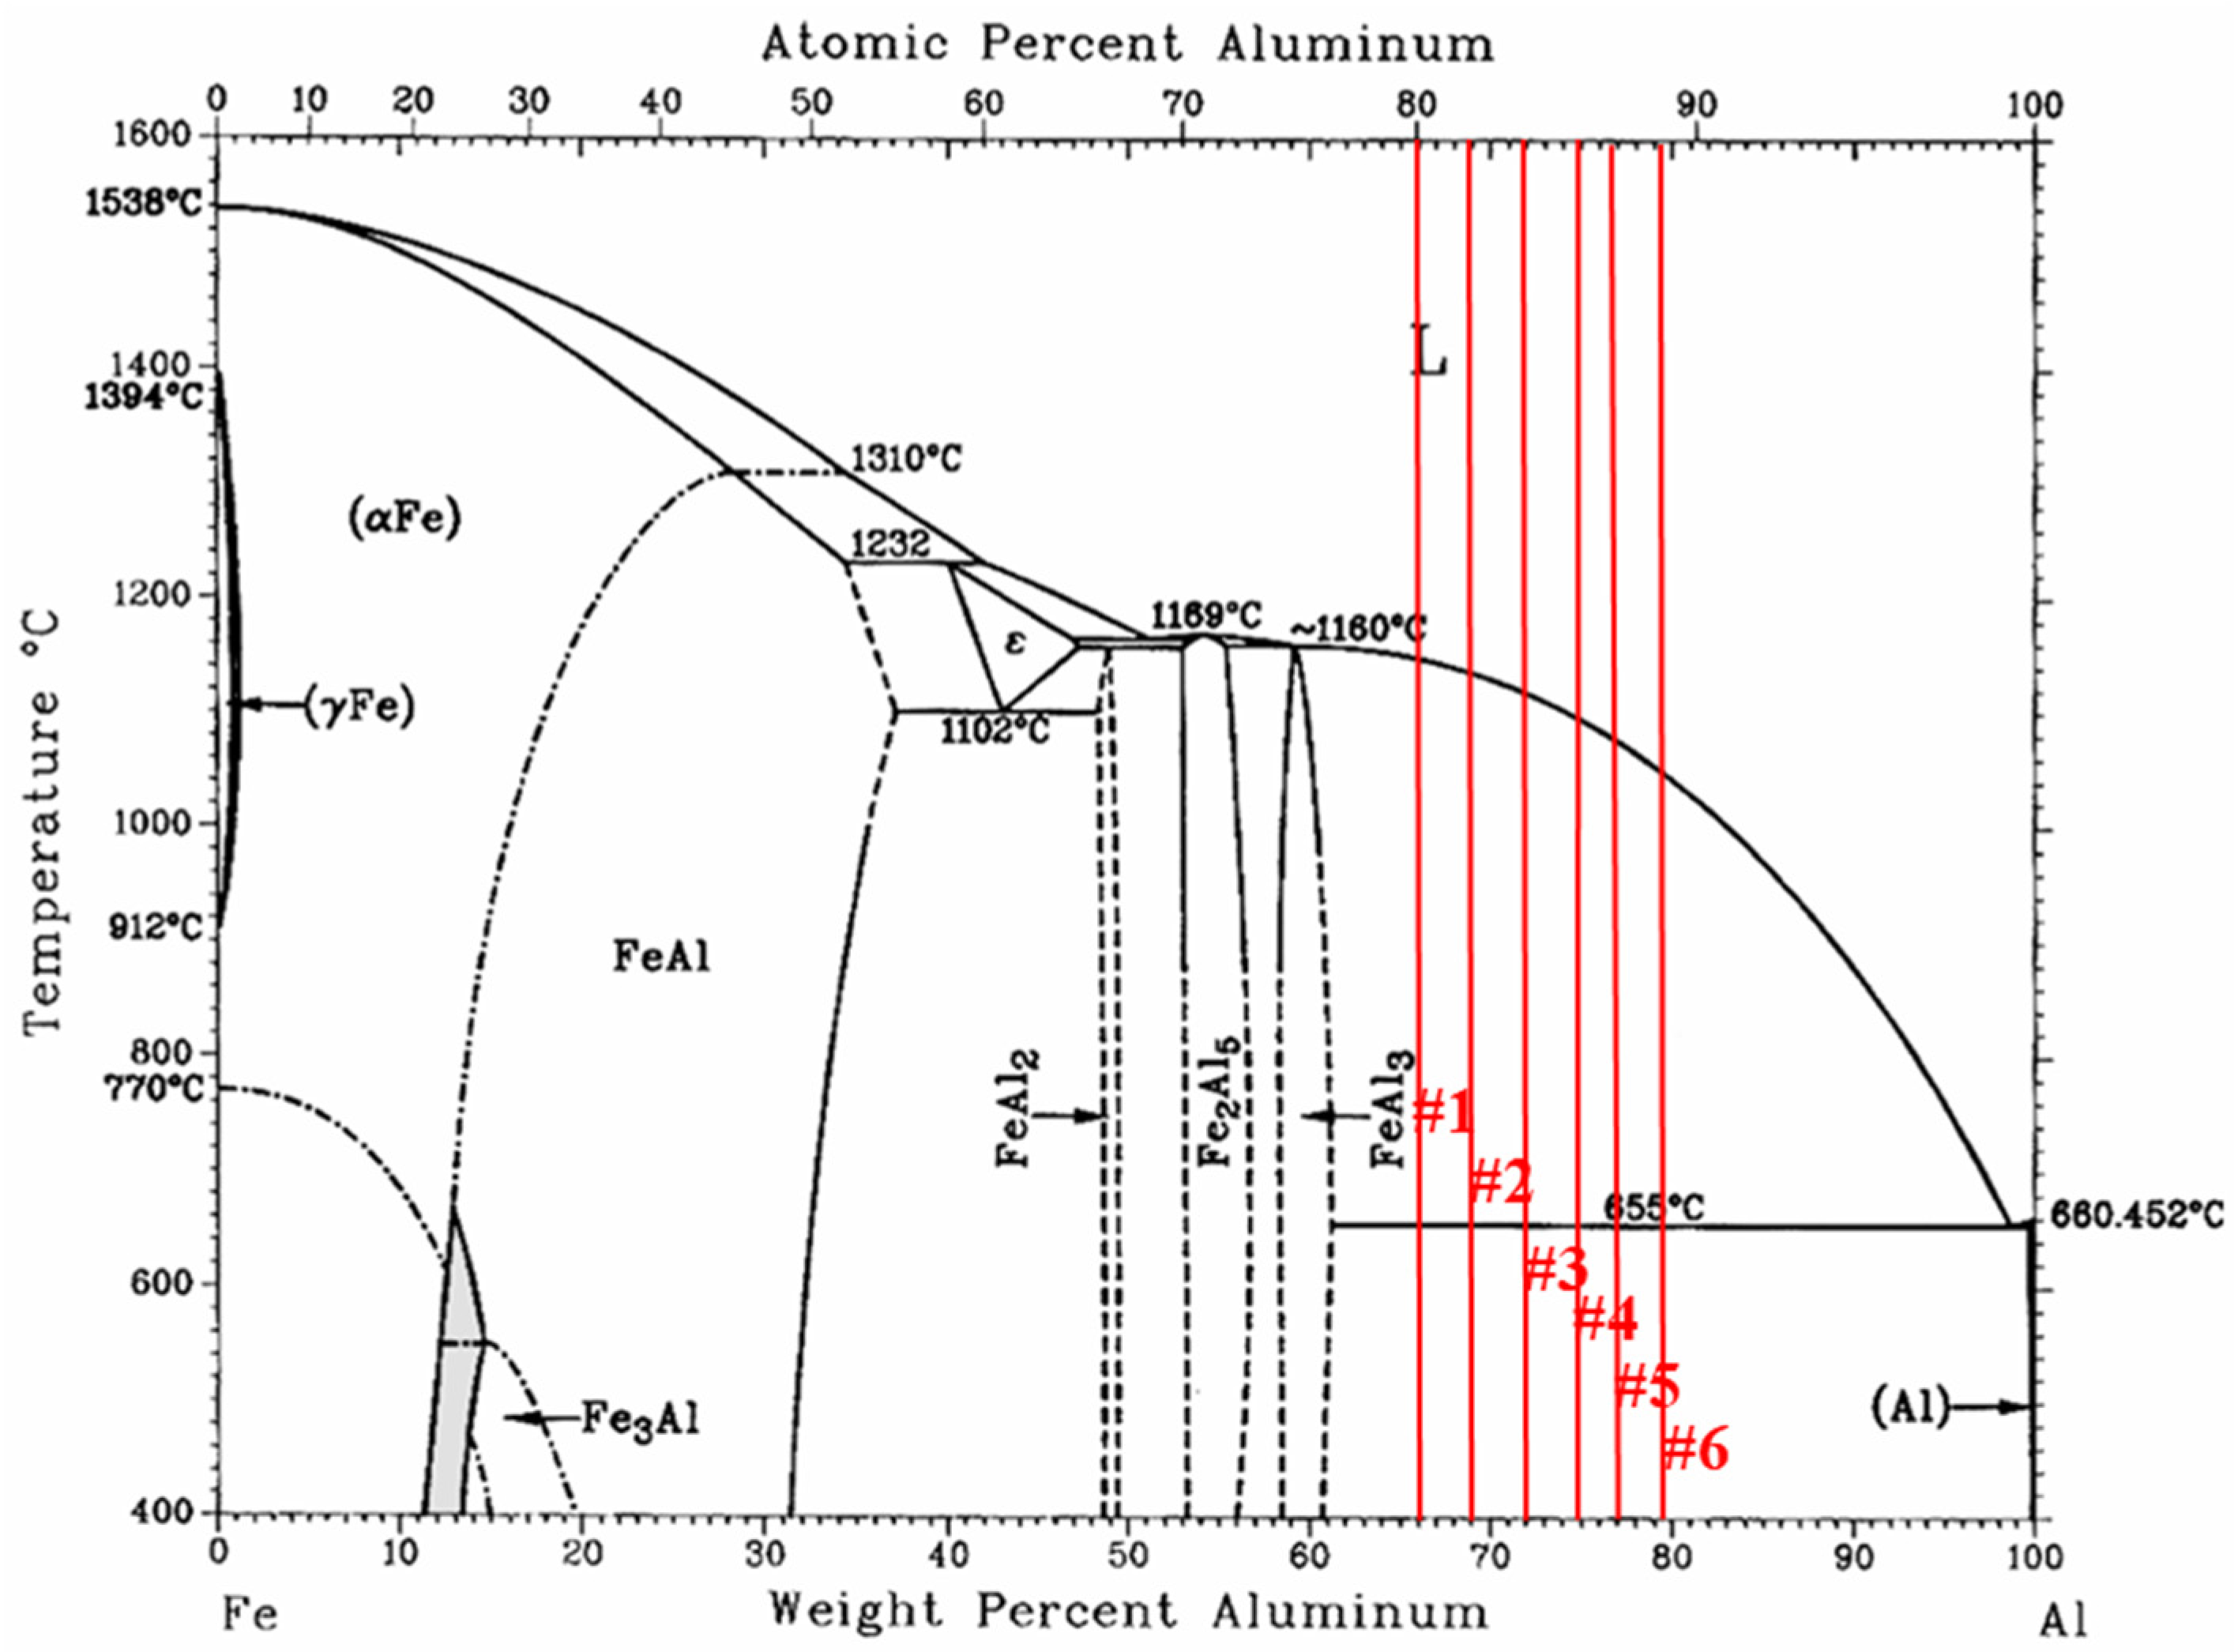
It is shown in Table 2 that both aluminum and iron were added in metallic form in the starting materials. Aluminum can react with iron to form an Al-Fe alloy when it melts at 660 °C. The compositions of the Al-Fe alloys in the starting materials are shown in Table 9 and Figure 9 [40]. Continuous monitoring of the sample temperature indicates that the aluminothermic reaction did not start below 1400 °C. It can be seen from Figure 9 that the Al-Fe alloys in Experiments #1 to #6 are all liquid at temperatures above 1200 °C. It is therefore the Al-Fe alloy that reacts with V2O5 and MoO3 at higher temperatures. The reducibility of Al in the alloy is weaker than that of pure Al. The lowest Al concentration in the Al-Fe alloy of Experiment #1 resulted in the highest “V2O3” concentration present in the slag. When the Al concentration in the Al-Fe alloy is above 74.6 wt% (Experiments #4–#6), all vanadium oxide can be fully reduced.
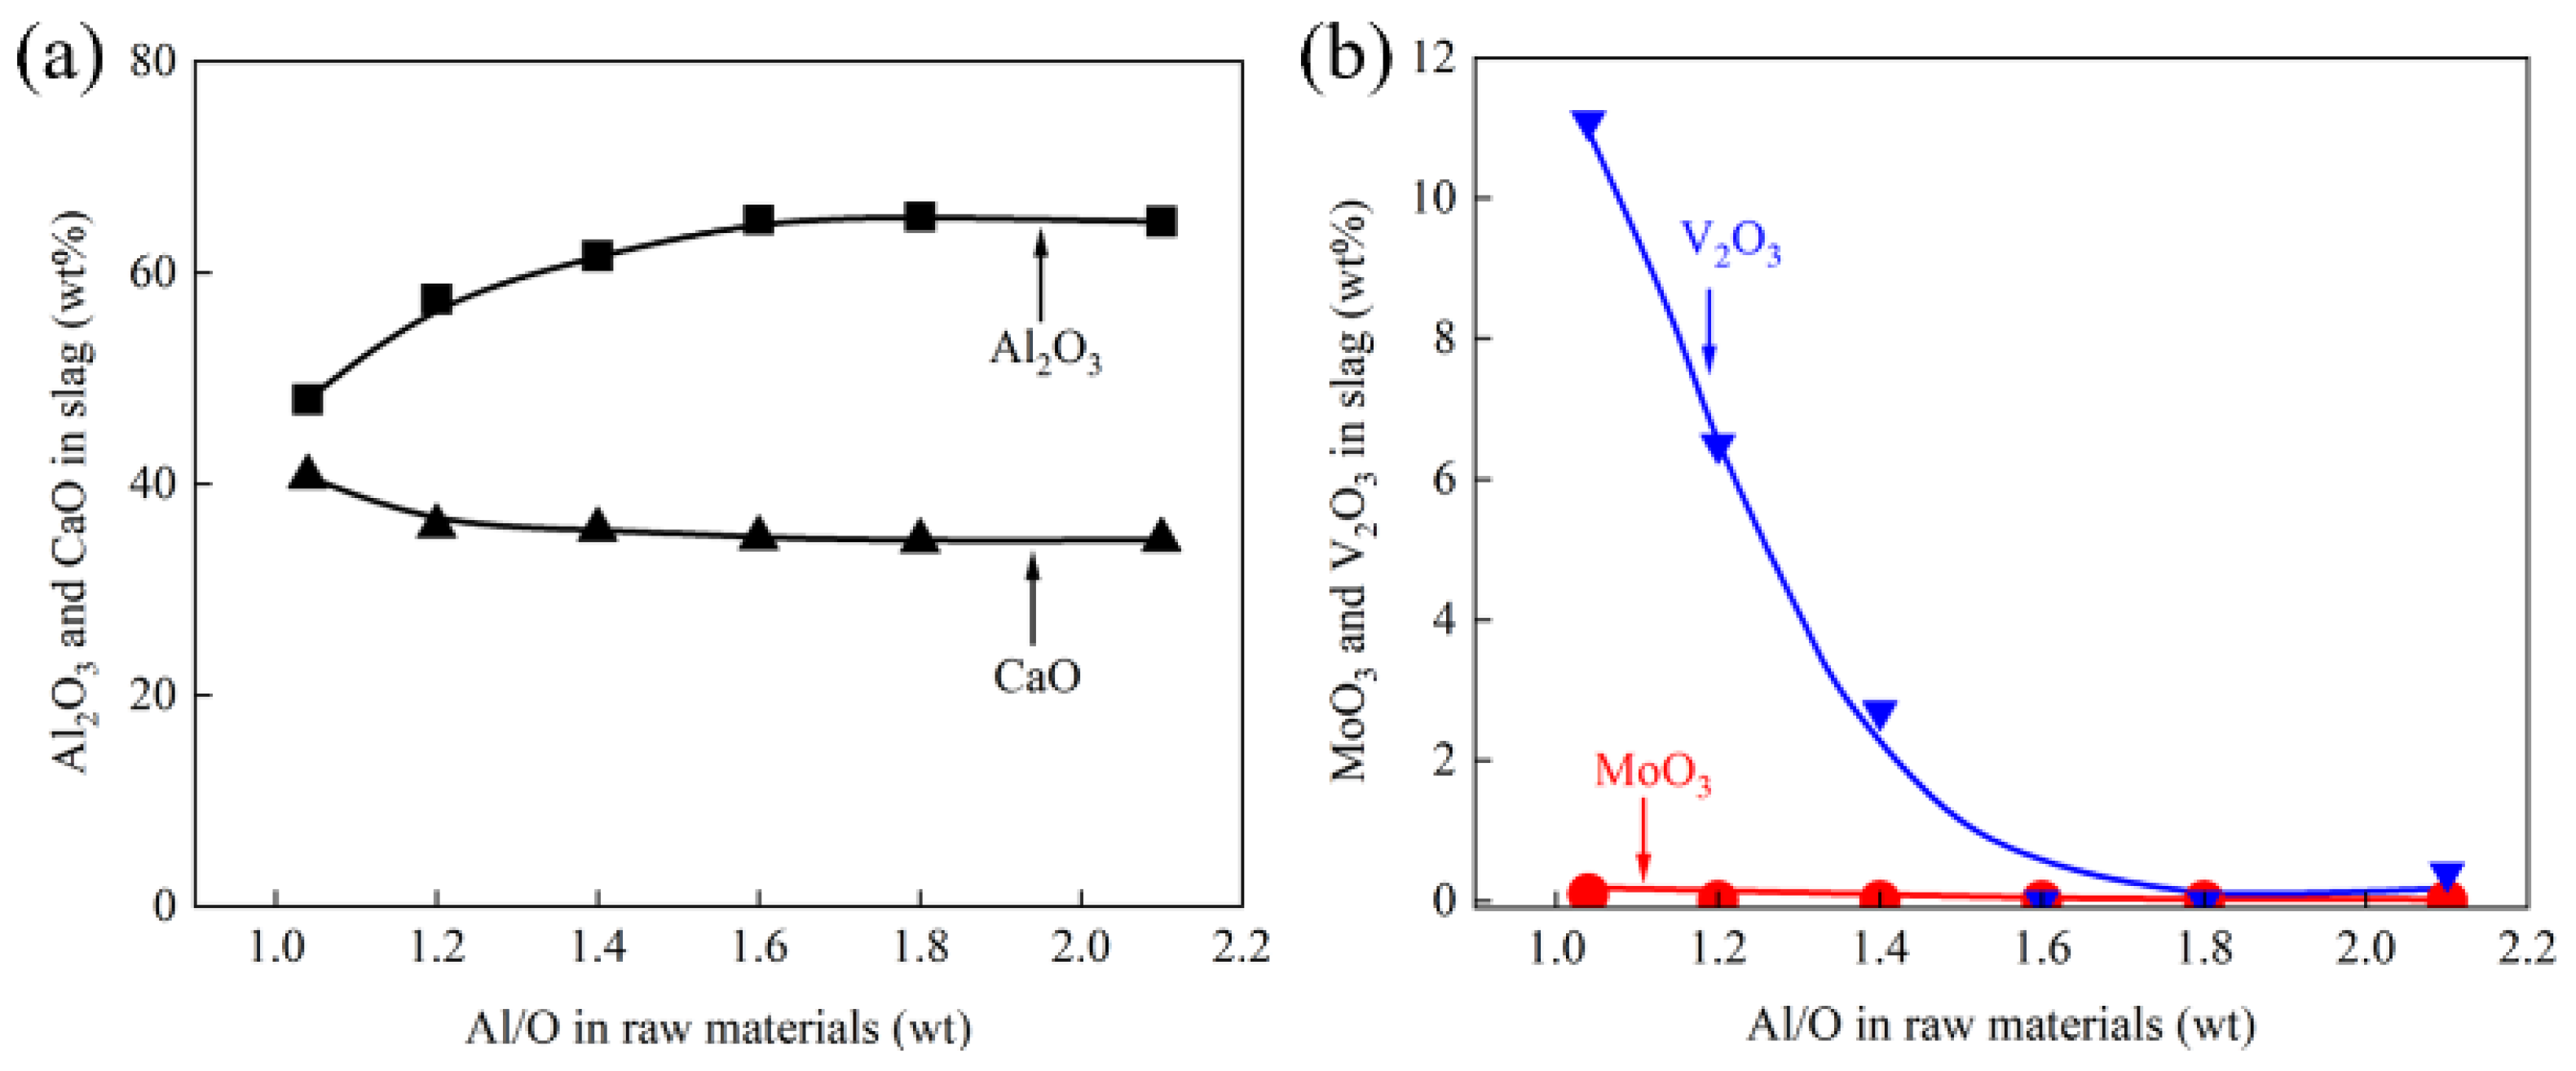
Al2O3 and CaO are the major components of the smelting slags, where Al2O3 comes from oxidation of Al and the crucible. Under the experimental conditions given in Table 1, the amount of Al2O3 from oxidation of Al should be the same in all slags, as the oxygen from V2O5 and MoO3 is constant. However, it can be seen from Figure 10a that Al2O3 content is relatively lower in slags #1–#3 than in slags #4–#6. The reason can be explained by Figure 10b, where the “V2O3” concentrations in slag decrease with increasing Al/O in raw materials. When Al/O in raw materials is above 1.6 (Experiments #4–#6), the “V2O3” concentrations in slag approach zero. At lower Al/O ratios (1.1–1.4), up to 11.1 wt% “V2O3” is present in the slags, indicating that the reduction of vanadium oxide was not completed. More Al remains in the alloy as shown in Figure 8c, and unreduced “V2O3” stays in the slag as shown in Figure 10b. The slag produced in this process is primarily composed of CaO and Al2O3, which are environmentally benign and can be potentially recycled as raw materials for cement production or refractories. The absence of fluorides (e.g., CaF2) eliminates fluoride pollution risks associated with some traditional aluminothermic practices, enhancing the environmental sustainability of the proposed route.
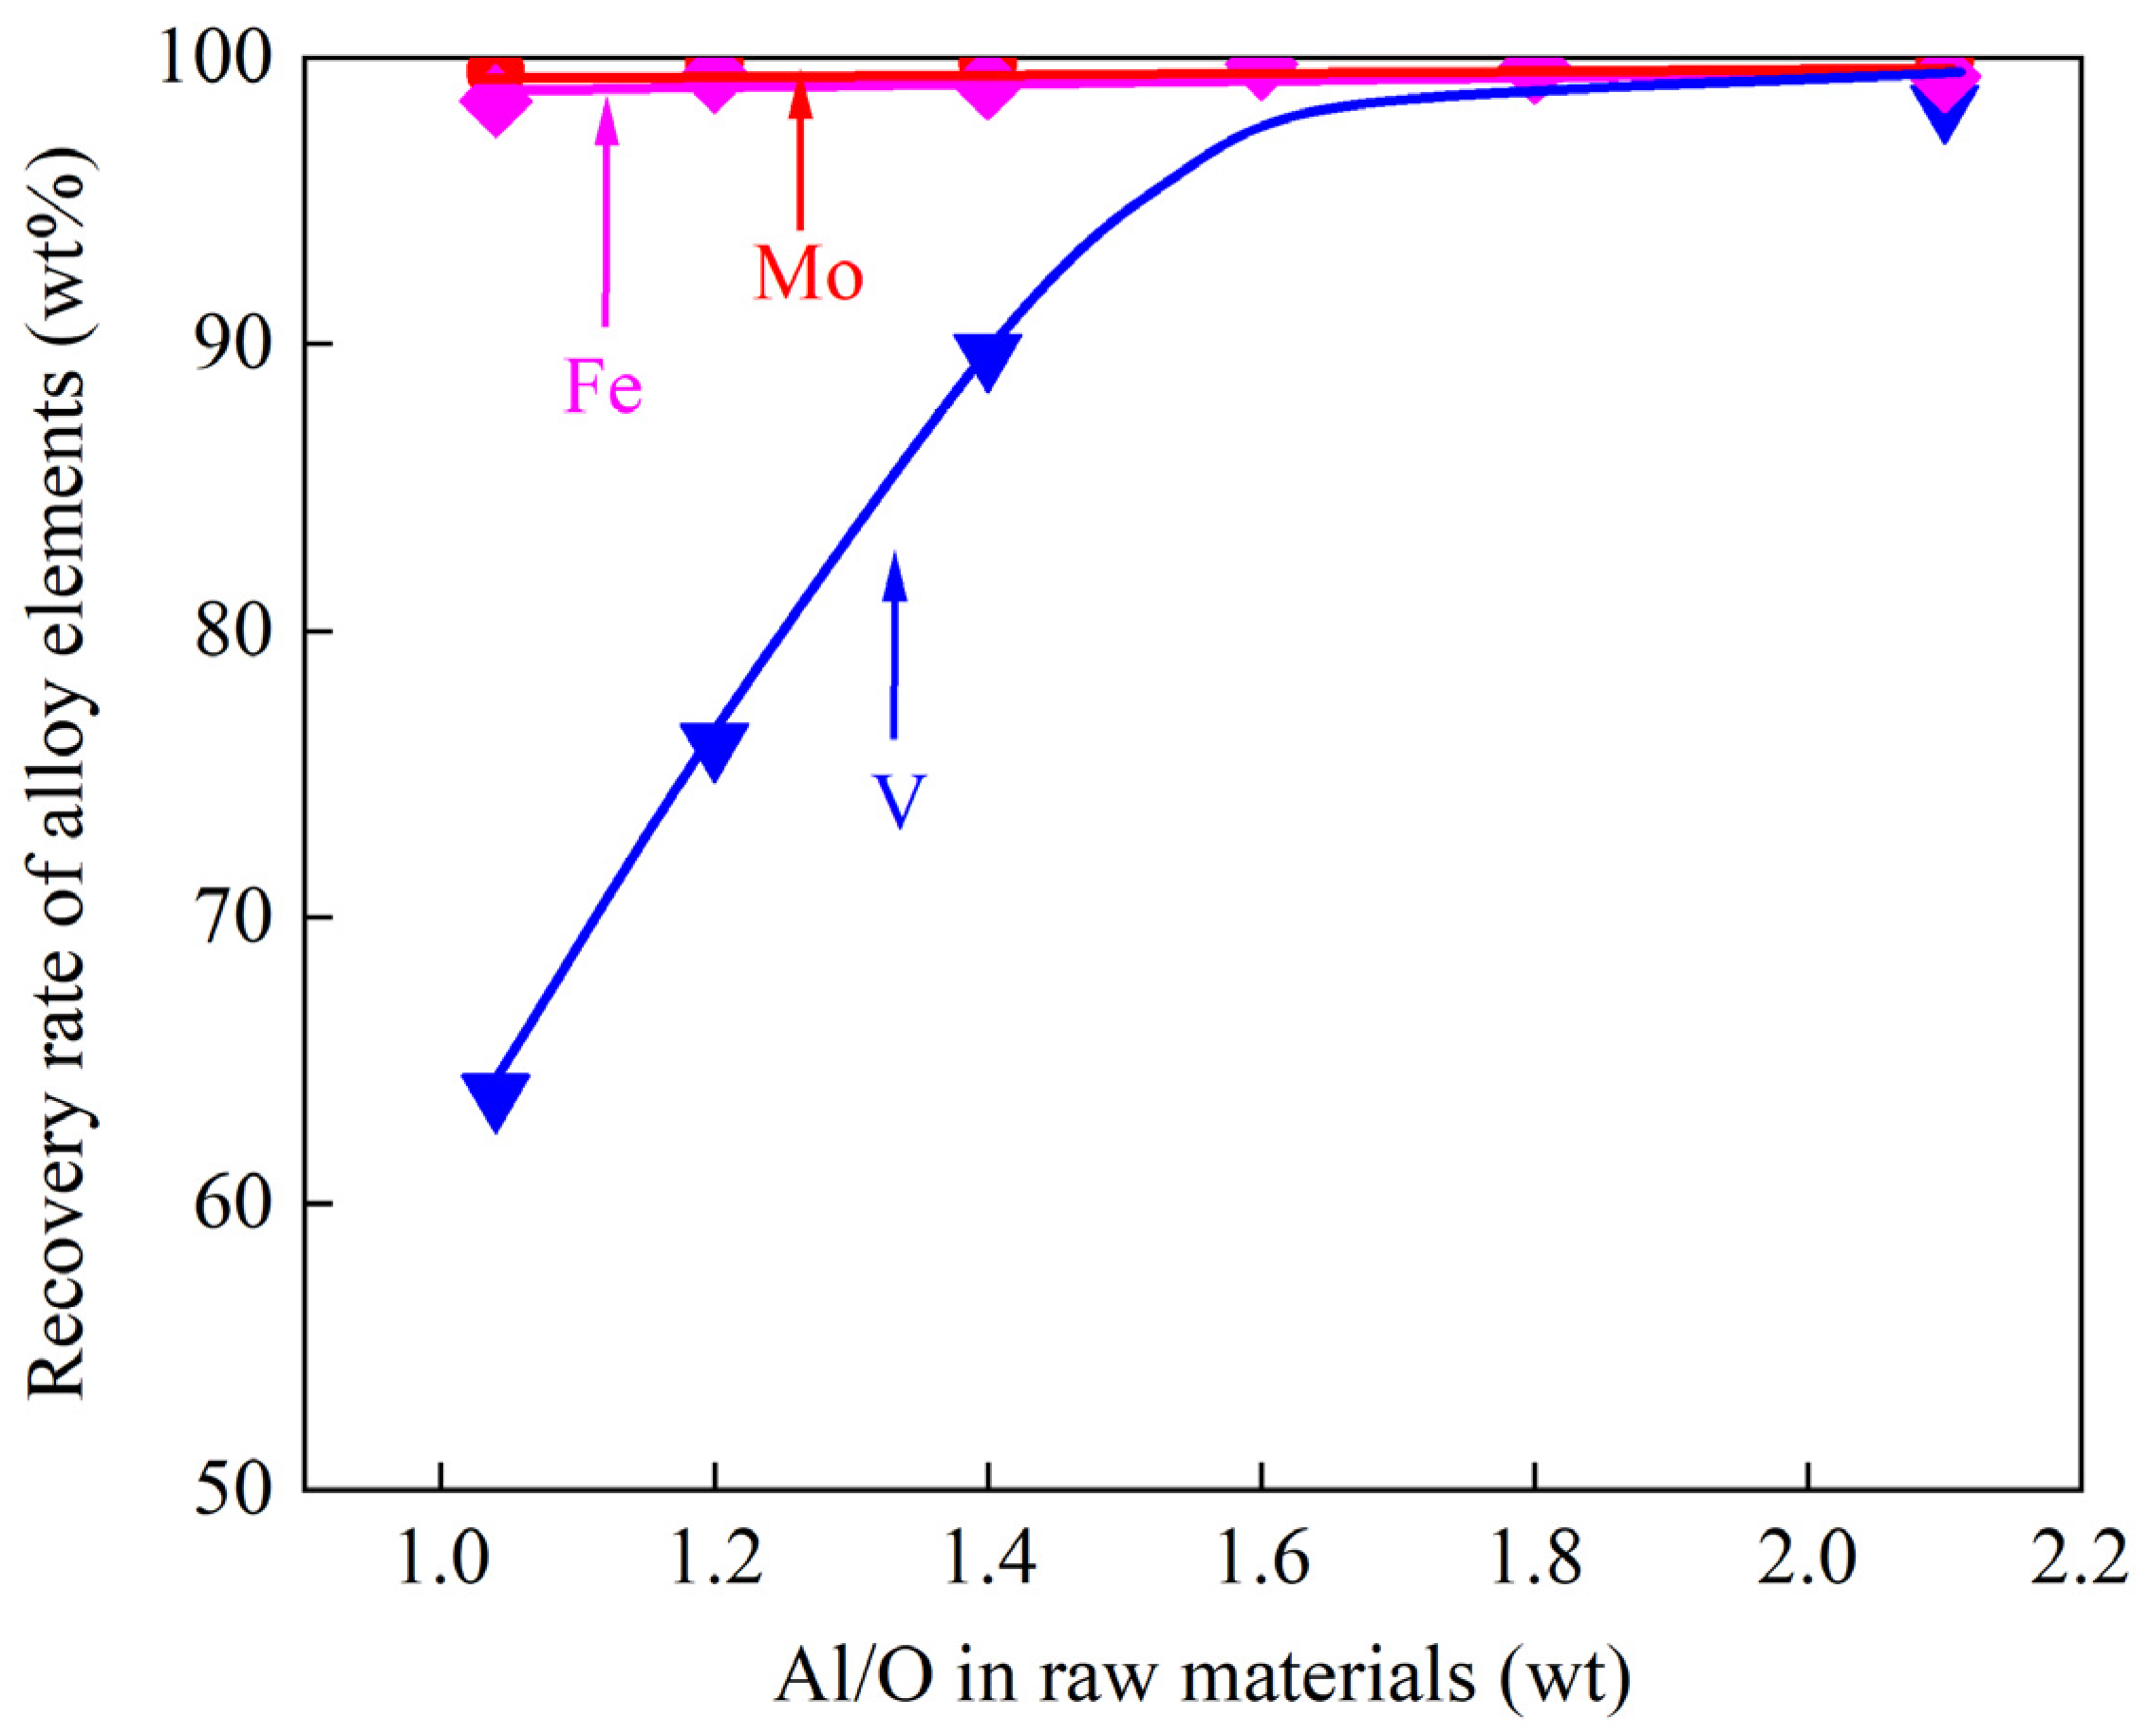
The recovery rates of alloying elements are crucial metrics for assessing production cost. Table 10 and Figure 11 summarize the recovery rates of iron, vanadium, and molybdenum as a function of the Al/O ratio in the raw materials. As discussed above, iron added in metallic form is fully recovered in the alloys. All MoO3 in the raw materials was also fully reduced and reported to the alloys. The recovery rates of vanadium increase with increasing Al/O in raw materials, approaching 100% when Al/O is above 1.6.
The thermodynamic analysis performed with FactSage consistently aligned with the experimental outcomes. The predicted reduction sequence (MoO3 > Fe2O3 > V2O5) explained the complete recovery of Mo and the delayed reduction of V at low Al/O ratios. The use of metallic iron, as suggested by the lower calculated adiabatic temperatures (Figure 3), successfully prevented crucible failure, which was experimentally confirmed. Furthermore, the observed transition from the (Al,Mo,V,Fe) solid solution to the Al8(V,Mo,Fe)5 intermetallic with increasing Al content matches the phase stability regions projected via the ternary V-Al-Mo system. This strong correlation validates the thermodynamic model as a reliable tool for process design.

5. Conclusions

This study successfully established a controlled aluminothermic co-reduction process for synthesizing V-Al-Mo-Fe multi-component master alloys. Integrating thermodynamic analysis with experimental validation confirms the feasibility of this route and identifies the key factors governing alloy composition and recovery. Based on these results, the following conclusions and specific process recommendations are proposed for future industrial-scale production.
First, raw material selection is fundamental for managing reaction intensity and cost. Thermodynamic calculations demonstrate that using metallic iron powder instead of iron oxide as the iron source significantly reduces the overall heat release of the system. This prevents excessive overheating and crucible failure while also lowering aluminum consumption. Therefore, it is recommended to use a charge composed of V2O5, MoO3, aluminum granules, and metallic iron powder.
Second, the Al/O mass ratio in the charge is the most critical parameter controlling reduction completeness and alloy yield. Experiments reveal that incomplete reduction of vanadium oxides occurs at Al/O ratios below 1.6, leading to vanadium loss in the slag. To ensure recovery rates exceeding 99% for V, Mo, and Fe, and to achieve clear separation between the CaO-Al2O3 slag and the molten alloy, the Al/O mass ratio must be maintained at or above 1.6. This parameter directly dictates the sufficiency of the reductant and is essential for high yield and low slag inclusion.
Furthermore, the final alloy composition and microstructure can be effectively tailored by the initial aluminum content. Aluminum in excess of the stoichiometric requirement remains in the alloy. Producers can calculate the required proportions of V, Mo, and Fe based on the target titanium alloy composition and precisely control the master alloy’s total aluminum content, melting point, and phase constitution by adjusting this aluminum excess. This ensures compatibility with subsequent titanium alloy melting processes.
Finally, a stable thermal profile is crucial for obtaining a homogeneous and clean alloy. It is recommended to employ a programmed heating cycle under an inert atmosphere, incorporating a holding stage at a temperature sufficiently high to completely melt the alloy (e.g., ≥1600 °C). This practice facilitates system equilibrium, promotes complete coalescence of metal droplets and effective slag flotation, thereby ensuring thorough slag–metal separation and a uniform master alloy ingot.
In summary, for the efficient and reliable production of V-Al-Mo-Fe multi-component master alloys, the following protocol is recommended: employ a charge formulation based on metallic iron, strictly control the Al/O mass ratio to ≥1.6, and execute a controlled thermal schedule with a high-temperature holding stage under an inert atmosphere. Adherence to these guidelines will enable the preparation of a master alloy with precise composition, high yield, and consistent quality, providing a superior feedstock for the simplified and cost-effective melting of advanced titanium alloys. While this study demonstrates the feasibility of the process at laboratory scale, industrial implementation would require addressing scale-up challenges such as heat management in larger reactors, slag viscosity and separation in continuous operation, and consistent raw material mixing. These aspects will be investigated in future work.


Author Contributions

Conceptualization, B.Z. and J.L.; Methodology, X.W. and J.L.; Software, B.Z.; Validation, J.L. and S.X.; Formal analysis, J.L.; Investigation, J.L. and S.X.; Resources, B.Z.; Data curation, X.W.; Writing—original draft, X.W.; Writing—review and editing, B.Z., J.L. and S.X.; Visualization, X.W. and J.L.; Supervision, J.L. and S.X.; Project administration, J.L. and B.Z.; Funding acquisition, J.L. and S.X. All authors have read and agreed to the published version of the manuscript.

Funding

This research was funded by Ganzhou Rare Earth New Materials and Application Industry Development Alliance (No. XTLM202511), Jiangxi Provincial Early Career Scientific and Technological Talent Development Special Project (No. 20244BCE52194), and National Natural Science Foundation of China Youth Program (No. 52404345).

Data Availability Statement

The original contributions presented in this study are included in the article. Further inquiries can be directed to the corresponding author.

Conflicts of Interest

The research was conducted in the absence of any commercial or financial relationships that could be construed as a potential conflict of interest.

References

  1. Li, J.; Sun, Q.; Yu, H. Research Status of Advanced Forming Technologies for High-Performance Titanium Alloys. Iron Steel Vanadium Titan. 2021, 42, 17–27. [Google Scholar]
  2. Liu, X.; Yang, J.; Li, H.; Zhang, Y.; Yang, W.; Gu, Q.; Li, G.; Huang, D. Research Progress and Challenges of Plastic Deformation Joining Technology for Pipeline Components. Acta Aeronaut. Astronaut. Sin. 2022, 43, 525258. [Google Scholar]
  3. Jin, H.; Wei, K.; Li, J.; Zhou, J.; Peng, W. Research Progress of Titanium Alloys for Aviation. Chin. J. Nonferrous Met. 2015, 25, 280–292. [Google Scholar]
  4. Zhao, Y. Development Status and Trends of Titanium Alloy Research at Home and Abroad. China Mater. Prog. 2010, 29, 1–8. [Google Scholar]
  5. Li, L.; Sun, J.; Meng, X. Application Status and Development Prospect of Titanium Alloys. Titan. Ind. Prog. 2004, 21, 9–24. [Google Scholar]
  6. Zhang, X.; Liu, H.; Che, C.; Xie, H.; Zhao, J.; Liu, S.; Liu, Y.; Zhang, A. Research Progress of Low-Cost Forming Technology for Titanium Alloys. Foundry 2021, 70, 1141–1148. [Google Scholar]
  7. Lu, Z.; Zhang, X.; Wei, S.; Wei, J.; Wen, T. Research Progress of Titanium Alloys and Their Precision Forming Technologies for Aerospace. J. Astronaut. Mater. Technol. 2020, 50, 1–7. [Google Scholar]
  8. Jeong, W.; Yang, J.; Choi, J.P.; Hwang, J.Y.; Kim, Y.W.; Park, S.J.; Choi, J.W.; Heogh, W.; Lee, H.; Park, J.; et al. Al-based functionally graded super-intermetallic compounds for the turbine blade of a high-performance jet engine. Adv. Compos. Hybrid Mater. 2025, 8, 420. [Google Scholar] [CrossRef]
  9. Li, B.; Yi, Y.; Ren, Y.; Yang, L. Effect of subphase change point temperature cyclic heat treatment on the microstructure and mechanical properties of Ti65 high-temperature titanium alloy fabricated by laser deposition manufacturing. J. Mater. Res. Technol. 2025, 37, 3998–4015. [Google Scholar] [CrossRef]
  10. Sun, J.; Lu, H.; Liang, Y.; Zhang, H.; Luo, K.; Lu, J. Evolution of microstructure and mechanical properties of Ti65 high-temperature titanium alloy after additive manufacturing and annealing. Mater. Sci. Eng. A 2024, 912, 147002. [Google Scholar] [CrossRef]
  11. Wang, C.; Wang, G.; Zhang, X.; Li, T.; Wang, J.; Yang, Q. Microstructural evolution and high-temperature deformation mechanisms in TiB whisker-reinforced near-α titanium matrix composites after superplastic tensile deformation. J. Alloys Compd. 2025, 1, 184163. [Google Scholar] [CrossRef]
  12. Mariana, C.; Pedro, A.; Larissa, S.; Luciana, S.; Conrado, R. A detailed analysis of the structural, morphological characteristics and micro-abrasive wear behavior of nitrate films produced in α (CP-Ti), α+β (Ti-6Al-4V), and β (TNZ33) type Ti alloys. J. Mater. Res. Technol. 2023, 27, 2399–2412. [Google Scholar] [CrossRef]
  13. Gunawarman; Niinomi, M.; Eylon, D.; Fujishiro, S.; Ouchi, C. Effect of β phase stability at Room Temperature on mechanical Properties in β-Rich α+β Type Ti-4.5Al-3V-2Mo-2Fe Alloy. ISIJ Int. 2002, 42, 191–199. [Google Scholar] [CrossRef][Green Version]
  14. Kikuchi, G.; Zui, H.; Takahashi, Y. Sinterability and mechanical properties of SP-700 (Ti-4.5Al-3V-2Fe-2Mo) and TiB/SP-700 prepared by spark plasma sintering. Funtai Oyobi Fummatsu Yakin/J. Jpn. Soc. Powder Powder Metall. 2012, 59, 570–576. [Google Scholar] [CrossRef][Green Version]
  15. Yu, F.; Kong, C.; Liang, Y. Low-temperature superplasticity of cryorolled Ti-6Al-4V titanium alloy sheets. Tungsten 2023, 5, 522–530. [Google Scholar] [CrossRef]
  16. Zhou, K.; Han, P.; Wang, W.; Yang, H.; Guo, X.; Hou, J.; Zhang, Y.; Qiao, K.; Qiang, F.; Wang, K. Microstructure and tensile properties of a large-scale Ti-4.5Al-3V-2Mo-2Fe alloy plate with ultrafine grains prepared by multi-pass friction stir processing. Mater. Today Commun. 2025, 45, 112324. [Google Scholar] [CrossRef]
  17. Cai, J.; Xu, C.; Hao, M.; Huang, X.; Ma, J.; Cao, C. Fatigue crack growth characteristics of fine structures of SP700 and Ti-6Al-4V titanium alloys. J. Aeronaut. Mater. 2006, 26, 71–74. [Google Scholar]
  18. Gunawarman, A.; Niinemo, M.; Fukunaga, K.; Eylon, D.; Fujishiro, S.; Ouchi, C. Fracture characteristics and microstructural factors in single and duplex annealed Ti-4.5Al-3V-2Mo-2Fe. Mater. Sci. Engineering. A 2001, 308, 216–224. [Google Scholar] [CrossRef]
  19. Gunawarman; Mitsuo, N.; Daniel, E.; Shiro, F.; Chiaki, O.; Toshihiko, K. Improvement in fracture toughness of Ti-4.5Al-3V-2Mo-2Fe through microstructural optimization. Metall. Mater. Trans. A 2003, 34, 267–275. [Google Scholar] [CrossRef]
  20. Zhang, F.; Huang, K.; Zhao, K.; Tan, H.; Li, Y.; Qiu, M.; Chen, Y.; Wang, M.; Zhang, C. Directed energy deposition combining high-throughput technology and machine learning to investigate the composition-microstructure-mechanical property relationships in titanium alloys. J. Mater. Process. Technol. 2023, 311, 117800. [Google Scholar] [CrossRef]
  21. Cory, R.; Majid, V.; Keivan, D. Nickel-Titanium Alloy Laser Micromachining: A Review of Nitinol Laser Processes and Optimization for High-Speed Laser Cutting. Adv. Eng. Mater. 2024, 26, 2302112. [Google Scholar] [CrossRef]
  22. Chiaki, O.; Hideaki, F.; Kohei, H. Microstructural characteristics and unique properties obtained by solution treating or aging in β-rich α+β titanium alloy. Mater. Sci. Eng. A 1999, 263, 132–136. [Google Scholar] [CrossRef]
  23. He, C.; Ye, H.; Qu, H.; Deng, C. Effects of heat treatment regime on microstructure and properties of TB3 titanium alloy. Hot Work. Technol. 2011, 40, 181–182, 185. [Google Scholar]
  24. Ma, B.; Ren, L.; Gao, T.; Zhou, L. Effects of β grain size and double aging furnace cooling rate on microstructure and properties of TB3 titanium alloy. Titan. Ind. Prog. 2018, 35, 31–34. [Google Scholar]
  25. Song, Z.; Sun, Q.; Xiao, L.; Sun, J.; Zhang, L.; Guo, X.; Li, X. Age Hardening and Its Modeling of Ti-10Mo-8V-1Fe-3.5Al Alloy. Rare Met. Mater. Eng. 2014, 43, 1543–1548. [Google Scholar] [CrossRef]
  26. Zhang, B.; Huang, M.; Sun, Q. Enhancing strength-ductility synergy via hierarchical microstructure in fine-grained Ti-10Mo-8V-1Fe-3.5Al alloy. Mater. Lett. 2022, 325, 132690. [Google Scholar] [CrossRef]
  27. Ayllon, J.; Miguel, V.; Martínez, A.; Coello, J. Development of a Nakazima formability test methodology for high temperature applications on titanium alloys sheet metal. IOP Conf. Ser. Mater. Sci. Eng. 2021, 1193, 012076. [Google Scholar] [CrossRef]
  28. Su, S.; Li, J.; Yang, F. Production Method of Aluminum-Vanadium-Molybdenum Intermediate Alloy for TB3 Titanium alloy. CN201910827801, 7 February 2020. [Google Scholar]
  29. Wang, X.; Liao, X.; Ma, X.; Zhao, B. Exothermic and Slag Formation Behavior of Aluminothermic Reduction of Mo and V Oxides. Metals 2025, 15, 704. [Google Scholar] [CrossRef]
  30. Zhang, Z.; Guo, S.; Tian, F. A Kind of Aluminum-Molybdenum-Vanadium-Iron Intermediate Alloy and Its Preparation Method. CN200310119080, 22 June 2005. [Google Scholar]
  31. Qing, D.; Feng, J.; Li, Y.; Liu, M.; Feng, Q.; Chen, F. Research on the Preparation Process of Al-Mo-V-Fe Intermediate Alloy for Titanium Alloys. World Nonferrous Met. 2019, 20, 13–16. [Google Scholar]
  32. Bale, C.; Bélisle, E.; Chartrand, P.; Decterov, S.; Eriksson, G.; Gheribi, A.; Hack, K.; Jung, I.; Kang, Y.; Melançon, J.; et al. FactSage thermodynamic software and databases 2010–2016. Calphad 2016, 54, 35–53. [Google Scholar] [CrossRef]
  33. Muan, A.; Osborn, E. Phase Equilibria Among Oxides in Steelmaking; Addison-Wesley Publishing Company, Inc.: Reading, MA, USA, 1965. [Google Scholar]
  34. Qiao, Z. Rare Metals Handbook; Metallurgical Industry Press: Beijing, China, 1992; p. 254. [Google Scholar]
  35. Xia, Y. Laboratory Manual of Chemistry, 2nd ed.; Chemical Industry Press: Beijing, China, 2008; p. 17. [Google Scholar]
  36. Liao, W.; Chen, F.; Lei, Z. Elec Trochemistry of Materials; Science Press: Beijing, China, 2019; p. 24. [Google Scholar]
  37. Hu, B.; Yao, B.; Wang, J.; Zhao, J.; Min, F.; Du, Y. Thermodynamic Assessment of the Al-Mo-V Ternary System. J. Min. Metall. Sect. B Metall. 2017, 53, 95–106. [Google Scholar] [CrossRef]
  38. Zhang, Q. Phase Diagram Atlas of Ternary Alloys; Chemical Industry Press: Beijing, China, 2022; p. 191. [Google Scholar]
  39. Okamoto, H. Al-V (Aluminum-Vanadium). J. Phase Equilibria Diffus. 2012, 33, 491. [Google Scholar] [CrossRef]
  40. Massalski, T.; Okamoto, H. Binary Alloy Phase Diagrams; ASM International: Almere, The Netherlands, 1990; p. 147. [Google Scholar]
Figure 1. Gibbs free energy and enthalpy change for reactions (4) to (6) during the aluminothermic reduction process: (a) Gibbs free energy and enthalpy at 660 °C; (b) change in Gibbs free energy with temperature.
Metals 16 00206 g001
Figure 2. Influence of Al/O ratio on (a) reaction heat release and (b) maximum temperature calculated by FactSage 8.3 based on the equivalent conversion of Fe in Table 2 to Fe2O3.
Metals 16 00206 g002
Figure 3. Influence of Al/O ratio on (a) reaction heat release and (b) maximum temperature calculated by FactSage 8.3 based on Table 2.
Metals 16 00206 g003
Figure 4. Macrographs of post-reaction samples: #1 (2% Al in alloy), #6 (37% Al in alloy).
Metals 16 00206 g004
Figure 5. Typical microstructures of the slags and alloys in #1–#3 after the reaction.
Metals 16 00206 g005
Figure 6. Typical microstructures of the slags and alloys in #4–#6 after the reaction.
Metals 16 00206 g006
Figure 7. A comparison of the designed and experimental compositions of the V-Al-Mo-Fe alloys, showing on the ternary phase diagram reprinted from Ref. [37].
Metals 16 00206 g007
Figure 8. Alloy compositions as a function of Al/O ratio in raw materials: comparison between the designed and experimental values (a) Fe in alloy; (b) Mo in alloy; (c) Al in alloy; and (d) V in alloy.
Metals 16 00206 g008
Figure 9. The Fe and Al composition in the raw materials, showing on the Fe-Al binary phase diagram, reprinted from Ref. [39].
Metals 16 00206 g009
Figure 10. Compositions of the smelting slags as a function of Al/O in raw material, (a) Al2O3 and CaO in slag, (b) MoO3 and V2O3 in slag.
Metals 16 00206 g010
Figure 11. Effect of Al/O ratio in the raw material on recovery rates of V, Mo, and Fe.
Metals 16 00206 g011
Table 1. Raw materials used in the present study.
MaterialFormPurity (%)Manufacturer
V2O5Powder≥99.7Chengde Vanadium Titanium Co., Ltd. (Chengde, China)
AlGranules≥99.9Beijing Kerry New Materials Co., Ltd. (Beijing, China)
CaOPowder≥99.5Xilong Scientific Co., Ltd. (Shantou, China)
MoO3Powder≥99.5Shanghai Macklin Biochemical Co., Ltd. (Shanghai, China)
FePowder≥99.5Shanghai Macklin Biochemical Co., Ltd.
Table 2. Experimental conditions.
Exp No.Al (g)V2O5 (g)Fe (g)MoO3 (g)CaO (g)Al:(V + Mo + Fe) in AlloysAl in Alloy (wt%)Al/O (wt)
#12.94.01.52.25.22:9821.1
#23.34.01.52.25.29:9191.2
#33.84.01.52.25.216:84161.4
#44.44.01.52.25.223:77231.6
#55.04.01.52.25.230:70301.8
#65.84.01.52.25.237:63372.1
Table 3. Heat release (∆H) and maximum temperature (Tm) corresponding to different Al/O ratios based on the equivalent conversion of Fe in Table 2 to Fe2O3.
Exp No.Al/O Ratio (wt)∆H (kJ/kg)Tm (°C)
#11.0−31492560
#21.1−31242565
#31.3−30852555
#41.5−30402529
#51.6−29972493
#61.9−29382435
Table 4. Heat release (∆H) and maximum temperature (Tm) as a function of Al/O ratio, calculated by FactSage 8.3 based on Table 2.
Exp No.Al/O Ratio (wt)∆H/(kJ/kg)Tm (°C)
#11.1−26792300
#21.2−26712305
#31.4−26362297
#41.6−26042268
#51.8−25782235
#62.1−25252164
Table 5. The compositions of the oxides in the slow-cooled samples measured by EPMA.
Exp No.Phaseswt%mol%
Al2O3CaO“V2O3MoO3Al2O3CaO“V2O3MoO3
#1inclusion in alloy68.831.10.00.154.545.10.20.2
CaO·Al2O364.035.60.40.049.750.10.20.0
12CaO·7(Al,V)2O327.645.127.30.021.564.014.50.0
#2CaO·Al2O364.235.30.50.049.949.90.20.0
12CaO·7(Al,V)2O339.646.314.10.029.763.17.20.0
#3inclusion in alloy61.838.20.00.047.152.90.00.0
CaO·Al2O364.535.50.00.050.050.00.00.0
remaining liquid52.147.80.10.037.462.50.10.0
#4CaO·Al2O363.336.70.00.048.751.30.00.0
remaining liquid51.848.20.00.037.262.80.00.0
#5CaO·Al2O365.334.70.00.050.949.10.00.0
12CaO·7Al2O354.245.80.00.039.560.50.00.0
#6CaO·2Al2O378.921.10.00.067.332.70.00.0
CaO·Al2O364.835.20.00.050.349.70.00.0
12CaO·7Al2O352.547.50.00.037.862.20.00.0
Table 6. The compositions of alloys in the slow-cooled samples measured by EPMA.
Exp No.Phaseswt%mol%
VAlMoFeCaVAlMoFeCa
#1(Al,Mo,V,Fe)28.712.530.628.20.030.525.017.227.30.0
#2(Al,Mo,V,Fe)27.717.128.326.90.027.932.415.124.60.0
#3(Al,Mo,V,Fe)31.618.724.924.80.030.834.312.922.00.0
#4alloy in slag96.62.10.00.01.394.53.90.00.01.6
(Al,Mo,V,Fe)32.323.423.820.50.030.041.011.717.30.0
#5(Al,Mo,V,Fe)35.025.117.622.30.031.342.38.318.10.0
Al8(Mo,V,Fe)523.738.520.916.90.019.359.19.012.60.0
#6Remaining liquid36.526.315.421.80.032.043.57.117.40.0
Al8(Mo,V,Fe)525.539.318.516.70.020.459.57.912.20.0
Table 7. Bulk compositions of slags measured by ICP.
Exp No.wt%mol%
Al2O3CaO“V2O3MoO3Al2O3CaO“V2O3MoO3
#148.140.711.10.137.457.74.90.0
#257.536.06.50.045.451.72.90.0
#361.635.72.70.048.150.71.20.0
#465.134.90.00.050.649.40.00.0
#565.334.70.00.050.949.10.00.0
#664.834.80.40.050.649.20.20.0
Table 8. Bulk compositions of alloys measured by ICP.
Exp No.wt%mol%
VAlMoFeCaVAlMoFeCa
#128.816.027.227.80.229.130.414.625.60.3
#231.317.625.026.00.130.832.713.123.30.1
#333.618.823.823.70.132.534.312.220.90.1
#431.125.421.422.00.128.243.310.318.10.1
#530.130.819.120.00.025.849.88.715.70.0
#625.939.217.217.70.020.659.17.412.90.0
Table 9. Compositions of Al-Fe alloys in the starting materials before the aluminothermic reaction starts.
Exp No.Al/wt%Fe/wt%Liquidus Temperature/°C
#165.934.11146
#268.831.31138
#371.728.31125
#474.625.41102
#576.923.11081
#679.520.51049
Table 10. Recovery rates of alloy elements.
Al/O(wt)Mo/wt%V/wt%Fe/wt%
1.199.563.898.5
1.299.876.199.3
1.499.889.799.1
1.699.999.999.8
1.899.999.899.6
2.199.998.499.4
Disclaimer/Publisher’s Note: The statements, opinions and data contained in all publications are solely those of the individual author(s) and contributor(s) and not of MDPI and/or the editor(s). MDPI and/or the editor(s) disclaim responsibility for any injury to people or property resulting from any ideas, methods, instructions or products referred to in the content.