Article

Effects of Stress State and Microstructure on Deformation-Induced Transformation and Ageing in Medium-Manganese TRIP Steels


by
Javier Carreno-Saavedra
*,
Roumen H. Petrov
and
Patricia Verleysen
MST-DyMaLab Research Group, Department of Electromechanical, Systems and Metal Engineering, Ghent University, Tech Lane Ghent Science Park 46, 9052 Zwijnaarde, Belgium
*
Author to whom correspondence should be addressed.
Metals 2026, 16(2), 177; https://doi.org/10.3390/met16020177
Submission received: 31 December 2025 / Revised: 23 January 2026 / Accepted: 27 January 2026 / Published: 2 February 2026

Abstract

This study examines the mechanical response of medium-manganese TRIP steels under different stress states, focusing on deformation-induced austenite-to-martensite transformation and ageing phenomena. Two steels with distinctly different ferrite–austenite morphologies and retained austenite (RA) fractions were analysed: a globular microstructure with 18% RA and a lamellar microstructure with 14% RA, produced by single (SA) and double annealing (DA), respectively. Continuous and interrupted tests were performed under in-plane shear, uniaxial tension, and plane strain stress states. Strain fields were analysed using high-resolution digital image correlation, while RA fractions were quantified as a function of strain by ex situ X-ray diffraction. The results demonstrate a pronounced stress-state dependence. SA samples exhibit discontinuous yielding, with uniaxial tests showing clear Lüders band formation. Both steels exhibit dynamic strain ageing manifested by Portevin–Le Chatelier (PLC) serrations and associated strain bands, which are most pronounced under uniaxial tension, weaker in plane strain, and barely detectable in in-plane shear. Static strain ageing is also evidenced by a strengthened yield response upon unloading–reloading in all samples. The SA globular microstructure exhibits higher PLC band inclination angles than the lamellar DA microstructure, consistent with its more pronounced anisotropy. The propagation velocity in uniaxial tensile samples decreases with increasing strain following the work-hardening response. For both steels, the austenite-to-martensite transformation rate is highest in uniaxial tension, slightly reduced in plane strain, and strongly suppressed under in-plane shear. A Beese–Mohr/Johnson–Mehl–Avrami–Kolmogorov formulation incorporating stress triaxiality and Lode angle captures these trends for both steels. For the stress states considered, the DA condition exhibits a consistently higher transformation rate than the SA condition, accompanied by a higher work-hardening rate. These findings highlight the coupled role of stress state and microstructural morphology in governing localisation behaviour and strain-induced transformation in medium-manganese steels.

1. Introduction

The automotive industry increasingly employs advanced high-strength steels (AHSS) owing to their unique combination of high strength and excellent ductility [1,2]. These properties enable structural components to absorb crash energy efficiently while allowing lighter vehicle designs at a competitive cost [3]. Consequently, the implementation of AHSS substantially contributes to lowering fuel consumption and reducing CO2 emissions in modern vehicles [4].
Medium-manganese (MedMn) transformation-induced plasticity (TRIP) steels belong to the third generation of AHSS, which are specifically designed to achieve an optimal balance between strength, ductility, and cost. The desired multiphase microstructure can be obtained either by thermo-mechanically controlled processing during hot deformation and controlled cooling, or via a cold-rolling and annealing route. MedMn TRIP steels typically contain 3–8 wt. % manganese and are generally processed using thermal treatments that include an intercritical annealing (IA) step, enabling precise control of the ferrite–austenite microstructure [5,6,7,8,9,10]. The tailored micro-structure is crucial for the mechanical performance of MedMn TRIP steels, which generally exhibit ultimate tensile strengths of 800–1200 MPa and total elongations of 20–40%.
The morphology of the microstructure varies strongly with the applied heat treatment [11]. When a single-annealing (SA) route is applied to a cold-rolled ferrite–cementite starting microstructure, IA promotes cementite dissolution and the nucleation of austenite within the deformed ferrite matrix, accompanied by recovery and recrystallisation, yielding an ultrafine globular morphology. In contrast, a double-annealing (DA) route first imposes an austenitisation and quenching step to obtain a fully martensitic structure. During the subsequent IA heat treatment, austenite nucleates along laths, blocks or sub-block boundaries, while the martensite progressively recovers and becomes the surrounding matrix. Although the recovered matrix is tempered martensite and may contain carbides, it is commonly referred to as ferrite in the literature due to its BCC structure and similar mechanical behaviour. The process, referred to as austenite-reverted transformation (ART), results in a fibrous ferrite–austenite microstructure [6,12,13,14].
The mechanical behaviour of MedMn TRIP steels is strongly affected by the stability of retained austenite (RA), which transforms into martensite during plastic deformation through the TRIP effect [9,15,16]. A gradual transformation is essential, as it sustains strain hardening and enhances ductility. The transformation kinetics depend on the chemical composition (primarily carbon and manganese, with additional contributions from alloying elements such as silicon and aluminium), microstructural features (e.g., austenite morphology and grain size), and loading conditions (strain rate, temperature, and stress state) [17,18]. Numerous models have been proposed to describe the transformation kinetics [19,20,21,22,23,24,25]. Among these, the Olson–Cohen (OC) formulation [19] and Johnson–Mehl–Avrami–Kolmogorov (JMAK)-based approaches [22,23] have been the most widely used. The original versions of both the Olson–Cohen and JMAK models were developed for uniaxial loading and do not include any dependence on stress state. As such, they do not allow for capturing the effects of more complex multiaxial loading. This limitation is significant, as forming and crash loading typically impose multiaxial stress states. Under such conditions, austenite stability, and thus the associated transformation kinetics, has been shown to vary with the applied stress state [26,27,28,29,30,31,32,33,34,35,36,37,38,39]. Studies on MedMn steels showed that both plane strain and biaxial tension promote faster transformation than uniaxial tension [34,37,38]. The observed faster transformation with increasing stress triaxiality has been associated with an increase in the mechanical driving force for the austenite-to-martensite transformation. To account for the stress state, existing transformation models have been extended [26,29,30,31,33,36]. Some modifications account for the influence of stress state through stress triaxiality ( η ), defined as the ratio of the hydrostatic stress to the equivalent von Mises stress ( η = σ m σ ¯ ) [26,29,31]. However, other experimental studies have reported divergent observations regarding the influence of stress triaxiality on the transformation kinetics [27,28,29,30,32,33,34,35,36,37,38]. In particular, transformation rates under plane strain and biaxial loading similar to, or even lower than, those under uniaxial tension have been observed, despite the higher stress triaxialities involved [30,33,36]. In [30,33], the non-monotonic dependence of the transformation on stress triaxiality is attributed to the influence of the Lode angle that locates a stress state within the deviatoric stress plane. The Lode angle θ is defined as θ = 1 3 a r c c o s ( 3 3 2 J 3 J 2 3 / 2 ) , where J 2 and J 3 are the second and third invariants of the deviatoric stress tensor. The corresponding Lode angle parameter ( θ ¯ ) is given by θ ¯ = 1 6 θ π . θ ¯ ranges from −1 to 1 and is commonly used alongside stress triaxiality as a key stress state descriptor. Considering both η and θ ¯ provides a more comprehensive characterisation of the stress state, capturing effects that triaxiality alone does not account for. Mansourinejad and Ketabchi [33] extended the Olson–Cohen model by incorporating η and θ ¯ into the kinetics law. Beese and Mohr [30] proposed a JMAK-based approach in which the parameter representing the austenite stability depends on η and θ ¯ . The proposed formulations showed good agreement with the experimental data under the investigated loading conditions. Both studies further demonstrated that stress triaxiality alone cannot fully capture the dependence of the transformation kinetics on the loading path.
The diverging, yet unexplained, experimental trends on the role of stress state show that the mechanisms governing the austenite-to-martensite transformation are not yet fully understood. Improving the understanding of the complex interactions between microstructure and applied stress requires experiments that impose a broad range of stress states. However, stress states that deviate from uniaxial tension or compression generally demand non-standard specimens, such as notched samples. These geometries introduce strongly heterogeneous strain fields, making both strain and retained-austenite measurements highly sensitive to the chosen analysis region. Reliable correlations between local strain and transformed austenite require that both quantities are measured at the same location and averaged over the same area. Nevertheless, many studies do not employ local strain measurements [28,29,33,34], and even when such measurements are used, the exact region considered is often not specified, leaving it unclear whether strain and austenite were determined at coincident locations [30,32,35,36,37,38]. The resulting lack of reliable experimental data also inhibits the development of a generalised and experimentally validated model capable of capturing strain-induced transformation under diverse loading paths.
The mechanical response of medium-Mn steels is further affected by static and dynamic strain ageing. In medium-Mn steels, static strain ageing is commonly associated with discontinuous yielding and Lüders band formation, whereas dynamic strain ageing may lead to Portevin–Le Chatelier (PLC) serrations in the stress–strain response, frequently accompanied by visible strain bands [40,41,42,43,44,45]. In medium-Mn TRIP steels, the onset and intensity of these ageing phenomena have been shown to depend strongly on chemical and phase composition, including the carbon and manganese contents, aluminium and silicon additions, and the volume fraction and morphology of retained austenite [46,47,48]. Recent studies suggest that interstitial solute atoms retained from intercritical annealing, as a consequence of incomplete partitioning or partial carbide dissolution, may interact with mobile dislocations and contribute to serrated flow in medium-Mn steels [46,47]. These solute–dislocation interactions are often discussed in parallel with classical static and dynamic strain ageing mechanisms and are consistent with broader observations linking PLC instabilities to solute content, retained austenite characteristics and deformation conditions, i.e., from room temperature up to ~150 °C and quasi-static strain rates, in medium-Mn AHSS [10,43,49].
The associated strain localisation phenomena, involving strong amplification of local strain within narrow, propagating bands, further complicate the analysis of transformation kinetics even under uniaxial tension. Correlating retained austenite measurements obtained at a specific location with global strain metrics may lead to apparent discontinuities or plateaus in the transformation curves, as the local strain history is strongly affected by the passage and arrest of Lüders and PLC bands [44,50,51]. In medium-Mn steels, PLC band propagation has been reported to frequently overlap with regions undergoing strain-induced martensitic transformation, reflecting, at least partially, a shared dependence on the evolving distribution of plastic strain and on austenite stability [10,49]. While the precise interaction remains under discussion and is expected to depend on alloy design and processing conditions, both phenomena have been highlighted as potentially occurring simultaneously in recent microstructural and in situ characterisation studies [52]. Moreover, serrated flow is not restricted to uniaxial loading. Recent studies show that the imposed stress state can influence the occurrence and intensity of PLC serrations, indicating that their manifestation is also stress-state dependent [53].
This study examines the mechanical response, strain localisation, and strain-induced martensitic transformation behaviour of medium-Mn TRIP steels under different stress states, with particular attention to ageing-related phenomena. Two distinct ferrite–austenite microstructures are investigated: a globular morphology with 18% retained austenite and a lamellar morphology with 14% RA. Mechanical testing is performed under different loading conditions, including in-plane shear, uniaxial tension, and plane strain, in order to impose a broad range of stress states. The experimental results are modelled adopting an extended Beese–Mohr/Johnson–Mehl–Avrami–Kolmogorov framework incorporating the effects of stress triaxiality and Lode angle parameter [30], enabling a quantitative assessment of stress-state-dependent transformation kinetics. In addition, the occurrence of Lüders bands and Portevin–Le Chatelier serrations associated with strain ageing phenomena under the different loading conditions is analysed to explore potential correlations between strain localisation and transformation behaviour. Finally, plastic anisotropy is examined and linked with the band orientation.

2. Materials and Methods

2.1. Processing Routes and Microstructures

The experimental material used in this study was a laboratory-made medium-Mn steel, produced by vacuum induction melting in two 100 kg ingots with identical chemical compositions, given in Table 1. After removal of the ingot heads, the remaining material was held at 1100 °C for 120 min and hot-rolled in six passes from 125 mm to 30 mm thickness, followed by air cooling. To reduce manganese segregation, the hot-rolled blocks (100 × 260 × 30 mm3) were homogenised at 1200 °C for 30 h. To minimise decarburisation during high-temperature treatments, the material was wrapped in stainless-steel foil and encased in mild-steel boxes. Prior to final hot rolling, the blocks were held at 1200 °C for 30 min and subsequently hot-rolled to a final thickness of 3 mm, with a finish rolling temperature above 900 °C, followed by air cooling. The sheets were then annealed at 700 °C for 10 min to soften the material prior to cold rolling, after which the oxide layer was removed by sandblasting. Final cold rolling to a thickness of 1.5 mm was performed in multiple passes, using reductions of approximately 0.2 mm at the beginning and 0.1 mm towards the end. The resulting cold-rolled microstructure consisted of ferrite, cementite, and martensite–austenite (MA) constituents.
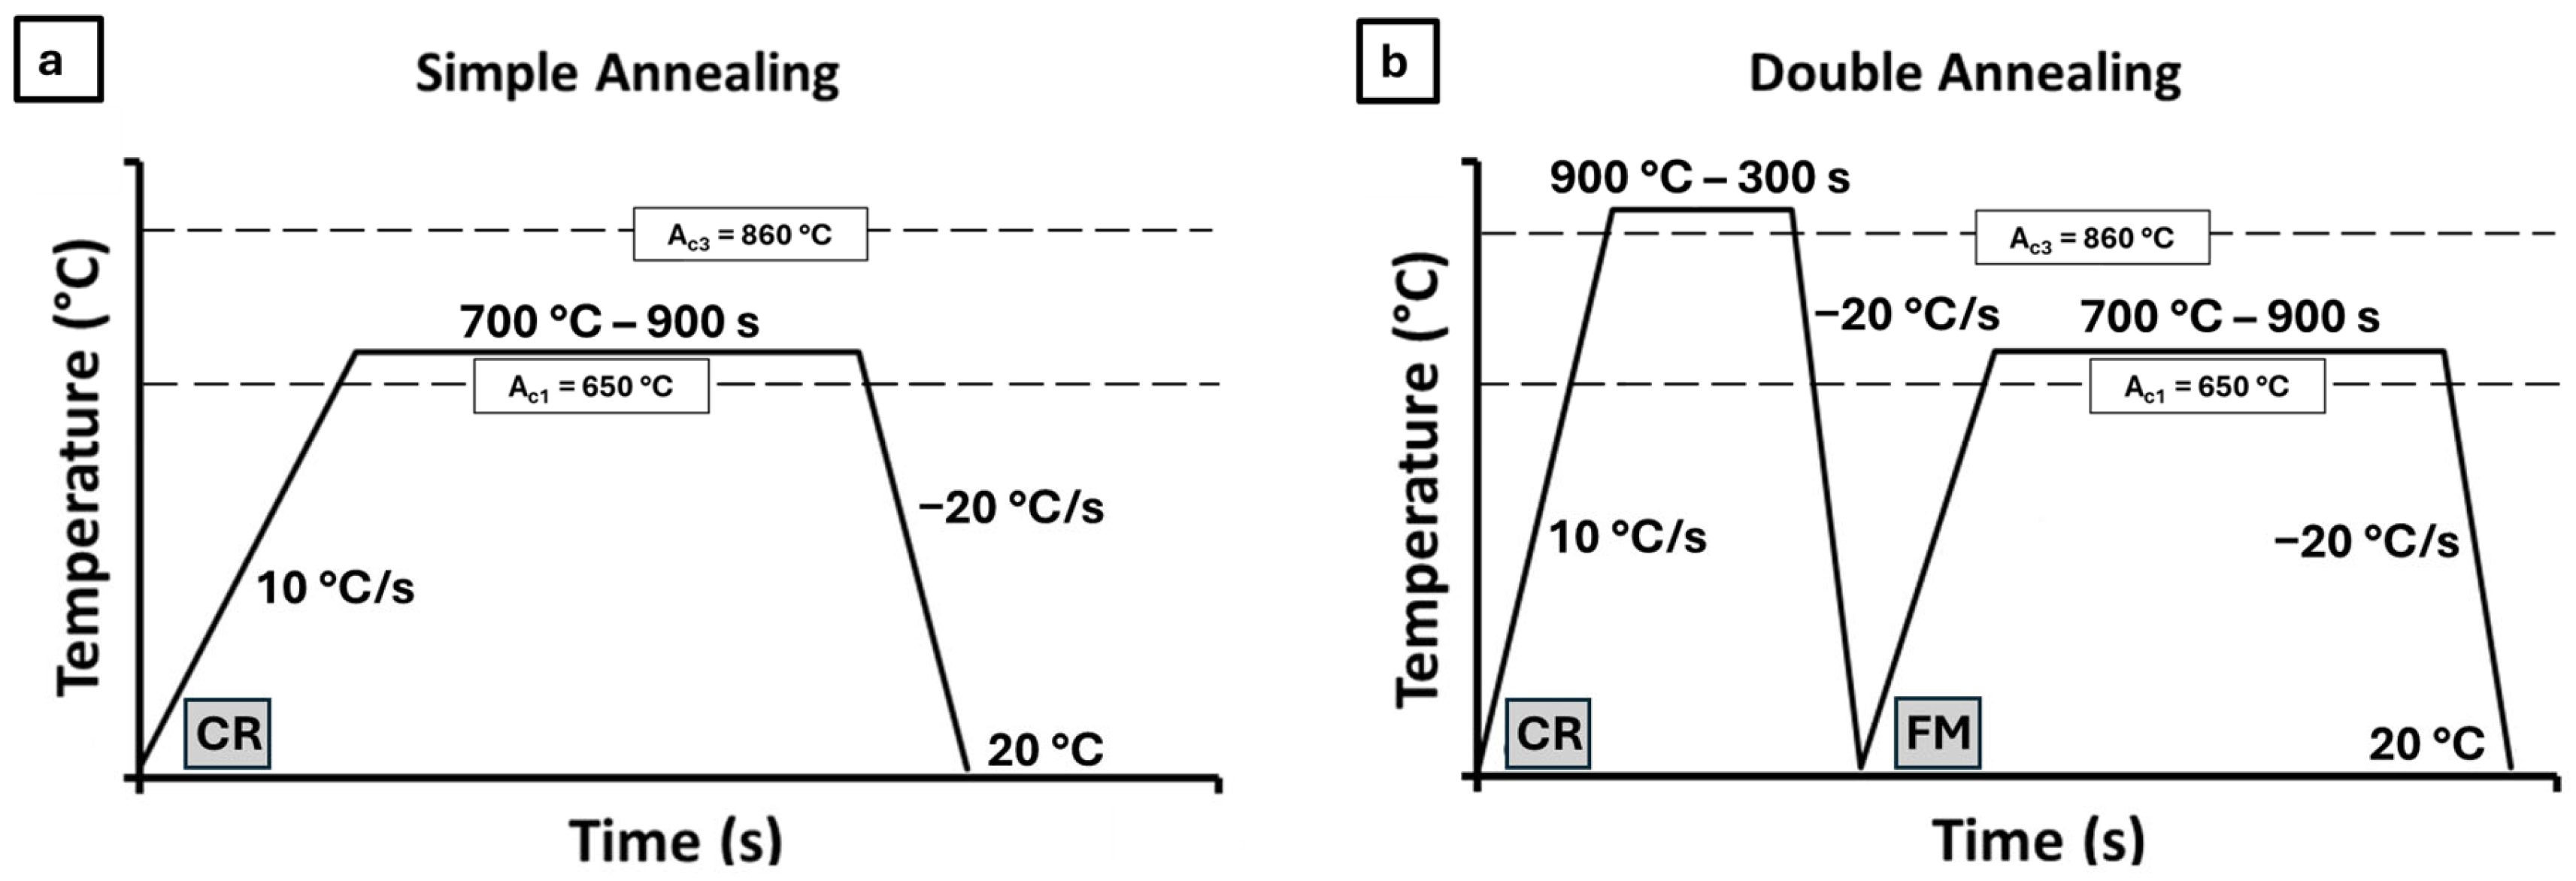
Two distinct ferrite–austenite microstructures were obtained by applying different annealing routes: a single-step intercritical annealing and a two-step double annealing involving austenitisation followed by intercritical annealing. Each route was designed to promote a different morphology of ferrite and retained austenite. To determine suitable processing parameters, high-resolution dilatometry was carried out to identify critical transformation temperatures and the evolution of phase fractions under various thermal conditions. The measurements established Ac3 ≈ 860 °C and Ac1 ≈ 650 °C and indicated near-complete carbide dissolution at ~710 °C during a 10 min intercritical hold. Subsequently, two complementary sets of anneals were explored. From the cold-rolled condition, intercritical treatments were performed in the range 680–720 °C. From a fully martensitic starting condition, obtained by austenitising at 920 °C for 200 s and quenching, intercritical anneals were conducted in the range of 650–850 °C. In both starting conditions, annealing at 700 °C resulted in a significant ferrite fraction, promoted carbide dissolution, and stabilised austenite. Additionally, austenitisation at 900 °C for 5 min followed by quenching was explored, resulting in a fully martensitic structure.
Based on these findings, the two selected thermal treatments are summarised as follows: In the first route, referred to as SA, the intercritical annealing was applied directly to the cold-rolled microstructural state, with heating at 10 °C/s to 700 °C, a holding time of 15 min, followed by quenching to room temperature. The second route, referred to as DA, involved an initial austenitisation at 900 °C with a heating rate of 10 °C/s and a soaking time of 5 min, followed by quenching to obtain a fully martensitic starting condition, and a subsequent intercritical annealing at 700 °C for 15 min, also followed by a final quenching. While the SA treatment promoted the formation of a globular ferrite–austenite microstructure, the DA route led to a lamellar ferrite–austenite morphology. Both thermal cycles are schematically illustrated in Figure 1.
The heat treatments were carried out on a dynamic annealing simulator, which ensured uniform heating and rapid quenching under controlled laboratory conditions. This setup allowed precise adjustment of heating and cooling rates, enabling reproducible laboratory-scale processing.
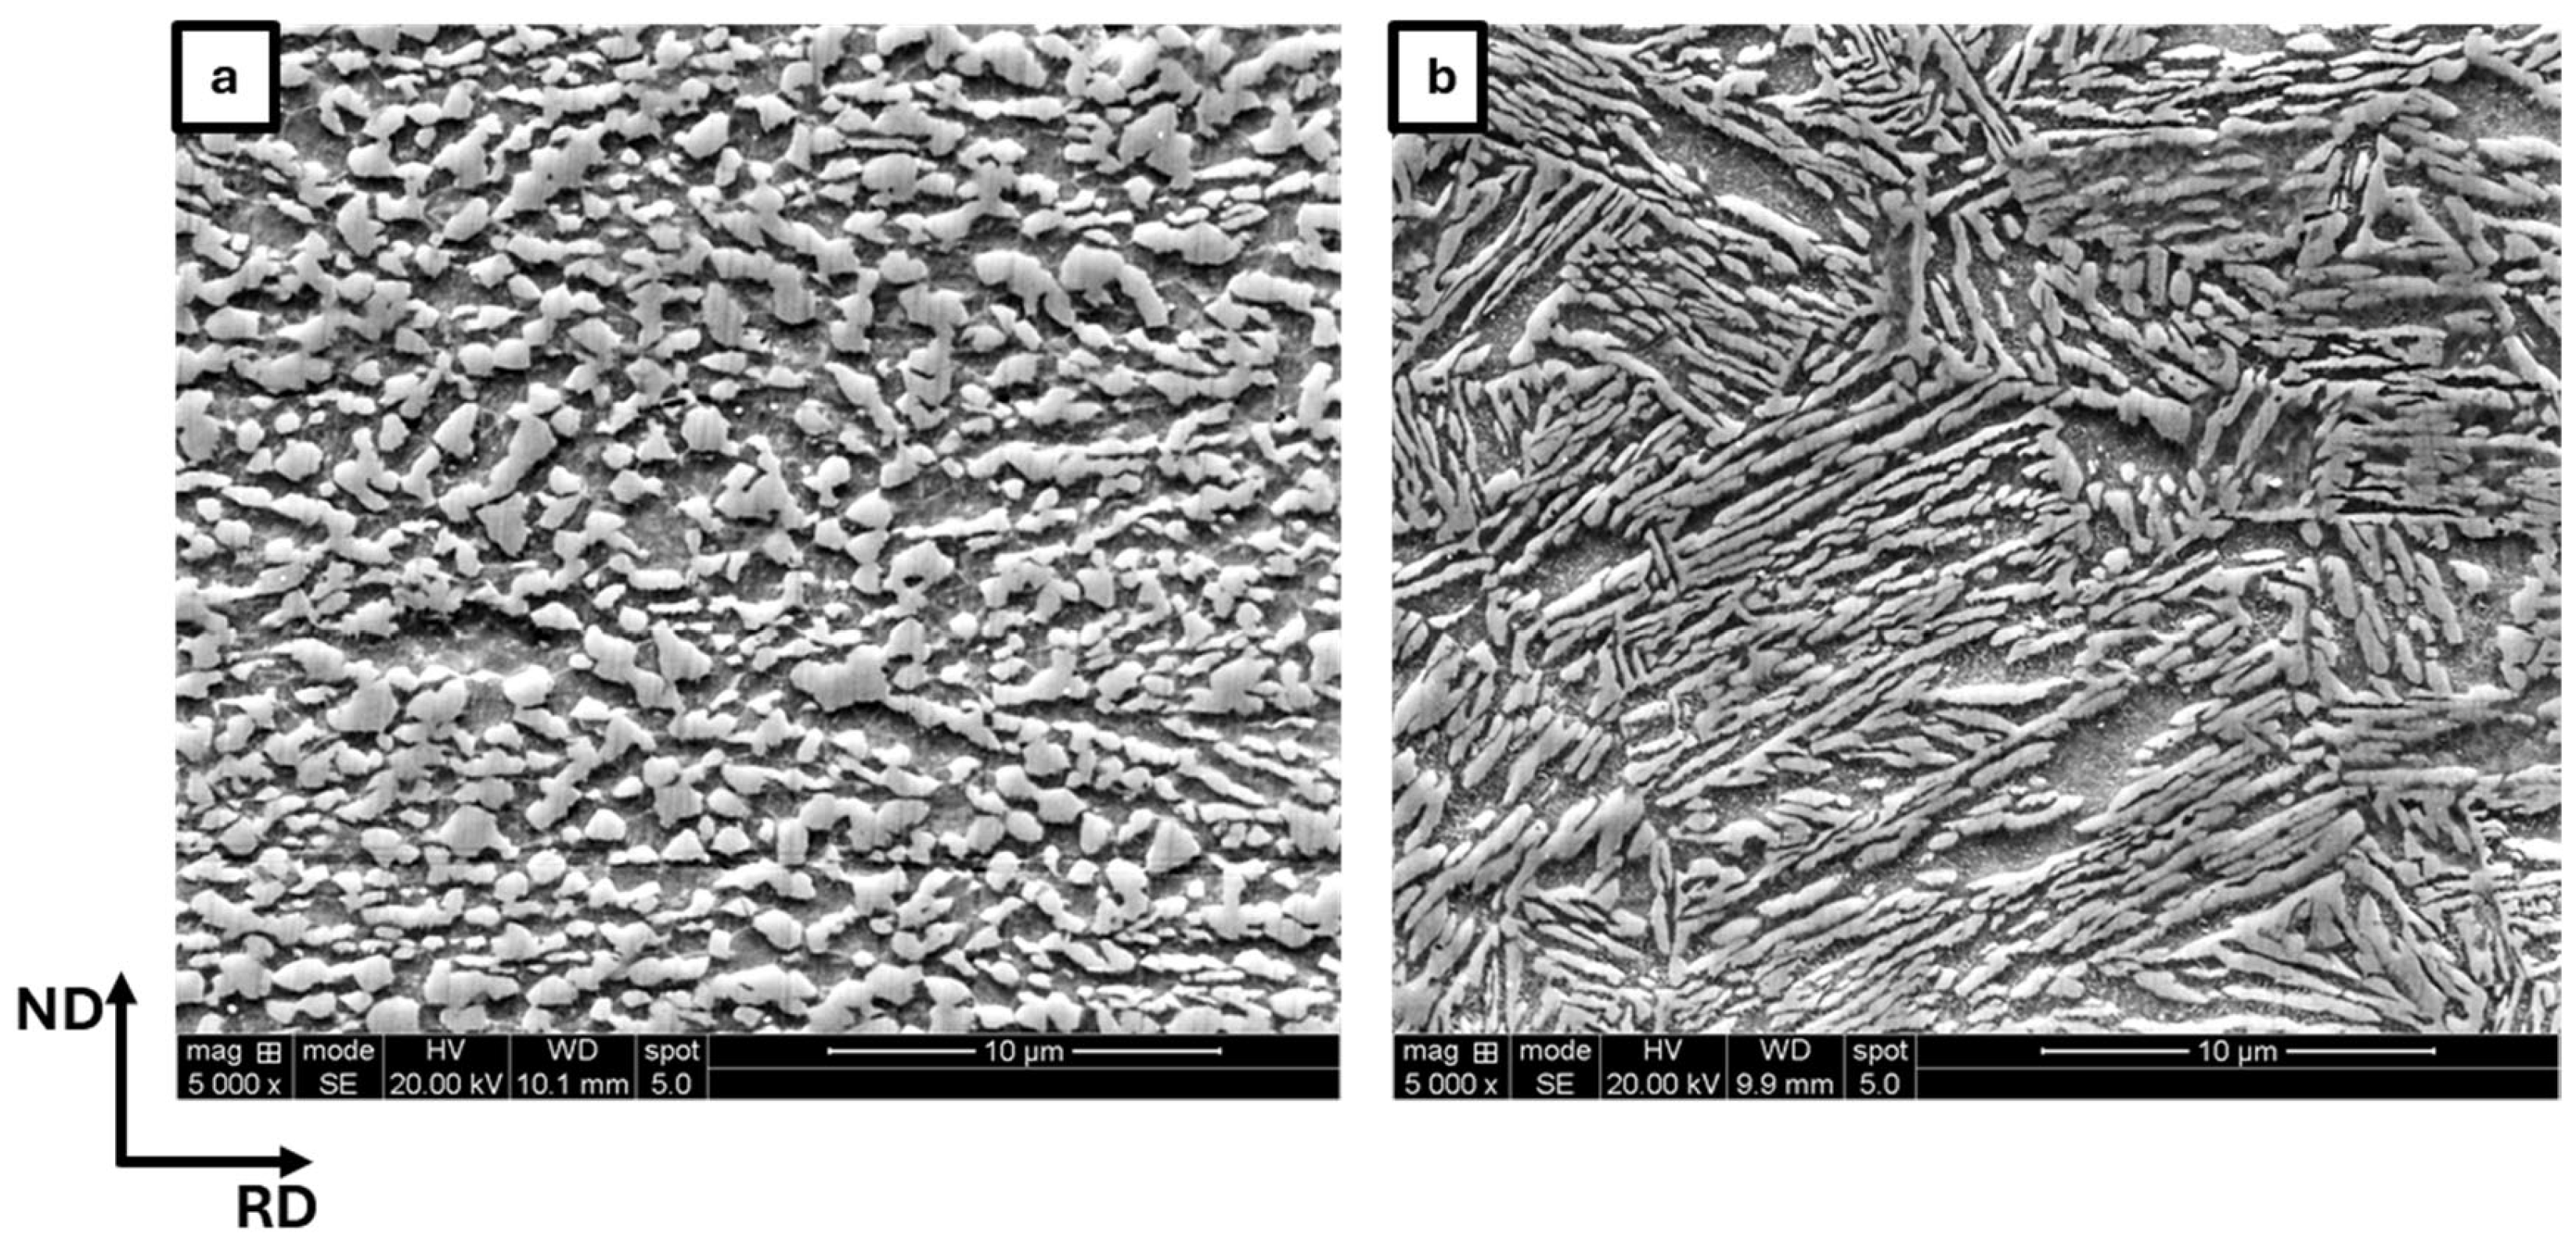
The resulting microstructures are hereafter referred to as SA700 and DA900700, corresponding to their respective thermal routes. Figure 2 shows SEM micrographs of the SA700 and DA900700 microstructures. Details on the sample preparation can be found in Section 2.2. The SA700 condition displays a globular two-phase microstructure composed of ferrite and retained austenite. The austenite is mainly distributed in isolated islands, often accompanied by martensite, thus forming MA constituents. In the DA900700 condition, the microstructure displays a fibrous morphology, with retained austenite arranged in elongated regions aligned along the rolling direction due to the prior austenitisation step in the two-stage annealing. As in the SA700 condition, austenite in DA900700 also appears to be associated with martensite, forming MA constituents. The ferrite and MA fractions were determined by image analysis. For the SA700 condition, the ferrite fraction measures 52.3 ± 2.2%, while the MA constituent accounts for 47.7 ± 2.2%. A similar analysis for DA900700 yields 49.4 ± 2.7% ferrite and 50.6 ± 2.7% MA. In parallel, XRD measurements result in retained austenite volume fractions of 17.6 ± 2.7% for the SA700 condition and 13.5 ± 1.5% for the DA900700 condition. Assuming negligible carbide presence, the martensite fraction was estimated by subtracting the retained austenite from the total MA content obtained via image analysis. A summary of all phase fractions is presented in Table 2.

2.2. Microstructural Characterisation

The microstructure was characterised after thermal processing using SEM and XRD. SEM observations were carried out at a depth of approximately 0.375 mm, i.e., one-quarter of the total sheet thickness, along the rolling direction–normal direction (RD–ND) plane. A Quanta 450 FEG-SEM microscope (Thermo Fisher Scientific, Hillsboro, OR, USA) operating at 20 kV with a working distance of 8.5 mm was used. Specimen preparation followed standard metallographic procedures, including grinding with 320 to 2000 grit SiC papers, polishing with 3 μm and 1 μm diamond suspensions, and etching with 3 vol.% Nital for 5–10 s, depending on the microstructure. Phase quantification was performed using threshold-based image analysis in ImageJ (version 1.53t), evaluating the pixel area fraction of MA constituents relative to ferrite. Representative SEM images were acquired at 2500× magnification from five different regions, covering a total analysed area of approximately 60 × 50 μm2 per region. Additional higher-magnification images at 5000× and 10,000× were used for phase identification but were not included in the area quantification. This sampling strategy ensured statistical relevance while capturing microstructural heterogeneity. Although this approach is in principle comparable to the grid method described in ASTM E562M [54], the automated pixel-based segmentation introduces some uncertainty. In particular, the MA fraction may be slightly overestimated due to the possible inclusion of undissolved carbides within the austenite–martensite contrast regions.
Quantification of the retained austenite was performed via X-ray diffraction using a Bruker D8 Advance diffractometer (Bruker AXS, Karlsruhe, Germany) with a Cu Kα radiation source (λ = 1.5405 Å), operated at 40 kV and 40 mA. Measurements were conducted on the specimen surface in the RD–TD plane, using a 1 mm diameter collimator. Prior to analysis, the surface was ground and polished as in the SEM preparation, and approximately 0.15 mm of material was removed to minimise the influence of the decarburised surface layer. Scans covered the 2θ range from 40° to 94°, with a step size of 0.03° and a dwell time of 1.5 s. The retained austenite volume fraction was determined using the direct comparison Cullity method, based on the integrated intensities of the (220)γ and (311)γ diffraction peaks for austenite and the (200)α and (211)α diffraction peaks for ferrite and martensite, according to the following equation [55]:
V γ =   I γ 220 1.42   I α 200 + I γ 220 + I γ 220 0.71   I α 211 + I γ 220 + I γ 311 1.62   I α 200 + I γ 311 + I γ 311 0.81   I α 211 + I γ 311 4

2.3. Mechanical Testing

2.3.1. Sample Geometries

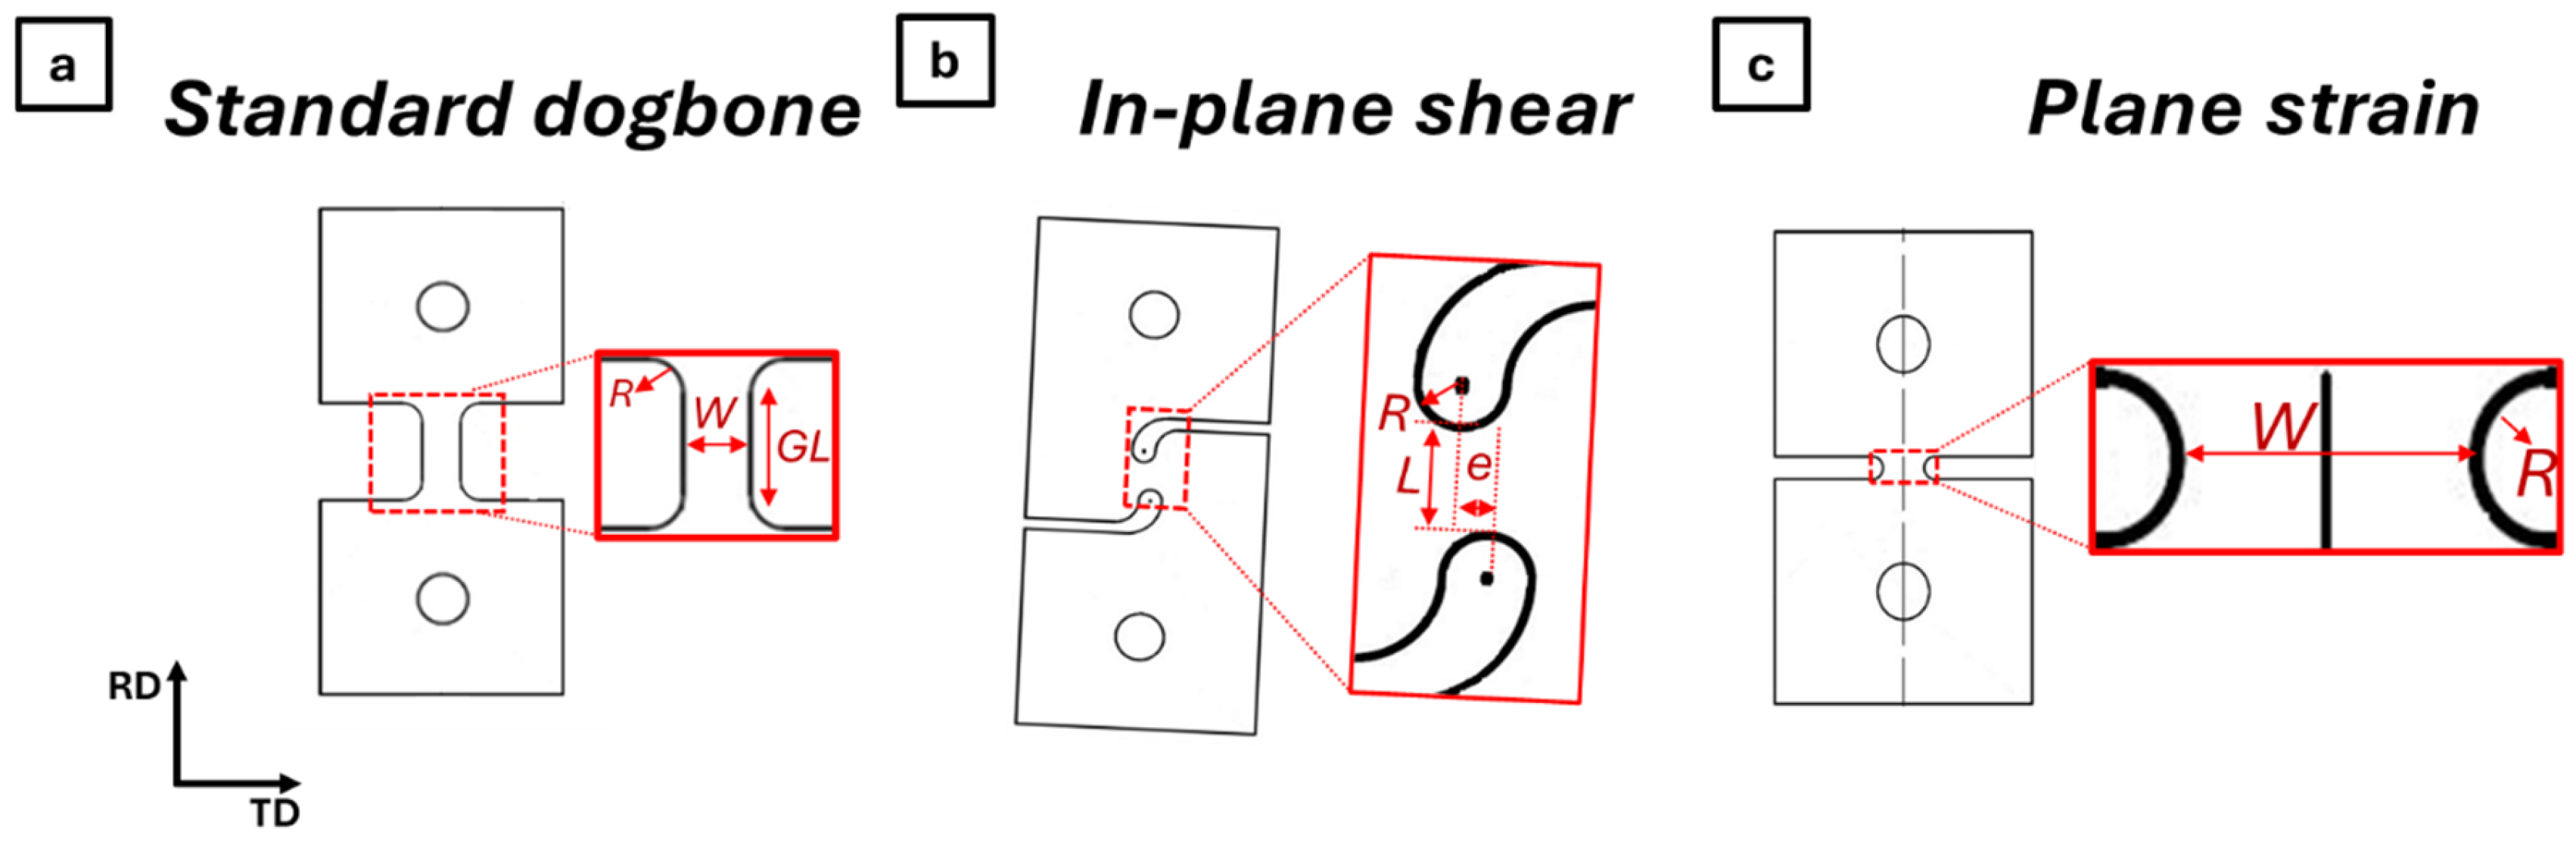
To evaluate the influence of stress state on the austenite-to-martensite transformation kinetics in MedMn steels, tensile experiments were conducted using three different sample geometries. A miniaturised dogbone specimen ( η ≈ 0.33, θ ¯ ≈ 1) was used as the reference. Two additional geometries were developed to impose plane strain ( η ≈ 0.58, θ ¯ ≈ 0) and in-plane shear ( η ≈ 0, θ ¯ ≈ 0) stress states, respectively. The selected specimen geometries were the result of an optimisation procedure relying on finite-element simulations to ensure a nearly uniform triaxiality in the central 1 mm3 of each specimen [56]. The geometries are presented in Figure 3. The plane strain specimen was based on a notched dogbone geometry, for which the central width (W) and notch radius (R) were optimised. For the in-plane shear specimen, the length of the shear zone (L), the eccentricity (e), and the notch radius (R) were optimised.
The miniaturised dogbone geometry featured a gauge length (GL) of 6 mm, a W of 3 mm, and an R of 2 mm. The optimised plane strain specimen had a W of 3.5 mm and an R of 1 mm. For the in-plane shear configuration, the critical dimensions were an L of 3 mm, an e of 0.9 mm, and an R of 1.2 mm. All specimens were machined by waterjet cutting from 1.5 mm thick sheets. The longest dimension of the dogbone and plane strain specimens was aligned with the rolling direction (RD). Owing to the asymmetric notch geometry, the in-plane shear specimen was rotated 5° clockwise with respect to the rolling direction to ensure that the deformation zone remained aligned with the RD.

2.3.2. Tests and Measurements

Mechanical tests were performed using a conventional Instron 5569 testing machine (Instron, Norwood, MA, USA) equipped with a calibrated 50 kN load cell. To isolate the influence of stress state, all tensile tests were conducted at room temperature, using crosshead speeds adjusted for each geometry to achieve a comparable average equivalent plastic strain rate of approximately 5 × 10⁻⁴ s−1. Prior to testing, one surface of each specimen was polished for subsequent XRD analysis (see Section 2.2), whereas the opposite surface remained unpolished and was used for DIC measurements.
Strain development during deformation was monitored by DIC. A black-and-white speckle pattern was applied to the DIC surface before loading. Image sequences were recorded at 0.5–1 Hz using a 5 MPxl Stingray camera (Allied Vision Technologies, Stadtroda, Germany) positioned perpendicular to the sample surface. The images were processed using the commercial software MatchID (version 2025) to obtain full-field strain maps. The subset size, step size, and strain window used in the DIC analysis were selected based on the measured speckle size (≈0.10–0.15 mm) and the optical resolution, which ranged from 0.003 to 0.006 mm/pixel depending on the specimen geometry. The correlation analysis was performed using the zero-normalised sum of squared differences (ZNSSD) criterion, bicubic spline interpolation, and a quadratic shape function [57,58]. A virtual strain gauge (VSG) of ≈0.5–0.6 mm was applied for all geometries to ensure consistent spatial averaging. Equivalent strain values were calculated from the displacement fields using the logarithmic Euler–Almansi strain tensor [59]. The strain reported in the engineering stress-equivalent strain curves and in the equivalent plastic strain used to establish the transformation–strain relationships corresponds to the average equivalent strain measured within a 1 mm2 region at the centre of the gauge section, where the specimen geometry was optimised to ensure a nearly uniform triaxiality. Mechanical parameters were extracted directly from the engineering stress–equivalent strain curves. Yield strength was defined for the uniaxial dogbone geometry only, whereas maximum engineering stress, strain at maximum engineering stress, and failure strain were evaluated for all geometries. Engineering stress was calculated as the measured force divided by the initial cross-sectional area of the gauge section. For each condition and geometry, two continuous tensile tests were performed. The reported mechanical values correspond to the mean values and the associated standard deviations are provided in the corresponding tables.
The Lankford coefficient ( r -value) was evaluated exclusively for the uniaxial (dogbone) specimens. Axial ( ε a x t r u e ) and transverse ( ε w t r u e ) true strains were obtained from the DIC fields within a 4 × 3 mm2 region centred in the gauge section. Assuming volume conservation during plastic deformation, the true thickness strain was calculated as ε t h t r u e =   ( ε a x t r u e + ε w t r u e ) . Elastic contributions were removed by subtracting the elastic strain, using a Young’s modulus of 200 GPa and a Poisson’s ratio of 0.3. The plastic r -value was then determined as r = ε w p l / ε t h p l along the plastic deformation range. Following ASTM E517 [60], the r -value at 15% equivalent strain ( r 15 ) was used for comparison, where the r -value stabilises.
For the same uniaxial specimens, the work-hardening rate ( d σ / d ε ) was determined using a strain window of 0.003, based on Savitzky–Golay–smoothed true stress–true plastic strain data.
Local strain-rate fields were used to analyse Lüders and PLC bands. Band propagation was monitored in all geometries by tracking the region of local strain-rate values along one-dimensional profiles extracted at the specimen mid-section (gauge centre). However, quantitative band characterisation was performed exclusively for the uniaxial (dogbone) specimens. In this case, the instantaneous band position was defined as the location of the strain-rate maximum along the profile, and the propagation velocity was obtained from the slope of the corresponding position–time curve. Band geometry was characterised in terms of inclination angle ( β ) and width: the inclination angle was defined as the absolute angle between the band axis and the specimen loading direction, measured in the specimen plane. The band width was measured along the normal to the band direction and defined as the distance between the two points where the local strain rate falls below 90% of the peak value.
In addition to continuous tensile tests, three interrupted-tension tests were performed for each sample geometry. Each specimen was repeatedly loaded and unloaded at predefined strain levels between the onset of yielding and the peak load. These interruptions allowed ex situ determination of the retained-austenite fraction at selected strain levels. After each unloading step, the XRD scan was performed on a ~1 mm2 region at the centre of the gauge section. This area was selected to match the zone used for the local strain measurements by DIC, ensuring the co-localisation of strain and retained austenite measurements and enabling direct correlation between deformation and transformation. Each scan required approximately 60 min to complete.

2.4. Modelling of Transformation Kinetics

To quantitatively capture the experimental trends, including the non-monotonic dependence on stress triaxiality, the transformation data were fitted using the phenomenological model proposed by Beese and Mohr [30]. This model, derived from the classical JMAK framework, describes the normalised transformed austenite fraction as follows:
f α =   f s ( 1 e x p ( ( k ε ) n ) )
where f α is the normalised transformed austenite fraction, f s is the saturation level, k is a phenomenological parameter related to the stability of retained austenite, n is a material parameter reflecting the nature of the transformation mechanism, and ε is the equivalent plastic strain.
To incorporate the effect of multiaxial loading, the stress-state dependence of k is expressed as a linear function of the stress triaxiality ( η ) and the Lode angle parameter ( θ ¯ ):
k ( η , θ ¯ ) = k 0 + α η η + α θ ¯ θ ¯  
This formulation accounts for the effect of multiaxial loading by directly linking the transformation kinetics to the local mechanical conditions.

3. Results

3.1. Continuous Tests: Mechanical Response, Strain Localisation and Plastic Anisotropy

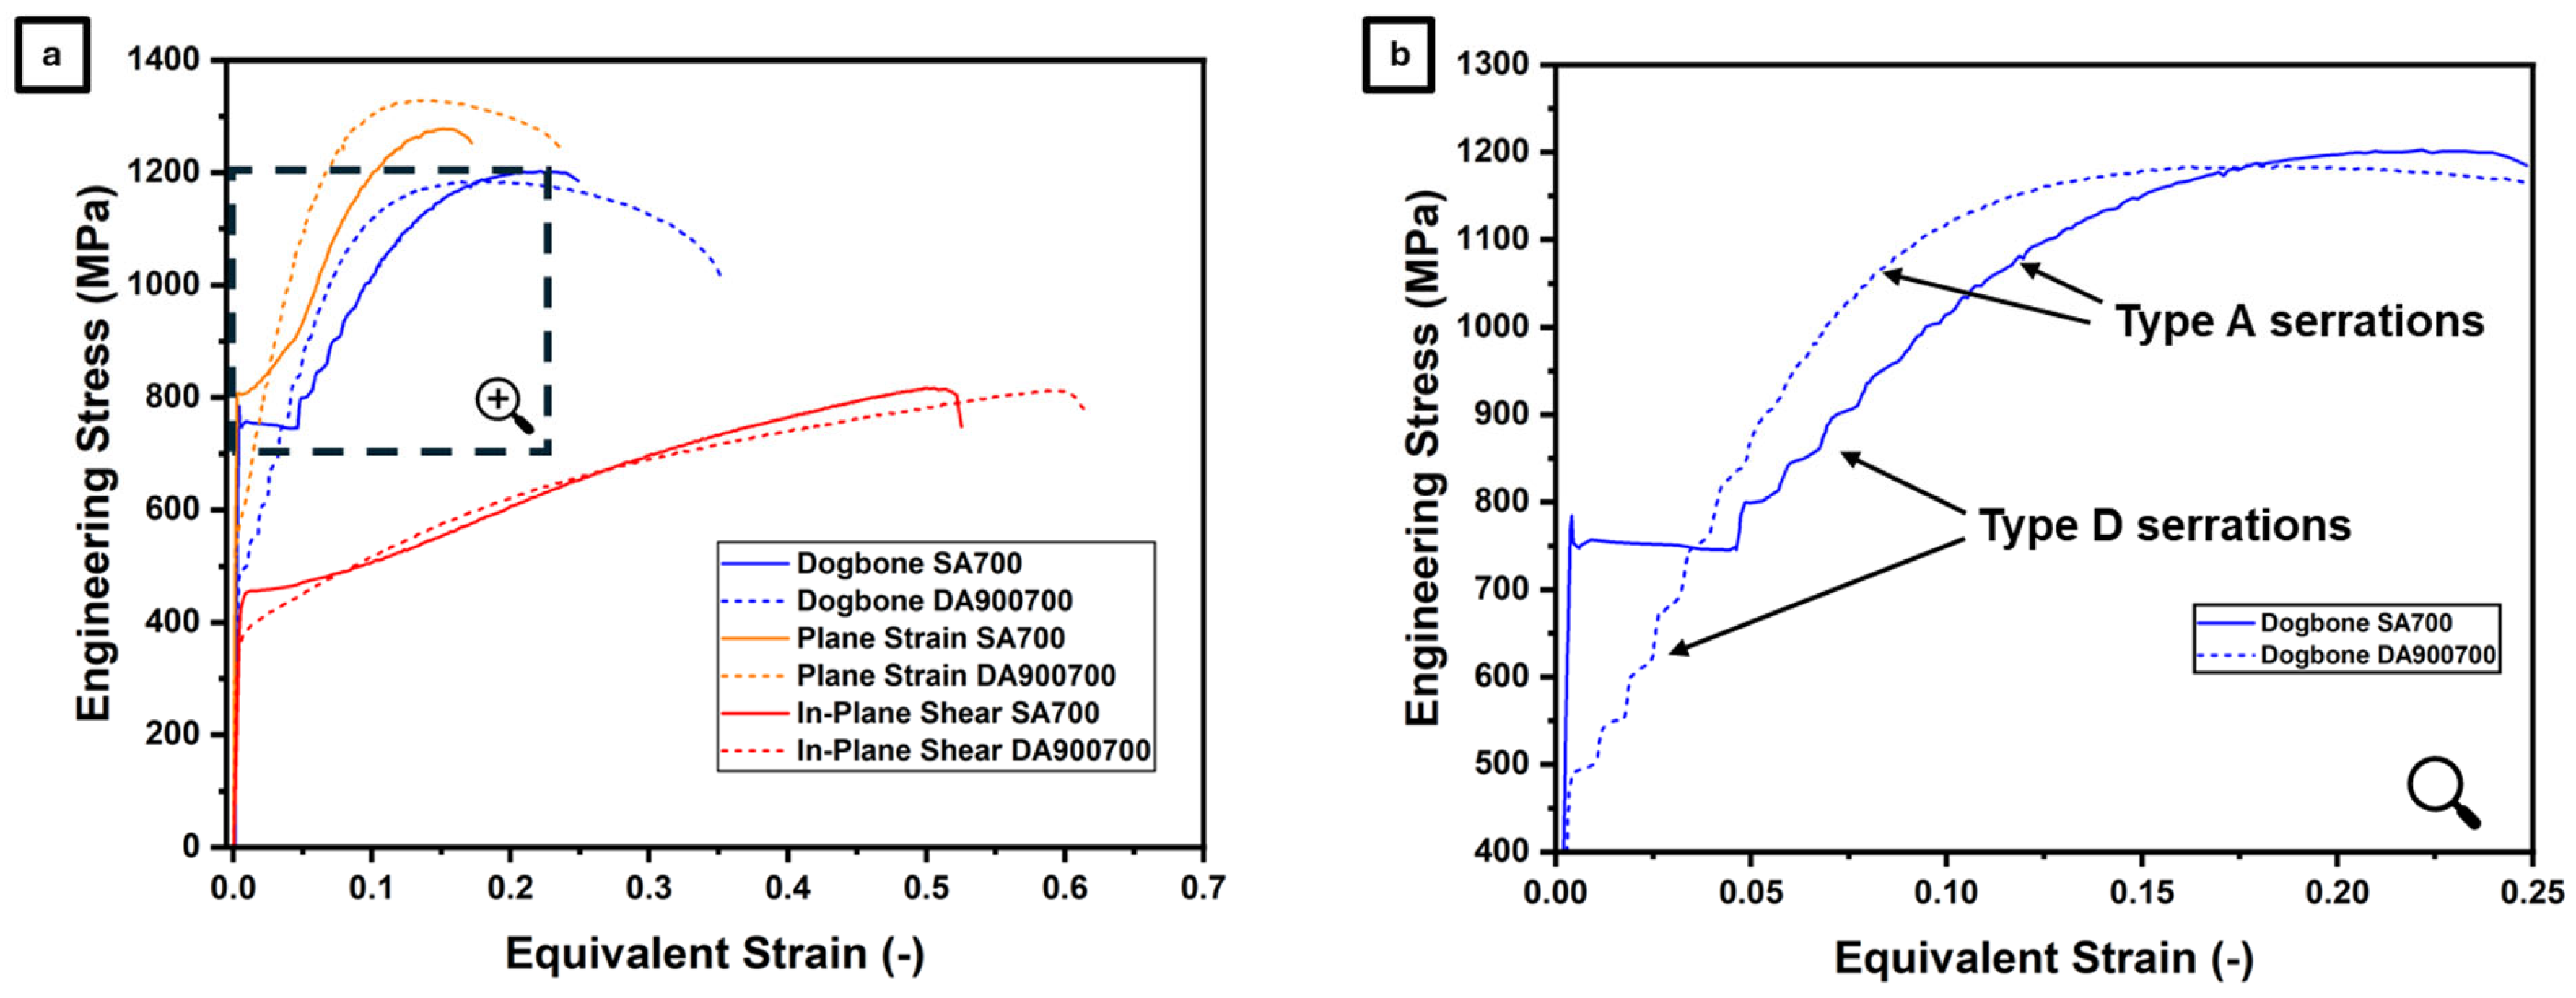
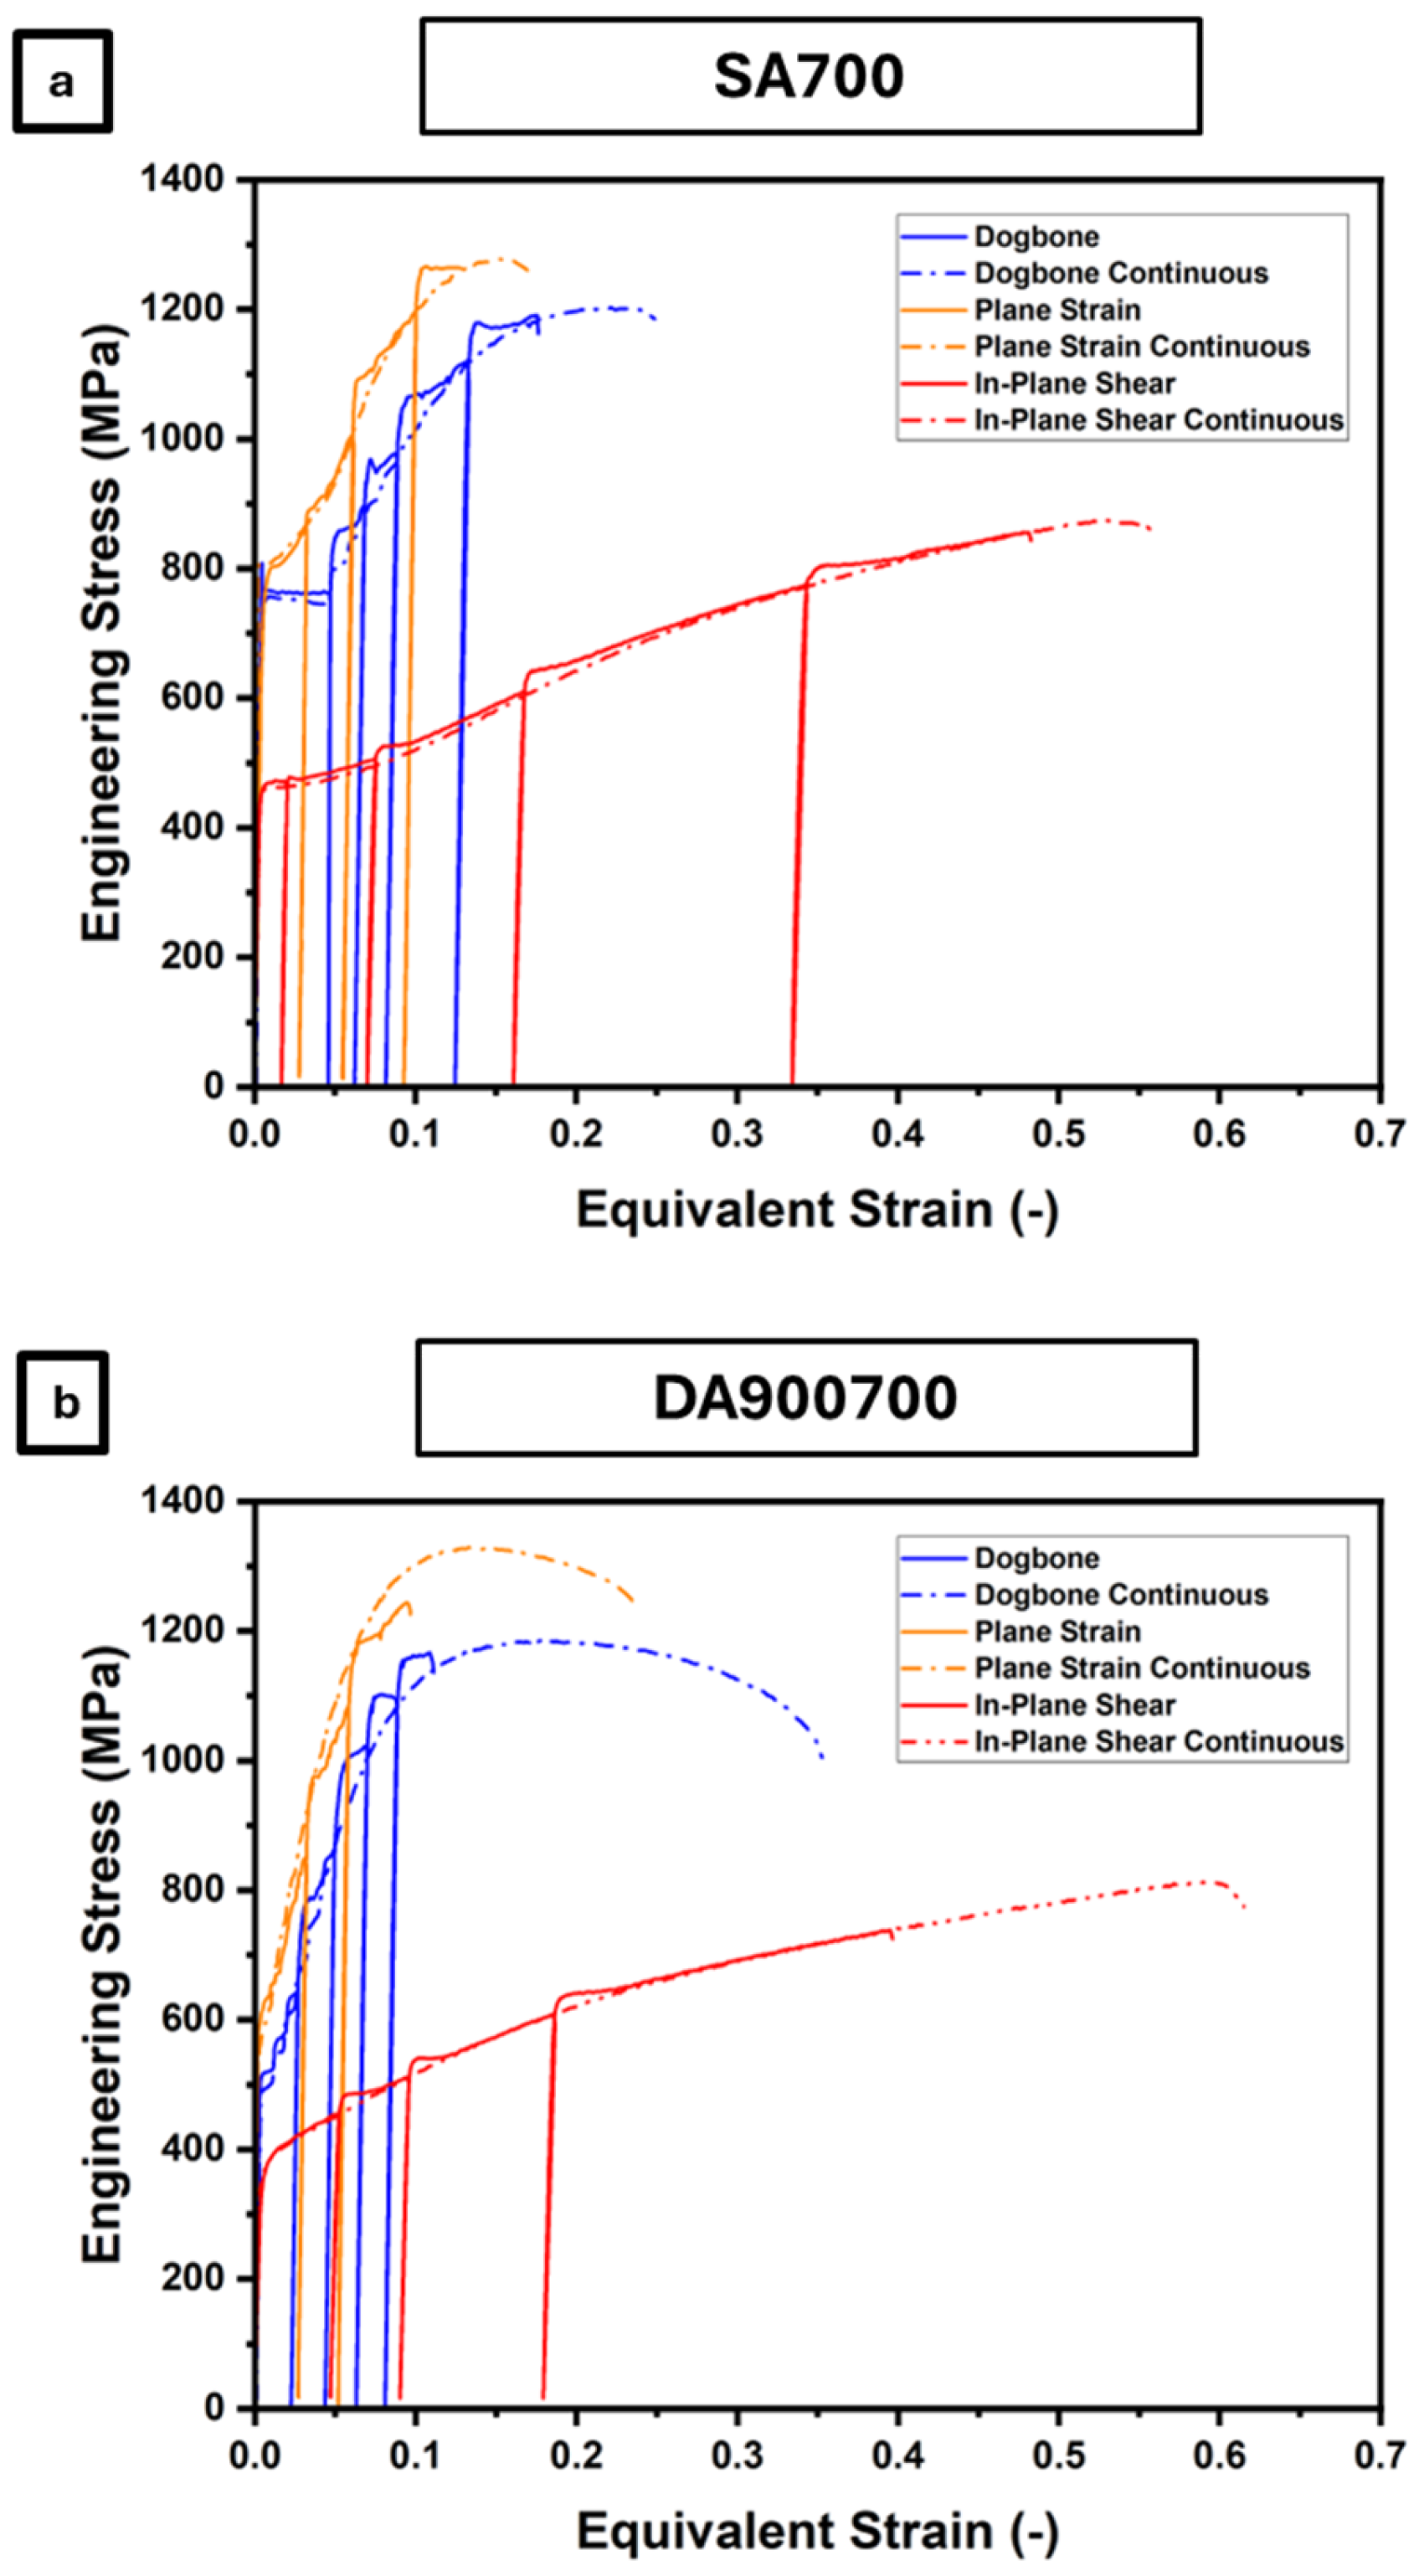
Figure 4a presents representative engineering stress-equivalent strain curves for both steels, obtained under quasi-static loading using the three specimen geometries. The equivalent strain values correspond to the local deformation measured within the 1 mm2 region at the centre of the deformation zone, as defined in Section 2.3.2. Table 3 summarises mechanical parameters derived from these tests, including the yield strength, maximum engineering stress, the strain at maximum engineering stress, and the failure strain for each condition.
For both steels, the flow stress level is highest under plane strain conditions, followed by uniaxial tension and in-plane shear.
In the early stages of plastic deformation, the SA700 steel exhibits pronounced discontinuous yielding, whereas no clear evidence of such behaviour is observed in the DA900700 steel. The magnitude of the yield response in the SA700 steel is noticeably higher than in DA900700. For the SA700 dogbone condition, a distinct yield-point phenomenon is observed, characterised by well-defined upper and lower yield stresses, both of which are reported in Table 3. The maximum engineering stress remains comparable between SA700 and DA900700 conditions for a given geometry.
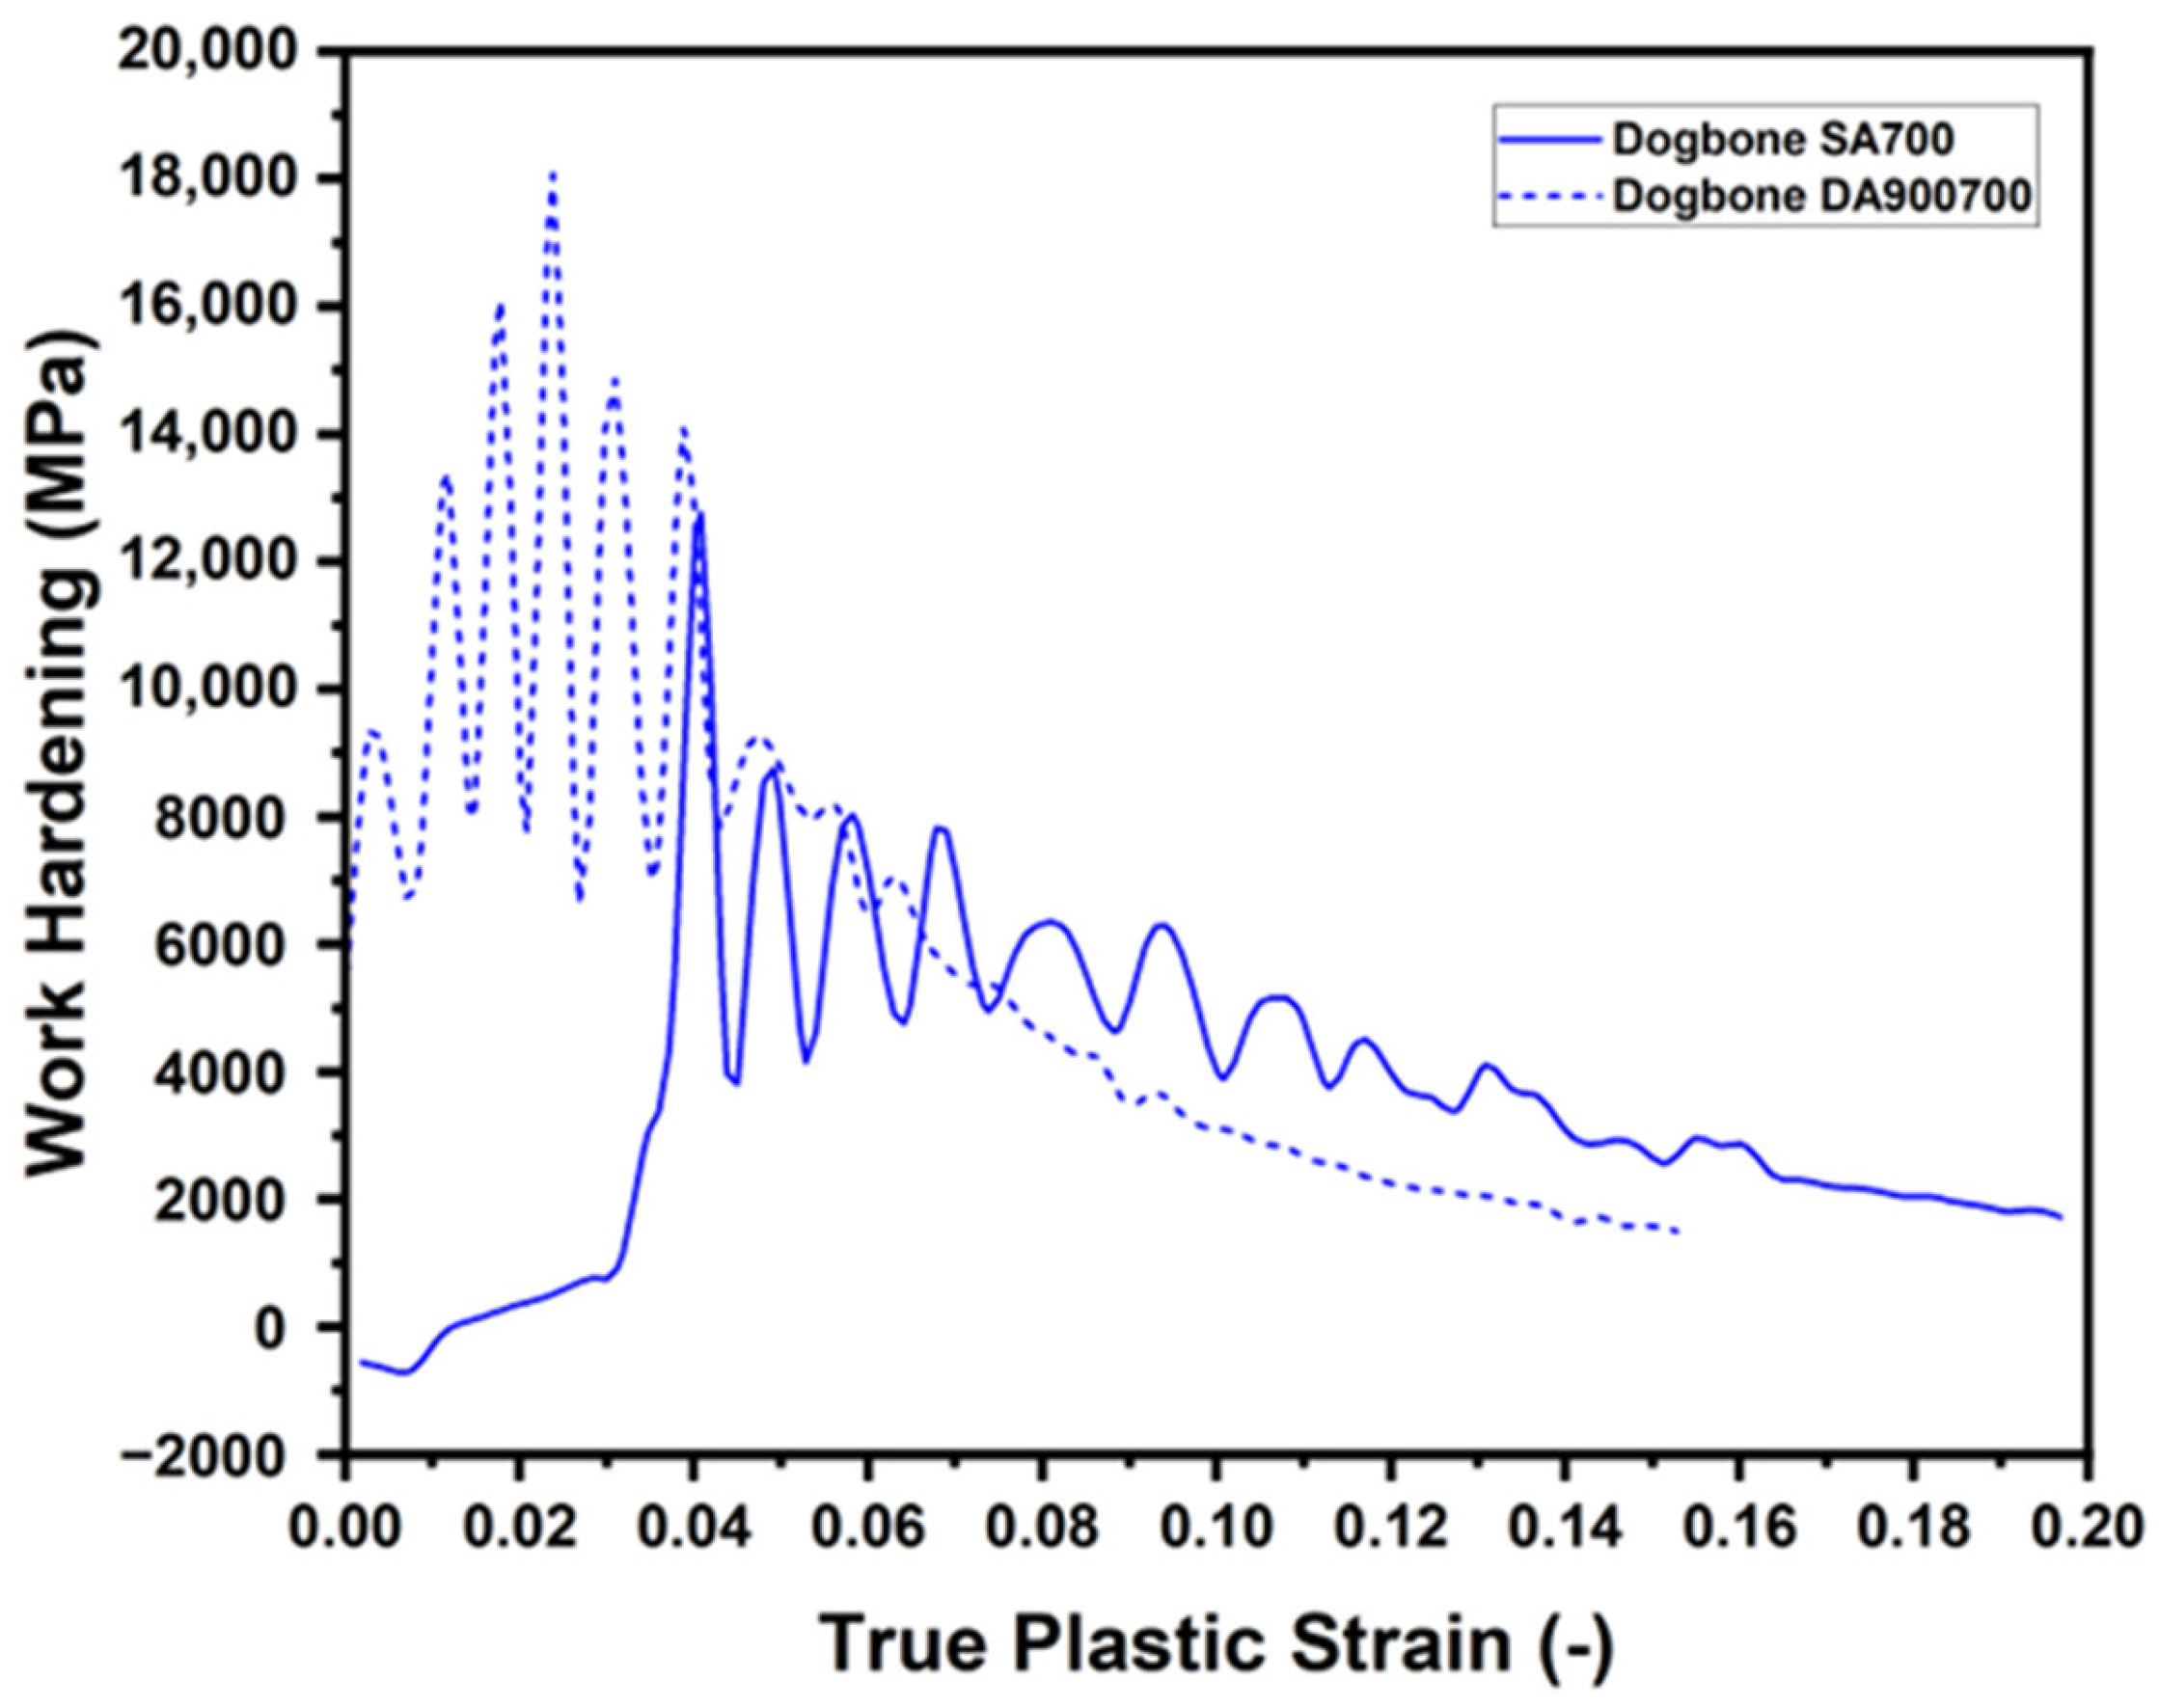
To quantify the difference in post-yield strengthening, the work-hardening rate was evaluated for the uniaxial dogbone specimens. Figure 5 shows that the DA900700 steel exhibits a markedly higher work-hardening rate at low plastic strain, whereas the SA700 steel displays near-zero or slightly negative values in this range, consistent with the presence of the yield-point phenomenon. With increasing strain, the work-hardening rate of the DA900700 condition decreases more rapidly and becomes lower than that of the SA700 condition beyond ε ≈ 0.05, whereas SA700 exhibits a more gradual decrease in work-hardening rate over the intermediate strain range.
The in-plane shear specimens exhibit the highest ductility for both thermal conditions, with equivalent strains at maximum stress exceeding 0.5. In contrast, the plane strain specimens display the lowest ductility, while the dogbone specimens reach intermediate values. However, the equivalent strain at maximum stress is lower for the DA900700 condition than for the SA700 condition in the dogbone and plane strain samples, whereas in in-plane shear, it is slightly higher for DA900700. The SA700 steel reaches failure at lower post-necking strain levels compared to the DA900700 steel.
The variations in flow stress and ductility between the in-plane shear, dogbone, and plane-strain configurations arise from the different deformation constraints imposed by the respective stress states.
Figure 4b provides a magnified view of the plastic region in the dogbone specimens, highlighting the serration types associated with the PLC effect [61]. In the SA700 condition, deformation initiates with a pronounced yield drop followed by a stress plateau characteristic of Lüders band propagation. Subsequent jerky flow shows predominantly type D serrations, gradually transitioning to weak type A oscillations as deformation proceeds. In contrast, the DA900700 steel does not exhibit a Lüders plateau. Serrations appear immediately after yielding, initially dominated by type D behaviour with more frequent stepwise plateaus than in the SA700 steel, before transitioning into type A serrations that are considerably weaker than those observed in the SA700 steel. The differences in serration characteristics and in the occurrence of a Lüders plateau highlight the strong dependence of serrated flow behaviour on the underlying microstructural state.
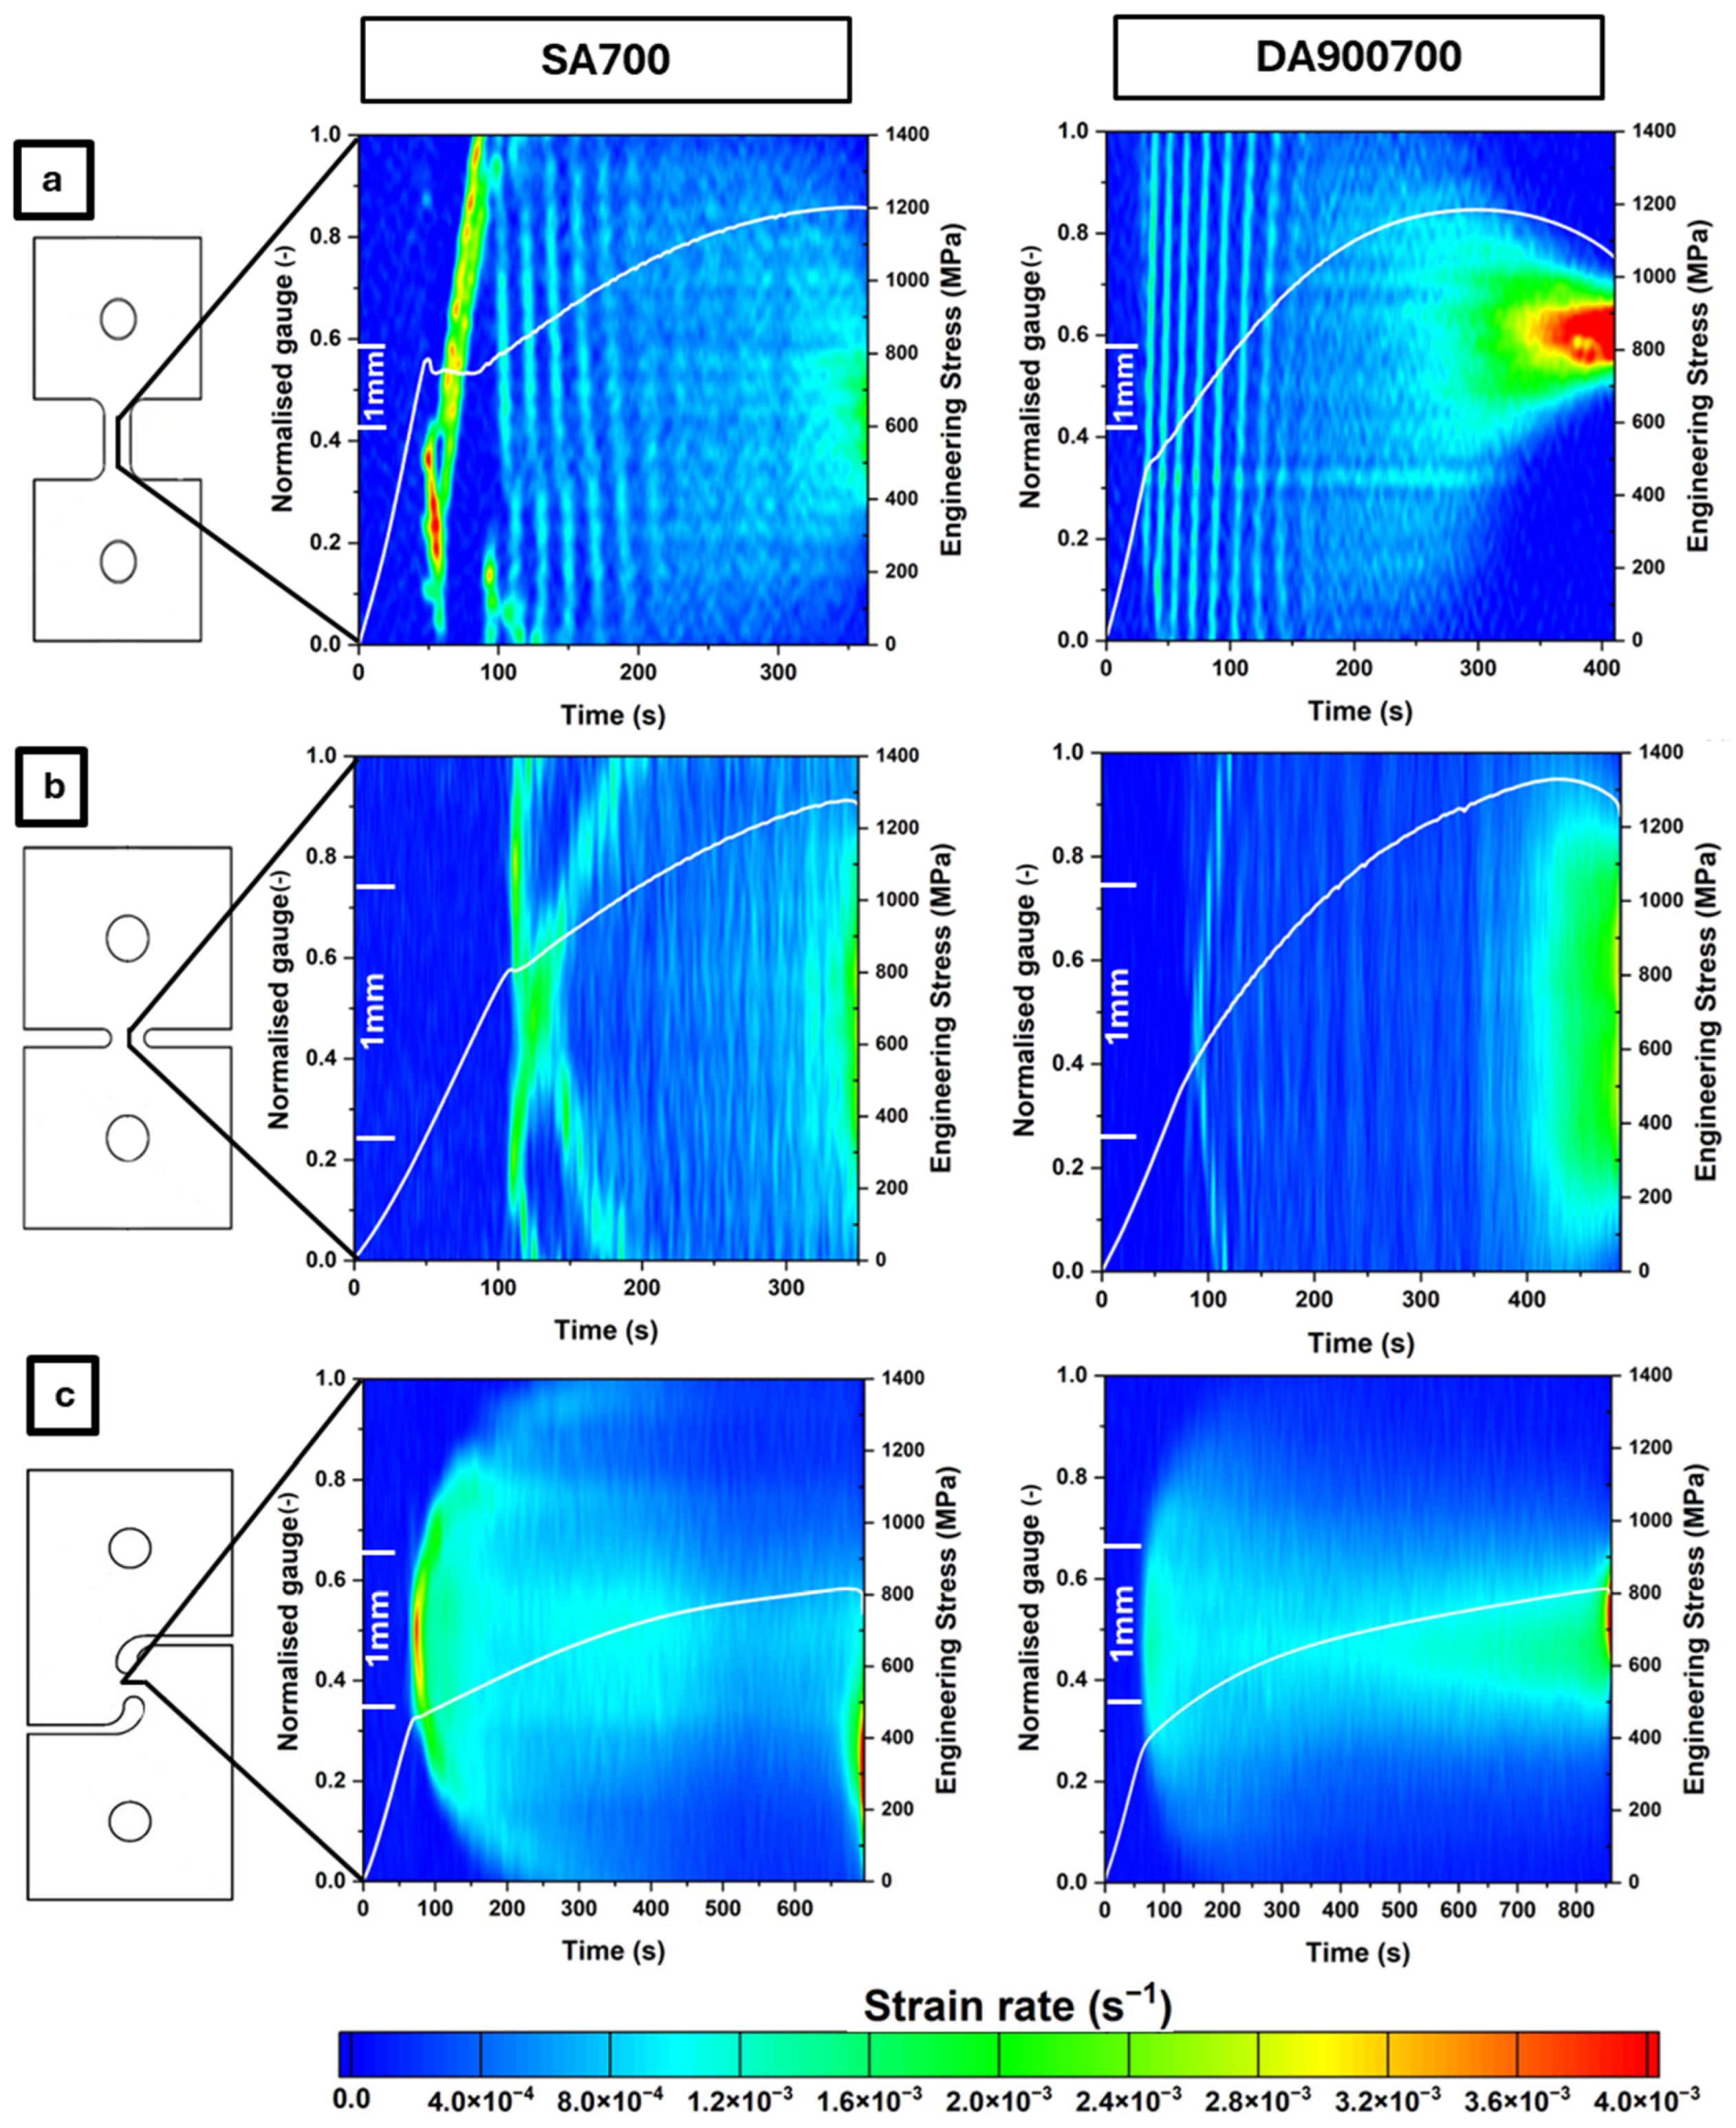
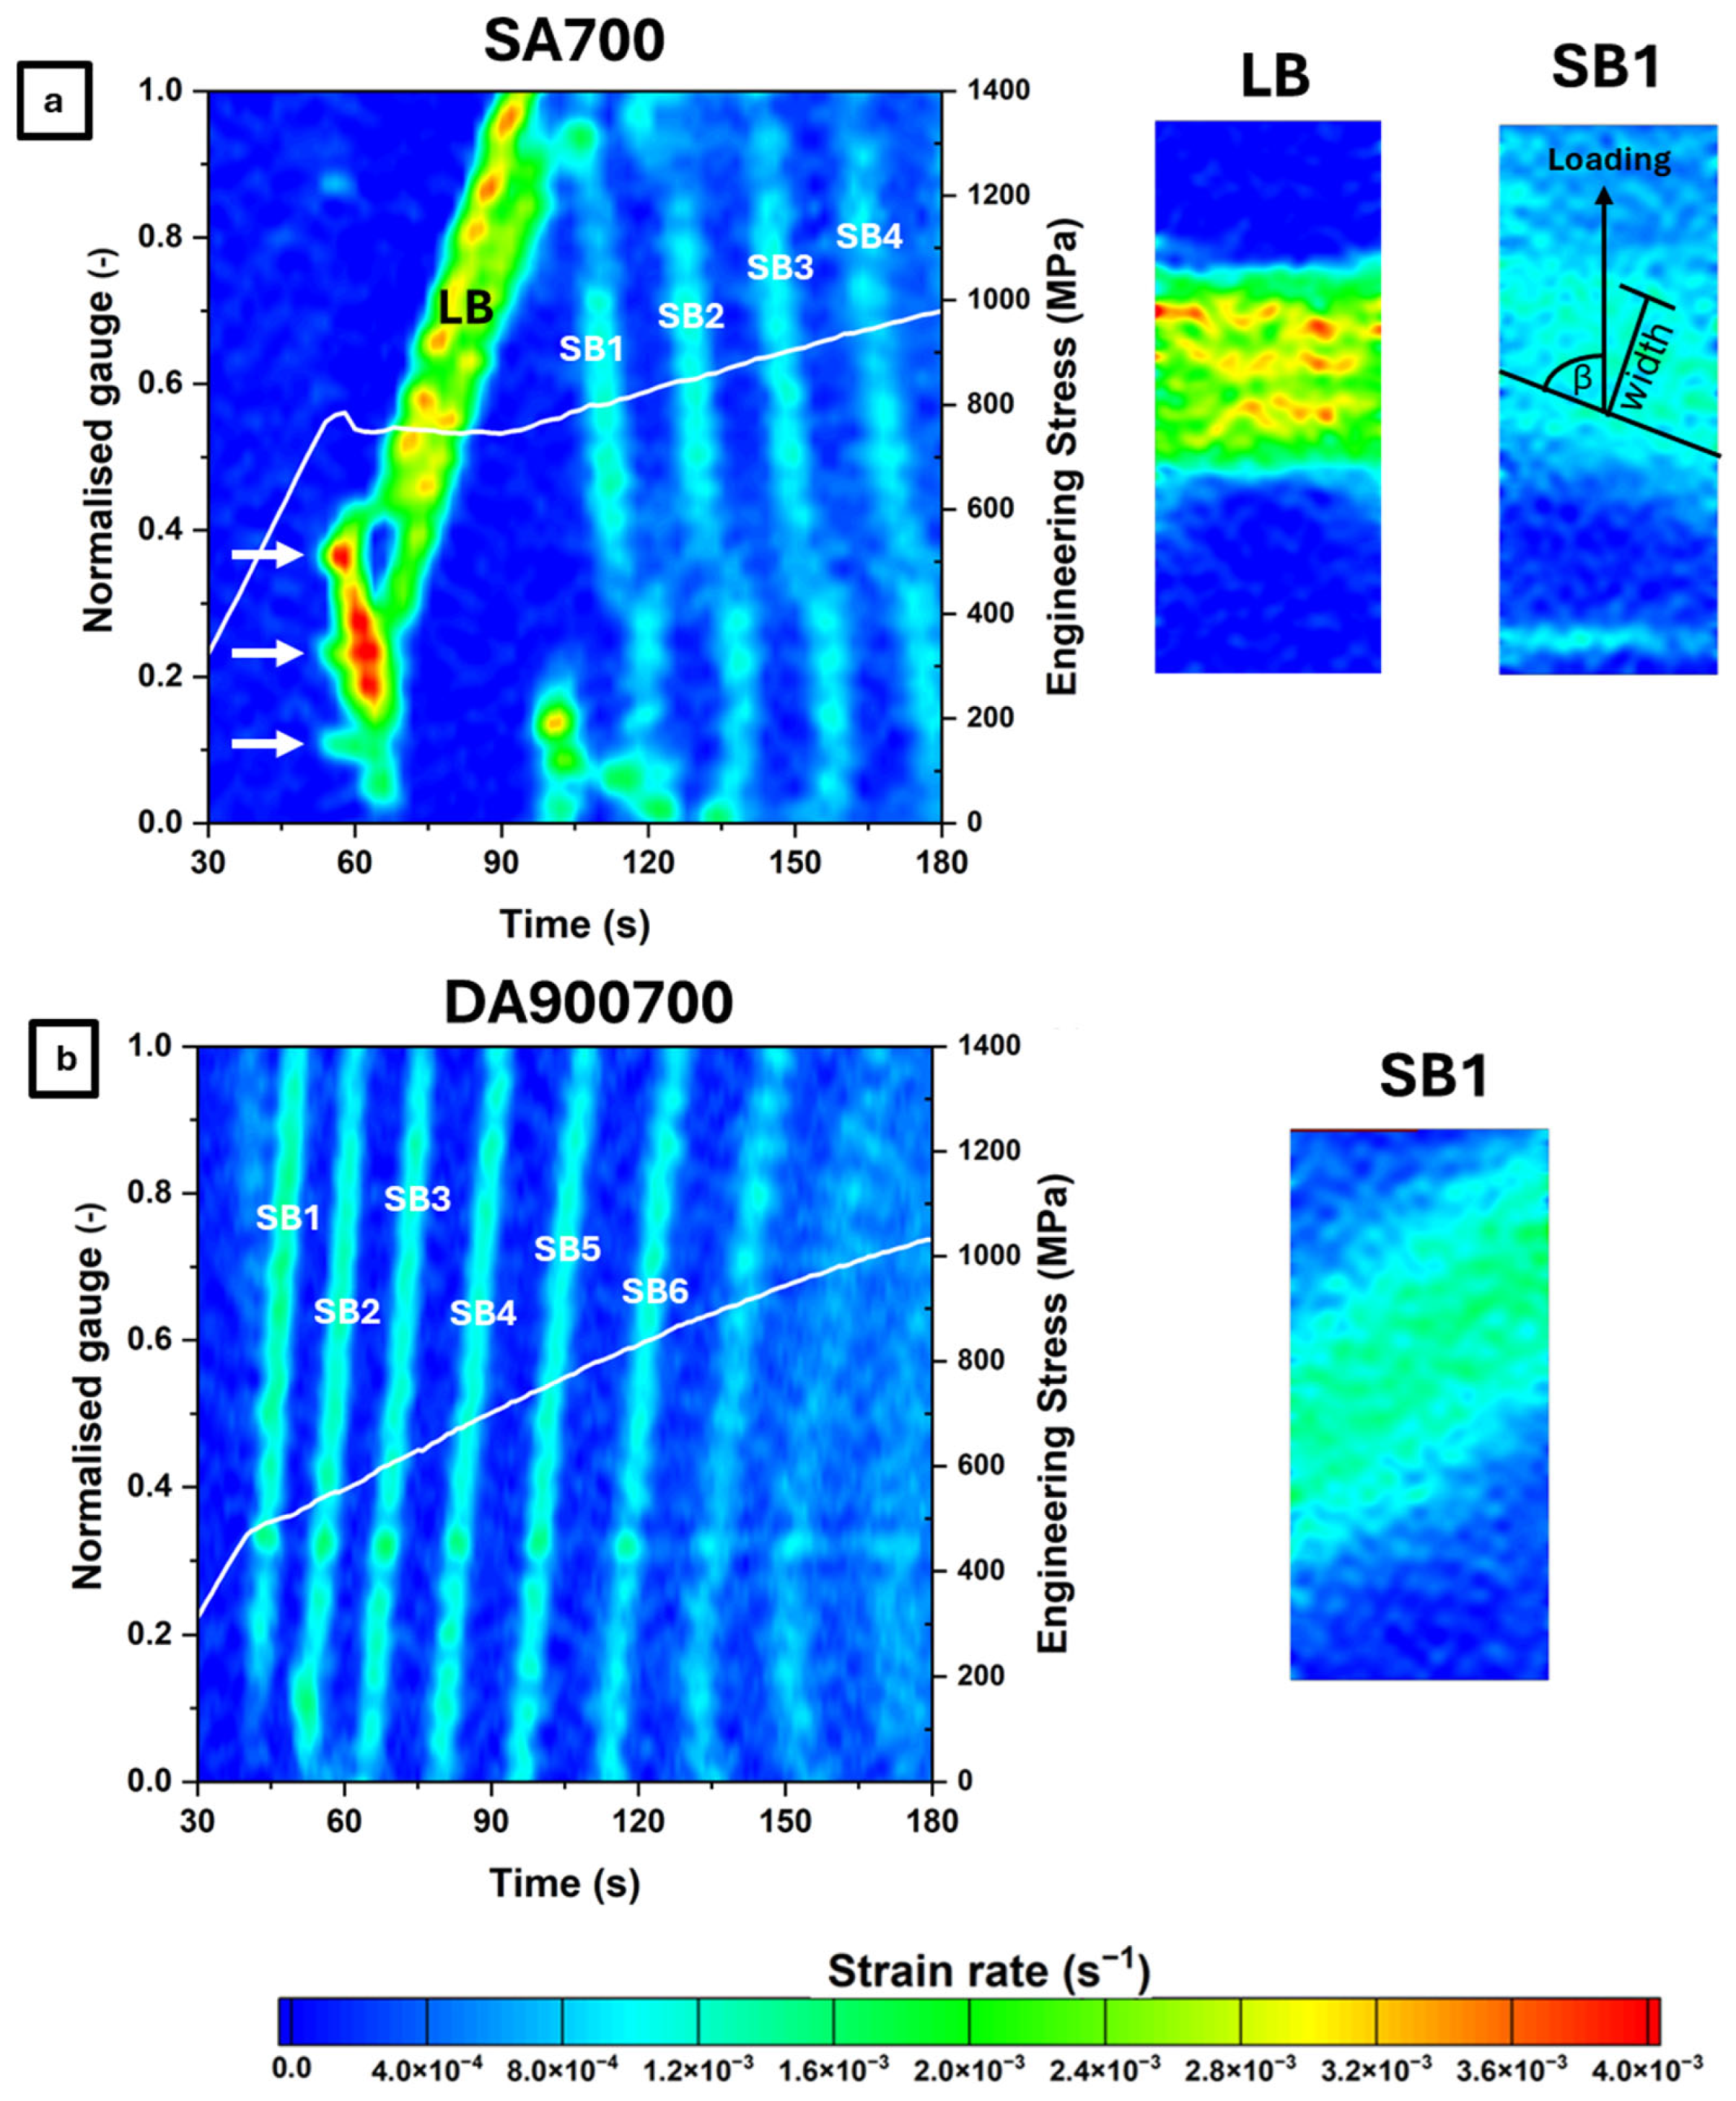
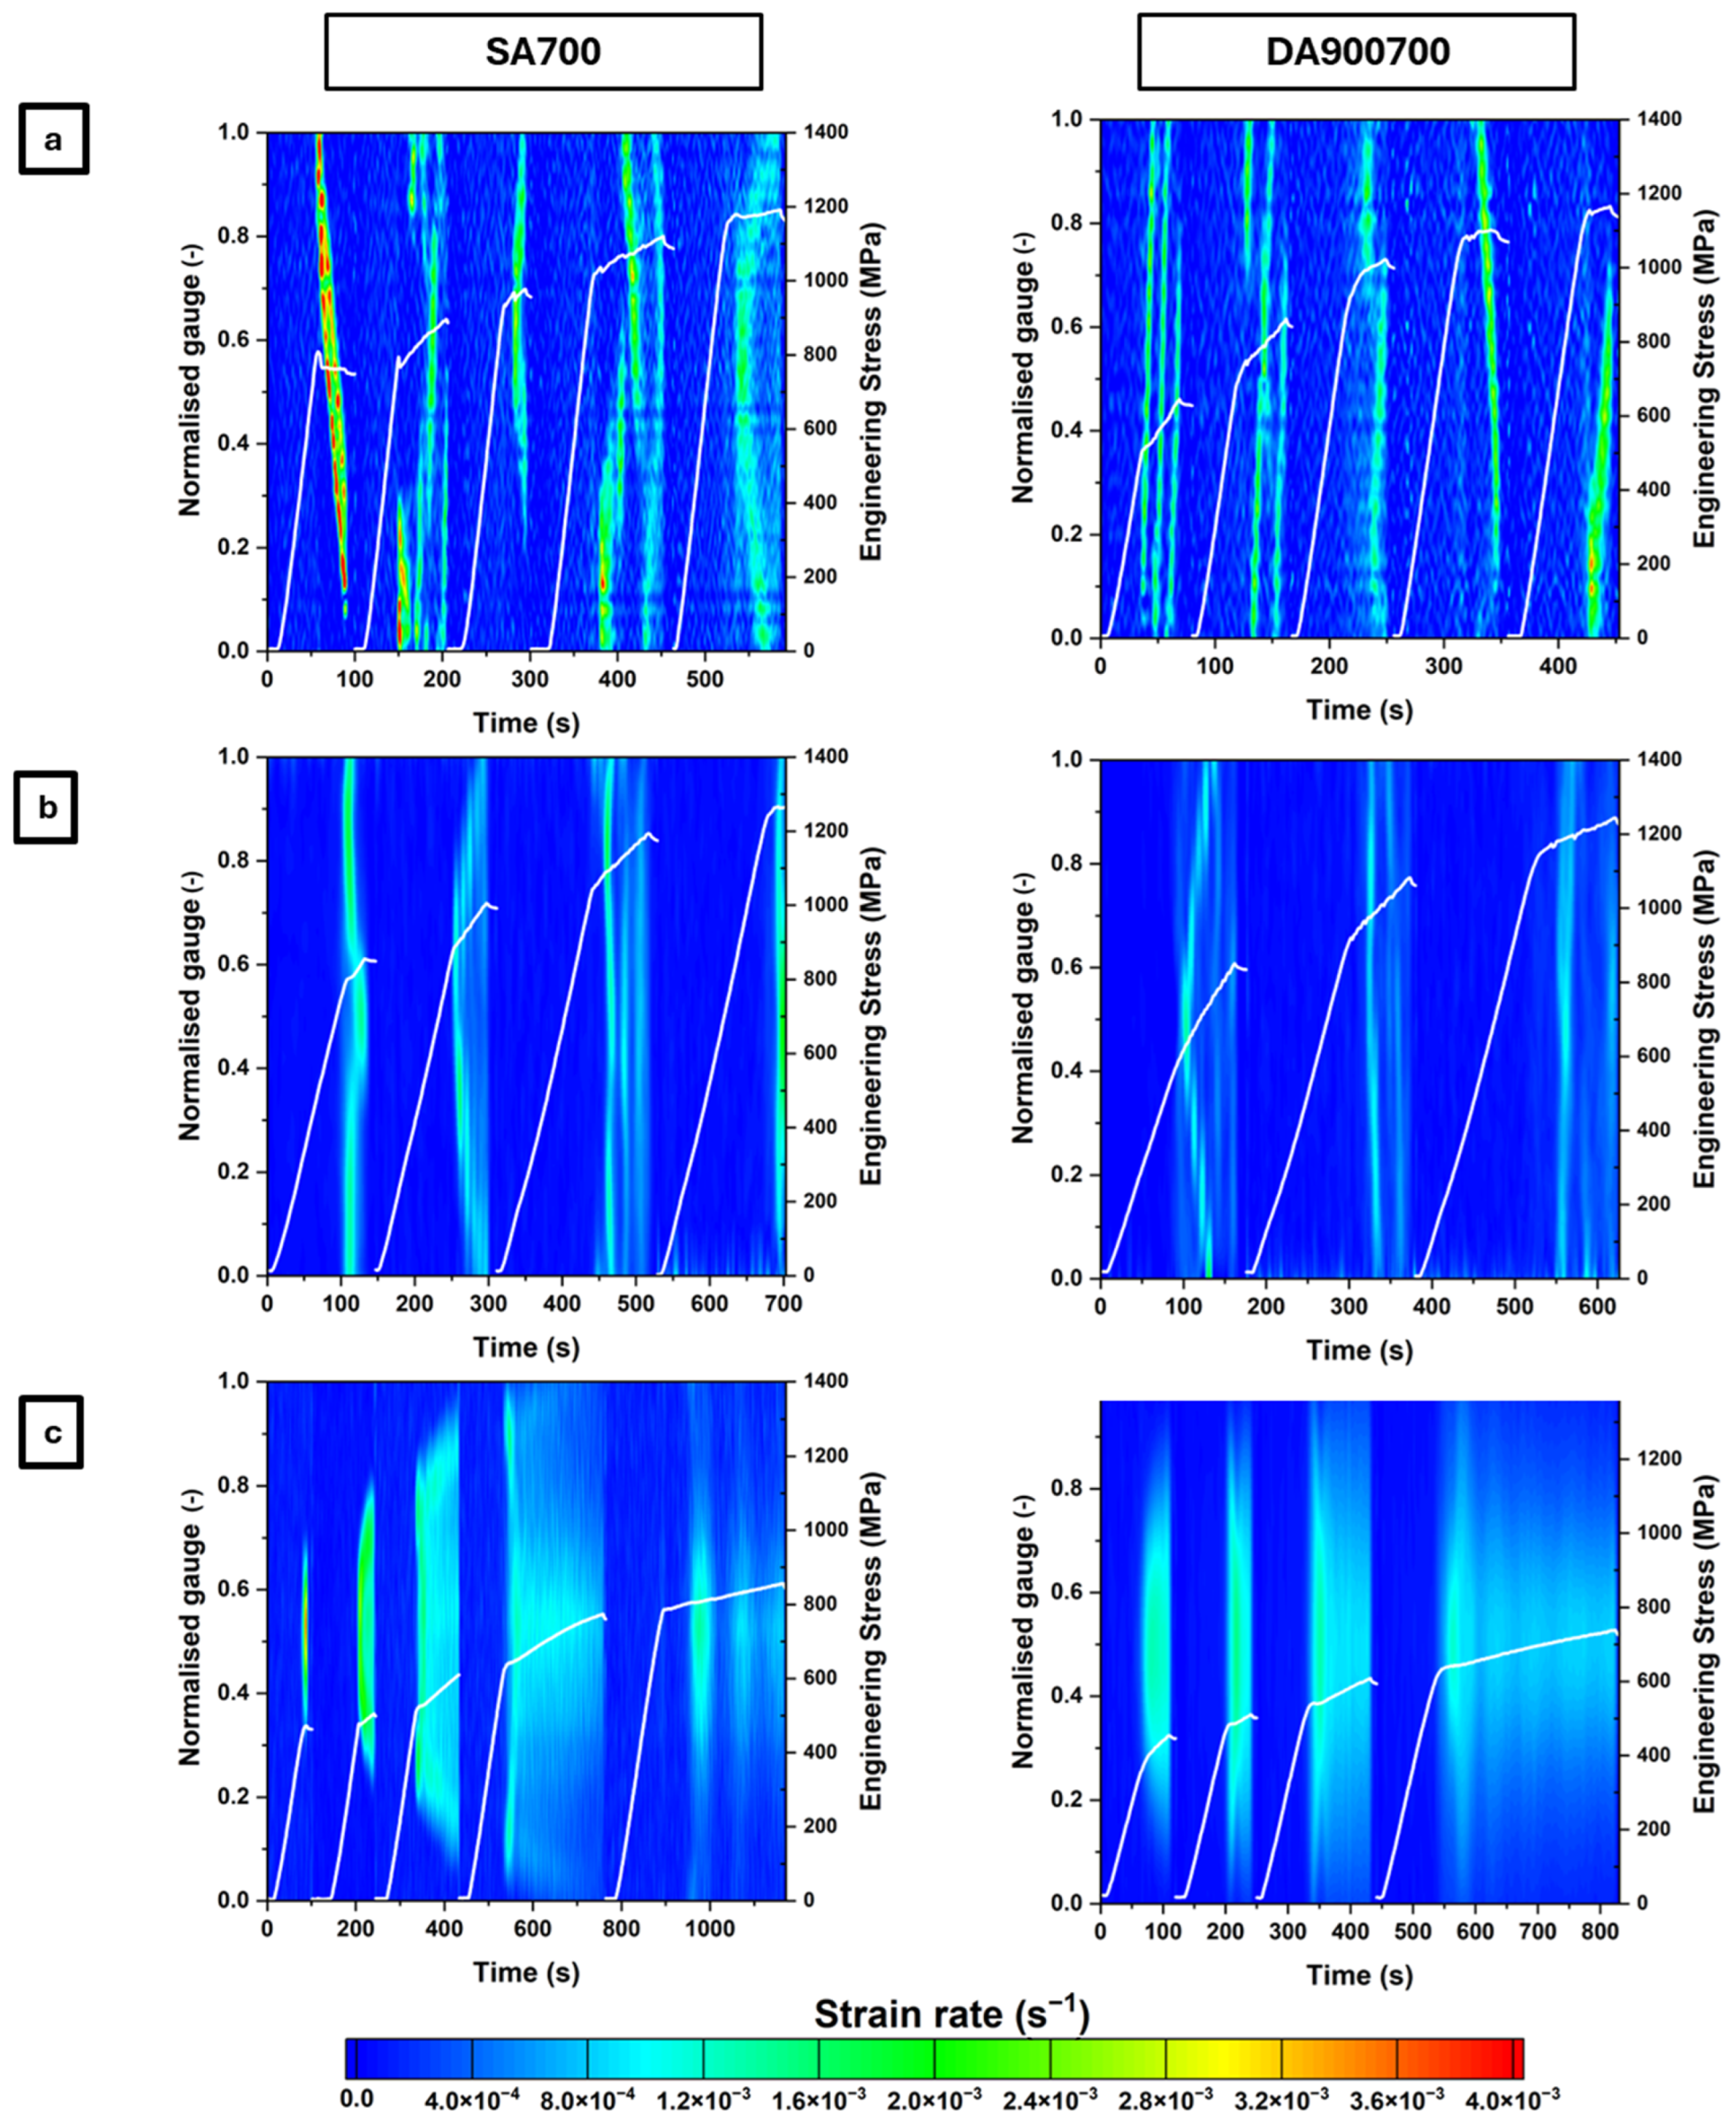
To illustrate band formation and propagation, Figure 6 shows the time histories of the DIC-derived strain-rate distribution along the centre line of the samples’ gauge sections, with the corresponding engineering stress curves shown for reference. Figure 7 presents similar graphs for the dogbone samples in the early stages of deformation. In the SA700 dogbone sample (Figure 7a), Lüders bands nucleate at multiple locations along the gauge (indicated by the white arrows), subsequently coalesce, and propagate as a single front, consistent with the stress plateau observed after yielding. At higher strains, PLC bands develop at the gauge edges. These bands coincide with the stress fluctuations observed in the corresponding stress–strain curves. In the SA700 plane strain sample (Figure 6b), yielding is accompanied by the formation and propagation of a band consistent with Lüders-type behaviour, followed by strain bands that are not well defined, in agreement with the weak PLC serrations in the stress response. In in-plane shear (Figure 6c), plastic deformation initiates with a centrally localised strain-rate peak, after which no clearly defined localisation or band propagation can be identified, nor stress serrations.
In the DA900700 specimens (Figure 6, right column), Lüders bands are absent. Instead, PLC serrations appear immediately after yielding in both dogbone and plane strain samples. In the uniaxial geometry, these serrations are associated with pronounced localisation bands, whereas under plane strain, only weak strain localisation is observed, consistent with the lower amplitude of the serrations. As in the SA700 steel, no banding is observed in the in-plane shear samples, where plastic deformation remains confined to the designed shear zone and no stress serrations are detected.
Given that band propagation is most clearly developed in the dogbone samples, quantitative characterisation was restricted to this geometry. Propagation velocity, inclination angle and band width were extracted for Lüders and PLC bands using the methods described in Section 2.3.2. Figure 7 identifies the Lüders and PLC bands selected for analysis and provides two representative bands per material condition, including one that illustrates the definition of inclination angle (α) and band width.
Table 4 reports the measured characteristics of the localisation bands analysed in the dogbone specimens under quasi-static loading. For SA700 steel, a single Lüders band is characterised at yielding after the establishment of a stable propagating front. This band exhibits a width of 1.4 mm, an inclination close to 90°, and a propagation velocity of 0.13 mm/s. Four subsequent PLC bands (labelled SB1–SB4) are characterised at higher strains. SB1 exhibits a higher inclination of approximately 70° and a width of 1.4 mm, whereas SB2–SB4 show lower angles of approximately 62–63°, consistent with deformation band angles reported for medium-Mn steels [62], and widths between 1.1 and 1.3 mm. Their propagation velocity decreases with increasing strain, from 0.68 mm/s (SB1) to 0.38 mm/s (SB4).
In DA900700 steel, six serrated bands (SB1–SB6) are characterised. Their widths range between 0.8 and 1.2 mm, while inclinations remain within a narrow range of approximately 56–58°. Propagation velocities decrease progressively from 0.75 mm/s (SB1) to 0.46 mm/s (SB6).
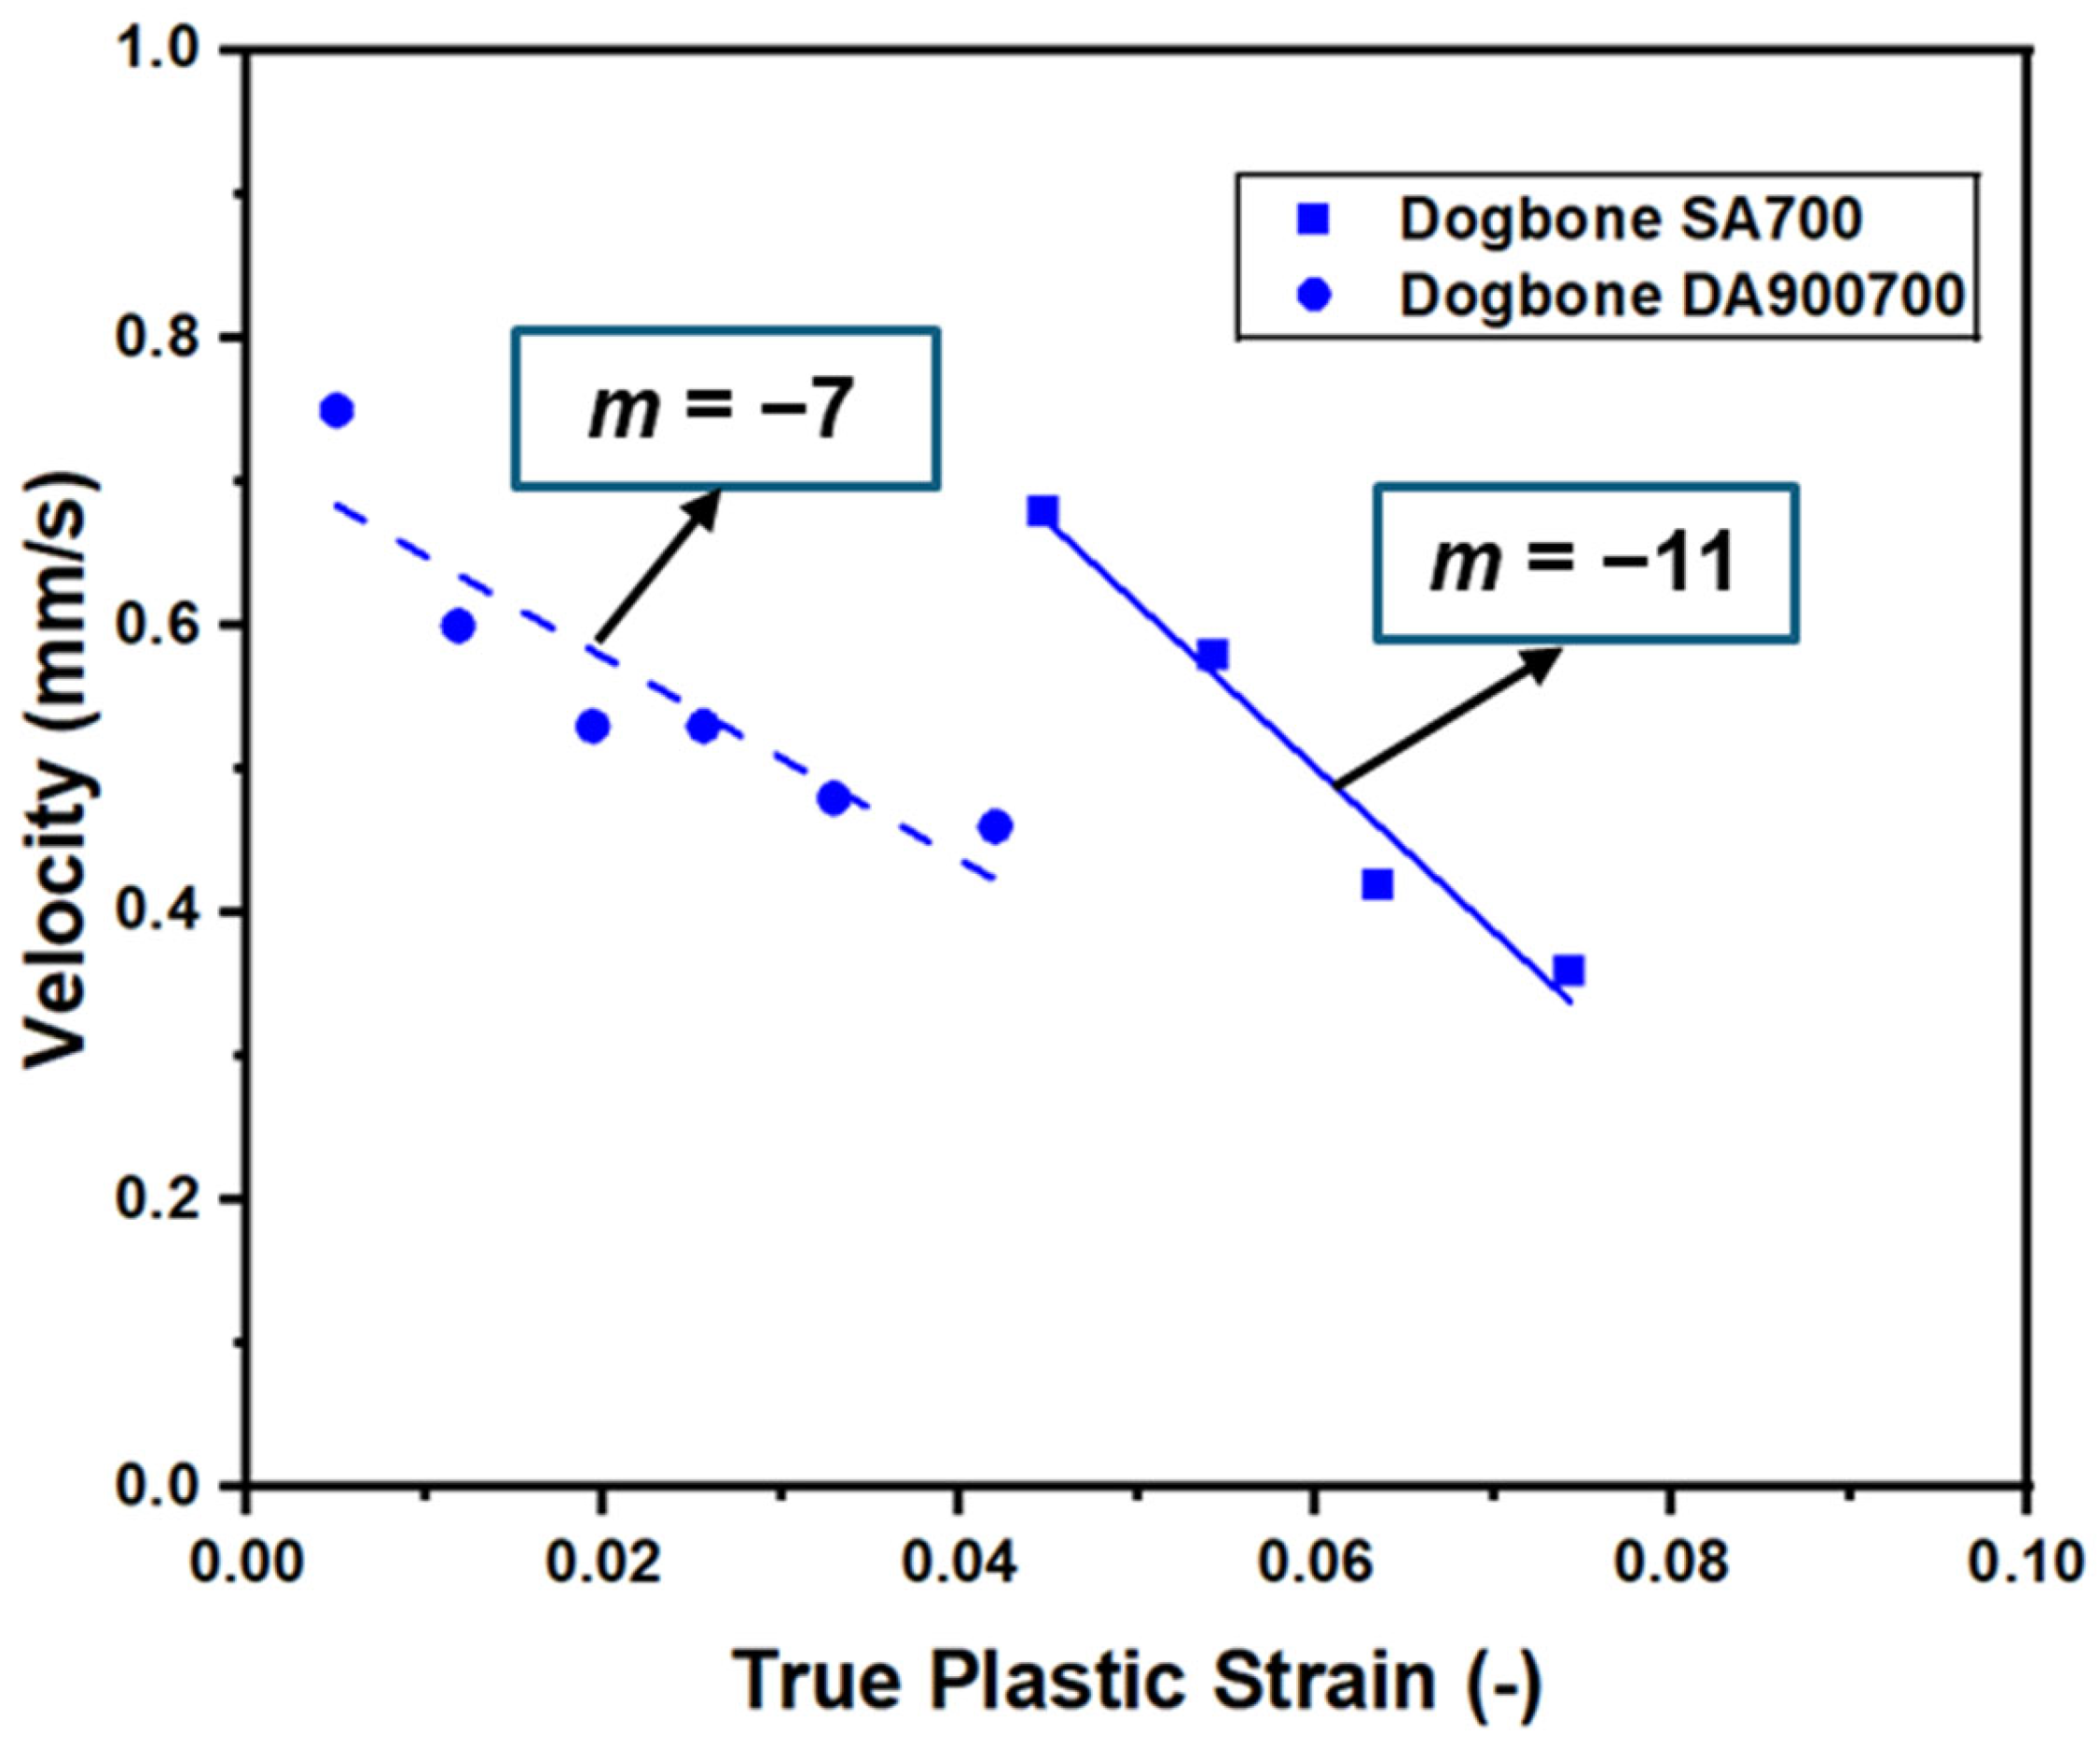
The evolution of the band propagation velocity as a function of true plastic strain for both steels is summarised in Figure 8, showing an approximately linear decrease, with a steeper slope for SA700 than for the DA900700 condition.
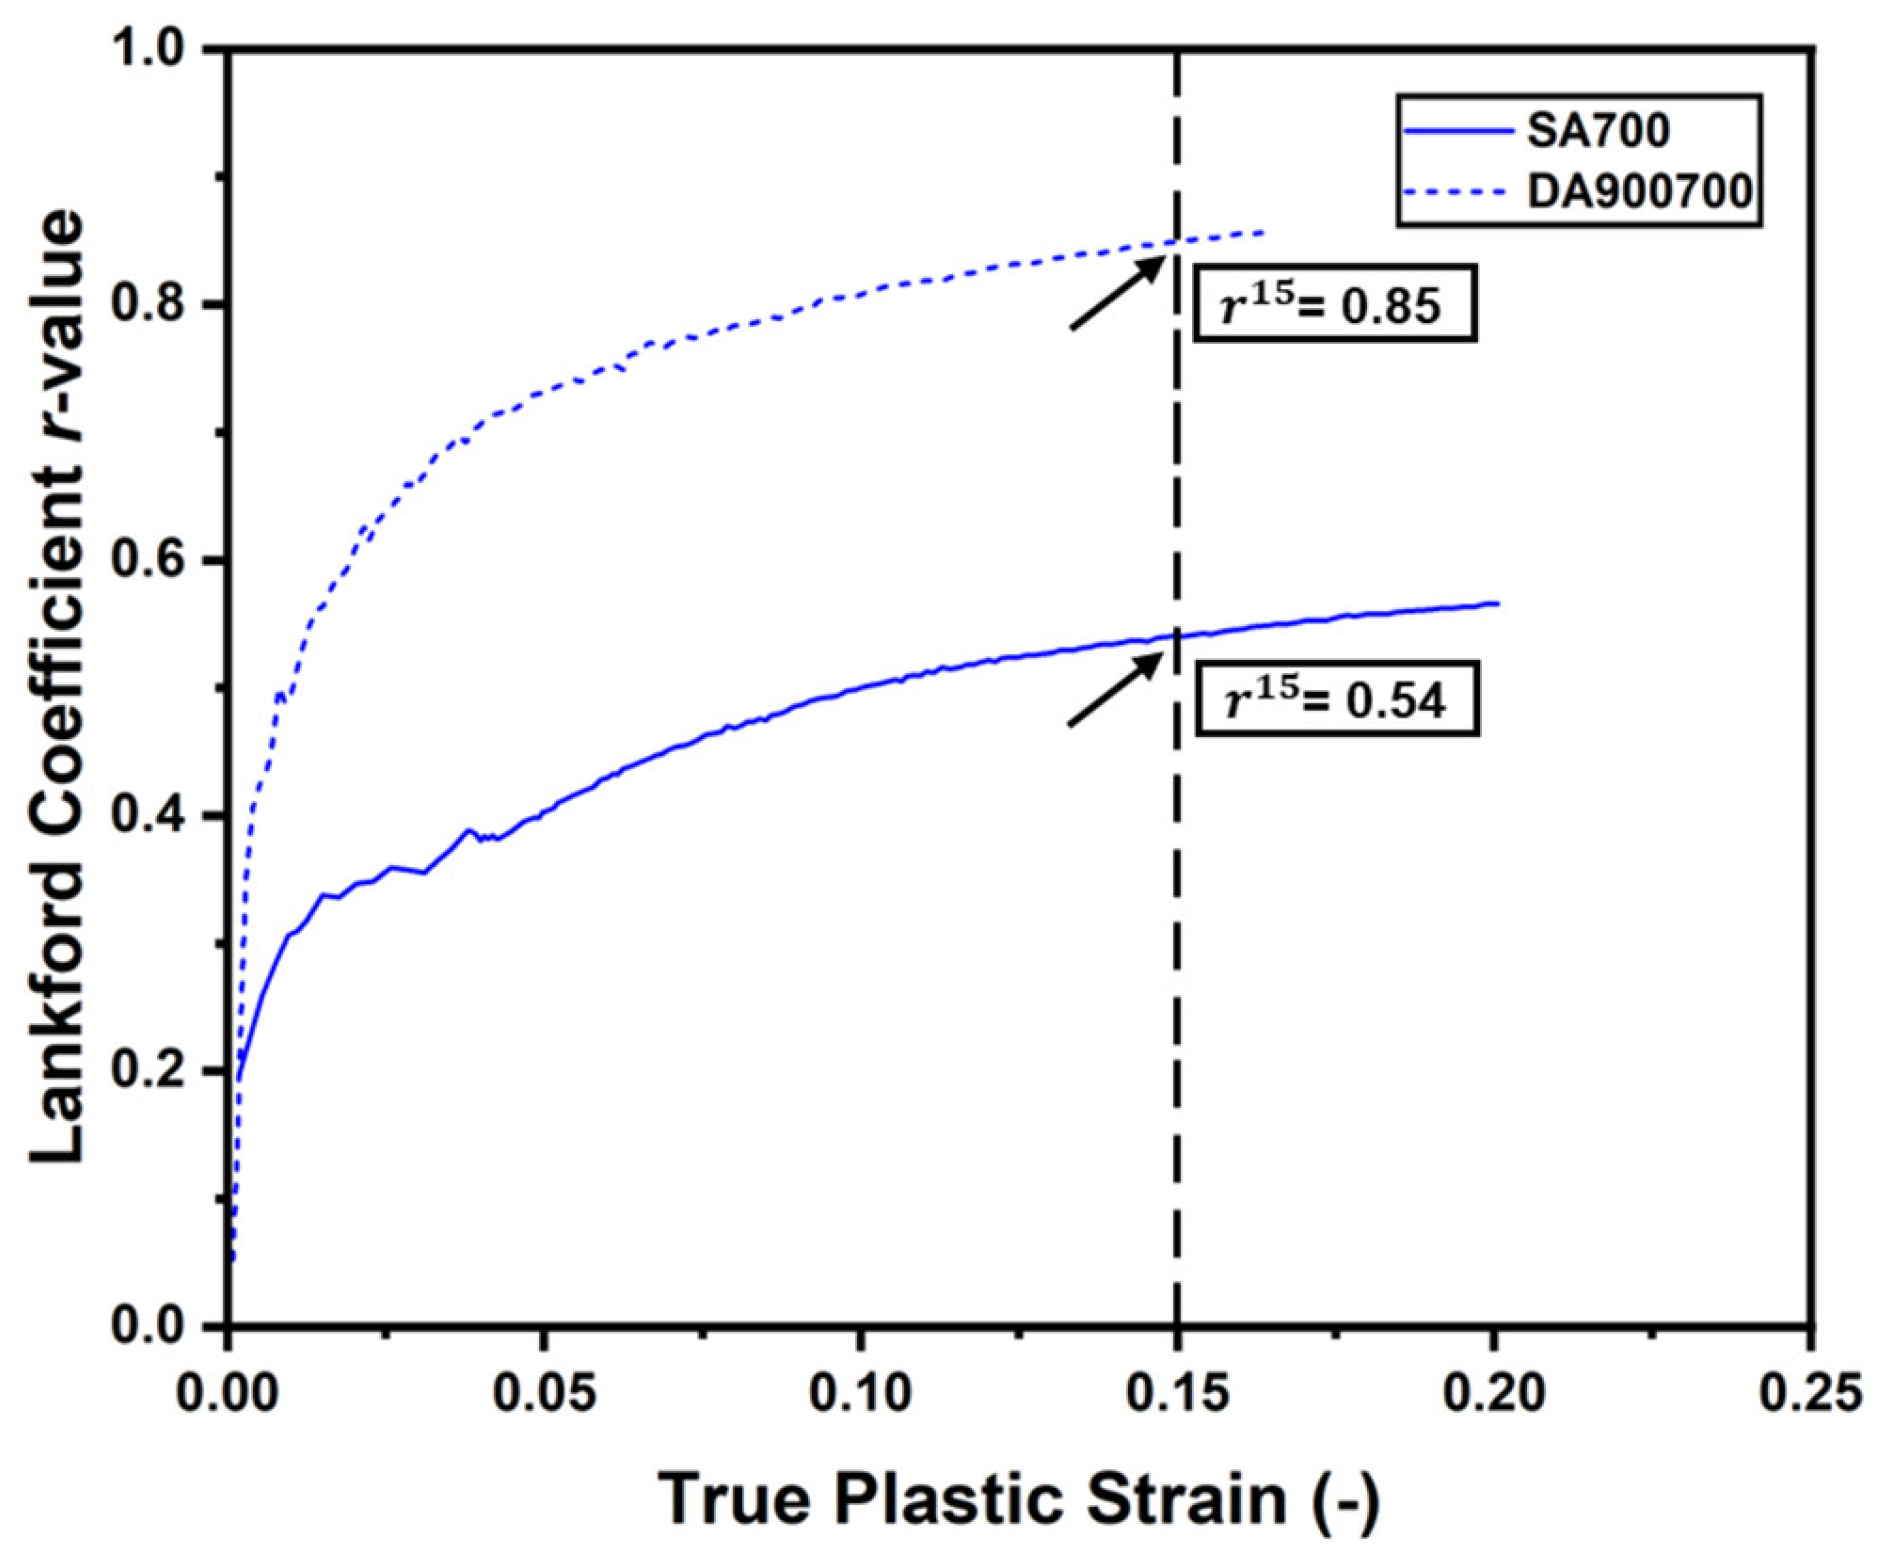
Figure 9 shows the evolution of the Lankford coefficient for the SA700 and DA900700 conditions as a function of true plastic strain. The r -value is significantly lower than unity, increases markedly after yielding, and tends towards stabilisation, although no clear plateau is reached near necking. At low strain levels, the Lankford coefficient should be interpreted with caution, as its determination relies on assumptions regarding elastic–plastic strain separation (including the adopted Poisson’s ratio) and on DIC strain measurements, which are subject to increased uncertainty at small deformation levels [63]. This comparison indicates that the SA700 condition exhibits a higher degree of plastic anisotropy within the investigated deformation range, as evidenced by a larger deviation of its r -value from unity compared to the DA900700 condition.
A relationship between plastic anisotropy and the inclination of localisation bands has been established in [64,65], with [64] proposing the following closed-form expression linking the localisation band orientation β to the Lankford coefficient r :
β =   ±   a r c t a n 1 + r r  
To examine the link between the plastic anisotropy and the PLC strain band orientation, the experimentally measured band angles were compared with predictions using Equation (4). Considering the r -values measured at 15% true plastic strain, the predicted angles are β ≈ 59.3° for the SA700 condition and β ≈ 56.8° for the DA900700 condition. These values are in good agreement with the experimentally measured PLC band angles of approximately 62–63° for the SA700 condition and 56–58° for the DA900700 condition (Table 4).

3.2. Interrupted Tests: Deformation-Induced Transformation Kinetics

Figure 10 shows representative engineering stress-equivalent strain curves for the interrupted dogbone tensile, plane strain and shear tests for the SA700 and DA900700 steels. For reference, the results of corresponding continuous tests are also included.
The interrupted curves of both steels exhibit a clear increase in flow stress upon reloading. Compared with the continuous curves, for all stress states, consistently higher stress levels are observed at equal strain levels at the onset of reloading. As deformation proceeds, the stress–strain curves exhibit a shape characteristic of discontinuous yielding, i.e., a high apparent yield stress followed by a stabilisation or even a slight decrease in stress. Upon further deformation, the curves continue along a path similar to the continuous tests, indicating that the overall strain-hardening behaviour remains consistent despite the interruptions.
Figure 11 presents the strain-rate maps obtained from the interrupted tensile tests for the three geometries and both heat treatments. After each unloading-reloading step, strain localisation bands reappear at approximately the same positions where they had previously stopped and continue propagating during the subsequent loading stage.
The interrupted tests were used to quantify the evolution of the retained austenite as a function of strain. Prior to deformation, the retained austenite fraction was quantified for each geometry and thermal condition. For the SA700 steel, average values of 16.6%, 18.3%, and 16.9% were measured in uniaxial tensile, plane strain, and in-plane shear specimens, respectively. The corresponding fractions for the DA900700 condition were 13.5%, 14.3%, and 13.1%.
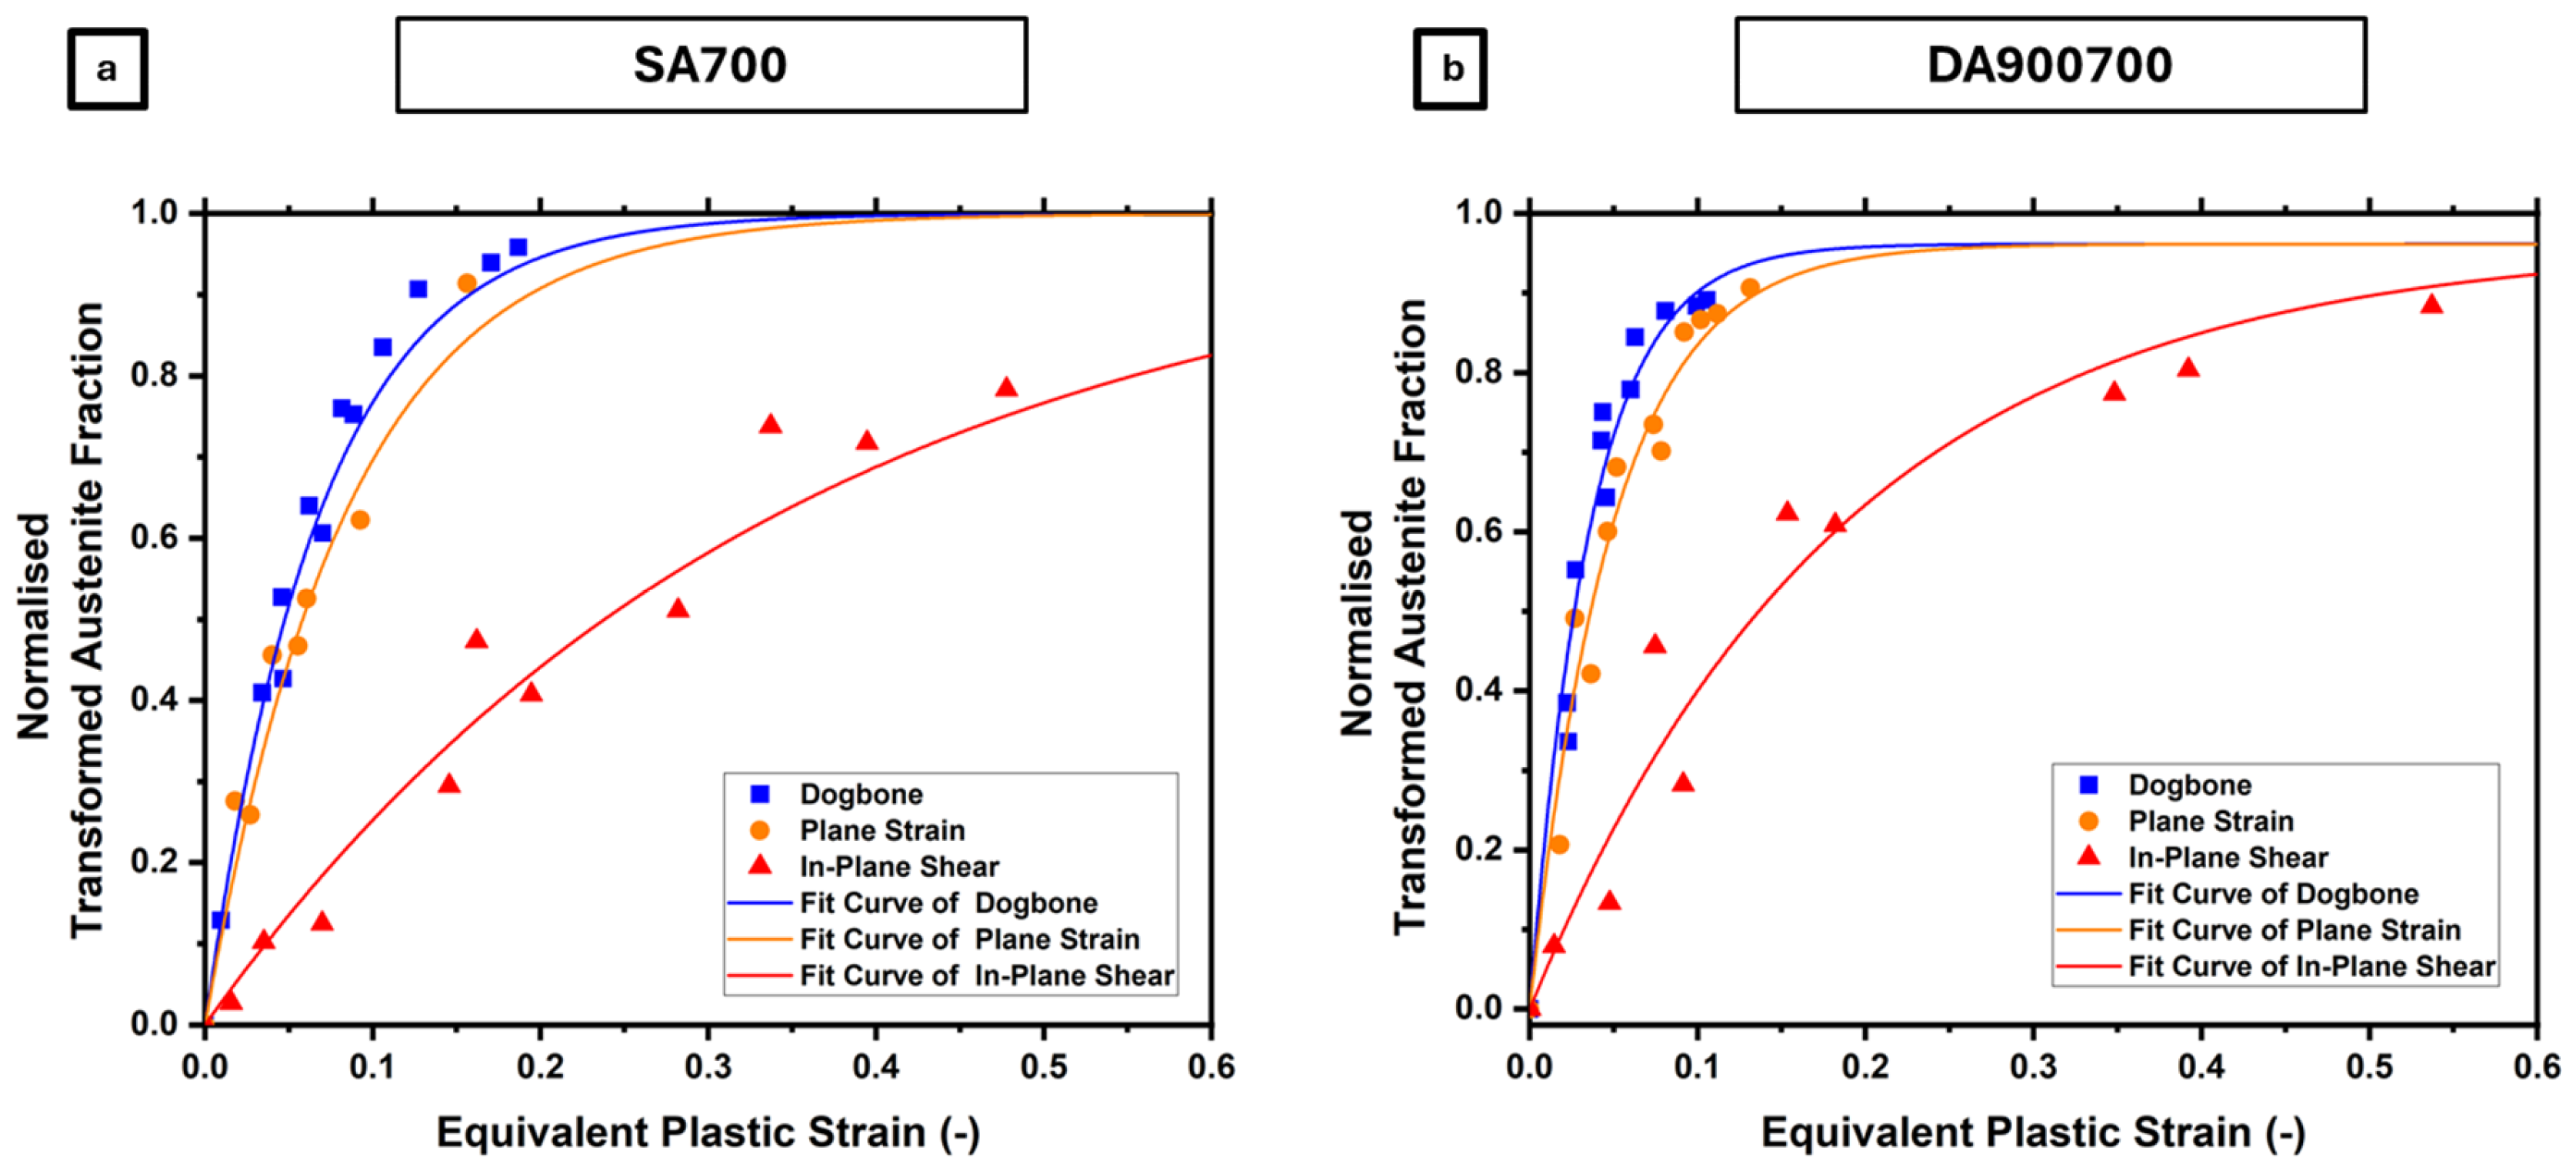
Figure 12 shows the normalised transformed austenite fraction as a function of equivalent plastic strain for all interrupted tests, covering the three stress states and both steels. In all cases, the normalised transformed austenite fraction increases progressively with plastic strain. The DA900700 steel exhibits a faster transformation than the SA700 steel, reaching an almost complete transformation of retained austenite at lower plastic strains in all geometries. Beyond the effect of the thermal treatment, the transformation kinetics are also clearly influenced by the applied stress state. The uniaxial dogbone tensile specimens exhibit the fastest transformation, followed by plane strain and in-plane shear. Notably, despite its higher stress triaxiality, the plane strain sample shows a slightly lower transformation rate than the dogbone sample at equivalent strain levels for both annealing conditions.
The JMAK kinetics model given by Equation (2) was then applied to the interrupted-test data to determine k for each geometry and both steels. The exponent n was fixed at 1 based on prior studies on cold-rolled multiphase TRIP steels [24,25,66]. The fitted curves are shown in Figure 12, and the corresponding parameters are summarised in Table 5.
The saturation level fₛ reaches unity for the SA700 condition, indicating that the retained austenite is almost fully transformed at large strains. In contrast, the DA900700 condition shows slightly lower fₛ values (≈0.96) for all geometries, suggesting that a small fraction of austenite remains untransformed even at the highest strain levels.
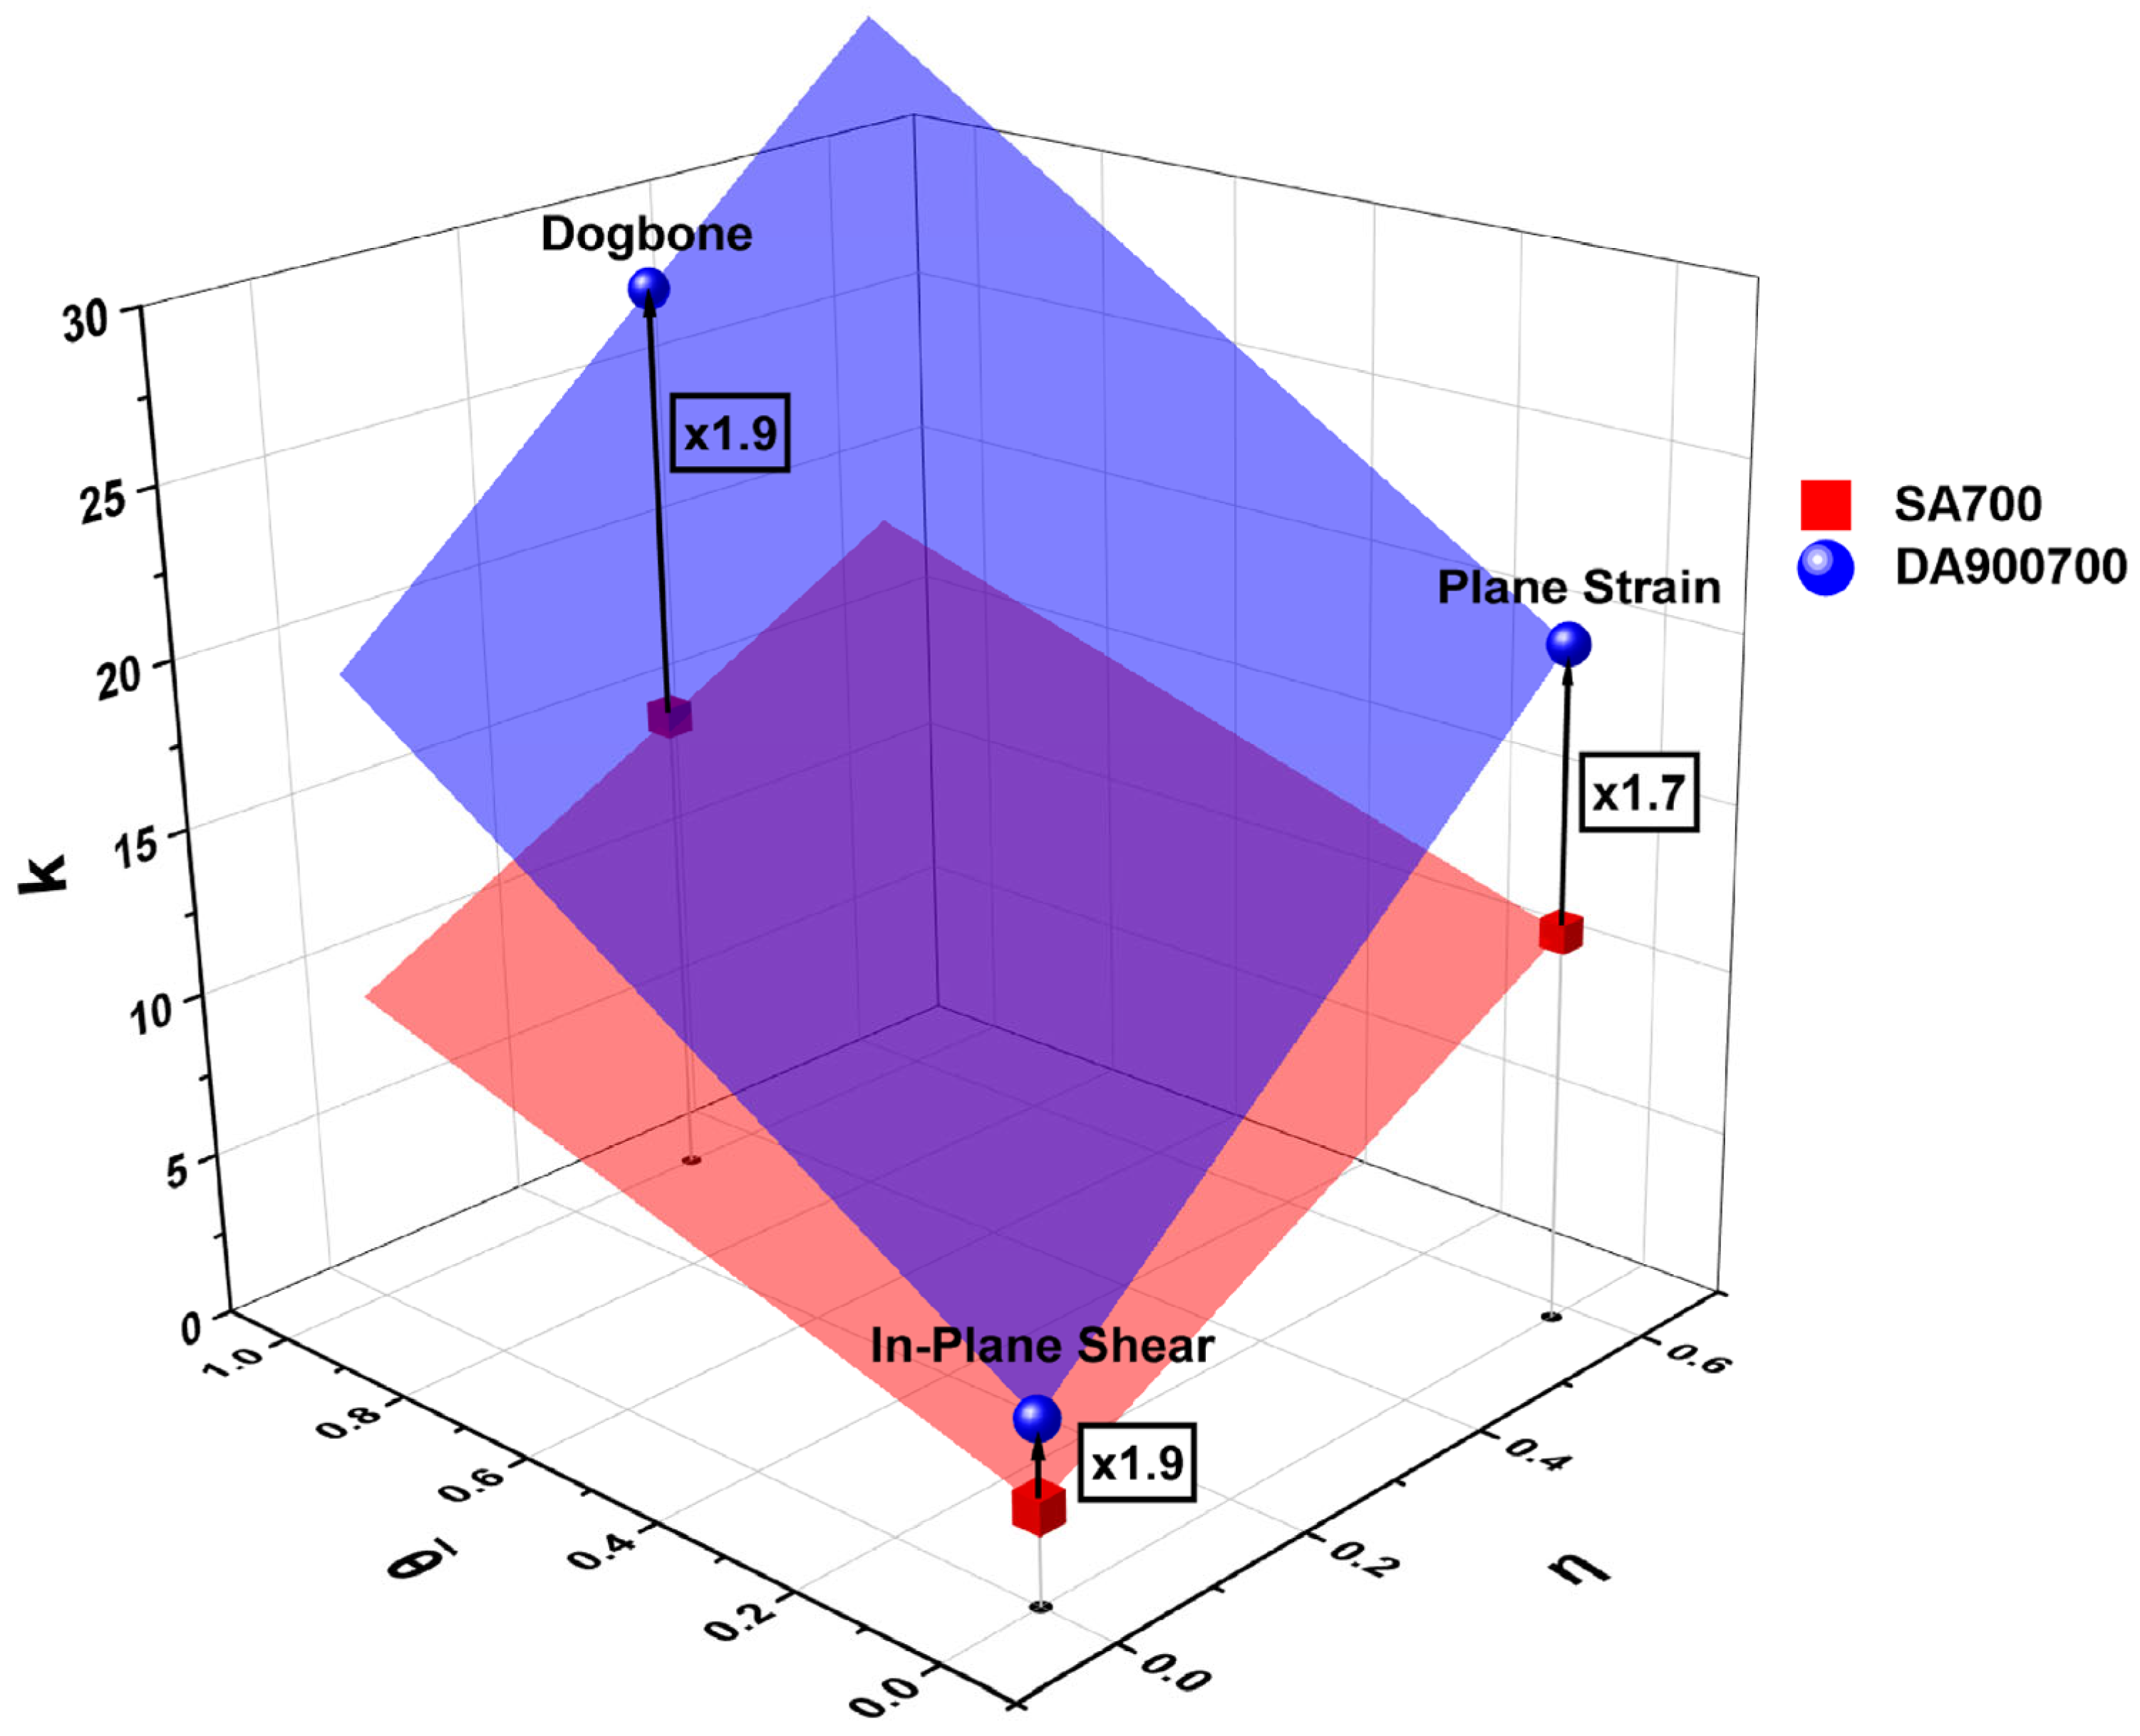
Figure 13 presents the evolution of the stability parameter k as a function of η and θ ¯ for the three specimen geometries and both steel heat treatments. For all geometries, changing the thermal treatment from SA700 to DA900700 increases k significantly, with a factor of 1.7–1.9. Independent of the thermal treatment, k increases by a factor of about 5 from in-plane shear to dogbone specimens and subsequently decreases by 20 to 25% from dogbone to plane strain. The non-monotonic dependence of k on stress triaxiality is consistent with the findings of Beese et al. [30], who proposed an equation (Equation (3)) for k as a function of both Lode angle parameter and triaxiality. The coefficients of this equation, k 0 ,   α η and α θ ¯ , are fitted using the values of k and are summarised in Table 6.

4. Discussion

The mechanical behaviour is strongly influenced by both the applied stress state and the underlying microstructural morphology. As stress triaxiality increases, the nominal flow–stress curve rises across the strain range, while the strain at localisation or failure decreases. Likewise, the stress state also affects the transformation kinetics: for both heat treatments, the austenite-to-martensite transformation proceeds fastest under uniaxial tension, followed by plane strain, and is slowest in in-plane shear, despite the higher triaxiality associated with plane strain. This non-monotonic ordering indicates that η alone is insufficient to describe the transformation behaviour and motivates including the Lode angle parameter alongside η in the analysis [30].
The SA700 steel shows a pronounced yield point phenomenon with Lüders-band propagation followed by PLC serrations, whereas the DA900700 steel does not exhibit Lüders propagation and PLC is observed immediately after yielding. The presence of the yield point phenomenon in the SA700 steel is consistent with its processing route, in which intercritical annealing is applied directly to the cold-rolled condition and results in a globular ferrite–austenite microstructure, which has been frequently associated with discontinuous yielding and Lüders-band formation [10,43,46,49]. In contrast, the DA900700 condition shows continuous yielding with PLC effect from the onset of plastic deformation. The occurrence of PLC serrations in both conditions reflects dynamic strain ageing, which in medium-Mn steels is commonly associated with solute–dislocation interactions and is frequently accompanied by strain localisation [40,41,42,43,44,45]. In both conditions, the interrupted tests reveal a clear strengthening of the yield response after unloading–reloading, consistent with rapid static strain ageing at room temperature.
Because deformation localises differently across geometries and heat treatments, as shown by the DIC maps in Figure 6 and Figure 11, the apparent transformation kinetics depend on where strain and phase are obtained. For this reason, it is essential that strain and phase are measured in the same region of interest, matching both location and size. Accordingly, the methodology used in this study ensures that the observed trends can be attributed to the stress state rather than to spatial mismatches between measurement locations.
The linear dependence of k on η and θ ¯ , proposed by Beese and Mohr [30], captures the observed trends well for both treatment conditions within the sampled domain and provides a first-order phenomenological approximation. However, with only three stress states, the evidence for linearity is limited, and the θ ¯ range is restricted to values near 0 and 1. Therefore, the fitted k ( η , θ ¯ ) plane should be regarded as locally valid and not extrapolated beyond the measured η and θ ¯ range considered. If extrapolated to a uniaxial compression test ( η = −0.33 and θ ¯ = −1), for instance, the linear equation would predict negative values of k , which is non-physical for a rate parameter. In addition, it would be important to establish operational bounds in conditions under which strain-induced transformation is effectively suppressed ( k ≈ 0) and, conversely, those that maximise the transformation rate (largest k ).
Although the use of a common saturation level f s and a fixed exponent n across stress states has been questioned [67], the present data indicate similar saturation levels and comparable n values for all three geometries. This study therefore suggests that f s and n are governed primarily by the intrinsic stability of the retained austenite, which is affected by its composition, morphology, and mechanical state, rather than by the stress state.
Across all geometries, the fitted k increases by a comparable factor (≈1.7–1.9×) when transitioning from the SA700 to the DA900700 condition. This geometry-independent shift indicates that, at a fixed stress state, the retained austenite in the SA700 steel is more stable than in the DA900700 steel. This difference may be related to the different microstructures prior to intercritical annealing and the resulting morphologies. In particular, processing routes starting from a cold-rolled microstructure have been reported to promote enhanced stabilisation of retained austenite after intercritical annealing, owing to more effective chemical partitioning during the heat treatment, whereas routes involving full austenitisation prior to intercritical annealing tend to yield a more homogeneous starting state and a comparatively lower retained-austenite stability [12].
These microstructural differences are reflected in the mechanical behaviour of all tests. Both steels reach similar maximum nominal stresses, in line with their comparable total martensite fractions at maximum load. However, the DA900700 steel reaches the maximum stress at a lower equivalent strain and exhibits a steeper initial work-hardening response. This behaviour is consistent with the faster austenite-to-martensite transformation and an earlier onset of macroscopic instability as the retained austenite is progressively depleted.
Under uniaxial loading, both steels exhibit a monotonic decrease in PLC-band propagation velocity with increasing true plastic strain. While the overall trend is similar, the rate of decrease differs between the two microstructures: DA900700 steel shows a more gradual reduction in band velocity over the analysed PLC regime, whereas SA700 steel exhibits a steeper decrease over its corresponding PLC strain interval. This behaviour can be attributed to the underlying work-hardening response. In DA900700 steel, the work-hardening rate remains comparatively high and stable at low strains over the interval where band velocities are evaluated, which limits the reduction in band mobility and results in a lower absolute velocity slope. In SA700 steel, after the Lüders regime characterised by near-zero work hardening, the work-hardening rate exhibits a progressive decrease over the analysed PLC strain interval, which promotes a more pronounced deceleration of band propagation. This difference is consistent with the transformation kinetics discussed above. In the DA900700 condition, the faster strain-induced transformation provides a sustained hardening contribution at low strains, maintaining a comparatively high work-hardening level during the PLC regime analysed. In contrast, in the SA700 condition, the transformation contribution develops more gradually following the Lüders regime, resulting in a progressive decrease in the work-hardening rate over the analysed PLC interval. Such coupling between transformation kinetics, work-hardening and strain localisation is consistent with recent observations in medium-Mn steels, where dynamic strain ageing and TRIP interact through their sensitivity to local strain partitioning and austenite stability [10,49].
Differences in band inclination reflect the distinct plastic anisotropy of the two microstructures. The SA700 steel exhibits lower r -values and a larger deviation from unity, indicative of stronger plastic anisotropy compared with the DA900700 steel. This more pronounced anisotropy is shown to be accompanied by larger band inclinations in SA700. The link between band inclination and plastic anisotropy is further supported by the close agreement between the experimentally measured band angles and those predicted by an anisotropy-based model [63,64,65] over the investigated r -value range, indicating that band inclination is predominantly governed by plastic anisotropy. The full austenitisation step prior to intercritical annealing may further contribute to the reduced anisotropy observed in DA900700 by partially erasing the deformation history inherited from prior thermomechanical processing.
Localisation bands were also observed under plane strain and in-plane shear, indicating that strain localisation is not restricted to uniaxial loading within the investigated domain and should be considered when interpreting stress-state-dependent transformation kinetics.
The comparatively low Lankford coefficient of the lamellar SA700 microstructure, together with its stronger propensity for Lüders and Portevin–Le Chatelier band formation, indicates an increased sensitivity to heterogeneous deformation and strain localisation relative to the DA900700 condition. Such behaviour may be detrimental in applications requiring stable plastic flow and a delayed onset of strain localisation at high plastic strains, including forming operations and energy absorption. Furthermore, owing to the observed sensitivity of ageing-related phenomena to the stress state, the stability of plastic flow may vary spatially under complex strain paths. In contrast, the higher Lankford coefficient and weaker localisation features of the globular DA900700 microstructure are more conducive to stable deformation. These trends highlight the importance of microstructural design in achieving improved forming performance in medium-Mn steels.

5. Conclusions

This study examined the mechanical response of medium-manganese TRIP steels under different stress states, with a focus on deformation-induced austenite-to-martensite transformation and ageing phenomena. Three tensile geometries were employed to impose in-plane shear, uniaxial tension, and plane strain stress states, and two annealing routes were compared: single and double annealing, resulting in a globular and lamellar morphology, respectively. The main conclusions are:
  • As opposed to the DA900700 steel, the SA700 steel exhibits discontinuous yielding, with uniaxial tests showing clear Lüders-band formation. Both steels exhibit dynamic strain ageing manifested by Portevin–Le Chatelier serrations and associated strain-localisation bands, which are most pronounced under uniaxial tension, weaker in plane strain, and barely detectable in in-plane shear. Static strain ageing is evidenced by a strengthened yield response upon unloading–reloading for all investigated stress states.
  • The imposed stress state strongly affects the macroscopic stress–strain response and ductility as a result of different levels of deformation constraints. For both microstructures, the flow-stress level was highest under plane strain, followed by uniaxial tension and in-plane shear. Conversely, the attainable equivalent strain was highest in in-plane shear, lowest in plane strain, and intermediate in uniaxial tension.
  • The SA700 steel shows a higher yield strength than the DA900700 steel, while both reach similar maximum engineering stresses, consistent with their comparable final martensite fractions. In the early stages of plastic deformation, DA900700 steel exhibits a markedly higher work-hardening rate compared to the SA700 steel. With increasing strain, the work-hardening rate of DA900700 steel decreases more rapidly and becomes lower than that of the SA700 steel.
  • For both steels, the austenite-to-martensite transformation proceeds fastest in uniaxial tension, slightly slower in plane strain, and markedly slower in in-plane shear, evidencing a non-monotonic dependence on stress triaxiality. An extended Beese–Mohr/Johnson–Mehl–Avrami–Kolmogorov formulation incorporating stress triaxiality and Lode angle captures the experimentally observed transformation kinetics.
  • For all stress states, the double-annealed condition shows higher transformation rates than the single-annealed steel, indicating a lower retained-austenite stability in the lamellar microstructure.
  • The experimentally measured PLC band inclination angles show good agreement with predictions from an anisotropy-based model using the measured r -values, suggesting that PLC band orientation is governed by plastic anisotropy. Consistently, the SA700 steel, characterised by lower r -values and stronger anisotropy, exhibits higher band inclinations and an increased tendency for strain localisation, whereas the DA900700 steel displays weaker anisotropy and more stable plastic flow.
  • In uniaxial tests, PLC band propagation velocities decrease monotonically with increasing strain in both steels and are generally higher in the DA900700 steel. The reduction in band velocity is more gradual in the DA900700 steel than in the SA700 steel, which is consistent with the different evolution of the work-hardening response between the two microstructures. This behaviour suggests a coupled interaction between strain localisation, work hardening, and strain-induced transformation.

Author Contributions

Conceptualization, P.V.; Methodology, J.C.-S. and P.V.; Formal analysis, J.C.-S.; Investigation, J.C.-S.; Writing—original draft, J.C.-S.; Writing—review & editing, R.H.P. and P.V.; Visualization, J.C.-S.; Supervision, R.H.P. and P.V.; Funding acquisition, P.V. All authors have read and agreed to the published version of the manuscript.

Funding

This research was funded by the European Research Fund for Coal and Steel (RFCS), grant number RFCS-2019-899482 (DynAustab). The APC was fully waived by the publisher.

Data Availability Statement

The original contributions presented in this study are included in the article. Further inquiries can be directed to the corresponding author.

Conflicts of Interest

The authors declare no conflict of interest.

References

  1. Kuziak, R.; Kawalla, R.; Waengler, S. Advanced high strength steels for automotive industry. Arch. Civ. Mech. Eng. 2008, 8, 103–117. [Google Scholar] [CrossRef]
  2. Galán, J.; Samek, L.; Verleysen, P.; Verbeken, K.; Houbaert, Y. Aceros avanzados de alta resistencia en la industria automovilística. Rev. Metal. 2012, 48, 118–131. [Google Scholar] [CrossRef]
  3. Xia, P.; Sabirov, I.; Petrov, R.; Verleysen, P. Review of Performance of Advanced High Strength Steels under Impact. Adv. Eng. Mater. 2025, 27, 2402016. [Google Scholar] [CrossRef]
  4. Kim, H.J.; Keoleian, G.A.; Skerlos, S.J. Economic Assessment of Greenhouse Gas Emissions Reduction by Vehicle Lightweighting Using Aluminum and High-Strength Steel. J. Ind. Ecol. 2011, 15, 64–80. [Google Scholar] [CrossRef]
  5. Miller, R.L. Ultrafine-grained microstructures and mechanical properties of alloy steels. Metall. Trans. 1972, 3, 905–912. [Google Scholar] [CrossRef]
  6. Ma, Y. Medium-manganese steels processed by austenite-reverted-transformation annealing for automotive applications. Mater. Sci. Technol. 2017, 33, 1713–1727. [Google Scholar] [CrossRef]
  7. De Cooman, B.C. High Mn TWIP steel and medium Mn steel. In Automotive Steels; Elsevier: Amsterdam, The Netherlands, 2017; pp. 317–385. ISBN 978-0-08-100638-2. [Google Scholar]
  8. Kumar Singh, M.; Kumar Verma, A.; Kumar, A. Microstructure and Mechanical properties of Medium Manganese Steels. Mater. Today Proc. 2022, 56, 356–367. [Google Scholar] [CrossRef]
  9. Yu, S.; Deng, Y.G. A Review of Recent Developments in Microstructures and Mechanical Properties of Medium Manganese Steels. J. Mater. Eng. Perform. 2025, 34, 16827–16846. [Google Scholar] [CrossRef]
  10. Kwok, T.W.J.; Dye, D. A review of the processing, microstructure and property relationships in medium Mn steels. Int. Mater. Rev. 2023, 68, 1098–1134. [Google Scholar] [CrossRef]
  11. Schneider, R.; Steineder, K.; Krizan, D.; Sommitsch, C. Effect of the heat treatment on the microstructure and mechanical properties of medium-Mn-steels. Mater. Sci. Technol. 2019, 35, 2045–2053. [Google Scholar] [CrossRef]
  12. Lee, Y.K.; Han, J. Current opinion in medium manganese steel. Mater. Sci. Technol. 2015, 31, 843–856. [Google Scholar] [CrossRef]
  13. Zhang, X.; Miyamoto, G.; Kaneshita, T.; Yoshida, Y.; Toji, Y.; Furuhara, T. Growth mode of austenite during reversion from martensite in Fe-2Mn-1.5Si-0.3C alloy: A transition in kinetics and morphology. Acta Mater. 2018, 154, 1–13. [Google Scholar] [CrossRef]
  14. Zhang, X.; Miyamoto, G.; Toji, Y.; Nambu, S.; Koseki, T.; Furuhara, T. Orientation of austenite reverted from martensite in Fe-2Mn-1.5Si-0.3C alloy. Acta Mater. 2018, 144, 601–612. [Google Scholar] [CrossRef]
  15. Chen, J.; Lv, M.; Tang, S.; Liu, Z.; Wang, G. Correlation between mechanical properties and retained austenite characteristics in a low-carbon medium manganese alloyed steel plate. Mater. Charact. 2015, 106, 108–111. [Google Scholar] [CrossRef]
  16. Sun, B.; Fazeli, F.; Scott, C.; Guo, B.; Aranas, C.; Chu, X.; Jahazi, M.; Yue, S. Microstructural characteristics and tensile behavior of medium manganese steels with different manganese additions. Mater. Sci. Eng. A 2018, 729, 496–507. [Google Scholar] [CrossRef]
  17. Jain, A.; Varshney, A. A critical review on deformation-induced transformation kinetics of austenitic stainless steels. Mater. Sci. Technol. 2024, 40, 75–106. [Google Scholar] [CrossRef]
  18. Pereloma, E.V.; Gazder, A.; Timokhina, I. Retained Austenite: Transformation-Induced Plasticity. In Encyclopedia of Iron, Steel, and Their Alloys; CRC Press: Boca Raton, FL, USA, 2016; pp. 3088–3103. ISBN 978-1-4665-1104-0. [Google Scholar]
  19. Olson, G.B.; Cohen, M. Kinetics of strain-induced martensitic nucleation. Metall. Trans. A 1975, 6, 791–795. [Google Scholar] [CrossRef]
  20. Matsumura, O.; Sakuma, Y.; Takechi, H. Trip and Its Kinetic Aspects in Austempered 0.4C-1.5Si-0.8Mn Steel. Scr. Met. 1987, 21, 1301–1306. [Google Scholar] [CrossRef]
  21. Ahmedabadi, P.M.; Kain, V.; Agrawal, A. Modelling kinetics of strain-induced martensite transformation during plastic deformation of austenitic stainless steel. Mater. Des. 2016, 109, 466–475. [Google Scholar] [CrossRef]
  22. Guimarães, J.R.C. The deformation-induced martensitic reaction in polycrystalline Fe-30.7 Ni-0.06C. Scr. Metall. 1972, 6, 795–798. [Google Scholar] [CrossRef]
  23. Shin, H.C.; Ha, T.K.; Chang, Y.W. Kinetics of deformation induced martensitic transformation in a 304 stainless steel. Scr. Mater. 2001, 45, 823–829. [Google Scholar] [CrossRef]
  24. Zhu, N.; Wu, Q.; He, Y.; Lu, X.; Li, L.; Hu, P. Effect of Ni on the Stability of Retained Austenite and Mechanical Properties for TRIP Steels Containing Vanadium. Steel Res. Int. 2014, 85, 143–154. [Google Scholar] [CrossRef]
  25. Lee, C.G.; Kim, S.J.; Lee, T.H.; Lee, S. Effects of volume fraction and stability of retained austenite on formability in a 0.1C–1.5Si–1.5Mn–0.5Cu TRIP-aided cold-rolled steel sheet. Mater. Sci. Eng. A 2004, 371, 16–23. [Google Scholar] [CrossRef]
  26. Stringfellow, R.G.; Parks, D.M.; Olson, G.B. A constitutive model for transformation plasticity accompanying strain-induced martensitic transformations in metastable austenitic steels. Acta Metall. Mater. 1992, 40, 1703–1716. [Google Scholar] [CrossRef]
  27. Sugimoto, K.; Kobayashi, M.; Nagasaka, A.; Hashimoto, S. Warm Stretch-formability of TRIP-aided Dual-phase Sheet Steels. ISIJ Int. 1995, 35, 1407–1414. [Google Scholar] [CrossRef]
  28. Yu, H.Y.; Kai, G.Y.; De Jian, M. Transformation behavior of retained austenite under different deformation modes for low alloyed TRIP-assisted steels. Mater. Sci. Eng. A 2006, 441, 331–335. [Google Scholar] [CrossRef]
  29. Shan, T.K.; Li, S.H.; Zhang, W.G.; Xu, Z.G. Prediction of martensitic transformation and deformation behavior in the TRIP steel sheet forming. Mater. Des. 2008, 29, 1810–1816. [Google Scholar] [CrossRef]
  30. Beese, A.M.; Mohr, D. Effect of stress triaxiality and Lode angle on the kinetics of strain-induced austenite-to-martensite transformation. Acta Mater. 2011, 59, 2589–2600. [Google Scholar] [CrossRef]
  31. Haidemenopoulos, G.N.; Aravas, N.; Bellas, I. Kinetics of strain-induced transformation of dispersed austenite in low-alloy TRIP steels. Mater. Sci. Eng. A 2014, 615, 416–423. [Google Scholar] [CrossRef]
  32. Kim, H.; Lee, J.; Barlat, F.; Kim, D.; Lee, M.G. Experiment and modeling to investigate the effect of stress state, strain and temperature on martensitic phase transformation in TRIP-assisted steel. Acta Mater. 2015, 97, 435–444. [Google Scholar] [CrossRef]
  33. Mansourinejad, M.; Ketabchi, M. Modification of Olson–Cohen model for predicting stress-state dependency of martensitic transformation. Mater. Sci. Technol. 2017, 33, 1948–1954. [Google Scholar] [CrossRef]
  34. Yang, Y.G.; Mi, Z.L.; Xu, M.; Xiu, Q.; Li, J.; Jiang, H.T. Impact of intercritical annealing temperature and strain state on mechanical stability of retained austenite in medium Mn steel. Mater. Sci. Eng. A 2018, 725, 389–397. [Google Scholar] [CrossRef]
  35. Zou, D.; Li, S.; He, J.; Gu, B.; Li, Y. The deformation induced martensitic transformation and mechanical behavior of quenching and partitioning steels under complex loading process. Mater. Sci. Eng. A 2018, 715, 243–256. [Google Scholar] [CrossRef]
  36. Polatidis, E.; Haidemenopoulos, G.N.; Krizan, D.; Aravas, N.; Panzner, T.; Šmíd, M.; Papadioti, I.; Casati, N.; Van Petegem, S.; Van Swygenhoven, H. The effect of stress triaxiality on the phase transformation in transformation induced plasticity steels: Experimental investigation and modelling the transformation kinetics. Mater. Sci. Eng. A 2021, 800, 140321. [Google Scholar] [CrossRef]
  37. Yang, Y.; Mu, W.; Sun, B.; Jiang, H.; Mi, Z. New insights to understand the strain-state-dependent austenite stability in a medium Mn steel: An experimental and theoretical investigation. Mater. Sci. Eng. A 2021, 809, 140993. [Google Scholar] [CrossRef]
  38. Zou, Y.; Gao, Q.; Ding, H.; Zhang, Y.; Tang, Z. Investigations on austenite stability and martensitic transformation kinetics of a medium Mn steel under different strain states. Int. J. Plast. 2023, 171, 103788. [Google Scholar] [CrossRef]
  39. Moghanni Alghalandis, H.; Langi, V.; Pun, L.; Rubio Ruiz, R.A.; Isakov, M.; Hokka, M. The effects of strain rate, adiabatic heating, and stress/strain state on strain-induced martensitic transformation in metastable austenitic stainless steel: Experimental and Numerical study. Mater. Sci. Eng. A 2025, 947, 149196. [Google Scholar] [CrossRef]
  40. Varanasi, R.S.; Zaefferer, S.; Sun, B.; Ponge, D. Localized deformation inside the Lüders front of a medium manganese steel. Mater. Sci. Eng. A 2021, 824, 141816. [Google Scholar] [CrossRef]
  41. Li, Z.C.; Ding, H.; Misra, R.D.K.; Cai, Z.H. Deformation behavior in cold-rolled medium-manganese TRIP steel and effect of pre-strain on the Lüders bands. Mater. Sci. Eng. A 2017, 679, 230–239. [Google Scholar] [CrossRef]
  42. Callahan, M.; Hubert, O.; Hild, F.; Perlade, A.; Schmitt, J.H. Coincidence of strain-induced TRIP and propagative PLC bands in Medium Mn steels. Mater. Sci. Eng. A 2017, 704, 391–400. [Google Scholar] [CrossRef]
  43. Kozłowska, A.; Grzegorczyk, B.; Morawiec, M.; Grajcar, A. Explanation of the PLC Effect in Advanced High-Strength Medium-Mn Steels. A Review. Materials 2019, 12, 4175. [Google Scholar] [CrossRef] [PubMed]
  44. Sun, B.; Vanderesse, N.; Fazeli, F.; Scott, C.; Chen, J.; Bocher, P.; Jahazi, M.; Yue, S. Discontinuous strain-induced martensite transformation related to the Portevin-Le Chatelier effect in a medium manganese steel. Scr. Mater. 2017, 133, 9–13. [Google Scholar] [CrossRef]
  45. Wang, X.G.; Wang, L.; Huang, M.X. Kinematic and thermal characteristics of Lüders and Portevin-Le Châtelier bands in a medium Mn transformation-induced plasticity steel. Acta Mater. 2017, 124, 17–29. [Google Scholar] [CrossRef]
  46. Bhowmik, N.; Ghosh, S.; Mandal, S.; Haldar, A.; Chattopadhyay, P.P. Genesis of plasticity-induced serrated metal flow in medium-Mn steel. Calphad 2022, 77, 102425. [Google Scholar] [CrossRef]
  47. Ahmed, S.; Penttilä, J.; Rämö, J.; Honkanen, M.; Kuokkala, V.T.; Oja, O.; Peura, P. Occurrence of dynamic strain aging in intercritically annealed low carbon high aluminum medium manganese steels. Mater. Sci. Eng. A 2022, 856, 144011. [Google Scholar] [CrossRef]
  48. Zheng, C.; Yu, C.; Sun, Y.; Li, S.; Zhang, M.; Liu, L.; Sun, J. Correlation between discontinuous and continuous mechanical behavior and austenite microstructure in 0.06C-9Mn medium-manganese steel. Mater. Sci. Eng. A 2025, 931, 148198. [Google Scholar] [CrossRef]
  49. Sun, B.; Da Silva, A.K.; Wu, Y.; Ma, Y.; Chen, H.; Scott, C.; Ponge, D.; Raabe, D. Physical metallurgy of medium-Mn advanced high-strength steels. Int. Mater. Rev. 2023, 68, 786–824. [Google Scholar] [CrossRef]
  50. Zhang, M.; Chen, H.; Wang, Y.; Wang, S.; Li, R.; Li, S.; Wang, Y.D. Deformation-induced martensitic transformation kinetics and correlative micromechanical behavior of medium-Mn transformation-induced plasticity steel. J. Mater. Sci. Technol. 2019, 35, 1779–1786. [Google Scholar] [CrossRef]
  51. Lamari, M.; Allain, S.Y.P.; Geandier, G.; Ponçot, M.; Perlade, A.; Zhu, K. Behavior of TRIP-aided medium Mn steels investigated by in situ synchrotron X-ray diffraction experiments and microstructure-based micromechanical modelling. Int. J. Plast. 2024, 173, 103866. [Google Scholar] [CrossRef]
  52. Lamari, M.; Allain, S.Y.P.; Geandier, G.; Hell, J.C.; Perlade, A.; Zhu, K. In Situ Determination of Phase Stress States in an Unstable Medium Manganese Duplex Steel Studied by High-Energy X-ray Diffraction. Metals 2020, 10, 1335. [Google Scholar] [CrossRef]
  53. Chandran, S.; Verleysen, P. Non-monotonic plasticity and fracture in DP1000: Stress-state, strain-rate and temperature influence. Int. J. Mech. Sci. 2024, 267, 109011. [Google Scholar] [CrossRef]
  54. ASTM E562/E562M; Standard Test Method for Determining Volume Fraction by Systematic Manual Point Count. ASTM International: West Conshohocken, PA, USA, 2019.
  55. Meyer, M.D.; Vanderschueren, D. The Characterization of Retained Austenite in TRIP Steels by X-Ray Diffraction. In Proceedings of the 41st Mechanical Working and Steel Processing Conference, Baltimore, MA, USA, 24–27 October 1999. [Google Scholar]
  56. Pontillo, A.; Lonardi, C.; Chandran, S.; Vercruysse, F.; Corallo, L.; Verleysen, P. Experimental study of the stress state and strain rate dependent mechanical behaviour of TRIP-assisted steels. EPJ Web Conf. 2021, 250, 05003. [Google Scholar] [CrossRef]
  57. Schreier, H.; Orteu, J.J.; Sutton, M.A. Image Correlation for Shape, Motion and Deformation Measurements: Basic Concepts, Theory and Applications; Springer: Boston, MA, USA, 2009; ISBN 978-0-387-78746-6. [Google Scholar]
  58. Jones, E.; Iadicola, M.; Bigger, R.; Blaysat, B.; Boo, C.; Grewer, M.; Hu, J.; Jones, A.; Klein, M.; Lava, P.; et al. A Good Practices Guide for Digital Image Correlation, 1st ed.; International Digital Image Correlation Society: Irmo, SC, USA, 2018. [Google Scholar]
  59. Hashiguchi, K.; Yamakawa, Y. Introduction to Finite Strain Theory for Continuum Elasto-Plasticity, 1st ed.; Wiley: Hoboken, NJ, USA, 2012; ISBN 978-1-119-95185-8. [Google Scholar]
  60. ASTM E517; Standard Test Method for Plastic Strain Ratio r for Sheet Metal. ASTM International: West Conshohocken, PA, USA, 2018.
  61. Rodriguez, P. Serrated plastic flow. Bull. Mater. Sci. 1984, 6, 653–663. [Google Scholar] [CrossRef]
  62. Yan, S.; Yu, Z.; Liang, T.; Wang, S.; Li, W.; Tao, X.; Liu, X. Unusual step-like stress flow behavior and mechanisms of a 1.3 GPa grade medium-Mn steel with 51.2 % ductility. Mater. Des. 2023, 235, 112380. [Google Scholar] [CrossRef]
  63. Yu, K.; Hou, L.; Guo, M.; Li, D.; Huang, D.; Zhuang, L.; Zhang, J.; Wu, P. A method for determining r-value of aluminum sheets with the Portevin-Le Chatelier effect. Mater. Sci. Eng. A 2021, 814, 141246. [Google Scholar] [CrossRef]
  64. Cazacu, O.; Rodríguez-Martínez, J.A. Effects of plastic anisotropy on localization in orthotropic materials: New explicit expressions for the orientation of localization bands in flat specimens subjected to uniaxial tension. J. Mech. Phys. Solids 2019, 126, 272–284. [Google Scholar] [CrossRef]
  65. Corallo, L.; Revil-Baudard, B.; Cazacu, O.; Verleysen, P. Role of anisotropy on strain localization at high-strain rates in Ti6Al4V. Eur. J. Mech. A Solids 2023, 97, 104856. [Google Scholar] [CrossRef]
  66. Chung, J.H.; Jeon, J.B.; Chang, Y.W. Work-hardening and ductility enhancement mechanism of cold rolled multiphase TRIP steels. Met. Mater. Int. 2010, 16, 533–541. [Google Scholar] [CrossRef]
  67. Mansourinejad, M.; Ketabchi, M. Influence of Strain State on the Kinetics of Martensitic Transformation Induced Plasticity (TRIP) in AISI 304 Stainless Steel. Steel Res. Int. 2018, 89, 1700359. [Google Scholar] [CrossRef]
Figure 1. Schematic representation of (a) simple annealing and (b) double annealing heat treatments. CR denotes the cold-rolled starting microstructure, and FM denotes the fully martensitic condition obtained after austenitisation and quenching.
Metals 16 00177 g001
Figure 2. SEM micrographs of (a) SA700 and (b) DA900700 conditions at 5000× magnification. The SA700 microstructure shows a globular morphology, while DA900700 exhibits a fibrous morphology with elongated features.
Metals 16 00177 g002
Figure 3. Geometries and key dimensions of the tensile specimens. (a) Dogbone ( η ≈ 0.33, θ ¯ ≈ 1): GL = 6 mm, W = 3 mm, R = 2 mm. (b) In-plane shear ( η ≈ 0, θ ¯ ≈ 0): L = 3 mm, e = 0.9 mm, R = 1.2 mm. (c) Plane strain ( η ≈ 0.58, θ ¯ ≈ 0): W = 3.5 mm, R = 1 mm. Dimensions optimised for the target stress states are highlighted in red.
Metals 16 00177 g003
Figure 4. (a) Engineering stress vs. equivalent strain curves for SA700 (solid lines) and DA900700 (dashed lines) conditions tested using three tensile geometries under quasi-static loading: dogbone (blue), plane strain (orange), and in-plane shear (red). (b) Zoomed view of the dogbone response for SA700 and DA900700 conditions, showing Type A and Type D serrations.
Metals 16 00177 g004
Figure 5. True work-hardening rate as a function of true plastic strain for the uniaxial dogbone specimens of the SA700 and DA900700 steels.
Metals 16 00177 g005
Figure 6. Strain-rate maps along the gauge section obtained by DIC for (a) dogbone, (b) plane strain, and (c) in-plane shear geometries in the continuous tests. Left: SA700 condition; right: DA900700 condition. The white curves represent the corresponding engineering stress evolution.
Metals 16 00177 g006
Figure 7. Zoomed strain-rate maps of the dogbone specimens during continuous loading, highlighting the bands selected for quantitative characterisation. (a) SA700 condition: one Lüders band (LB) followed by PLC bands SB1–SB4. The white arrows indicate the nucleation sites associated with the formation of the Lüders band (b) DA900700 condition: PLC bands SB1–SB6 appearing immediately after yielding. For each condition, the right panels show examples of bands. Band SB1 illustrates the definitions of band width and inclination angle ( β ).
Metals 16 00177 g007
Figure 8. PLC-band propagation velocity as a function of true plastic strain for uniaxial dogbone specimens in the SA700 and DA900700 conditions. Symbols correspond to individual bands, and dashed lines indicate linear fits. The parameter m denotes the slope of the linear fits.
Metals 16 00177 g008
Figure 9. Evolution of the Lankford coefficient as a function of true plastic strain for the SA700 and DA900700 conditions. The vertical dashed line highlights the r 15 values for comparison.
Metals 16 00177 g009
Figure 10. Engineering stress vs. equivalent strain curves for interrupted (solid lines) and continuous (dashed lines) tensile tests of (a) SA700 steel and (b) DA900700 steel. One interrupted test per geometry is shown, with unloading at different plastic strain levels. Results are shown for dogbone (blue), plane strain (orange), and in-plane shear (red).
Metals 16 00177 g010
Figure 11. Strain-rate maps along the gauge section obtained by DIC for (a) dogbone, (b) plane strain, and (c) in-plane shear geometries in the interrupted tests. Left: SA700 steel; right: DA900700 steel. The white curves represent the corresponding engineering stress evolution.
Metals 16 00177 g011
Figure 12. Normalised transformed austenite fraction as a function of equivalent plastic strain for interrupted tensile tests of (a) SA700 steel and (b) DA900700 steel. Results are shown for dogbone (blue squares), plane strain (orange circles), and in-plane shear (red triangles) geometries. The continuous lines represent model fits to the experimental data.
Metals 16 00177 g012
Figure 13. Surface representation of the fitted transformation rate parameter k ( η , θ ¯ ) (Equation (3)) for the SA700 (red) and DA900700 (blue) conditions. Solid markers correspond to the experimentally determined k values for each specimen geometry. The vertical arrows indicate the proportional increase in k when changing the treatment condition for the corresponding stress state.
Metals 16 00177 g013
Table 1. Chemical composition of the medium-Mn lab-grade steel (major elements in wt. %, trace elements in ppm as indicated).
MaterialCMnSiAlNSOFe
MedMn-Steel0.241.50.828 ppm16 ppm11 ppmBal.
Table 2. Phase fractions of the SA700 and DA900700 microstructures.
ConditionFerrite ± SD (%)Retained Austenite ± SD (%)Martensite ± SD (%)
SA70052.3 ± 2.217.6 ± 2.729.9 ± 2.4
DA90070049.4 ± 2.713.5 ± 1.537.1 ± 1.5
Table 3. Mechanical parameters extracted from engineering stress–equivalent strain curves for the SA700 and DA900700 steels under different stress states. For the SA700 dogbone sample, both upper and lower yield strengths are reported (upper/lower).
ConditionGeometryYield Strength (MPa)Maximum Engineering Stress (MPa)Strain at Maximum
Engineering Stress (%)
Failure Strain (%)
SA700Dogbone800 ± 20/757 ± 151184 ± 1823.7 ± 1.425.4 ± 0.5
Plane Strain-1262 ± 1815.6 ± 116.7 ± 1
In-Plane Shear-845 ± 2952.7 ± 2.655.5 ± 2.8
DA900700Dogbone516 ± 201167 ± 2618.9 ± 1.735.3 ± 0.1
Plane Strain-1307 ± 4714.3 ± 323.3 ± 1
In-Plane Shear-821 ± 1760.8 ± 2.963.6 ± 2.9
Table 4. Propagation velocities of Lüders and PLC bands measured from DIC strain-rate maps in the dogbone specimens of SA700 and DA900700 steels under quasi-static loading.
ConditionBand LabelWidth (mm) β (°)Velocity (mm/s)
SA700LB1.4900.13
SB11.4700.68
SB21.1620.58
SB31.2620.42
SB41.3630.38
DA900700SB11.2560.75
SB21.2580.6
SB30.9570.53
SB40.9560.53
SB50.8560.48
SB61560.46
Table 5. Beese–Mohr/JMAK model parameters for SA700 and DA900700 steels fitted to the transformation data of each specimen geometry.
Geometry n SA700DA900700
f s k R2 f s k R2
Dogbone11.0014.60.990.9627.680.98
Plane Strain11.0011.90.980.9620.30.97
In-Plane Shear11.002.90.970.965.40.96
Table 6. Calibrated parameters of the stress-state-dependent k formulation for the SA700 and DA900700 conditions.
ParameterSA700DA900700
k 0 2.95.4
α η 15.525.7
α θ ¯ 6.613.8
Disclaimer/Publisher’s Note: The statements, opinions and data contained in all publications are solely those of the individual author(s) and contributor(s) and not of MDPI and/or the editor(s). MDPI and/or the editor(s) disclaim responsibility for any injury to people or property resulting from any ideas, methods, instructions or products referred to in the content.