Article

Integrated Modeling and Multi-Criteria Analysis of the Turning Process of 42CrMo4 Steel Using RSM, SVR with OFAT, and MCDM Techniques


by
Dejan Marinkovic
1,
Kenan Muhamedagic
2,
Simon Klančnik
3,*,
Aleksandar Zivkovic
1,
Derzija Begic-Hajdarevic
2,* and
Mirza Pasic
2
1
Faculty of Technical Sciences, University of Novi Sad, Trg Dositeja Obradovica 6, 21000 Novi Sad, Serbia
2
Faculty of Mechanical Engineering, University of Sarajevo, Vilsonovo Setaliste 9, 71000 Sarajevo, Bosnia and Herzegovina
3
Faculty of Mechanical Engineering, University of Maribor, Smetanova Ulica 17, 2000 Maribor, Slovenia
*
Authors to whom correspondence should be addressed.
Metals 2026, 16(2), 131; https://doi.org/10.3390/met16020131
Submission received: 26 December 2025 / Revised: 19 January 2026 / Accepted: 21 January 2026 / Published: 23 January 2026

Abstract

This paper analyzes different approaches for the mathematical modeling and optimization of process parameters in the hard turning process of 42CrMo4 steel using a hybrid approach combining response surface methodology (RSM), multi-criteria decision making (MCDM), and machine learning through, support vector regression (SVR) with one-factor-at-a-time (OFAT) sensitivity analysis. Controlled process parameters such as cutting speed, depth of cut, feed, and insert radius are applied to conduct the experiments based on a full factorial experimental design. RSM was used to develop models that describe the effect of controlled parameters on surface roughness and cutting forces. Special emphasis was placed on the analysis of standardized residuals to evaluate the predictive capabilities of the RSM-developed model on an unseen data set. For all four outputs considered, analysis of the standardized residuals shows that over 97% of the points lie within ±3 standard deviations. A multi-criteria optimization technique was applied to establish an optimal combination of input parameters. The SVR model had high performance for all outputs, with coefficient of determination values between 89.91% and 99.39%, except for surface roughness on the test set, with a value of 9.92%. While the SVR model achieved high predictive accuracy for cutting forces, its limited generalization capability for surface roughness highlights the higher complexity and stochastic nature of surface formation mechanisms in the turning process. OFAT analysis showed that feed rate and depth of cut have been shown to be the most important input variables for all analyzed outputs.

1. Introduction

In modern manufacturing, there is an increasing demand for improved efficiency, productivity, and machining quality, especially when dealing with alloy steels such as 42CrMo4. This steel is characterized by excellent mechanical properties, including high toughness, hardness, and fatigue resistance, which makes it widely used in industry for the production of various critical components such as shafts, gears, and transmission parts. However, machining such high-hardness materials presents a significant challenge, particularly due to increased cutting forces, accelerated tool wear, and the need to achieve minimal surface roughness. Therefore, intensive research has been focused on optimizing cutting parameters, as well as developing accurate models for predicting cutting forces and surface quality when machining these steels. Input process parameters such as cutting speed, feed rate, depth of cut, and tool radius have a direct influence on the turning process performance [1,2,3]. Kumar et al. [1] analyzed the effect of cutting parameters on the flank wear of cutting tools during the turning process of EN36B steel. It was found that the depth of cut has the most significant effect on the tool flank wear. Özdemir et al. [2], through statistical analysis based on Taguchi mixed-level parameter design (L18) and the response surface methodology (RSM), found that the depth of cut has the most significant effect on cutting forces, while feed rate is the dominant factor affecting surface roughness. The impact of cutting parameters on surface roughness and cutting forces in the turning process of 90MnCrV7 steel was analyzed in [3], using feed-forward neural network models and SHAP (SHapley Additive exPlanations) analysis. Modern machining processes typically involve multiple output responses that should be optimized simultaneously, analyzing various input parameters, material and tool types, vibrations, and other factors that directly affect process performance. In [4], multi-objective optimization and evaluation of different cutting tools conducted in the dry turning of AISI 4140 steel using RSM and the MOALO (Multi-Objective Ant Lion Optimizer) algorithm were presented. The results demonstrated that optimal combinations of input parameters can reduce cutting forces while simultaneously improving surface roughness. To enhance the performance of machining processes, multi-objective optimization has become an essential approach in research focused on machining steels [5,6]. The combined analysis of multiple output performance measures, such as surface roughness, cutting forces, temperature, material removal rate, and tool wear, requires the application of suitable optimization methods capable of simultaneously optimizing several often-conflicting objectives. The gray relational analysis (GRA) method has proven to be highly effective in optimizing multiple output characteristics in different machining processes. In [7], the authors used a combination of the Taguchi experimental design and GRA to optimize surface roughness and material removal rate. The GRA methodology enabled the optimization of conflicting objectives and demonstrated a high degree of reliability in decision making under complex manufacturing conditions. The research conducted by Kumar et al. [8] focused on the effect of cutting speed, feed rate, and depth of cut with the goal of optimizing cutting forces and surface roughness using the GRA method during the duplex turning process of Ti-alloy. Feed rate was identified as the most influential input parameter. Several authors [9,10,11] have applied GRA in combination with the Taguchi method to simultaneously optimize surface roughness and material removal rate. Their results indicate a significant influence of parameters such as cutting speed, feed rate, and depth of cut on both output characteristics, while GRA proved effective in determining the optimal parameter combinations. This approach has been successfully applied to different materials, including Al-6061 aluminum [11], high-chromium cast iron [12], and austenitic stainless steel 303 [13]. Sristi et al. [14] compared GRA with other MCDM methods in hard turning, demonstrating that while GRA produces stable results, they are slightly less accurate compared to more advanced techniques. Nonetheless, its simplicity is a key advantage in industrial environments. Furthermore, in [15,16], the integration of GRA with the TOPSIS (Technique for Order Preference by Similarity to Ideal Solution) method is demonstrated, enhancing the robustness and reliability of the optimization process. The TOPSIS method is widely used in engineering optimization due to its ability to efficiently rank multiple alternatives based on their closeness to the ideal solution and distance from the worst-case solution. In the study by Umamaheswarrao et al. [17], TOPSIS was applied for the multi-criteria optimization of parameters in the dry hard turning of AISI 52100 steel. The authors analyzed the effects of cutting speed, feed rate, and depth of cut on surface roughness, cutting force, and workpiece surface temperature. The results demonstrated that the optimal combination of cutting conditions significantly reduces undesirable effects while enhancing machining efficiency. A similar application of the method was presented by Rathod et al. [18] through an experimental analysis of turning stainless steel SS304. By combining the Taguchi design with the TOPSIS method, simultaneous optimization of multiple responses was achieved, resulting in a significant reduction in surface roughness and cutting forces. An innovative approach was introduced in [19], where a hybrid optimization model integrating TOPSIS with the sine cosine algorithm (SCA) was developed. The model was applied to the machining of medium-hardened steel, confirming its superiority in efficiently balancing conflicting objectives compared to classical methods. Finally, the study by Lakshmanan et al. [20] addressed turning optimization considering surface roughness, cutting force, and temperature using the TOPSIS approach. The results indicate that proper integration of multi-criteria analysis in selecting cutting parameters substantially contributes to improving overall process performance [21,22]. The GRA, TOPSIS, and PSI (Preference Selection Index) methods are becoming increasingly popular and effective tools for multi-criteria optimization in material removal processes, either alone or in combination with other multi-criteria optimization methods. Rao et al. [21] combined PSI with GRA and desirability functions to simultaneously optimize the multiple output characteristics of the turning process. This hybrid approach facilitated robust evaluation of input parameter effects and improved the reliability of optimization outcomes. In a study by Raja et al. [22], the PSI methodology was used alongside GRA to assess the performance of cryogenically treated tool materials during the turning of AISI 1045 steel. The results highlighted the significant advantage of the PSI method in differentiating machining regimes that lead to lower values of surface roughness and tool wear. Leksycki and Feldshtein [23] applied the PSI methodology in finishing operations to analyze the influence of key machining parameters within the context of nonlinear and unstable turning regimes. The results indicated that the PSI approach enables the identification of optimal machining conditions and clearly distinguishes between stable and unstable regions within the experimental space.
While previous studies have mainly combined RSM and MCDM, this study integrates RSM and support vector regression (SVR) with the one-factor-at-a-time (OFAT) sensitivity analysis and MCDM methods. The integration of RSM and SVR with OFAT for predicting output responses and the MCDM techniques for process optimization represents a hybrid approach aimed at improving the efficiency and quality of machining during hard turning of 42CrMo4 steel. This comprehensive approach not only deepens our understanding of the turning process through mathematical models but also provides a more realistic evaluation by applying an independent test set. SVR was introduced to provide a data-driven nonlinear modeling perspective of the turning process. While RSM offers high interpretability and strong statistical foundations, SVR enables verification of model behavior under fewer structural assumptions and allows for the assessment of nonlinear relationships from a purely machine learning standpoint [24]. The specificity of this study is reflected in the testing of the developed models on an unseen data set, which showed how robust and reliable the developed models are. The reliability and stability of the RSM model in this study are also reflected in the large number of data used for testing, as well as in monitoring the standardized residuals on the test and training data. For all developed models, response surface plots were developed, and standardized residuals plots based on training and test data were used to detect outliers and to analyze the models’ performance in order to gain a clearer understanding of the models’ prediction performance. RSM was used to develop predictive models of the process, but in order to improve the prediction accuracy, a nonlinear SVR approach with OFAT sensitivity analysis was also included in the analysis. Also, in this study, different MCDM methods (hybrid PSI-TOSPIS and GRA) were applied to identify the optimal combination of input parameters, with a comparative analysis of their performance. Practically, this means that the recommended optimal combination of input parameters can be applied with a higher degree of certainty, regardless of the choice of evaluation method.

2. Materials and Methods

Turning experiments were conducted under controlled dry-cutting conditions using a CNC INDEX GU600 lathe (Index, Esslingen, Germany). ISO P-grade cemented carbide inserts (SANDVIK TNMG160408 and SANDVIK TNMG160404) were used for the machining. 42CrMo4 alloy steel was the workpiece used for the present study. The workpieces were prepared with dimensions of 30 mm in diameter and 60 mm in length, while the effective cutting length was maintained at 40 mm. To ensure stability during machining and to reduce potential clamping-related errors and vibrations, each workpiece was pre-machined and securely clamped in soft jaws. A fully factorial experiment was designed with four factors—cutting speed, depth of cut, feed, and the insert radius at different levels (Table 1)—resulting in 240 experimental runs. The input parameter levels were selected to correspond to the semi-finishing and finishing machining of the 42CrMo4 steel.
A customized data acquisition system was developed in MATLAB R2022 to enable simultaneous monitoring and processing of cutting force signals (main cutting force: F c , passive force: F p , feed force: F f ). Cutting forces were measured using a Kistler 9527A dynamometer (Winterthur, Switzerland) mounted on a tool holder. Surface roughness was evaluated in terms of the arithmetic mean deviation of the assessed profile ( R a ), in accordance with ISO 4287:1997 [25]. Measurements were performed using a Mitutoyo Surftest SJ-210 profilometer (Kawasaki, Japan). A cut-off length of 2.5 mm was applied to suppress high-frequency surface irregularities, while an evaluation length of 12.5 mm, corresponding to five consecutive cut-off segments, was selected in accordance with ISO 4288:1996 [26], ensuring the statistical reliability and representativeness of the measured data. The chemical composition of the 42CrMo4 steel noted in Table 2 was determined by optical emission spectrometry, carried out in accordance with SRPS C.A1.011:2004 [27].
RSM was used to develop regression models to predict surface roughness and cutting forces during the turning process of 42CrMo4 alloyed steel. Cutting speed, feed, depth of cut, and insert radius were considered independent variables in the RSM analysis. Out of a total of 240 experimental runs, 192 experimental datapoints (training set), which were randomly selected, were used to create mathematical models, while 48 experimental runs were used to test the models. Statistical analysis was performed at a significance level of 0.05. Analysis of variance (ANOVA) was used to evaluate the statistical significance of the cutting parameters based on F-values and their corresponding p-values. Cutting parameters with p-values less than 0.05 were considered statistically significant. Regression analysis was used to fit the experimental data to a second-order regression model, as follows:
Y = β o + i = 1 n β i x i + i = 1 n β i i x i 2 + i = 1 n 1 j > 1 n β i j x i x j + ε ,
where Y is a response; x i and x j are independent variables; β o is the constant; β i is the linear-term coefficient; β i i is the quadratic term coefficient; β i j is the two-interaction term coefficient; n is the number of independent variables; and ε is the unidentified error.
The reduced quadratic model was developed so that all linear terms were retained regardless of their statistical significance since their presence ensures proper interpretation of quadratic and interaction effects, while non-significant quadratic and interaction terms were omitted [28].
In addition to statistical modeling based on RSM, this study also applied a nonlinear SVR approach for the prediction of surface roughness and cutting forces, where models were developed separately for each output variable using the same data division into training and test sets. The impact of individual input parameters on the output variables was analyzed using OFAT sensitivity analysis, where each input parameter was varied within its experimental range while the remaining parameters were kept at their average values, ensuring methodological consistency with the RSM analysis. OFAT is used to independently confirm, rather than redefine, the parameter importance trends obtained from RSM and ANOVA within a data-driven SVR framework.

3. Results and Discussion

3.1. Prediction of Surface Roughness by RSM

The ANOVA results for the reduced quadratic model for predicting surface roughness ( R a ) are shown in Table 3. The results show that the insert radius has the most significant impact on the surface roughness, followed by depth of cut, while v c shows minimal impact within the considered range. The results show that radius, r , plays a critical role in determining the surface roughness. As the radius, r , increases, R a decreases sharply, as shown in Figure 1a, indicating that the selection of the insert radius is very important to achieving the optimal roughness of the machined surface. By increasing the insert radius, the contact zone between the tool and the workpiece becomes wider, which results in smaller irregularities on the machined surface and a decrease in roughness. The linear term feed is statistically insignificant, but the quadratic term feed is statistically significant, indicating that the relationship between f and R a is nonlinear, as in [29]. The significant interaction effect between depth of cut and feed indicates that the influence of feed depends on the level of depth of cut.
This implies that in determining surface roughness, it is not enough to consider the influence of these parameters individually; their combined effect is important, as shown in Figure 1b. At lower values of f and a p , a smaller surface roughness is achieved, while at lower f and higher a p , as well as at lower a p and higher f , the surface roughness increases significantly. A higher feed results in a significant increase in irregularities that remain visible since the small depth of cut does not contribute to their reduction. When a small feed is combined with a higher depth of cut, the increased contact area and greater intensity of engagement result in a significant increase in surface roughness. The F = 25.8 and the p-value of 0.000 for the model indicate that the surface roughness is dependent on the considered input parameters. The obtained values of the coefficients R 2 = 45.56%, R a d j 2 = 43.79%, and R p r e d 2 = 41.15% indicate that the model is moderately to solidly reliable, relatively well adjusted, and partially predictive.
The reduced quadratic model for predicting R a is given by
R a = 8.80 + 0.00462 v c 45.9 f + 5.21 a p 11.005 r + 284 f 2 29.38 f · a p
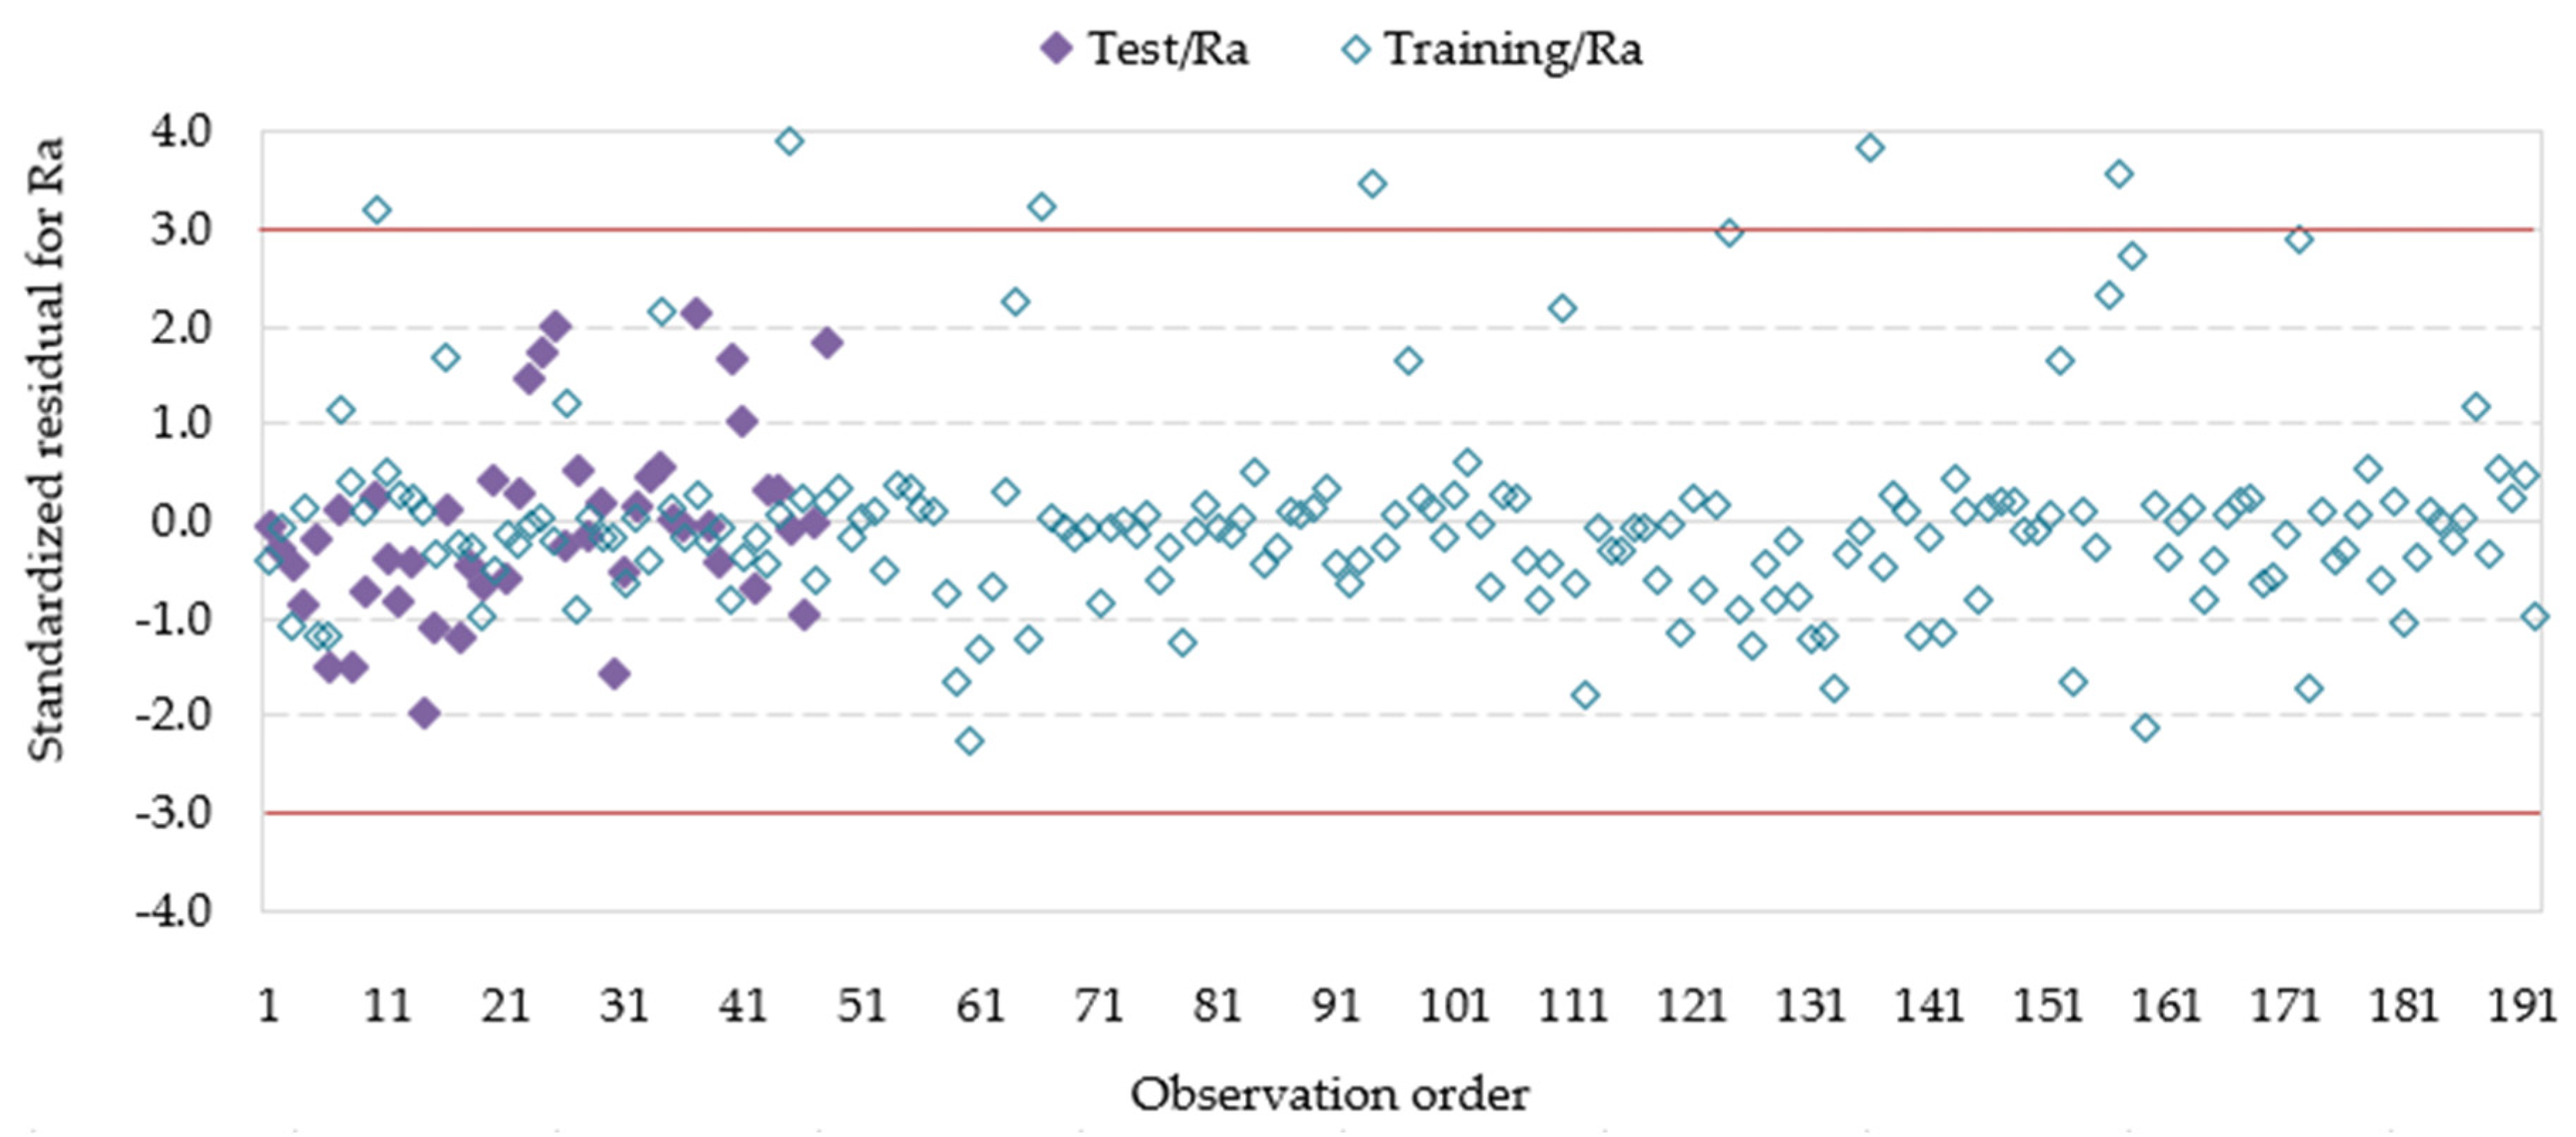
Figure 2 shows the standardized residuals for surface roughness for the training and test sets. It can be seen that six points in the training set are outside the ±3 standardized residuals. So, these 3% of the total 192 training data are outside of the limits and can be assumed to be random outliers. There are no points outside the ±3 standardized residuals in the test set, indicating that the model performs well on the test data without extreme outliers.

3.2. Prediction of Main Cutting Force by RSM

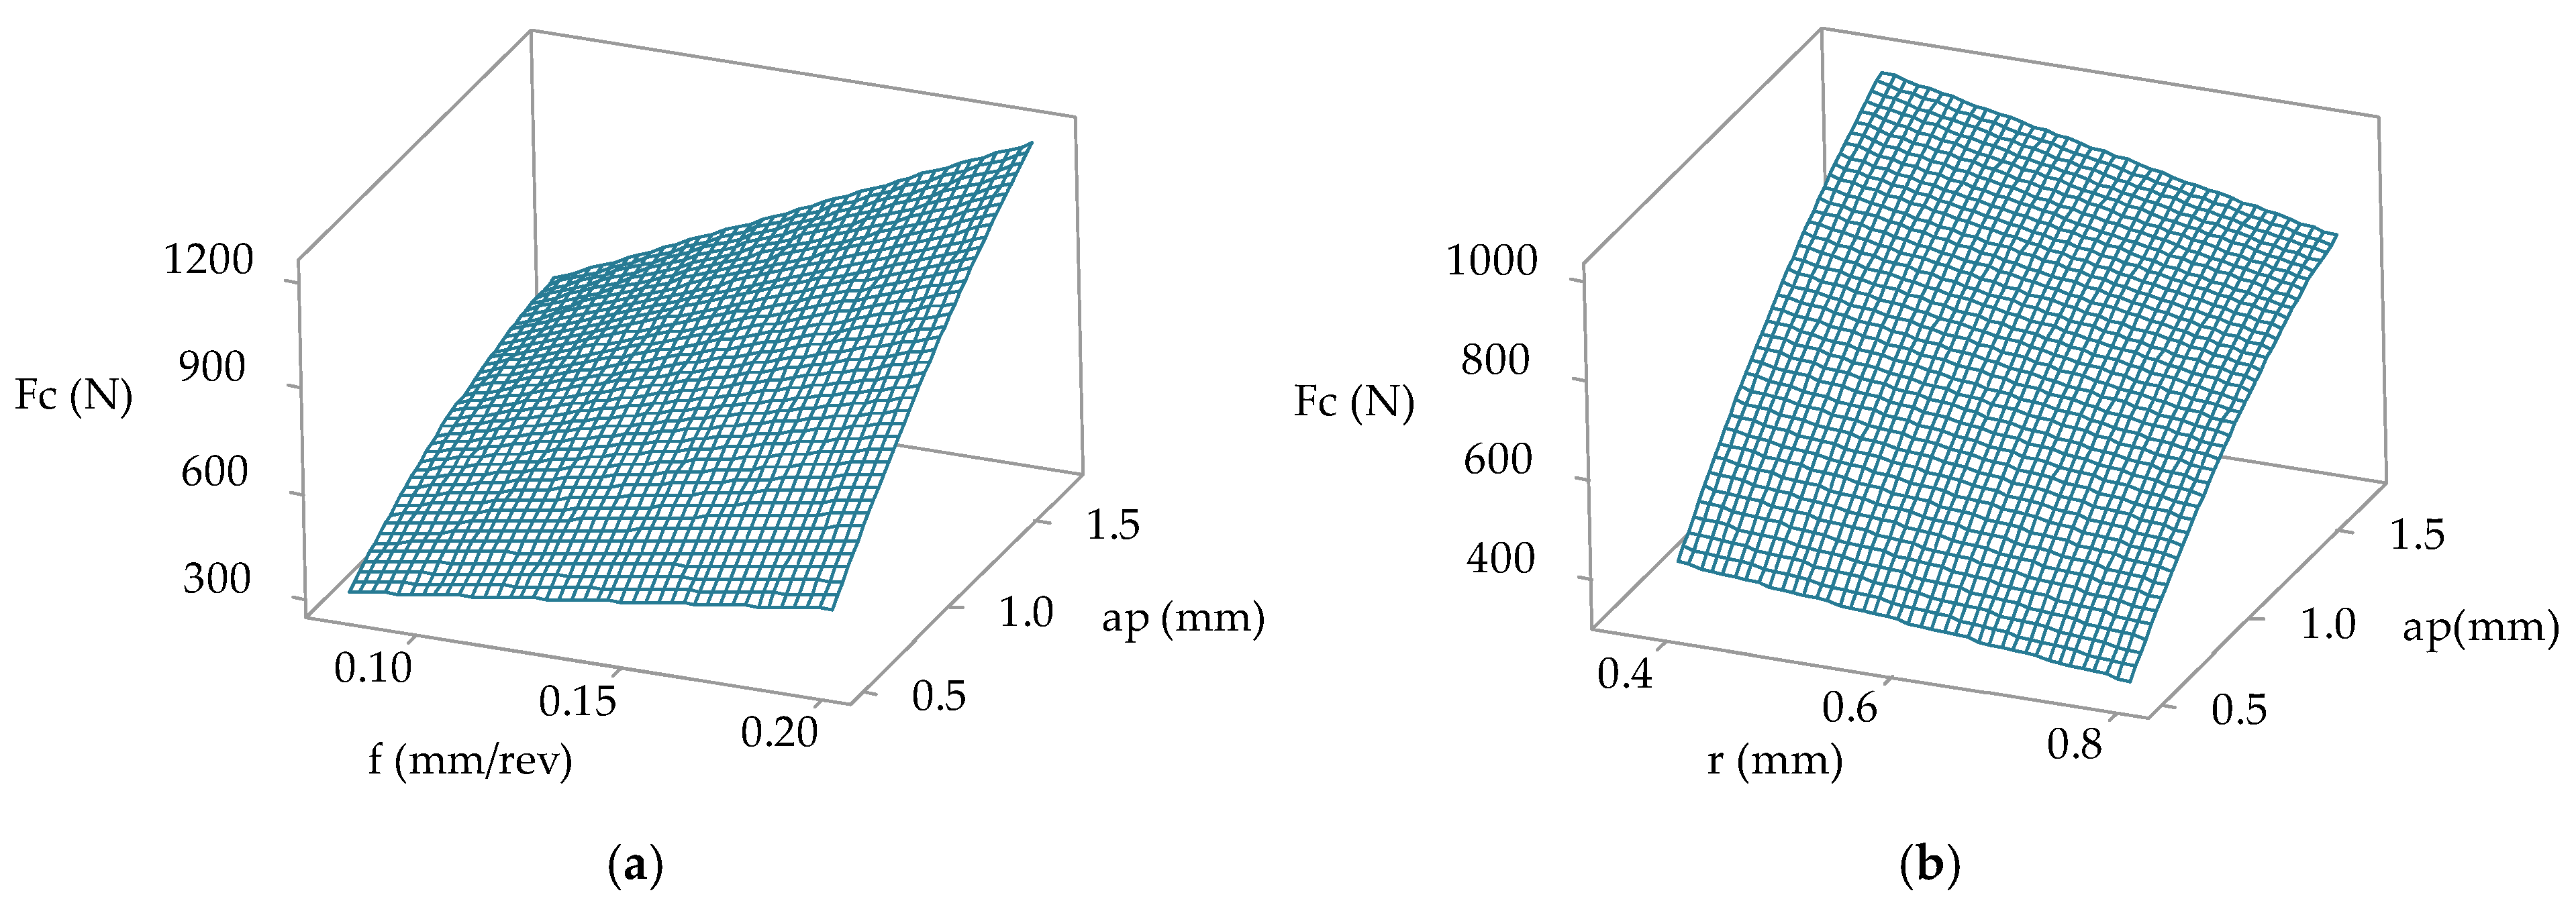
Table 4 shows the ANOVA results for the reduced quadratic model for predicting the main cutting force ( F c ). The results show that a p has the most significant impact on F c , followed by the feed and the insert radius. In Figure 3, it can be seen that by increasing the depth of cut and feed, the main cutting force increases, while by increasing the insert radius, a slight decrease in the main cutting force can be observed. The increase in the main cutting force with increasing depth of cut and feed results from the larger volume of the material engaged in the plastic deformation zone being removed, which leads to more intense shearing in the primary zone, an expanded tool–workpiece contact area, and higher friction. The slight decrease in cutting force caused by increasing the insert radius can be explained by the redistribution of load, a more stable cutting process, and the partial influence of soft jaws during workpiece clamping, which reduces vibrations and errors. The cutting speed is statistically insignificant and has minimal impact within the considered range. The significant interaction effect between feed and depth of cut indicates that the influence of feed depends on the level of depth of cut. As a p and f increase, F c increases, indicating that the selection of these two parameters is very important for minimizing the main cutting force (Figure 3a). The quadratic term a p is statistically significant, indicating that the relationship between a p and F c is nonlinear. The F-value of 337.86 and the p-value of 0.000 for the model indicate a significant relationship between F c and the input parameters. The obtained values of the coefficients R 2 = 93.66%, R a d j 2 = 93.38%, and R p r e d 2 = 92.9% indicate that the model is very reliable, well adjusted, and predictive. The reduced quadratic model for predicting F c is given by
F c = 28.1 0.1514   v c + 1261   f + 476   a p + 172.1   r 160.4   a p 2 + 3013   f · a p 2270   f · r 188.4   a p · r
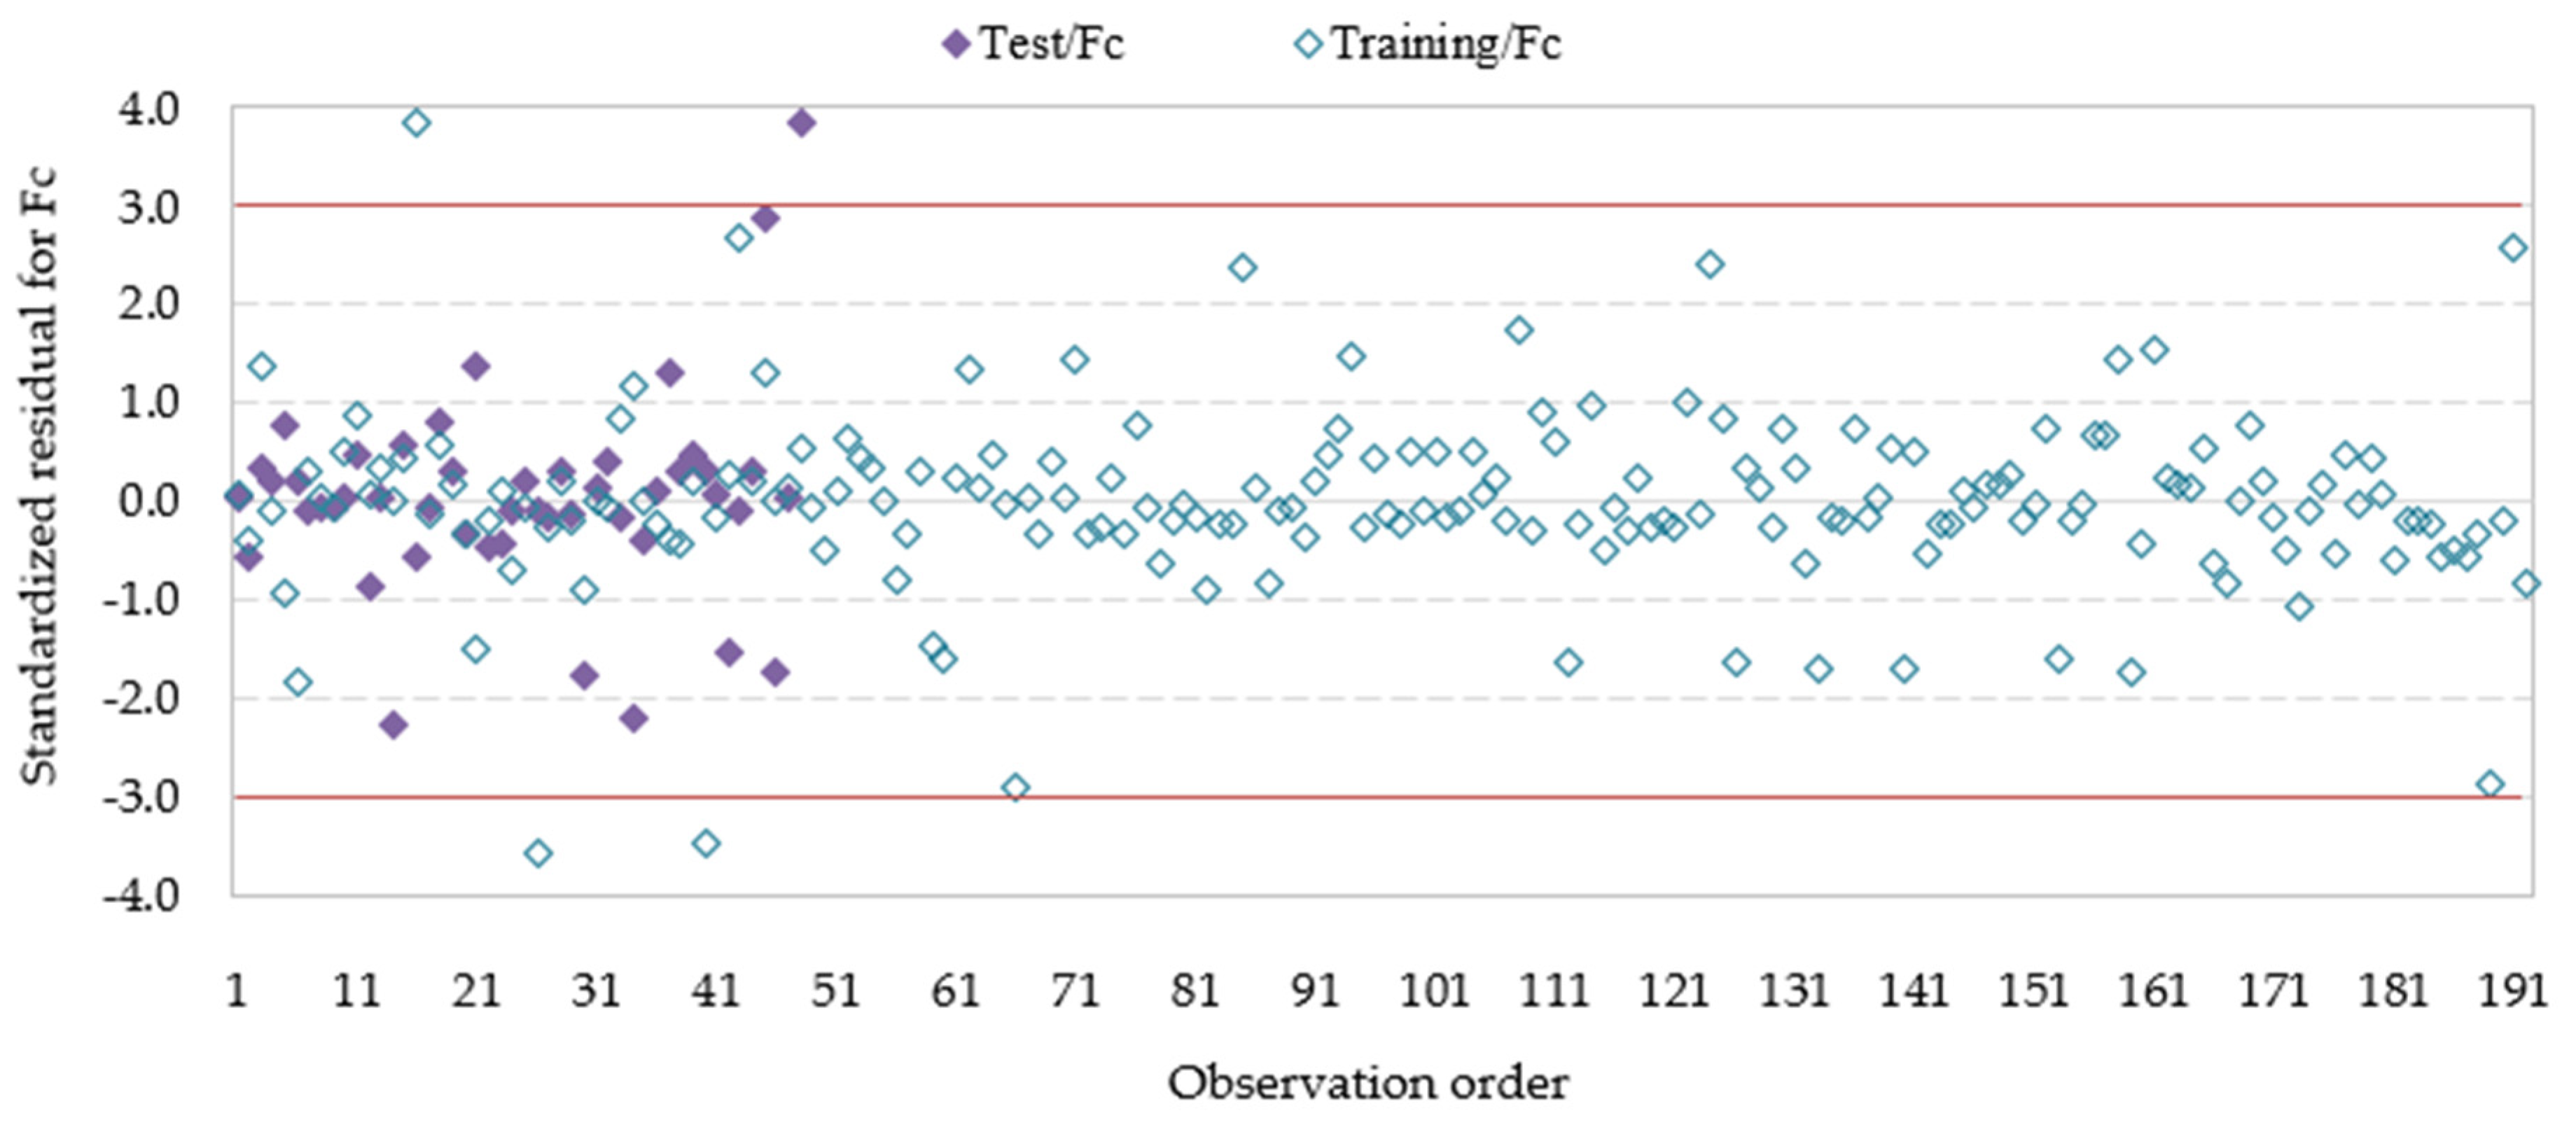
Analysis of the standardized residuals showed that there are four points outside the ±3 limits (Figure 4), representing less than 2% of the total data set; this does not indicate serious deviations. Combined with the high coefficients, R 2 , and low number of outliers, this means that the model is not random but statistically and practically relevant.

3.3. Prediction of Passive Force by RSM

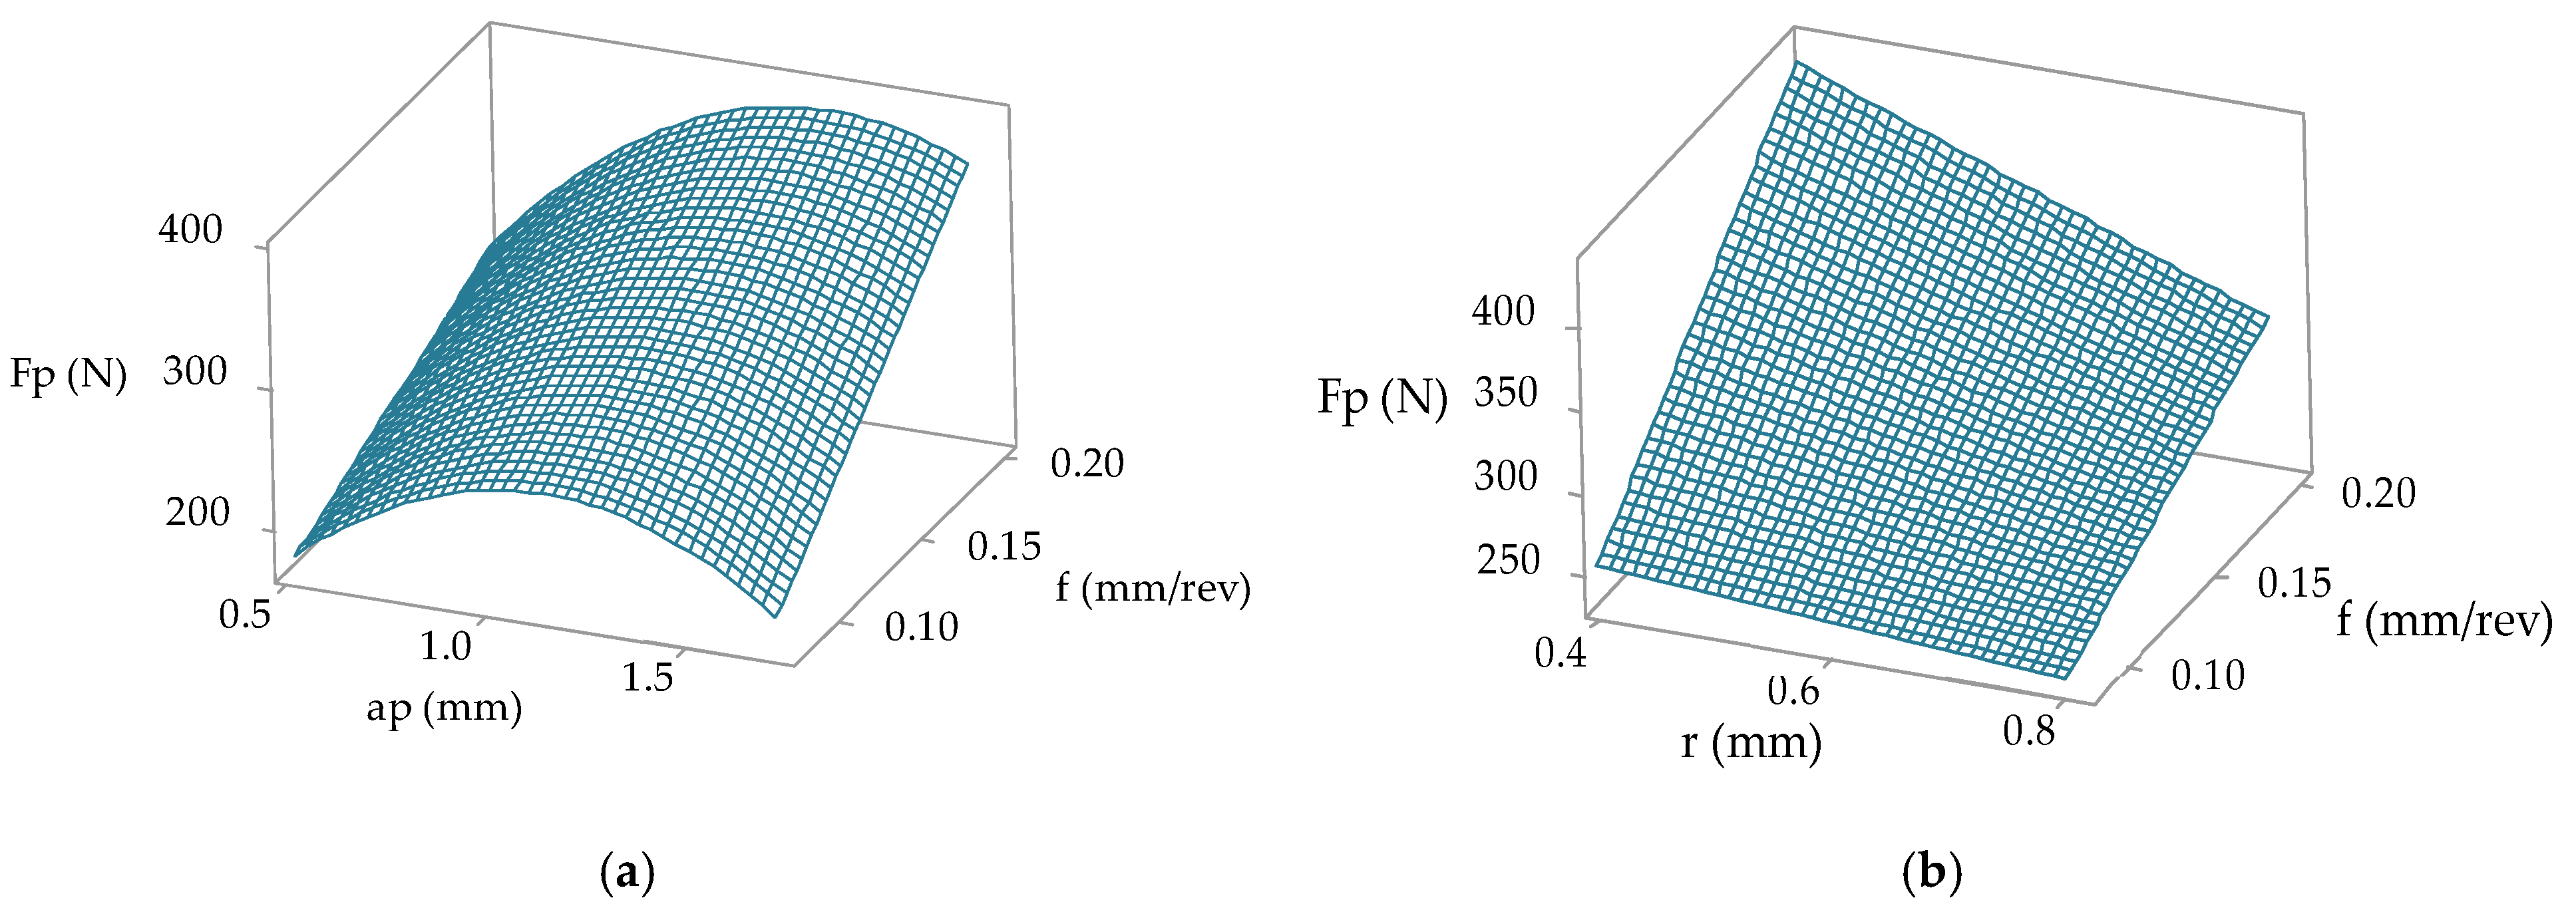
The ANOVA results for the reduced quadratic model for passive force ( F p ) prediction are listed in Table 5. The results showed that all considered input parameters are statistically significant. The feed has the most significant impact on F p , followed by the insert radius and depth of cut, and then the cutting speed. The quadratic term of depth of cut is statistically significant, indicating that the relationship between a p   and F p is nonlinear. This nonlinearity is more pronounced at a lower feed, as can be seen in Figure 5a. As the feed increases, F p increases because more material is deformed and the tool–workpiece contact zone becomes larger. The increase in F p is especially notable at a smaller insert radius (Figure 5b), which can be explained by the fact that at a higher feed, the cutting tool removes more material, and a smaller r   can cause vibrations and instability in the process, which leads to a significant increase in passive force. The results indicate a statistically significant model, with F = 38.44 and p = 0.000. This confirms the existence of a significant relationship between the passive force and the input parameters. The obtained values of the coefficients R 2 = 62.69%, R a d j 2 = 61.06%, and R p r e d 2 = 58.79% indicate that the model is stable and reliable for prediction. The reduced quadratic model for predicting F p is given by
F p = 250.3 + 0.2375   v c + 1382   f + 485.2   a p + 333.5   r 182.6   a p 2 + 705   f · a p 1794   f · r 218.4   a p · r
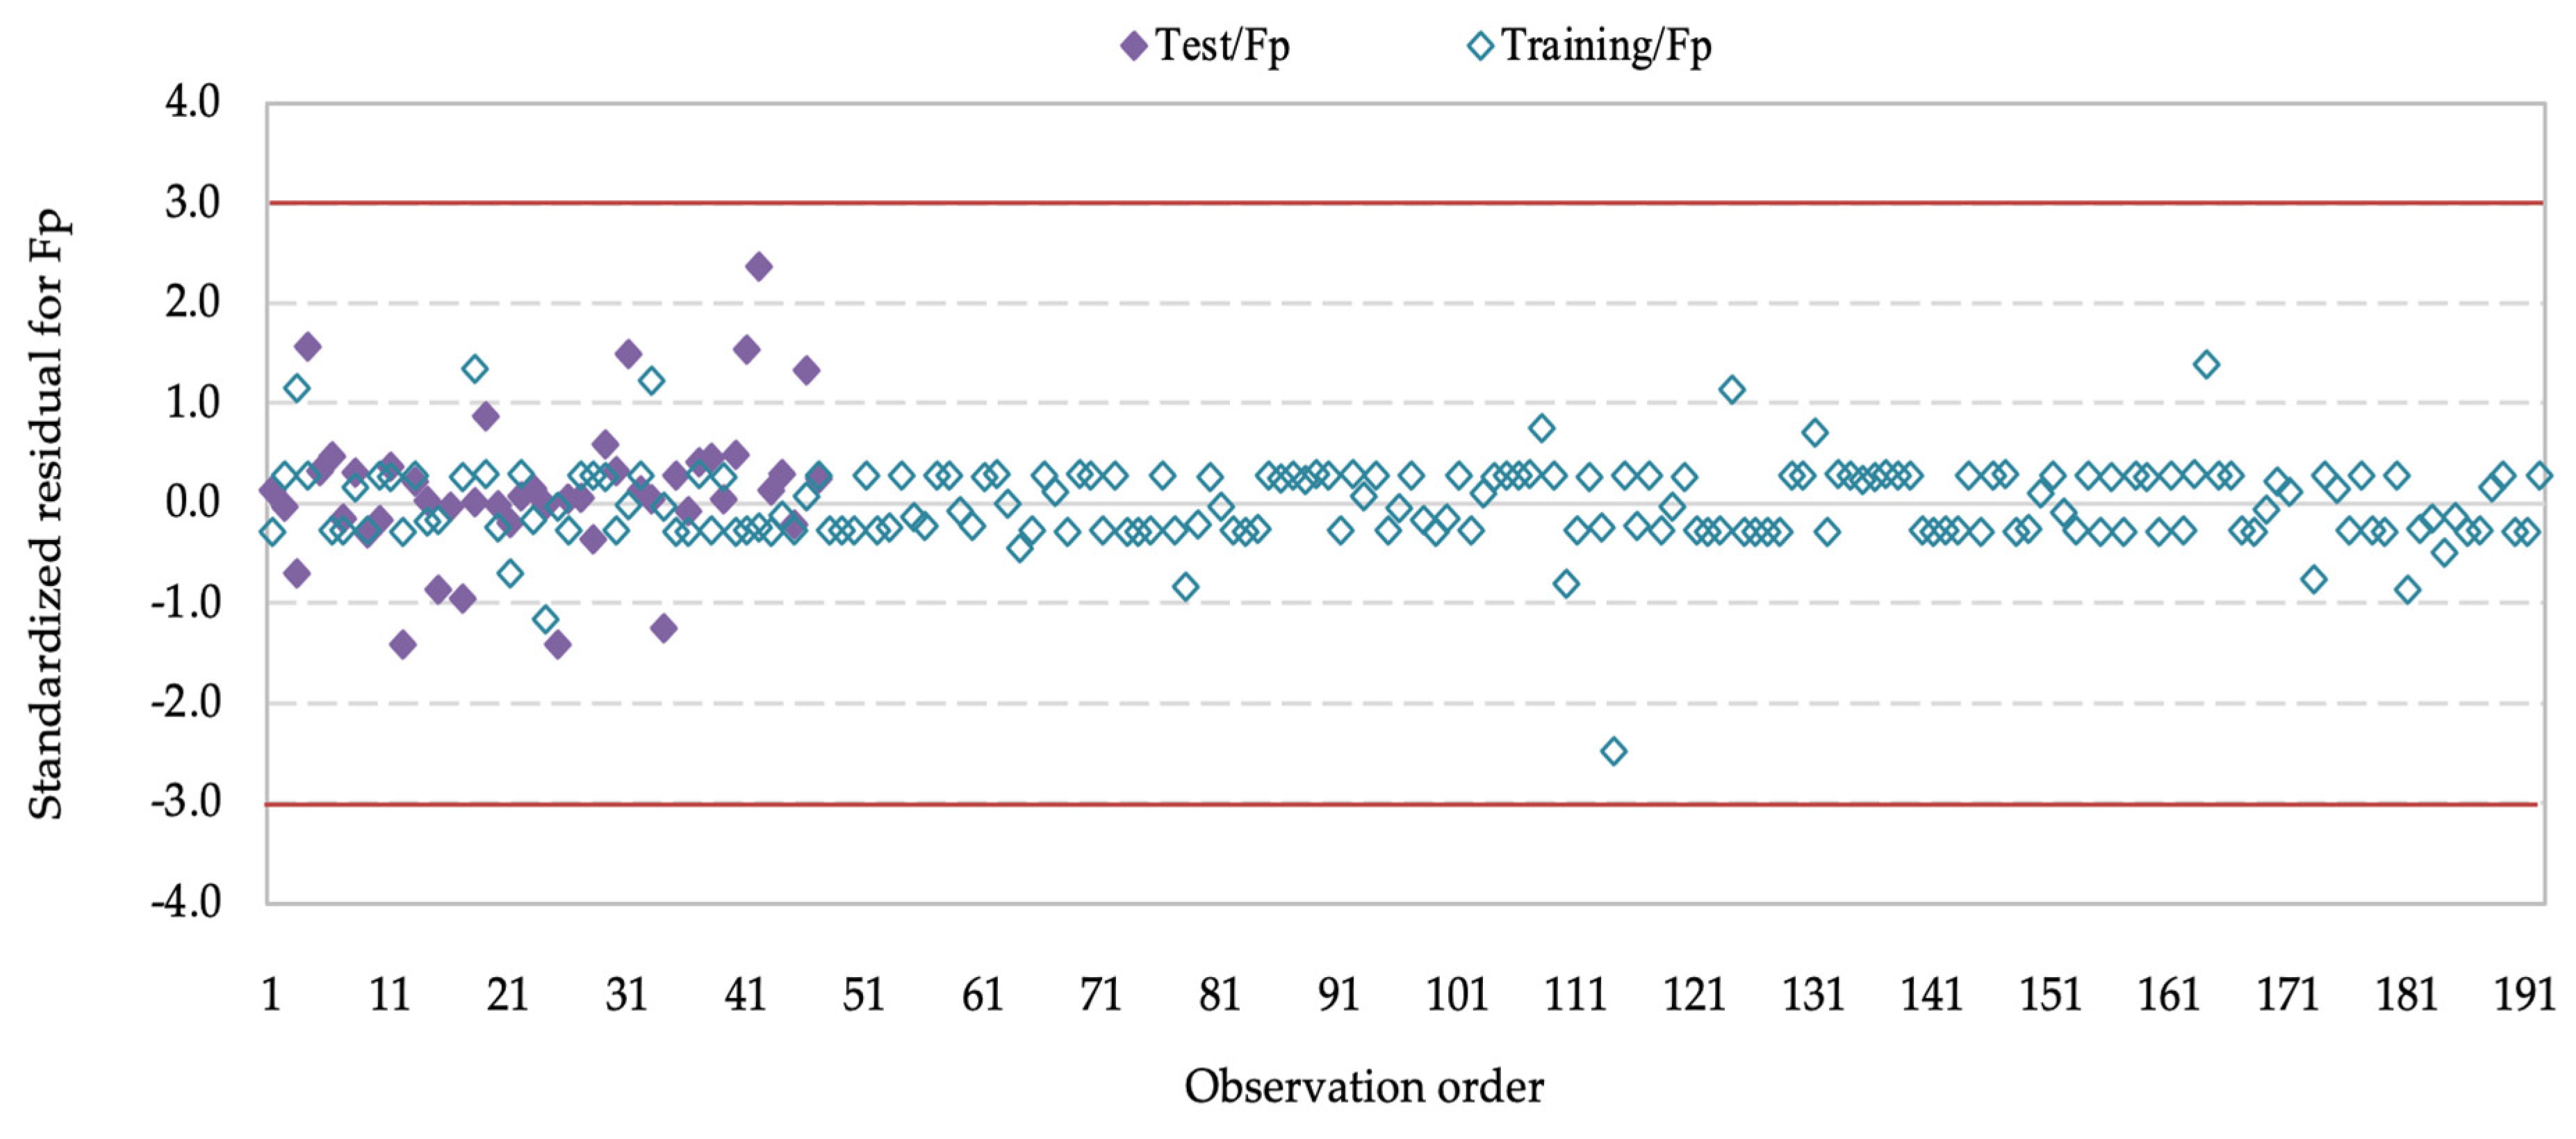
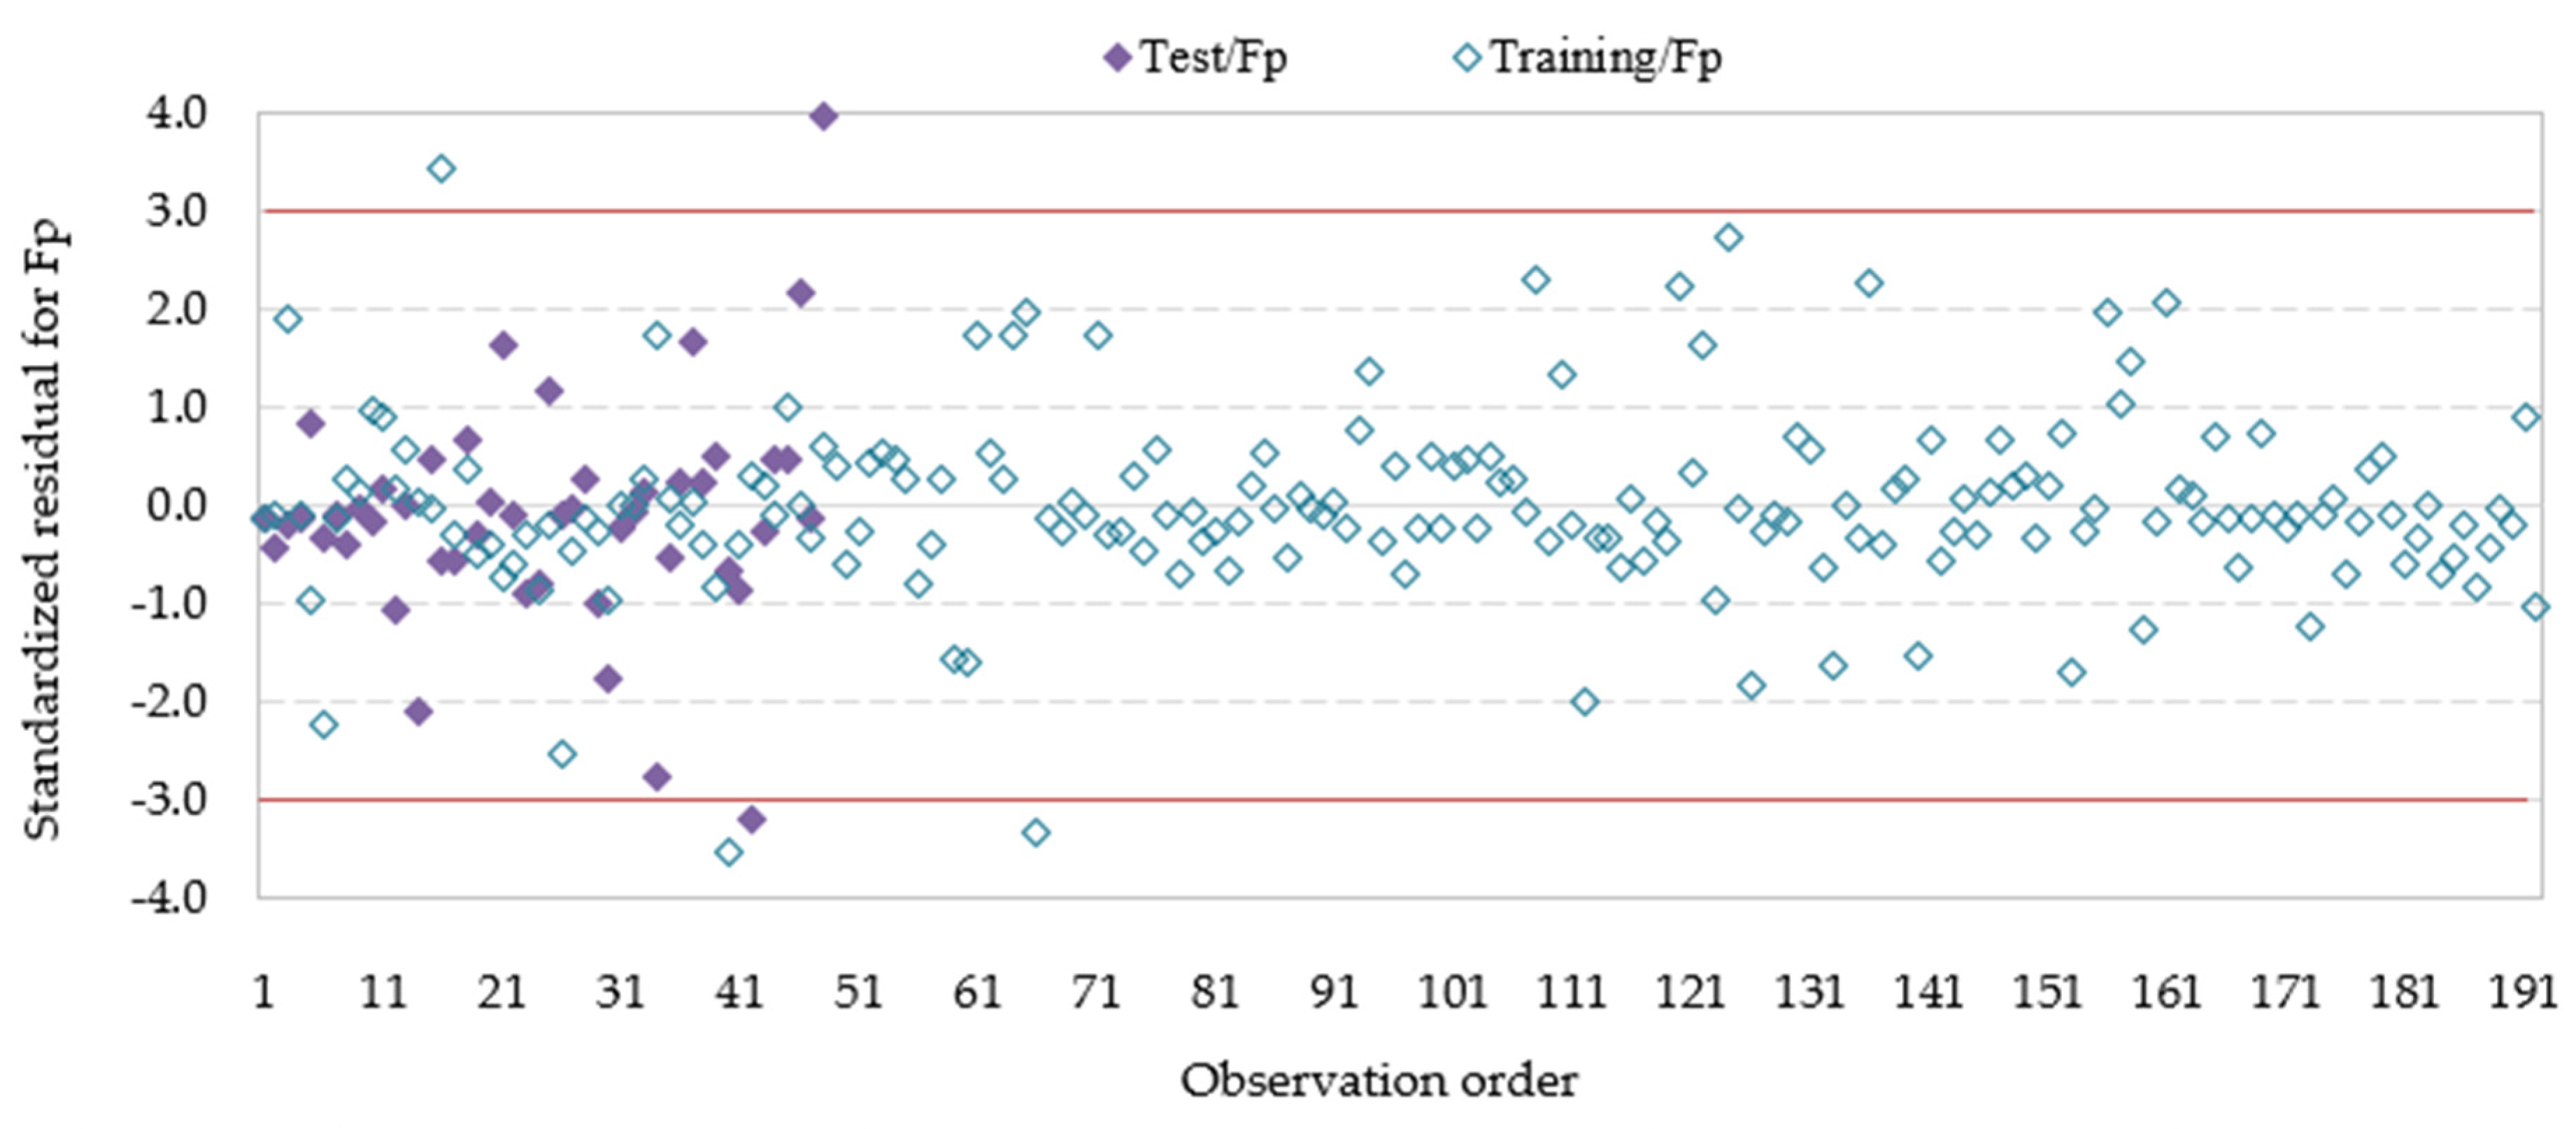
Analysis of the standardized residuals showed the presence of five points outside the range of ±3 (Figure 6), which is approximately 2.1% of the total data set. Three points are from the training set and two from the test set, which may indicate a slight deviation in prediction. However, the presence of outliers does not lead to a significant decrease in the reliability of the model.

3.4. Prediction of Feed Force by RSM

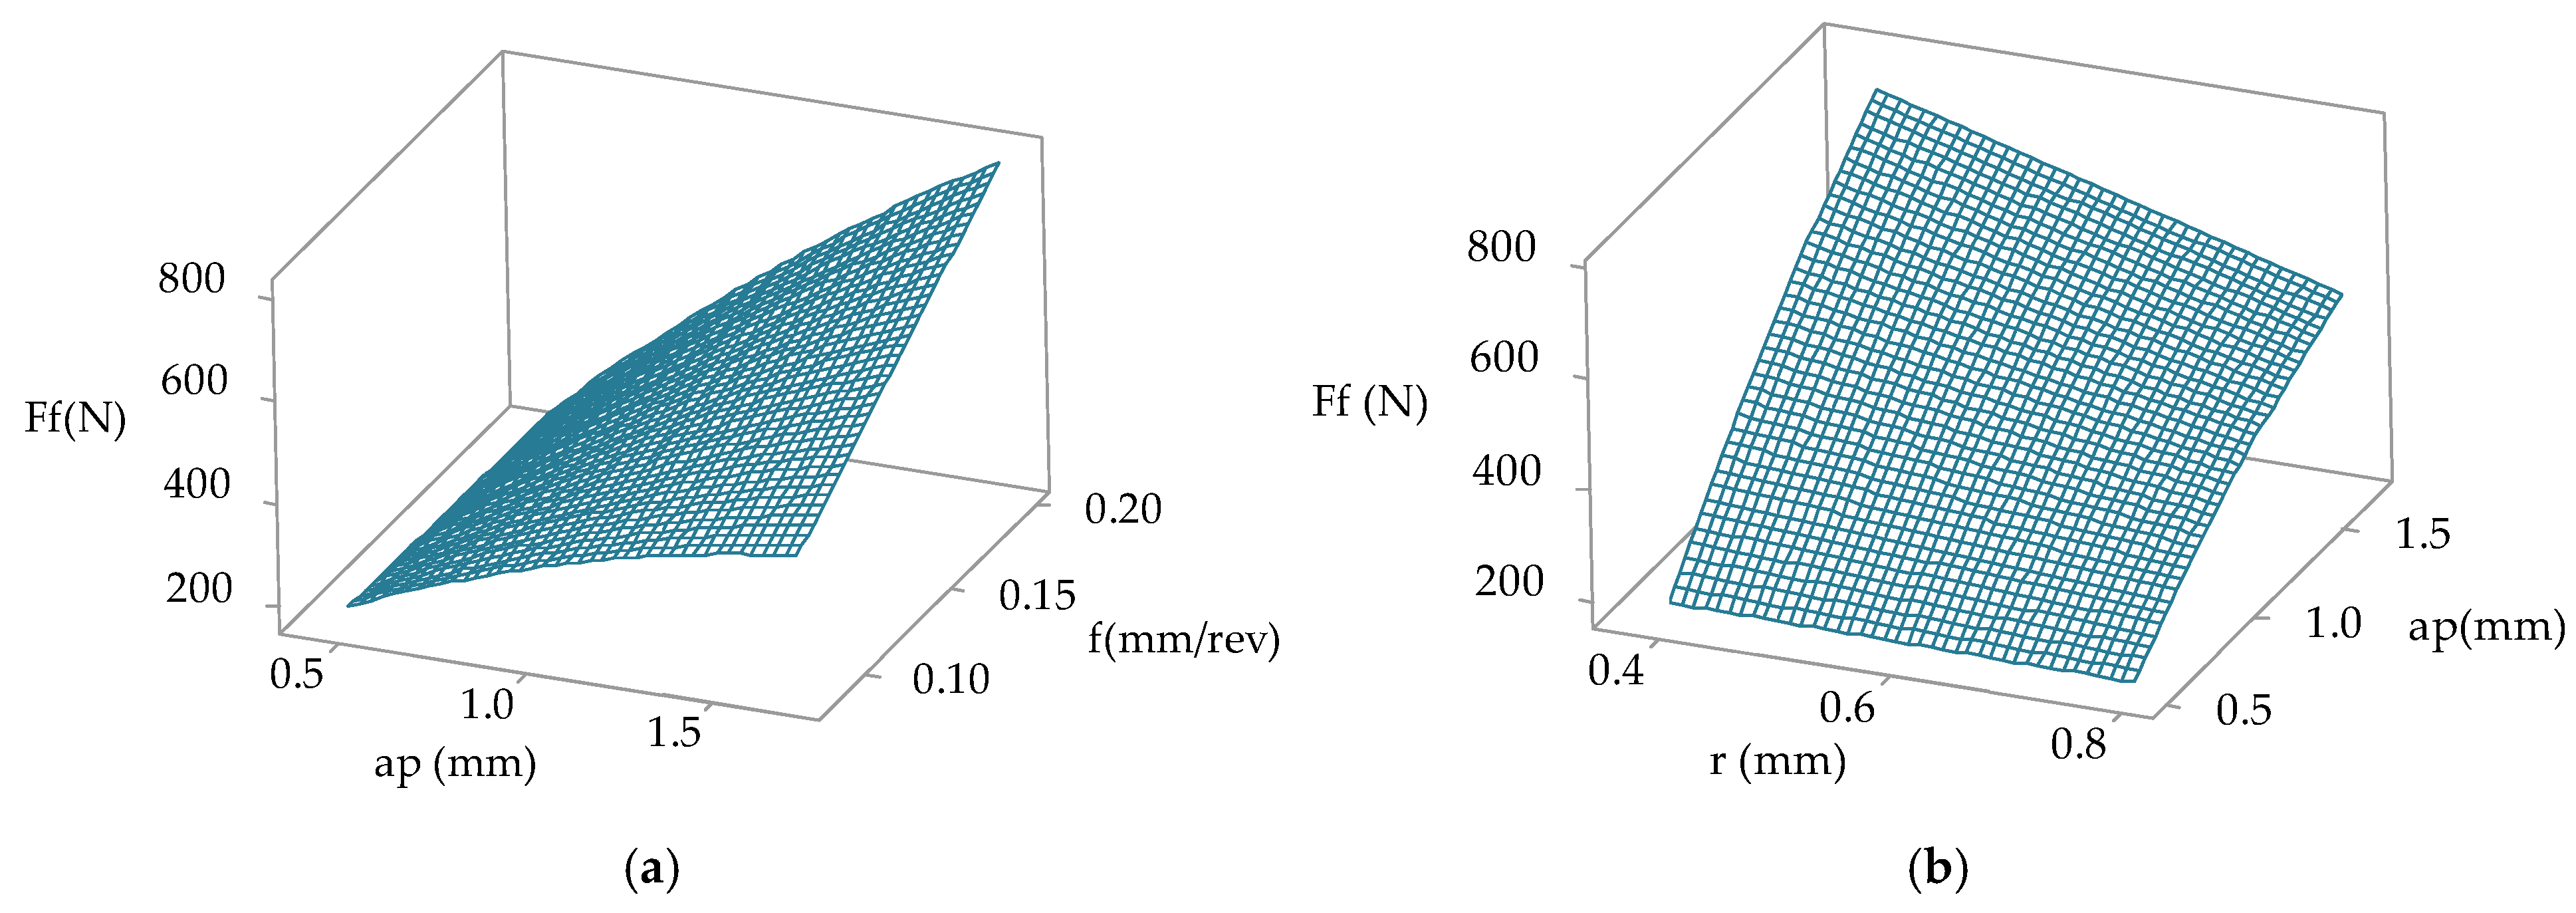
The ANOVA results for a reduced quadratic model for predicting feed force are listed in Table 6. The results show that depth of cut has the most significant impact on F f , followed by the feed and the insert radius. The cutting speed is statistically insignificant and has minimal impact within the considered range. The results show that a p plays a critical role in determining F f . As the depth of cut increases, F f increases sharply, especially at higher feed, due to the enlargement of the tool–workpiece contact zone and the formation of a thicker chip, which generates greater friction and increased resistance to chip flow (Figure 7a). A significant increase in F f was observed at a smaller r and a higher a p (Figure 7b). At a small insert radius, due to the sharper tip of the tool, higher stresses are present. When a higher depth of cut is applied at a small insert radius, the volume of material removed increases, which further increases the stresses and results in a higher F f . The quadratic term a p is statistically significant, but its impact is much smaller than in the case of passive force, indicating that the relationship between a and F p is mostly linear (Figure 7). The results show that the model is statistically significant. The obtained values of the coefficients R 2 = 80.77%, R a d j 2 = 79.93%, and R p r e d 2 = 77.97% indicate that the model is stable and highly reliable for prediction. The reduced quadratic model for predicting F f is given by
F f = 353 + 0.106   v c + 991   f + 481   a p + 771   r 95.6   a p 2 + 2630   f · a p 4020   f · r 472.2   a p · r
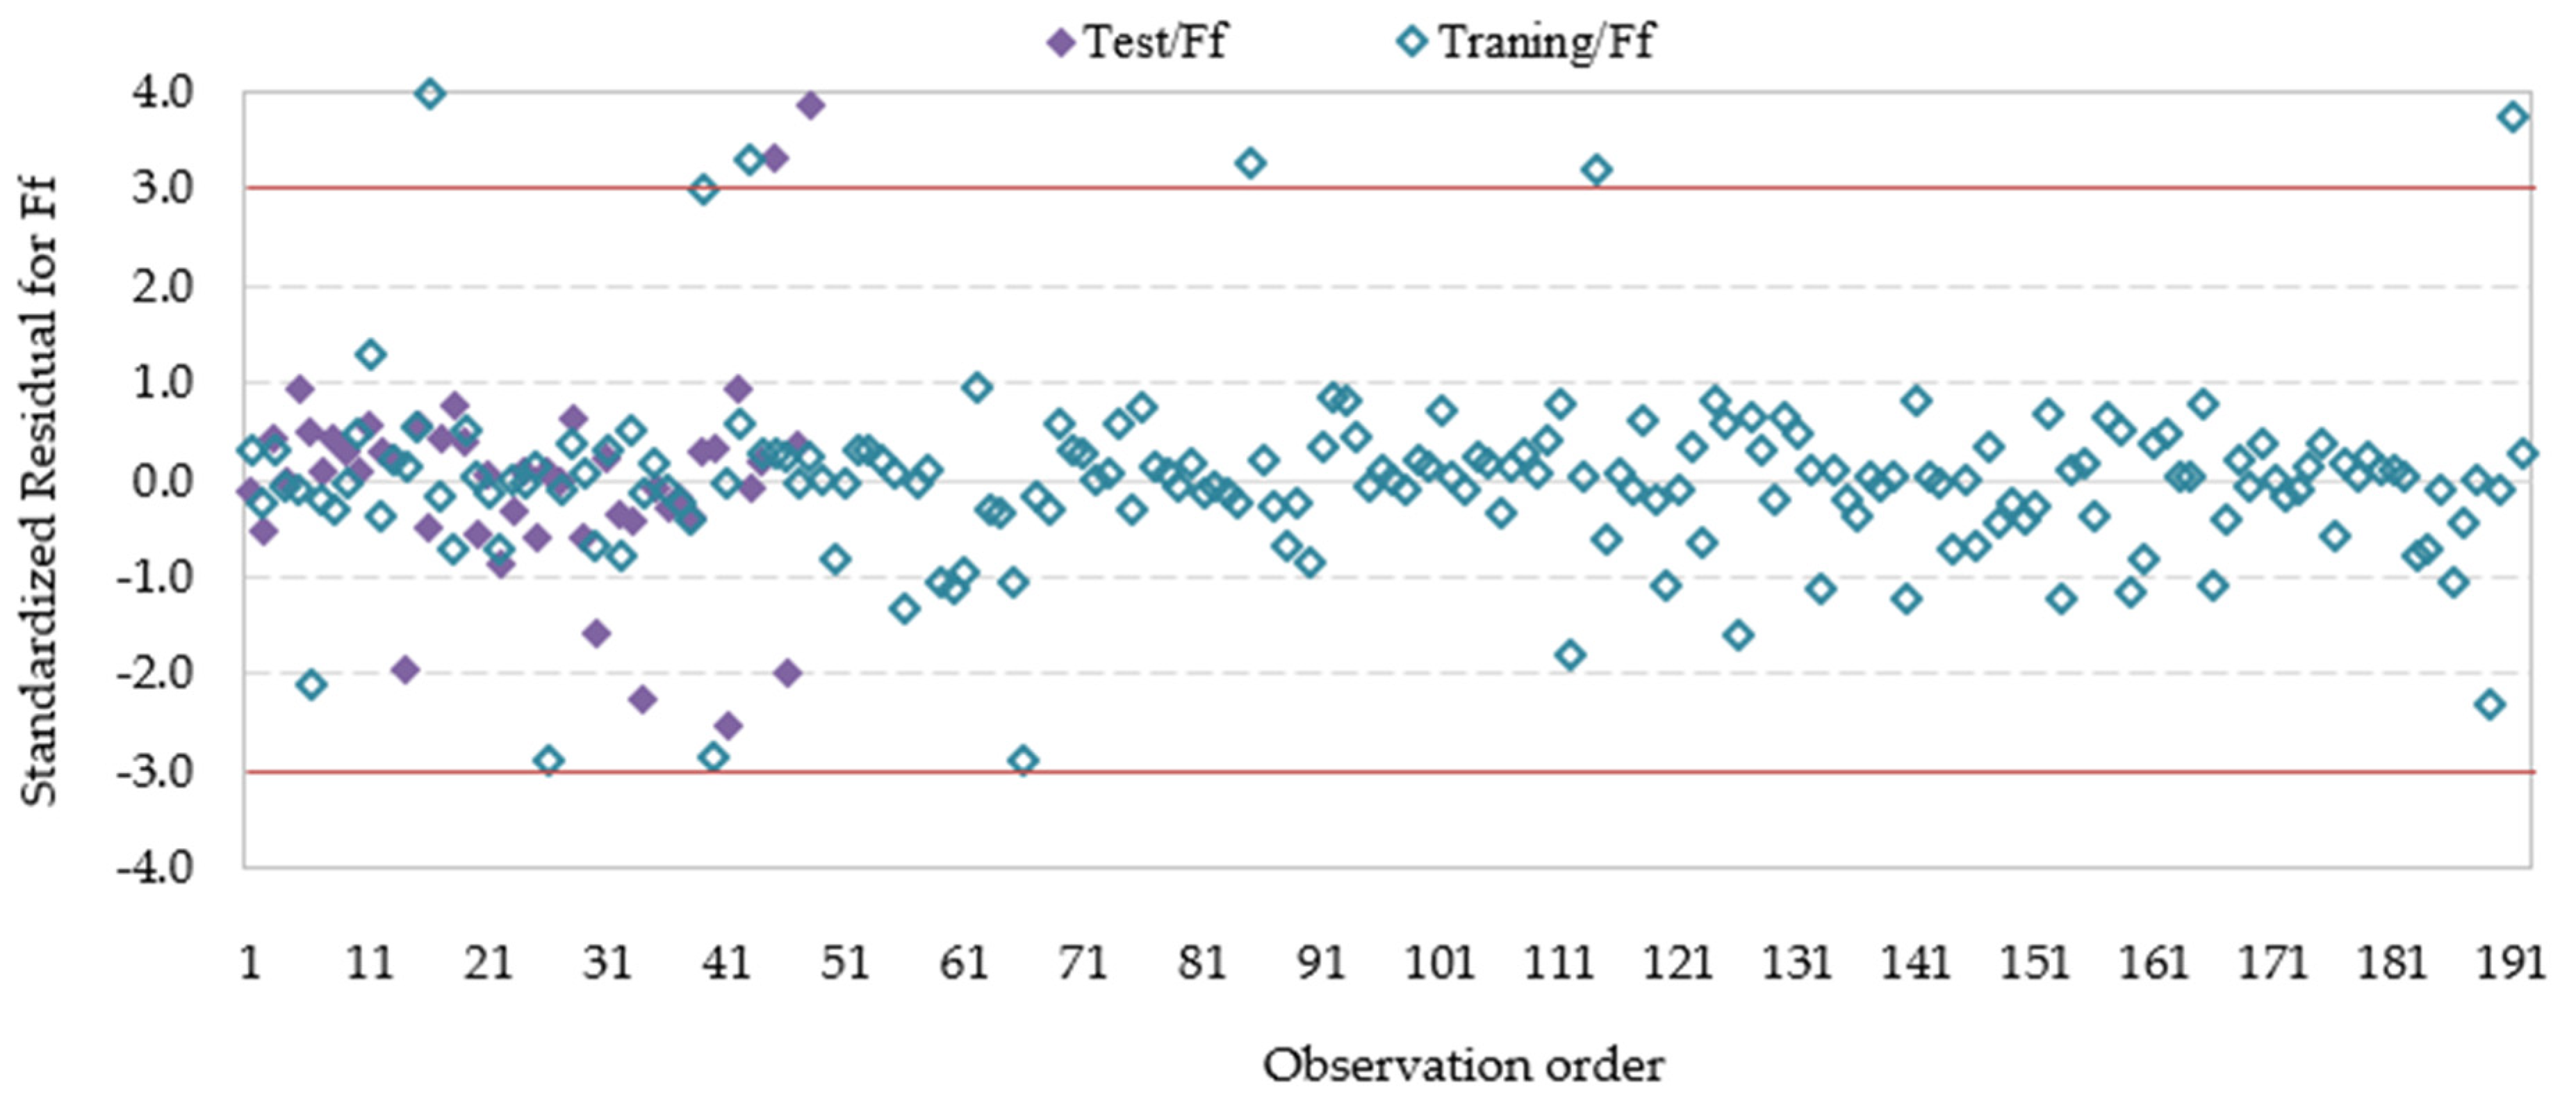
The analysis of standardized residuals showed that seven points are outside the ±3 limits (Figure 8), which is approximately 2.9% of the total data set. Of these seven outliers, two are from the test set, while the rest are from the training set. This occurrence is possible in real data and does not indicate serious instability in the model.

3.5. SVR Model with OFAT Sensitivity Analysis

The results of the SVR model for all output variables are shown in Table 7. On the training set, high values for the determination coefficient were achieved for all observed outputs, with R 2 values of 89.91% for R a , 99.39% for F c , 95.45% for F p , and 99.16% for F f . These results indicate the ability of the SVR model to accurately approximate the nonlinear relationships between input parameters and output variables in the training set.
The performance analysis on the test set shows a different degree of generalization depending on the output variable. For R a , a significantly lower value for the coefficient of determination ( R 2 _test = 9.92%) was recorded, with increased RMSE and MAE values, indicating the limited ability of the SVR model to generalize the roughness prediction to unseen data. This behavior can be associated with a higher sensitivity of surface roughness to local process changes and a potentially more pronounced influence of stochastic effects compared to cutting forces.
In contrast, high R 2 values were achieved for cutting forces on the test set, namely 96.82% for F c , 80.43% for F p , and 93.73% for F f .
The results of the OFAT sensitivity analysis presented in Table 8 allow for quantification of the absolute and relative influence of individual input parameters on the output quantities. For surface roughness ( R a ), the dominant influence is the depth of cut, with a relative contribution of 46.45%, followed by feed with 36.96%. The influence of cutting speed and insert radius is significantly smaller, with a total contribution below 17%. These results indicate that changes in geometric and kinematic parameters are of crucial importance for the formation of surface texture.
For the main cutting force ( F c ), the depth of cut also represents the most influential parameter with 46.58%, while feed makes a significant contribution of 37.74%. The cutting speed and insert radius have a secondary influence, which is consistent with the mechanical nature of the formation of the main cutting force.
In passive force ( F p ), the dominant influences are relatively more evenly distributed between depth of cut (34.27%) and feed rate (33.31%), while cutting speed (23.74%) shows a greater contribution compared to other outputs. This indicates the more complex character of passive force, which is more sensitive to combined changes in process parameters.
For feed force ( F f ), depth of cut stands out as an extremely dominant parameter with a relative contribution of 61.24%, while feed rate has a secondary but still significant influence (20.29%). The influence of cutting speed and insert radius remains limited.
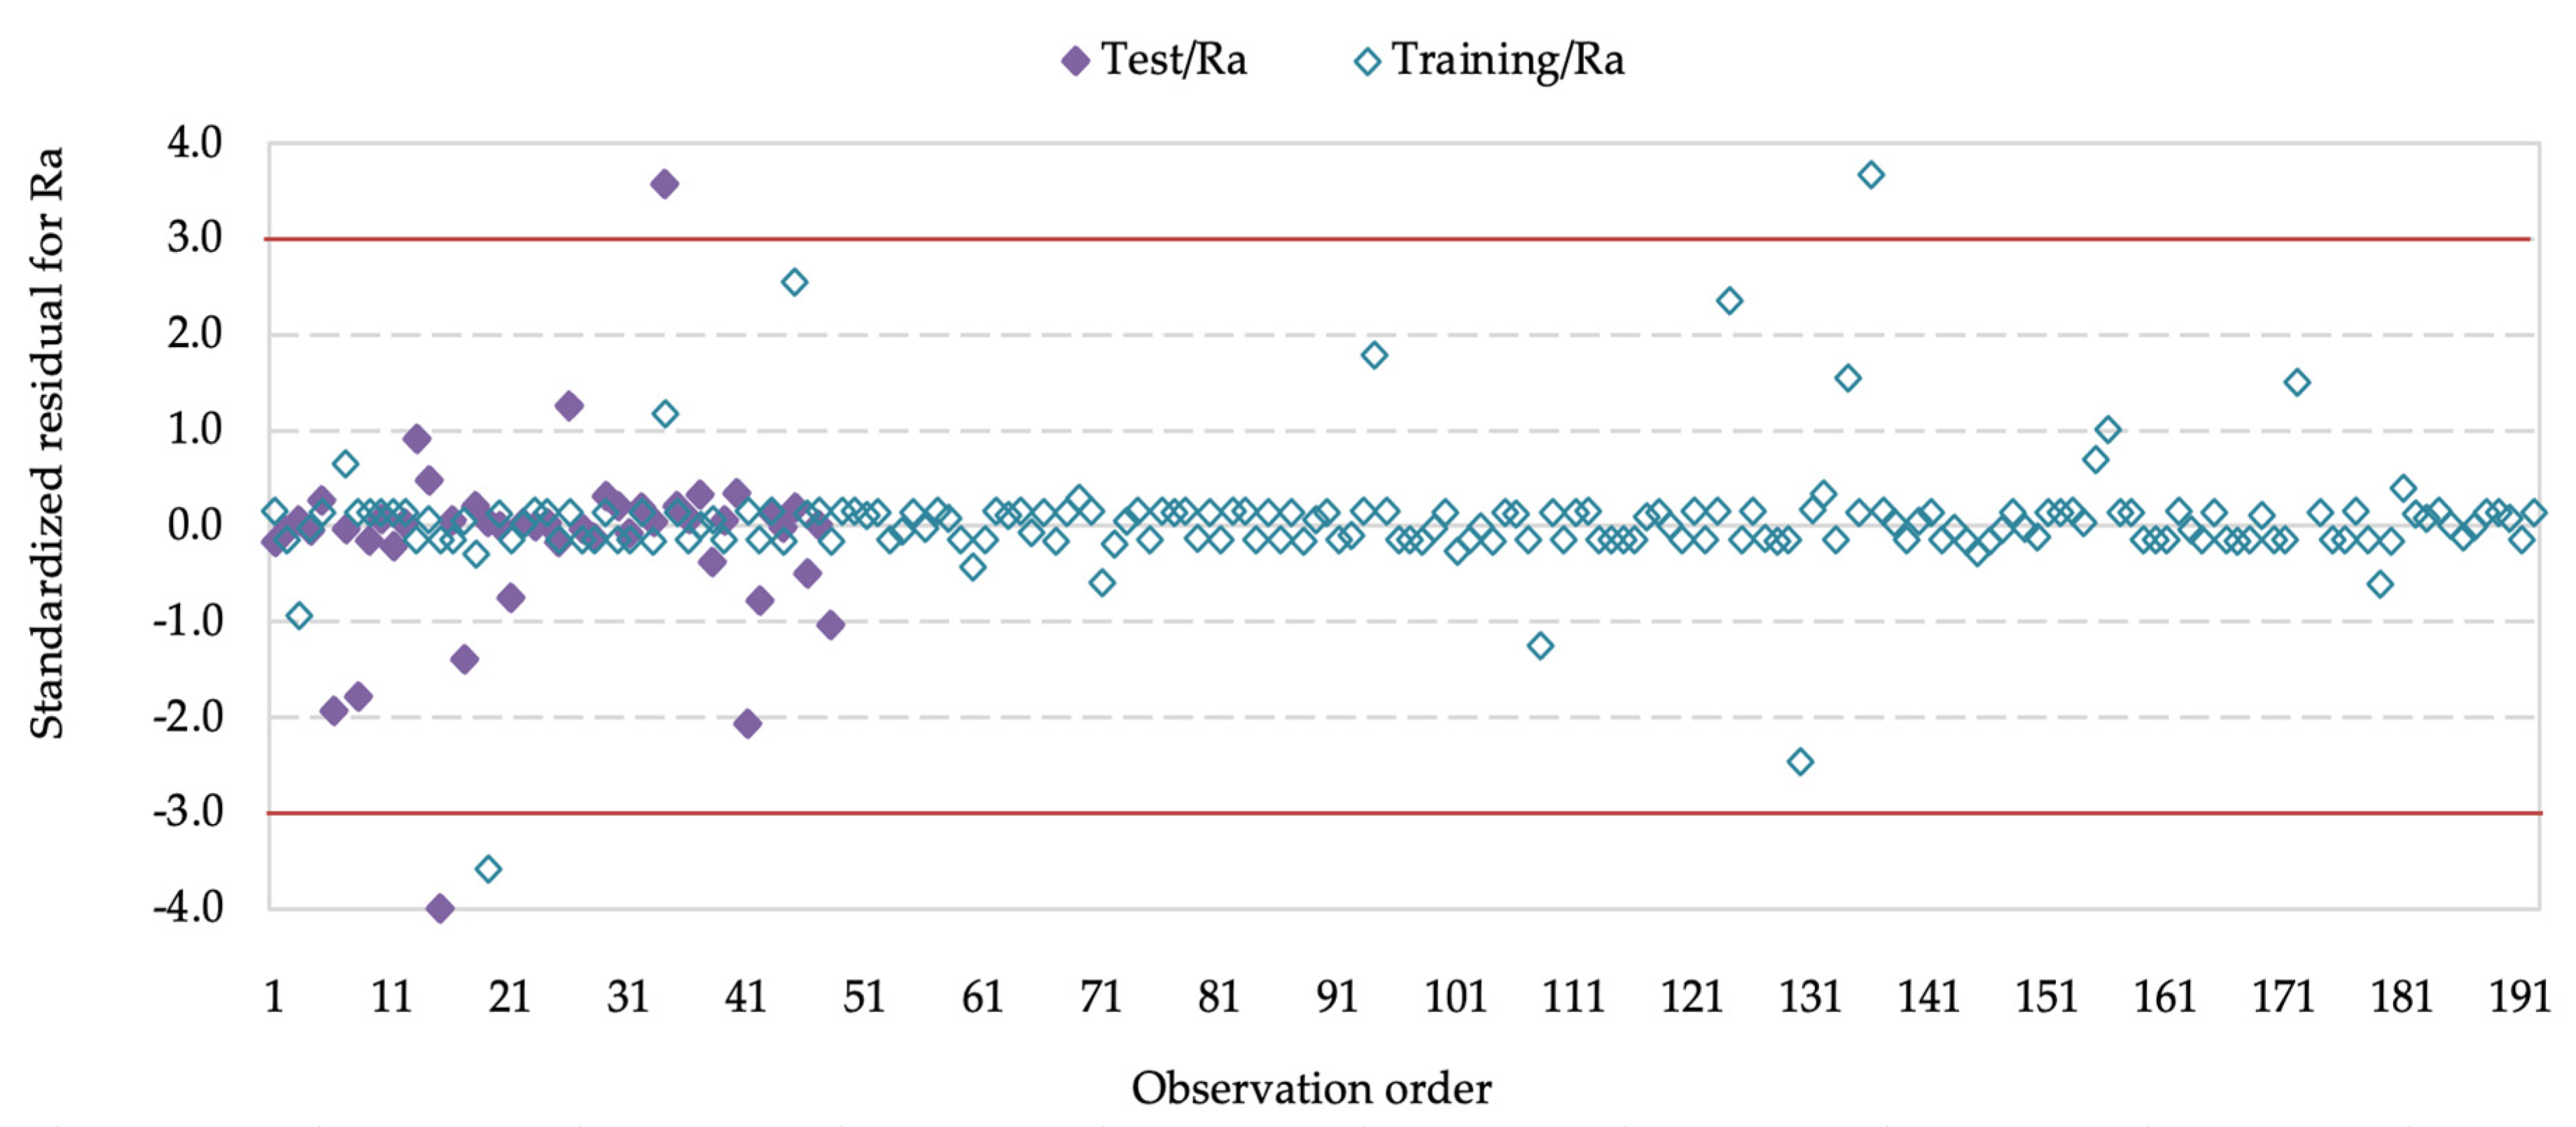
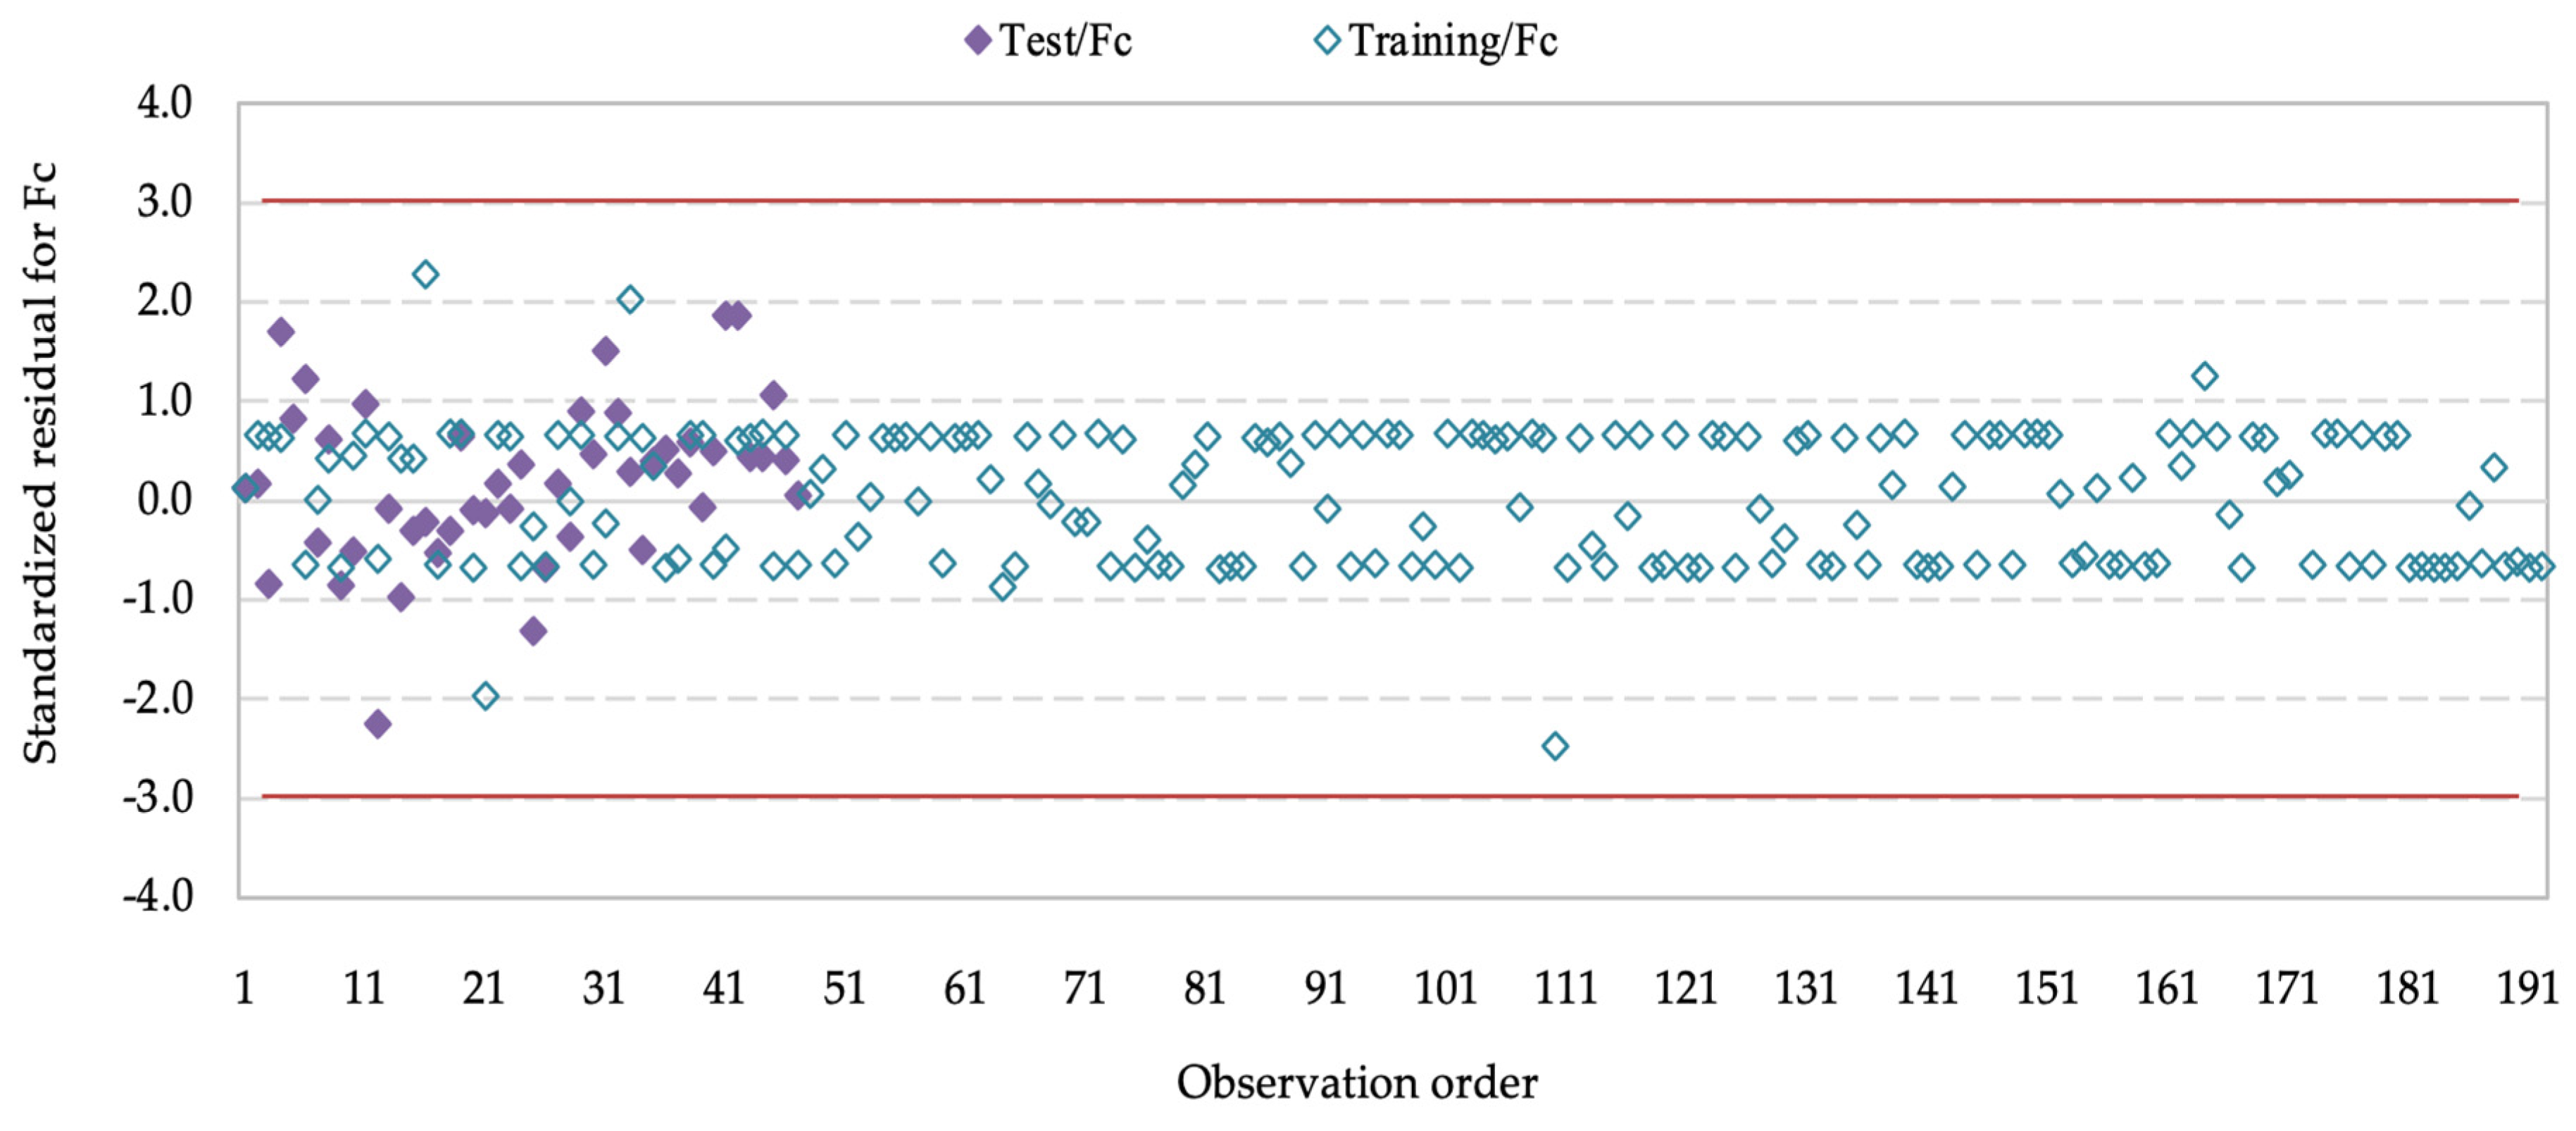
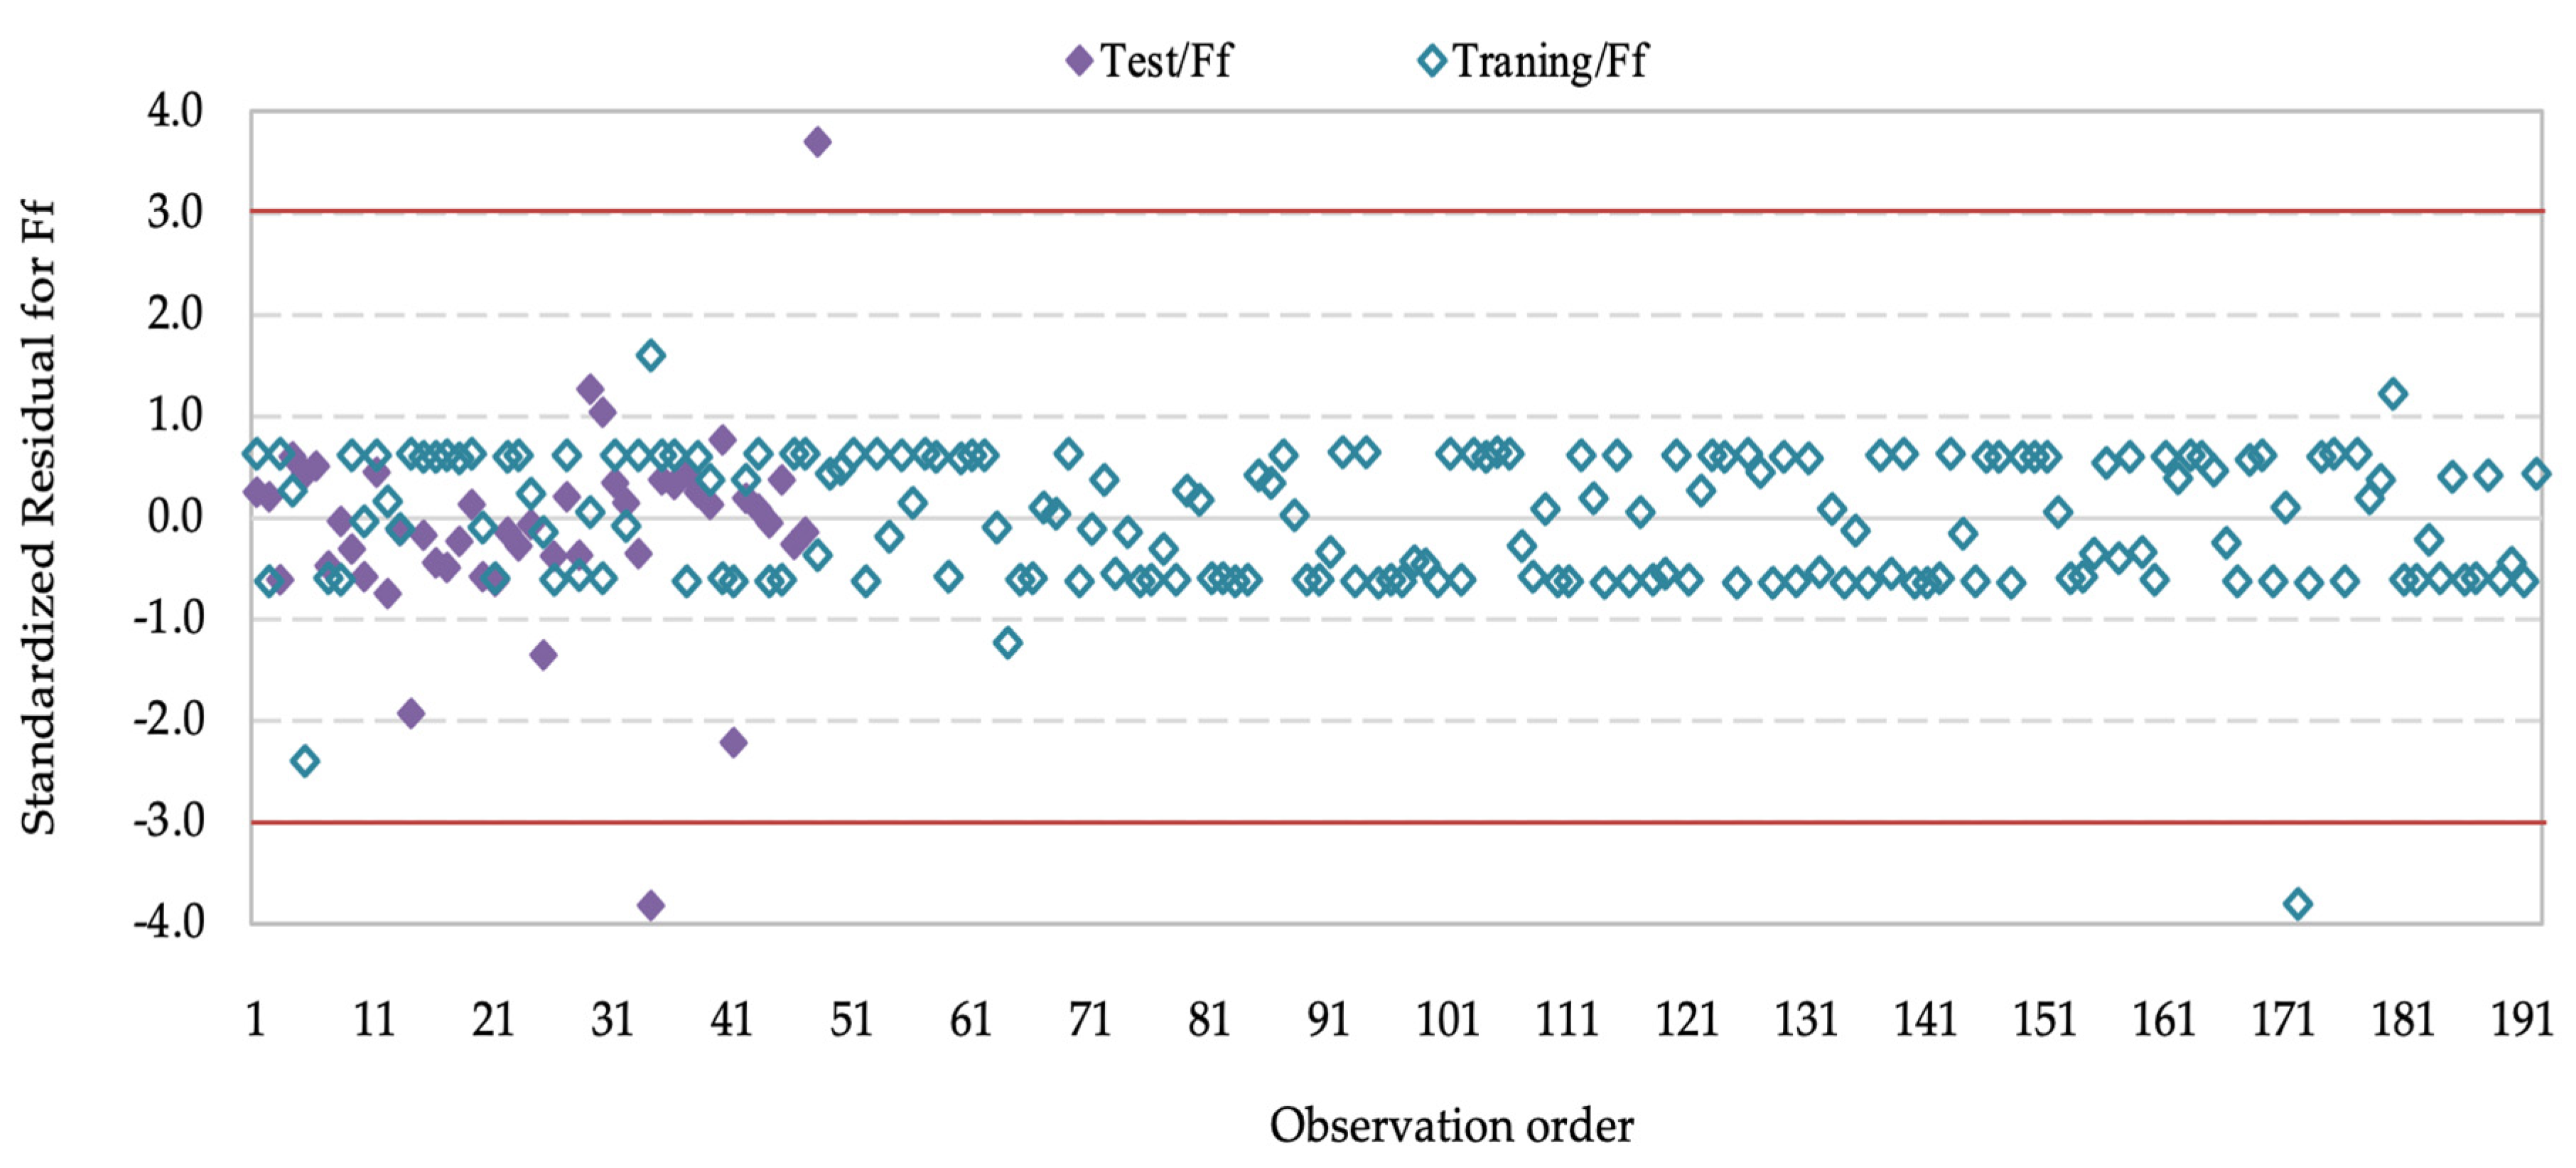
In Figure 9, Figure 10, Figure 11 and Figure 12, the standardized residuals for R a , F c , F f , and F p are randomly scattered around zero for both the training and test sets and mostly lie within the ±3 limits, indicating no systematic bias and acceptable model behavior.

3.6. Multi-Criteria Optimization of Turning Process

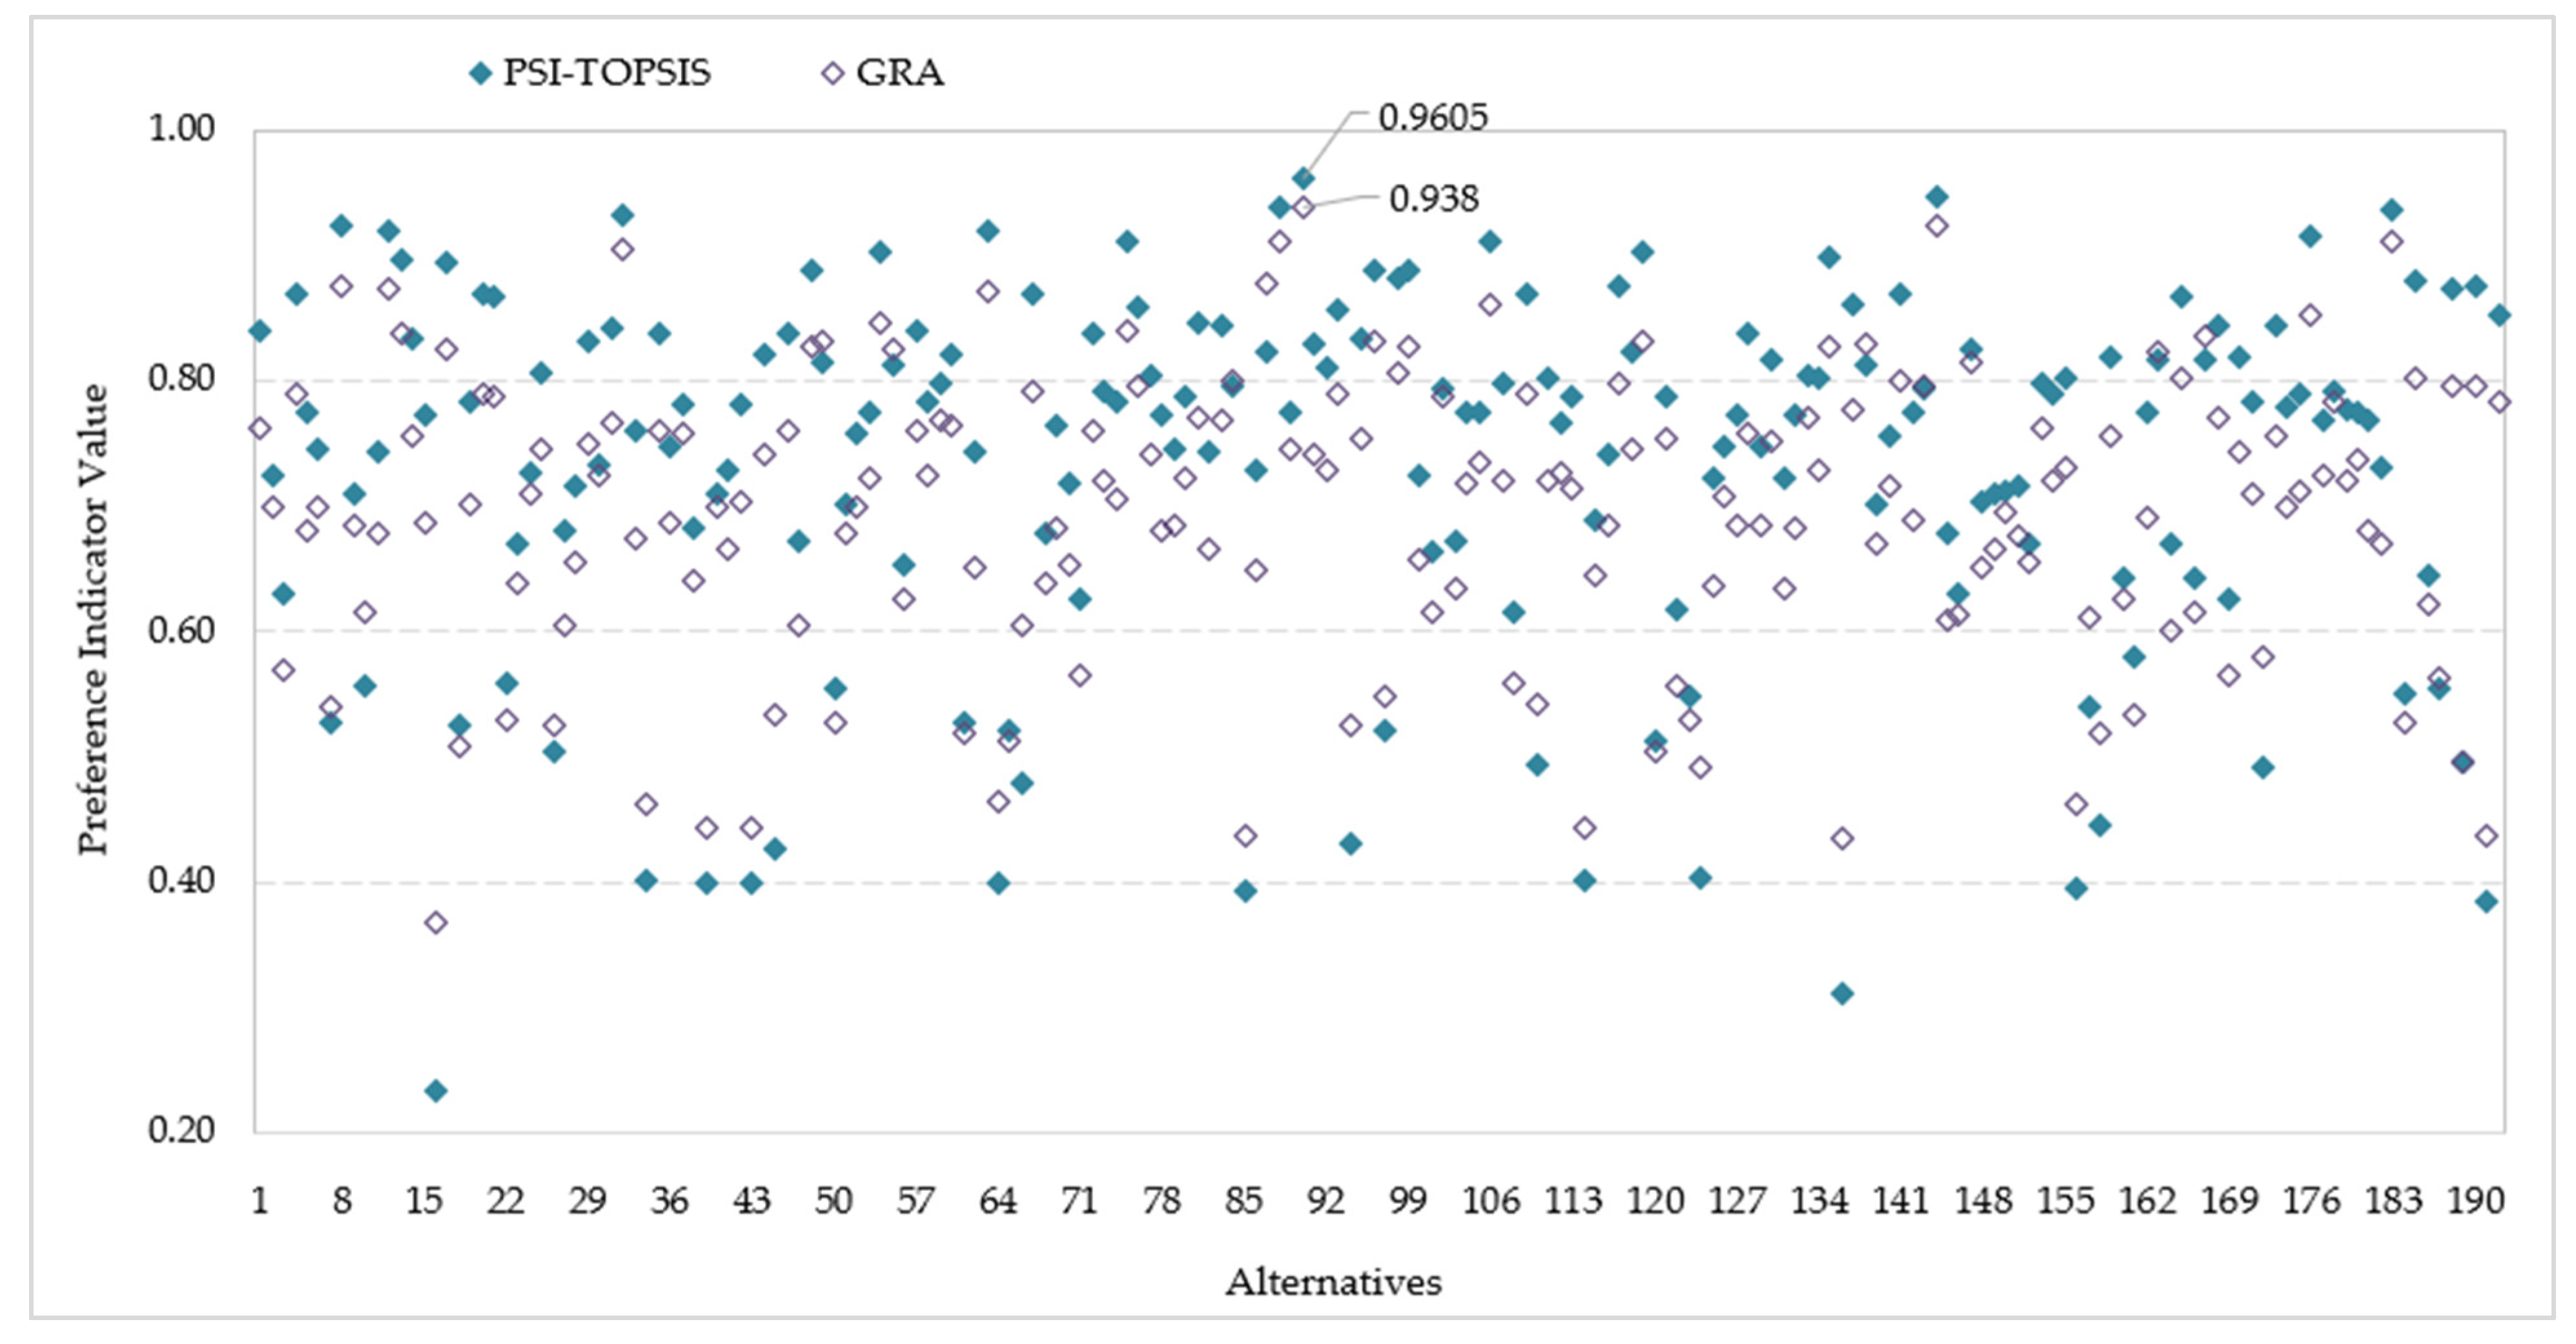
Multi-criteria optimization of the turning process of 42CrMo4 steel was applied to identify the optimal level of input parameters that simultaneously minimizes surface roughness and cutting forces. Gray relational analysis (GRA) and the hybrid PSI-TOPSIS method were used. For the multi-criteria optimization of the turning process, a data set consisting of 192 experimental datapoints was used. The same data set was used to develop mathematical models. This ensured consistency and enabled the comparability of the results. ANOVA was applied to determine the impact of input parameters on MCDM method preference indicator with their percentage contributions. The multi-criteria optimization was performed on experimental data and is independent of the results of the RSM and SVR models. The statistical significance of input parameters was assessed based on p-values. The preference indicator values for both used MCDM methods, for each alternative, are shown in Figure 13. It can be noted that the best option is alternative 90 for both considered methods. The preference indicator value obtained using the hybrid PSI-TOPSIS method is 0.9605, while the preference indicator value according to the GRA method is 0.938.
Based on the response tables, as shown in Table 9 for the hybrid PSI-TOPSIS method and Table 10 for GRA, the optimal combination of input parameters is cutting speed at level 1, depth of cut at level 1, feed at level 1, and insert radius at level 2. It can be observed that both MCDM methods selected the same optimal combination. The optimal combination of input parameters in the turning process of 42CrMo4 alloy steel, with regard to the considered outputs, is a 100 m/min cutting speed, a 0.5 mm depth of cut, a 0.08 mm feed, and a 0.8 mm insert radius. At this optimal combination, the considered output values are R a =   0.855 μ m , F c = 268.3 N, F p = 168.5 N, and F f = 149.3 N, respectively.
According to the ANOVA results (Table 11 and Table 12), the depth of cut is the most significant factor affecting the preference indicator in both methods. Depth of cut is the parameter with the strongest influence, with a percentage contribution of 31.82% (according to PSI-TOPSIS) or 38.99% (according to GRA), followed by an insert radius at 26.65% or 24.13%, while feed holds at 15.63% or 19.90%. Cutting speed is statistically insignificant and exhibits the lowest impact in both evaluation methods.

4. Conclusions

In this study, RSM was used to predict surface roughness ,   main cutting force, passive force, and feed force based on the input parameters cutting speed, feed, depth of cut, and insert radius, as well as to evaluate the impact of these input parameters on the considered output responses. The GRA and the hybrid PSI-TOPSIS methods were applied to perform multi-criteria optimization and determine the optimal combination of input parameters. Also, SVR models were developed for each output individually, along with OFAT sensitivity analysis. The following conclusions can be drawn:
  • A reduced square model was proposed, where the determination coefficient ranged from a moderate R 2 = 45.56% for surface roughness to a slightly higher R 2 = 62.69% for the passive force and a good R 2 = 80.77% for the feed force to a very high R 2 = 93.66% for the main cutting force. Considering that the determination coefficient varies widely, from 45.56% to 93.66%, this indicates that the RSM model is less reliable for some responses.
  • Based on the RSM results, for all four considered outputs, the analysis of standardized residuals shows that over 97% of the points are within ±3 standard deviations. The remaining 3% of the total data set are outside of the limits and can be assumed to be random outliers. Depth of cut has a primary impact on the main cutting force and feed force, whereas feed determines passive force, and the radius of the insert has a primary impact on R a . Cutting speed had the lowest impact on the considered outputs and can generally be considered irrelevant under the experimental conditions studied.
  • The application of the SVR model provided additional insight into the nonlinear behavior of the turning process, achieving stable and high predictive performance for all components of cutting forces, while the generalization for surface roughness was limited to the test set, indicating a greater complexity of the surface formation mechanisms compared to cutting forces. OFAT sensitivity analysis further quantified the influence of input parameters, confirming that depth of cut is the dominant factor for cutting forces, while feed has a significant impact on surface roughness, thus confirming the consistency of the conclusions obtained by RSM analysis through an alternative, data-driven approach.
  • Multi-criteria optimization using the PSI-TOPSIS and GRA methods identified the same optimal combination of input parameters: 100 mm/min cutting speed, 0.5 mm depth of cut, 0.08 mm feed, and 0.8 mm insert radius. The ANOVA results show that the depth of cut is the most significant factor affecting the preference indicator in both methods, followed by the insert radius and feed. Cutting speed had the lowest impact in both evaluation methods. This confirms the reliability of the evaluation approach, thereby enabling its reliable application in real production conditions.
  • The integration of the RSM model and SVR with OFAT for prediction and MCDM methods for optimization offers a robust hybrid approach to improving the performance of the hard turning process, with practical solutions to improve the quality and efficiency of machining.
The limited generalization capability of the SVR model for surface roughness suggests that future studies should investigate alternative machine learning and deep learning models, such as ensemble tree-based methods or neural networks, as well as the influence of data distribution and hyperparameter optimization on predictive performance.

Author Contributions

Conceptualization, K.M., S.K., A.Z., D.B.-H., and M.P.; Methodology, S.K., A.Z., D.B.-H. and M.P.; Software, D.B.-H. and M.P.; Validation, S.K., A.Z., D.B.-H., and M.P.; Formal Analysis, D.M., K.M., D.B.-H., and M.P.; Investigation, D.M., K.M., A.Z., D.B.-H., and M.P.; Resources, D.M. and A.Z.; Data Curation, D.M., K.M., and S.K.; Writing—Original Draft, D.M., K.M., S.K., A.Z., D.B.-H., and M.P.; Writing—Review and Editing, K.M., S.K., A.Z., D.B.-H., and M.P.; Visualization, D.M., K.M., D.B.-H., and M.P.; Supervision, S.K., A.Z., D.B.-H., and M.P. All authors have read and agreed to the published version of the manuscript.

Funding

The APC was funded by University of Sarajevo-Faculty of Mechanical Engineering.

Data Availability Statement

The original contributions presented in this study are included in the article. Further inquiries can be directed to the corresponding authors.

Conflicts of Interest

The authors declare no conflict of interest.

Abbreviations

The following abbreviations are used in this manuscript:
RSMResponse Surface Methodology
SVRSupport Vector Regression
OFATOne-Factor-at-a-Time
MCDMMultiple-Criteria Decision Making

References

  1. Kumar, R.; Kumar, A.; Kant, L.; Prasad, A.; Bhoi, S.; Meena, C.S.; Singh, V.P.; Ghosh, A. Experimental and RSM-based process-parameters optimisation for turning operation of EN36B steel. Materials 2022, 16, 339. [Google Scholar] [CrossRef] [Scilit]
  2. Özdemir, M.; Kaya, M.T.; Akyildiz, H.K. Analysis of surface roughness and cutting forces in hard turning of 42CrMo4 steel using Taguchi and RSM method. Mechanika 2020, 26, 231–241. [Google Scholar] [CrossRef] [Scilit]
  3. Pasic, M.; Marinkovic, D.; Lukic, D.; Begic-Hajdarevic, D.; Zivkovic, A.; Milosevic, M.; Muhamedagic, K. Prediction and optimization of surface roughness and cutting forces in turning process using ANN, SHAP analysis, and hybrid MCDM method. Appl. Sci. 2024, 14, 11386. [Google Scholar] [CrossRef] [Scilit]
  4. Hamadi, B.; Yallese, M.A.; Boulanouar, L.; Nouioua, M.; Hammoudi, A. RSM-based MOALO optimization and cutting inserts evaluation in dry turning of AISI 4140 steel. Struct. Eng. Mech. 2022, 84, 17–33. [Google Scholar] [CrossRef]
  5. Tanvir, M.H.; Hussain, A.; Rahman, M.M.T.; Ishraq, S.; Zishan, K.; Rahul, S.T.T.; Habib, M.A. Multi-objective optimization of turning operation of stainless steel using a hybrid whale optimization algorithm. J. Manuf. Mater. Process. 2020, 4, 64. [Google Scholar] [CrossRef] [Scilit]
  6. Yallese, M.A.; Boucherit, S.; Khelfaoui, F.; Ouelaa, Z.; Haoues, S.; Belhadi, S. Multi-objective optimization in intermittent turning: Balancing productivity, surface quality, sound intensity, and tool vibration using MCDM methods. J. Vib. Eng. Technol. 2025, 13, 298. [Google Scholar] [CrossRef] [Scilit]
  7. Puh, F.; Jurkovic, Z.; Perinic, M.; Brezocnik, M.; Buljan, S. Optimization of machining parameters for turning operation with multiple quality characteristics using grey relational analysis. Tech. Gaz. 2016, 23, 377–382. [Google Scholar] [CrossRef] [Scilit]
  8. Kumar, S.; Yadav, R.N.; Kumar, R. Experimental studies and multi-response optimisation of duplex turning parameters using grey relational analysis with entropy measurement. Int. J. Precis. Technol. 2020, 9, 71. [Google Scholar] [CrossRef] [Scilit]
  9. Mukherjee, D.; Ranjan, R.; Moi, S.C. Multi-response optimization of surface roughness and MRR in turning using taguchi grey relational analysis (TGRA). Int. Res. J. Multidiscip. Scope 2022, 3, 1–7. [Google Scholar] [CrossRef] [Scilit]
  10. Balwan, V.R.; Dabade, B.M.; Kabnure, B.B. Optimization of surface finish and material removal rate while turning hardened EN 353 steel using GRA. Mater. Today Proc. 2022, 59, 331–338. [Google Scholar] [CrossRef] [Scilit]
  11. Deepak, D.; Beedu, R. Multi response optimization of process parameters using grey relational analysis for turning of Al-6061. IOP Conf. Ser. Mater. Sci. Eng. 2017, 225, 012092. [Google Scholar] [CrossRef] [Scilit]
  12. Kalyon, A.; Günay, M.; Özyürek, D. Application of grey relational analysis based on Taguchi method for optimizing machining parameters in hard turning of high chrome cast iron. Adv. Manuf. 2018, 6, 419–429. [Google Scholar] [CrossRef] [Scilit]
  13. Sundara Bharathi, S.R.; Ravindran, D.; Moshi, A.A.M. Multi-response optimization of CNC turning parameters of austenitic stainless steel 303 using Taguchi-based grey relational analysis. Trans. Can. Soc. Mech. Eng. 2020, 44, 592–601. [Google Scholar] [CrossRef] [Scilit]
  14. Sristi, N.A.; Zaman, P.B.; Dhar, N.R. Multi-response optimization of hard turning parameters: A comparison between different hybrid Taguchi-based MCDM methods. Int. J. Interact. Des. Manuf. 2022, 16, 1779–1795. [Google Scholar] [CrossRef] [Scilit]
  15. Ficko, M.; Begic-Hajdarevic, D.; Hadziabdic, V.; Klancnik, S. Multi-response optimisation of turning process parameters with GRA and TOPSIS methods. Int. J. Simul. Model. 2020, 19, 547–558. [Google Scholar] [CrossRef] [Scilit]
  16. Namboodri, T.; Felhő, C.; Sztankovics, I. Optimization of machining parameters for improved surface integrity in chromium–nickel alloy steel turning using TOPSIS and GRA. Appl. Sci. 2025, 15, 8895. [Google Scholar] [CrossRef] [Scilit]
  17. Umamaheswarrao, P.; Rangaraju, D.; Suman, K.N.S.; Ravisankar, B. Application of TOPSIS for multi response optimization of process parameters in dry hard turning of AISI 52100 steel. INCAS Bull. 2021, 13, 211–224. [Google Scholar] [CrossRef] [Scilit]
  18. Rathod, N.J.; Chopra, M.K.; Chaurasiya, P.K.; Vidhate, U.S.; Dasore, A. Optimization on the turning process parameters of SS 304 using Taguchi and TOPSIS. Ann. Data. Sci. 2023, 10, 1405–1419. [Google Scholar] [CrossRef] [Scilit]
  19. Kumar, R.; Rafighi, M.; İynen, O.; Reddy, M.P.K.; Zade, S.; Özdemir, M.; Pandey, A.; Singh, R. Implementing a novel TOPSIS-sine cosine algorithm-based hybrid optimization in machining medium-hardened steel. Sci Rep 2025, 15, 22740. [Google Scholar] [CrossRef] [Scilit]
  20. Lakshmanan, S.; Pradeep Kumar, M.; Dhananchezian, M. Optimization of turning parameter on surface roughness, cutting force and temperature through TOPSIS. Mater. Today Proc. 2023, 72, 2231–2237. [Google Scholar] [CrossRef] [Scilit]
  21. Maheswara Rao, C.; Srinivasa Reddy, P.; Suresh, D.; Jagadeesh Kumar, R. Optimization of turning process parameters using PSI-based desirability-grey analysis. In Recent Advances in Material Sciences; Pujari, S., Srikiran, S., Subramonian, S., Eds.; Lecture Notes on Multidisciplinary Industrial Engineering; Springer Singapore: Singapore, 2019; pp. 231–246. ISBN 9789811376429. [Google Scholar]
  22. Raja, P.; Sakthivel, M.; Kumar, T.S.; Petrů, J.; Kalita, K. Deep cryo treated tungsten carbide tools on AISI 1045 steel turning through grey relational analysis and preference selection index. Sci. Rep. 2025, 15, 18452. [Google Scholar] [CrossRef] [Scilit] [PubMed]
  23. Leksycki, K.; Feldshtein, E. Study of the finish turning process based on the parameter space investigation method. Int. J. Adv. Manuf. Technol. 2023, 126, 5487–5499. [Google Scholar] [CrossRef] [Scilit]
  24. Kuhn, M.; Johnson, K. Applied Predictive Modeling; Springer: New York, NY, USA, 2013; ISBN 978-1-4614-6848-6. [Google Scholar]
  25. ISO 4287:1997; Geometrical Product Specifications (GPS)—Surface Texture: Profile Method—Terms, Definitions and Surface Texture Parameters. International Organization for Standardization: Geneva, Switzerland, 1997.
  26. ISO 4288:1996; Geometrical Product Specifications (GPS)—Surface Texture: Profile Method—Rules and Procedures for the Assessment of Surface Texture. International Organization for Standardization: Geneva, Switzerland, 1996.
  27. SRPS C.A1.011:2004; Methods of Chemical Analyses—Optical Emission Spectrometric Method with Spark Excitation for Quantitative Chemical Analyses of Pig Iron, Cast Iron, Low-Alloyed Steels, High-Alloyed Steels, Aluminium Alloys and Copper Alloys. ISS: Belgrade, Serbia, 2004.
  28. Montgomery, D.C. Design and Analysis of Experiments, 9th ed.; John Wiley & Sons, Inc: Hoboken, NJ, USA, 2017; ISBN 978-1-119-32093-7. [Google Scholar]
  29. Van-Canh, N.; Anh-Thang, N.; Ngoc-Linh, P.; Thuy-Duong, N. Multi-objective optimization of SUS430C steel turning process using hybrid machine learning and evolutionary algorithm approach. Results Eng. 2025, 25, 104233. [Google Scholar] [CrossRef] [Scilit]
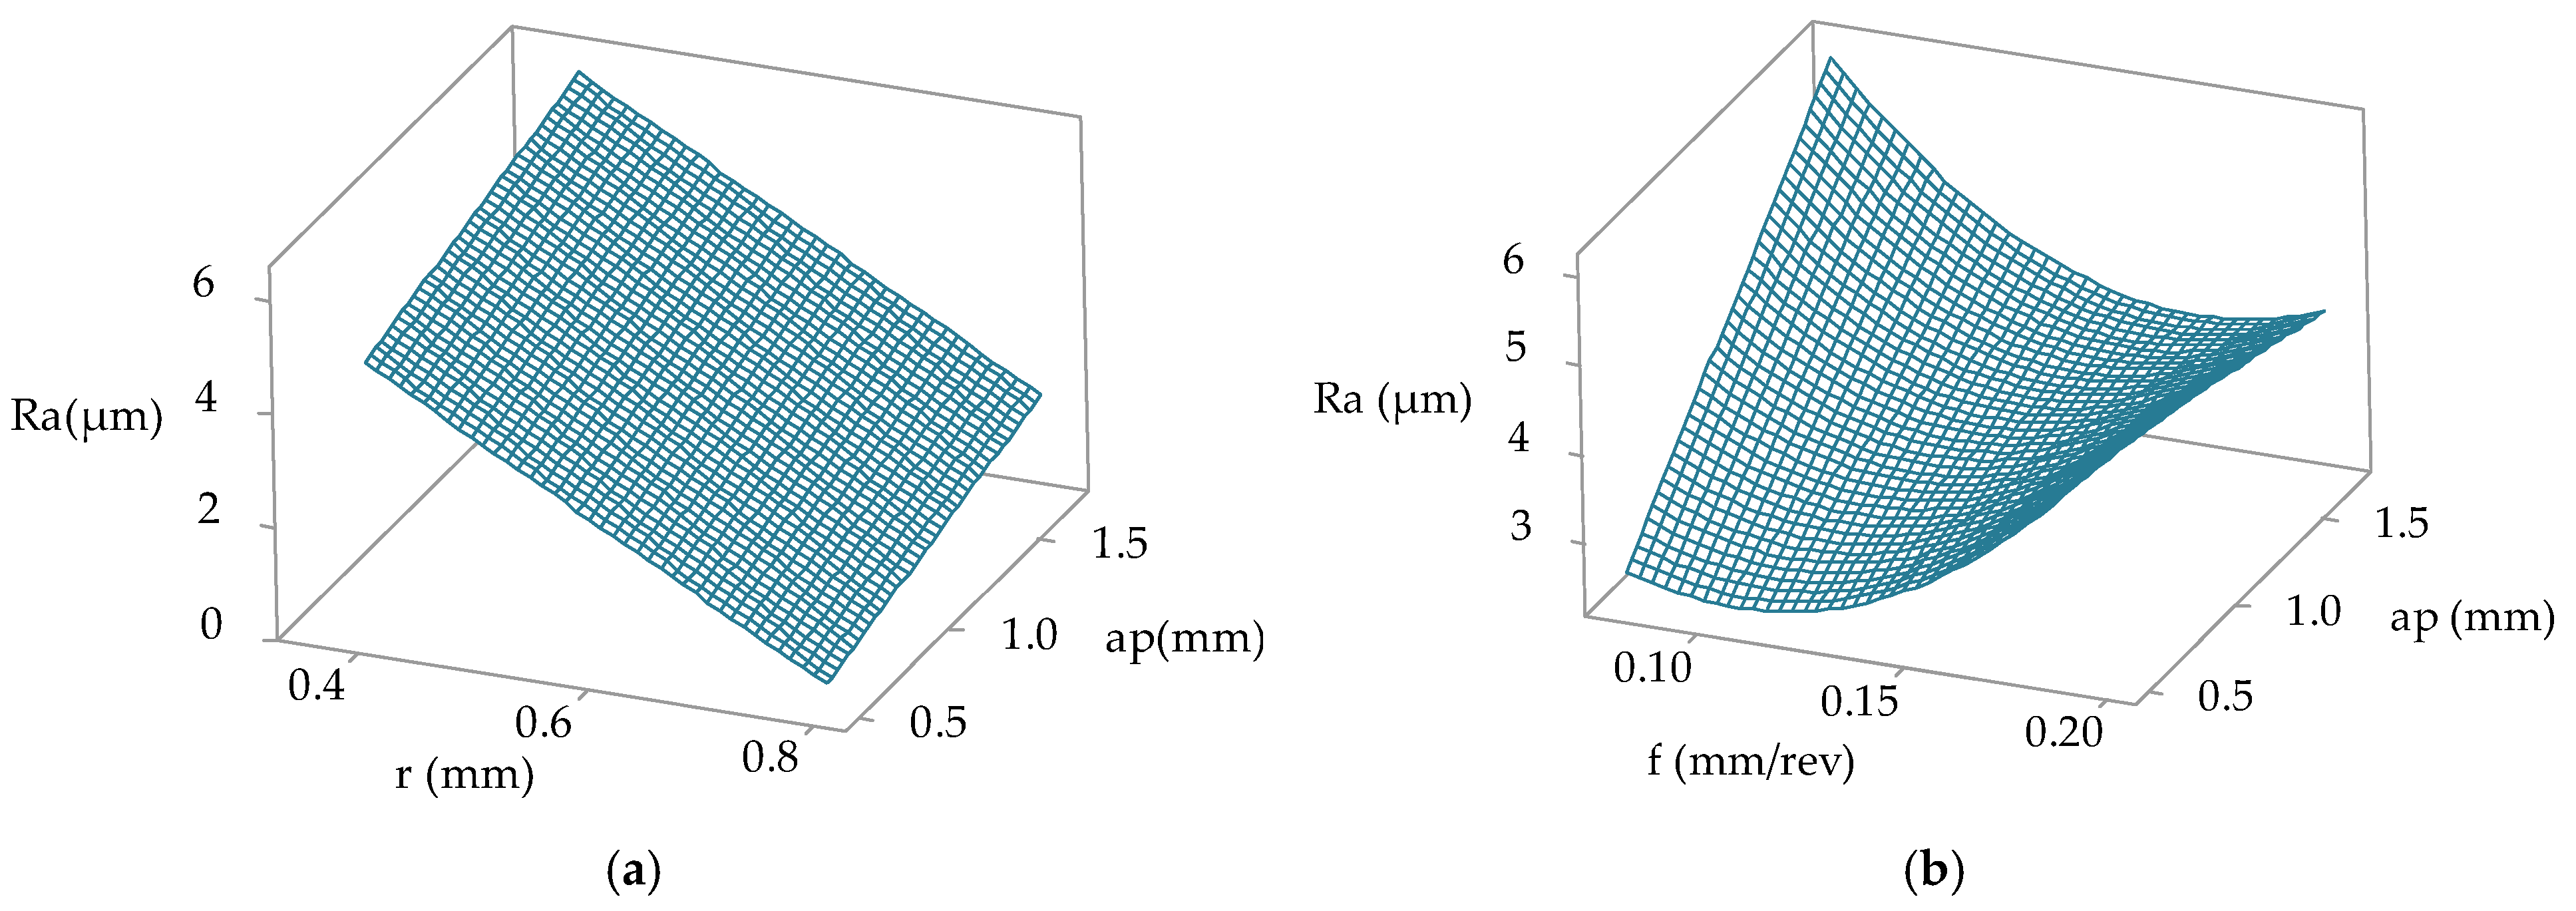
Figure 1. Response surface plots of R a : (a) R a vs. insert radius and depth of cut; (b) R a vs. feed and depth of cut.
Metals 16 00131 g001
Figure 2. Standardized residuals for surface roughness for RSM model.
Metals 16 00131 g002
Figure 3. Response surface plots of F c : (a) F c vs. feed and depth of cut; (b) F c vs. insert radius and depth of cut.
Metals 16 00131 g003
Figure 4. Standardized residuals for main cutting force for RSM model.
Metals 16 00131 g004
Figure 5. Response surface plots of the passive force: (a) F p vs. depth of cut and feed; (b) F p vs. insert radius and feed.
Metals 16 00131 g005
Figure 6. Standardized residuals for passive force for RSM model.
Metals 16 00131 g006
Figure 7. Response surface plots for the feed force: (a) F f vs. feed and depth of cut; (b) F f vs. insert radius and depth of cut.
Metals 16 00131 g007
Figure 8. Standardized residuals for feed force for RSM model.
Metals 16 00131 g008
Figure 9. Standardized residuals for surface roughness for SVR model.
Metals 16 00131 g009
Figure 10. Standardized residuals for main cutting force for SVR model.
Metals 16 00131 g010
Figure 11. Standardized residuals for feed force for SVR model.
Metals 16 00131 g011
Figure 12. Standardized residuals for passive force for SVR model.
Metals 16 00131 g012
Figure 13. Preference indicator for each alternative.
Metals 16 00131 g013
Table 1. Input parameters and their levels in the experiment.
No.Name SymbolUnitLevel
123456
1Cutting speed v c m/min100130160200230260
2Depth of cut a p mm0.50.81.11.41.7-
3Feed f mm/rev0.080.110.150.20--
4Insert radius r mm0.40.8----
Table 2. The chemical composition of 42CrMo4.
C (%)Mn (%)Si (%)P (%)S (%)Cr (%)Ni (%)Cu (%)Al (%)Co (%)Ti (%)
0.3460.7260.1830.0140.0150.9500.1650.1820.0050.0060.002
Table 3. ANOVA results for R a .
SourceDFSeq SSAdj MSF-Valuep-ValueContribution [%]
Model61089.83181.63925.800.00045.56
v c 15.1012.3241.750.1870.21
f 10.100.6300.090.7650.00
a p 147.1240.1175.700.0181.97
r 1937.53927.775131.790.00039.19
f × f 137.8538.3195.440.0211.58
f × a p 162.1362.1328.830.0032.60
Error1851302.357.040
Total1912392.18
Table 4. ANOVA results for F c .
SourceDFSeq SSAdj MSF-Valuep-ValueContribution [%]
Model8114134321426679337.860.00093.66
v c 115620131783.120.0790.13
f 139106594067384963.210.00032.09
a p 1576897962409131477.930.00047.34
r 1822539933833221.140.0006.75
a p × a p 113550811257826.660.0001.11
f × a p 1631975652581154.540.0005.19
f × r 1798448123319.240.0000.66
a p × r 1483084830811.440.0010.40
Error1837727614223
Total19112186193
Table 5. ANOVA results for F p .
SourceDFSeq SSAdj MSF-Valuep-ValueContribution [%]
Model8102263012782938.440.00062.69
v c 144023324369.750.0022.70
f 1444350460501138.480.00027.24
a p 1797688763526.350.0004.89
r 114479218704356.250.0008.88
a p × a p 116395814597543.900.00010.05
f × a p 1313503576410.750.0011.92
f × r 1494765074915.260.0003.03
a p × r 1649146491419.520.0003.98
Error1836085513325
Total1911631181
Table 6. ANOVA results for F f .
SourceDFSeq SSAdj MSF-Valuep-ValueContribution [%]
Model8632350579043896.080.00080.77
v c 1392064720.790.3760.05
f 1777375853515103.750.0009.93
a p 138903934224435513.480.00049.69
r 157485372566388.200.0007.34
a p × a p 164359400434.870.0290.82
f × a p 146056249712160.430.0005.88
f × r 124865525481930.970.0003.18
a p × r 130338830338836.880.0003.88
Error18315055438227
Total1917829049
Table 7. SVR metrics for all outputs.
Output R 2 _TrainRMSE_TrainMAE_Train R 2 _TestRMSE_TestMAE_Test
R a 89.91%0.06800.024409889.92%0.18820.0972
F c 99.39%0.01530.010079796.82%0.03900.0270
F p 95.45%0.03620.0151485880.43%0.08160.0466
F f 99.16%0.01630.0097503893.73%0.05100.0310
Table 8. OFAT sensitivity analysis results.
R a F c F p F f
OFAT Absolute EffectOFAT Effect [%]OFAT Absolute EffectOFAT Effect [%]OFAT Absolute EffectOFAT Effect [%]OFAT Absolute EffectOFAT Effect [%]
v c 0.0387.56%0.0586.21%0.19023.74%0.0335.18%
f 0.18536.96%0.35537.74%0.26733.31%0.13020.29%
a p 0.23346.45%0.43846.58%0.27534.27%0.39461.24%
r 0.0459.03%0.0899.47%0.0708.69%0.08513.29%
Table 9. Response table for preference indicator—PSI-TOPSIS method.
Input ParameterLevel
123456
v c 0.75340.72370.73830.74350.71950.7247
a p 0.83320.79730.74900.62080.6581-
f 0.78640.78360.71350.6469--
r 0.66110.8047----
Table 10. Response table for preference indicator—GRA method.
Input ParameterLevel
123456
v c 0.71260.68470.69700.69980.68440.6900
a p 0.80670.72740.67990.60550.6446-
f 0.75230.72520.67590.6193--
r 0.64190.7461----
Table 11. ANOVA results for the PSI-TOPSIS method.
SourceDFSeq SSAdj MSF-Valuep-ValueContribution [%]
v c 50.026660.004780.850.5180.67
f 30.621670.2245339.820.00015.63
a p 41.265740.3246657.580.00031.82
r 11.060281.06028188.050.00026.65
Error1781.003630.00564
Total1913.97798
Table 12. ANOVA results for the GRA method.
SourceDFSeq SSAdj MSF-Valuep-ValueContribution [%]
v c 50.016930.0025751.140.3430.68
f 30.492400.17622777.770.00019.90
a p 40.964790.254458112.290.00038.99
r 10.597060.597063263.480.00024.13
Error1780.403350.002266
Total1912.47453
Disclaimer/Publisher’s Note: The statements, opinions and data contained in all publications are solely those of the individual author(s) and contributor(s) and not of MDPI and/or the editor(s). MDPI and/or the editor(s) disclaim responsibility for any injury to people or property resulting from any ideas, methods, instructions or products referred to in the content.