Article

Performance Evaluation of Five-Axis CNC Milling via Spindle Current and Vibration Monitoring

1
Faculty of Engineering, University of Porto, Rua Dr. Roberto Frias, 4200-465 Porto, Portugal
2
SISMA—Sá Couto & Monteiro, SA, R. António Ferreira da Silva 20, 4475-181 Maia, Portugal
3
LAETA/INEGI, Institute of Science and Innovation in Mechanical and Industrial Engineering, R. Dr. Roberto Frias 400, 4200-465 Porto, Portugal
*
Author to whom correspondence should be addressed.
Metals 2026, 16(1), 129; https://doi.org/10.3390/met16010129
Submission received: 10 December 2025 / Revised: 14 January 2026 / Accepted: 19 January 2026 / Published: 22 January 2026
(This article belongs to the Special Issue Numerical and Experimental Advances in Metal Processing, 2nd Edition)

Abstract

The digitalization of machining processes is increasingly recognized as essential for achieving higher productivity, reliability, and traceability. However, access to reliable in-process sensor data remains limited, particularly in multi-axis CNC machining, where dimensional accuracy and surface integrity strongly depend on stable and optimized process conditions. This study investigates sensor-based monitoring as a practical approach for evaluating process performance in five-axis CNC milling. Electric current and vibration signals were acquired during three machining operations, under distinct cutting parameters, using current clamps and a plug-and-play MEMS accelerometer. The signals were processed using the root mean square method to assess the correlation between sensor data and machining conditions. Dimensional inspection of each workpiece was carried out to verify geometric conformity. The results show that spindle current measurements exhibit a strong linear correlation with material removal rate and cutting power, supporting their use as indicators of cutting forces and energy consumption. Vibration signals revealed pronounced dynamic behaviour for specific tool orientations, particularly in transverse to tool axis direction. The proposed methodology provides a simple and low-cost framework for integrating sensor-based monitoring into five-axis CNC milling, particularly relevant for semi-roughing operations, and offers a basis for future studies on process optimization and real-time condition monitoring.

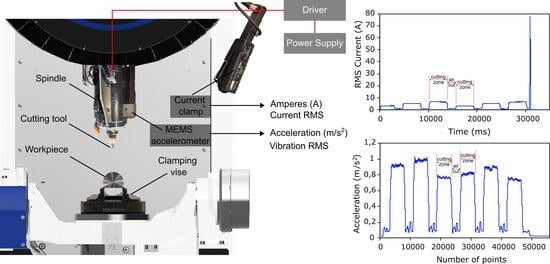
Graphical Abstract

1. Introduction

Five-axis CNC milling plays a crucial role in various manufacturing sectors, including the mould industry, aerospace, and medical devices, as well as in other applications that require the production of complex geometries and tight tolerances. Despite its flexibility, there are challenges related to process stability, vibration and tool wear [1]. In this context, sensor-based monitoring, for instance through signals such as cutting force, vibration and current, has become essential to improve reliability, detect faults and support process optimisation [2,3,4]. The main objective of this work is to develop and validate a strategy that enables the monitoring and optimisation of a five-axis CNC milling by employing an efficient machining strategy, integrating sensors and applying signal analysis techniques. There is also focus on establishing correlations between the signals and machining quantities, such as the cutting parameters and surface finish quality, as the effectiveness of digital twin systems relies of the robustness of such correlations. Within the context of Industry 4.0, sensor-based data acquisition is a prerequisite for data-driven machining. However, the development of reliable digital twins for milling processes requires a solid understanding of sensor selection and signal analysis techniques. In particular, it is necessary to identify which signals are most relevant and how they relate to physical phenomena and process outcomes, in order to enable real-time monitoring and optimisation of five-axis CNC milling operations.
In machining monitoring, vibration and spindle current signals are widely used due to their sensitivity to tool condition and ease of acquisition without interfering with operations [5,6]. Accelerometers mounted on the spindle enable the detection of chatter and process instabilities by capturing dynamic oscillations in multiple directions [7,8]. While vibration signals provide direct information on the dynamic behavior of the tool–workpiece system and can be particularly effective for detecting chatter, spindle current signals offer an indirect but robust estimation of the cutting forces, reflecting variations in load (i.e., tool wear-induced changes), material removal rate, and tool engagement.
Li et al. [9] emphasised the benefits of spindle-integrated sensors, as the prediction of chatter stability in machining is challenging and may be less accurate. These typically rely on piezoelectric sensors, which offer high sensitivity but are costly and complex to integrate. Alternatively, approaches based on eddy-current or proximity sensing, such as the one proposed by Hao Jiang et al. [10], require precise alignment and a reference surface on the workpiece, making their setup challenging. Recently, novel MEMS-based sensing concepts have emerged, offering low-cost and easily integrable alternatives for real-time vibration and chatter monitoring, as is the case of the present study [11].
Current monitoring provides a practical and non-invasive method to estimate cutting loads, with changes in motor current being closely related to tool wear [6]. Zhou et al. [12] demonstrated that current-based monitoring can perform comparably to direct force measurements, particularly when enhanced by advanced signal processing techniques.
Among the various signal processing techniques, the Root Mean Square (RMS) is extensively applied due to its simplicity and effectiveness in quantifying acceleration values over time [12,13,14]. RMS is particularly suitable for stationary conditions and is frequently used alongside Fast Fourier Transformation (FFT) for detecting frequency components associated with chatter [8,14]. RMS captures the effective energy of the signal, and when applied to the eletric current it could be sensitive to tool wear (usually increases with wear).
This work investigates the use of sensor-based monitoring, focusing on electrical current and vibration signals, as a mean to evaluate energy consumption and process dynamics during five-axis CNC milling. This analysis was centered on the production of a precision steel part, which served as a case study. Three machining operations were monitored under varying cutting parameters, in which electric current and vibration signals were obtained using current clamps and a MEMS accelerometer, respectively. Both types of signals were processed using the Root Mean Square (RMS) method to assess the relevance of the extracted information, with particular emphasis on their relationship with the cutting parameters. This analysis provides a basis for understanding how sensor signals reflect the machining conditions, which is a necessary step towards the development of digital twins for machining processes and real-time process optimisation. In addition, each produced workpiece was submitted to quality control to verify the dimensional accuracy and geometric tolerances. Despite the widespread use of spindle current and vibration signals for process monitoring, most studies are conducted under controlled laboratory conditions, which limits their direct applicability in industrial scenarios. In practical five-axis milling operations, factors such as complex tool paths, multi-pass cutting, variable material engagement, and tool wear can affect the reliability of sensor-based monitoring. The maturity of these technologies under real industrial conditions is still low, highlighting the need for further investigation. The main objectives of this study are to evaluate the applicability and robustness of spindle current and vibration monitoring in industrial five-axis milling, to investigate their relationship with cutting parameters, process stability, and dimensional quality, and to identify the practical conditions under which these sensors can provide reliable information to support process monitoring and optimization. Only by demonstrating such robustness under realistic industrial conditions can these sensing approaches contribute to advancing Industry 4.0 applications, enabling the development of digital models capable of real-time predictions and process corrections.

2. Materials and Methods

The workpiece material was the 42CrMo4 steel, a low-alloyed steel classified as ISO P2, characterized by high strength and hardness, which contribute to its low machinability and accelerated tool wear [15]. Its chemical composition, presented in Table 1, includes abrasive alloying elements such as Cr and Mo, while the low sulphur content limits lubricating effects, further compromising machinability [15]. The main mechanical properties, shown in Table 2, confirm the material’s high strength and moderate ductility, reinforcing the need for optimised cutting strategies, highlight the potential of this practical example for exploring and validating sensor integration strategies.
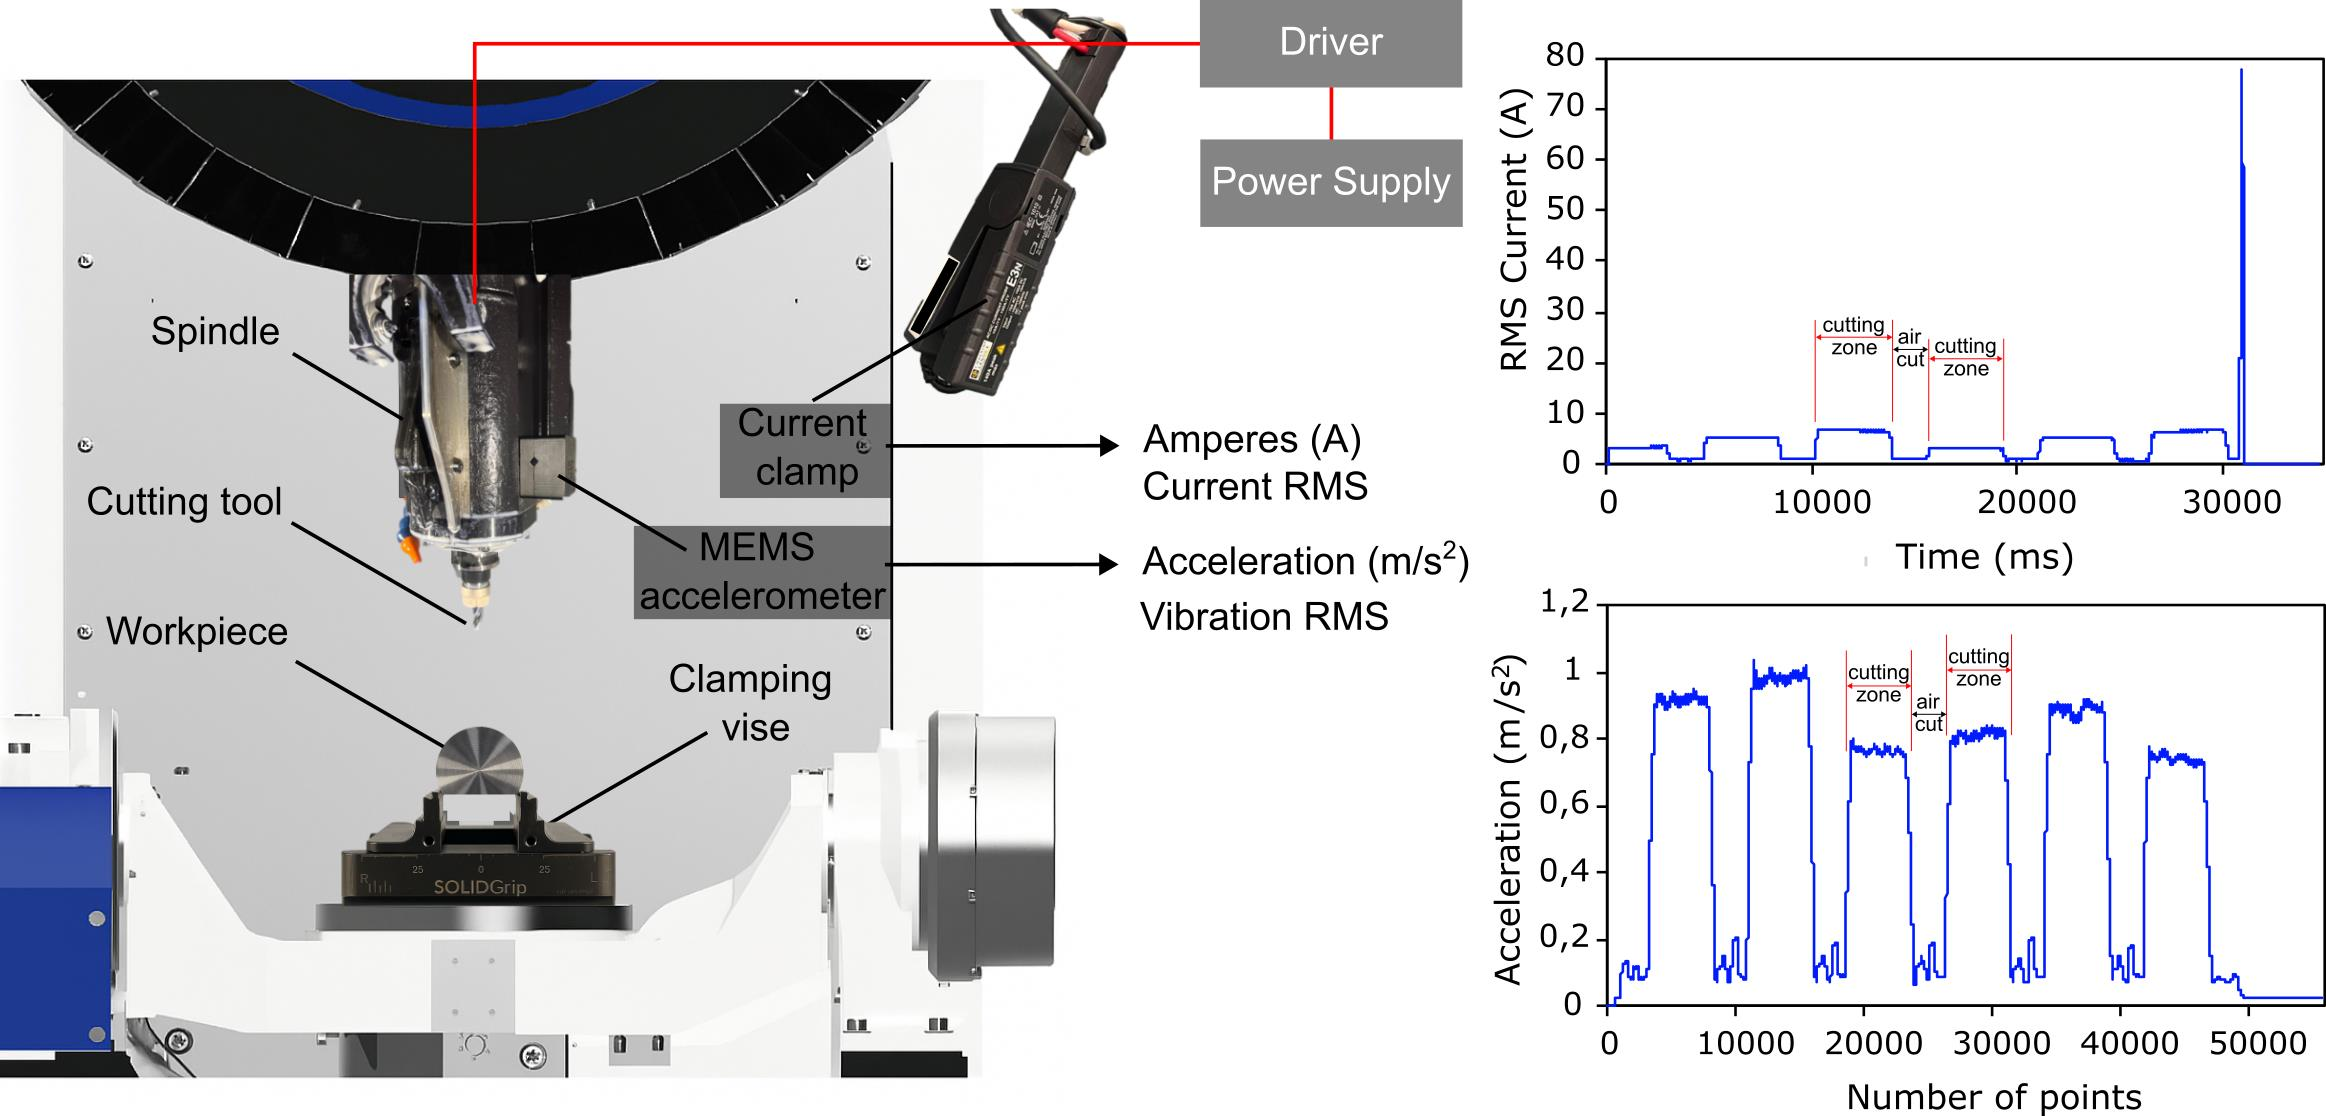
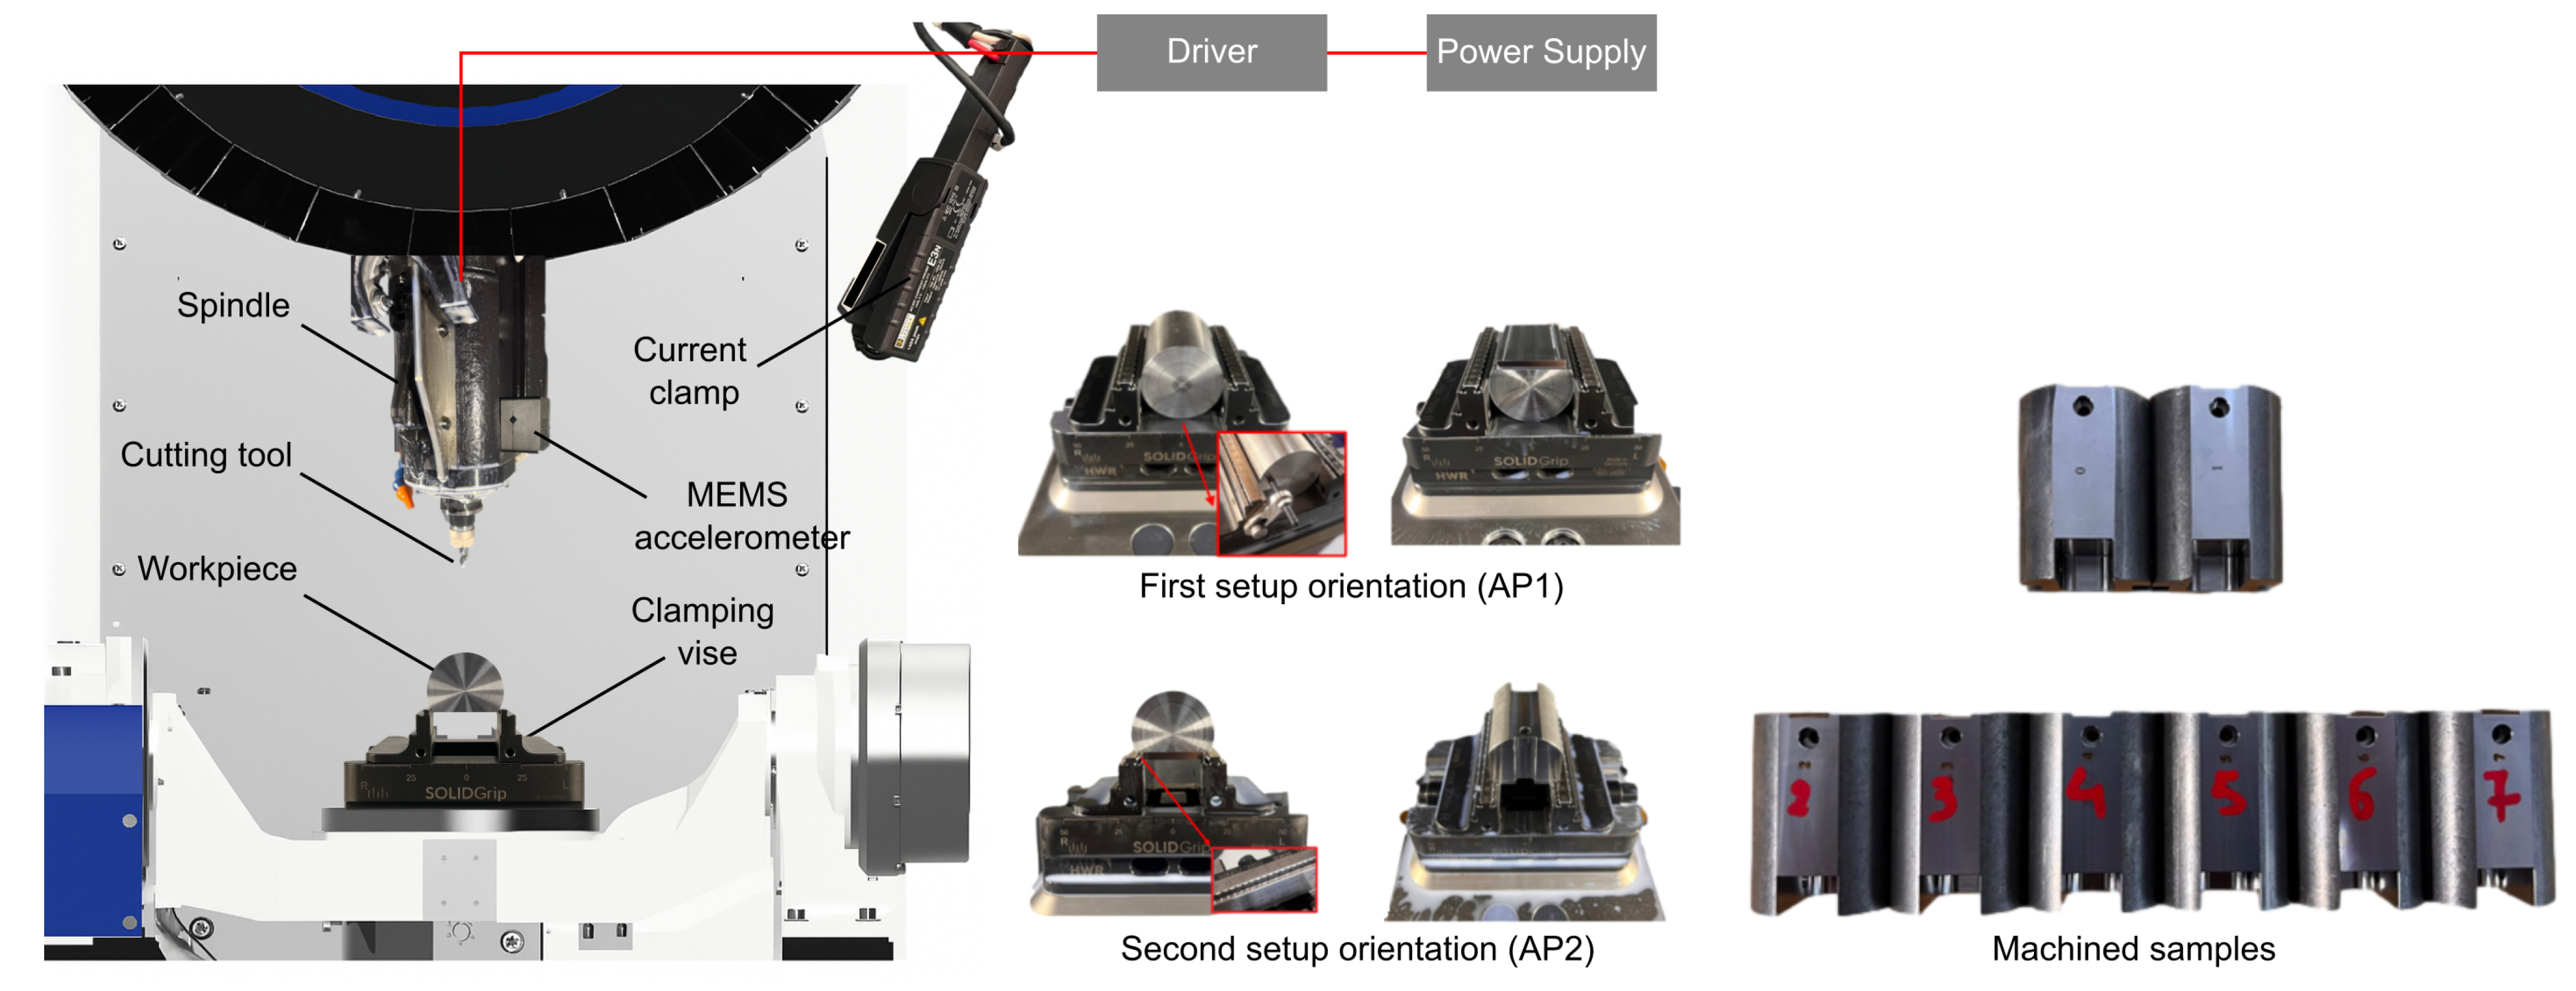
The experimental work was conducted on a five-axis CNC machine (Brother U500Xd2 5AX, Brother Industries, Ltd., Nagoya, Japan), illustrated in Figure 1. The spindle is capable of delivering a maximum power of 15.4 kW, with a maximum torque of 27 Nm and rotational speed of 16,000 rpm. Furthermore, the spindle is driven by a three-phase motor that functions on alternating current (AC) with 200 to 230 V. This high spindle speed is combined with a BT30 tool interface.
The machining strategy was defined through an iterative process integrating empirical insights from experienced engineers, tool supplier recommendations and CAM-based simulations. Initial machining tests revealed limitations in chip evacuation during drilling and part accessibility, leading to a progressive refinement of the plan. The final approach relied on two distinct setups, shown in Figure 1 as AP1 (first setup orientation) and AP2 (second setup orientation). Eight workpieces were machined to validate, monitor and optimise the milling process, as illustrated in Figure 1. Part No. 0 was used to confirm the milling strategy (path), and part No. 1 was used as a baseline for cutting parameters, while the remaining 6 (No. 2 to 7) were used as experimental testing (varying cutting parameter), as will be further explained.
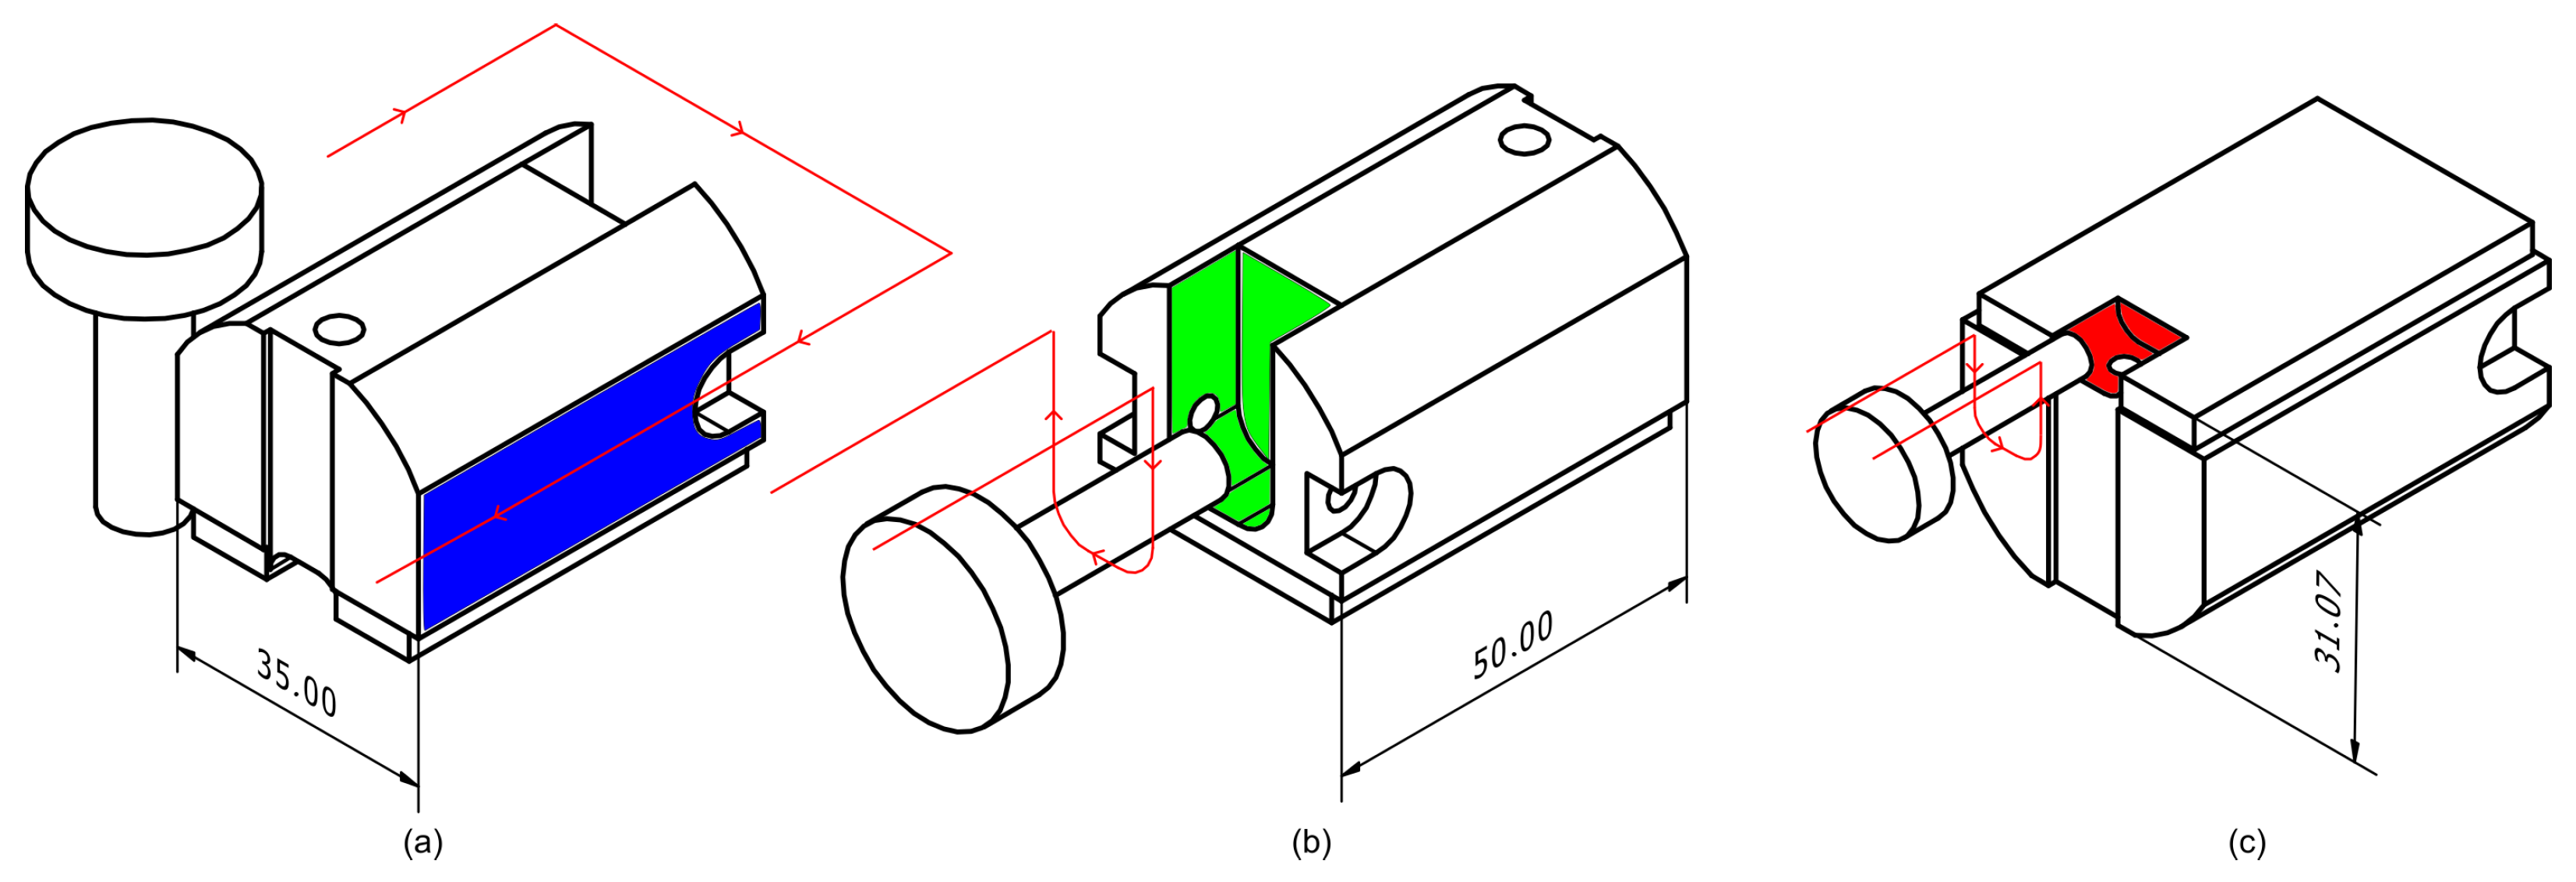
AP1 corresponds to the production of the reference surfaces required for the subsequent setup, AP2, which provides full access to the remaining features, including the front and back faces. Since the second setup encompasses the most critical machining operations, the focus of this study and subsequent analysis was placed on 3 operations of this clamping configuration. Due to the high number of operations in the part, three milling operations were selected for monitoring: one peripheral roughing (OP1), one oblong contouring (OP13) and one slot feature combining roughing and finishing (OP15), all represented in Figure 2. These operations involve different mill diameters (10, 8 and 5 mm) and cutting conditions, offering a representative set of tool engagements and geometries.
The first operation, OP1 (highlighted blue), consisted of three lateral passes on each side of the part, resulting in a total of 6 passes performed with a 10 mm diameter end mill. With each pass, the axial depth of cut ( a p ) increased, while the radial depth of cut ( a e ) remained constant. OP13 corresponds to the roughing of the oblong (highlighted green) on the back face of the part, using a 8 mm diameter end mill. Ten passes were made, keeping the axial cutting depth constant, while the radial depth varied along the path. OP15 involves roughing and finishing of a slot (highlighted red), using a 5 mm end mill. Thirteen roughing passes were performed with constant axial and variable radial depth. In addition, the tool performed two finishing passes, removing an additional 0.03 mm of the side surface, an approach that allowed us to study the sensitivity of the signals under light cutting conditions.
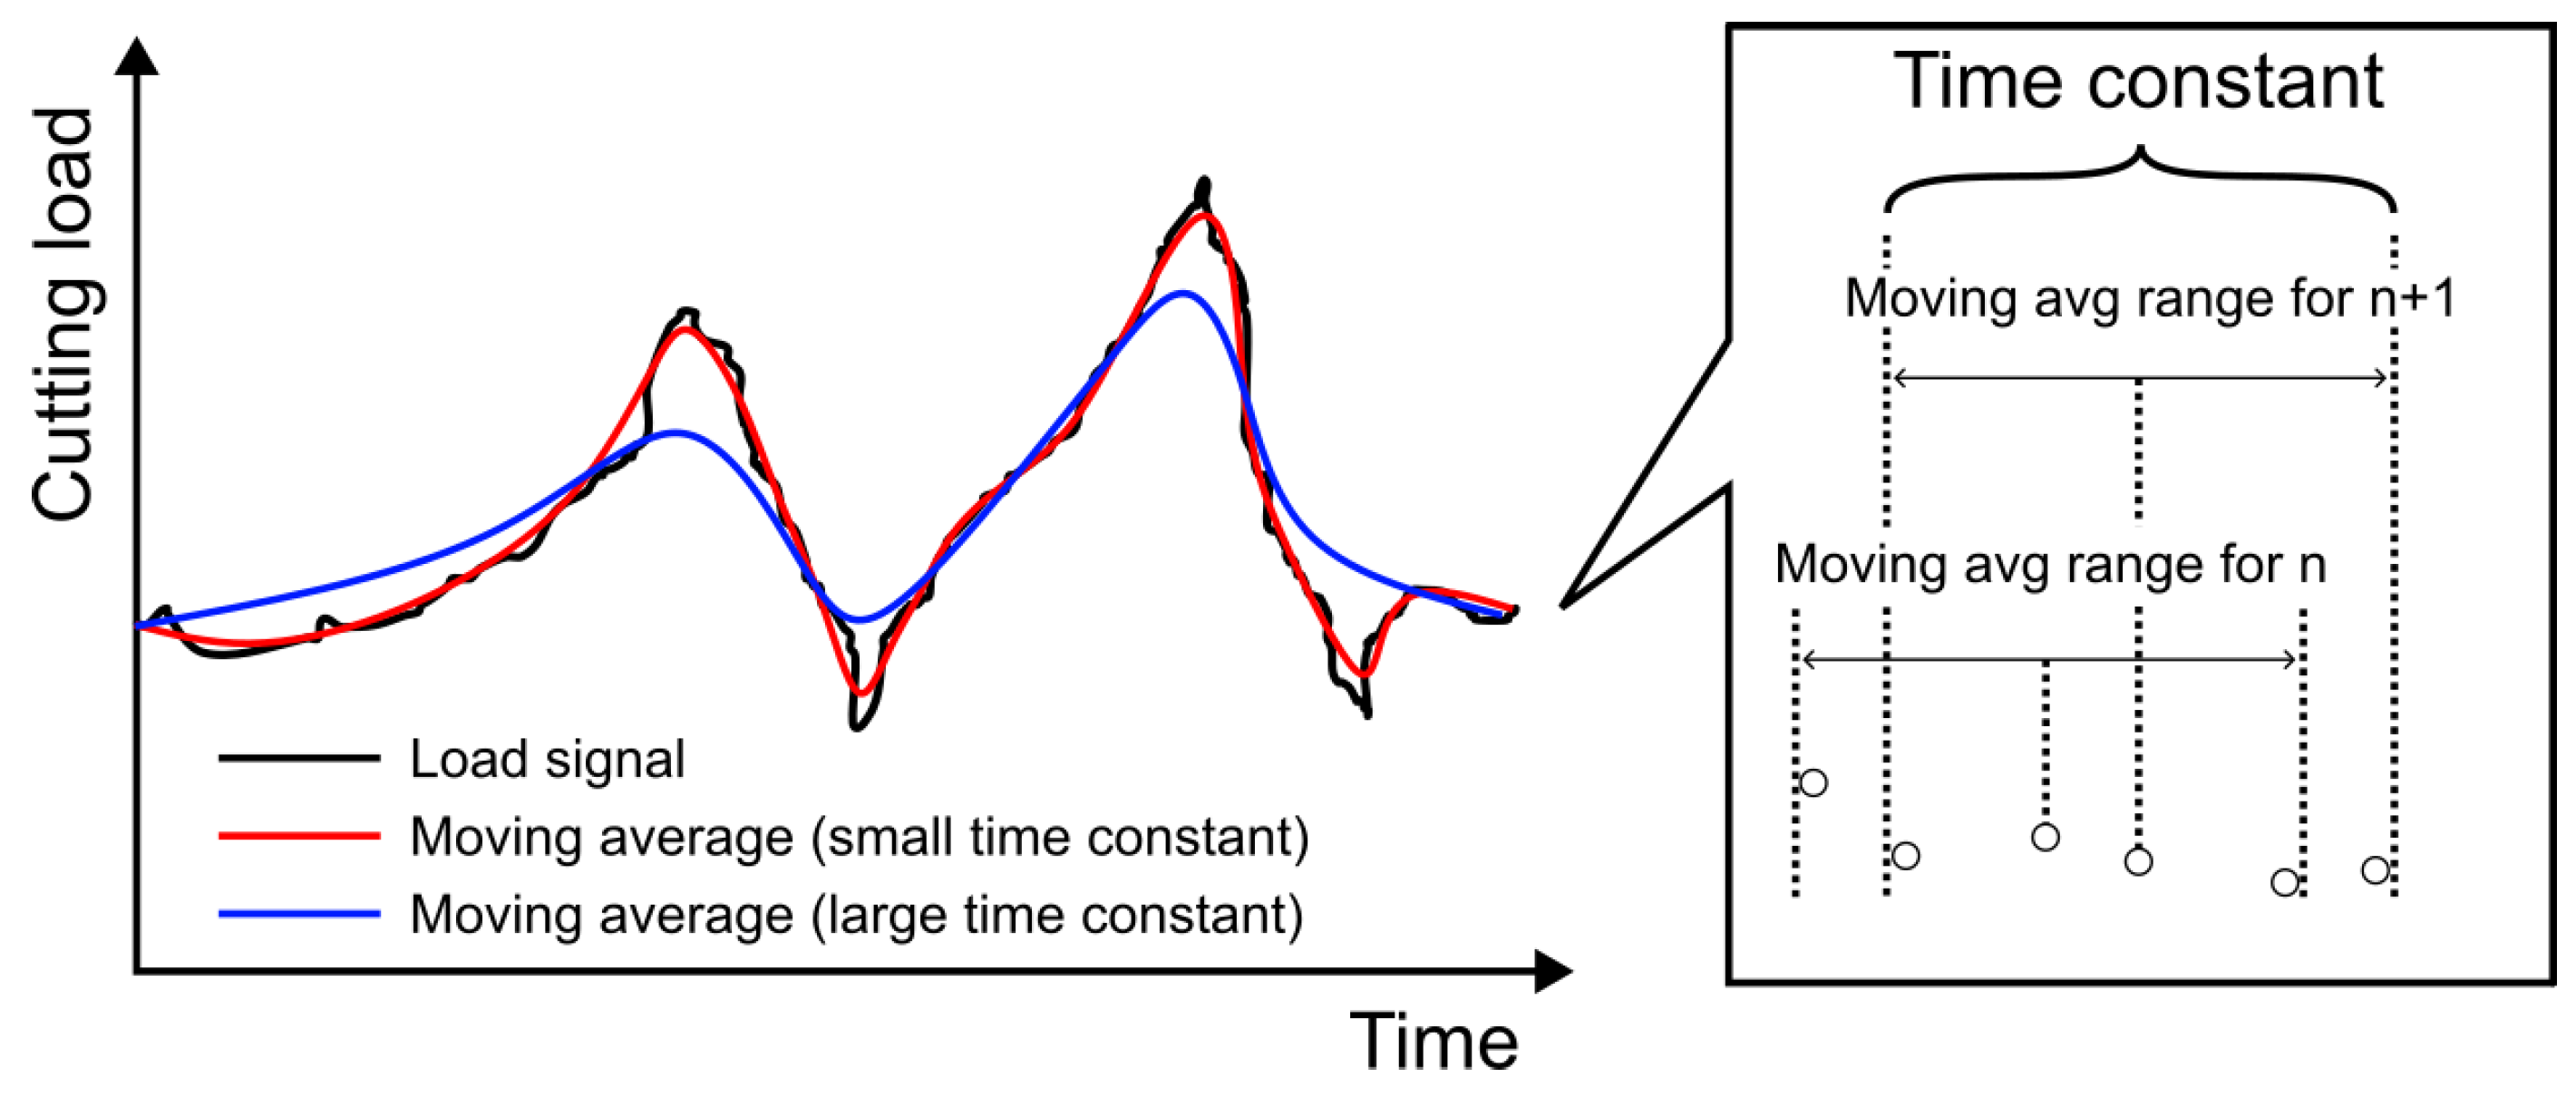
Process monitoring was performed using three different sensing approaches: (i) an E27 AC/DC current clamp, connected to one of the spindle drive phases and interfaced with an NI USB-6210 DAQ, with 1000 Hz of sampling rate; (ii) vibration signal was captured using a wireless 3-axis MEMS accelerometer (MPU-6886, TDK Sensing Solutions, Tokyo, Japan) with ±16 g range and 16-bit resolution, magnetically mounted on the spindle case flat surface (refer to Figure 1) for optimal sensitivity, with a sampling rate was 1500 Hz and (iii) the CNC machine’s internal machining load monitoring function was used to estimate spindle torque in real time, with peak and average modes computed over a 100 ms window, as displayed in Figure 3. The torque was estimated by signals from the servo motor that are provided by the machine’s built-in load monitoring function, which can be activated by the M-code (M341).
Dimensional and geometric quality control was carried out using a coordinate measuring machine (CMM). All inspections were repeated systematically to ensure traceability and validate the process consistency. This approach enabled a complete evaluation of part conformity and supported the correlation between machining conditions and output quality.
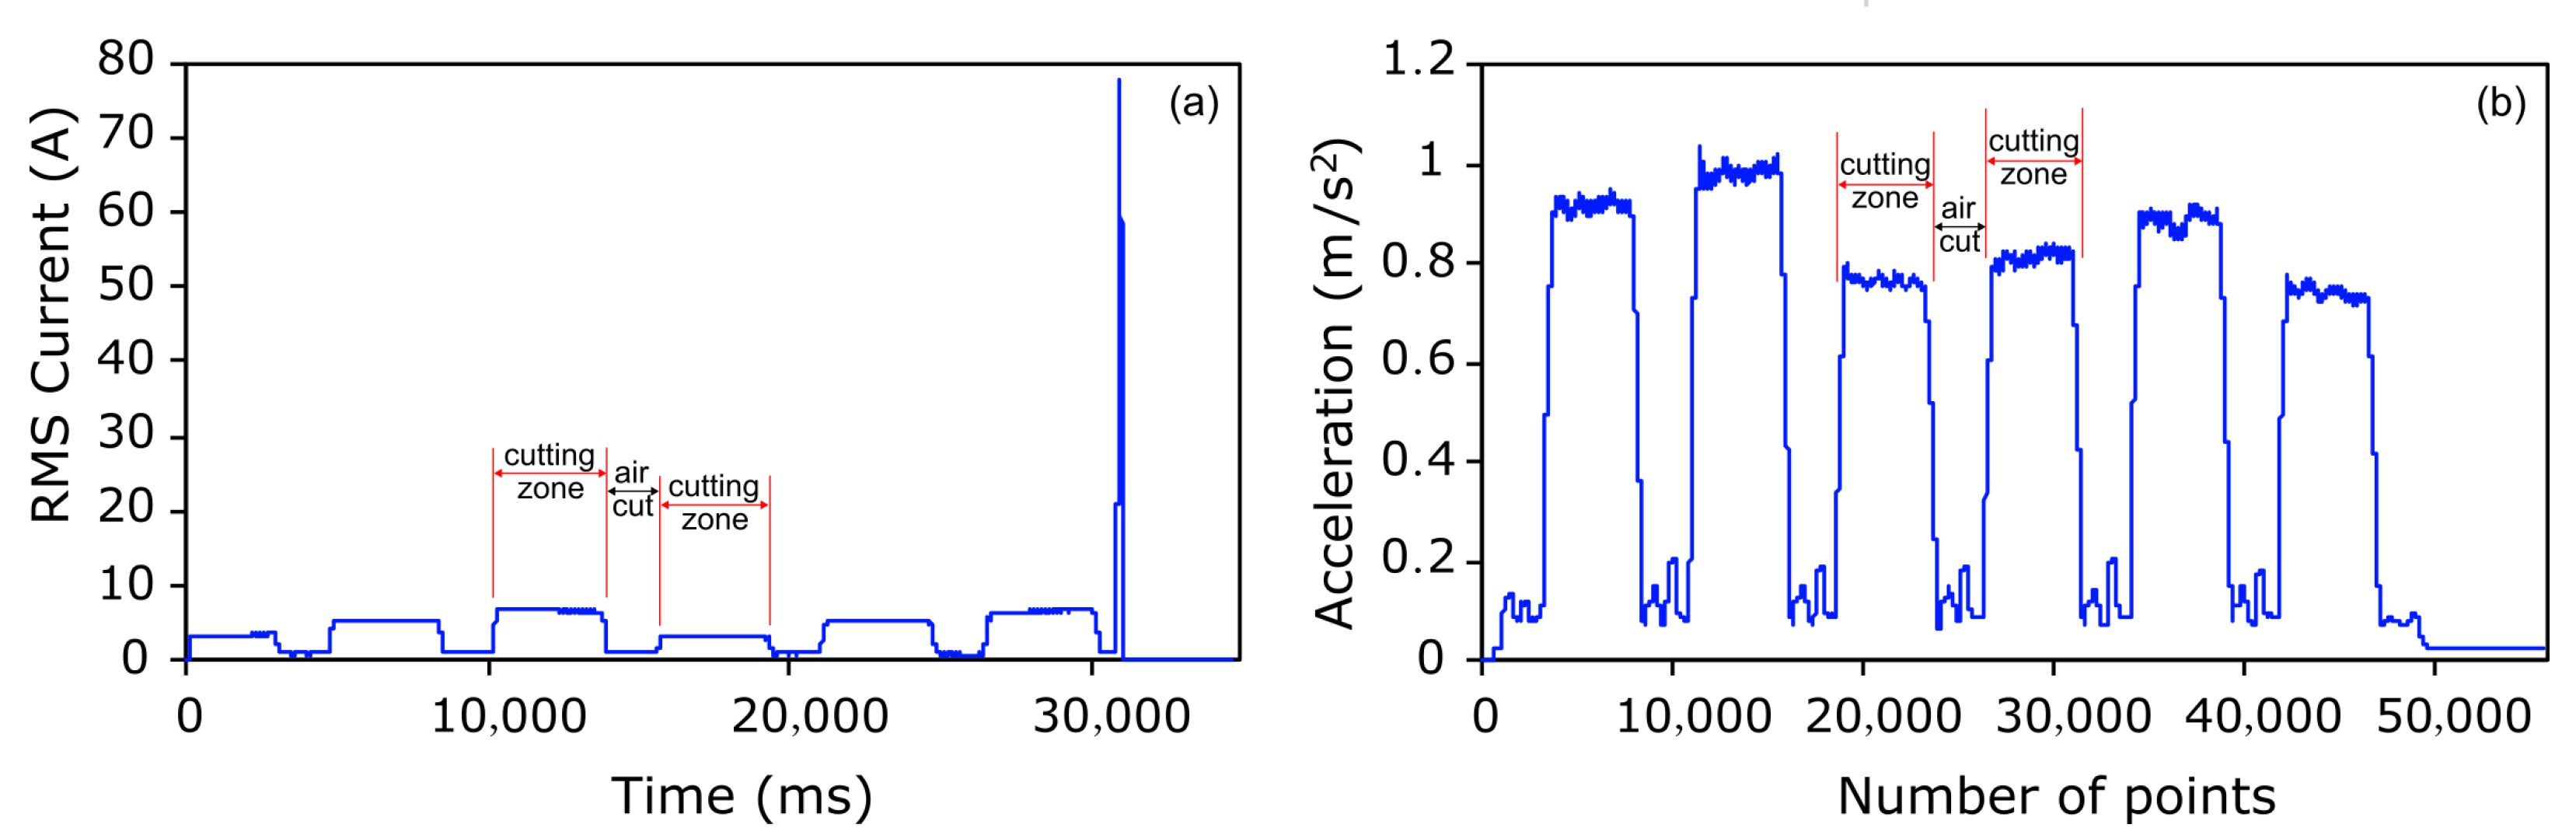
To analyse and process the signals, the RMS method (see Equation (1)) was applied to estimate the mean current (A) value and the mean acceleration (m/s2) values. Subsequently, the data were segmented into windows, the mean value was calculated over each segment and a global RMS value representative of the test was obtained by calculating the average of the six mean values (as shown in Figure 4a,b). This approach enables both local current and vibration estimation during each individual pass and a consistent comparison across different trials. Additionally, the impact of idle time is minimised.
R M S = 1 N t = 1 N ( x ( t ) ) 2
In the case of current, air cutting times were also analysed to calculate total energy consumption. The RMS value of the idle current was calculated in air cutting segments, excluding tool entry and exit peaks. This baseline reflects current consumption between tool passes and enables comparison with cutting values. Workpiece 1 was used as a reference and in the subsequent parts, variations in cutting speed and feed per tooth were introduced to study the impact of cutting parameters. It is important to note that, due to accelerometer data collection failure, tests 6 and 7 were excluded, and only four tests were valid for operation 15. The cutting parameters used in each test for each operation are represented in Table 3, Table 4 and Table 5. To evaluate the influence of cutting parameters on process behaviour, the cutting speed, v c , and feed per tooth, f z , varied around the reference condition (test 1). From trials 2 to 5, v c was increased or decreased around 30%, while f z was kept constant and vice-versa. The final two trials involved simultaneous variation in both parameters. It is important to note that, in some cases, the adjustment percentage was limited to avoid exceeding the recommended values by the tool manufacturer.

3. Results and Discussion

3.1. Current Analysis

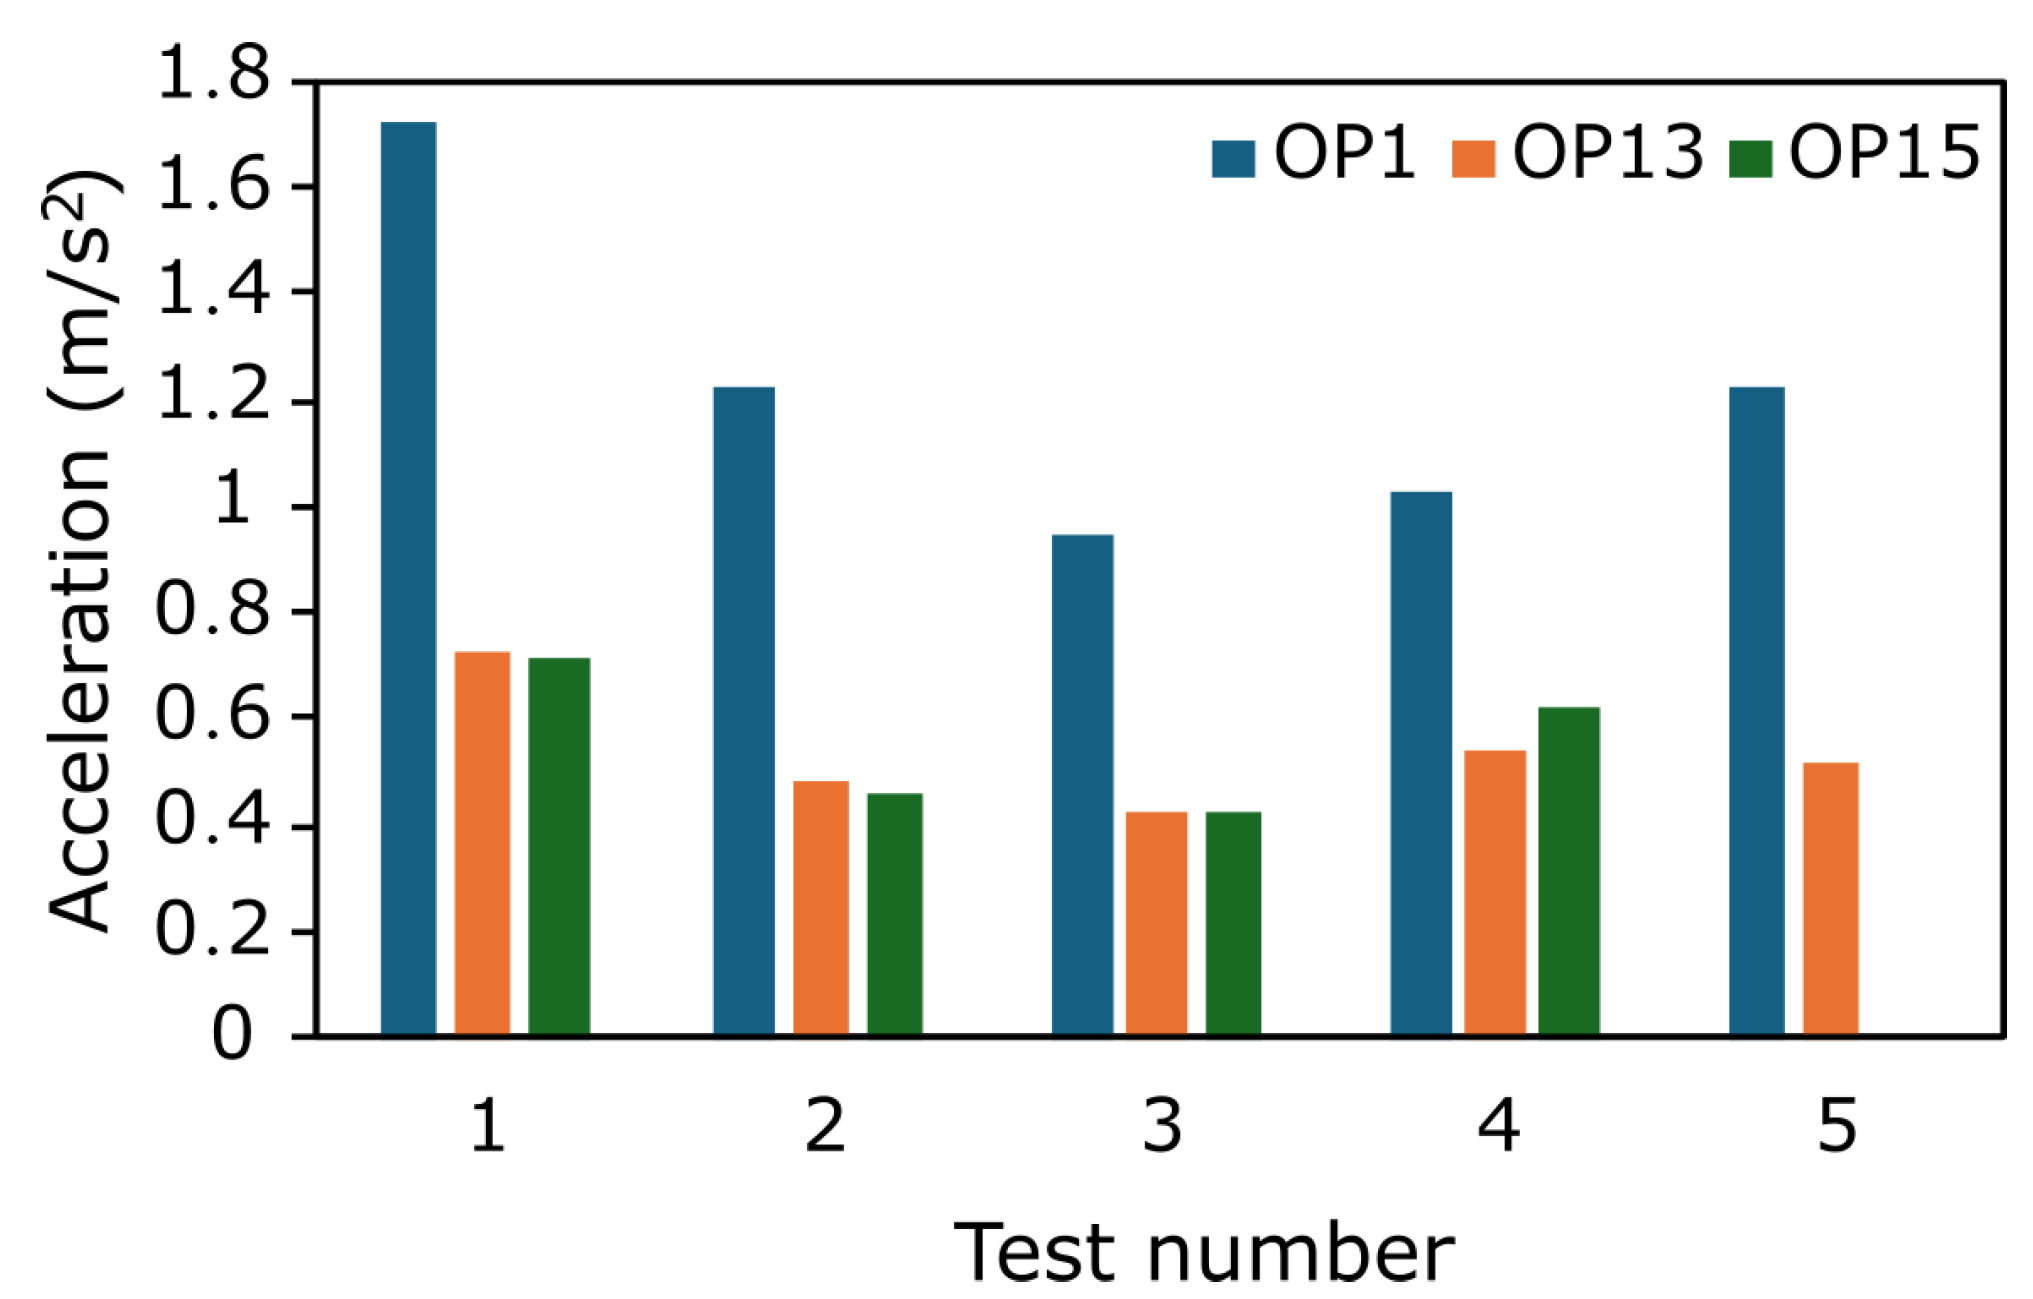
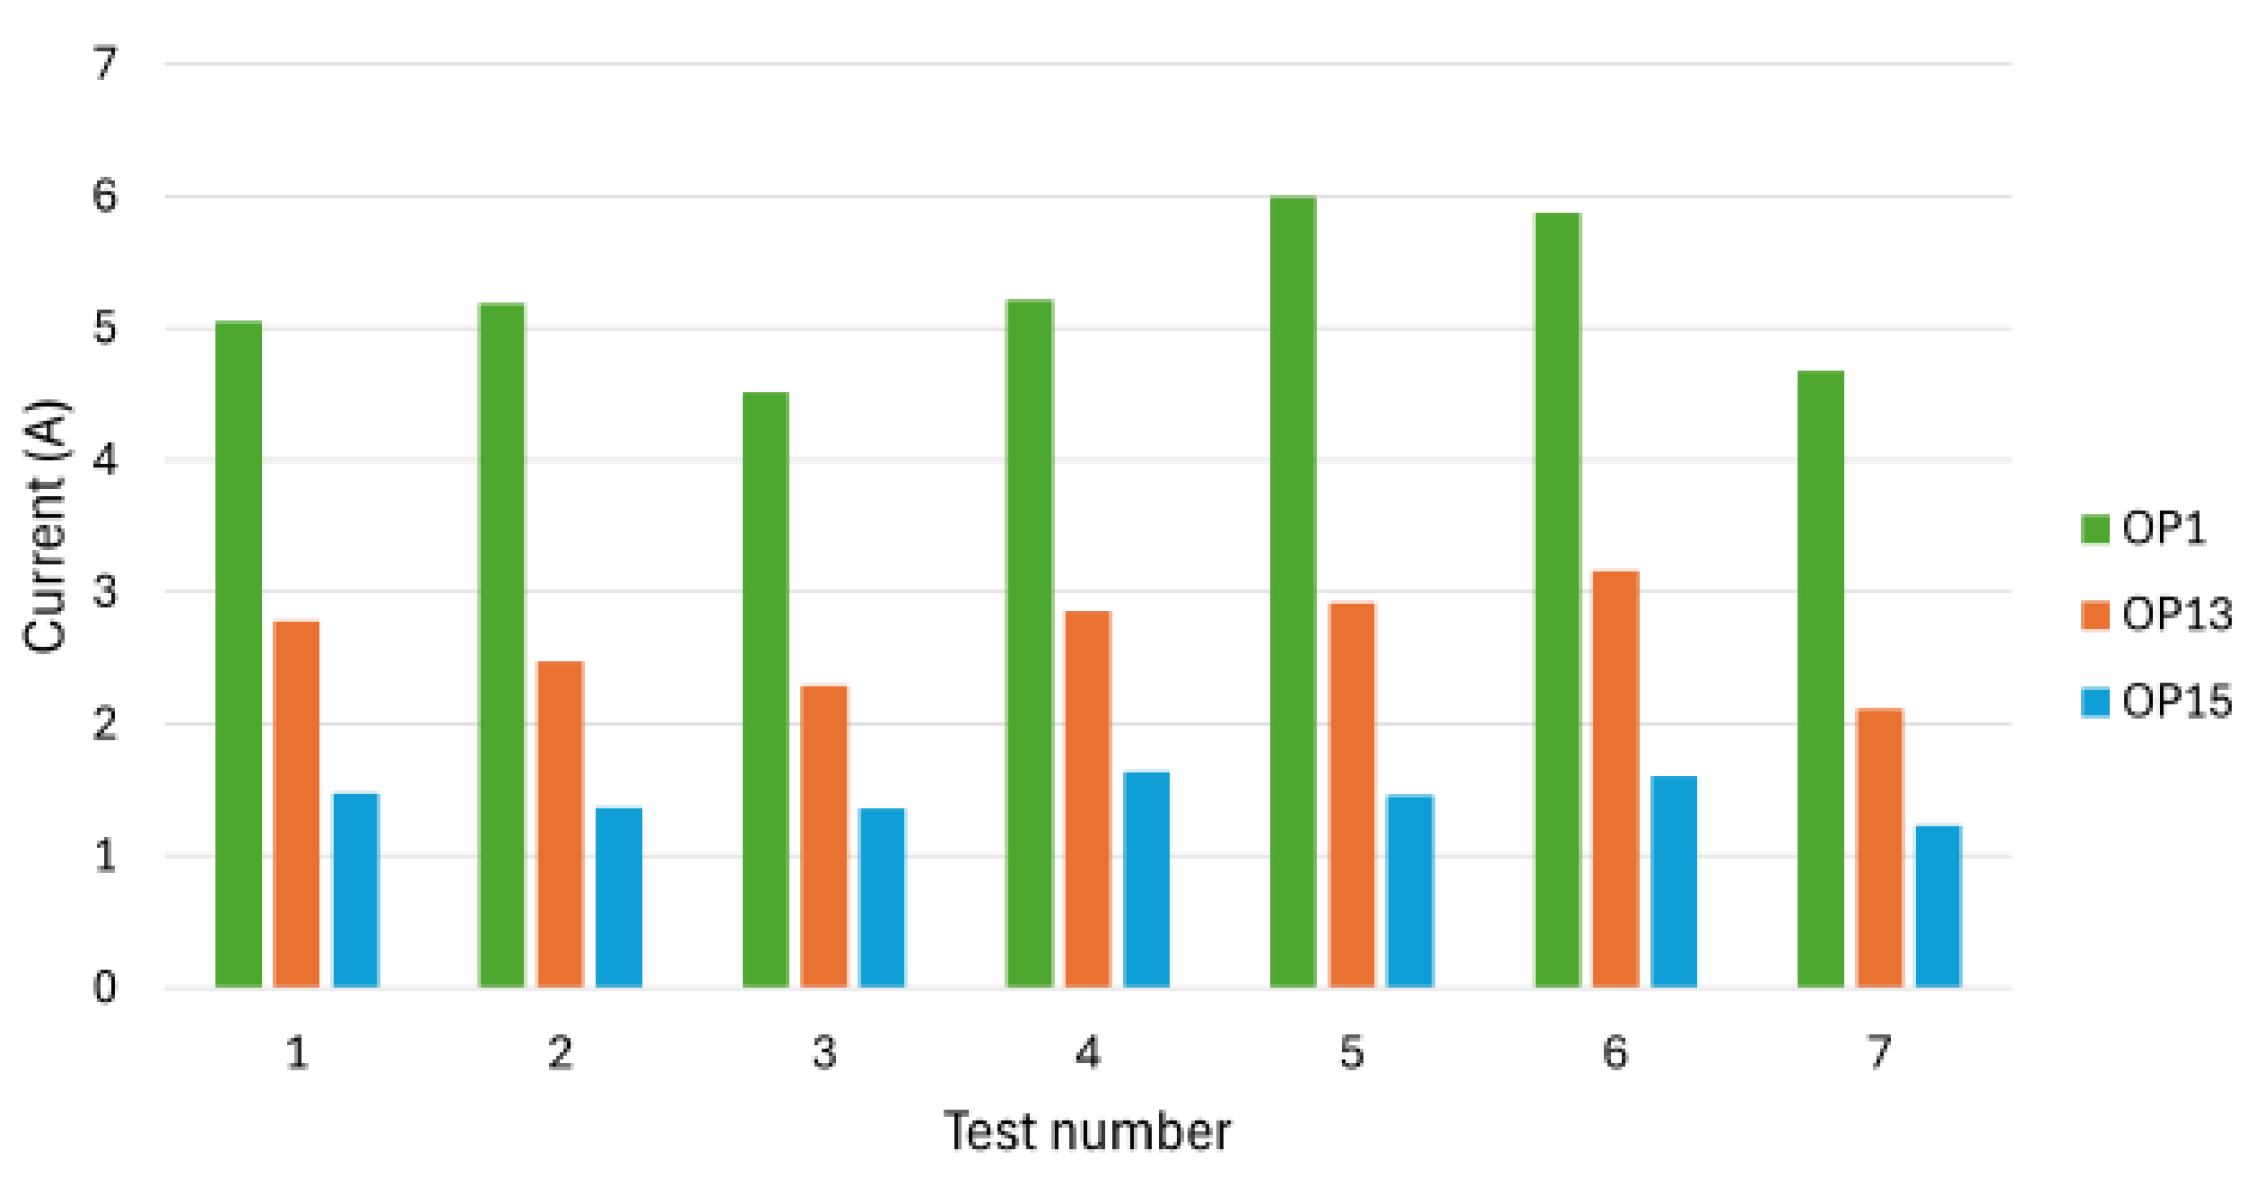
As illustrated by Figure 5, spindle current (RMS) during cutting was highest in OP1, reflecting the higher cutting speeds, larger tool diameter, larger feed rates and larger axial depth of cut ( a p ). These factors increased contact area, chip section and cutting force ( F c ), which directly raises spindle torque and energy demand. This confirms that current is a reliable proxy for mechanical load, meaning it can be exploited for real-time estimation of cutting forces and energy consumption. OP13 showed intermediate current with clear sensitivity to parameter changes, whereas OP15, with multiple steps and lower depths of cut, yielded the lowest currents due to lower removed volume per pass and a more uniform torque distribution. This highlights that current monitoring is less sensitive in finishing operations, suggesting the need for complementary signals in such cases.
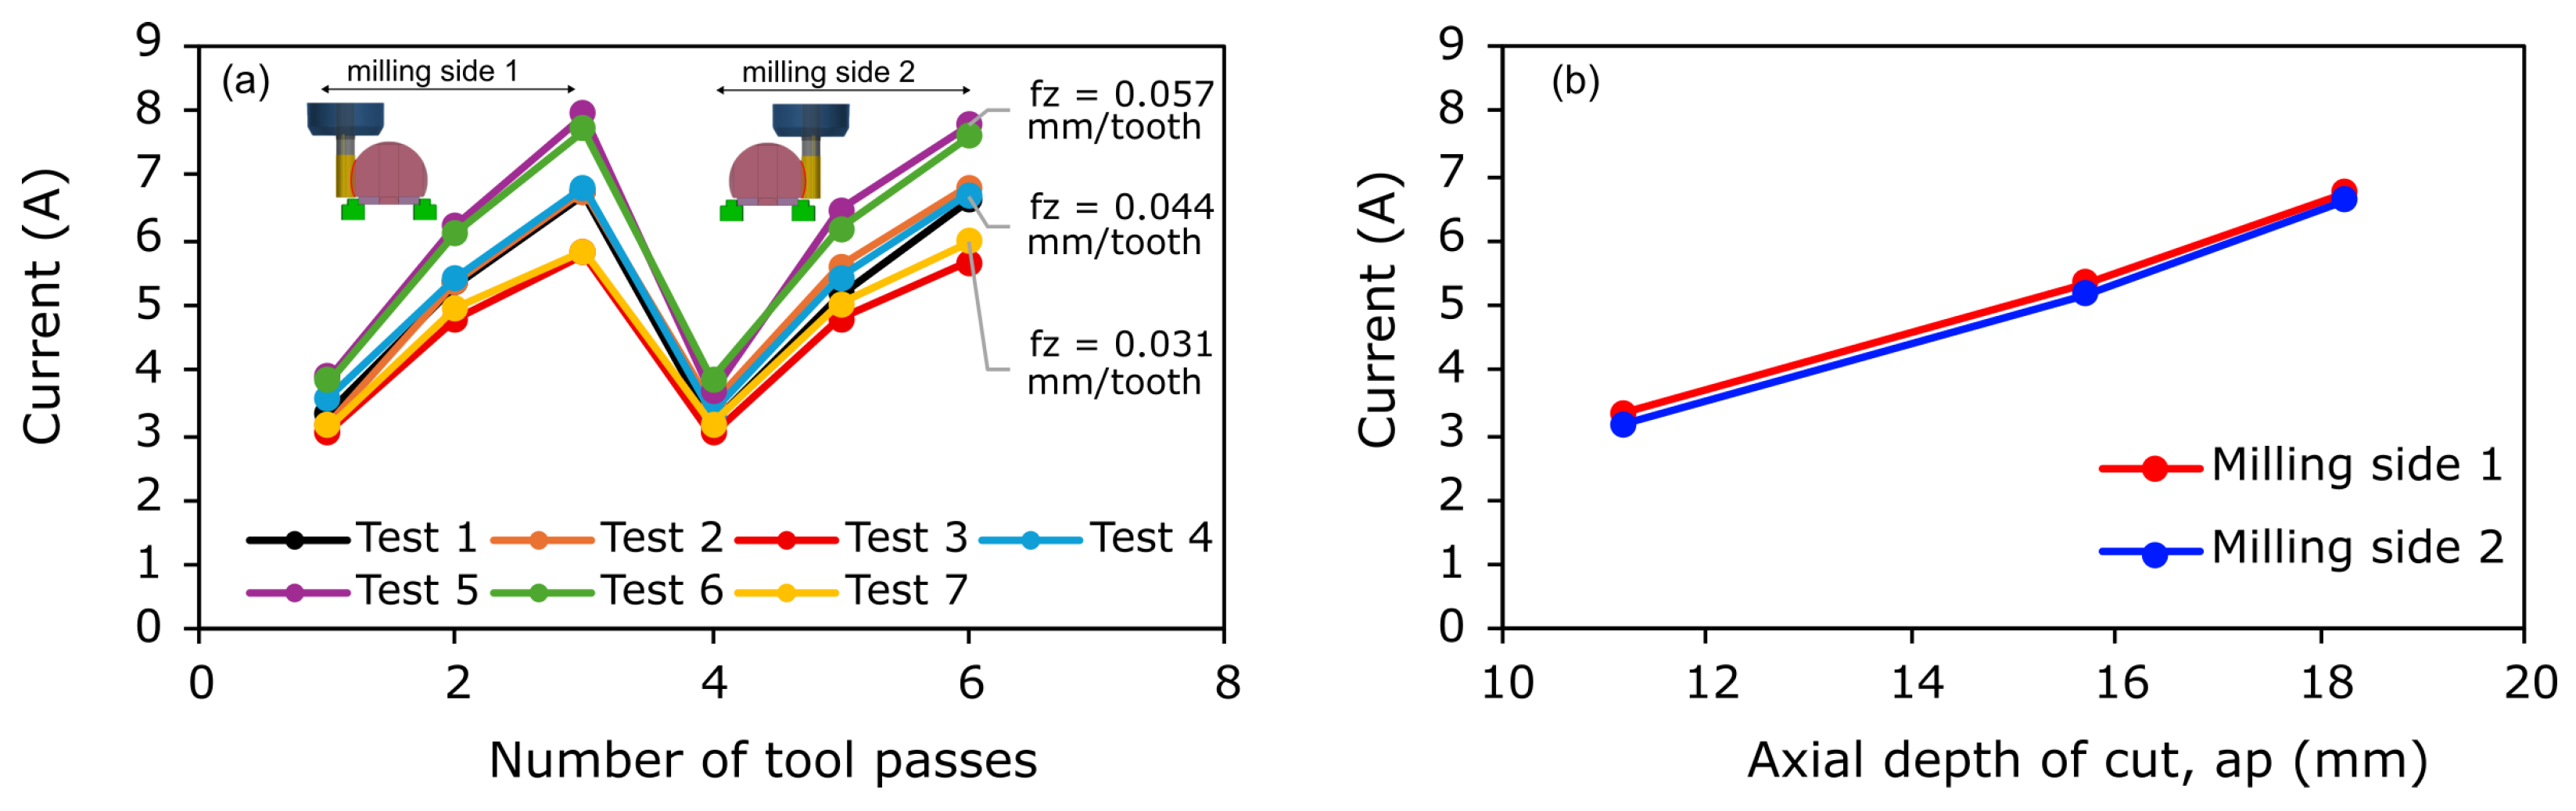
Focusing on OP1 (refer to Figure 6a), the impact of cutting parameters is noticeable on effective current values. Test 5, which corresponds to an increase of f z with constant cutting speed, showed the highest value of current. On the other hand, a decrease of only f z (Test 3) resulted in the lowest value of the current. This confirms that f z has a stronger influence on spindle load than cutting speed because it directly affects chip thickness and cutting forces. Tests where f z changed led to larger variations in RMS current (−10.6% and 18.58%) suggesting a stronger correlation between feed and energy. In contrast, isolated variations in cutting speed produced smoother differences and similar results of current. From a process optimization perspective, this means current monitoring can be used to detect feed-related overloads and trigger adaptive feed control to prevent excessive tool wear. Additionally, from a defect-free and process reliability perspective, current monitoring helps identify unexpected load spikes when the stock allowance is larger than expected (e.g., near-net or cast shapes), enabling adaptive triggers to prevent tool overload or dimensional errors. This f z influence is in accordance to theory, since the cutting power, P c , is calculated using the feed rate, v f , as expressed in Equation (2).
P c = a p · a e · v f · K c 60 · 10 6 [ kW ]
Since the feed rate is directly influenced by the feed per tooth, it is expected for the power to increase with the increase of f z . When f z becomes smaller than the minimum chip thickness there is no chip formation (there is material surface deformation instead). This means that part of the consumed energy is not associated with material removal, but with friction.
Although higher cutting speeds are generally associated with increased energy demand, the relationship between vc and current is not strictly linear. This is because cutting power depends on both feed rate and cutting load, which can decrease as vc rises due to thermal softening effects. Conversely, higher strain rates can induce strain hardening, increasing resistance. These competing mechanisms explain the observed non-linear trend. From a monitoring perspective, this complexity means that current alone cannot fully predict energy behavior under speed variations, reinforcing the need for integrated models that combine sensor data with, for instance, CAM-based engagement data for accurate real-time monitoring [16]. To further compute the relationship between depth of cut, a p , and current, I, the values of a p for each engagement were determined and the corresponding plot is represented in Figure 6b. it becomes clear that there is a linear response of the current with the increase of a p . This indicates that the current is capable of detecting the response of energy consumption to different amounts of removed material. Also, from a process optimization standpoint, this means current monitoring can serve as a real-time indicator of material engagement, enabling adaptive strategies to maintain stable loads and prevent occasional overload.
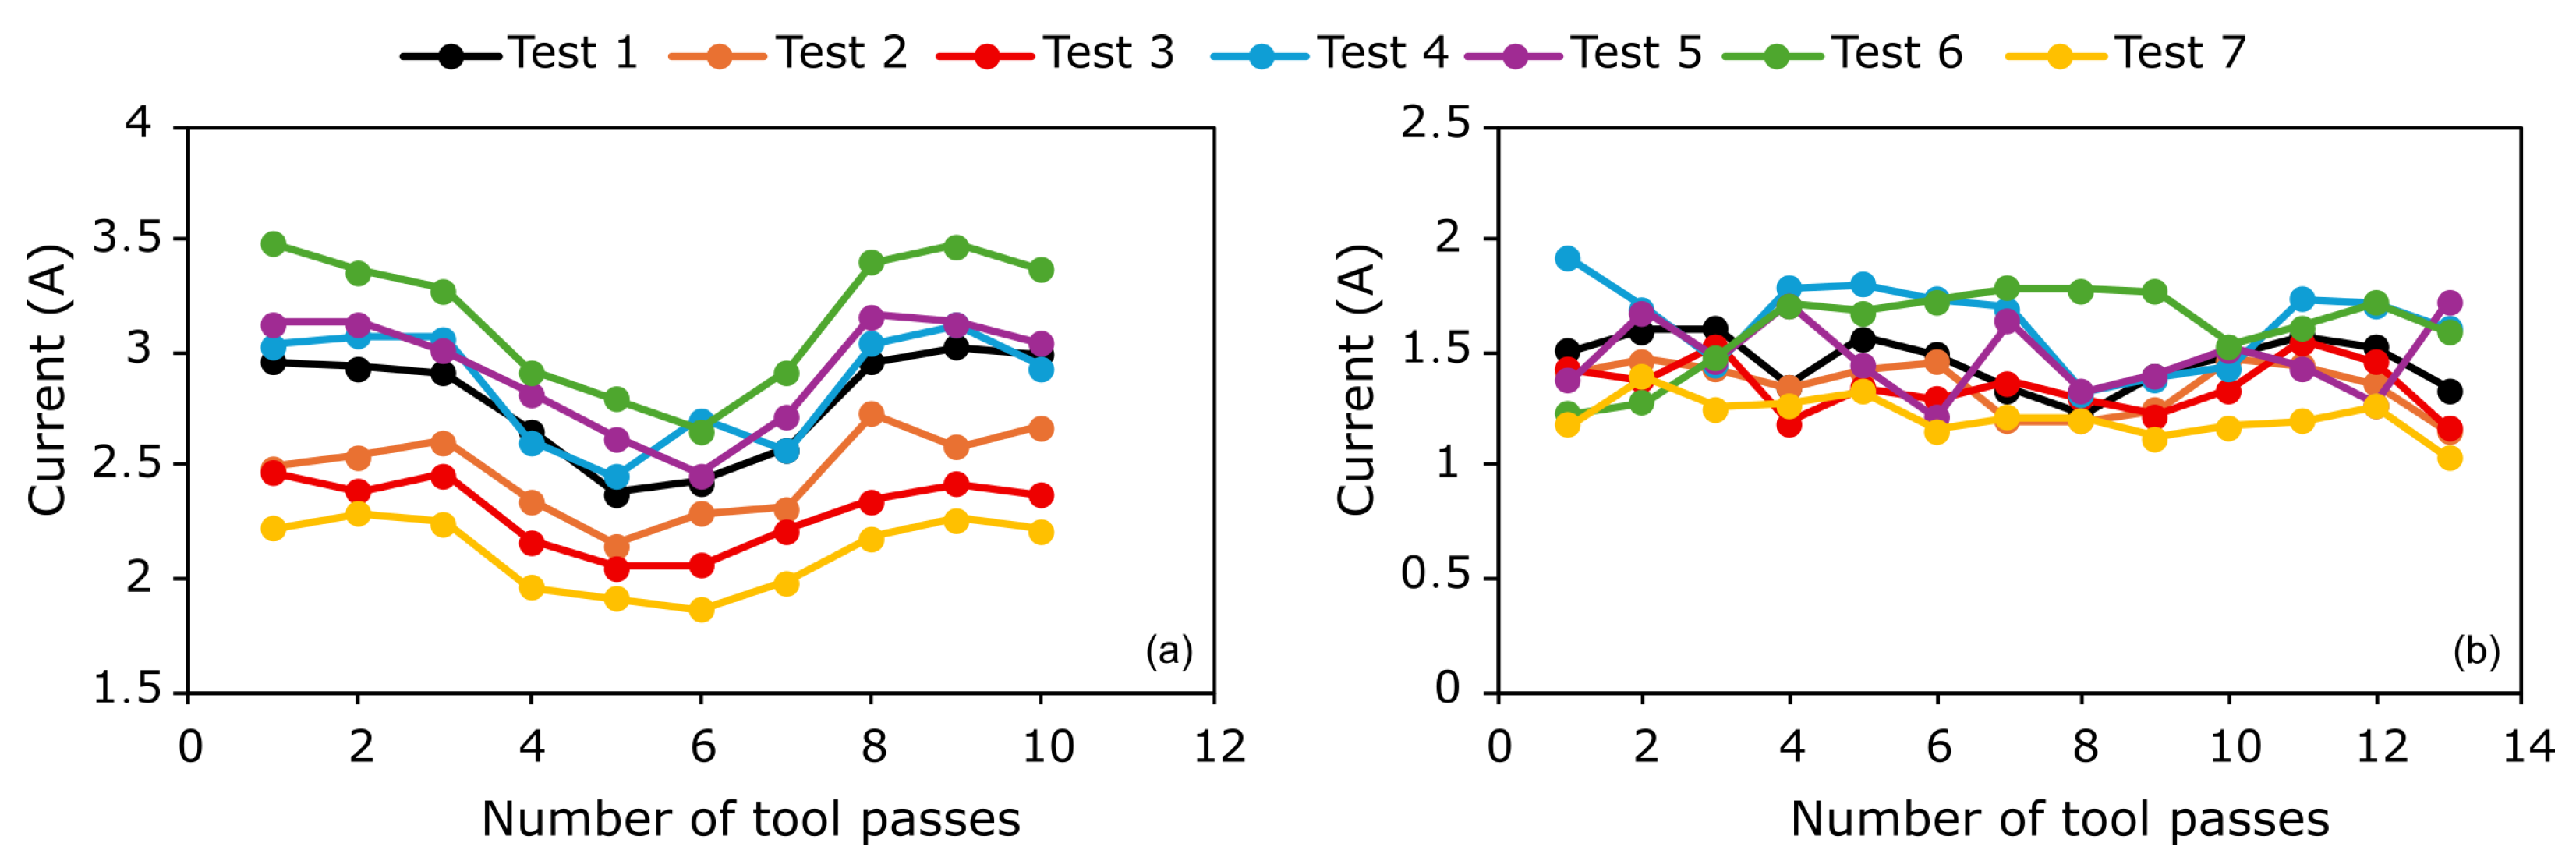
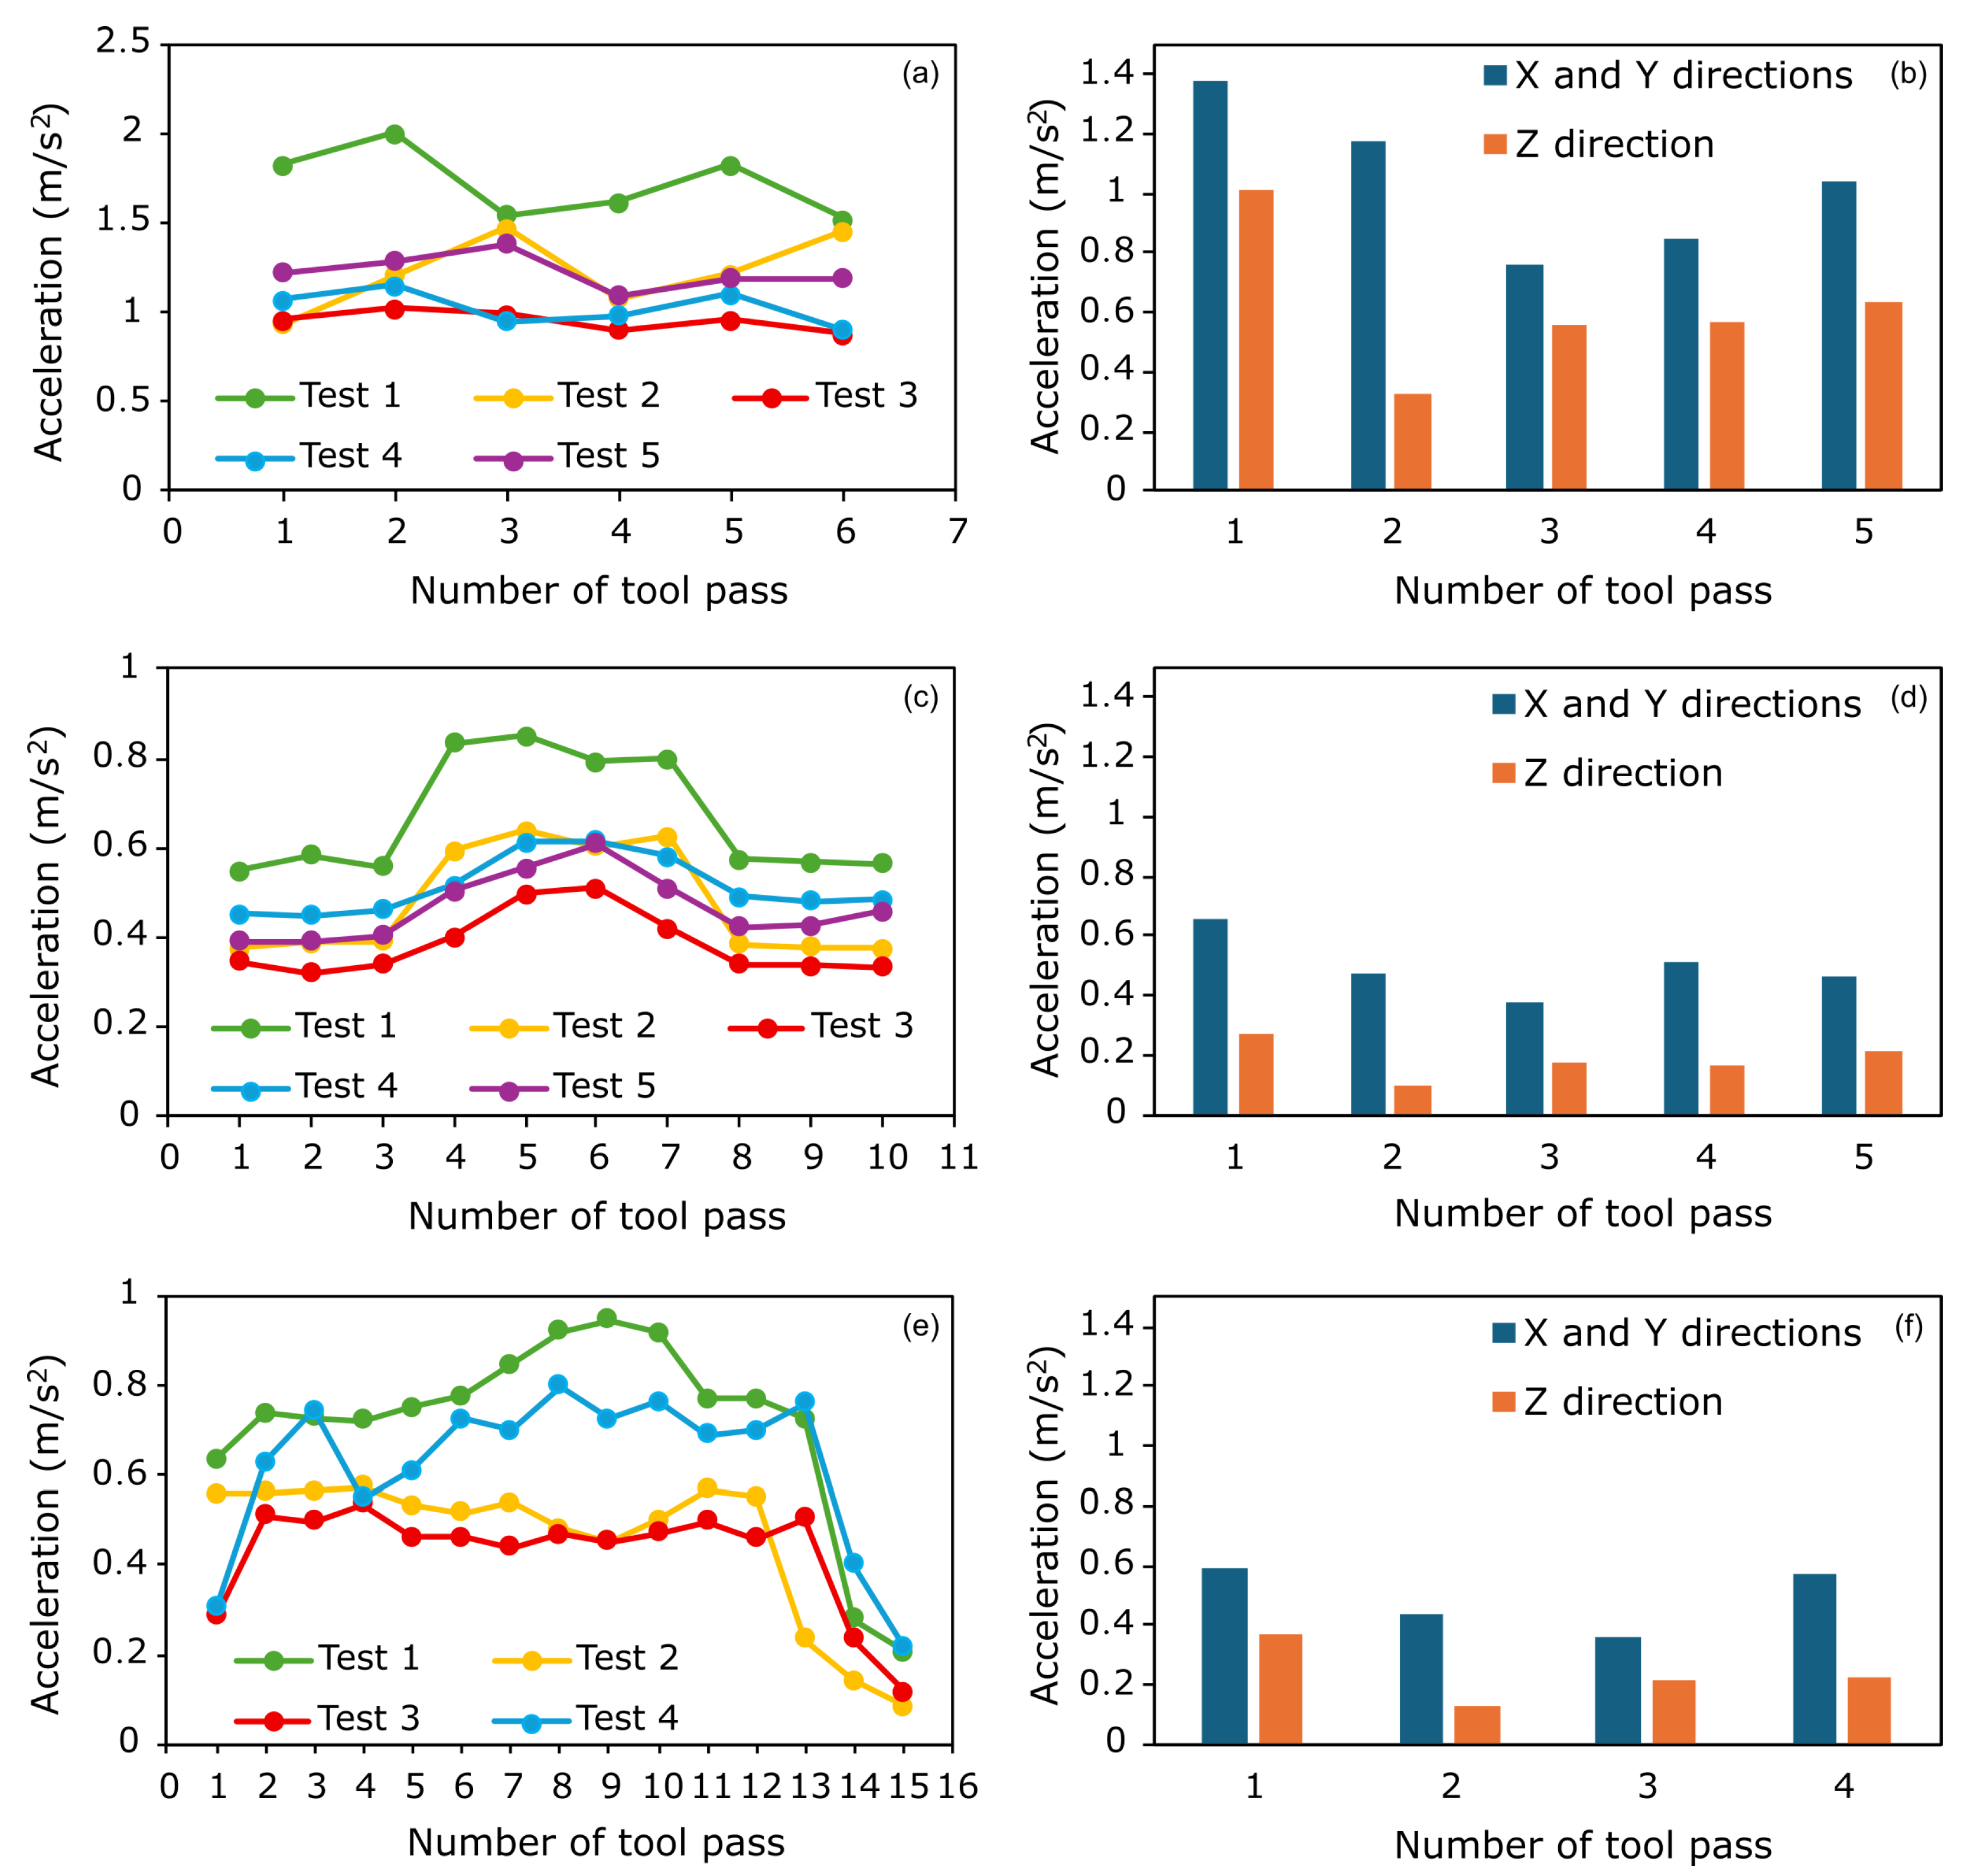
In both OP13 and OP15, the tool intersects with pre-drilled holes, causing a transition in and out of voids which result in dynamic variations of force and, as a consequence, in current consumption. Therefore, it is expected to observe a decrease in the current in the instants that the tool enters the empty space, since the load at the spindle is also lower. This is quite noticeable in OP13 (in Figure 7a) starting from pass 4 up until pass 7. Despite less evident, there is, as well, a general current decrease from passes 6 to 10 in OP15, Figure 7b. Still, test 6 (larger f z and v c ) shows higher current values and test 7 (smallest f z and v c ) show the lowest current values. These results demonstrate that the clamps are capable of capturing dynamic variations and provides a faithful representation of the tool’s behaviour under real operating conditions. From a monitoring perspective, this demonstrates that current sensing can detect transient load changes caused by toolpath geometry, enabling adaptive strategies to maintain process stability when machining parts with complex features.
It is also possible to associate the current with the quantity of removed material (MRR). This variable is calculated by Equation (3), where it depends on the radial and axial depths of cut and the feed rate.
M R R = a p · a e · v f 100 [ cm 3 / min ]
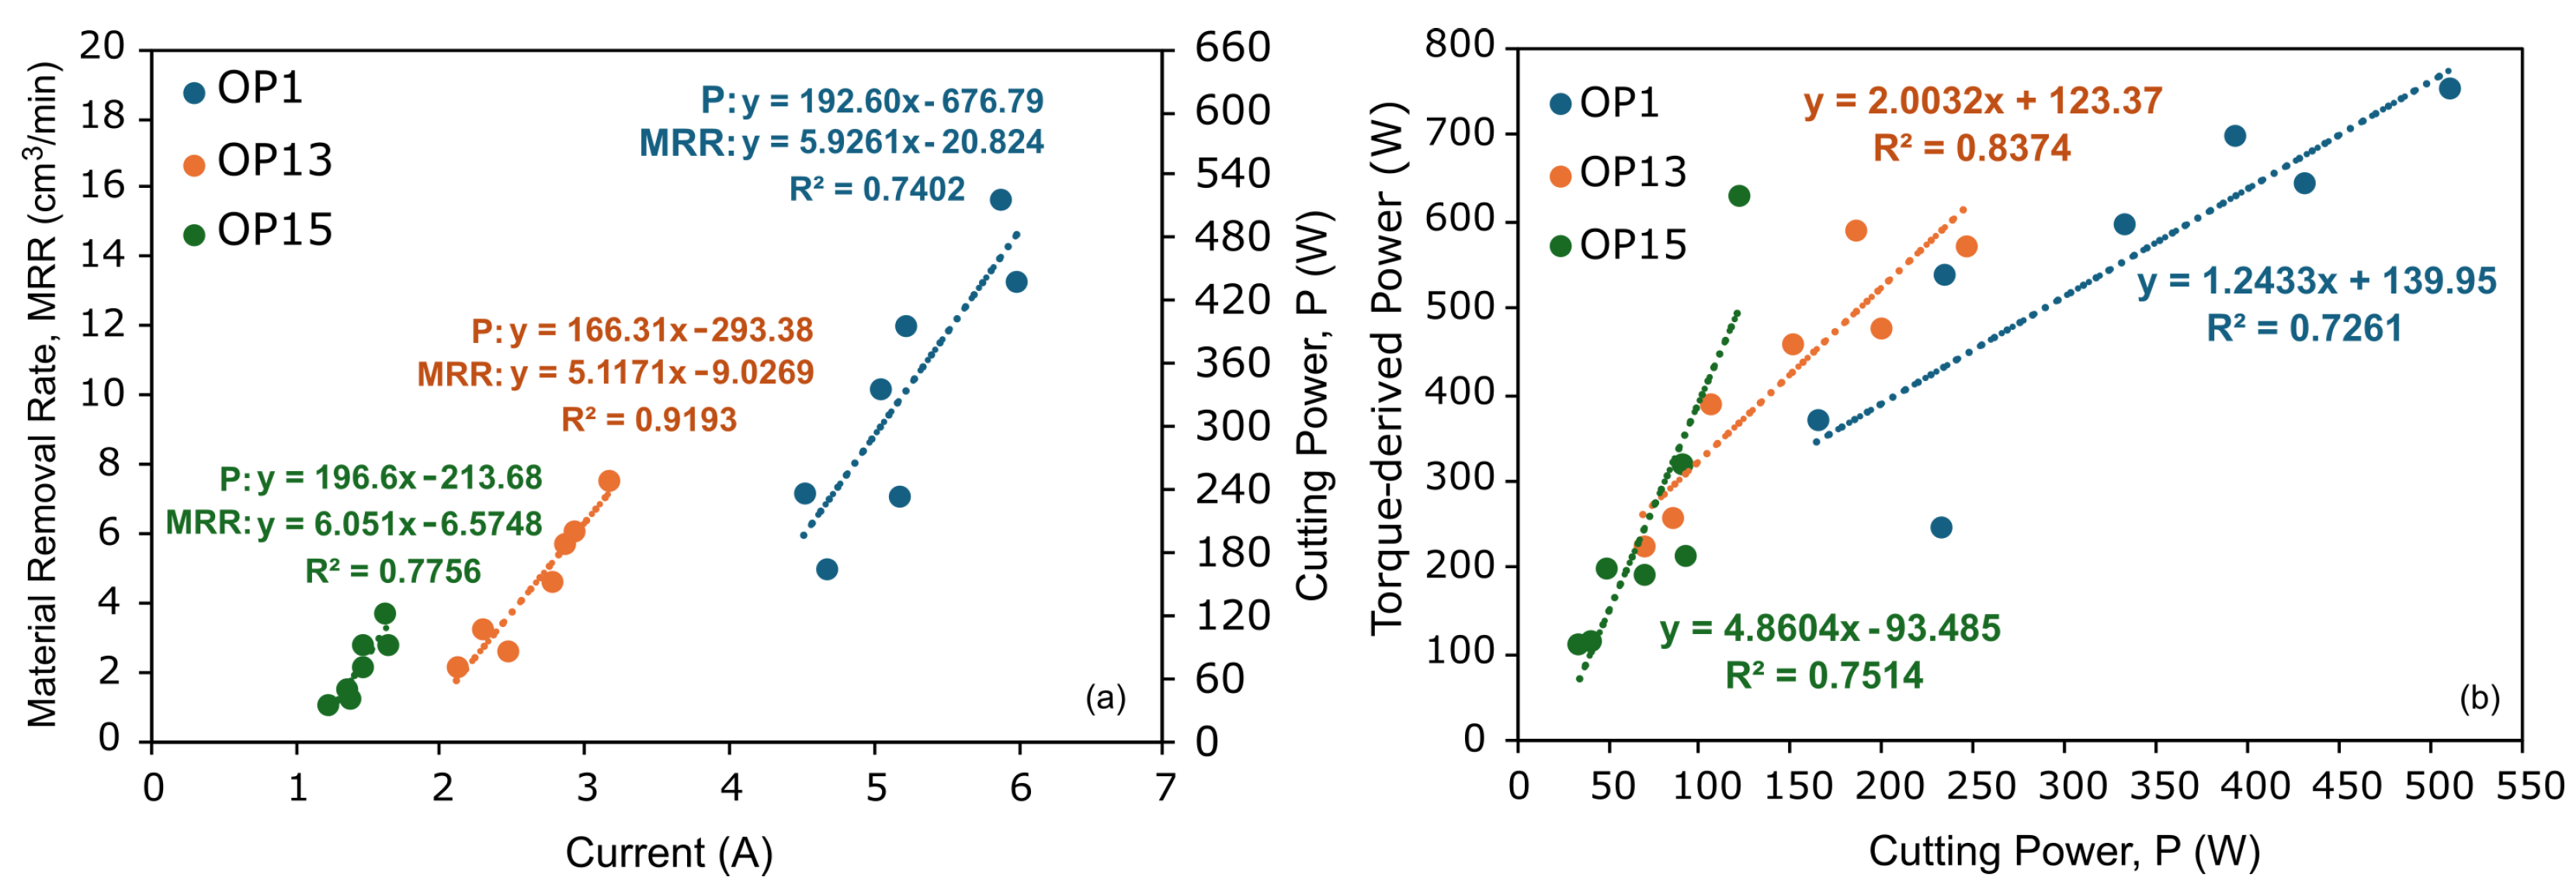
When analyzing the correlation of the current and the material removal rate, a linear trend was found in all three operations, as demonstrated by Figure 8a. OP13 has the strongest correlation ( R 2 0.91 ). OP1 also demonstrated a good linear relationship, but more dispersion of data is likely due to variable axial depth of cut. In general, these results indicate that the current signal obtained from the clamps is suitable to translate different volumes of removed material, which in turn is associated with the cutting loads involved. This finding is significant because it enables current-based estimation of MRR and energy consumption in real time, supporting digital twin models for predictive control. However, the absence of a universal relationship across all operations highlights the need for context-aware calibration (i.e., data from CAM).
Regarding the cutting power and measured current linear relationship (in the same Figure 8a), OP13 has the strongest correlation. OP1 had the highest cutting power values, which is expected since it has the highest MRR and torque, translating into higher cutting forces. OP15 showed a steeper slope, meaning that the current was responsive to smaller load variations. However, in this operation, distinguishing finishing passes (barely undetectable variation when compared to idle/air cutting) is a challenge (as will be further highlighted in Figure 9).
In Figure 8b the power estimated from torque and spindle speed is compared with the cutting power. The average torque read by the machine considers several factors such as accelerations, decelerations, friction and load variations. In contrast, the cutting power estimated with the chip geometry and specific cutting pressure only accounts the ideal chip formation. OP13 maintained a stronger correlation, while OP1 and OP15 have greater data dispersion. However, in general, the power estimated from the torque demonstrated that the machine’s function is capable of indicating energy consumption during cutting, the corresponding cutting effort and, as a consequence, can indicate tool wear in an indirect manner, provided that wear will impact cutting power.
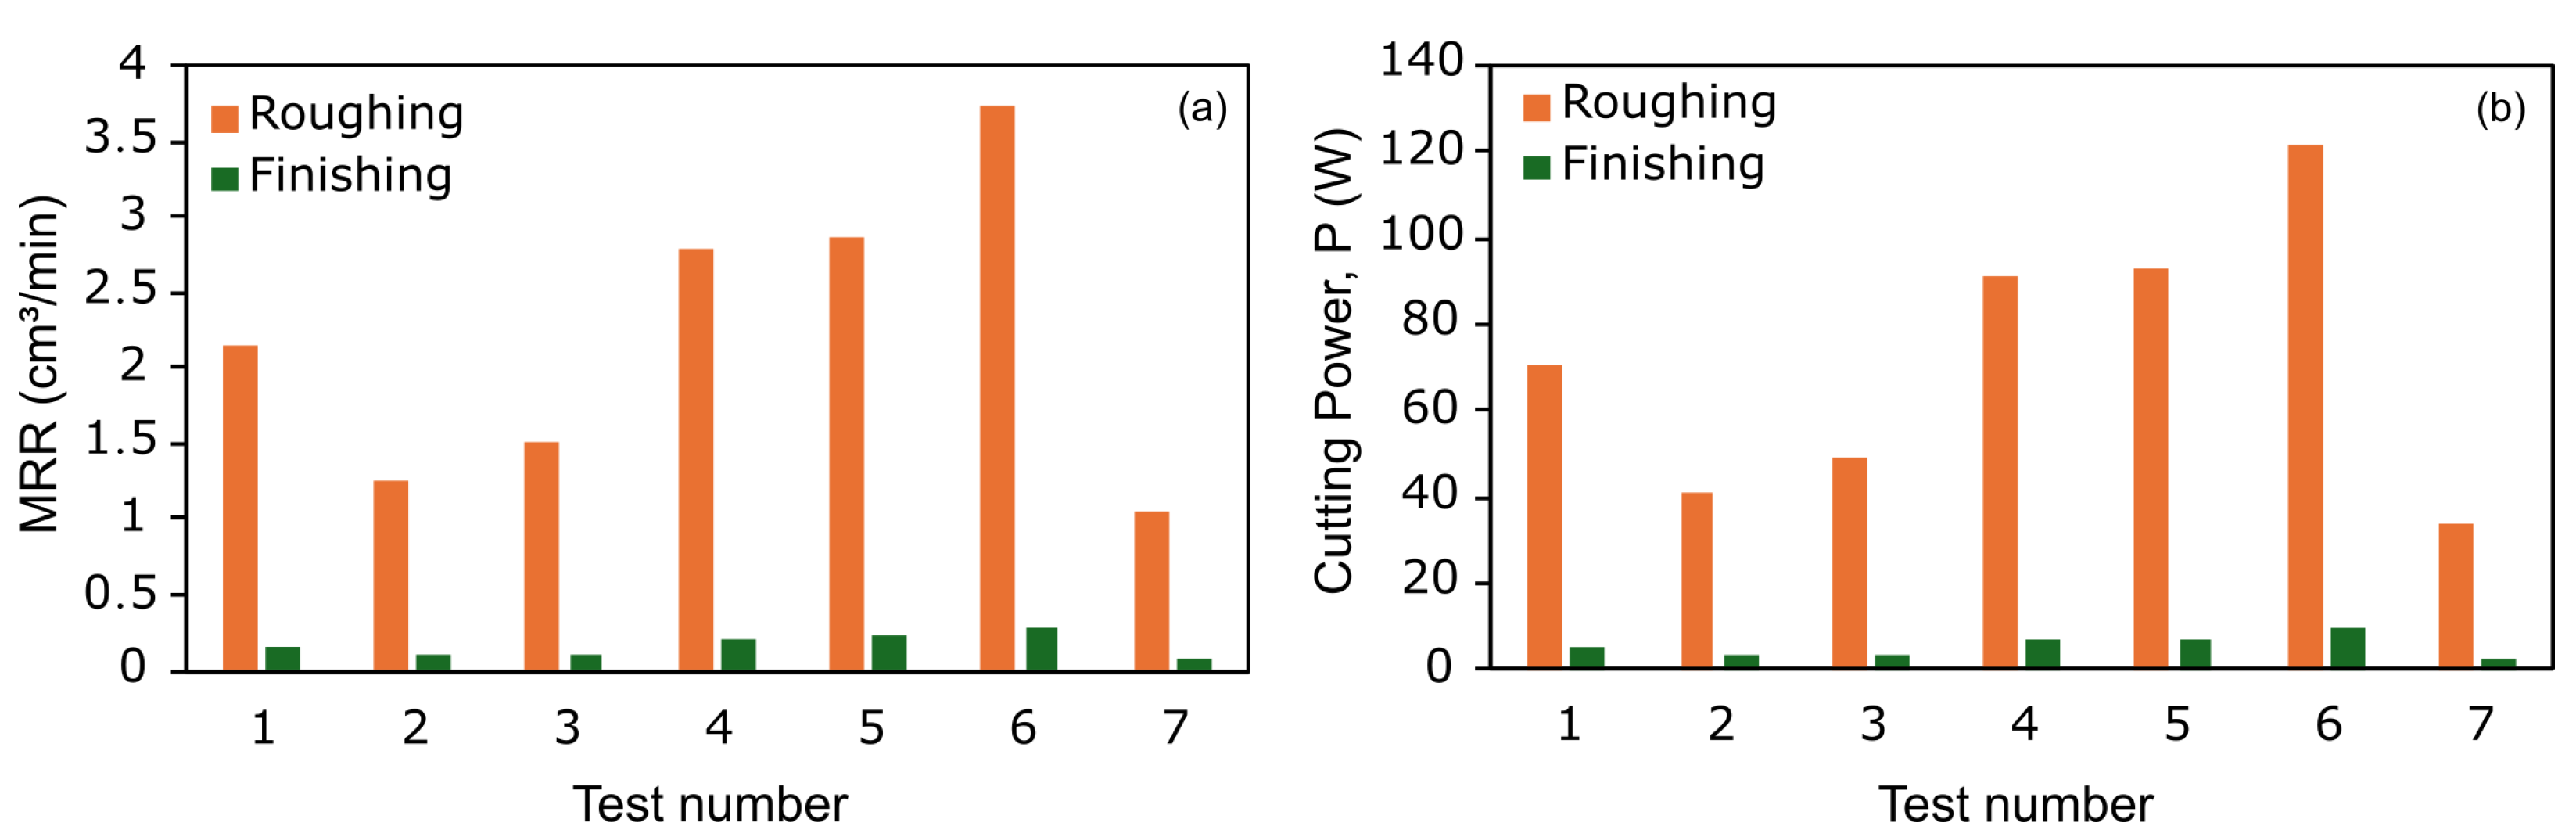
Idle current was similar across operations confirming a stable baseline. In OP15, roughing removed approximately 3.7 cm3/min compared to only 0.3 cm3/min in finishing, resulting in a 90% resuction in power demand (Figure 9). Consequently, finishing currents approached air-cutting levels, making detection challenging. This limitation underscores that current monitoring alone is insufficient for low-load operations.
All these results demonstrate that the current monitoring allows for capturing dynamic changes and translating the tool’s behaviour in a way that is faithful to what happens in reality. Overall, the trends observed across the different results support one another and reinforce the conclusion that the measured current is a reliable indicator of cutting performance. Torque data from the CNC spindle can be used to complement this information and be used as an indicator to predict tool wear, as tool wear would result in increasing torque.

3.2. Vibration Analysis

Resultant RMS acceleration, displayed in Figure 10, was highest in OP1, which is consistent with its aggressive roughing conditions (increased a p ) and longer tool length, both of which amplify dynamic excitation. OP13 and OP15 operations showed similar patterns excitation, with OP15 showcasing lower values. The smaller depth of cut, a p , helped distribute load and improve stability. Notably, Test 3 (lower f z ) achieved the best stability, confirming that reducing feed per tooth mitigates lateral force oscillations. Interestingly, lowering v c increased X-axis vibration, indicating that slower speeds do not guarantee improved stability, likely due to reduced dynamic stiffness at lower cutting speeds. From a process monitoring perspective, these results suggest that vibration can guide parameter selection to minimize chatter risk and improve surface integrity, particularly in multi-axis toolpaths where engagement varies significantly.
Figure 11 highlights vibration spikes when the tool crosses pre-drilled holes, especially along the X-axis. These spikes occur because the loss of support material abruptly changes cutting forces, amplifying dynamic excitation. Partial engagement of the cutting edge further introduces load imbalance, increasing vibration. This capability is critical for detecting transient instability during complex toolpaths, enabling future adaptive damping or feed adjustments in real time.
Since the main cutting forces in milling are generally lateral, for all three operations, the vibration levels in the X and Y axes were compared with those in the Z direction to determine the direction of the forces. As Figure 11 shows, in all cases, vibrations were higher in the X and Y directions, confirming that lateral cutting forces are responsible for the most significant dynamic oscillations. To sum up, the accelerometer captured dynamic effects, distinguished finishing and detected tool engagement changes. Axis-by-axis trends were less consistent because milling dynamics affect each direction differently. From the different cutting data, the reduction of the feed per tooth is highlighted as the best adjustment to minimise vibration.
Limitations included drift/offset and occasional sensor freezes, indicating a need for stronger processing or more robust hardware.

3.3. Quality Control

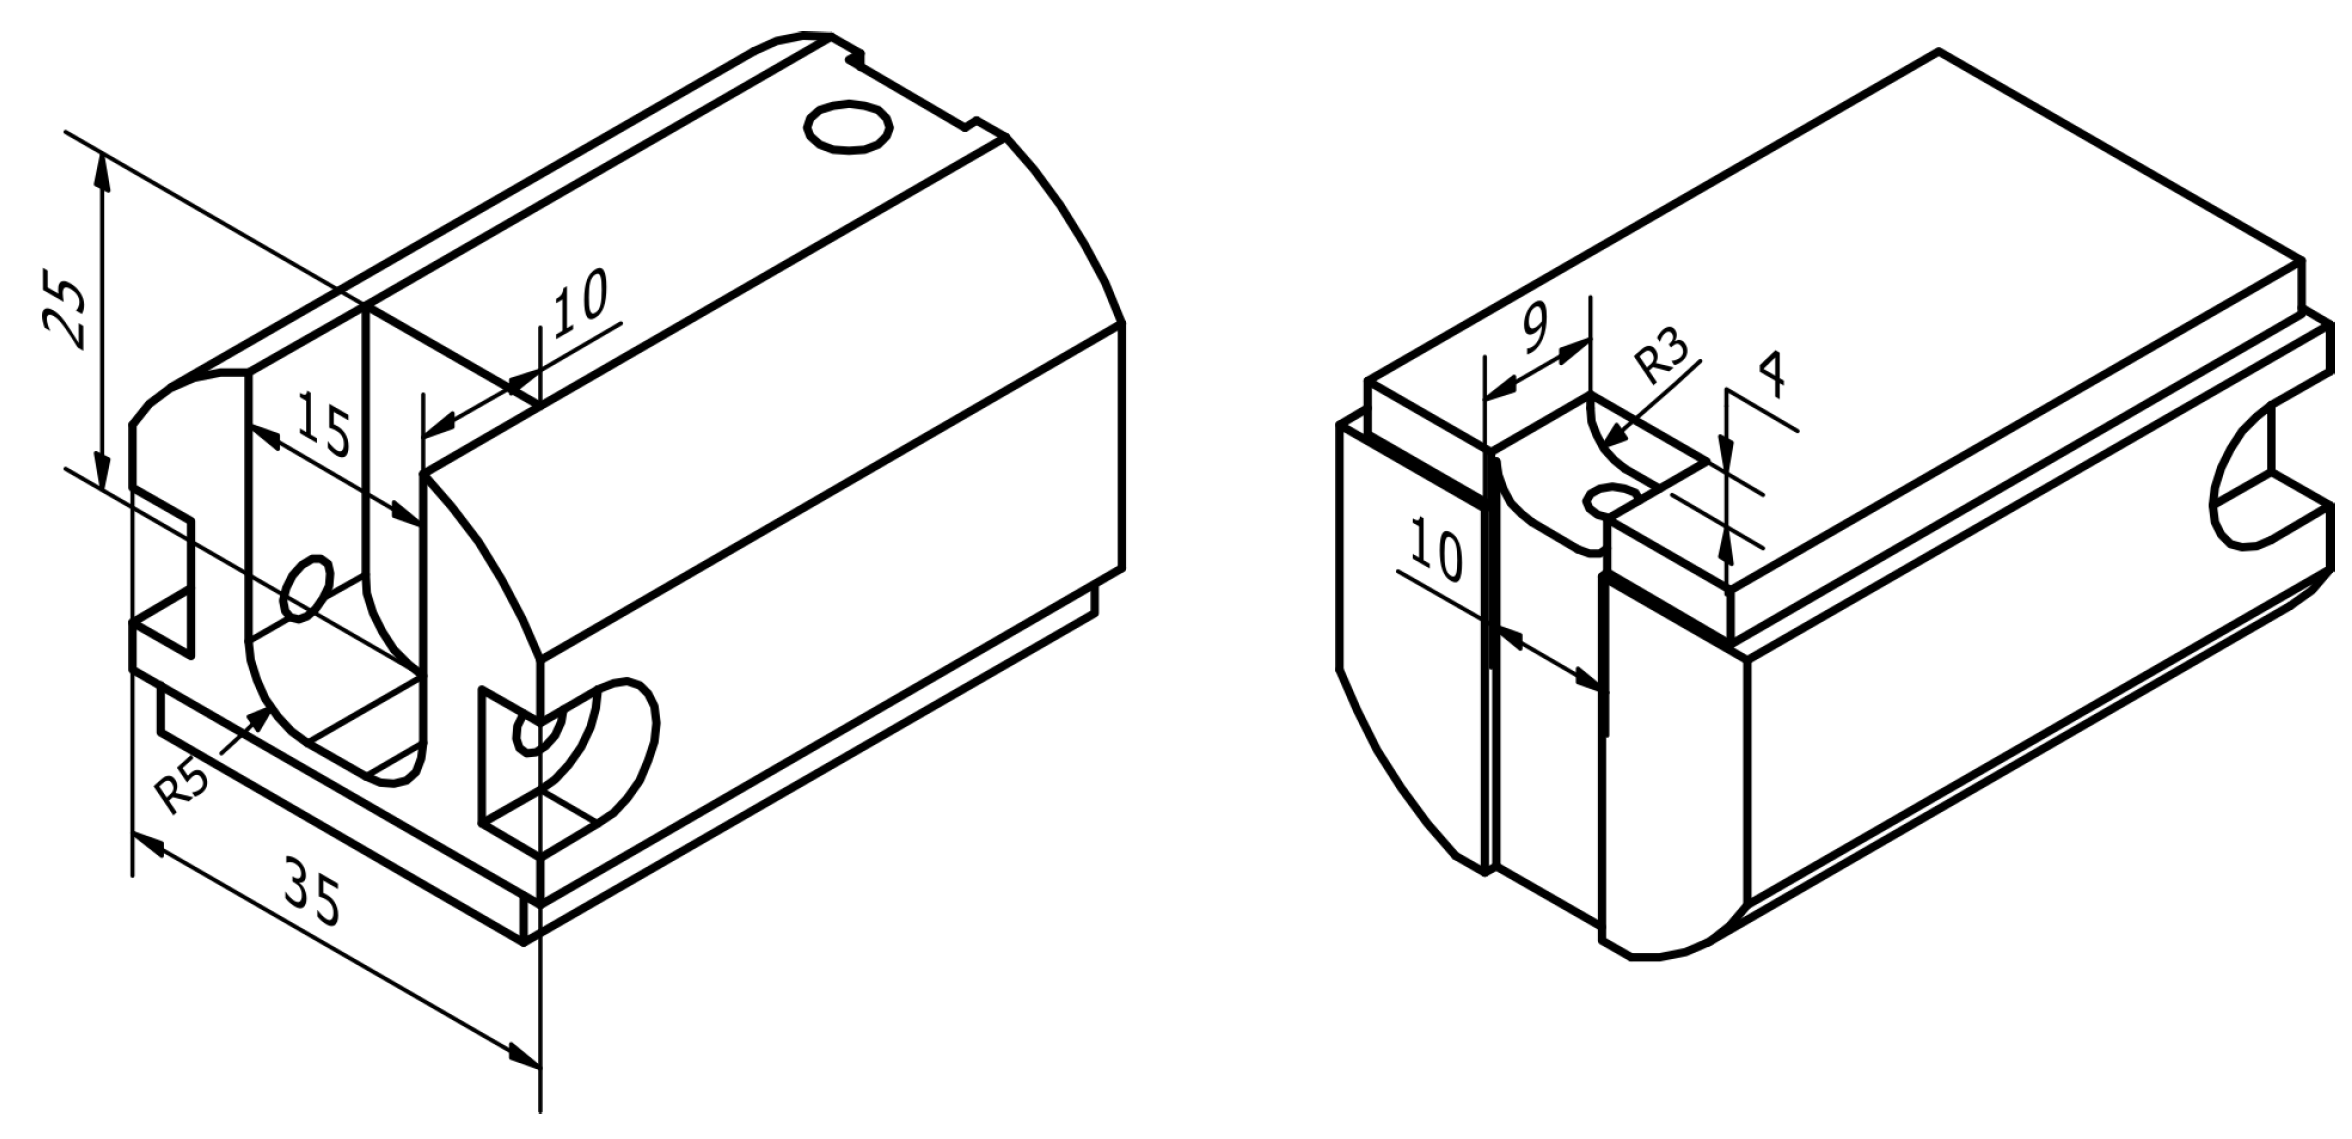
Table 6 shows the dimensional deviations of selected features (refer to Figure 12) for each test. These values represent the difference between measured and nominal dimensions. To assess overall performance, five metrics were calculated: mean, absolute mean, maximum, minimum and amplitude. As the results demonstrate, test 4 (increase of v c ) can be highlighted as the most dimensionally stable condition. It presents low amplitude (93 μm), which suggests low local non-conformities. It has the lowest absolute mean deviation (24.82 μm), which means it has a small average error regardless of direction. Additionally, it exhibits the lowest standard deviation (30.60 μm), indicating low dispersion of the deviations around the mean. While no direct correlation was observed between vibration levels and dimensional deviations, continuous monitoring of current and vibration can detect early signs of instability or tool wear before tolerance violations occur.
In contrast, test 7 (decrease of v c and f z ) resulted in the lowest dimensional stability, presenting the highest amplitude, absolute mean and standard deviation (100 μm, 32.73 μm and 36.56 μm, respectively). In addition, tests 1 and 3 had small variations between measurements with standard deviations of 29.79 μm and 30.62 μm, respectively, suggesting a consistent performance. Test 5 showed higher amplitude (97 μm), but its mean was close to zero which does not clarify if it has a tendency to remove excess or insufficient amounts of material. Test 2 demonstrates larger dispersion with an amplitude of 94 μm and absolute mean of 31.49 μm. Finally, test 6 had more fluctuation of the deviations around the mean, with a standard deviation result of 31.49 μm and the highest negative mean (−4.64 μm), indicating a tendency for under-machining.
In sum, although no direct relationship is observed between dimensional deviations and vibration levels, continuous measurement of electrical current and vibration can still reveal important process instabilities (i.e., tool wear) and changes to the process before final components are fully manufactured.

4. Conclusions

In conclusion, the data obtained from the electrical current and vibration signals has proven to be a valuable approach for monitoring five-axis CNC milling operations. In particular, the following specific conclusions can be drawn:
  • The data obtained from the electrical current and vibration signals has proven to be a valuable approach for monitoring five-axis CNC milling operations. The current signals demonstrated strong correlations with cutting power and material removal rate, with values of R2 ranging from 0.74 to 0.92. Electrical current values can be a good indicator of energy consumption and cutting forces. However, it shows limited sensitivity under low cutting forces, being less effective in distinguishing finishing passes.
  • It was observed that the feed per tooth had a significant influence on current consumption, due to its direct impact on the average chip thickness. In addition, it was noted that rotation speeds (cutting speed) require more energy consumption for the spindle to overcome friction effects.
  • Vibration signals captured process stability in different directions: lateral forces caused higher vibration and lower feed per tooth improved stability across tests.
  • Quality control results demonstrated that, for the production of this test part, there is a considerable window of parameters that can be used without compromising dimensional accuracy. Even though all cutting data configurations, in global, verified the requirements, there are some variations that lead to higher deviations.
In summary, the results showed that the electric current signal can be used as an indicator of energy consumption and cutting forces, with high linear correlation with material removal rates (MRRs) and cutting power. Vibration measurements were capable of reflecting dynamic oscillations, particularly in the tool radial X-axis direction. Both signals can be used together but are not related as they provide distinct complimentary information of process behaviour.
Future work should include a series production when tool wear can be tackled by the sensors and their effects on surface finishing which is expected to be sensitive to the vibrations. Other time-history signal features as well as frequency domain features should be evaluated to detect chatter, tool failure, among other issues. MEMS sensors show less reliability when compared to piezoelectric sensors; therefore, more data would be required to allow a more robust assessment.

Author Contributions

Conceptualization, B.C. and A.M.P.d.J.; methodology, B.C.; software, J.F.; validation, B.C., T.E.F.S. and A.M.P.d.J.; formal analysis, B.C.; investigation, B.C.; resources, P.S.C. and A.R.; data curation, B.C. and T.E.F.S.; writing—original draft preparation, B.C.; writing—review and editing, B.C., T.E.F.S. and A.M.P.d.J.; visualization, B.C. and T.E.F.S.; supervision, A.R., A.M.P.d.J. and P.S.C.; project administration, A.R., A.M.P.d.J. and P.S.C.; funding acquisition, A.R. and P.S.C. All authors have read and agreed to the published version of the manuscript.

Funding

This research was funded by COMPETE 2030, project “SNext—Nova geração de ferramentas híbridas”, grant number COMPETE2030-FEDER-00582100. The authors also acknowledge Fundação para a Ciência e a Tecnologia (FCT) for its financial support via LAETA (UID/50022/2025).

Data Availability Statement

The original contributions presented in this study are included in the article. Further inquiries can be directed to the corresponding author.

Conflicts of Interest

Authors Beatriz Cardoso and Pedro Sá Couto were employed by SISMA—Sá Couto & Monteiro, SA. The remaining authors declare that the research was conducted in the absence of any commercial or financial relationships that could be construed as a potential conflict of interest.

References

  1. Liu, L.; Jiang, X.; Ying, E.; Sun, Z.; Geng, D.; Zhang, D. Elliptical ultrasonic side milling for improved surface integrity and fatigue resistance of thin-walled Ti6Al4V components. J. Zhejiang Univ.-Sci. A 2025, 26, 1179–1196. [Google Scholar] [CrossRef]
  2. Huang, S.N.; Tan, K.K.; Wong, Y.S.; De Silva, C.W.; Goh, H.L.; Tan, W.W. Tool wear detection and fault diagnosis based on cutting force monitoring. Int. J. Mach. Tools Manuf. 2007, 47, 444–451. [Google Scholar] [CrossRef]
  3. Xu, Z.; Zhang, B.; Li, D.; Yip, W.S.; To, S. Digital-twin-driven intelligent tracking error compensation of ultra-precision machining. Mech. Syst. Signal Process. 2024, 219, 111630. [Google Scholar] [CrossRef]
  4. Lu, Y.; Yue, C.; Liu, X.; Wang, L.; Liang, S.Y.; Xia, W.; Dou, X. Research on digital twin monitoring system during milling of large parts. J. Manuf. Syst. 2024, 77, 834–847. [Google Scholar] [CrossRef]
  5. Teti, R.; Jemielniak, K.; O’Donnell, G.; Dornfeld, D. Advanced monitoring of machining operations. CIRP Ann. Manuf. Technol. 2010, 59, 717–739. [Google Scholar] [CrossRef]
  6. Zhou, Y.; Sun, W. Tool wear condition monitoring in milling process based on current sensors. IEEE Access 2020, 8, 97344–97354. [Google Scholar] [CrossRef]
  7. Fikri, M.R.; Saptaji, K.; Azmi, F.N. Wireless vibration monitoring system for milling process and analysis of the influence of processing parameters. J. ICT Res. Appl. 2022, 16, 38–55. [Google Scholar] [CrossRef]
  8. Wang, W.K.; Wan, M.; Zhang, W.H.; Yang, Y. Chatter detection methods in the machining processes: A review. J. Manuf. Process. 2022, 77, 98–121. [Google Scholar] [CrossRef]
  9. Li, D.; Cao, H.; Chen, X. Fuzzy control of milling chatter with piezoelectric actuators embedded to the tool holder. Mech. Syst. Signal Process. 2021, 148, 107190. [Google Scholar] [CrossRef]
  10. Jiang, H.; Long, X.; Meng, G. Study of the correlation between surface generation and cutting vibrations in peripheral milling. J. Mater. Process. Technol. 2008, 208, 229–238. [Google Scholar] [CrossRef]
  11. Mohamed, A.; Hassan, M.; M’Saoubi, R.; Attia, H. Tool condition monitoring for high-performance machining systems—A review. Sensors 2022, 22, 2206. [Google Scholar]
  12. Zhong, W.; Zhao, D.; Wang, X. A comparative study on dry milling and little quantity lubricant milling based on vibration signals. Int. J. Mach. Tools Manuf. 2010, 50, 936–942. [Google Scholar] [CrossRef]
  13. Huang, P.; Li, J.; Sun, J.; Zhou, J. Vibration analysis in milling titanium alloy based on signal processing of cutting force. Int. J. Adv. Manuf. Technol. 2013, 64, 1631–1641. [Google Scholar] [CrossRef]
  14. Ghazali, M.H.M.; Rahiman, W. Vibration analysis for machine monitoring and diagnosis: A systematic review. Shock Vib. 2021, 2021, 9469318. [Google Scholar] [CrossRef]
  15. Soares, P. Aços–Características, Tratamentos, 6th ed.; Publindústria: Porto, Portugal, 2009; pp. 1–370. [Google Scholar]
  16. Sagias, V.D.; Koutroumpousis, M.; Stergiou, C.; Tsolakis, A.; Kioroglou, G.; Zacharia, P. FEA-Guided Toolpath Compensation for Robotic Machining: An Integrated CAD/CAM/CAE Framework for Enhanced Accuracy. Automation 2025, 6, 73. [Google Scholar] [CrossRef]
Figure 1. Experimental setup showing the CNC machine, cylindrical workpiece clamping arrangement, first and second fixture setup positions, the current clamp and accelerometer used for process monitoring.
Metals 16 00129 g001
Figure 2. Tool path of each operation: (a) OP1, (b) OP13 and (c) OP15.
Metals 16 00129 g002
Figure 3. Load monitoring function of the Brother U500Xd2 5AX CNC machine.
Metals 16 00129 g003
Figure 4. Identification of RMS current (a) and vibration (b) signals highlighting examples of effective cutting zones and air cutting zone.
Metals 16 00129 g004
Figure 5. Current values of each test (varying cutting parameters), for the three different operations: OP1, OP13 and OP15.
Metals 16 00129 g005
Figure 6. Influence of cutting parameters (a) and resulting axial depth of cut, a p (b) on measured current values.
Metals 16 00129 g006
Figure 7. Variation in the current with each tool pass of (a) OP13 and (b) OP15.
Metals 16 00129 g007
Figure 8. Comparison of the linear correlation of the current with the material removal rate (a) and power (b) of all tests.
Metals 16 00129 g008
Figure 9. Material removal rate (MRR) (a) and cutting power (b) between the roughing and finishing passes of OP15.
Metals 16 00129 g009
Figure 10. Comparison of the resultant acceleration values of all operations.
Metals 16 00129 g010
Figure 11. Variation of the resultant acceleration for each tool pass and for all tests of all operations: (a,b) OP1; (c,d) OP13; (e,f) OP15 (X and Y stands for radial to tool axis direction and Z stand for tool axis direction).
Metals 16 00129 g011
Figure 12. Dimensional features from operations OP1, OP13 and OP15 considered for quality control analysis.
Metals 16 00129 g012
Table 1. Chemical composition of the 42CrMo4 steel (% mass).
CMnSiSPCrNiMoAlCuB
0.4280.8700.2800.02000.0121.0500.1000.1500.0200.1100.0001
Table 2. Mechanical properties of the material 42CrMo4 steel.
Tensile Strength, Rm [MPa]Proof Stress, Rp (0.2) [MPa]Elongation (%)Hardness (HBW)
744.0593.014.7220.0
Table 3. Cutting conditions used in each test of OP1.
Test v c (m/min) f z (mm/tooth)n, Spindle Speed (rpm) v f (mm/min)Variation
11520.04384850850Reference
2106.40.04383386.8593.4 v c , f z constant
31520.0314850600 f z , v c constant
41800.04385729.61003.6 v c , f z constant
51520.05748501103.1 f z , v c constant
61800.0575729.61306.3↑ both v c and f z
7106.40.0313386.8420↓ both v c and f z
Table 4. Cutting conditions used in each test of OP13.
Test v c (m/min) f z (mm/tooth)n, Spindle Speed (rpm) v f (mm/min)Variation
1146.00.02505800.0580.0Reference
296.20.02503827.7382.8 v c , f z constant
3146.00.01755800.0406.6 f z , v c constant
4180.00.02507161.0716.0 v c , f z constant
5146.00.03305800.0766.8 f z , v c constant
6180.00.03307162.0945.4↑ both v c and f z
796.20.01753827.7267.9↓ both v c and f z
Table 5. Cutting conditions used in each test of OP15.
Test v c (m/min) f z (mm/tooth)n, Spindle Speed (rpm) v f (mm/min)Variation
1860.0305500660.0Reference
260.20.0303832.5383.3 v c , f z constant
3860.0215500459.9 f z , v c constant
41120.0307130855.6 v c , f z constant
5860.0405500876.0 f z , v c constant
61120.0407130.11140.8↑ both v c and f z
760.20.0213832.5321.9↓ both v c and f z
Table 6. Dimensional deviation values ( μ m) for each test and corresponding statistical metrics.
FeatureTest 1Test 2Test 3Test 4Test 5Test 6Test 7
DIST 35 (OP1)48424142444450
DIST 25 (OP13)14171056430
DIST 10 (OP13)25192830363420
DIST 15 (OP13)−40−52−51−51−53−52−50
R5_1 (OP13)−30−34−32−33−27−32−20
R5_2 (OP13)−33−37−41−39−37−38−30
DIST 10 (OP15)36362434333230
DIST 4 (OP15)−12−10−10−9−9−9−50
R3_1 (OP15)212219810440
R3_2 (OP15)899−710−2320
DIST 9 (OP15)−16−20−21−15−14−15−20
Maximum48424142444450
Minimum−40−52−51−51−53−52−50
Amplitude889492939796100
Mean1.91−0.73−2.18−3.18−0.09−4.641.82
Absolute mean25.7327.0926.0024.8225.3626.0932.73
Standard deviation29.7931.6230.6230.6031.2131.4936.56
Disclaimer/Publisher’s Note: The statements, opinions and data contained in all publications are solely those of the individual author(s) and contributor(s) and not of MDPI and/or the editor(s). MDPI and/or the editor(s) disclaim responsibility for any injury to people or property resulting from any ideas, methods, instructions or products referred to in the content.