
Experimental Evaluation of Thermo-Mechanical Properties of GRCop-42, Produced by PBF-LB, at Low Temperatures

 , , , , and
Abstract

1. Introduction
2. Materials and Methods
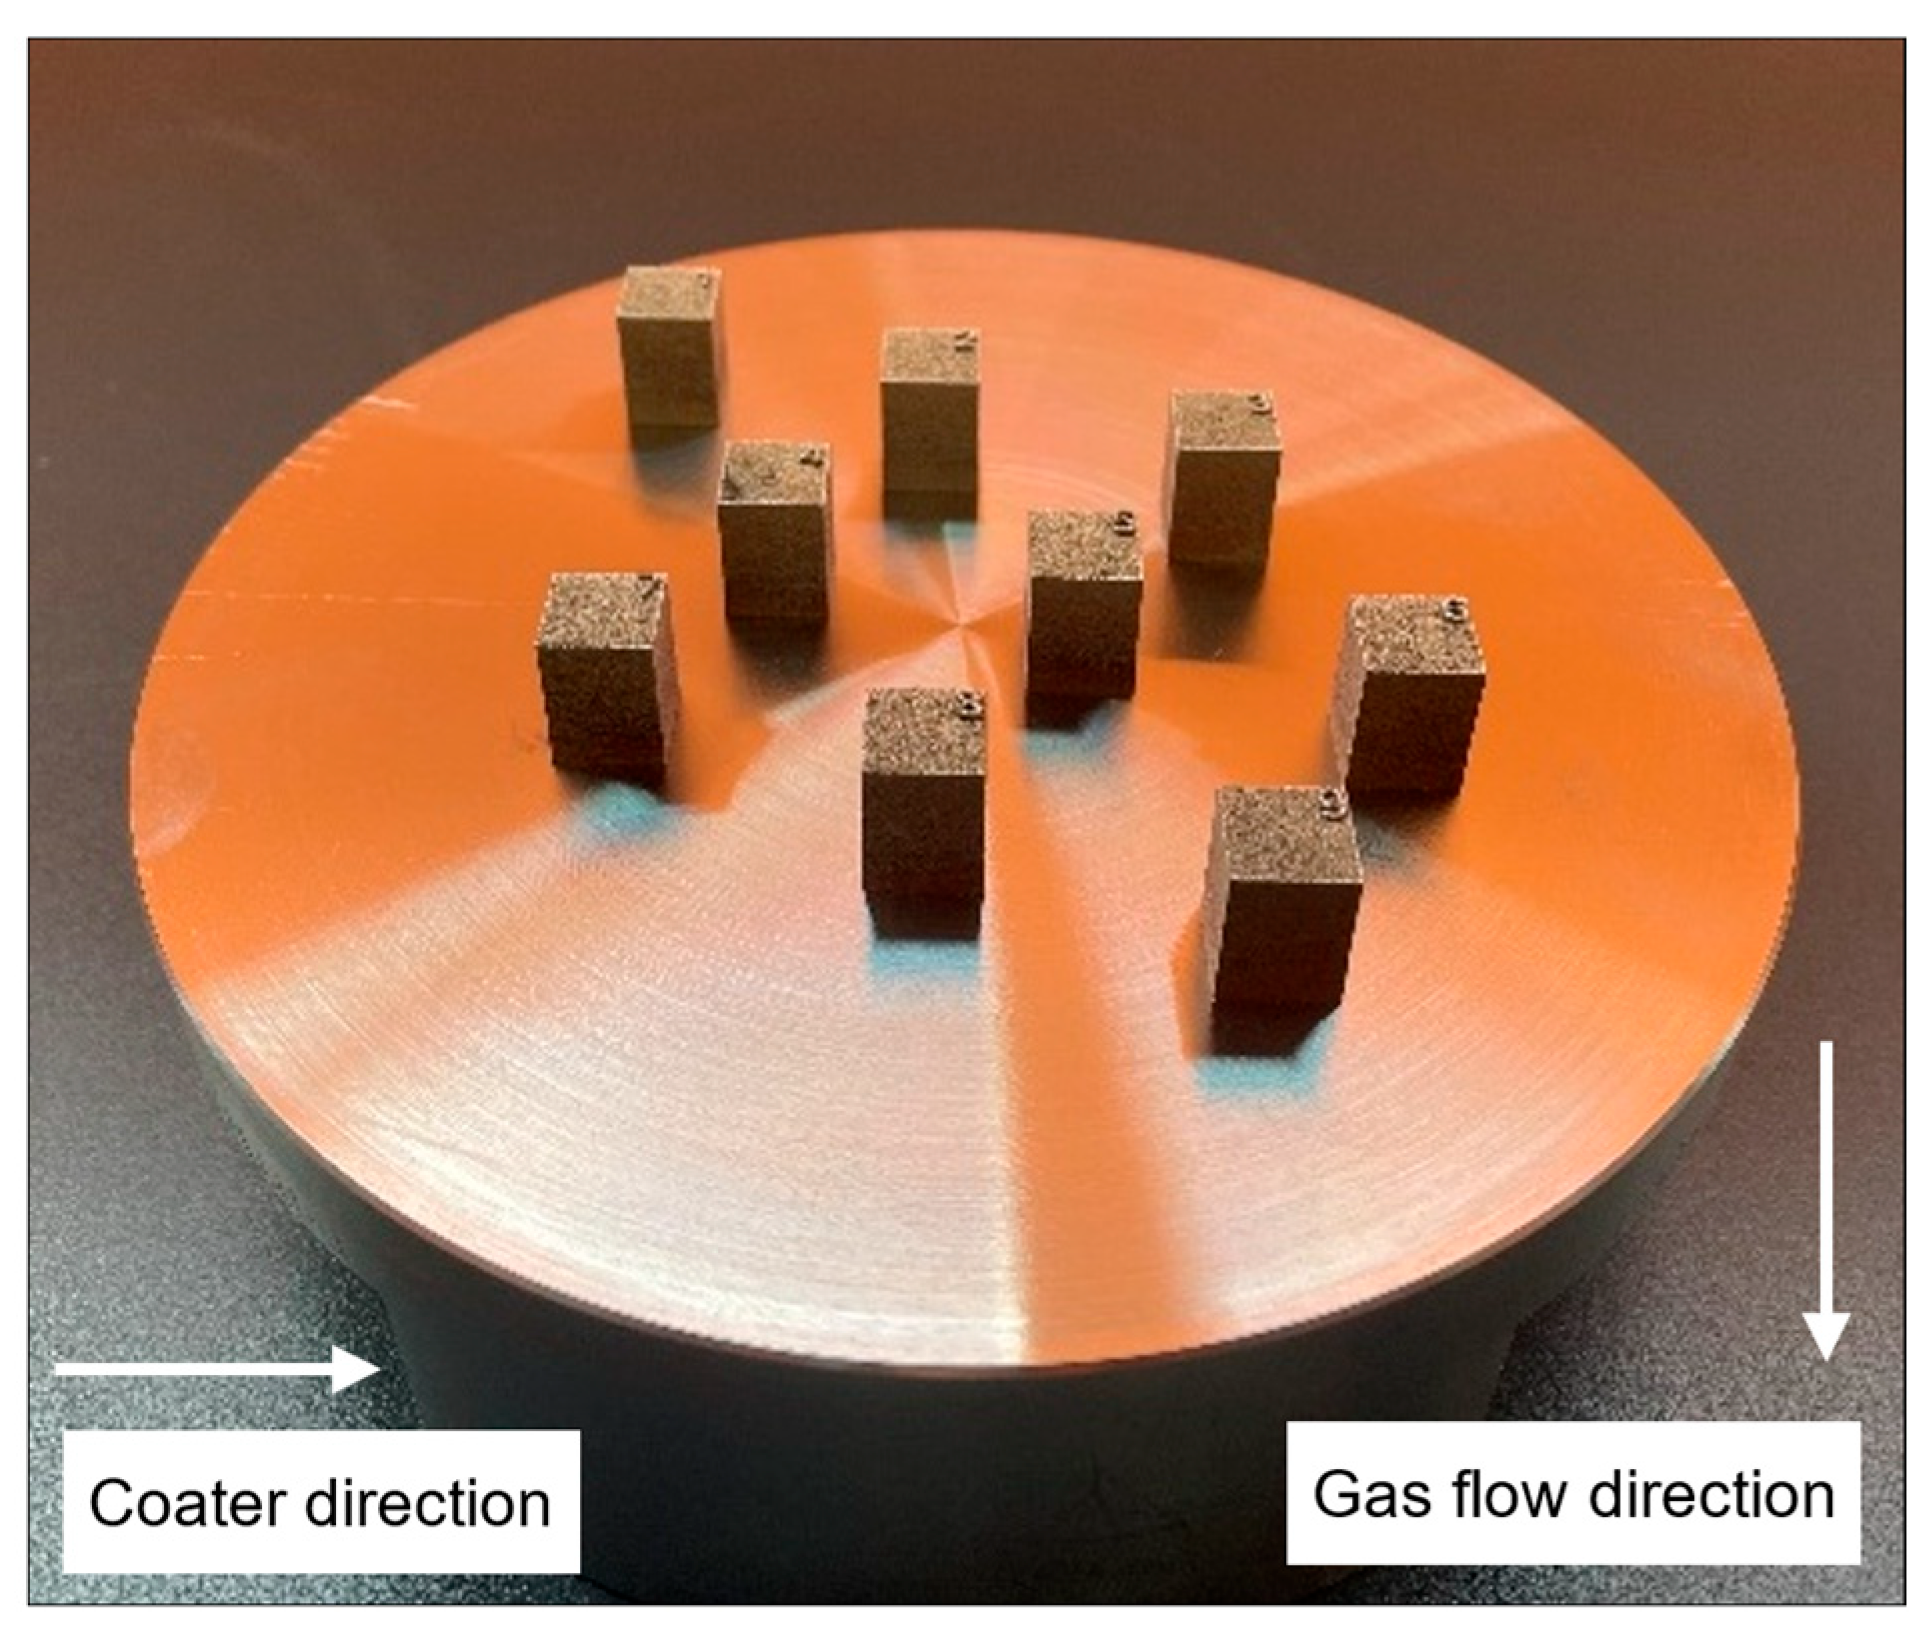
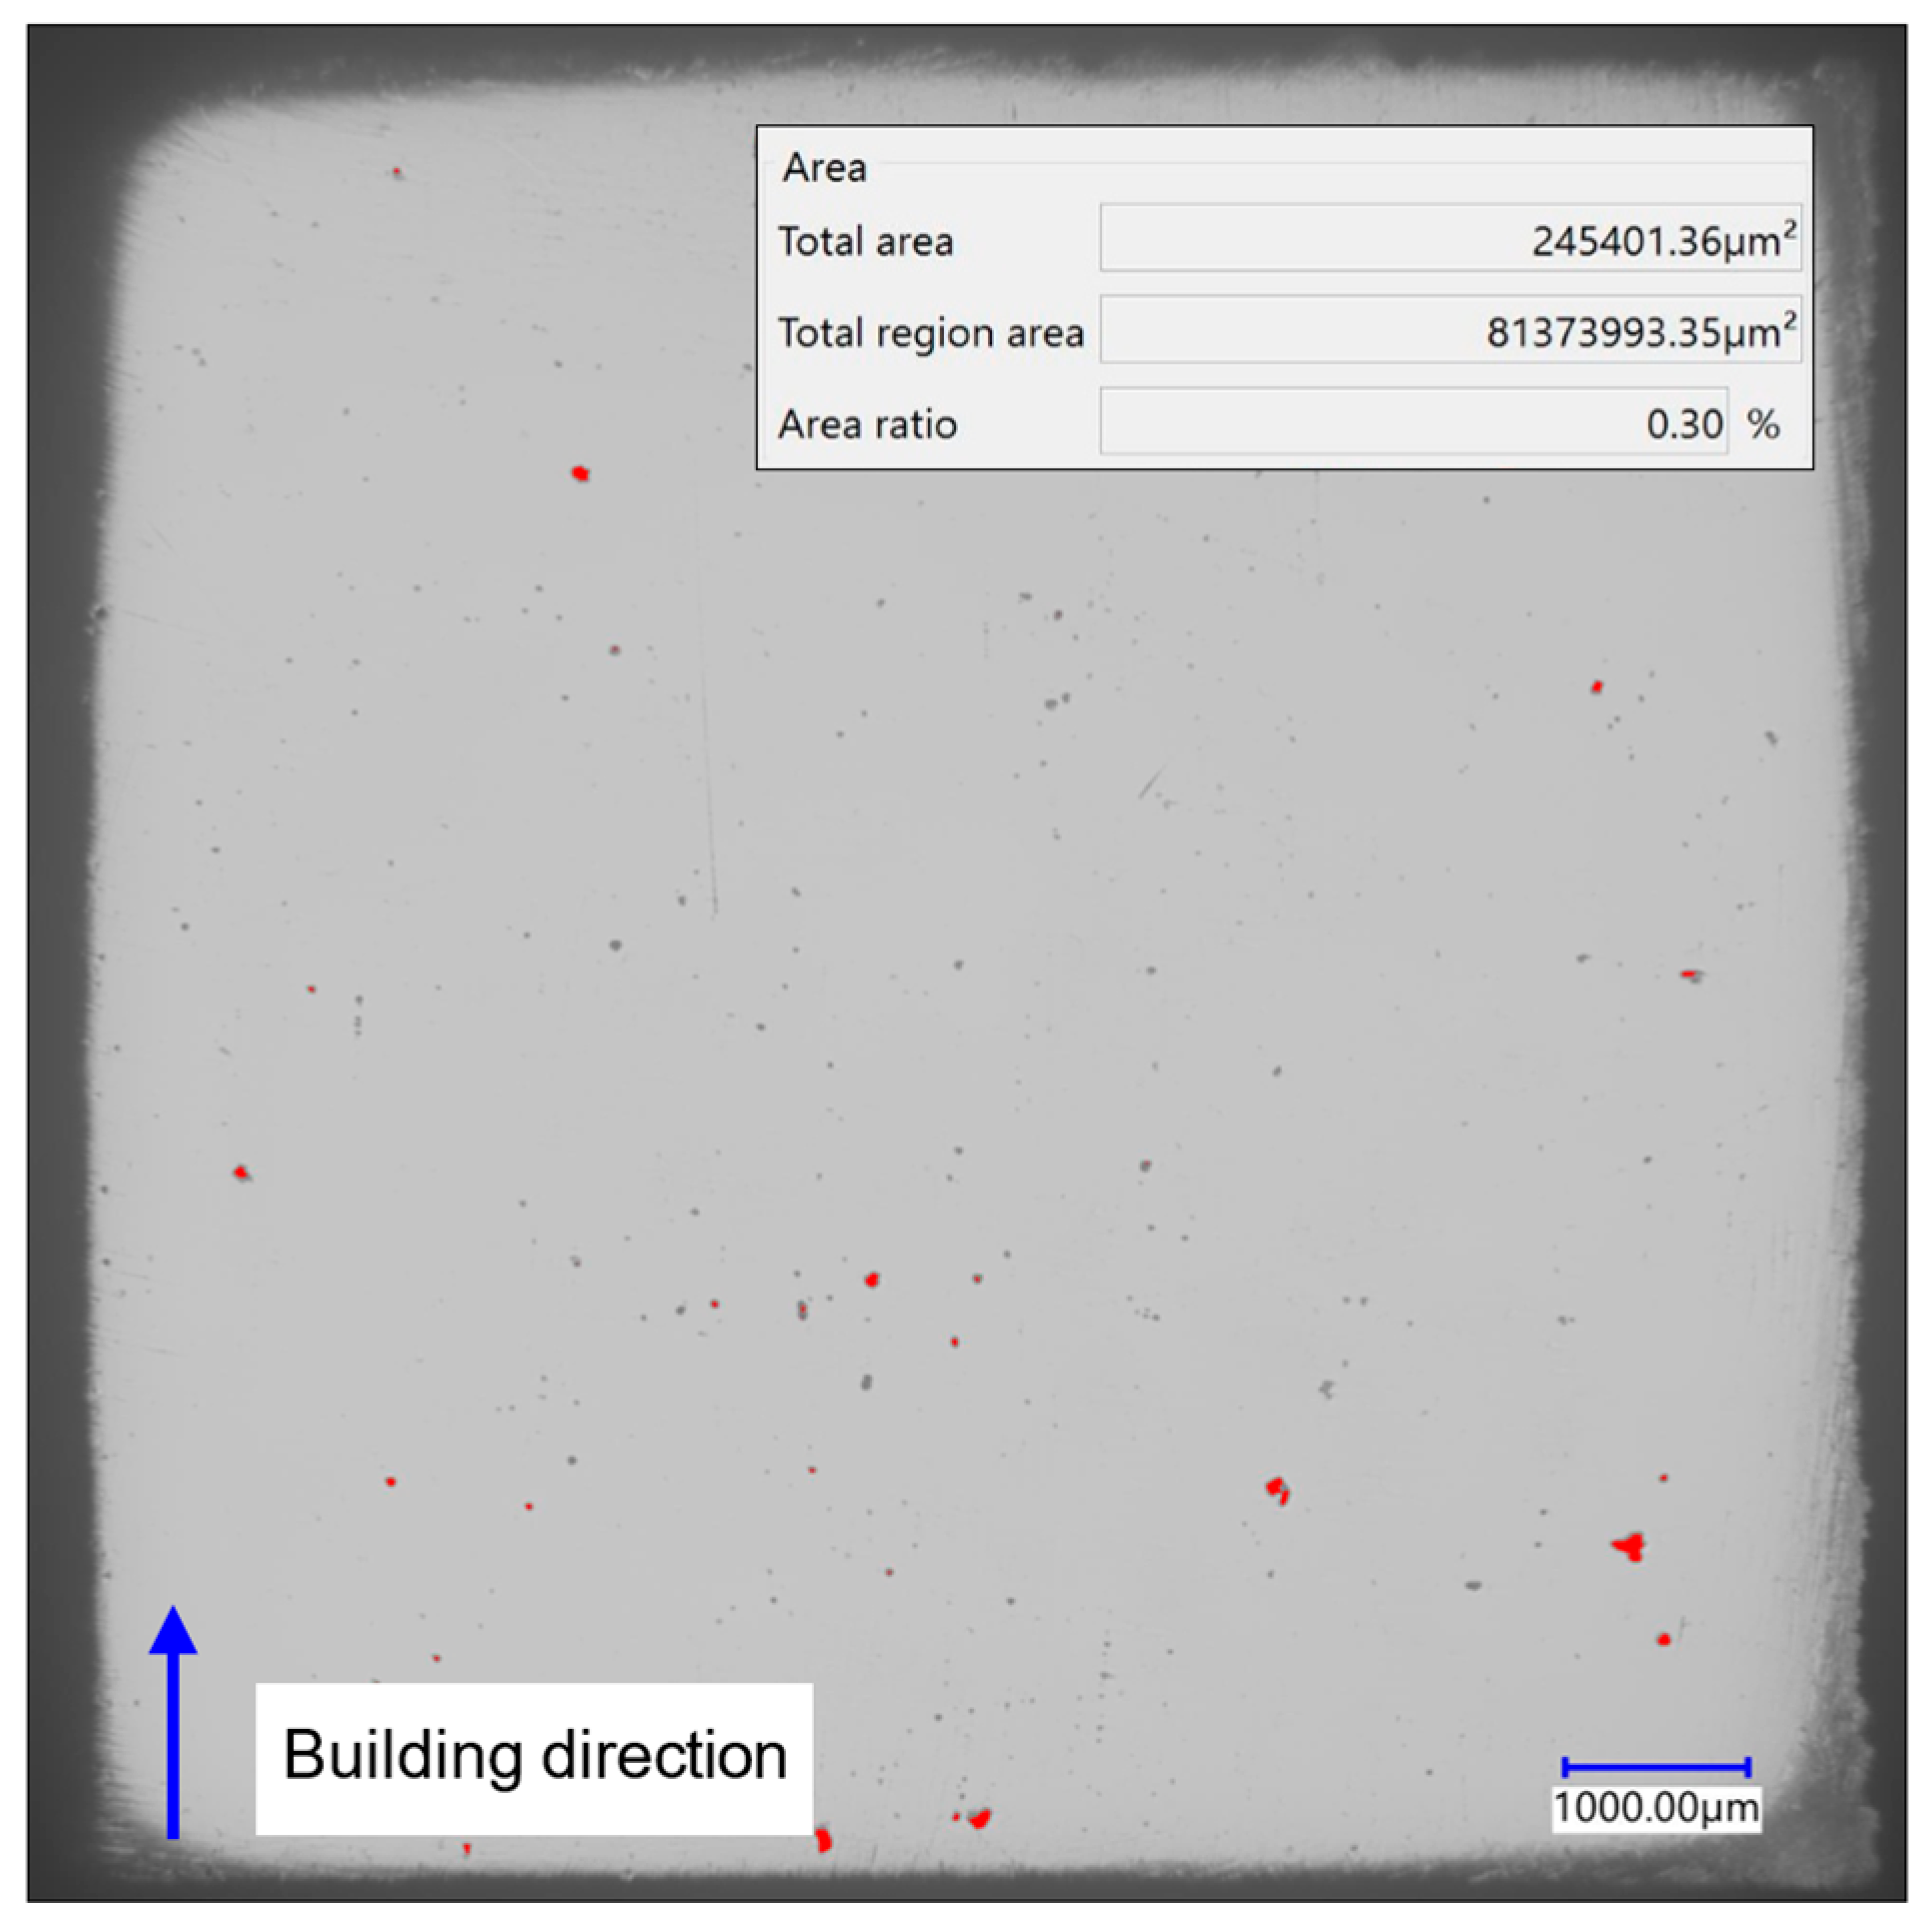
2.1. GRCop-42 Production
2.2. Experimental Tests Configuration
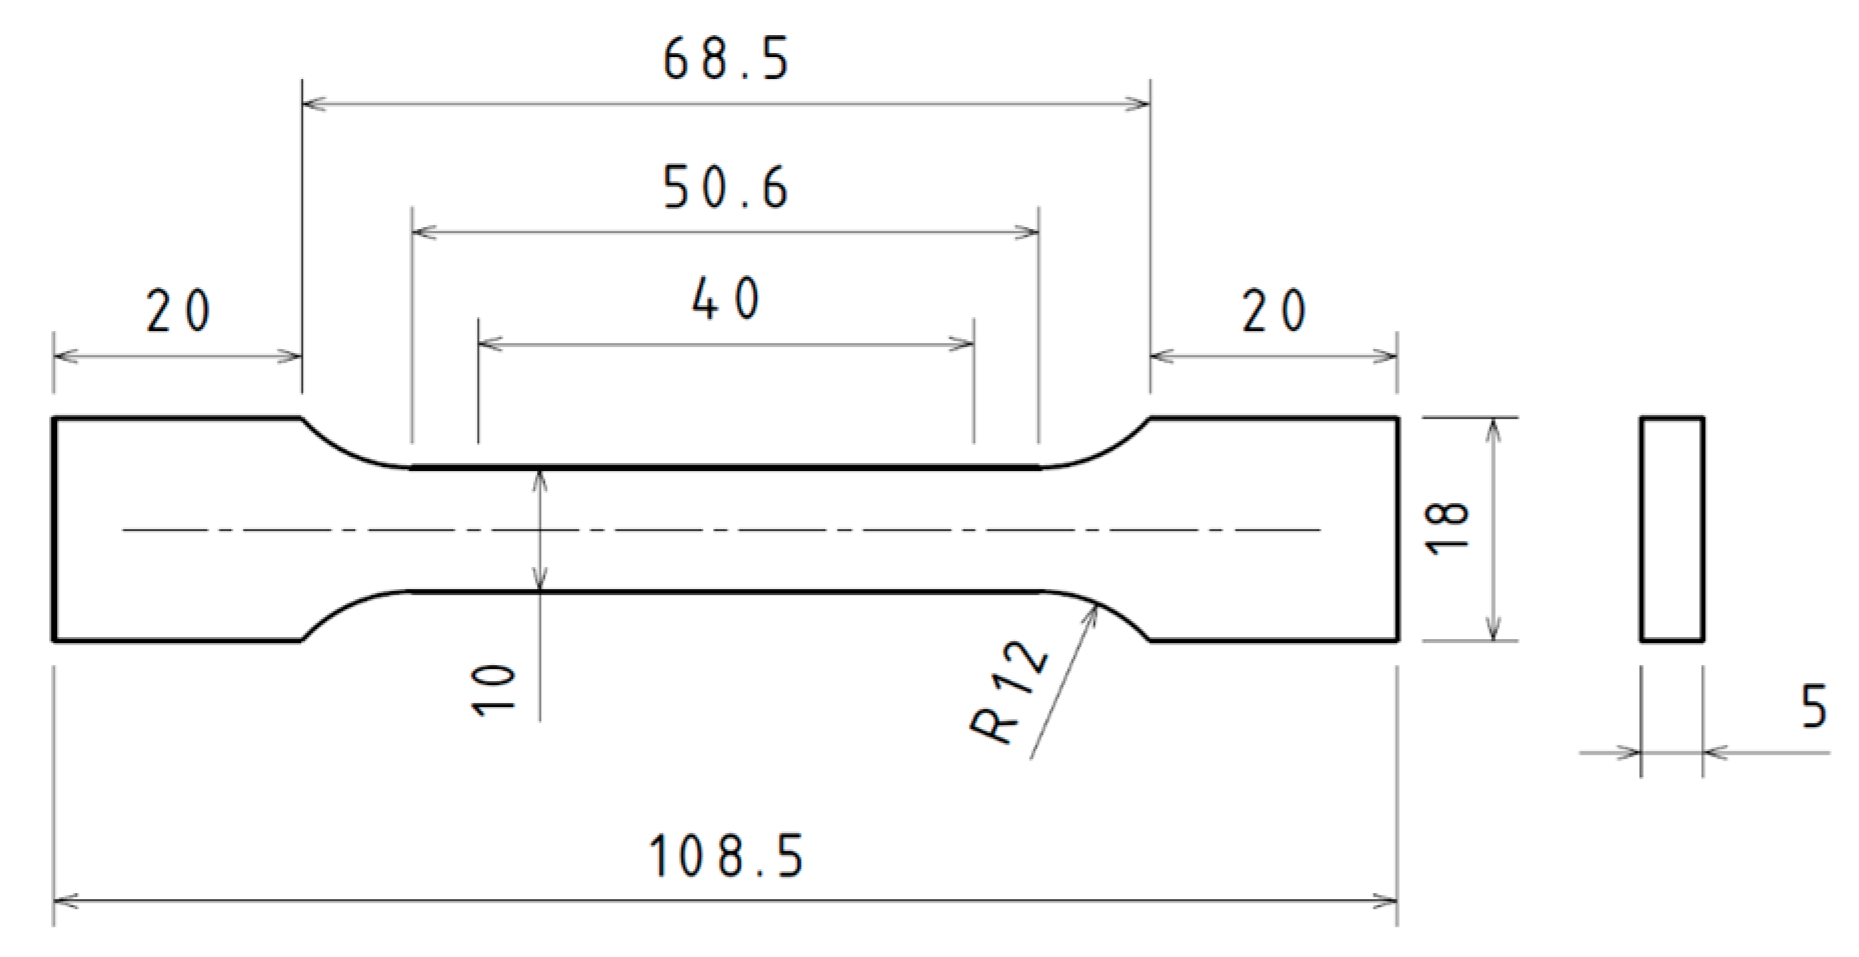
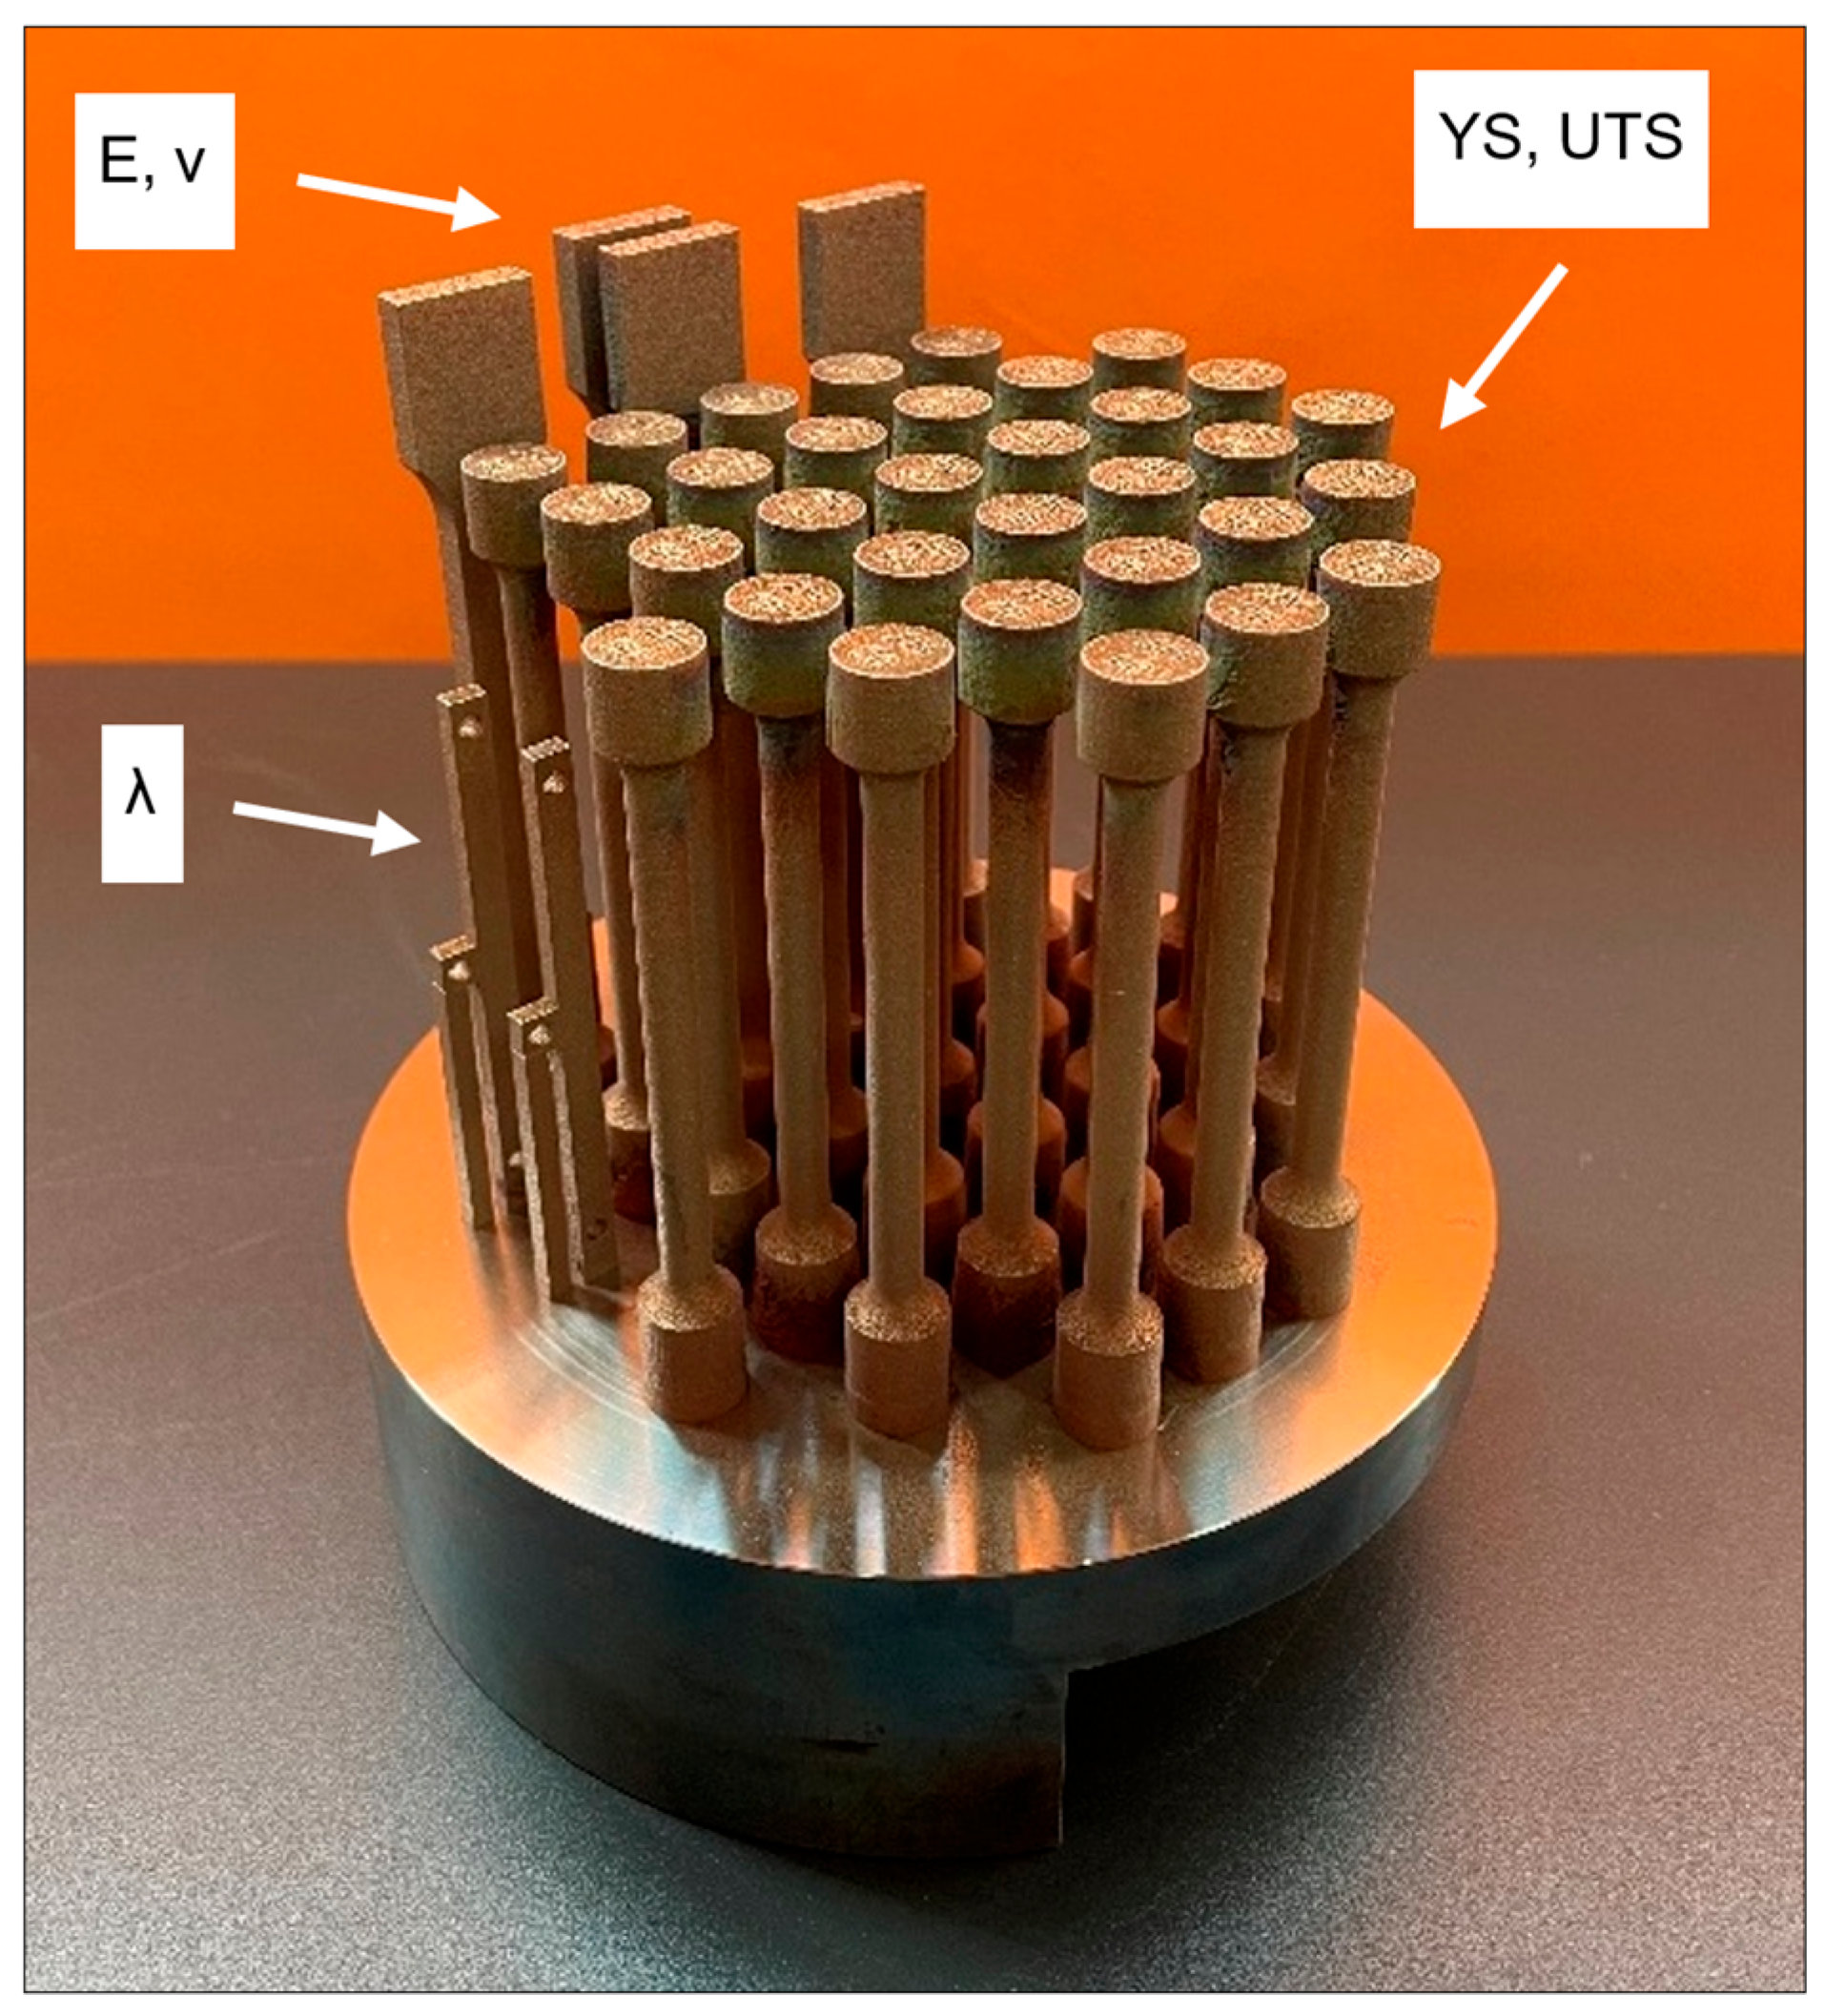
2.2.1. Mechanical Tests
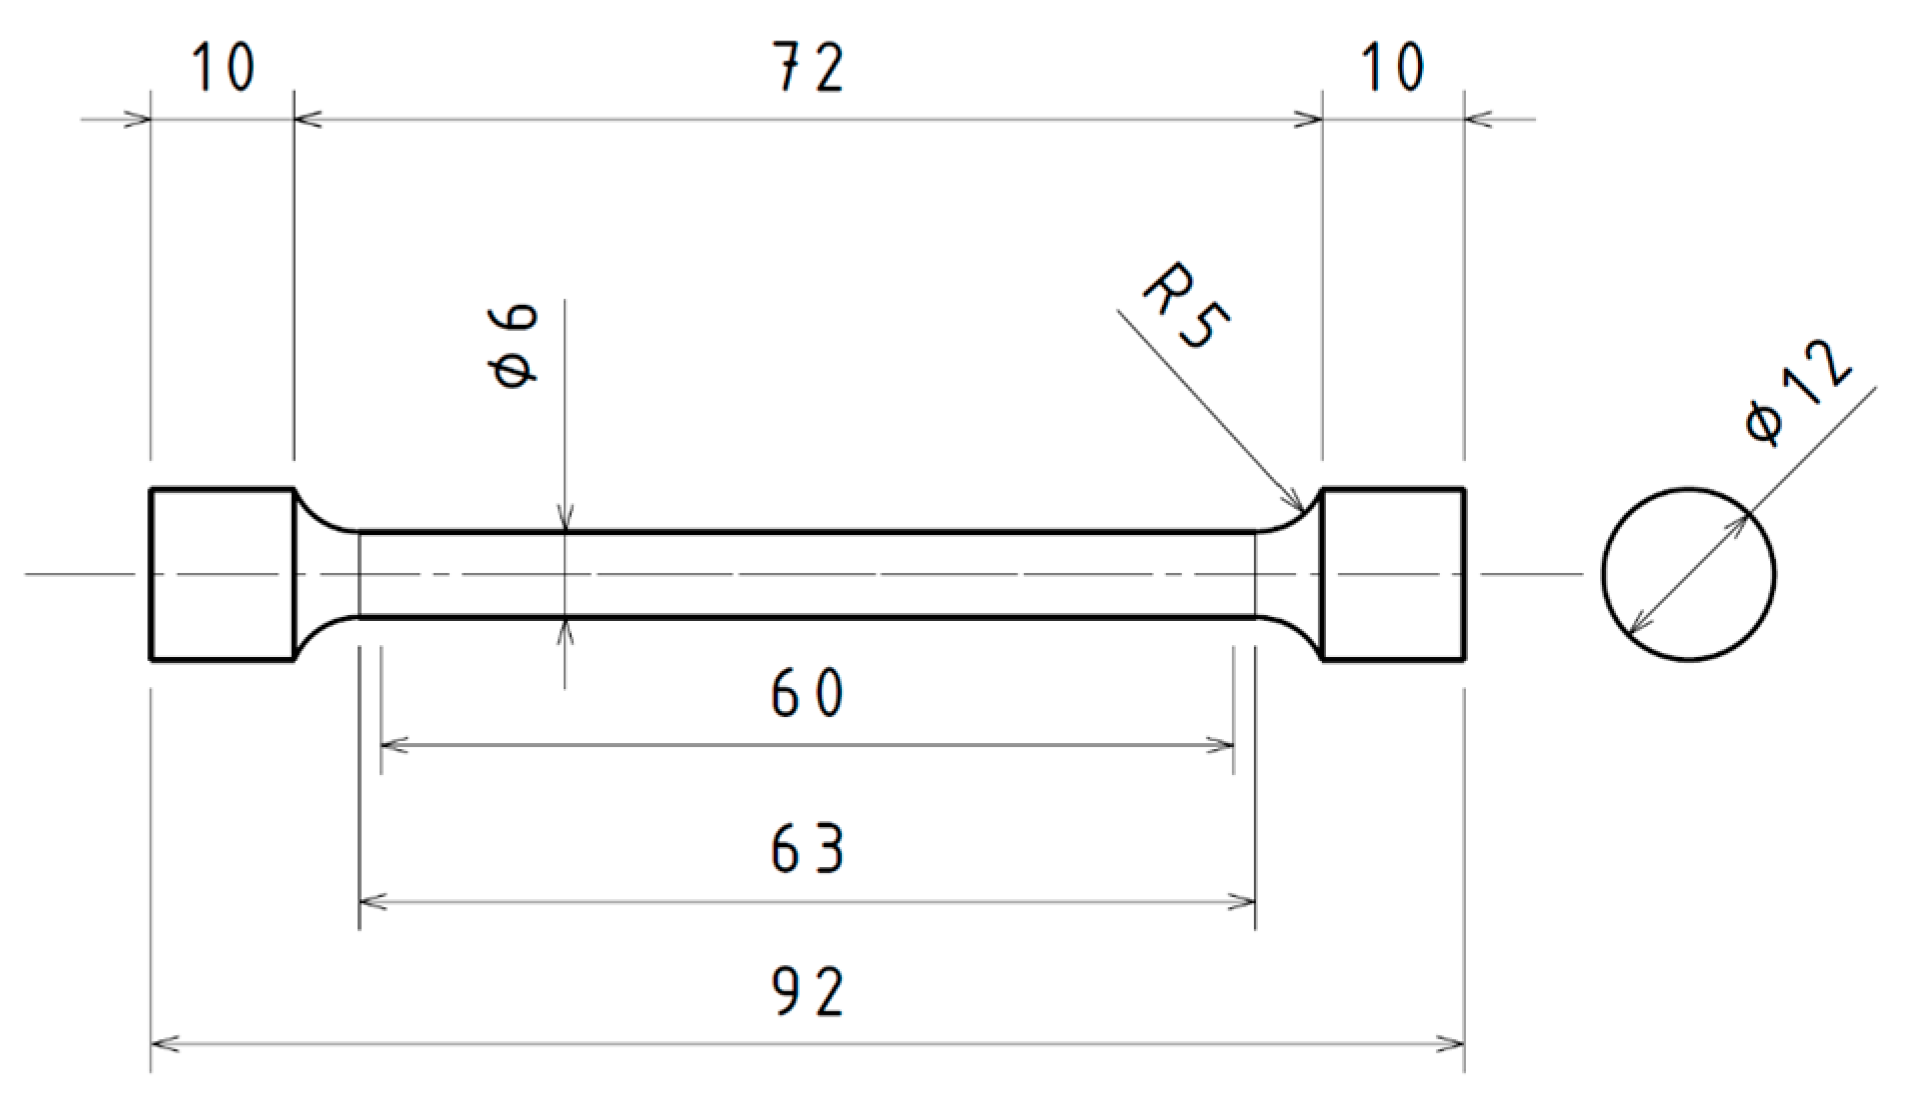
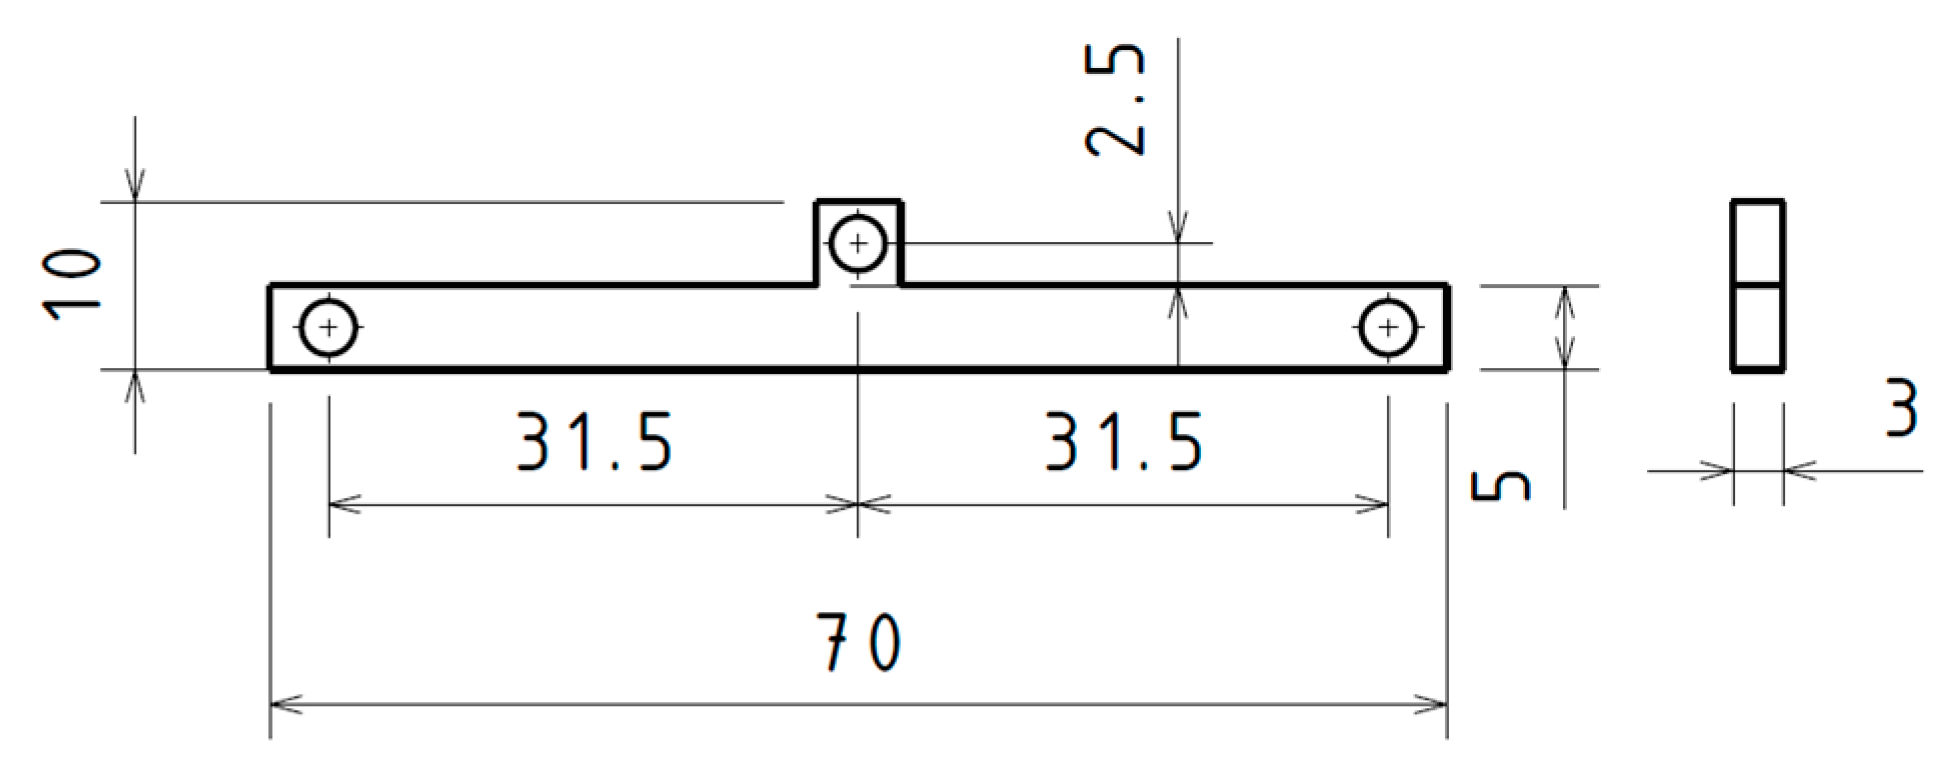
2.2.2. Thermal Tests
3. Results
3.1. Mechanical Properties
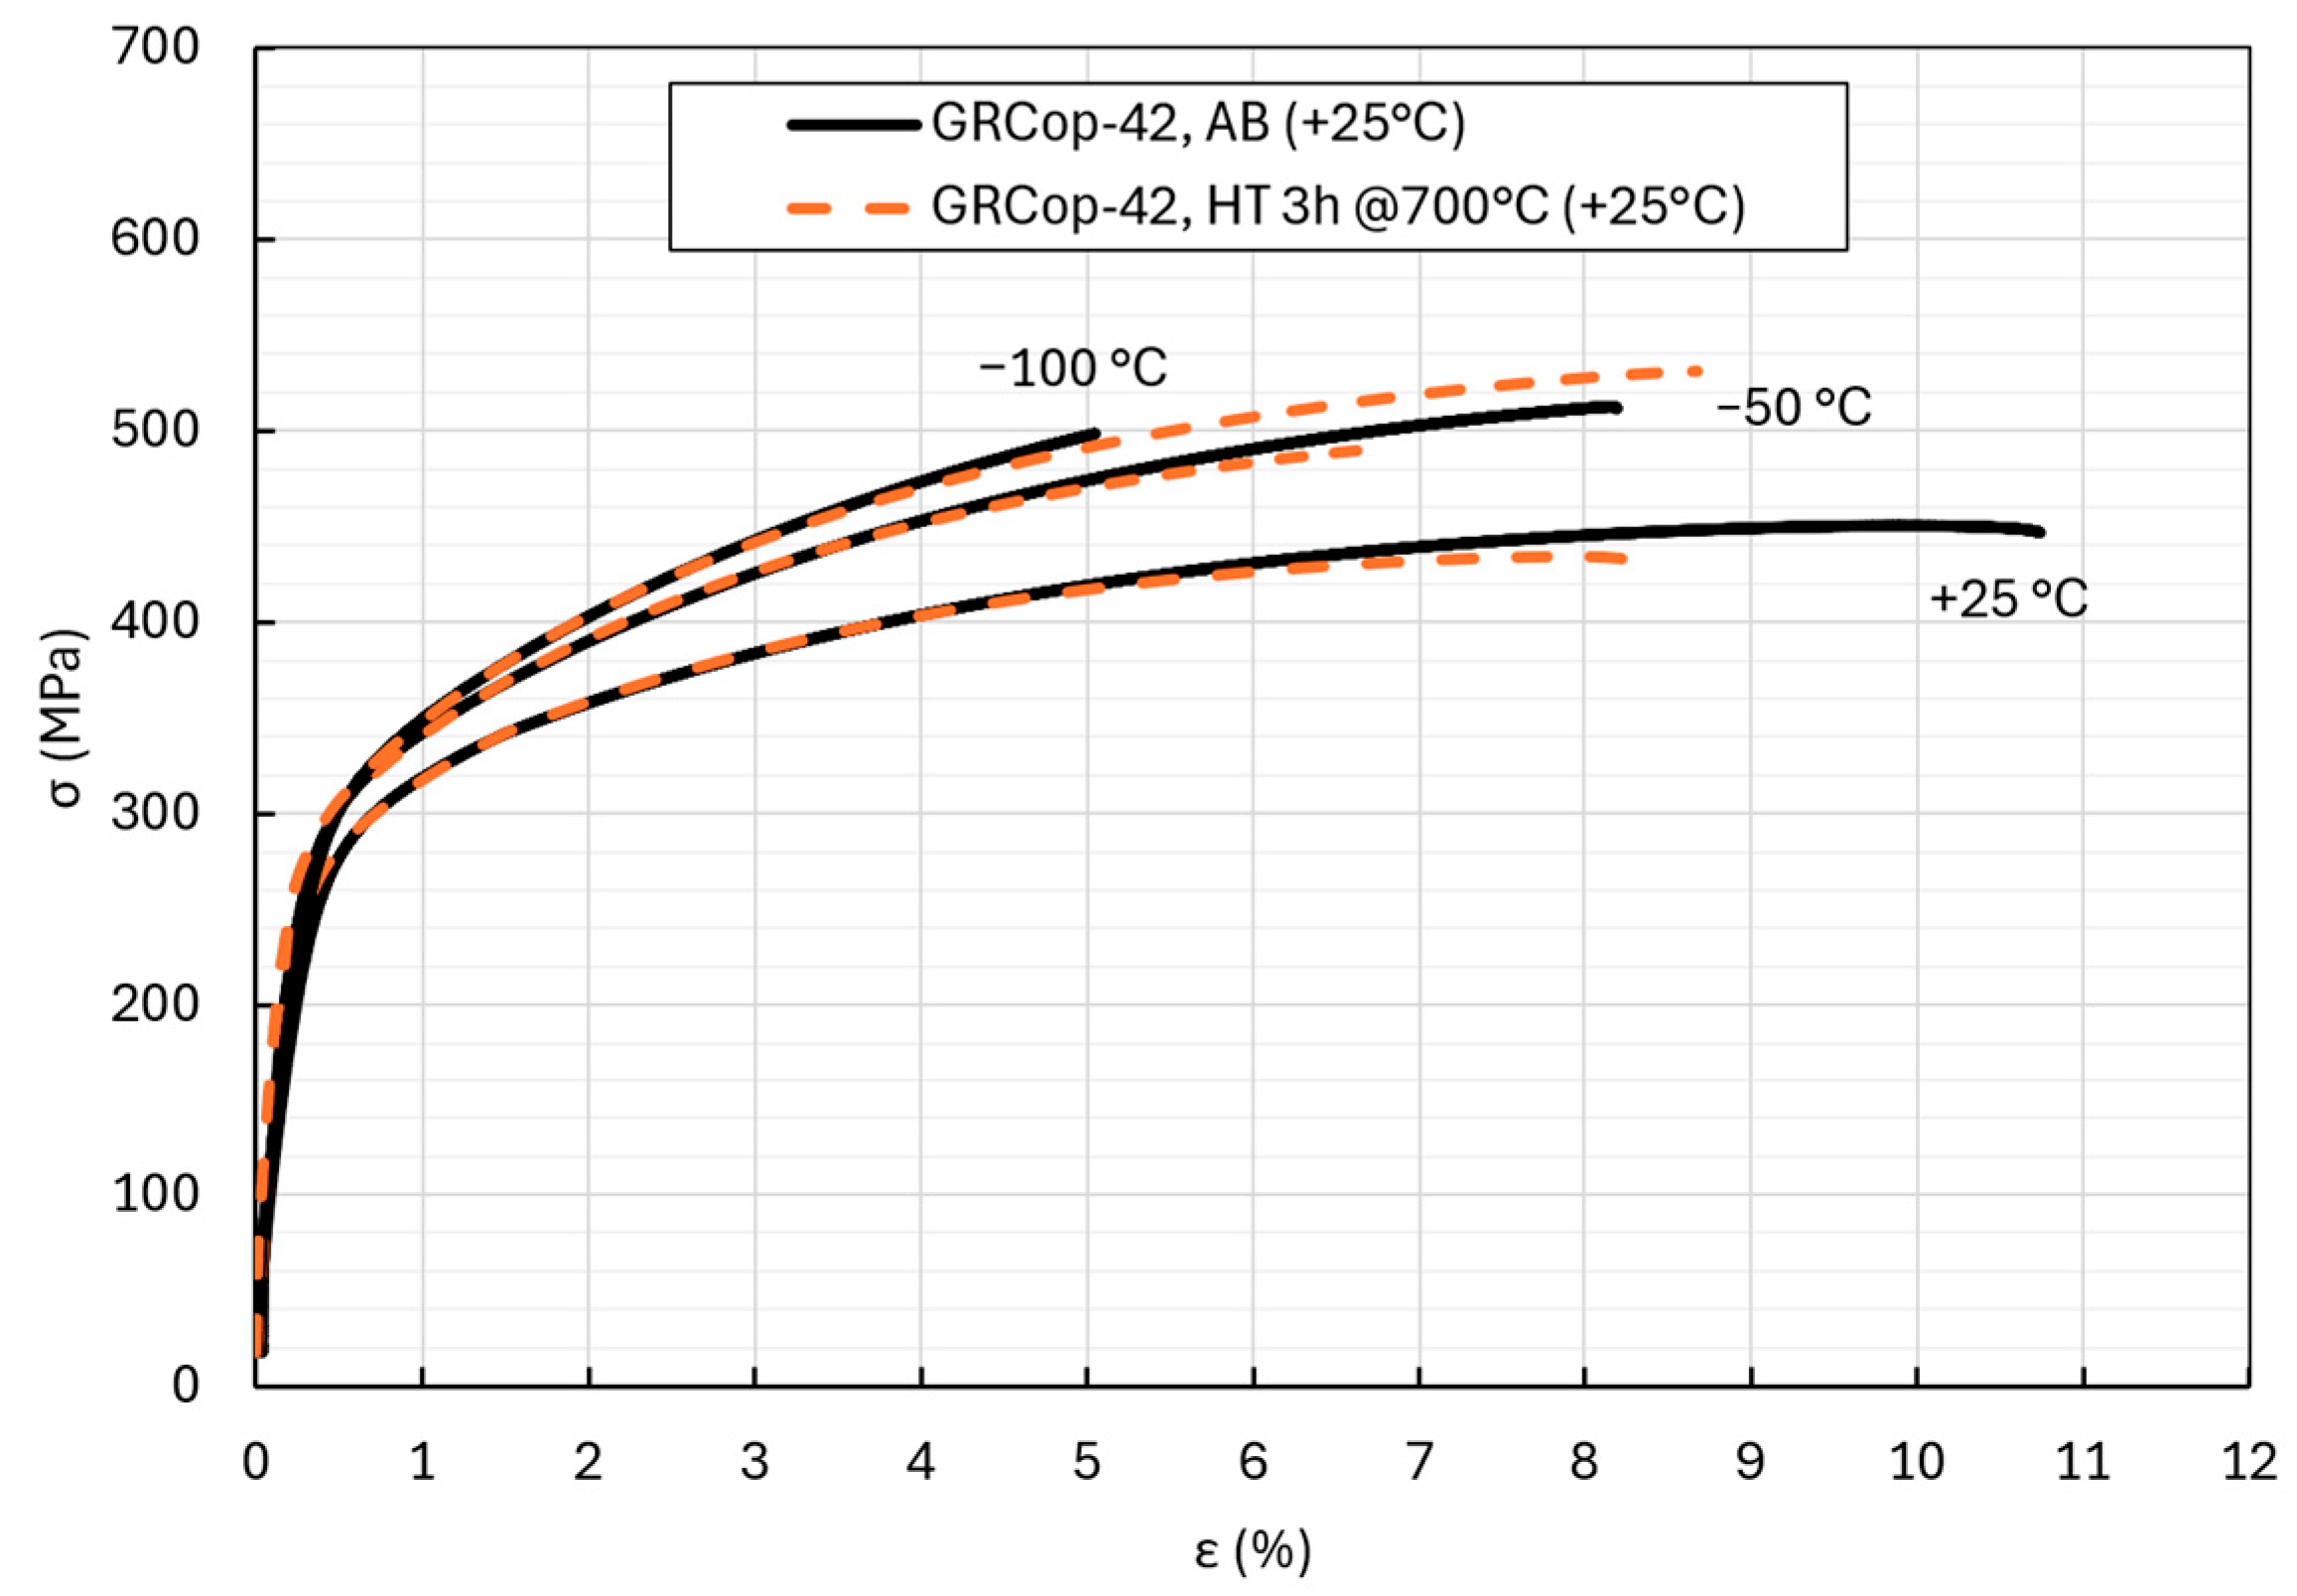
3.1.1. Experimental Data
3.1.2. Constitutive Material Model
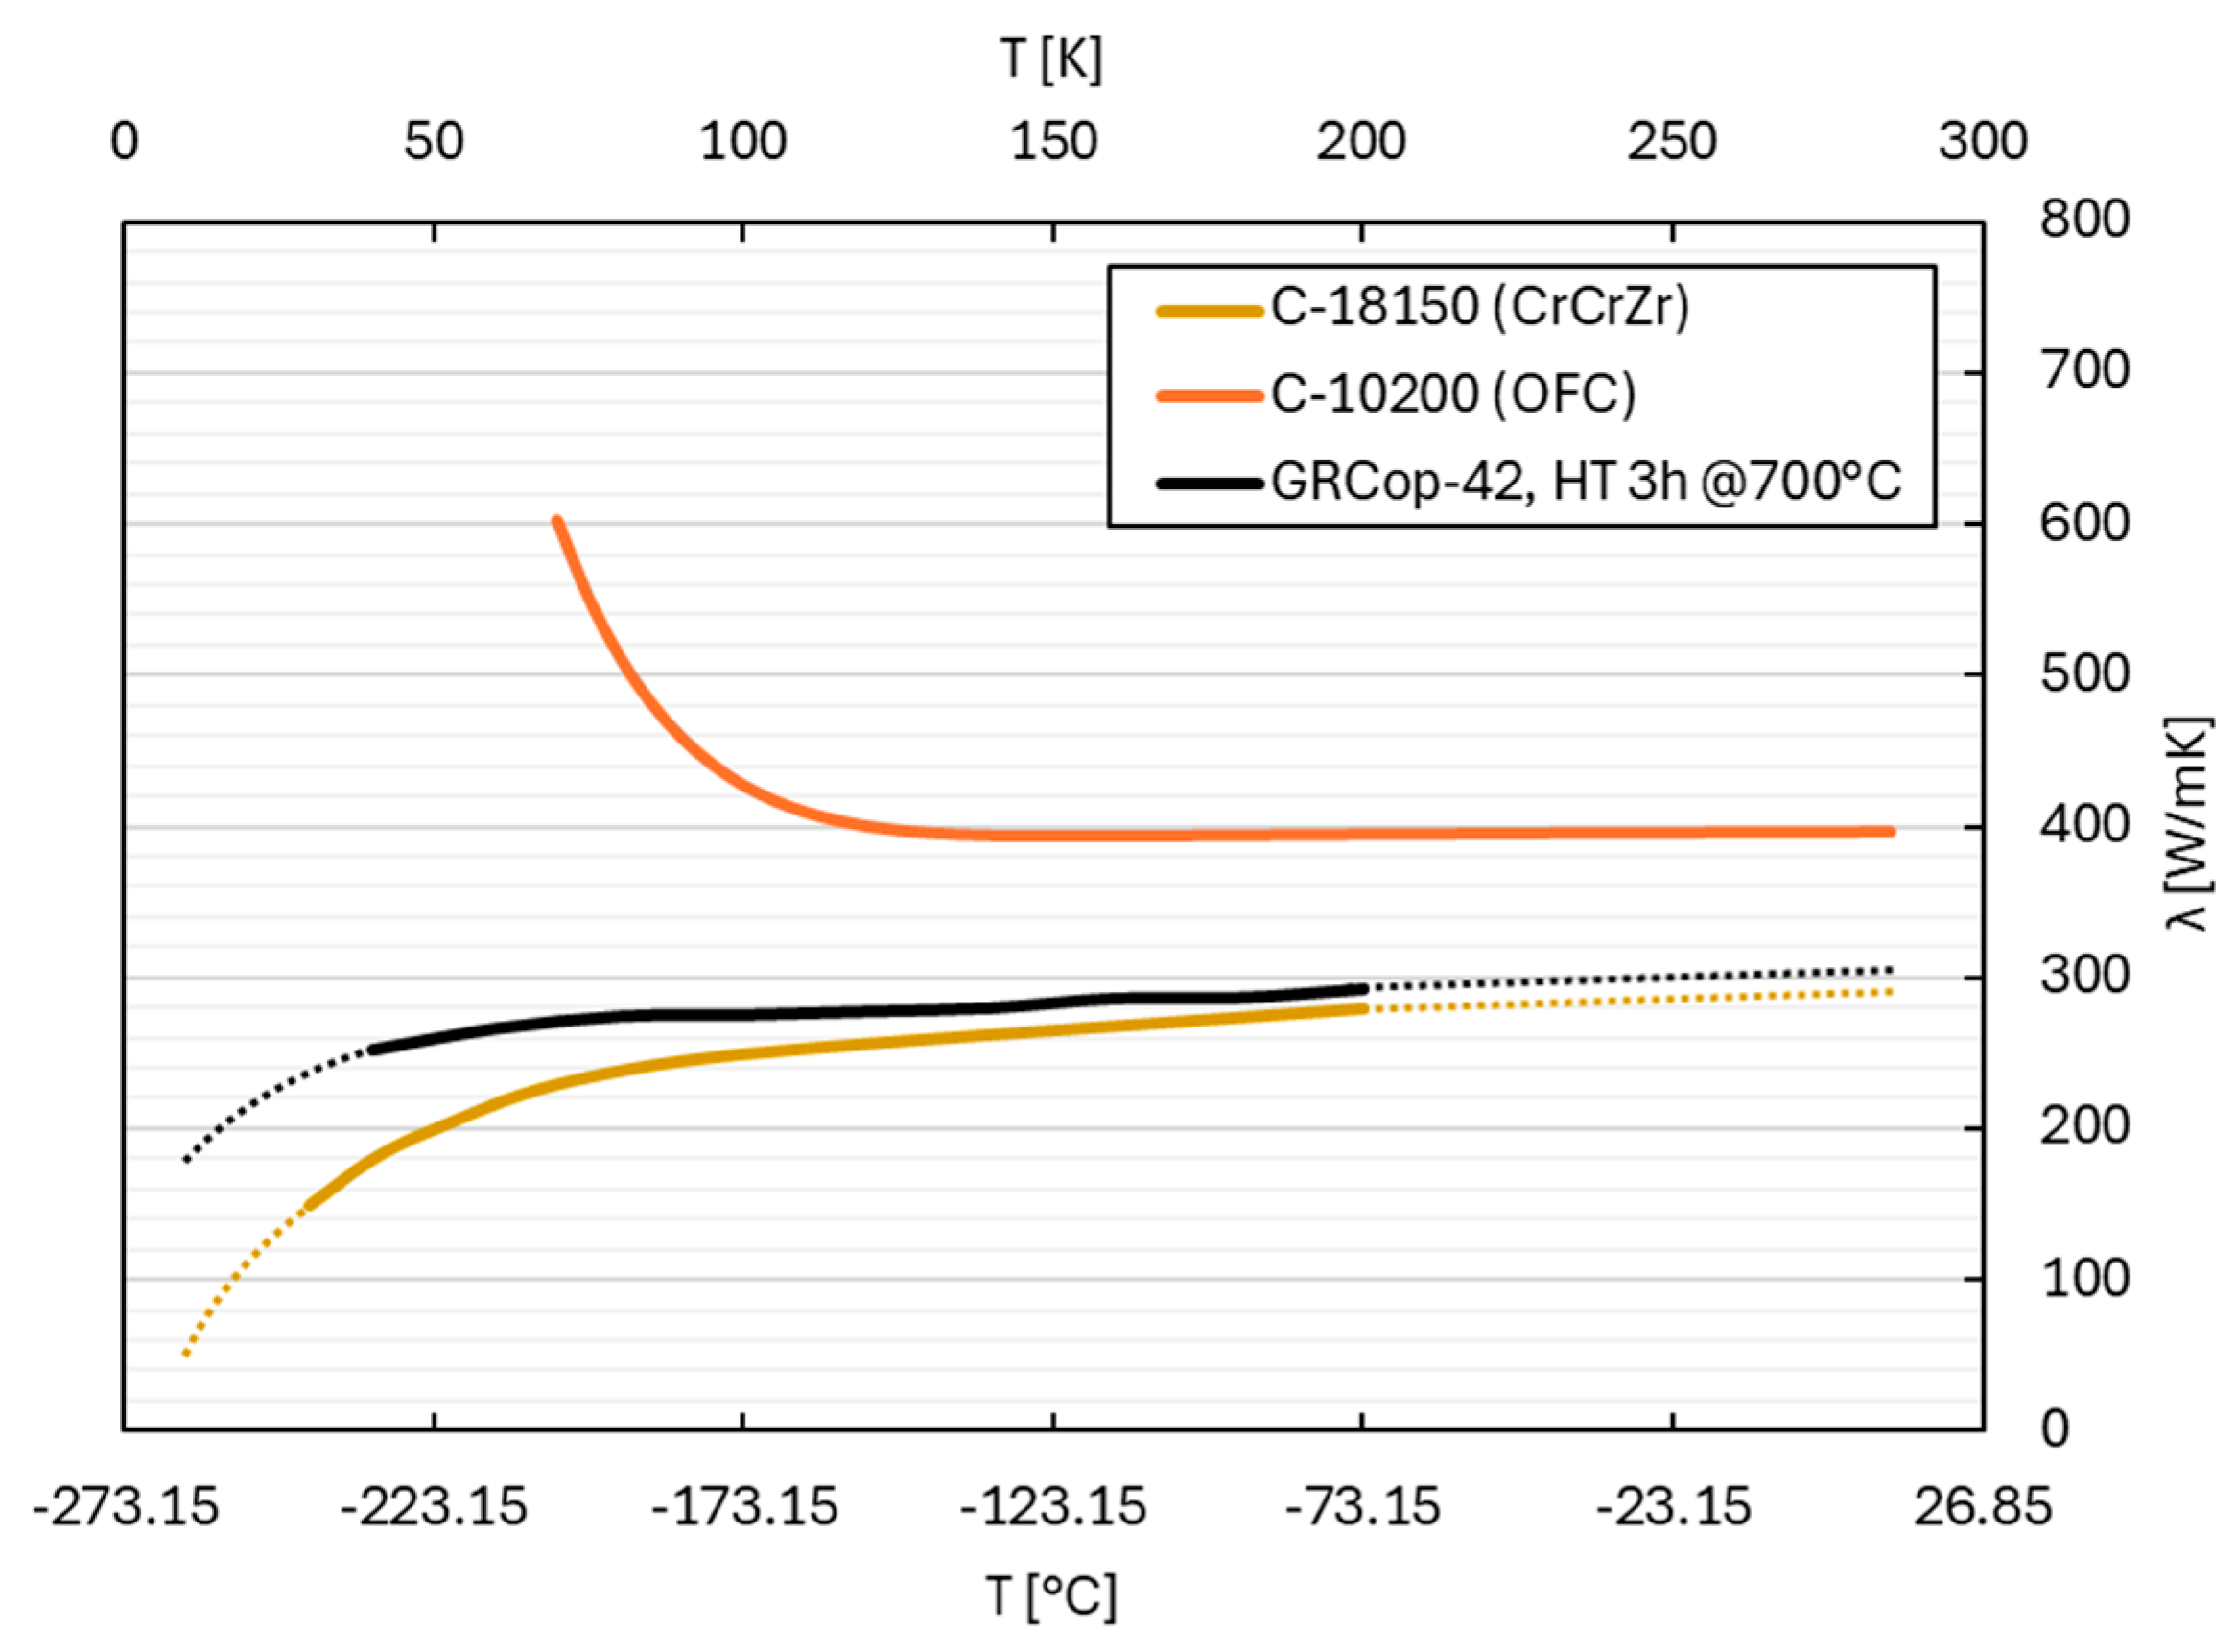
3.2. Thermal Conductivity
4. Discussion
5. Conclusions
Author Contributions
Funding
Data Availability Statement
Acknowledgments
Conflicts of Interest
Abbreviations
| PBF-LB | Bed Fusion-Laser Based |
| GRCop-42 | Glenn Research Center Copper (Cu-4 wt. Cr-2 wt.% Nb) |
| GRCop-84 | Glenn Research Center Copper (Cu-8 wt. Cr-4 wt.% Nb) |
| DED | Direct Energy Deposition |
| IR | InfraRed |
| HIP | Hot Isostatic Pressing |
| YS | Yield Strength |
| OFC | Oxygen Free Copper |
| UTS | Ultimate Tensile Strength |
| TC | Thermal Conductivity |
| VED | Volumetric Energy Density |
| M4P | Metal4Printing |
| DOE | Design of Experiment |
| EDM | Electrical Discharge Machining |
| AB | As-build |
| HT | Heat-Treated |
| RTD | Resistance Temperature Detectors |
| PT100 | 100 Ω Platinum Resistors |
| PID | Proportional-Integral-Derivative |
| MLI | Multi-Layer Insulation |
| V-C | Voce-Chaboche |
| GRG | Nonlinear Generalized Reduced Gradient |
| ICP-MS | Inductively Coupled Plasma-Mass Spectrometry |
References
- Campani, A.; Adams, D.Q.; Alduino, C.; Alfonso, K.; Avignone, F.T.; Azzolini, O.; Bari, G.; Bellini, F.; Benato, G.; Biassoni, M.; et al. Status and results from the CUORE experiment. Int. J. Mod. Phys. A 2020, 35, 2044016. [Google Scholar] [CrossRef]
- Ananna, C.; Barbieri, L.; Boeltzig, A.; Campostrini, M.; Casaburo, F.; Compagnucci, A.; Csedreki, L.; Gesue, R.M.; Marsh, J.; Mercogliano, D.; et al. Detectors and Shieldings: Past and Future at LUNA. Universe 2024, 10, 228. [Google Scholar] [CrossRef]
- Kaizer, J.; Nisi, S.; Povinec, P.P. Radiopurity measurements of aluminum, copper and selenium materials for underground experiments and mass spectrometry development. J. Radioanal. Nucl. Chem. 2019, 322, 1447–1454. [Google Scholar] [CrossRef]
- Aprile, E.; Abe, K.; Agostini, F.; Maouloud, S.A.; Alfonsi, M.; Althueser, L.; Angelino, E.; Angevaare, J.R.; Antochi, V.C.; Martin, D.A.; et al. Material radiopurity control in the XENONnT experiment. Eur. Phys. J. C 2022, 82, 599. [Google Scholar] [CrossRef]
- Cooper, K.G.; Lydon, J.L.; LeCorre, M.D.; Jones, Z.C.; Scannapieco, D.S.; Ellis, D.L.; Lerch, B.A. Three-Dimensional Printing GRCop-42; NASA/TM: Greenbelt, MD, USA, 2018; p. 220129.
- Gradl, P.; Mireles, O.R.; Katsarelis, C.; Smith, T.M.; Sowards, J.; Park, A.; Chen, P.; Tinker, D.C.; Protz, C.; Teasley, T.; et al. Advancement of extreme environment additively manufactured alloys for next generation space propulsion applications. Acta Astronaut. 2023, 211, 483–497. [Google Scholar] [CrossRef]
- De Groh, H.C.; Ellis, D.L.; Loewenthal, W.S. Comparison of GRCop-84 to Other Cu Alloys with High Thermal Conductivities. J. Mater. Eng. Perform. 2008, 17, 594–606. [Google Scholar] [CrossRef]
- Gradl, P.R.; Protz, C.S.; Cooper, K.; Ellis, D.; Evans, L.J.; Garcia, C. GRCop-42 Development and Hot-fire Testing Using Additive Manufacturing Powder Bed Fusion for Channel-cooled Combustion Chambers. In AIAA 2019-4228 Session: Additive Manufacturing: Test Results and Feasibility I, Proceedings of the AIAA Propulsion and Energy 2019 Forum, Indianapolis, IN, USA, 19–22 August 2019; AIAA: Reston, VA, USA, 2019. [Google Scholar] [CrossRef]
- Gradl, P.R.; Protz, C.S.; Ellis, D.L.; Greene, S.E. Progress in Additively Manufactured Copper-Alloy GRCop-84, GRCop-42, and Bimetallic Combustion Chambers for Liquid Rocket Engines. In Proceedings of the 70th International Astronautical Congress (IAC), Washington, DC, USA, 21–25 October 2019. [Google Scholar]
- Seltzman, A.H.; Wukitch, S.J. RF losses in selective laser melted GRCop-84 copper waveguide for an additively manufactured lower hybrid current drive launcher. Fusion Eng. Des. 2020, 159, 111762. [Google Scholar] [CrossRef]
- Seltzman, A.H.; Wukitch, S.J. Surface roughness and finishing techniques in selective laser melted GRCop-84 copper for an additive manufactured lower hybrid current drive launcher. Fusion Eng. Des. 2020, 160, 111801. [Google Scholar] [CrossRef]
- Seltzman, A.H.; Wukitch, S.J. Resolution and geometric limitations in laser powder bed fusion additively manufactured GRCop-84 structures for a lower hybrid current drive launcher. Fusion Eng. Des. 2021, 173, 112847. [Google Scholar] [CrossRef]
- Seltzman, A.H.; Wukitch, S.J. Brazing characteristics, microstructure, and wettability of laser powder bed fusion additive manufactured GRCop-84 compared to CuCrZr and OFC, and brazing to titanium-zirconium-molybdenum alloy limiters. Fusion Eng. Des. 2022, 180, 113185. [Google Scholar] [CrossRef]
- Demeneghi, G.; Gradl, P.; Mayeur, J.R.; Hazeli, K. Size effect characteristics and influences on fatigue behavior of laser powder bed fusion of thin wall GRCop-42 copper alloy. Heliyon 2024, 10, e28679. [Google Scholar] [CrossRef] [PubMed]
- Sahoo, S.; Keleshteri, M.M.; Mayeur, J.R.; Hazeli, K. Stress localization investigation of additively manufactured GRCop-42 thin-wall structure. Thin-Walled Struct. 2024, 201, 112022. [Google Scholar] [CrossRef]
- Rahman, H.; McCarroll, A.; Siddaiah, A.; Kumar, P.; Menezes, P.L. Ultrasonic assisted electropolishing to reduce the surface roughness of laser powder bed fusion based additively manufactured copper heat exchanger components. Int. J. Adv. Manuf. Technol. 2024, 134, 4297–4314. [Google Scholar] [CrossRef]
- Caravella, I.; Cortis, D.; Di Angelo, L.; Orlandi, D. Experimental Data Collection of Surface Quality Analysis of CuCrZr Specimens Manufactured with SLM Technology: Analysis of the Effects of Process Parameters. Materials 2023, 16, 98. [Google Scholar] [CrossRef]
- Bai, Y.; Zhao, C.; Zhang, Y.; Chen, J.; Wang, H. Additively manufactured CuCrZr alloy: Microstructure, mechanical properties and machinability. Mater. Sci. Eng. A 2021, 819, 141528. [Google Scholar] [CrossRef]
- Landes, S.; Suresh, T.; Prasad, A.; Letcher, T.; Gradl, P.; Ellis, D. Investigation of Additive Manufactured GRCop-42 Alloy Developed by Directed Energy Deposition Methods. In Proceedings of the ASME 2020 International Mechanical Engineering Congress and Exposition, Virtual, Online, 16–19 November 2020; Advances in Aerospace Technology. ASME: New York, NY, USA, 2020; Volume 4, p. V004T04A026. [Google Scholar] [CrossRef]
- Suresh, T.; Landes, S.; Letcher, T.; Prasad, A.; Gradl, P.; Ellis, D. Nanomechanical Characterization of Additive Manufactured GRCop-42 Alloy Developed by Directed Energy Deposition Methods. In Proceedings of the ASME 2020 International Mechanical Engineering Congress and Exposition, Virtual, Online, 16–19 November 2020; Advances in Aerospace Technology. ASME: New York, NY, USA, 2020; Volume 4, p. V004T04A003. [Google Scholar] [CrossRef]
- Demeneghi, G.; Barnes, B.; Gradl, P.; Ellis, D.; Mayeur, J.R.; Hazeli, K. Directed energy deposition GRCop-42 copper alloy: Characterization and size effects. Mater. Des. 2022, 222, 111035. [Google Scholar] [CrossRef]
- Demeneghi, G.; Gradl, P.; Mayeur, J.R.; Hazeli, K. GRCop-42: Comparison between laser powder bed fusion and laser powder direct energy deposition. Addit. Manuf. Lett. 2024, 10, 100224. [Google Scholar] [CrossRef]
- Cortis, D.; Pilone, D.; Broggiato, G.; Campana, F.; Tatananni, D.; Orlandi, D. Setting of L-PBF parameters for obtaining high density and mechanical performance of AISI 316L and 16MnCr5 alloys with fine laser spot size. Prog. Addit. Manuf. 2024, 9, 2017–2029. [Google Scholar] [CrossRef]
- ISO EN 6892-1; Metallic Materials—Tensile Testing—Part 1: Method of Test at Room Temperature. ISO: Geneva, Switzerland, 2019.
- ISO EN 6892-3; Metallic Materials—Tensile Testing—Part 3: Method of Test at Low Temperature. ISO: Geneva, Switzerland, 2015.
- Gruber, S.; Stepien, L.; Gerdt, L.; Lopez, E.; Kieser, J.; Brueckner, F.; Leyens, C.; Bratt, C. Process development for laser powder bed fusion of GRCop-42 using a 515 nm laser source. J. Laser Appl. 2023, 35, 042078. [Google Scholar] [CrossRef]
- Seltzman, A.H.; Wukitch, S.J. Fracture characteristics and heat treatment of laser powder bed fusion additively manufactured GRCop-84 copper. Mater. Sci. Eng. A 2021, 827, 141690. [Google Scholar] [CrossRef]
- Voce, E. The relationship between stress and strain for homogeneous deformation. J. Inst. Met. 1948, 74, 537–562. [Google Scholar]
- Petry, A.; Gallo, P.; Remes, H.; Niemelä, A. Optimizing the Voce–Chaboche Model Parameters for Fatigue Life Estimation of Welded Joints in High-Strength Marine Structures. J. Mar. Sci. Eng. 2022, 10, 818. [Google Scholar] [CrossRef]
- Nonlinear Generalized Reduced Gradient. Available online: https://www.sciencedirect.com/topics/engineering/reduced-gradient (accessed on 13 April 2025).
- Chen, Y.; Zeng, C.; Ding, H.; Emanet, S.; Gradl, P.R.; Ellis, D.L.; Guo, S. Thermophysical properties of additively manufactured (AM) GRCop-42 and GRCop-84. Mater. Today Commun. 2023, 36, 106665. [Google Scholar] [CrossRef]
- Seltzman, A.H.; Wukitch, S.J. Precipitate Size in GRCop-84 Gas Atomized Powder and Laser Powder Bed Fusion Additively Manufactured Material. Fusion Sci. Technol. 2021, 77, 641–646. [Google Scholar] [CrossRef]
- ASTM E407-07; Standard Practice for Microetching Metals and Alloys. ASTM: West Conshohocken, PA, USA, 2015.
- Glaubitz, E.B.; Fox, J.C.; Kafka, O.L.; Gockel, J. Contour parameters, melt pool behavior, and surface roughness relationships across laser powder bed fusion platforms and metallic alloys. Int. J. Adv. Manuf. Technol. 2025, 136, 4419–4437. [Google Scholar] [CrossRef]
- Minneci, R.P.; Haines, M.P.; Gradl, P.R.; Ellis, D.L.; Lass, E.A.; Bunn, J.R.; Choo, H.; Jones, Z.C.; Babu, S.S.; Rawn, C.J. Characterization and Rationalization of Microstructural Evolution in GRCop-84 Processed by Laser-Powder Bed Fusion (L-PBF). Metall. Mater. Trans. A 2024, 55, 1377–1396. [Google Scholar] [CrossRef]
- Hall–Petch Strengthening. Available online: https://en.wikipedia.org/wiki/Grain_boundary_strengthening (accessed on 24 May 2025).
- Shigley, J.; Budynas, R.; Keith, J. Mechanical Engineering Design; McGraw-Hill: New York, NY, USA, 2014. [Google Scholar]
- Copper, C10200, Soft (Oxygen-Free h.c. Copper). Data Compiled by the Granta Design Team at ANSYS, Incorporating Various Sources Including JAHM and MagWeb. Available online: https://www.ansys.com/en-in/products/materials/granta-collaborations (accessed on 24 May 2025).
- Hanzelka, P.; Musilova, V.; Kralik, T.; Vonka, J. Thermal conductivity of a CuCrZr alloy from 5K to room temperatures. Cryogenics 2010, 50, 737–742. [Google Scholar] [CrossRef]
- Copper Development Association Inc. Mechanical Properties of Copper and Copper Alloys at Low Temperatures. Copper 122: Phosphorus Deoxidized, High Residual-Phosphorus (Annealed). Available online: https://www.copper.org/resources/properties/144_8/ (accessed on 24 May 2025).


| Characteristic | |
|---|---|
| Model | PRIMA Print Sharp 150 |
| Building volume | Ø 150 mm × 160 mm |
| Laser source | 1 × 300 W IR fibre laser |
| Laser spot (d) | 35–100 µm |
| Layer thickness | 20–120 µm |
| Building platform heating | Up to 300 °C |
| Chemical Composition | Physical Properties | ||||
|---|---|---|---|---|---|
| Element | Min [wt.%] | Max [wt.%] | Grain size | Flow | App. Density |
| Al | 0.00 | 0.01 | d10 = 13 µm d50 = 27 µm d90 = 53 µm | 18 s/50 g | 4.67 g/cm3 |
| Cr | 3.10 | 3.40 | |||
| Cu | Balance | ||||
| Fe | 0.00 | 0.01 | |||
| Nb | 2.70 | 3.00 | |||
| Si | 0.00 | 0.01 | |||
| O | 0.00 | 0.05 | |||
| # | P (W) | L (µm) | S (mm/s) | H (µm) | VED (J/mm3) | Laser Pattern | ρm ± 2σ (g/cm3) |
|---|---|---|---|---|---|---|---|
| 1 | 270 | 60 | 730 | 80 | 77.1 | Meander with a rotation of 67° between each layer | 8.66 ± 0.05 |
| 2 | 730 | 90 | 68.5 | 8.72 ± 0.03 | |||
| 3 * | 730 | 100 | 61.6 | 8.74 ± 0.03 | |||
| 4 | 750 | 80 | 75.0 | 8.69 ± 0.02 | |||
| 5 | 750 | 90 | 66.7 | 8.70 ± 0.02 | |||
| 6 | 750 | 100 | 60.0 | 8.70 ± 0.03 | |||
| 7 | 770 | 80 | 73.1 | 8.63 ± 0.04 | |||
| 8 | 770 | 90 | 64.9 | 8.64 ± 0.05 | |||
| 9 | 770 | 100 | 58.4 | 8.64 ± 0.03 |
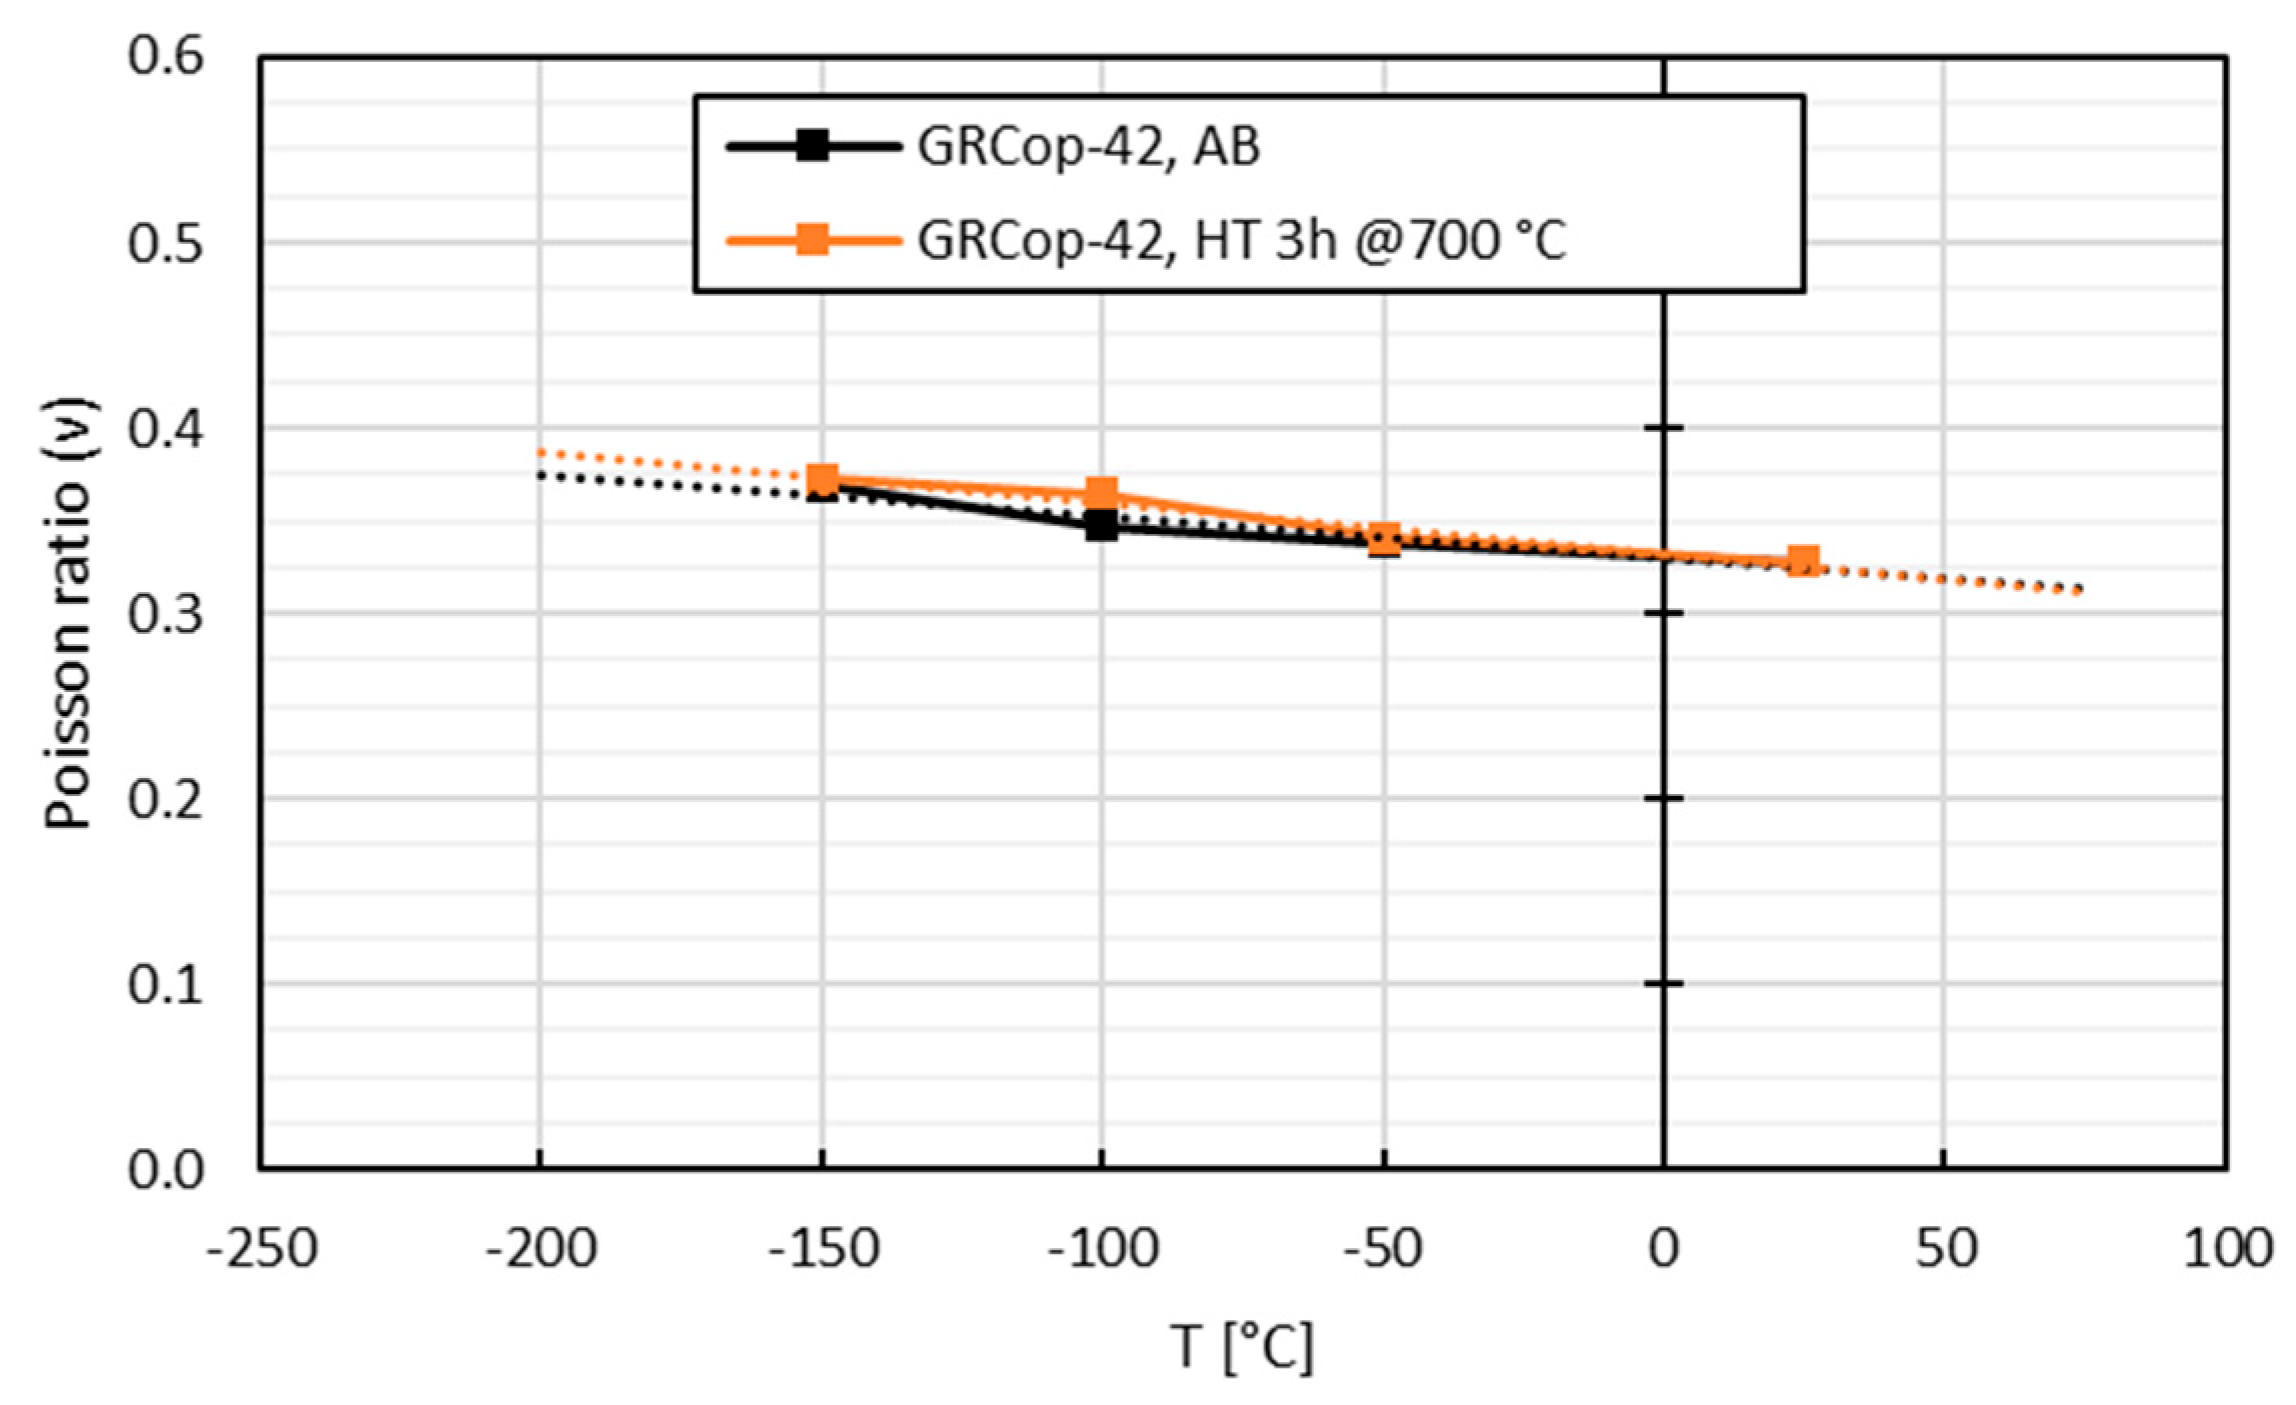
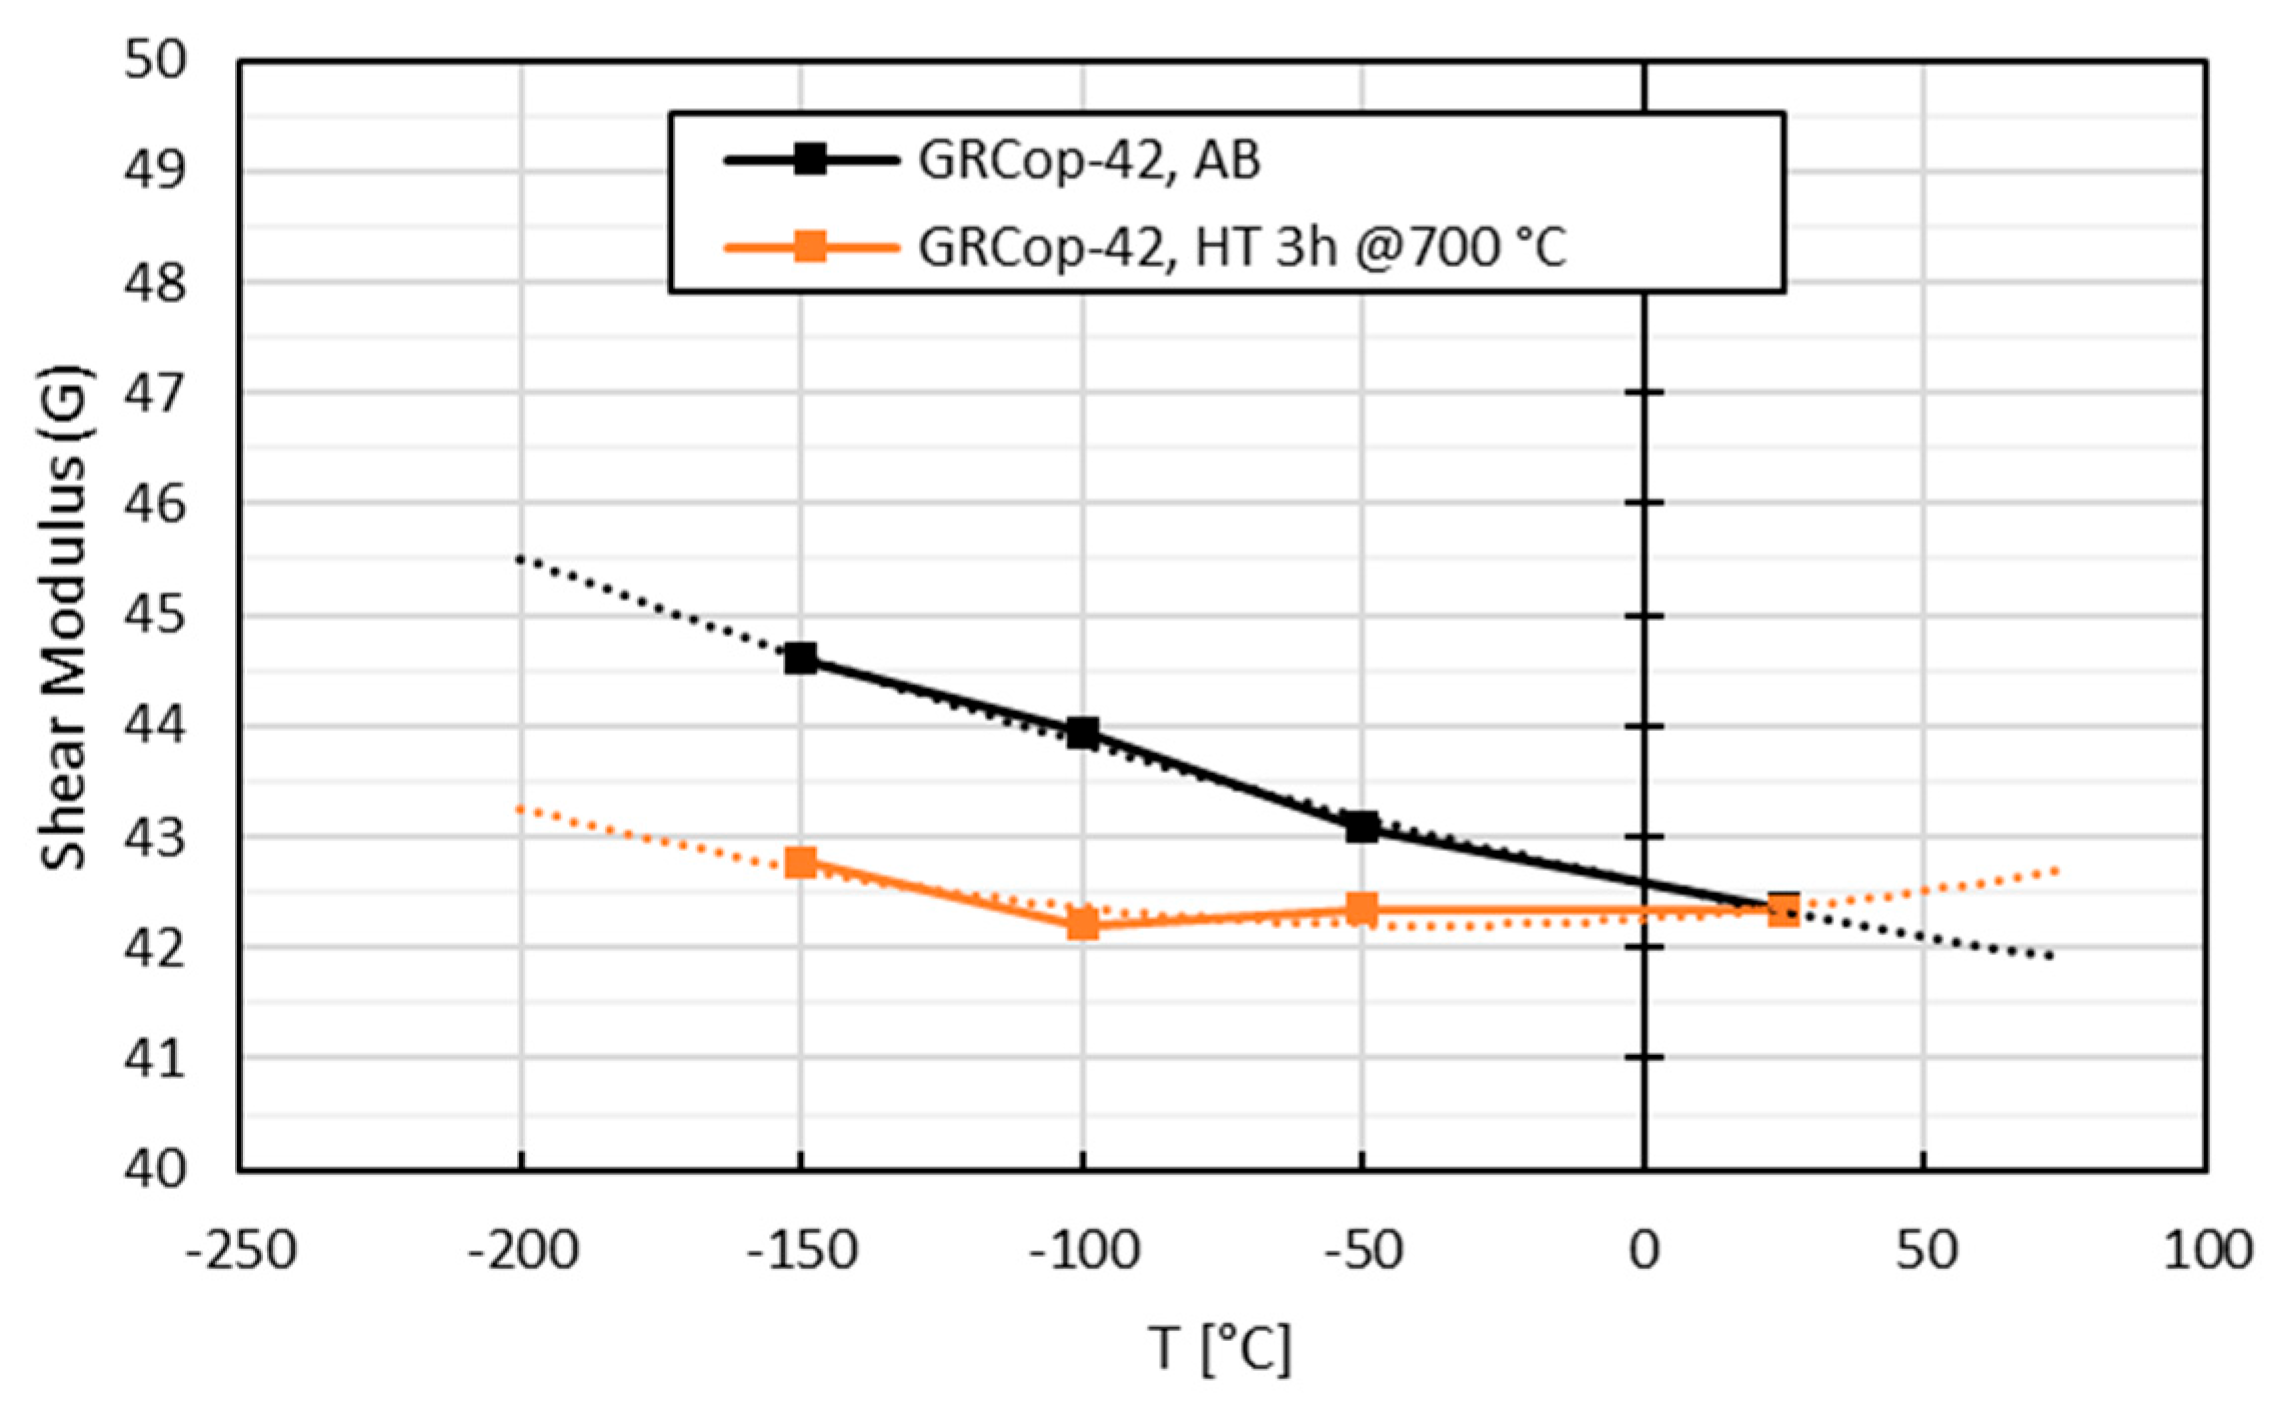
| Condition | T (°C/K) | (GPa) | G (GPa) | |
|---|---|---|---|---|
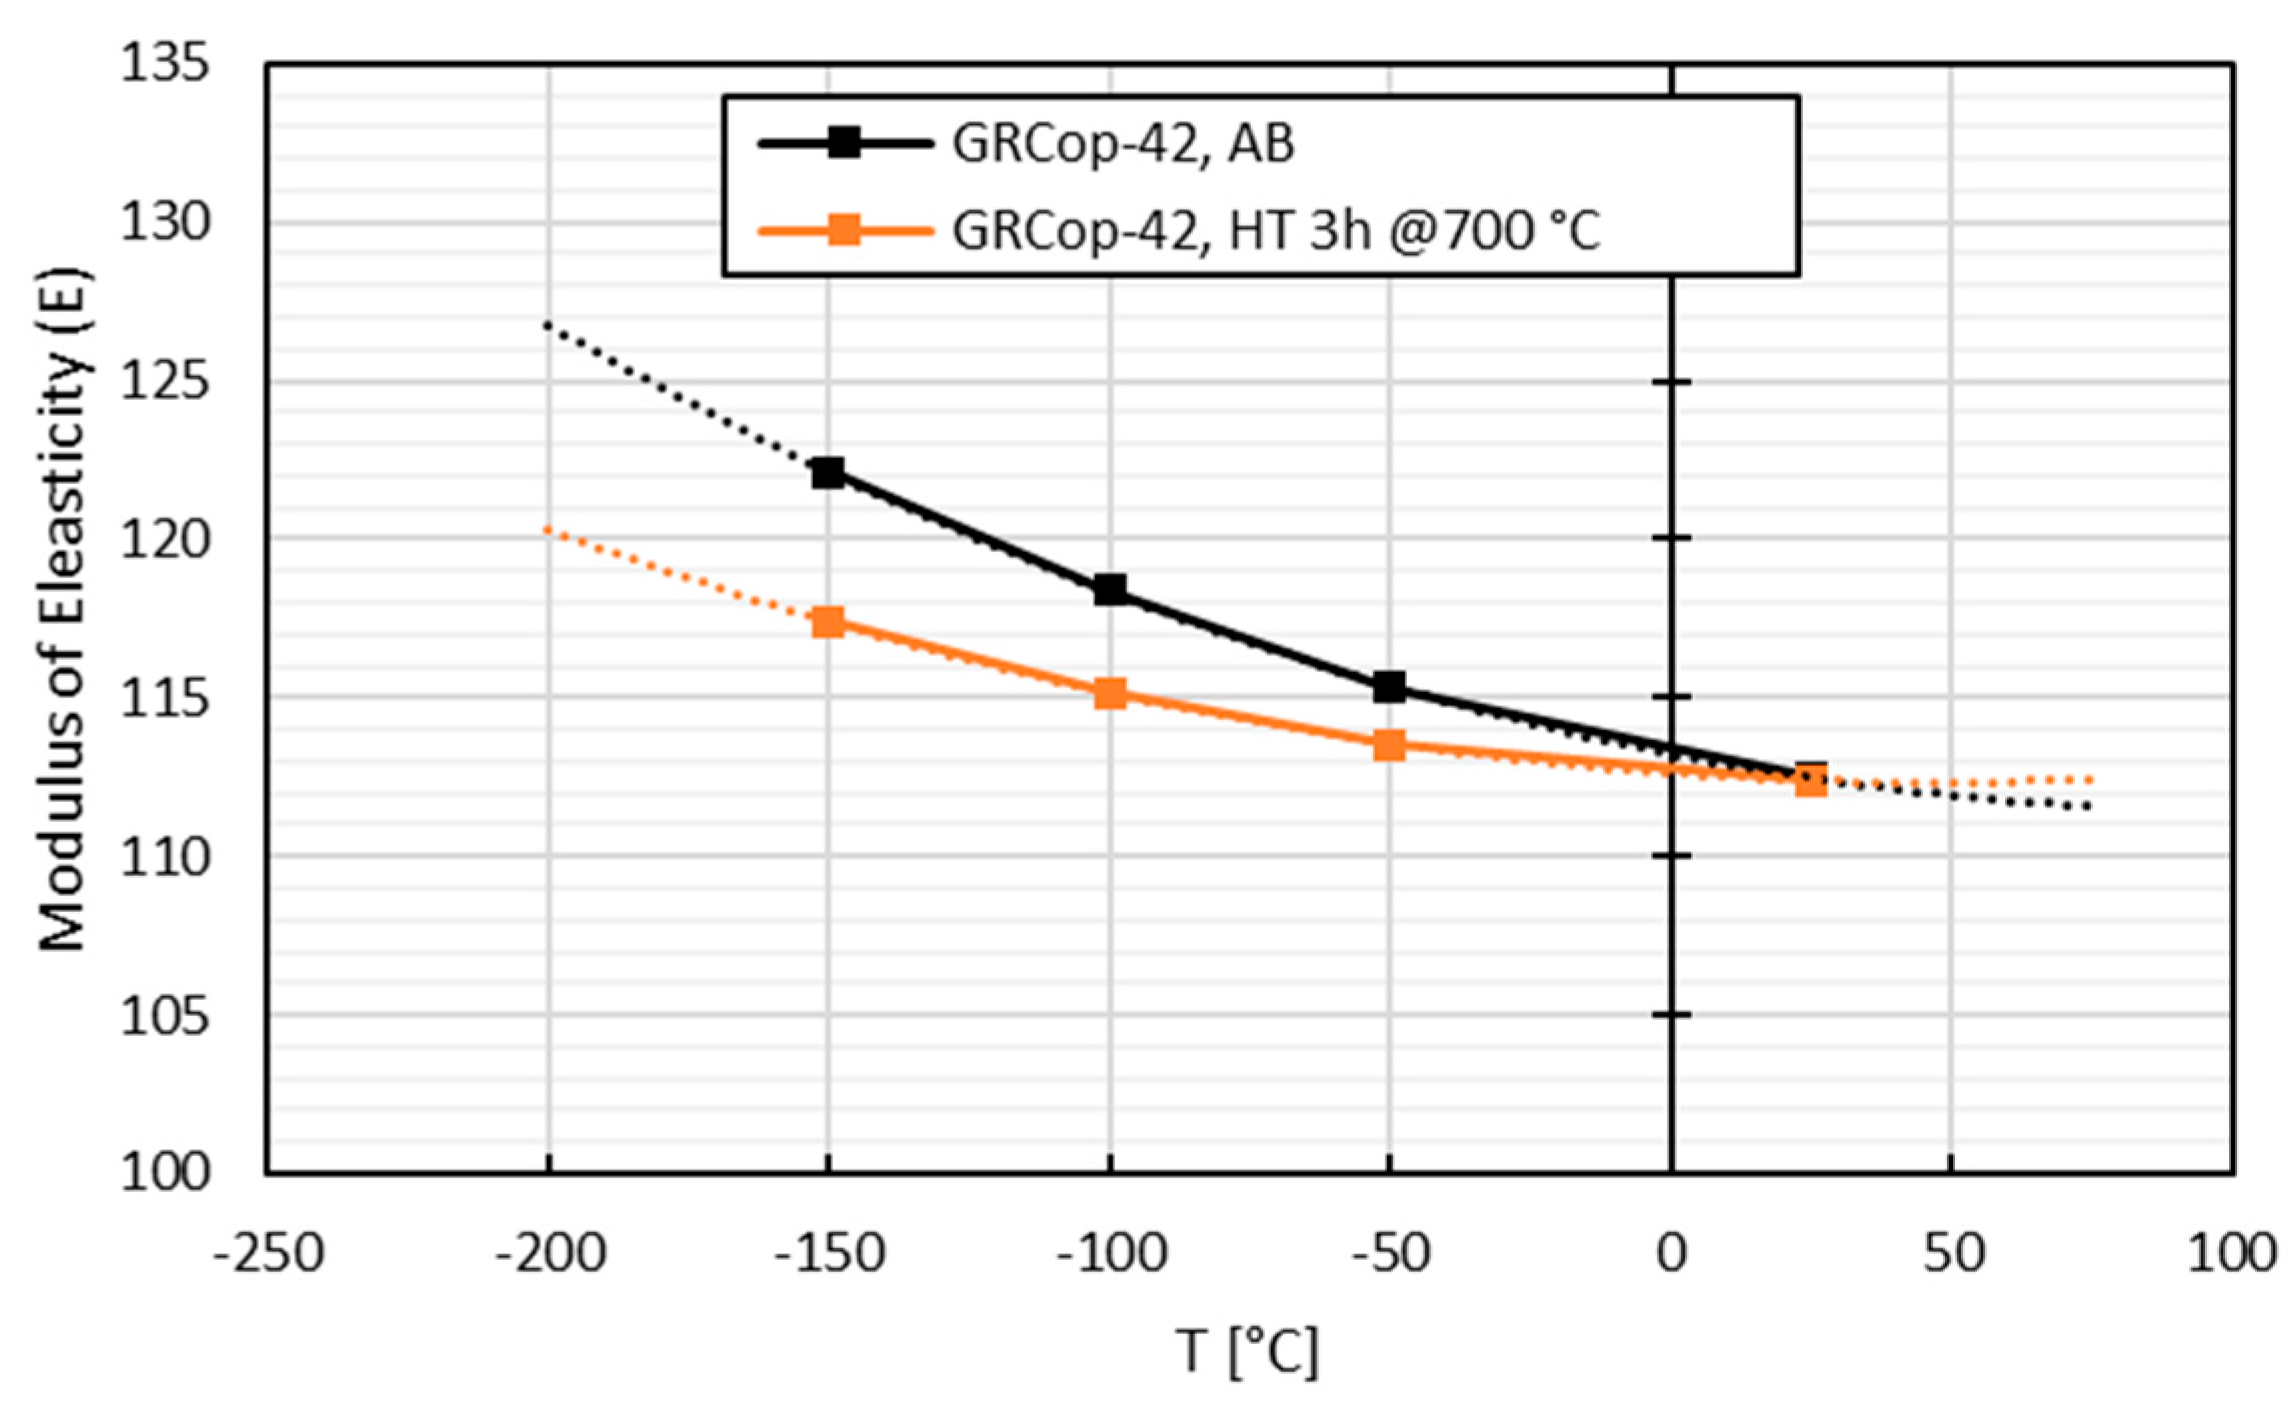
| AB | −150/123.15 | 122.1 ± 0.5 | 0.369 ± 0.003 | 44.6 |
| −100/173.15 | 118.4 ± 0.2 | 0.347 ± 0.005 | 44.3 | |
| −50/223.15 | 115.3 ± 0.4 | 0.338 ± 0.002 | 43.5 | |
| +25/298.15 | 112.5 ± 0.2 | 0.328 ± 0.004 | 42.4 | |
| HT | −150/123.15 | 117.4 ± 0.2 | 0.373 ± 0.002 | 42.8 |
| −100/173.15 | 115.2 ± 0.1 | 0.365 ± 0.002 | 42.2 | |
| −50/223.15 | 113.5 ± 0.3 | 0.341 ± 0.006 | 42.3 | |
| +25/298.15 | 112.4 ± 0.6 | 0.328 ± 0.001 | 42.3 |
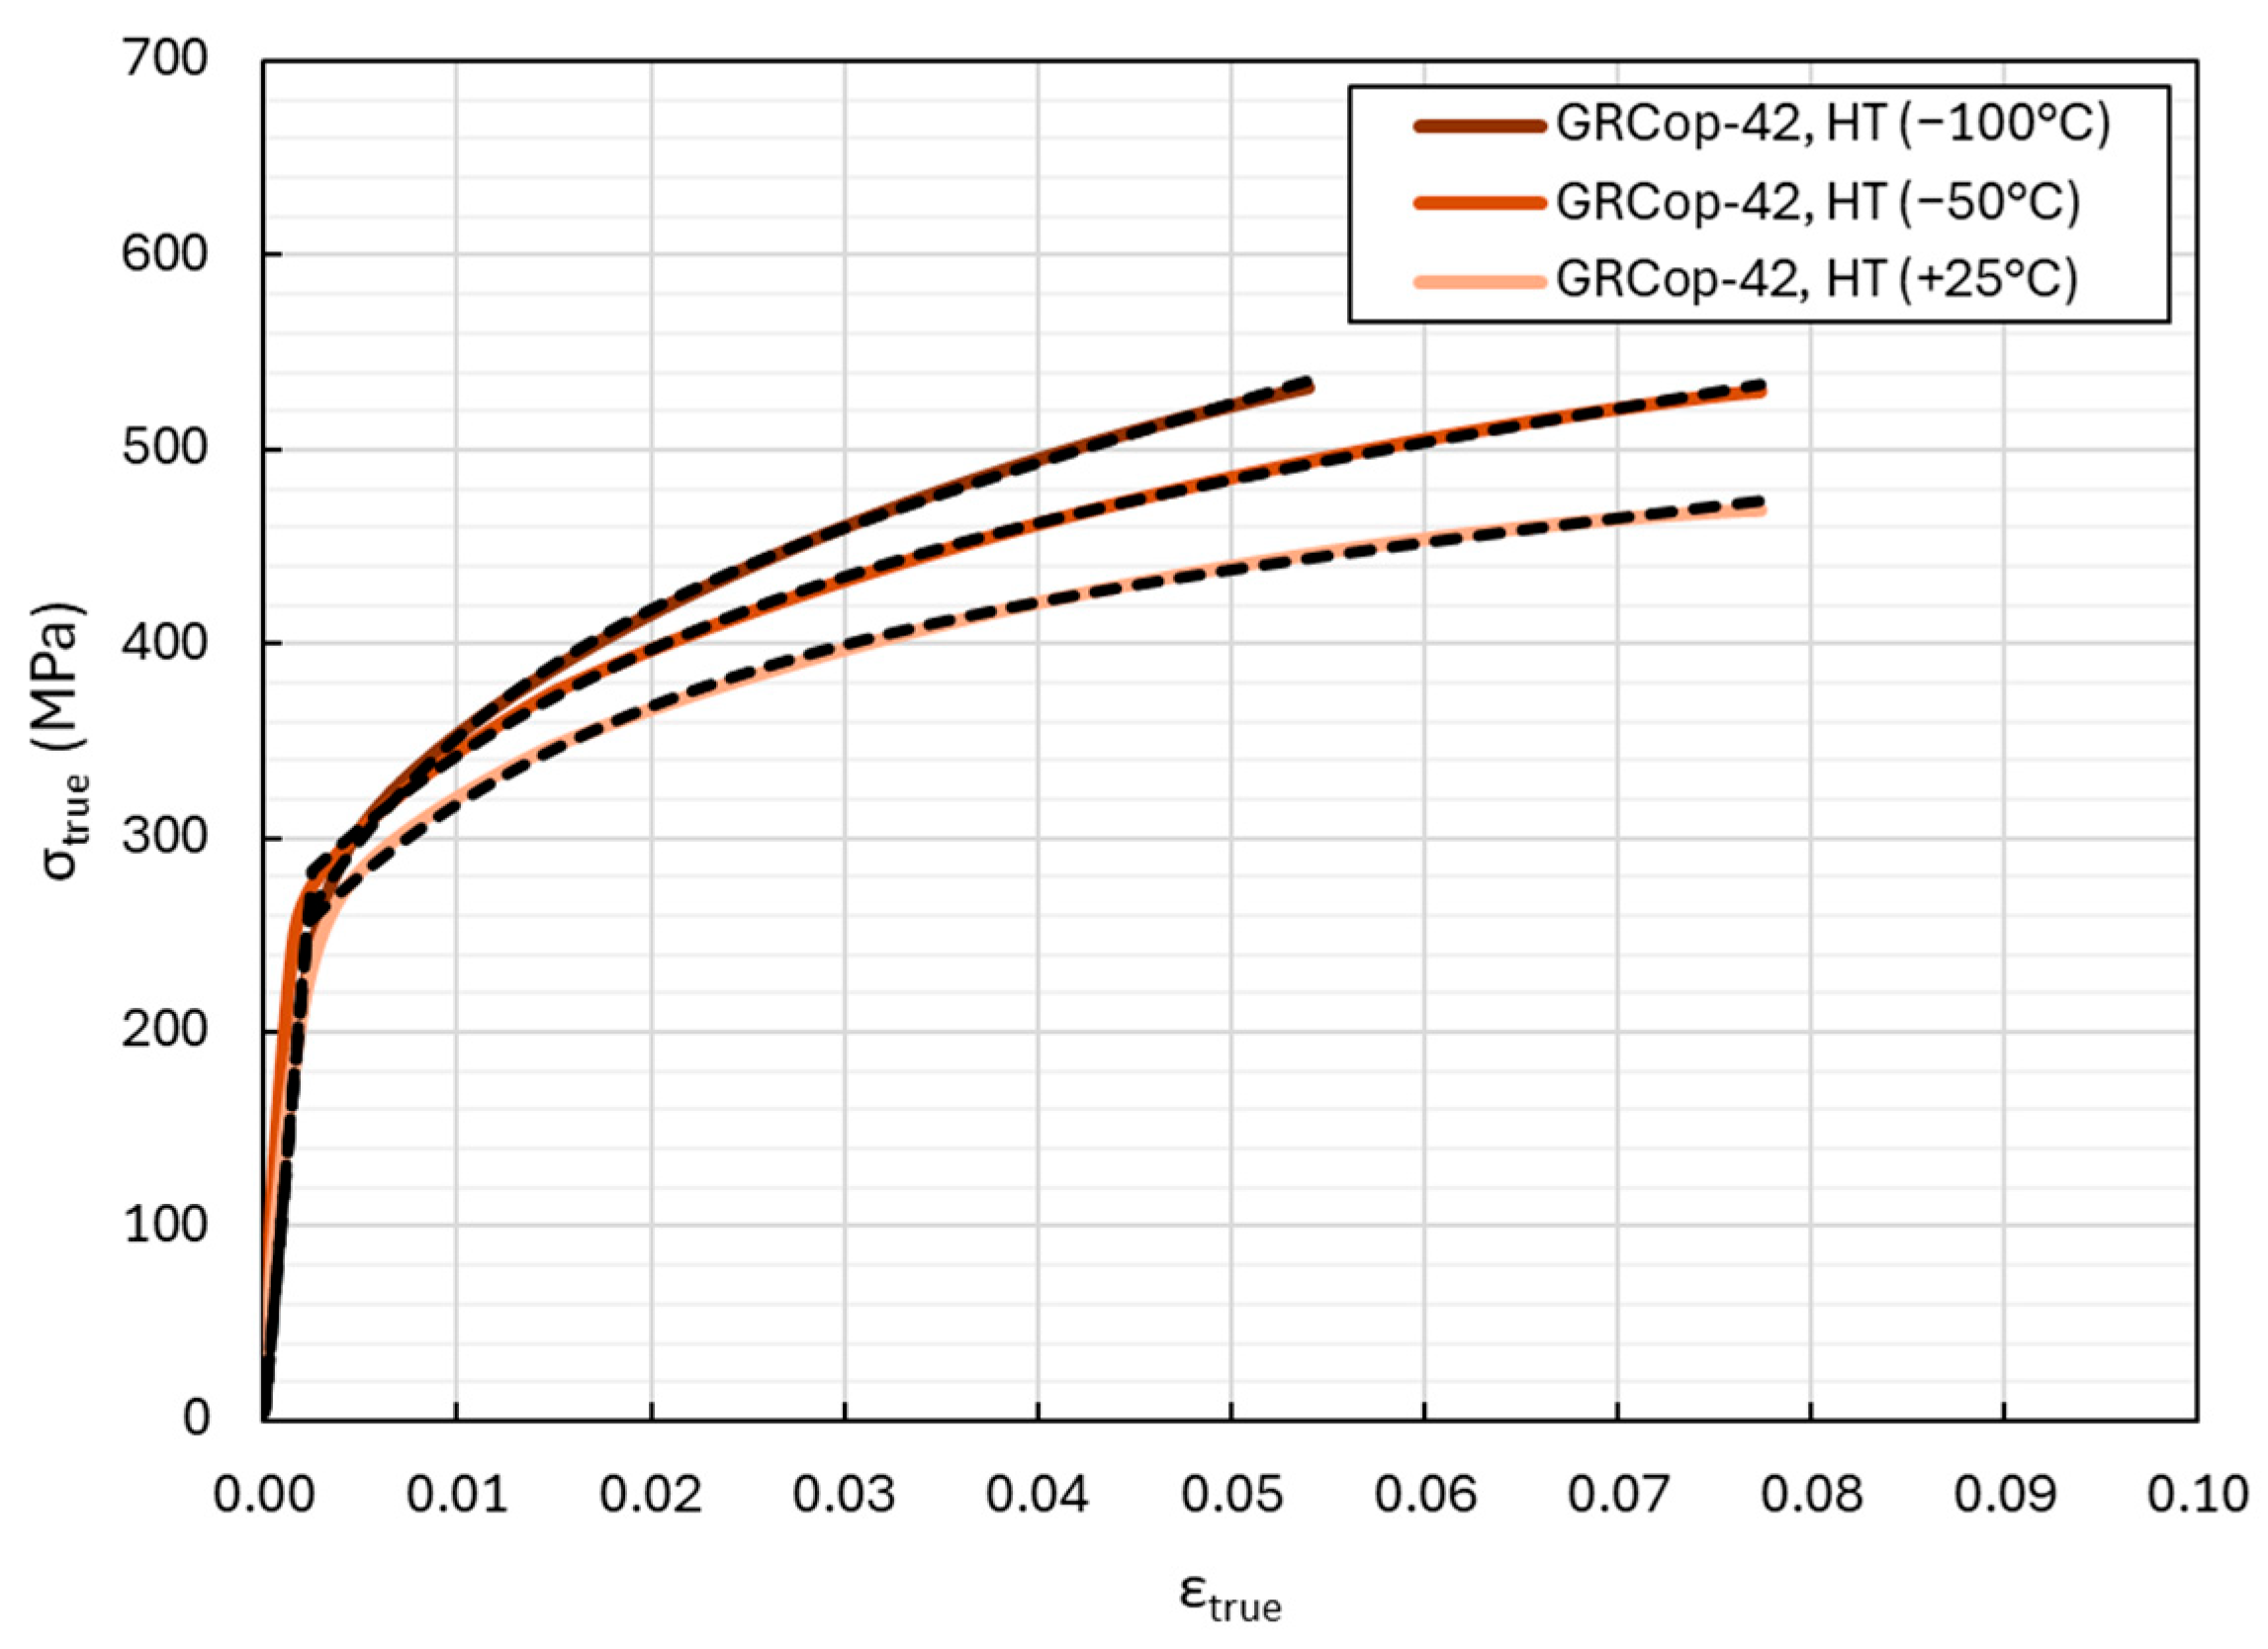
| Condition | T (°C/K) | (MPa) | (MPa) | (%) |
|---|---|---|---|---|
| AB | −100/173.15 | 308.6 ± 2.9 | 513.0 ± 1.20 | 4.8 ± 0.7 |
| −50/223.15 | 303.0 ± 5.5 | 491.5 ± 19.6 | 7.9 ± 0.6 | |
| +25/298.15 | 284.1 ± 2.3 | 429.9 ± 44.3 | 7.4 ± 6.3 | |
| HT | −100/173.15 | 307.8 ± 2.1 | 514.8 ± 28.5 | 6.9 ± 3.2 |
| −50/223.15 | 296.9 ± 4.8 | 493.6 ± 12.5 | 7.2 ± 1.1 | |
| +25/298.15 | 283.5 ± 2.5 | 435.5 ± 3.07 | 8.2 ± 0.3 |
| Condition | T [°C/K] | c1 | c2 | c3 | c4 | c5 | e [MPa] |
|---|---|---|---|---|---|---|---|
| HT | −100/173.15 | 222.5 | 161.5 | 99.5 | 2743.8 | 5.4 | 5.4 |
| −50/223.15 | 259.3 | 161.3 | 56.0 | 1428.9 | 11.2 | 11.2 | |
| +25/298.15 | 233.8 | 157.7 | 62.8 | 1034.9 | 5.1 | 5.1 |
| Condition | T (°C/K) | λ (W/m K) |
|---|---|---|
| AB | −233.15/40 | 40.5 |
| −213.15/60 | 46.2 | |
| −193.15/80 | 55.4 | |
| −173.15/100 | 62.5 | |
| −153.15/120 | 66.0 | |
| −133.15/140 | 69.1 | |
| −113.15/160 | 72.6 | |
| −93.15/180 | 74.0 | |
| −73.15/200 | 79.6 | |
| HT | −233.15/40 | 252.4 |
| −213.15/60 | 266.0 | |
| −193.15/80 | 274.1 | |
| −173.15/100 | 275.0 | |
| −153.15/120 | 277.2 | |
| −133.15/140 | 279.5 | |
| −113.15/160 | 285.7 | |
| −93.15/180 | 286.1 | |
| −73.15/200 | 291.6 |
| Material | (MPa) | (MPa) | λ (W/mK) | |
|---|---|---|---|---|
| GRCop-42 HT | 307.8 ± 2.1 | 514.8 ± 28.5 | 6.9 ± 3.2 | 275 |
| C-12200 (Annealed) | ~50 | ~330 | ~60 | ~395 |
| C-15000 (Cold Draw + Aged) | ~450 | ~520 | ~24 | ~220 |
Disclaimer/Publisher’s Note: The statements, opinions and data contained in all publications are solely those of the individual author(s) and contributor(s) and not of MDPI and/or the editor(s). MDPI and/or the editor(s) disclaim responsibility for any injury to people or property resulting from any ideas, methods, instructions or products referred to in the content. |
© 2025 by the authors. Licensee MDPI, Basel, Switzerland. This article is an open access article distributed under the terms and conditions of the Creative Commons Attribution (CC BY) license (https://creativecommons.org/licenses/by/4.0/).
Share and Cite
Cortis, D.; Giancarli, C.; Ferella, F.; Di Donato, C.; Elleboro, R.; Razeto, A.; Nisi, S.; Orlandi, D. Experimental Evaluation of Thermo-Mechanical Properties of GRCop-42, Produced by PBF-LB, at Low Temperatures. Metals 2025, 15, 604. https://doi.org/10.3390/met15060604
Cortis D, Giancarli C, Ferella F, Di Donato C, Elleboro R, Razeto A, Nisi S, Orlandi D. Experimental Evaluation of Thermo-Mechanical Properties of GRCop-42, Produced by PBF-LB, at Low Temperatures. Metals. 2025; 15(6):604. https://doi.org/10.3390/met15060604
Chicago/Turabian StyleCortis, Daniele, Cristina Giancarli, Francesco Ferella, Chiara Di Donato, Riccardo Elleboro, Alessandro Razeto, Stefano Nisi, and Donato Orlandi. 2025. "Experimental Evaluation of Thermo-Mechanical Properties of GRCop-42, Produced by PBF-LB, at Low Temperatures" Metals 15, no. 6: 604. https://doi.org/10.3390/met15060604
APA StyleCortis, D., Giancarli, C., Ferella, F., Di Donato, C., Elleboro, R., Razeto, A., Nisi, S., & Orlandi, D. (2025). Experimental Evaluation of Thermo-Mechanical Properties of GRCop-42, Produced by PBF-LB, at Low Temperatures. Metals, 15(6), 604. https://doi.org/10.3390/met15060604