
Additively Manufactured Biomedical Ti-15Mo Alloy with Triply Periodical Minimal Surfaces and Functional Surface Modification


Abstract
1. Introduction
2. Materials and Methods
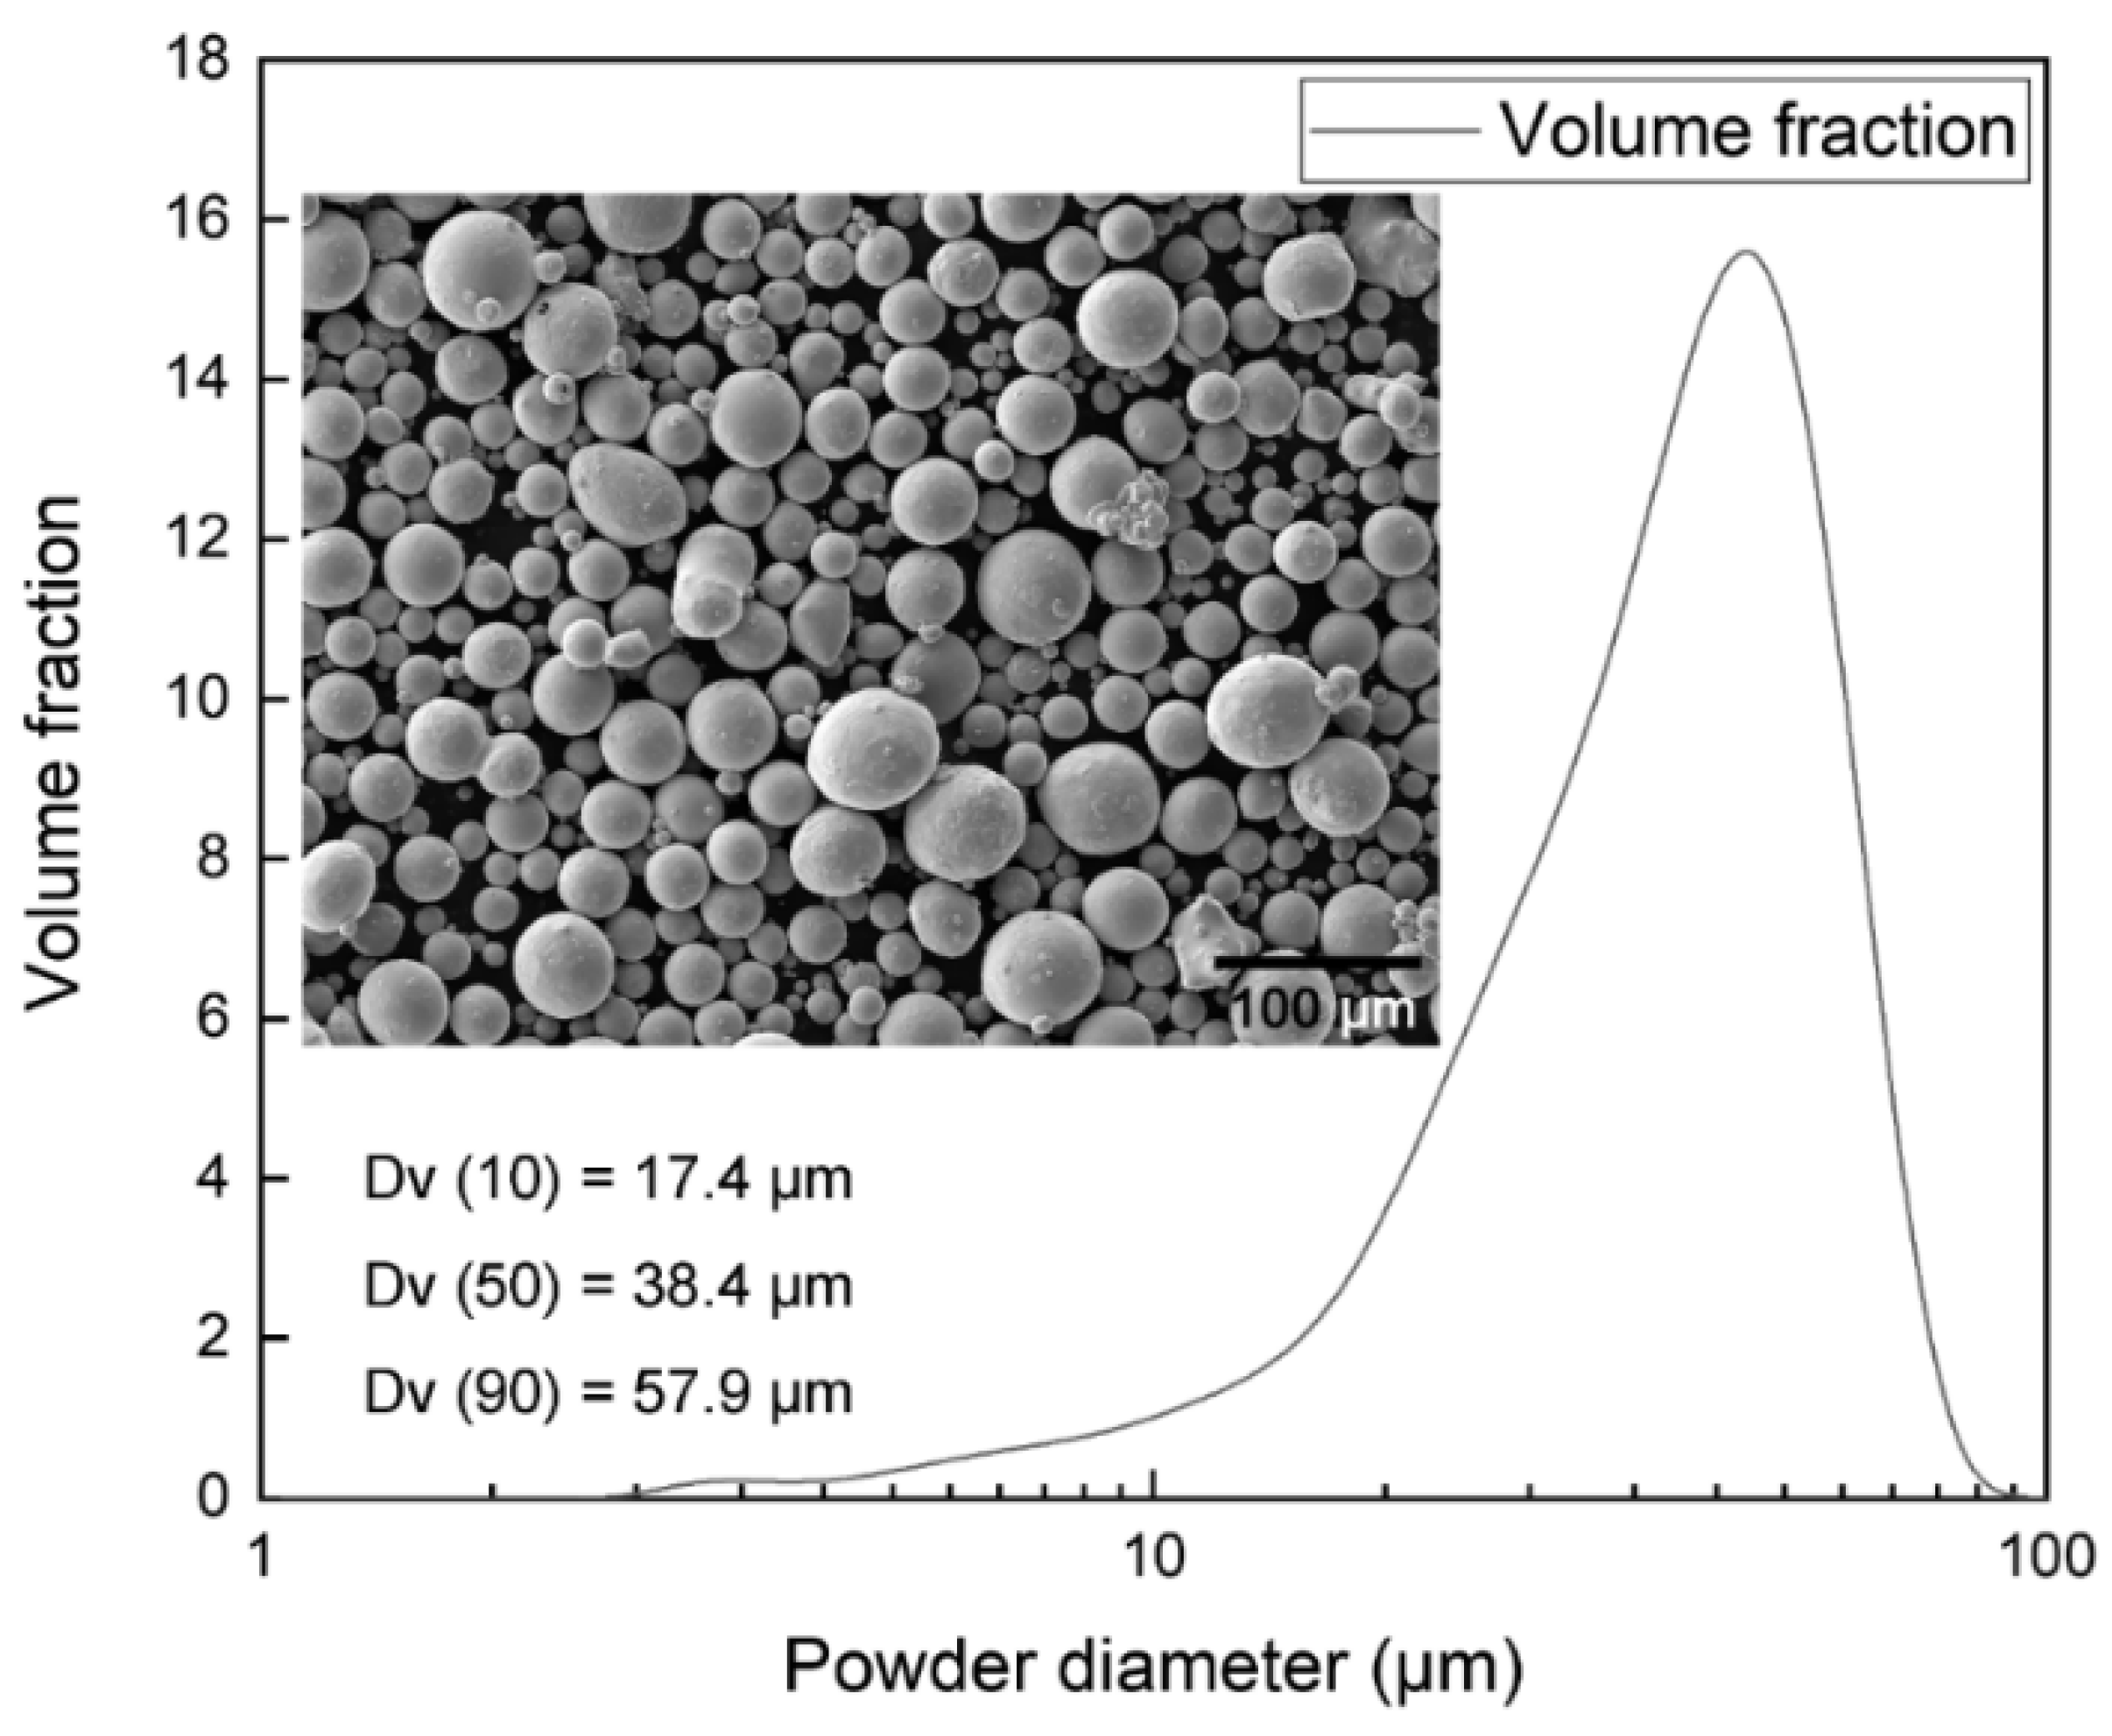
2.1. Raw Materials
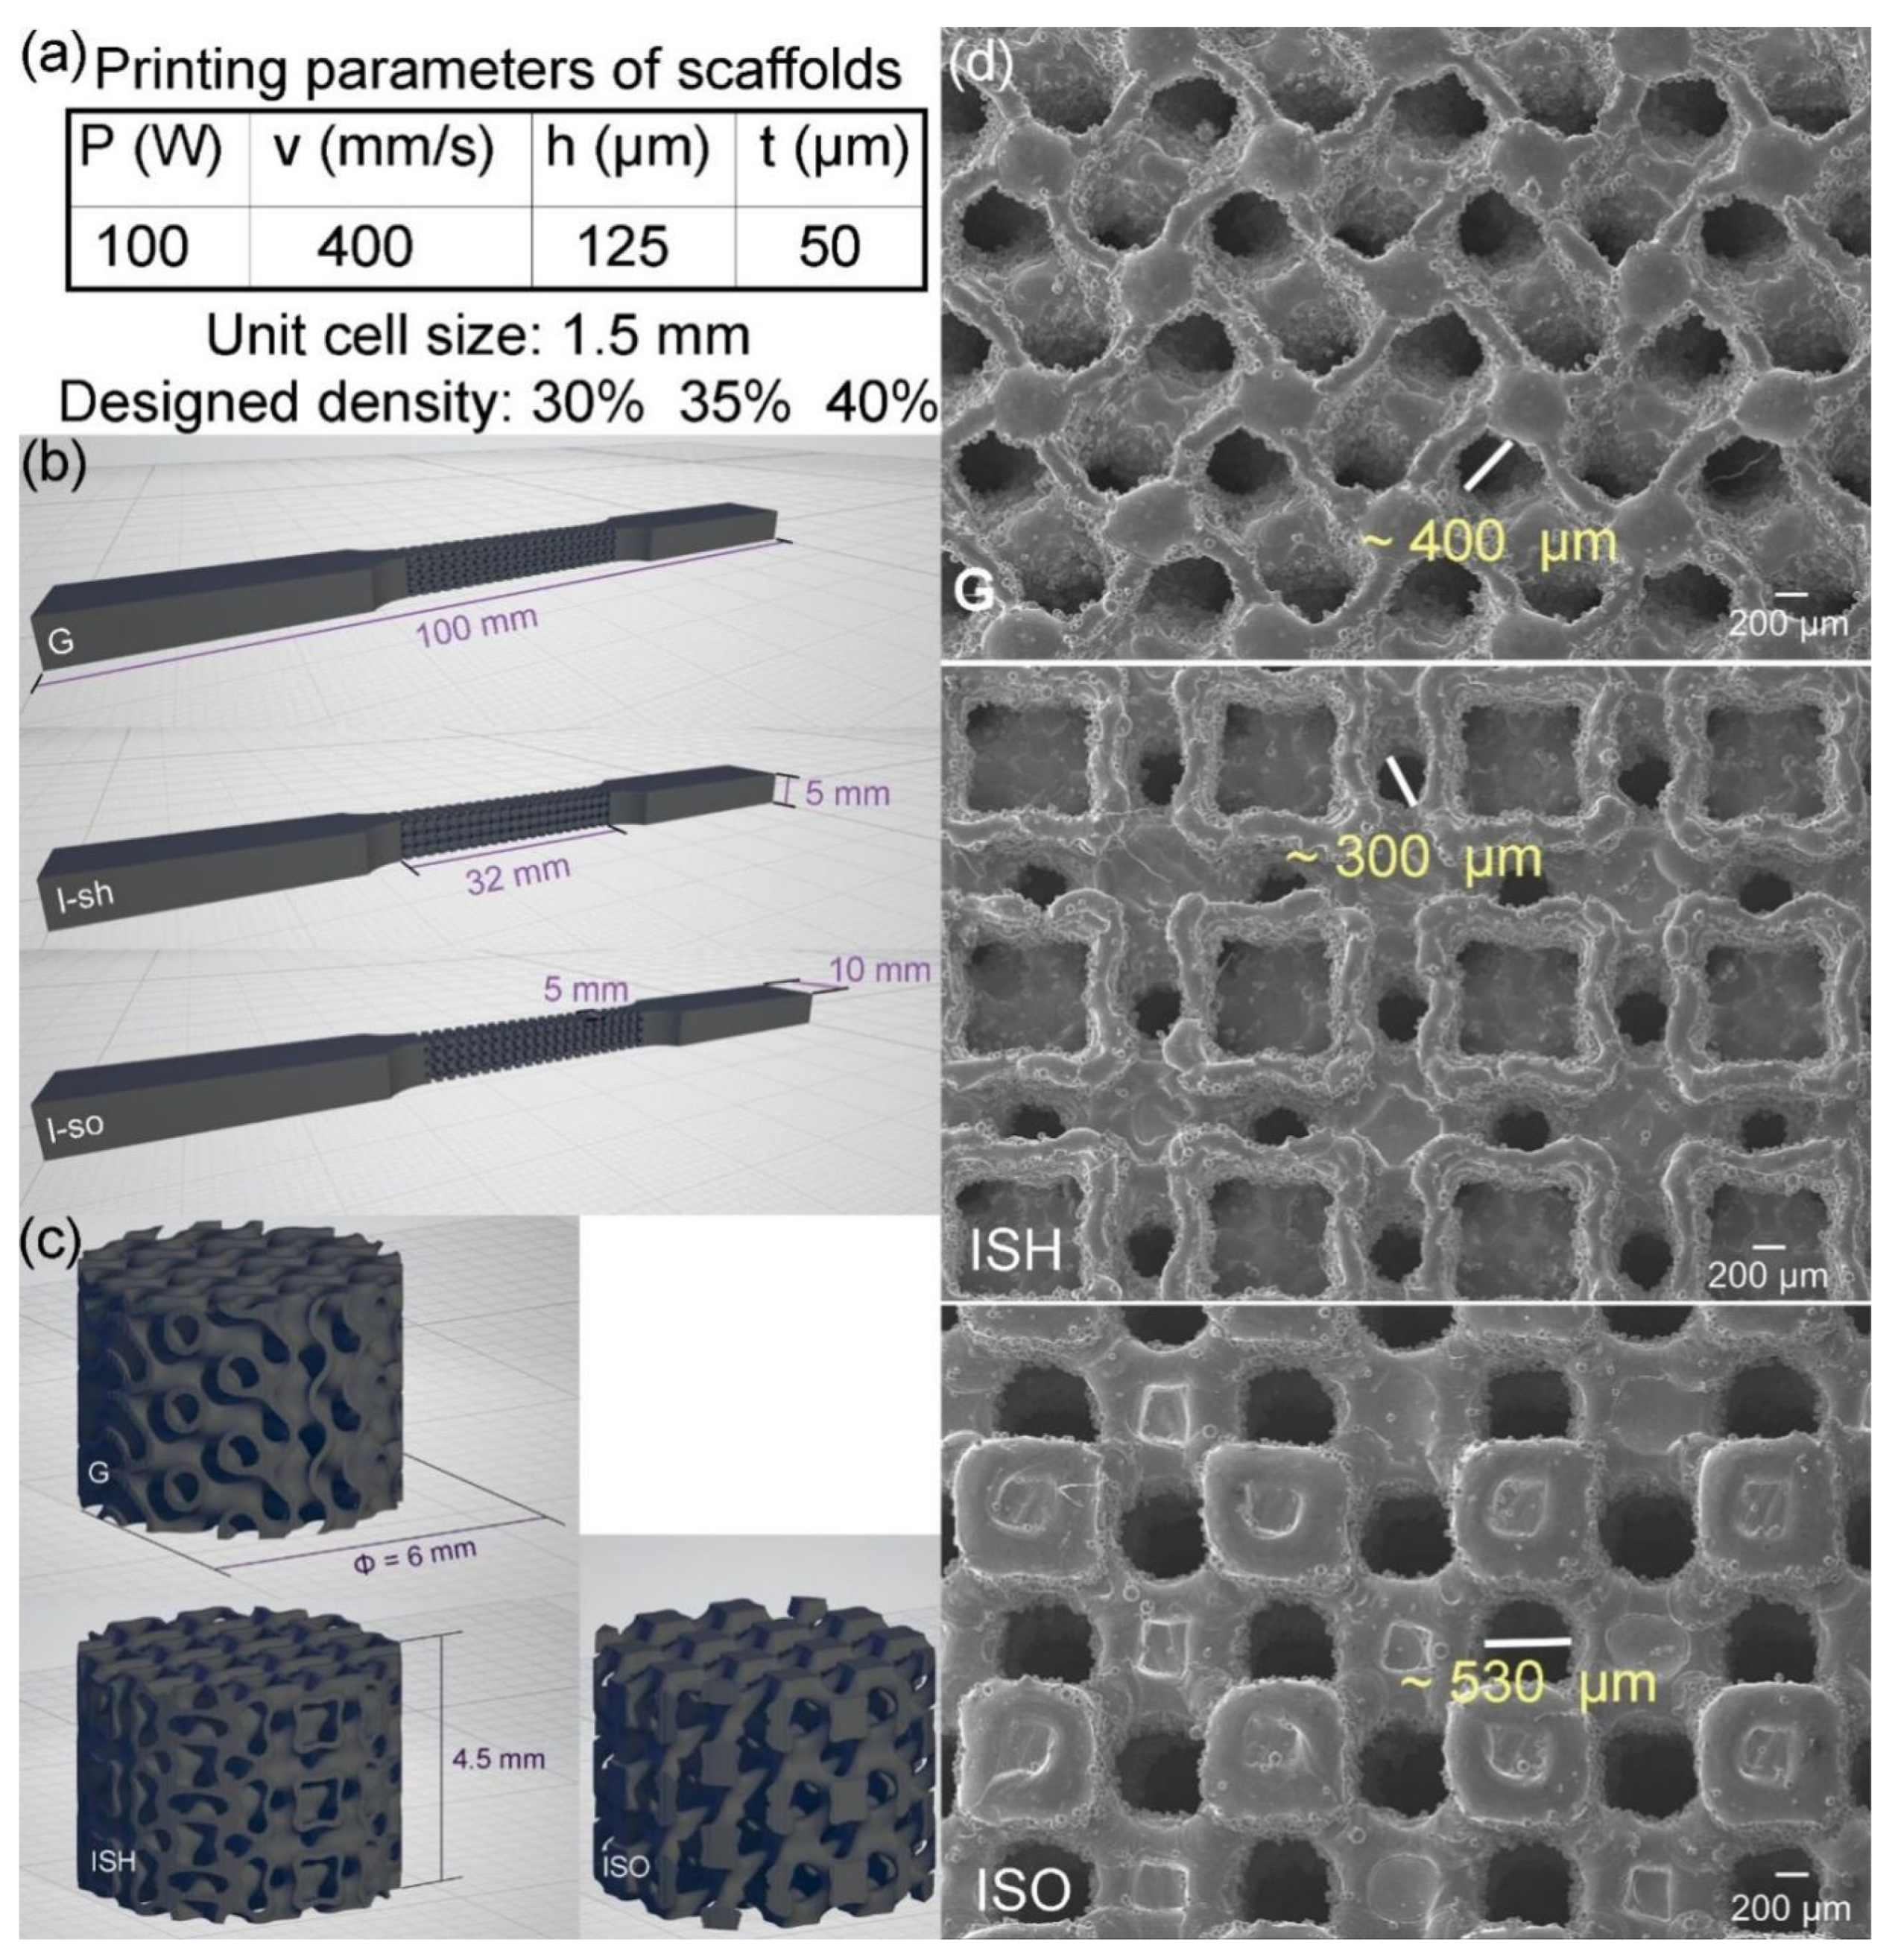
2.2. Lattices Design and Samples Design
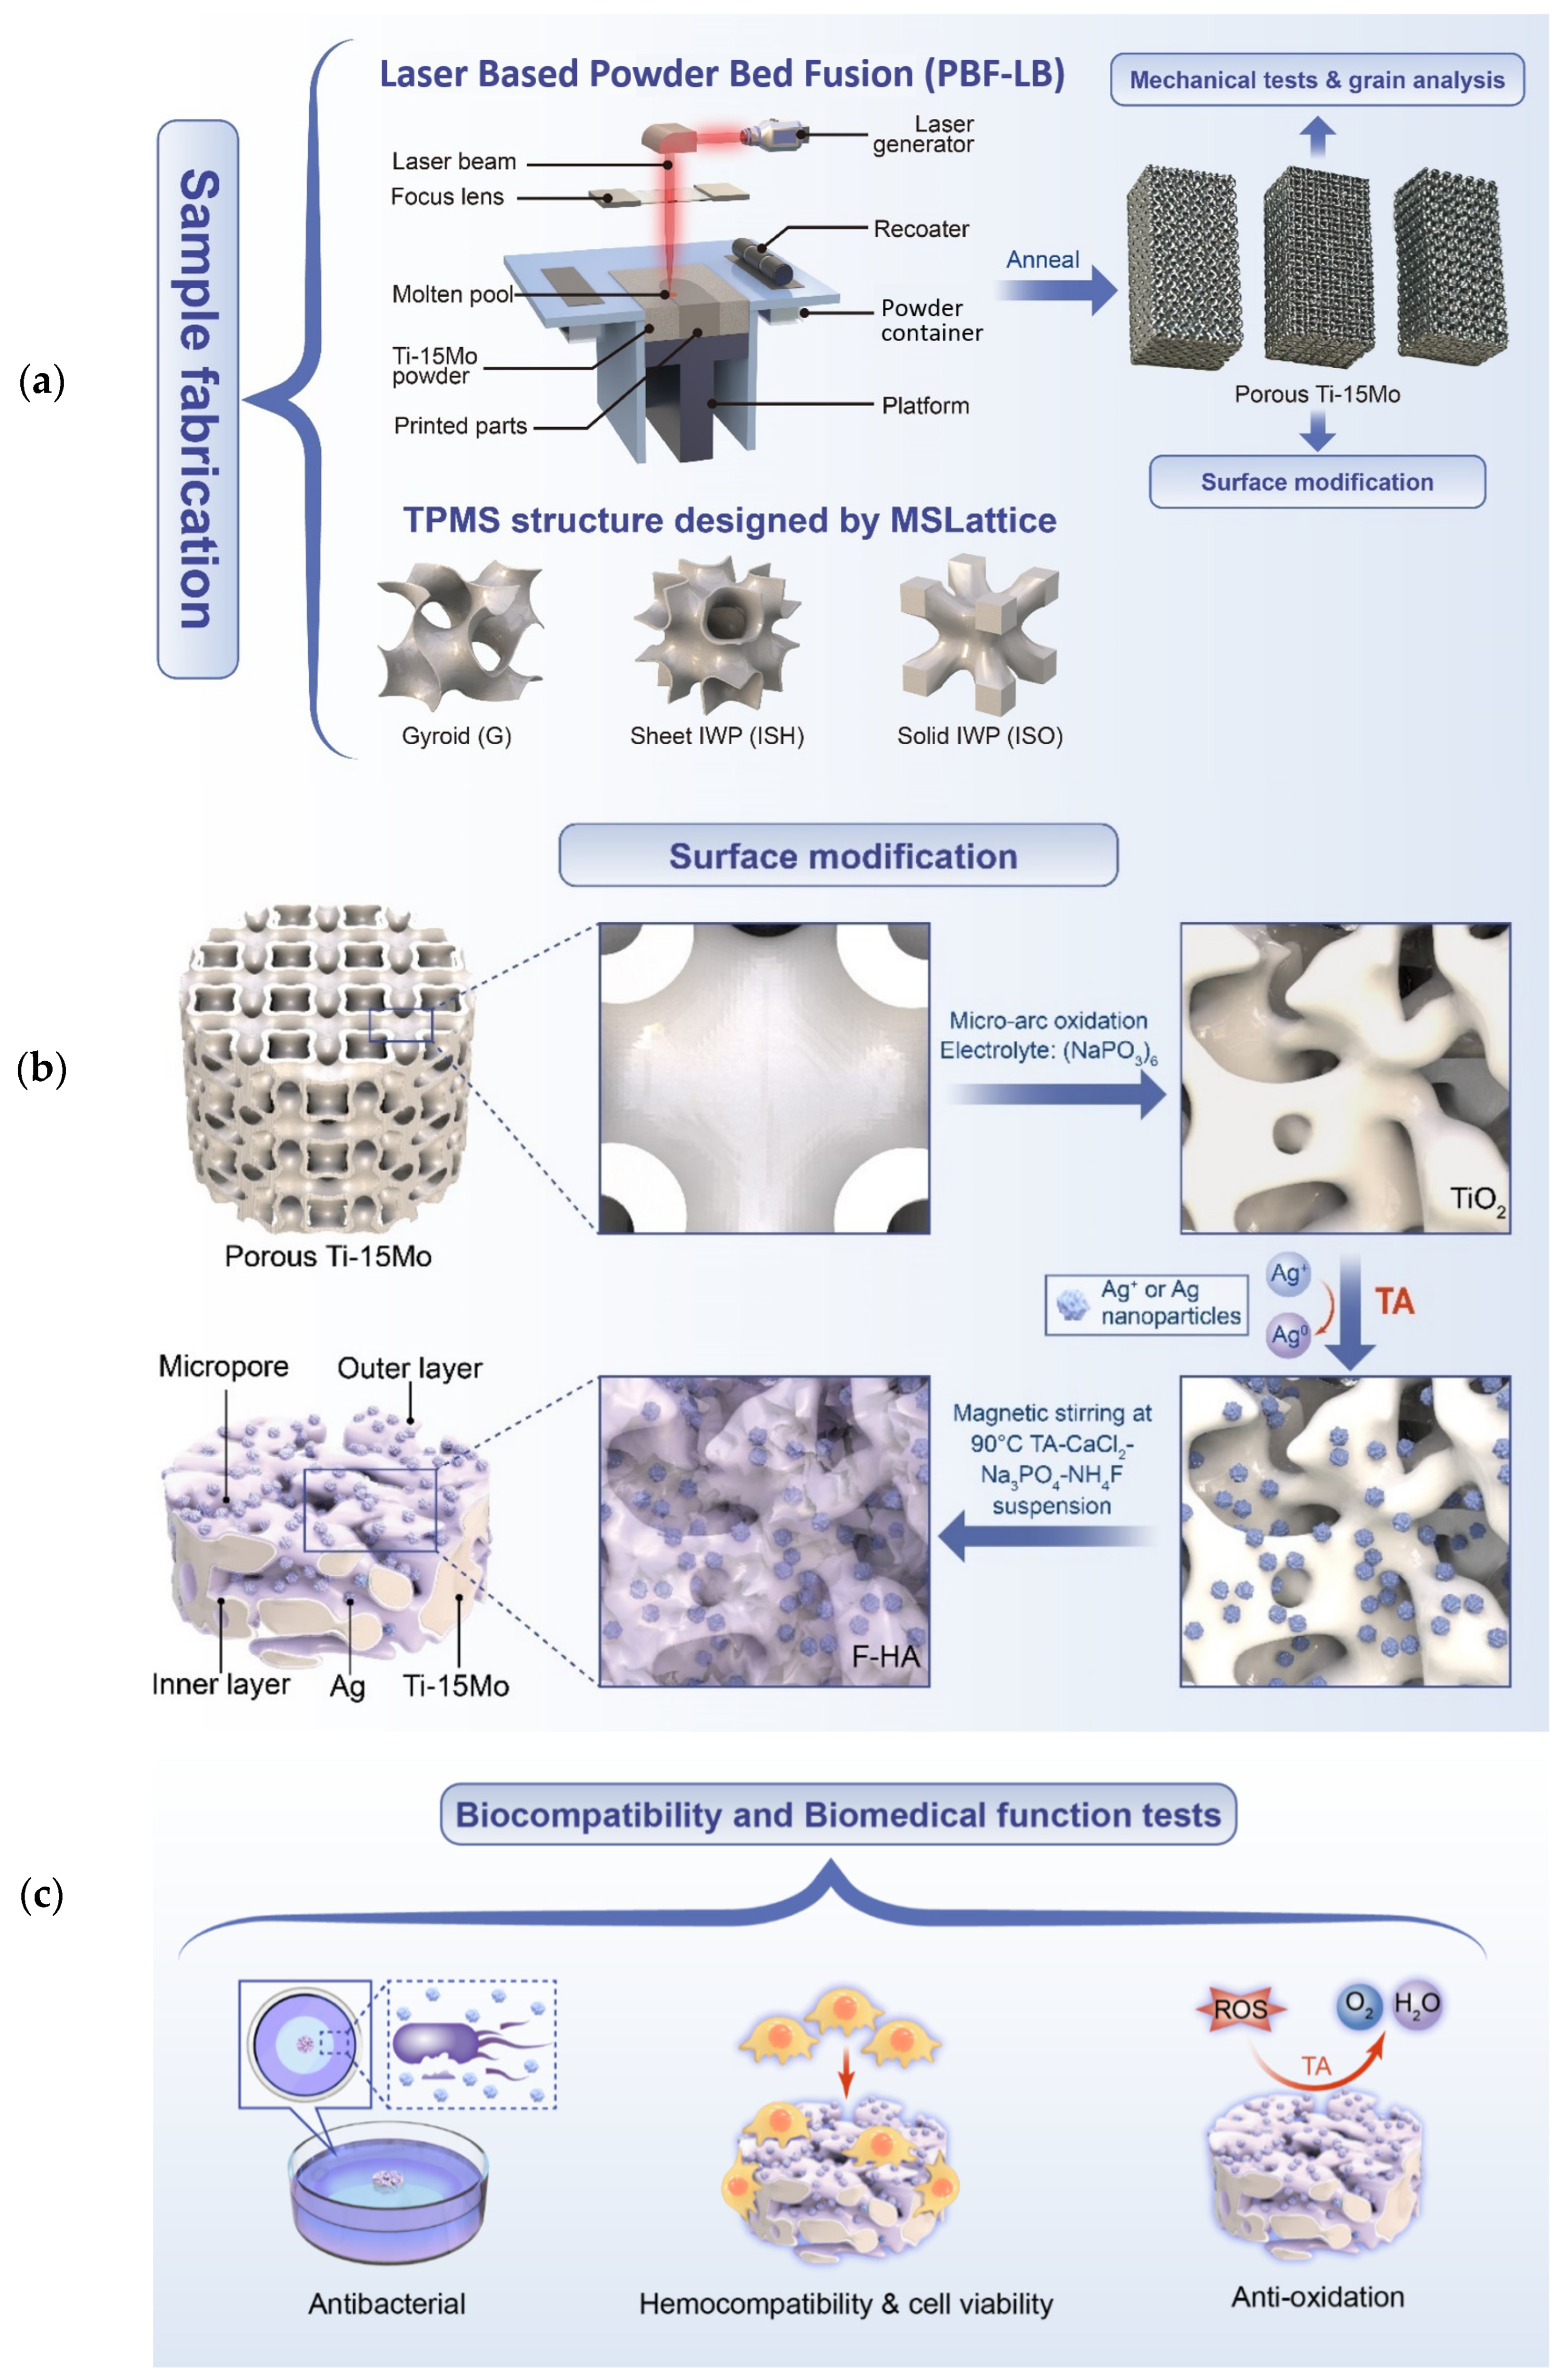
2.3. PBF-LB Processing and Process Optimization
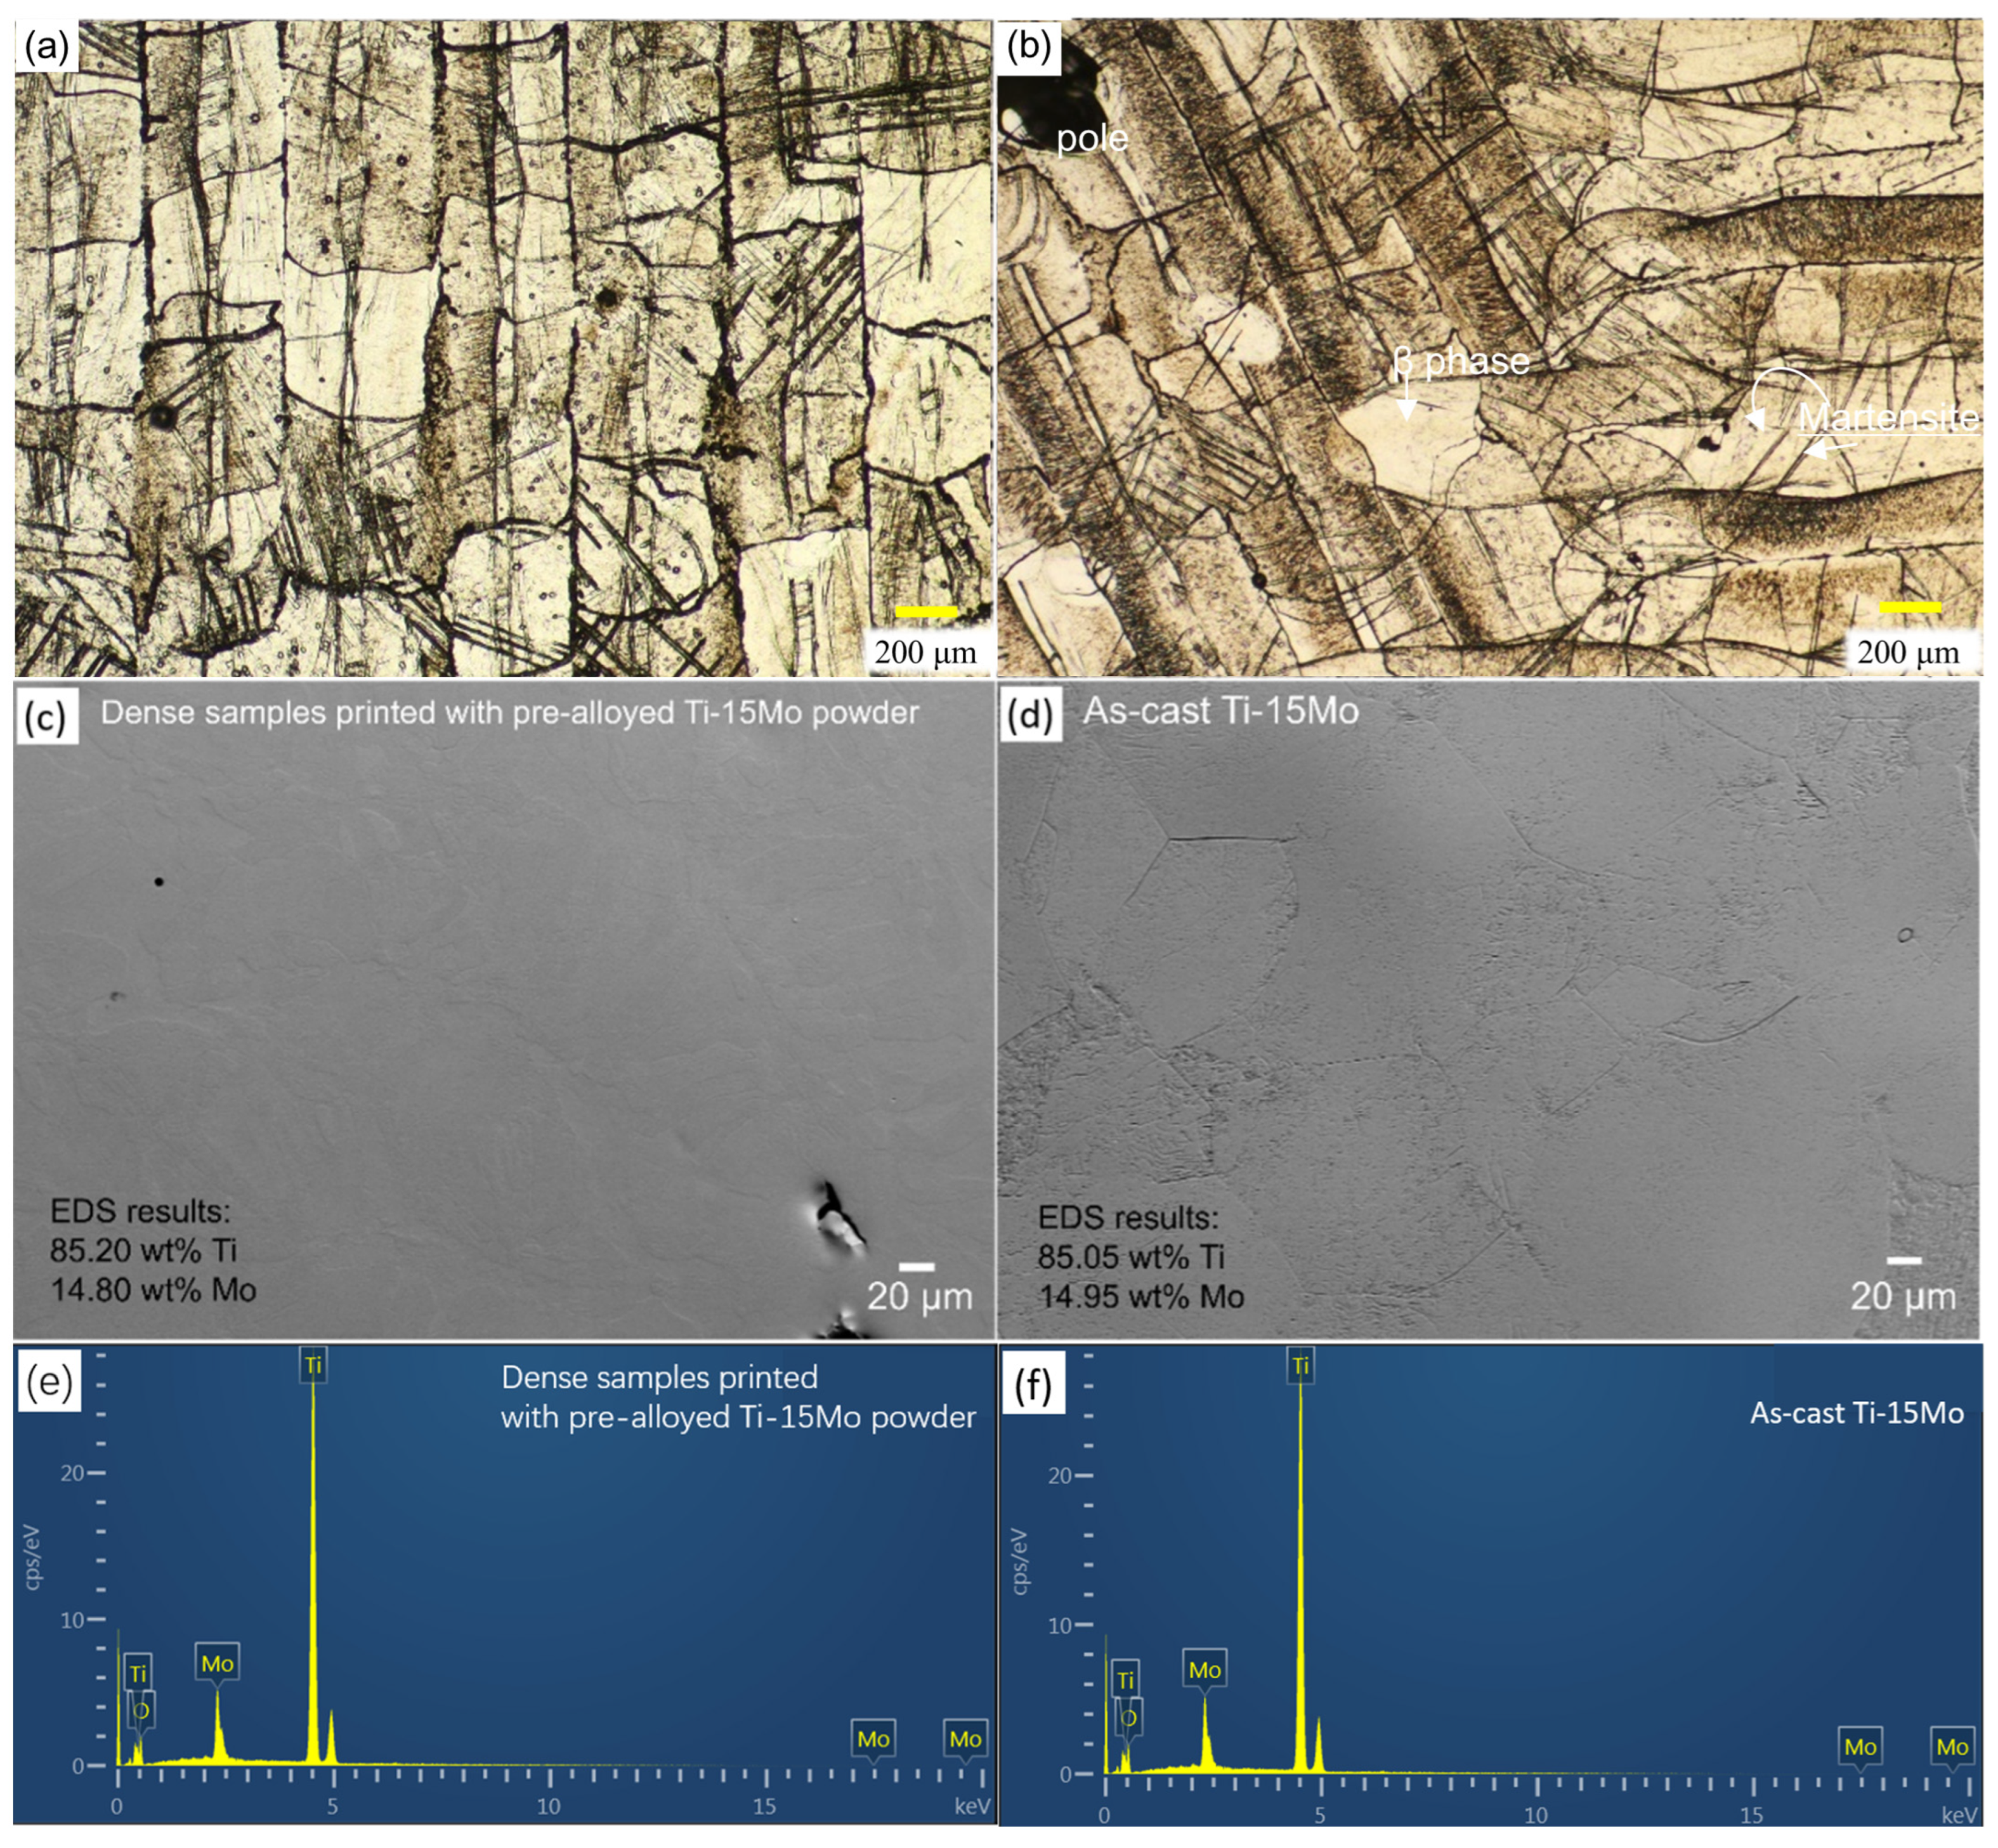
2.4. Microstructural Analysis
2.5. Mechanical Property Testing
2.6. Surface Modification and Characterization
2.6.1. Micro-Arc Oxidation (MAO) Process
2.6.2. Manufacturing of Multi-Biofunctional Coating
2.6.3. Surface Characterization
2.7. Bio-Property Test: In Vitro Test
2.7.1. Cytotoxicity Test and Ion Precipitation Analysis
2.7.2. Hemocompatibility Tests
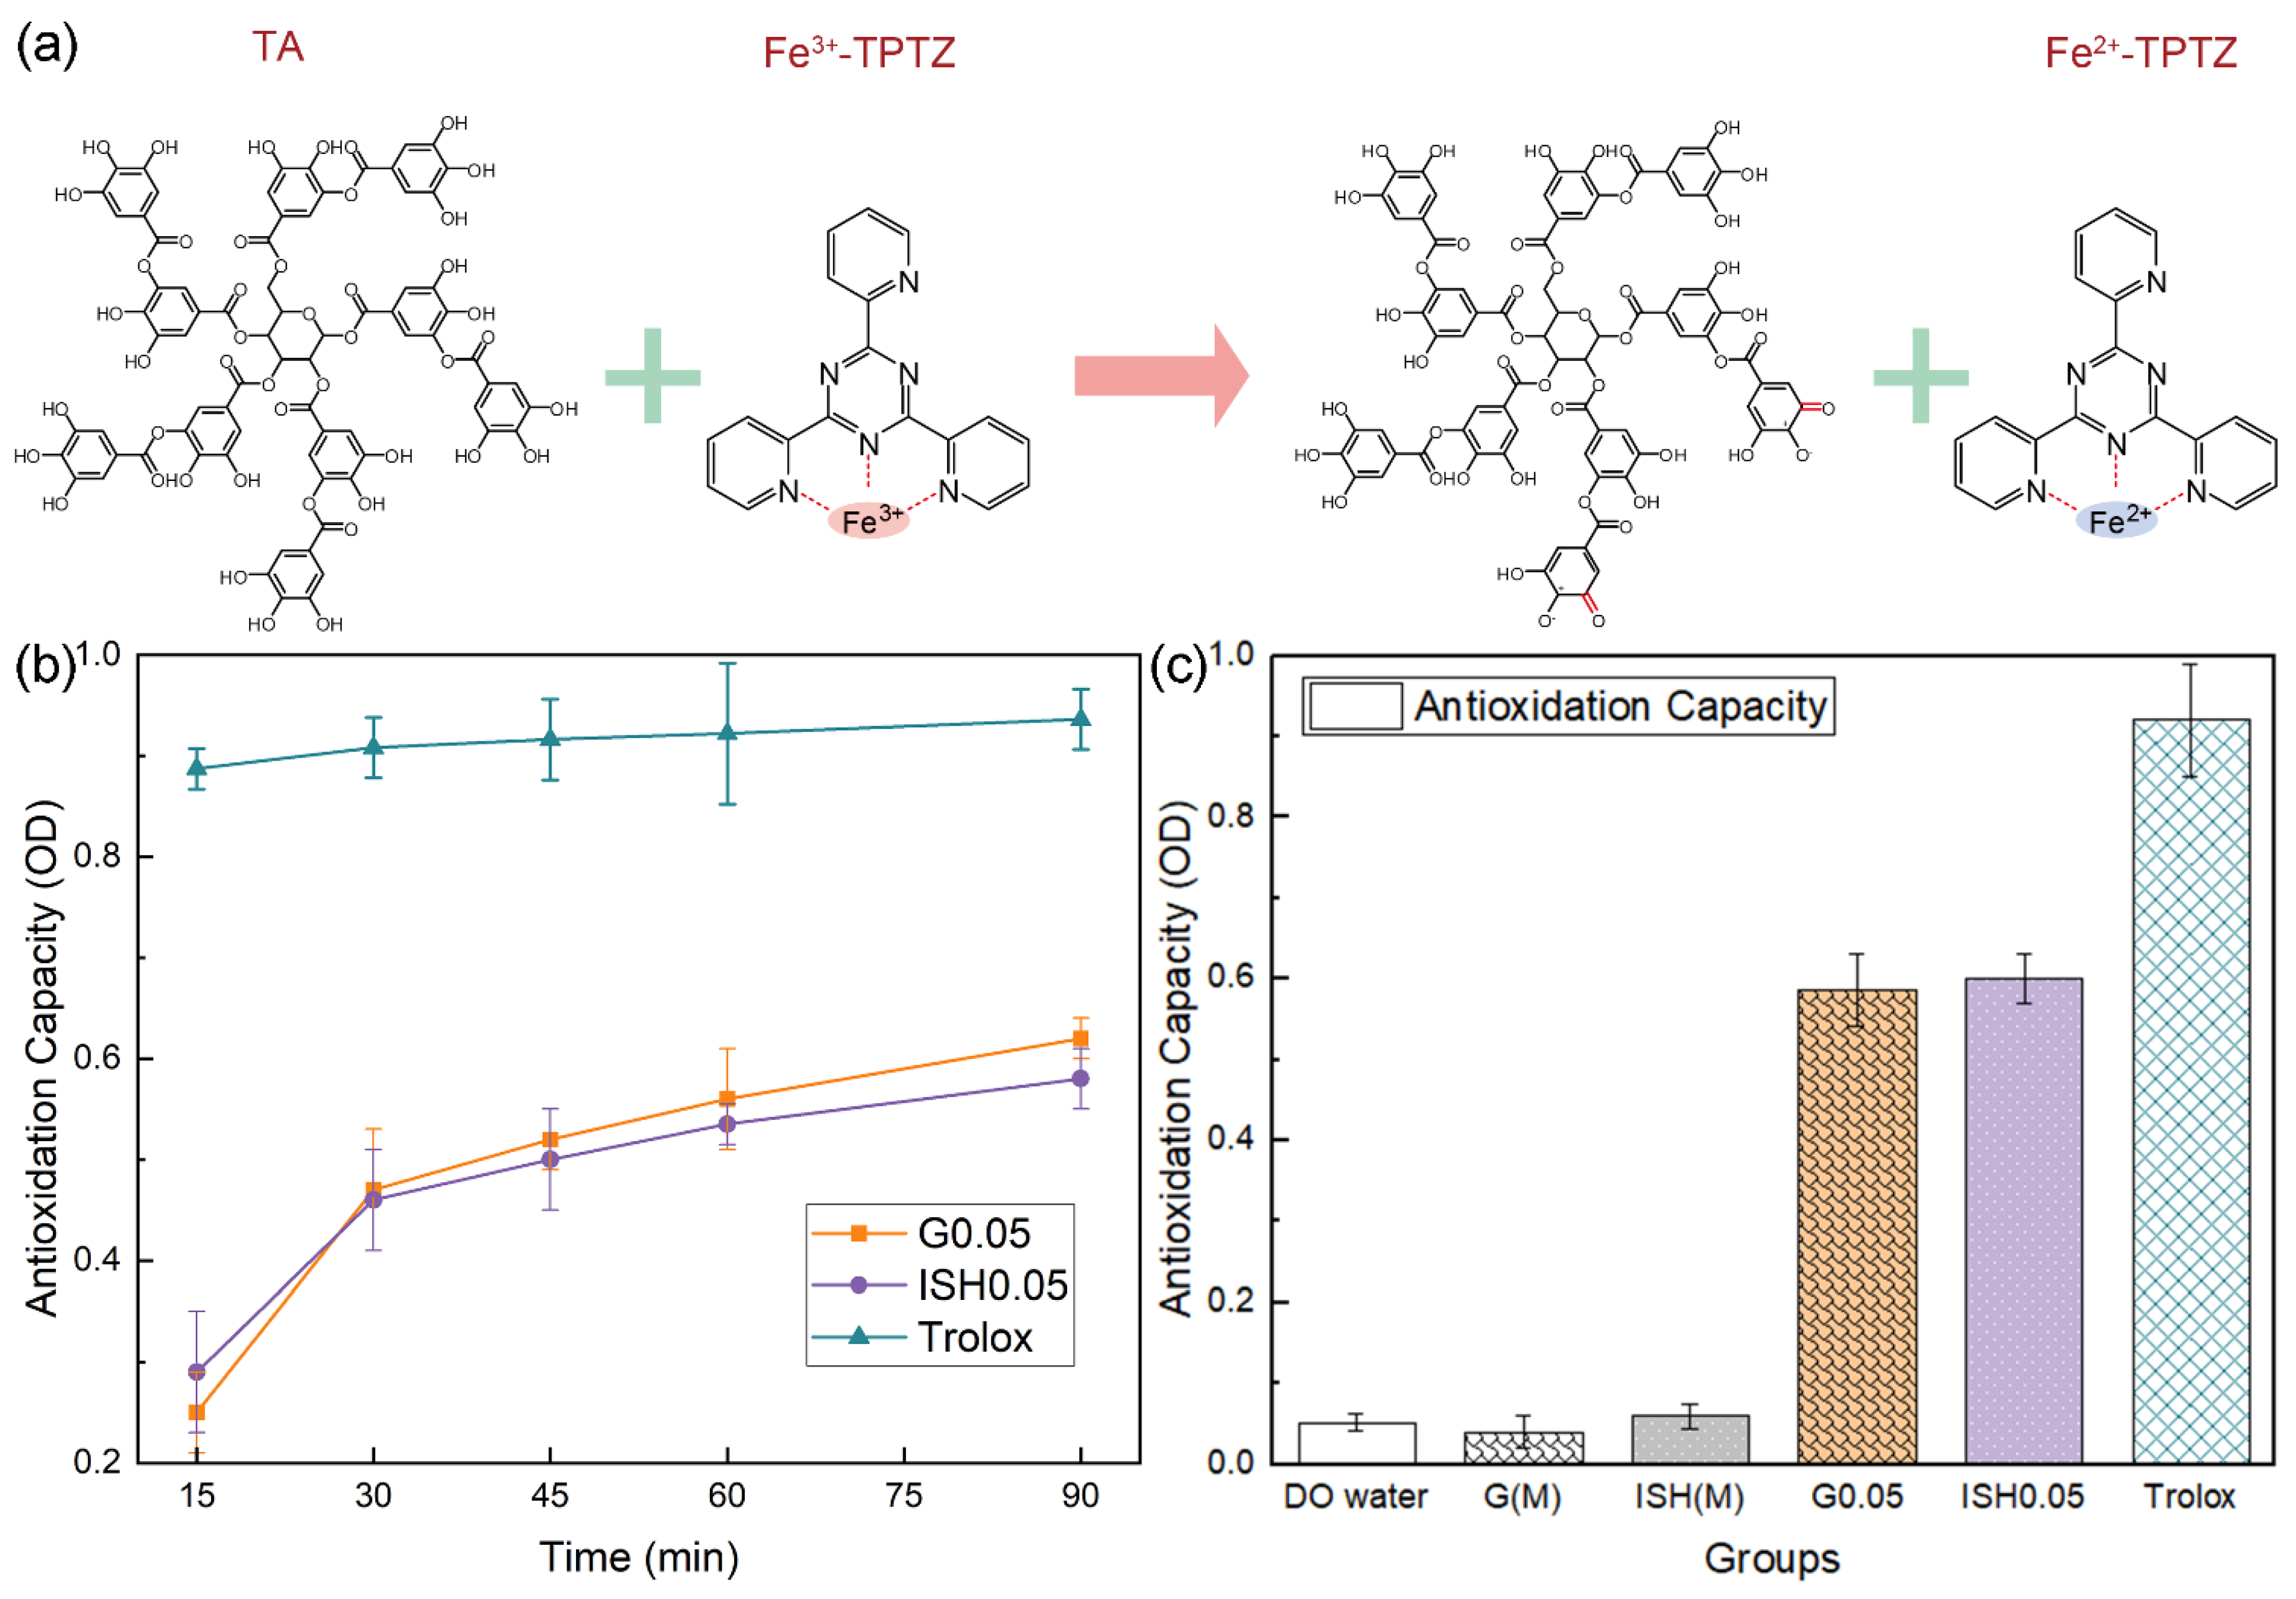
2.7.3. Total Antioxidant Capacity Test
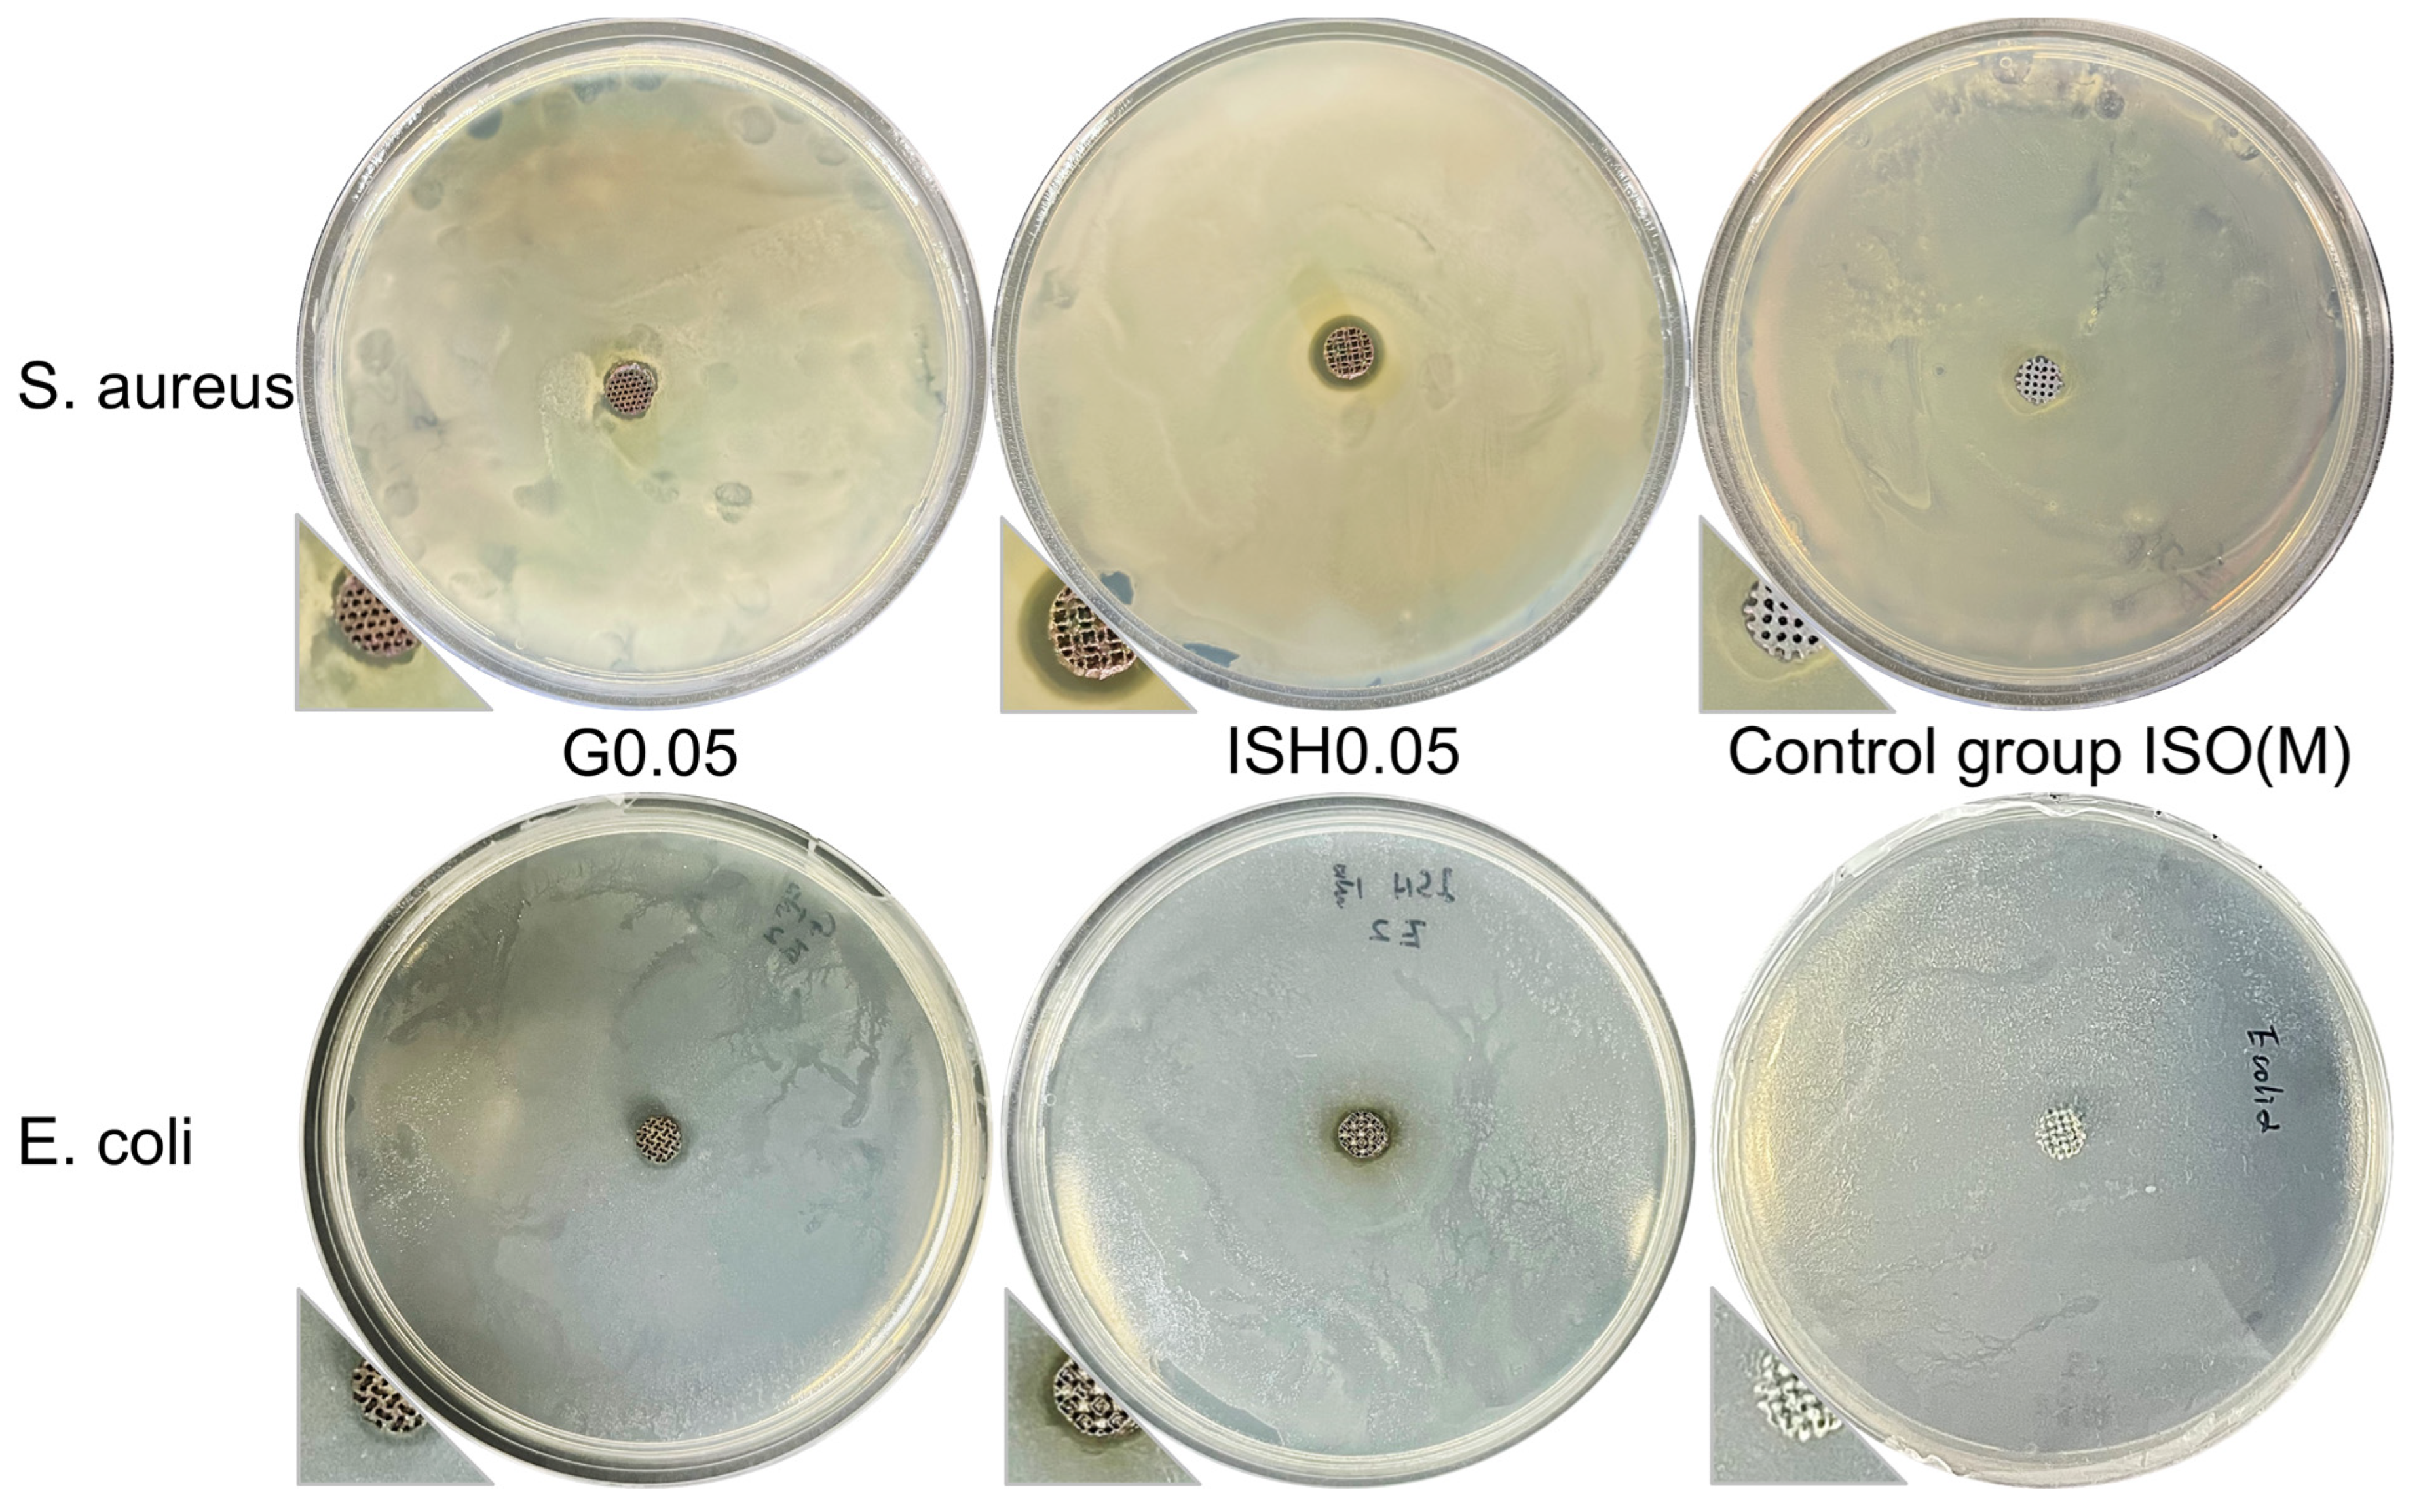
2.7.4. Antibacterial Test
2.8. Statistical Analysis
3. Results and Discussion
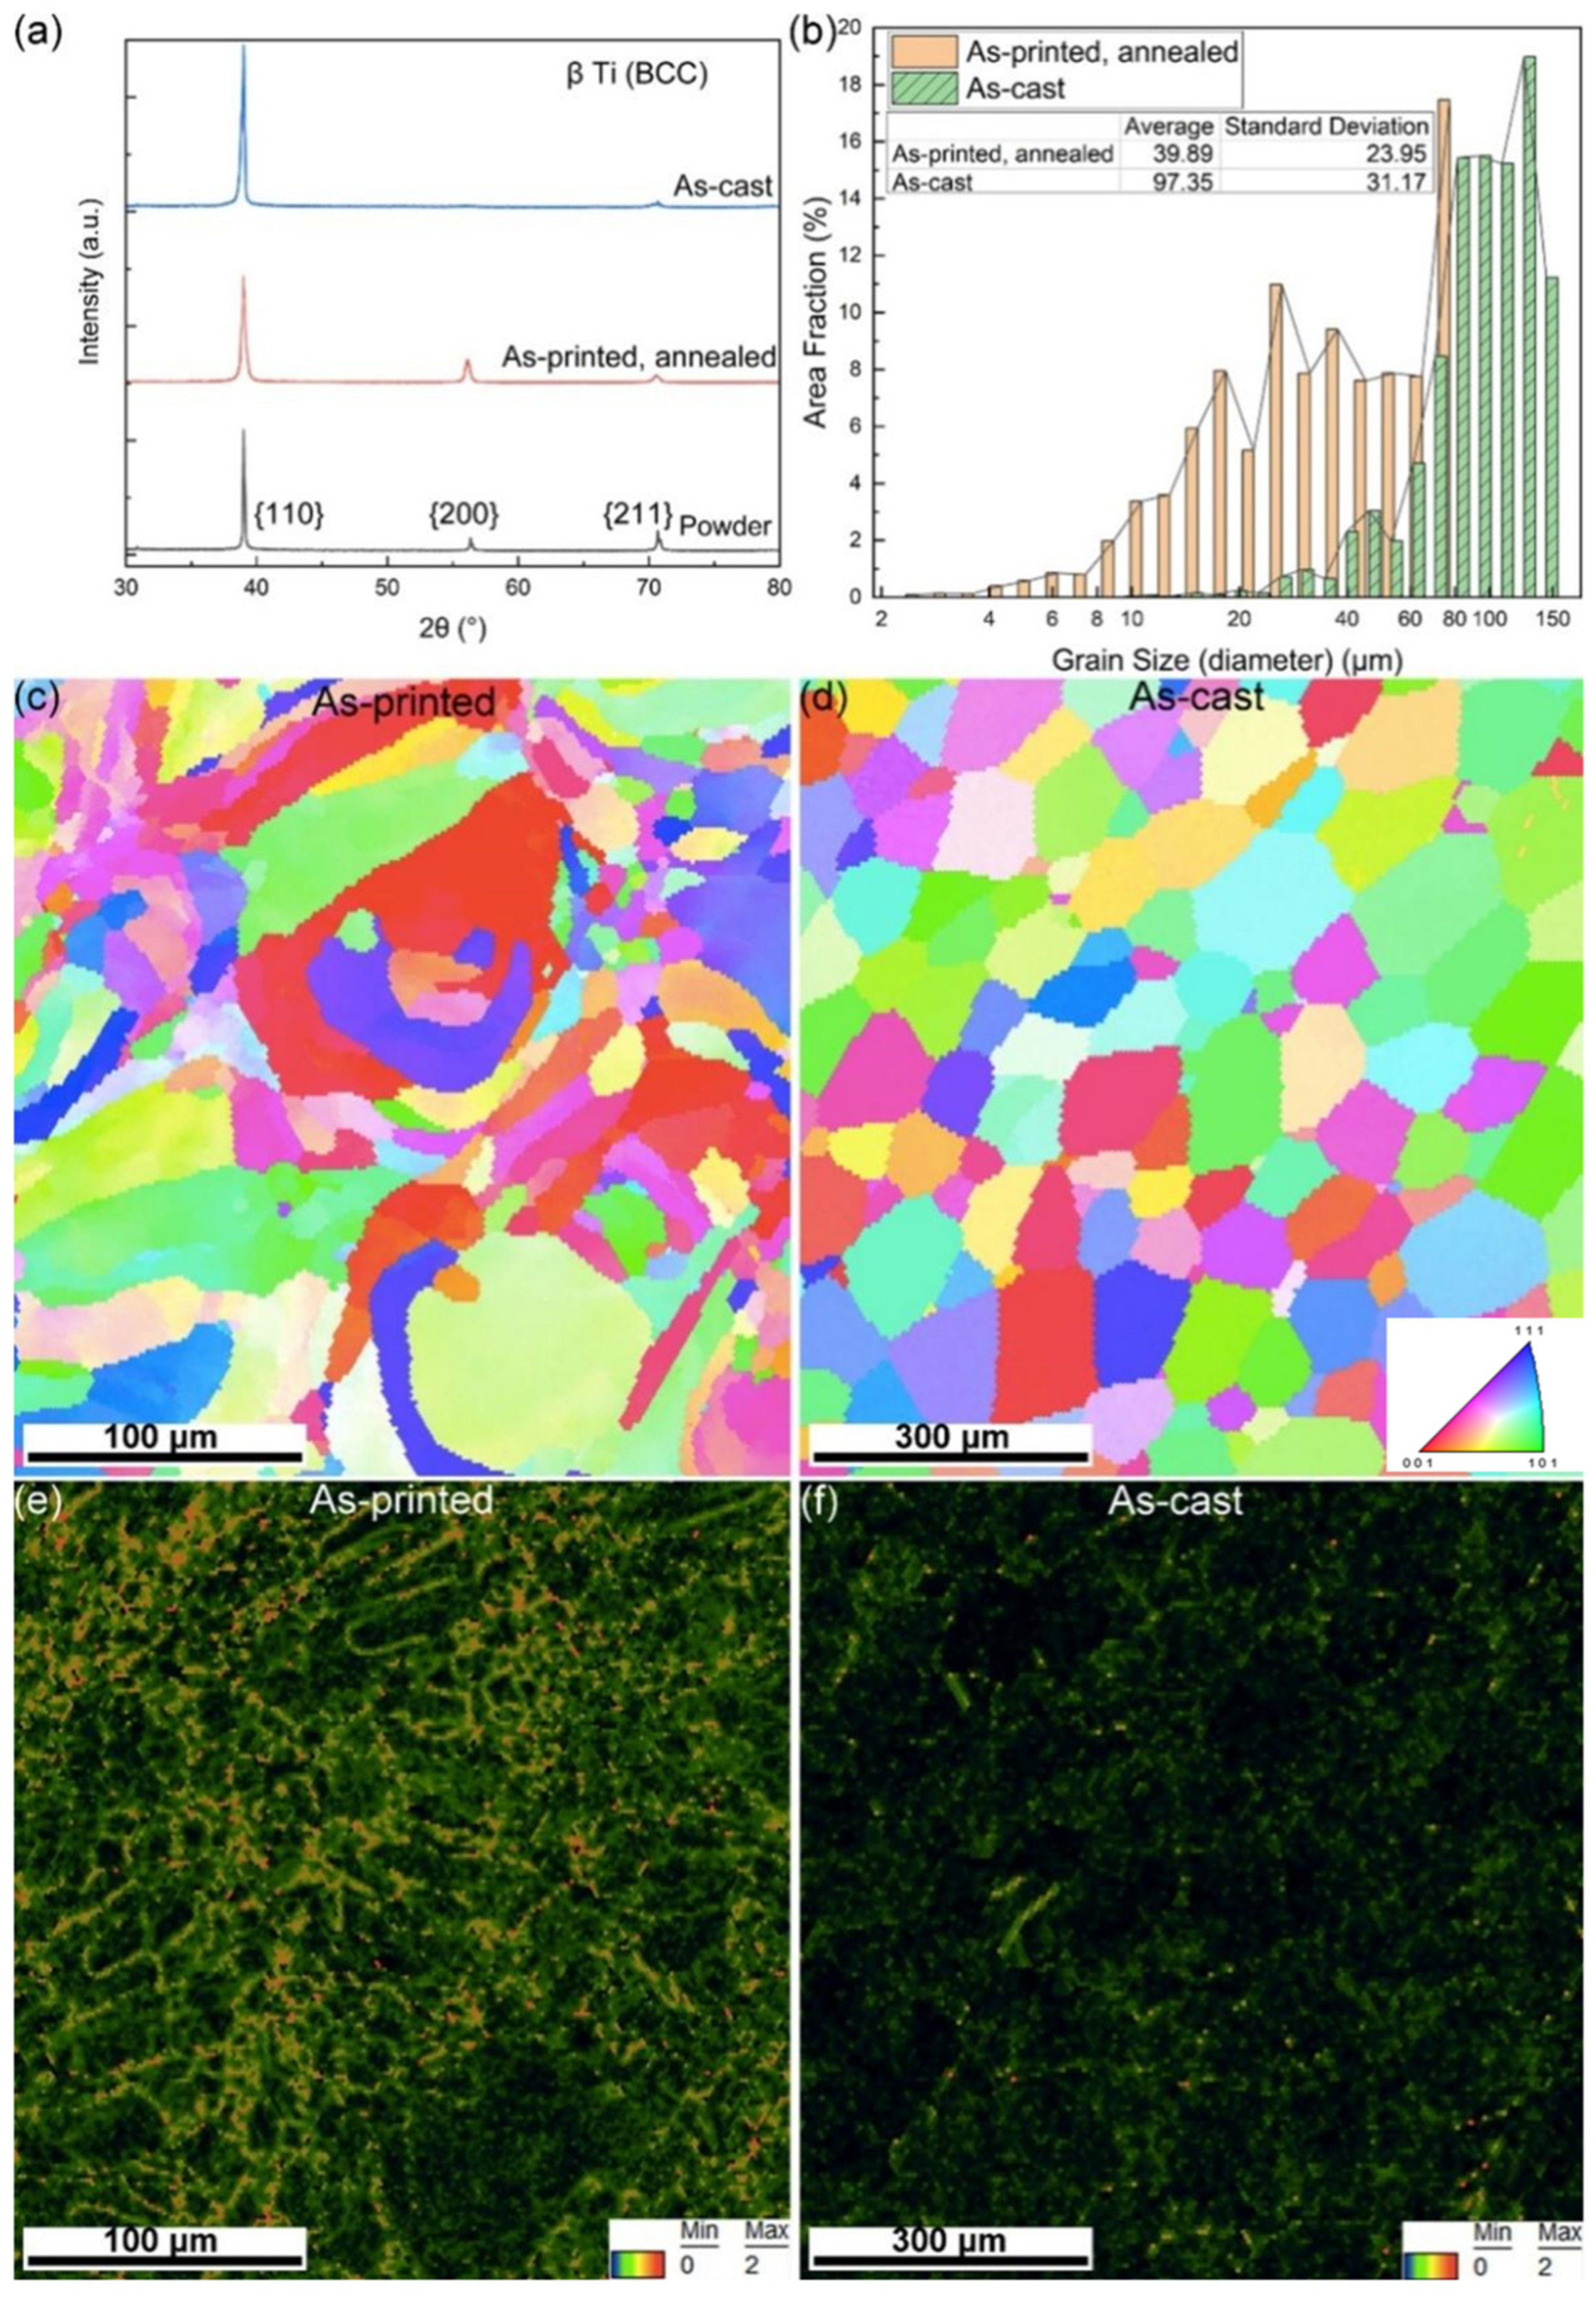
3.1. Results and Discussion of the As-Printed Dense and Porous Ti-15Mo
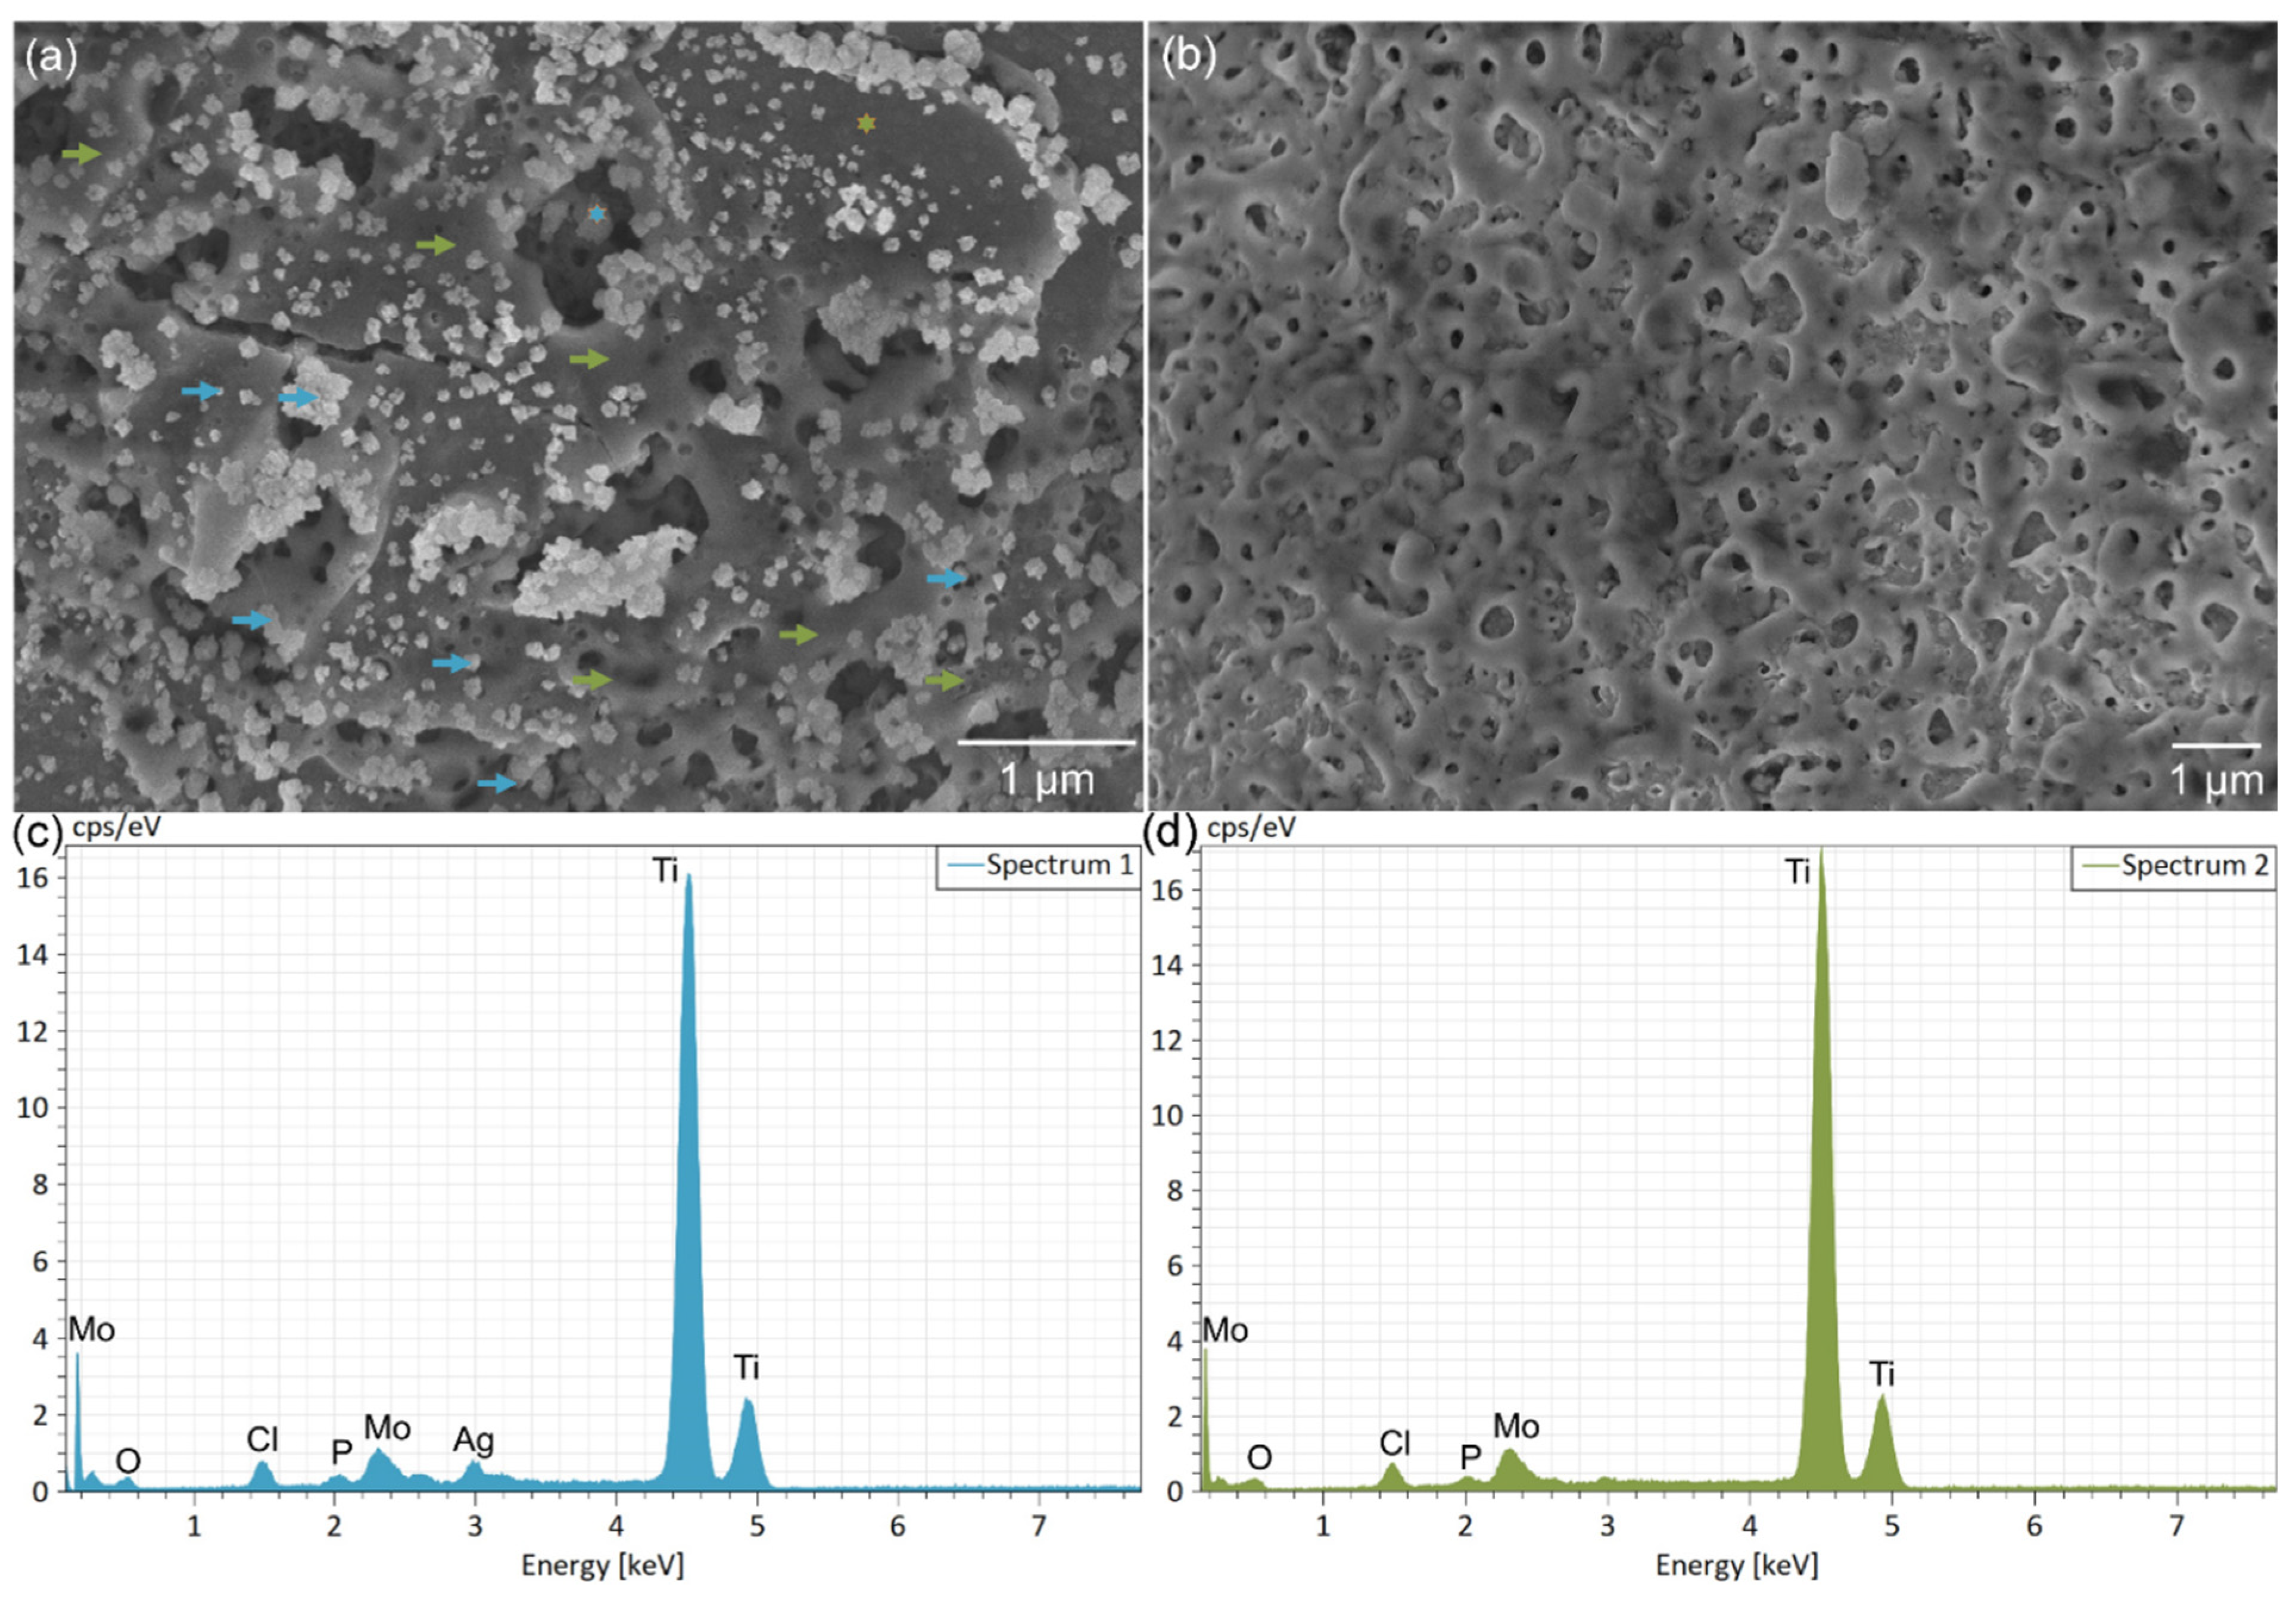
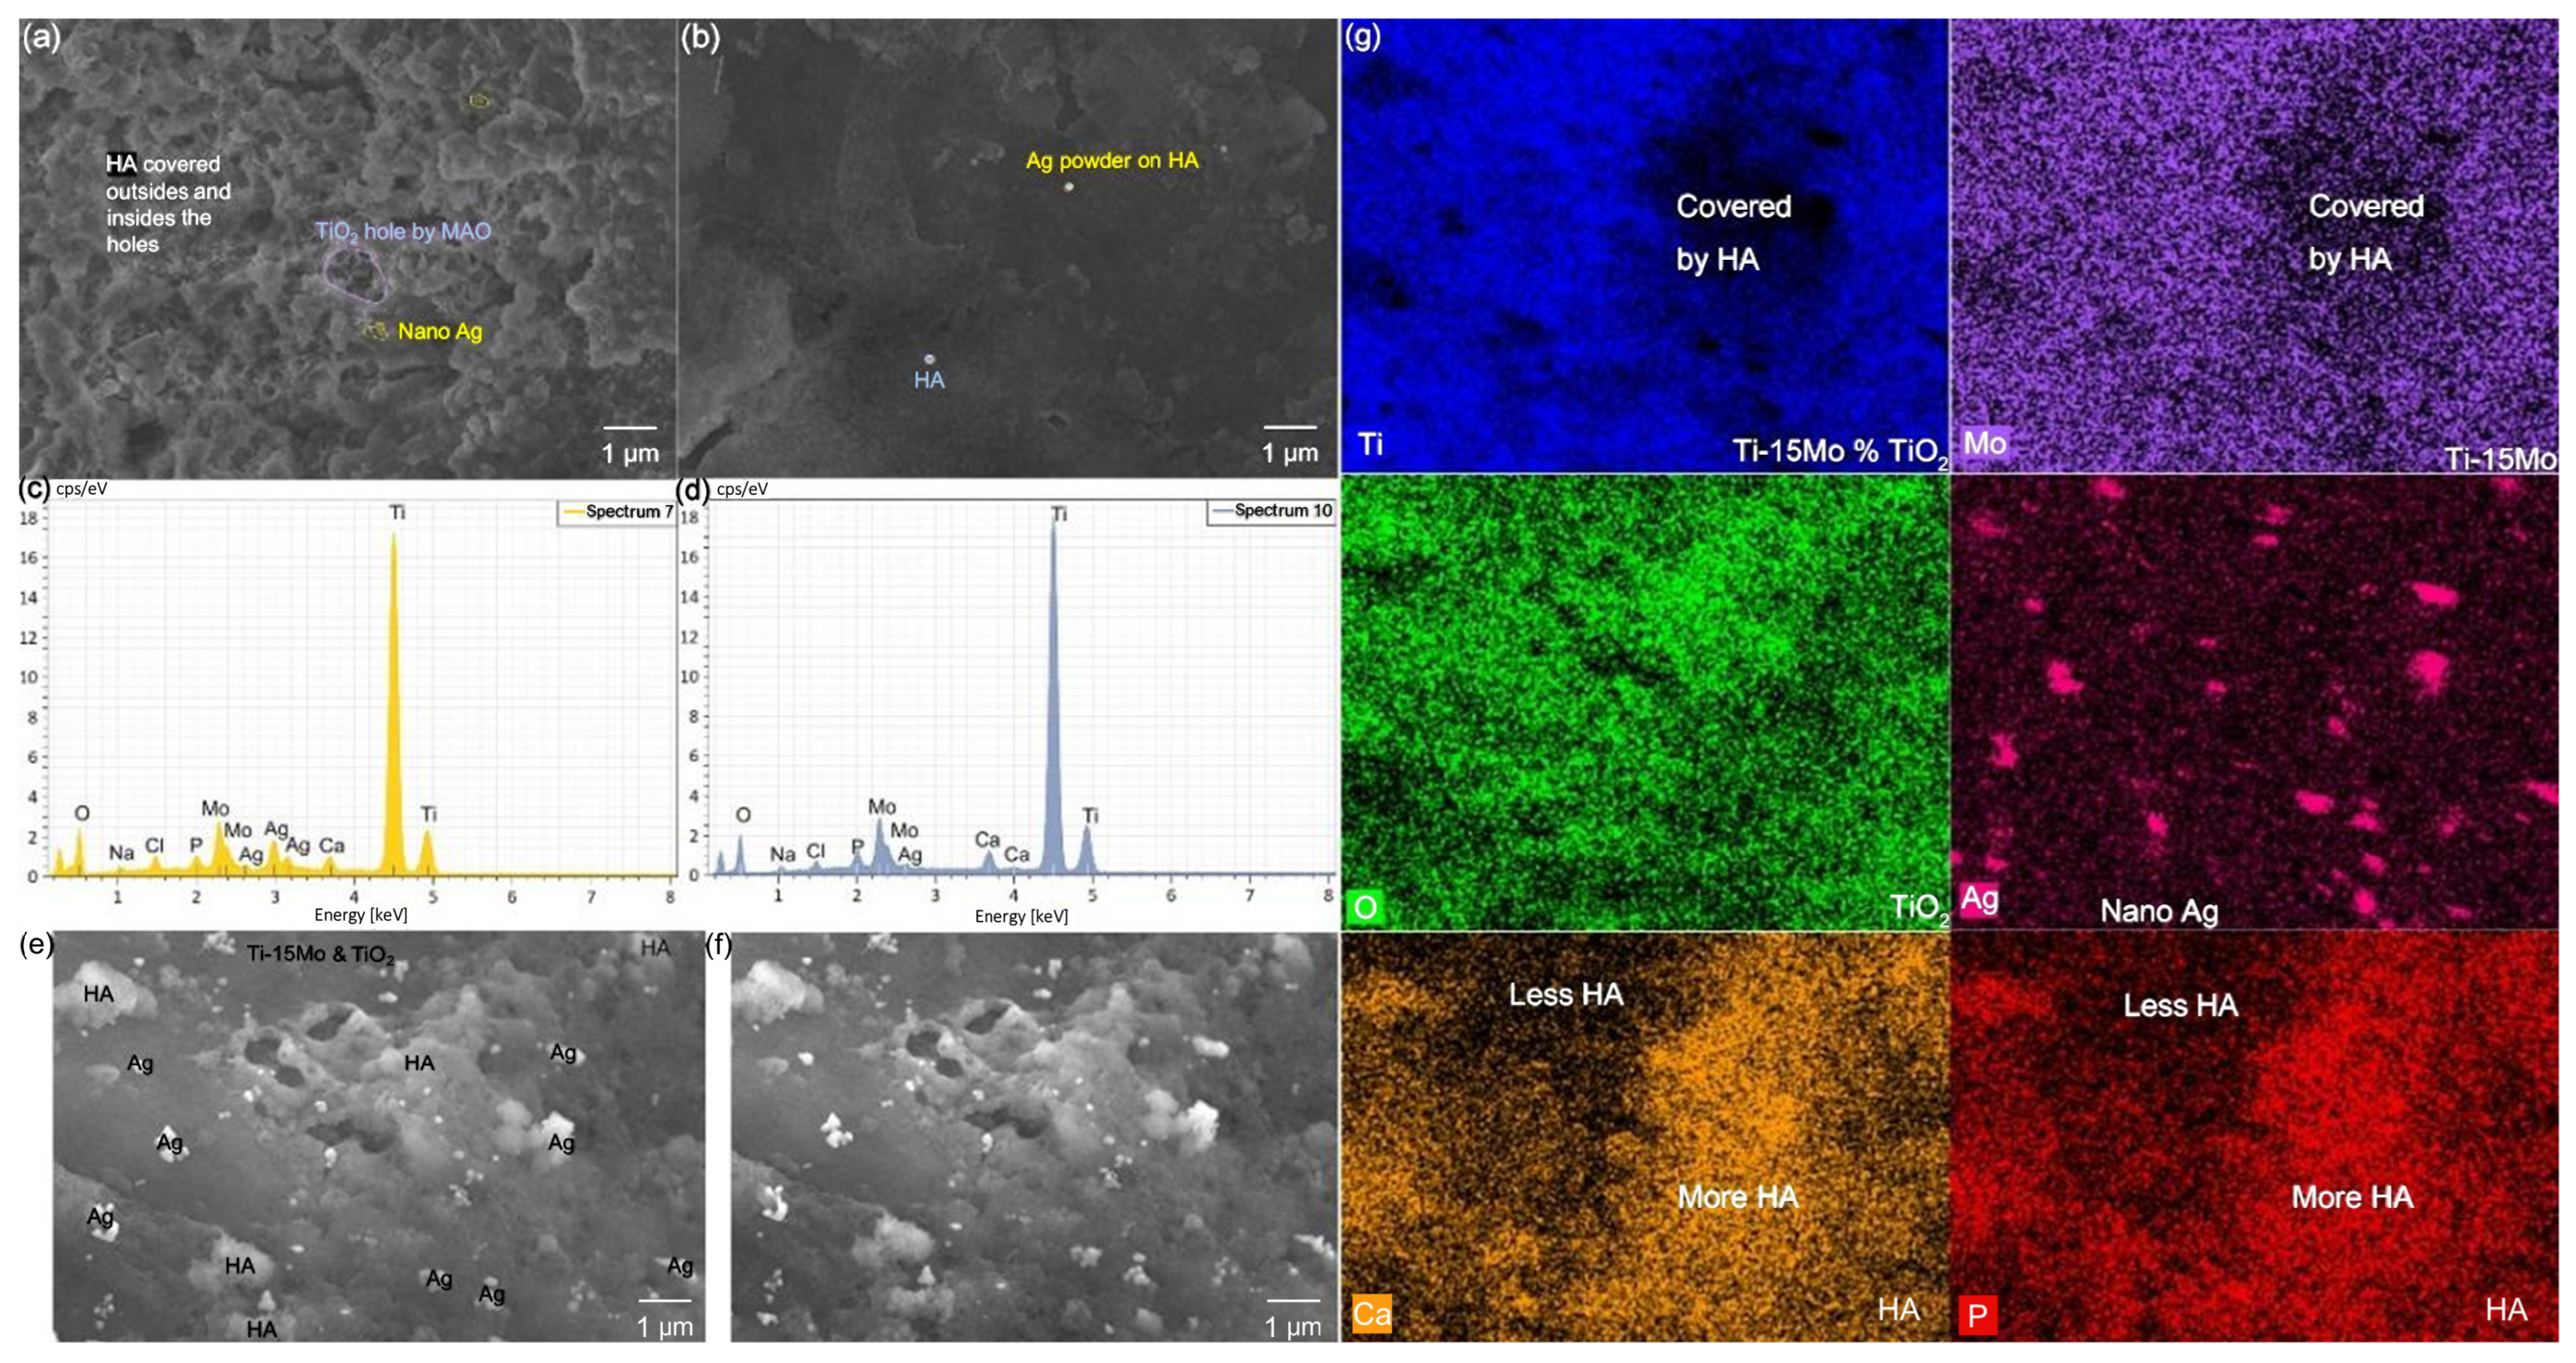
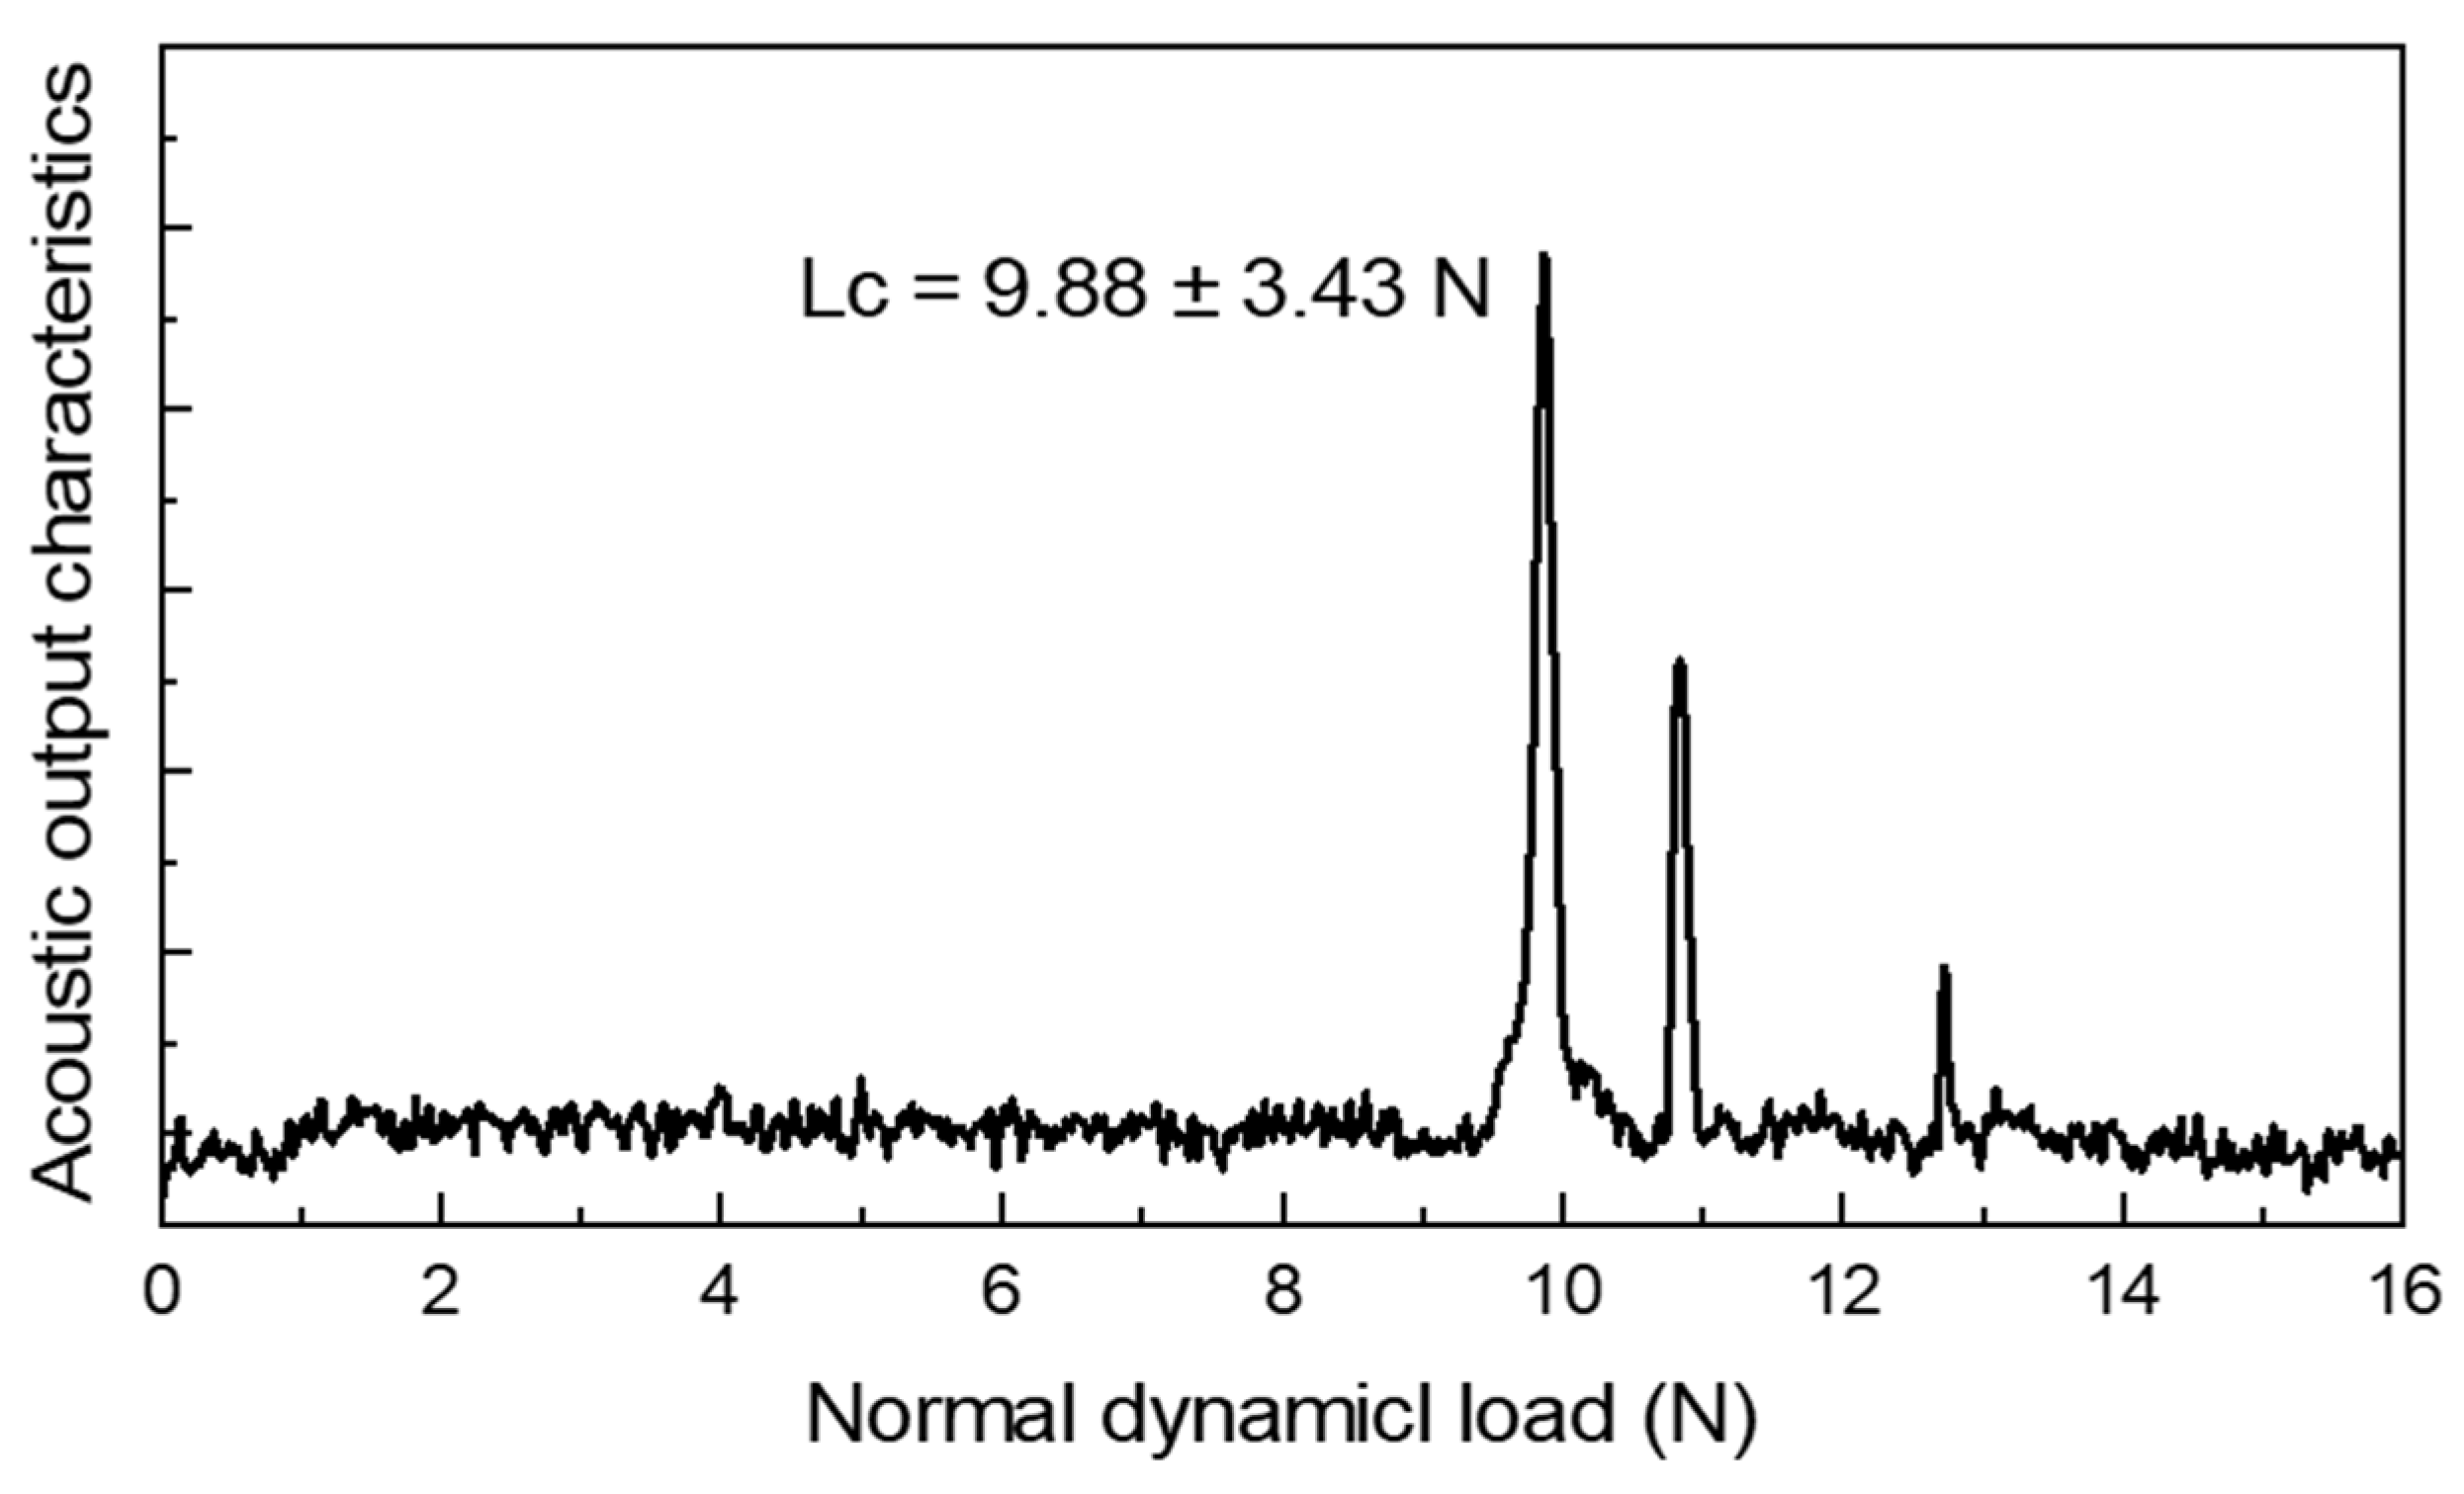
3.2. Results and Discussion of the Surface Modification of Ti-15Mo Lattices
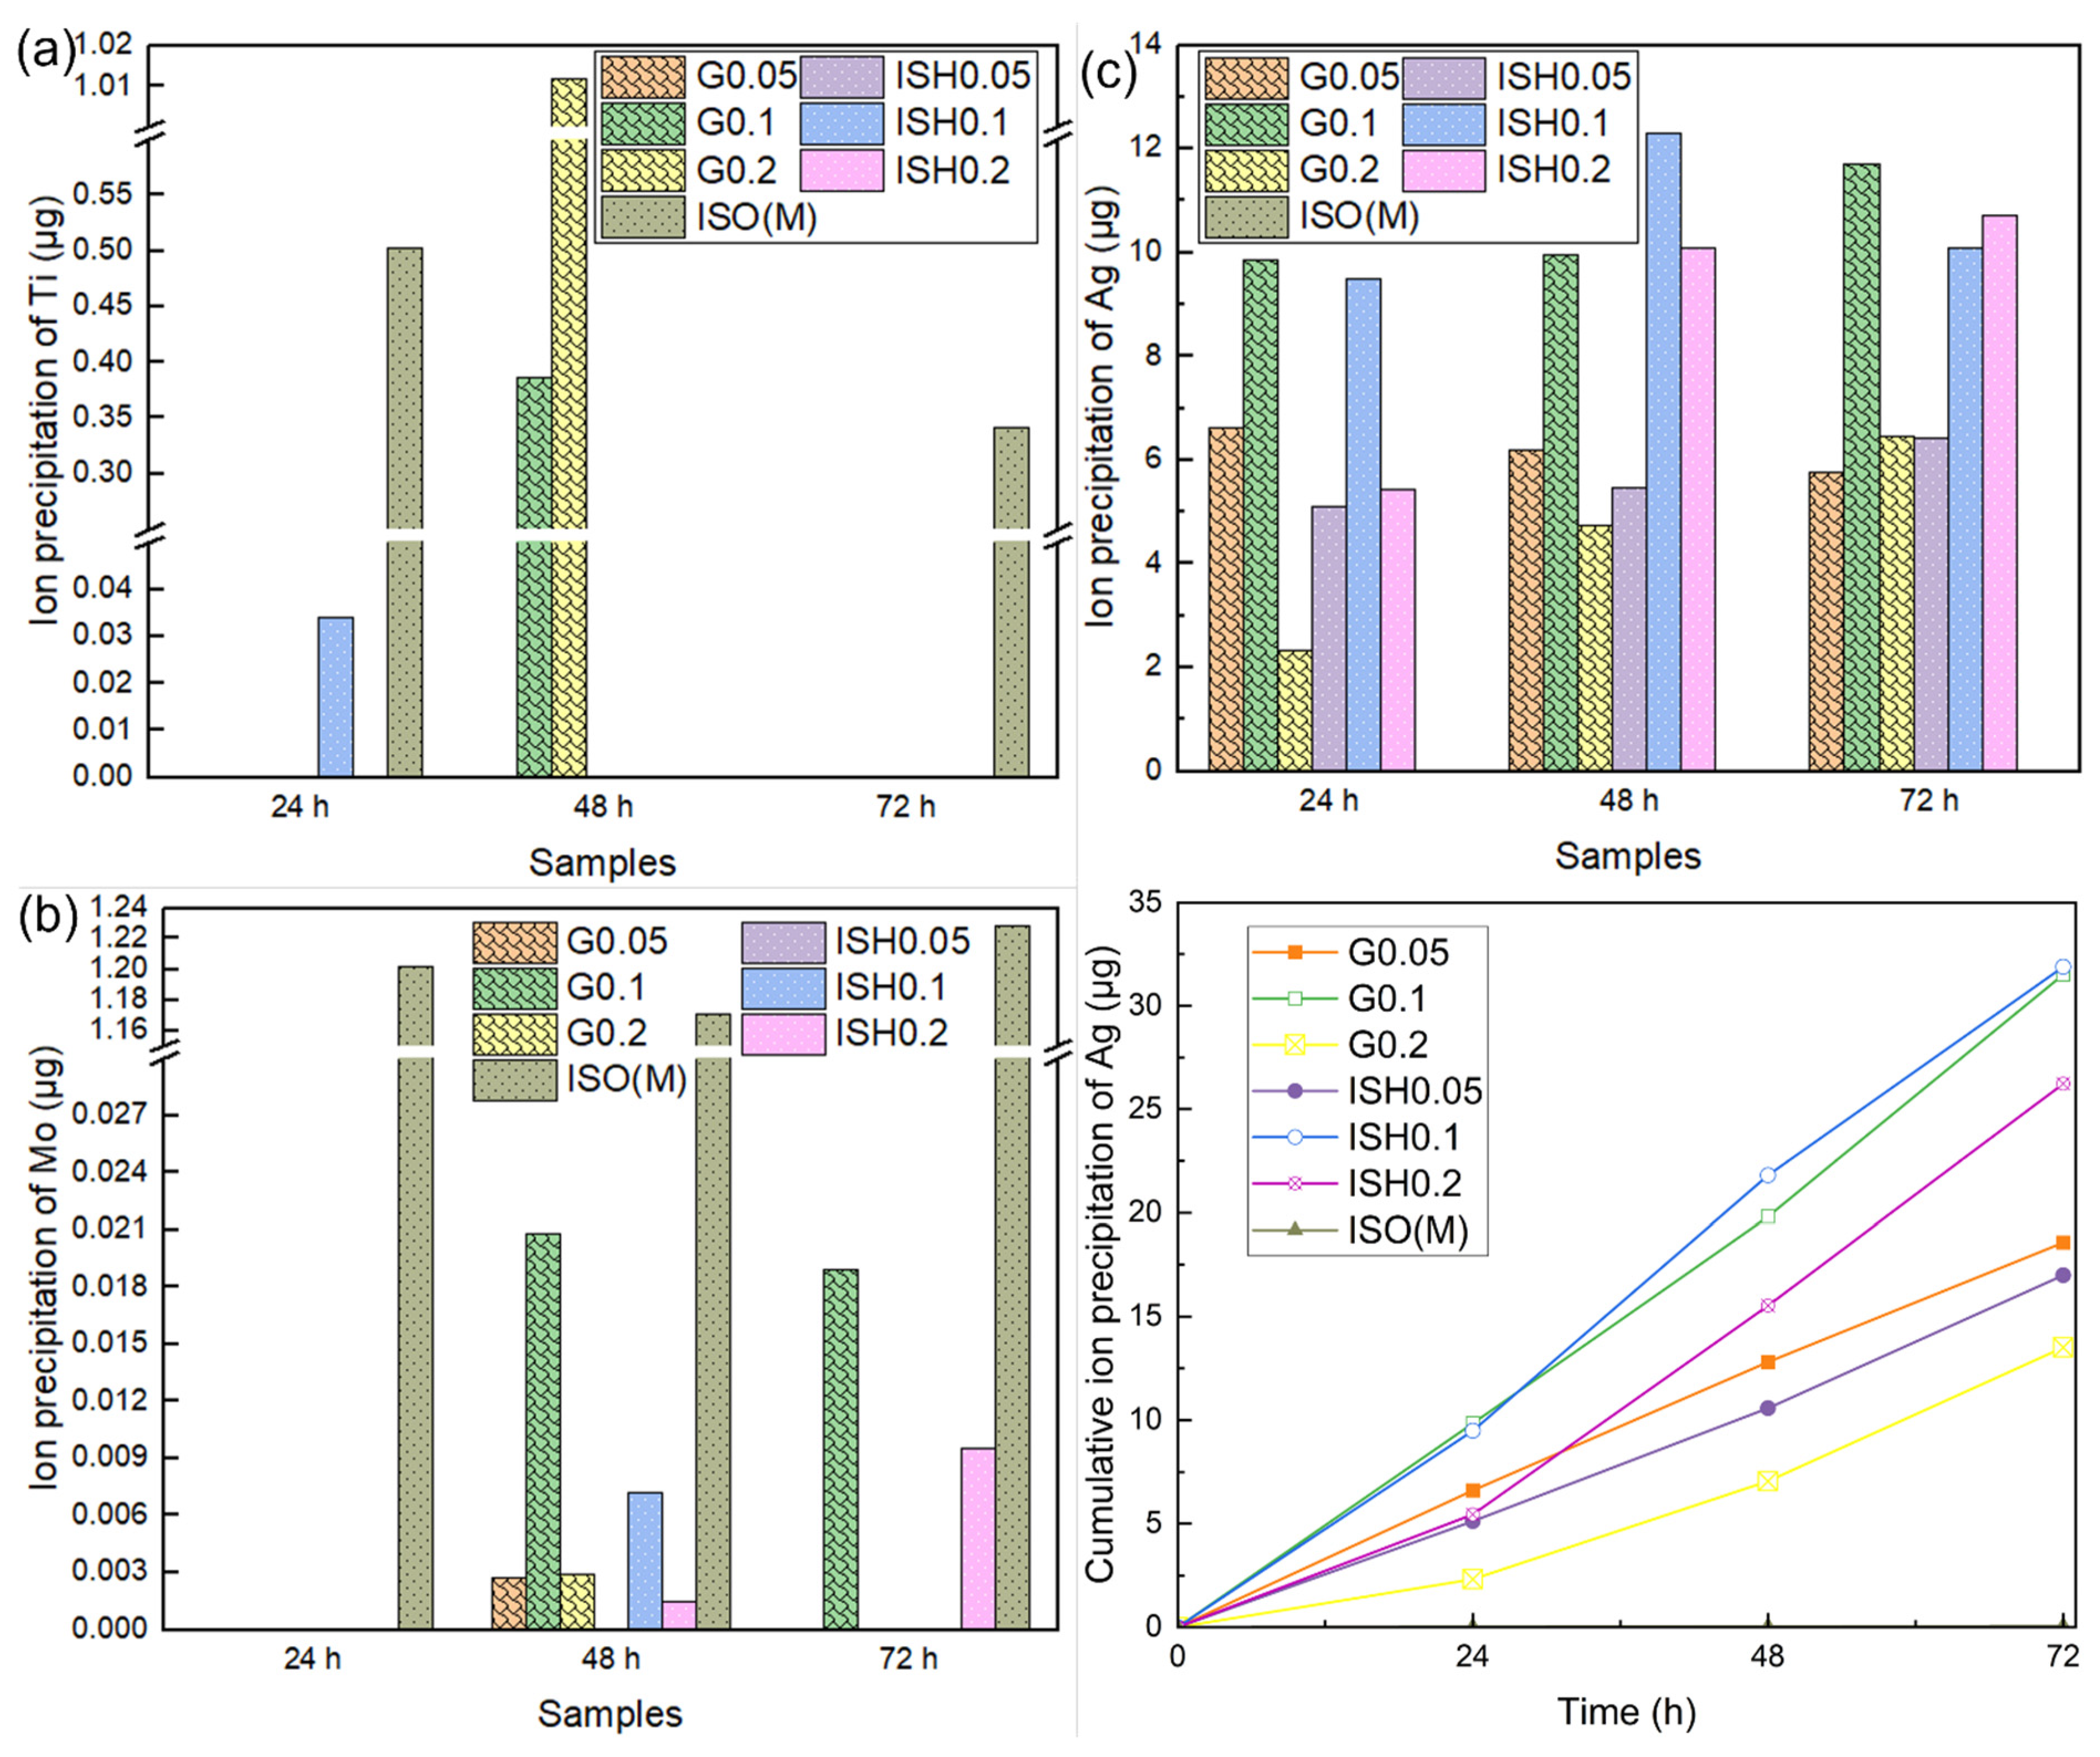
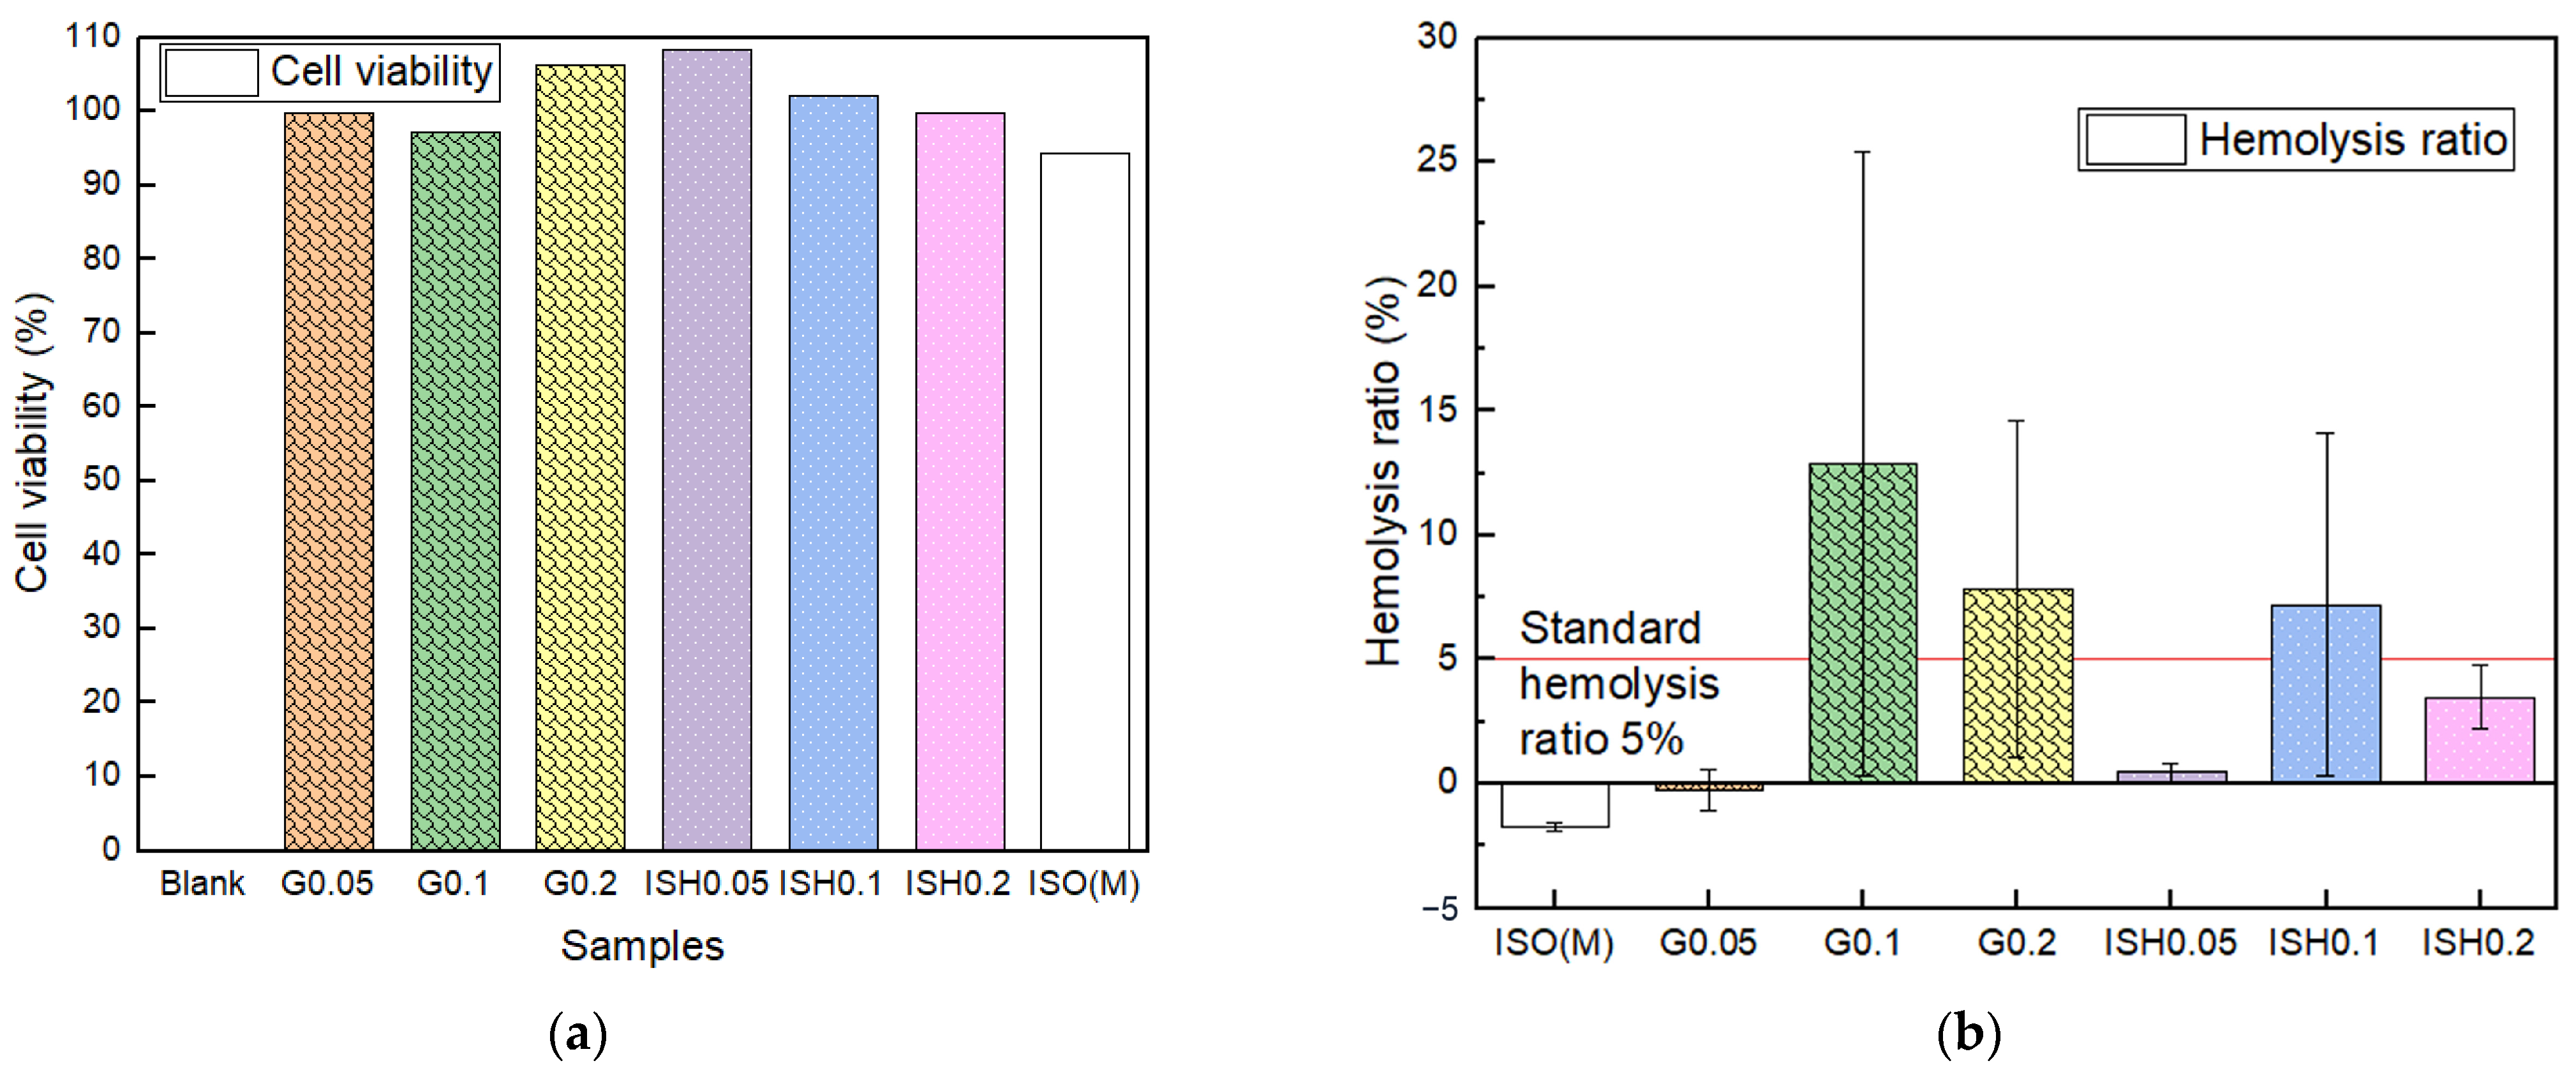
3.3. Results and Discussion of the In Vitro Analysis of Coated Ti-15Mo Scaffolds
4. Conclusions
Supplementary Materials
Author Contributions
Funding
Data Availability Statement
Acknowledgments
Conflicts of Interest
References
- ASTM F67-13; Standard Specification for Unalloyed Titanium for Surgical Implant Applications. American society for Testing and Materials: Philadelphia, PA, USA, 2017.
- Li, Y.; Wang, F. Review of 3D-Printed Titanium-Based Implants: Materials and Post-Processing. ChemBioEng Rev. 2024, 11, e202400032. [Google Scholar] [CrossRef]
- Xu, J.; Zhang, J.; Shi, Y.; Tang, J.; Huang, D.; Yan, M.; Dargusch, M.S. Surface Modification of Biomedical Ti and Ti Alloys: A Review on Current Advances. Materials 2022, 15, 1749. [Google Scholar] [CrossRef] [PubMed]
- Mesa-Restrepo, A.; Byers, E.; Brown, J.L.; Ramirez, J.; Allain, J.P.; Posada, V.M. Osteointegration of Ti Bone Implants: A Study on How Surface Parameters Control the Foreign Body Response. ACS Biomater. Sci. Eng. 2024, 10, 4662–4681. [Google Scholar] [CrossRef] [PubMed]
- Raja, P.; Babu, K.B.; Kannan, R.; Shanmugam, V.; Balaji, N.S.; Sahani, R.; Behera, L.; Pugazhenthi, A.; Thansekhar, M.R. Progress in the Optimization of Compositional Design and Thermomechanical Processing of Metastable β Ti Alloys for Biomedical Applications. ACS Biomater. Sci. Eng. 2024, 10, 3528–3547. [Google Scholar] [CrossRef]
- Yan, M.; Qian, M.; Kong, C.; Dargusch, M. Impacts of trace carbon on the microstructure of as-sintered biomedical Ti-15Mo alloy and reassessment of the maximum carbon limit. Acta Biomater. 2014, 10, 1014–1023. [Google Scholar] [CrossRef]
- Geetha, M.; Singh, A.K.; Asokamani, R.; Gogia, A.K. Ti based biomaterials, the ultimate choice for orthopaedic implants—A review. Prog. Mater. Sci. 2009, 54, 397–425. [Google Scholar] [CrossRef]
- dos Santos, M.L.; Riccardi, C.d.S.; Filho, E.d.A.; Guastaldi, A.C. Calcium phosphates of biological importance based coatings deposited on Ti-15Mo alloy modified by laser beam irradiation for dental and orthopedic applications. Ceram. Int. 2018, 44, 22432–22438. [Google Scholar] [CrossRef]
- Pronina, Y.; Narykova, M.; Kachanov, M. Relating Stiffness Changes in Porous Materials to the Evolution of Pore Space. Mech. Mater. 2025, 202, 105236. [Google Scholar] [CrossRef]
- Li, Z.; Mo, H.; Tian, J.; Li, J.; Xia, S.; Jia, X.; Zhou, L.; Lu, Y. Compressive Properties and Fracture Behaviours of Ti/Al Interpenetrating Phase Composites with Additive-Manufactured Triply Periodic Minimal Surface Porous Structures. Met. Mater. Int. 2024, 31, 955–970. [Google Scholar] [CrossRef]
- Bram, M.; Stiller, C.; Buchkremer, H.P.; Stöver, D.; Baur, H. High-porosity titanium, stainless steel, and superalloy parts. Adv. Eng. Mater. 2000, 2, 196–199. [Google Scholar] [CrossRef]
- Guo, C.; Ding, T.; Cheng, Y.; Zheng, J.; Fang, X.; Feng, Z. The Rational Design, Biofunctionalization and Biological Properties of Orthopedic Porous Titanium Implants: A Review. Front. Bioeng. Biotechnol. 2025, 13, 1548675. [Google Scholar] [CrossRef]
- Chang, S.Y.; Kang, D.H.; Cho, S.K. Innovative Developments in Lumbar Interbody Cage Materials and Design: A Comprehensive Narrative Review. Asian Spine J. 2024, 18, 444–457. [Google Scholar] [CrossRef] [PubMed]
- Karageorgiou, V.; Kaplan, D. Porosity of 3D biomaterial scaffolds and osteogenesis. Biomaterials 2005, 26, 5474–5491. [Google Scholar] [CrossRef]
- Balla, V.K.; Bodhak, S.; Bose, S.; Bandyopadhyay, A. Porous tantalum structures for bone implants: Fabrication, mechanical and in vitro biological properties. Acta Biomater. 2010, 6, 3349–3359. [Google Scholar] [CrossRef]
- Cwieka, K.; Wysocki, B.; Skibinski, J.; Chmielewska, A.; Swieszkowski, W. Numerical Design of Open-Porous Titanium Scaffolds for Powder Bed Fusion Using Laser Beam (PBF-LB). J. Mech. Behav. Biomed. Mater. 2023, 151, 106359. [Google Scholar] [CrossRef]
- Mohsan, A.U.H.; Wei, D. Advancements in Additive Manufacturing of Tantalum via the Laser Powder Bed Fusion (PBF-LB/M): A Comprehensive Review. Materials 2023, 16, 6419. [Google Scholar] [CrossRef]
- Tang, J.; Li, S.; Liu, Y.; Pei, G.; Yan, M. Significantly Enhanced Biocompatibility and Performance of 3D-Printed Porous 316L Stainless Steel via a Simple and Efficient Surface Polishing Approach. Mater. Des. 2025, 251, 113640. [Google Scholar] [CrossRef]
- Liu, H.; Chen, H.; Sun, B.; Fan, D.; Zhang, A.; Liu, H.; Wei, H.; Yang, W.; Li, Y.; Xia, P.; et al. Enhancing Angiogenesis and Osseointegration through a Double Gyroid Ti6Al4V Scaffold with Triply Periodic Minimal Surface. Bio. Design Manuf. 2024, 8, 36–54. [Google Scholar] [CrossRef]
- Lai, R.; Jiang, J.; Huo, Y.; Wang, H.; Bosiakov, S.; Lyu, Y.; Li, L. Design of Novel Graded Bone Scaffolds Based on Triply Periodic Minimal Surfaces with Multi-Functional Pores. Front. Bioeng. Biotechnol. 2025, 13, 1503582. [Google Scholar] [CrossRef]
- Bidan, C.M.; Wang, F.M.; Dunlop, J.W. Dunlop, A three-dimensional model for tissue deposition on complex surfaces. Comput. Methods Biomech. 2013, 16, 1056–1070. [Google Scholar] [CrossRef]
- Jinnai, H.; Watashiba, H.; Kajihara, T.; Nishikawa, Y.; Takahashi, M.; Ito, M. Surface curvatures of trabecular bone microarchitecture. Bone 2002, 30, 191–194. [Google Scholar] [CrossRef]
- Pinkall, U.; Polthier, K. Computing Discrete Minimal Surfaces and Their Conjugates. Exp. Math. 1993, 2, 15–36. [Google Scholar] [CrossRef]
- Çalışkan, C.İ.; Şahin, M.; Koca, A.; Tarakçı, G.; Okbaz, A.; Dalkılıç, A.S. Mechanical Performance and ANN-Based Prediction of Co-Cr Dental Alloys with Gyroid Cellular Structures Produced by LPBF Technology. Proc. Inst. Mech. Eng. Part C J. Mech. Eng. Sci. 2025, 1–19. [Google Scholar] [CrossRef]
- Zou, S.; Gong, H.; Gao, J. Additively Manufactured Multilevel Voronoi-Lattice Scaffolds with Bonelike Mechanical Properties. ACS Biomater. Sci. Eng. 2022, 8, 3022–3037. [Google Scholar] [CrossRef]
- Afshar, M.; Anaraki, A.P.; Montazerian, H.; Kadkhodapour, J. Additive manufacturing and mechanical characterization of graded porosity scaffolds designed based on triply periodic minimal surface architectures. J. Mech. Behav. Biomed. Mater. 2016, 62, 481–494. [Google Scholar] [CrossRef]
- Simske, S.; Ayers, R.; Bateman, T. Porous materials for bone engineering. Mater. Sci. Forum 1997, 250, 151–182. [Google Scholar] [CrossRef]
- Klenke, F.M.; Liu, Y.; Yuan, H.; Hunziker, E.B.; Siebenrock, K.A.; Hofstetter, W. Impact of pore size on the vascularization and osseointegration of ceramic bone substitutes in vivo. J. Biomed. Mater. Res. Part A 2008, 85A, 777–786. [Google Scholar] [CrossRef]
- Murphy, C.M.; Haugh, M.G.; O’Brien, F.J. The effect of mean pore size on cell attachment, proliferation and migration in collagen-glycosaminoglycan scaffolds for bone tissue engineering. Biomaterials 2010, 31, 461–466. [Google Scholar] [CrossRef]
- Hollister, S.; Lin, C.; Saito, E.; Schek, R.; Taboas, J.; Williams, J.; Partee, B.; Flanagan, C.; Diggs, A.; Wilke, E.; et al. Engineering craniofacial scaffolds. Orthod. Craniofacial Res. 2005, 8, 162–173. [Google Scholar] [CrossRef] [PubMed]
- Kumar, A.; Webster, T.J.; Biswas, K.; Basu, B. Flow cytometry analysis of human fetal osteoblast fate processes on spark plasma sintered hydroxyapatite-titanium biocomposites. J. Biomed. Mater. Res. Part A 2013, 101, 2925–2938. [Google Scholar] [CrossRef]
- Gnilitskyi, I.; Dolgov, L.; Tamm, A.; Ferraria, A.M.; Diedkova, K.; Kopanchuk, S.; Tsekhmister, Y.; Veiksina, S.; Polewczyk, V.; Pogorielov, M. Enhanced Osteointegration and Osteogenesis of Osteoblast Cells by Laser-Induced Surface Modification of Ti Implants. Nanomed. Nanotechnol. Biol. Med. 2024, 62, 102785. [Google Scholar] [CrossRef]
- Sun, X.D.; Liu, T.T.; Wang, Q.Q.; Zhang, J.; Cao, M.S. Surface Modification and Functionalities for Titanium Dental Implants. ACS Biomater. Sci. Eng. 2023, 9, 4442–4461. [Google Scholar] [CrossRef]
- Costa Filho, P.M.D.; Marcantonio, C.C.; de Oliveira, D.P.; Lopes, M.E.S.; Puetate, J.C.S.; Faria, L.V.; Carvalho, L.d.F.; de Molon, R.S.; Junior, I.R.G.; Nogueira, A.V.B.; et al. Titanium Micro-Nano Textured Surface with Strontium Incorporation Improves Osseointegration: An In Vivo and In Vitro Study. J. Appl. Oral Sci. 2024, 32, e20240144. [Google Scholar] [CrossRef]
- Robertson, S.F.; Bandyopadhyay, A.; Bose, S. Titania nanotube interface to increase adhesion strength of hydroxyapatite sol-gel coatings on Ti-6Al-4V for orthopedic applications. Surf. Coatings Technol. 2019, 372, 140–147. [Google Scholar] [CrossRef]
- Li, G.; Ma, F.; Liu, P.; Qi, S.; Li, W.; Zhang, K.; Chen, X. Review of Micro-Arc Oxidation of Titanium Alloys: Mechanism, Properties and Applications. J. Alloys Compd. 2023, 948, 169773. [Google Scholar] [CrossRef]
- Verdier, S.; Boinet, M.; Maximovitch, S.; Dalard, F. Formation, structure and composition of anodic films on AM60 magnesium alloy obtained by DC plasma anodizing. Corros. Sci. 2005, 47, 1429–1444. [Google Scholar] [CrossRef]
- Dittrich, K.; Krysmann, W.; Kurze, P.; Schneider, H.G. Structure and Properties of Anof Layers. Cryst. Res. Technol. 1984, 19, 93–99. [Google Scholar] [CrossRef]
- Liu, X.Y.; Chu, P.K.; Ding, C.X. Surface modification of titanium, titanium alloys, and related materials for biomedical applications. Mater. Sci. Eng. R Rep. 2004, 47, 49–121. [Google Scholar] [CrossRef]
- Ma, C.F.; Li, D.M.; Jiang, B.L.; Li, H.J. Study on surface bio-modification of titanium implant using microarc oxidation technology. J. Fourth Mil. Med. Univ. 2004, 25, 4–7. [Google Scholar]
- Gross, K.A.; Rodríguez-Lorenzo, L.M. Sintered hydroxyfluorapatites. Part 1: Sintering ability of precipitated solid solution powders. Biomaterials 2004, 25, 1375–1384. [Google Scholar] [CrossRef]
- Gross, K.A.; Rodríguez-Lorenzo, L.M. Sintered hydroxyfluorapatites. Part II: Mechanical properties of solid solutions determined by microindentation. Biomaterials 2004, 25, 1385–1394. [Google Scholar] [CrossRef]
- Li, B.; Zhao, P.; Liu, S.; Wang, D.; Li, H.; Liang, C.; Wang, H. Preparation and Properties of Hydroxyapatite/Chitosan Coatings on Ti Surface by Different Electrochemical Methods. J. Mater. Eng. Perform. 2024, 1–9. [Google Scholar] [CrossRef]
- Boanini, E.; Torricelli, P.; Gazzano, M.; Della Bella, E.; Fini, M.; Bigi, A. Combined effect of strontium and zoledronate on hydroxyapatite structure and bone cell responses. Biomaterials 2014, 35, 5619–5626. [Google Scholar] [CrossRef]
- Qu, H.; Wei, M. Effect of fluorine content on mechanical properties of sintered fluoridated hydroxyapatite. Mater. Sci. Eng. C 2006, 26, 46–53. [Google Scholar] [CrossRef]
- Qu, H.; Wei, M. The effect of fluoride contents in fluoridated hydroxyapatite on osteoblast behavior. Acta Biomater. 2006, 2, 113–119. [Google Scholar] [CrossRef]
- LeGeros, R.Z. Properties of osteoconductive biomaterials: Calcium phosphates. Clin. Orthop. Relat. Res. 2002, 395, 81–98. [Google Scholar] [CrossRef]
- Ratha, I.; Datta, P.; Reger, N.C.; Das, H.; Balla, V.K.; Devi, K.B.; Roy, M.; Nandi, S.K.; Kundu, B. In Vivo Osteogenesis of Plasma Sprayed Ternary-Ion Doped Hydroxyapatite Coatings on Ti6Al4V for Orthopaedic Applications. Ceram. Int. 2022, 48, 11475–11488. [Google Scholar] [CrossRef]
- Kaczmarek-Szczepańska, B.; Zasada, L.; Michalska-Sionkowska, M.; Vishnu, J.; Manivasagam, G. The Modification of Titanium Surface by Decomposition of Tannic Acid Coating. Appl. Sci. 2023, 13, 5204. [Google Scholar] [CrossRef]
- DOh, D.X.; Prajatelistia, E.; Ju, S.-W.; Kim, H.J.; Baek, S.-J.; Cha, H.J.; Jun, S.H.; Ahn, J.-S.; Hwang, D.S. A rapid, efficient, and facile solution for dental hypersensitivity: The tannin-iron complex. Sci. Rep. 2015, 5, srep10884. [Google Scholar] [CrossRef]
- Huang, D.; Lin, Q.; Yin, M.; Wei, Y.; Du, J.; Hu, Y.; Zhao, L.; Lian, X.; Chen, W. Ag nanoparticles decorated electrospinning carbon nanotubes/polyamide nanofibers. J. Biomater. Sci. Polym. Ed. 2019, 30, 1744–1755. [Google Scholar] [CrossRef]
- Al-Ketan, O.; Abu Al-Rub, R.K. MSLattice: A free software for generating uniform and graded lattices based on triply periodic minimal surfaces. Mater. Des. Process. Commun. 2021, 3, e205. [Google Scholar] [CrossRef]
- Al-Ketan, O.; Assad, M.A.; Abu Al-Rub, R.K. Mechanical properties of periodic interpenetrating phase composites with novel architected microstructures. Compos. Struct. 2017, 176, 9–19. [Google Scholar] [CrossRef]
- Al-Ketan, O.; Rowshan, R.; Abu Al-Rub, R.K. Topology-mechanical property relationship of 3D printed strut, skeletal, and sheet based periodic metallic cellular materials. Addit. Manuf. 2018, 19, 167–183. [Google Scholar] [CrossRef]
- Zhu, W.; Moumni, Z.; Zhu, J.; Zhang, Y.; Li, S.; Zhang, W. A Multi-Scale Experimental Investigation for Fatigue Limit and Fatigue Crack Initiation Behavior of Powder Bed Fusion-Laser Beam 316L Stainless Steel. Mater. Sci. Eng. A 2023, 866, 144692. [Google Scholar] [CrossRef]
- Schuh, B.; Völker, B.; Todt, J.; Schell, N.; Perrière, L.; Li, J.; Couzinié, J.; Hohenwarter, A. Thermodynamic instability of a nanocrystalline, single-phase TiZrNbHfTa alloy and its impact on the mechanical properties. Acta Mater. 2018, 142, 201–212. [Google Scholar] [CrossRef]
- Li, C.-L.; Wang, C.-S.; Narayana, P.; Hong, J.-K.; Choi, S.-W.; Kim, J.H.; Lee, S.W.; Park, C.H.; Yeom, J.-T.; Mei, Q. Formation of equiaxed grains in selective laser melted pure titanium during annealing. J. Mater. Res. Technol. 2021, 11, 301–311. [Google Scholar] [CrossRef]
- Tang, J.; Wu, Z.; Yao, X.; Zhou, Y.; Xiong, Y.; Li, Y.; Xu, J.; Dargusch, M.S.; Yan, M. From bio-inertness to osseointegration and antibacterial activity: A one-step micro-arc oxidation approach for multifunctional Ti implants fabricated by additive manufacturing. Mater. Des. 2022, 221, 110962. [Google Scholar] [CrossRef]
- Jia, Z.; Xiu, P.; Li, M.; Xu, X.; Shi, Y.; Cheng, Y.; Wei, S.; Zheng, Y.; Xi, T.; Cai, H.; et al. Bioinspired anchoring AgNPs onto micro-nanoporous TiO2 orthopedic coatings: Trap-killing of bacteria, surface-regulated osteoblast functions and host responses. Biomaterials 2016, 75, 203–222. [Google Scholar] [CrossRef]
- Huang, D.; Lin, Q.X.; Zhou, Y.J.; Li, J.X.; Wei, Y.; Hu, Y.C.; Lian, X.J.; Chen, S.; Chen, W.Y. Ag nanoparticles incorporated tannic acid/nanoapatite composite coating on Ti implant surfaces for enhancement of antibacterial and antioxidant properties. Surf. Coatings Technol. 2020, 399, 126169. [Google Scholar] [CrossRef]
- He, G.; Guo, B.; Wang, H.; Liang, C.; Ye, L.; Lin, Y.; Cai, X. Surface characterization and osteoblast response to a functionally graded hydroxyapatite/fluoro-hydroxyapatite/titanium oxide coating on titanium surface by sol-gel method. Cell Prolif. 2014, 47, 258–266. [Google Scholar] [CrossRef]
- Xu, S.; Long, J.; Sim, L.; Diong, C.H.; Ostrikov, K. RF plasma sputtering deposition of hydroxyapatite bioceramics: Synthesis, performance, and biocompatibility. Plasma Process. Polym. 2005, 2, 373–390. [Google Scholar] [CrossRef]
- Shi, R.; Huang, Y.; Zhang, J.; Wu, C.; Gong, M.; Tian, W.; Zhang, L. Effective delivery of mitomycin-C and meloxicam by double-layer electrospun membranes for the prevention of epidural adhesions. J. Biomed. Mater. Res. Part B Appl. Biomater. 2020, 108, 353–366. [Google Scholar] [CrossRef]
- Wei, Z.; Tian, P.; Liu, X.; Zhou, B. Hemocompatibility and selective cell fate of polydopamine-assisted heparinized PEO/PLLA composite coating on biodegradable AZ31 alloy. Colloids Surfaces B Biointerfaces 2014, 121, 451–460. [Google Scholar] [CrossRef]
- Benzie, I.F.F.; Strain, J.J. The ferric reducing ability of plasma (FRAP) as a measure of “antioxidant power”: The FRAP assay. Anal. Biochem. 1996, 239, 70–76. [Google Scholar] [CrossRef]
- Sugano, M.; Tsuchida, Y.; Satake, T.; Ikeda, M. A microstructural study of fatigue fracture in titanium-molybdenum alloys. Mater. Sci. Eng. A Struct. Mater. Prop. Microstruct. Process. 1998, 243, 163–168. [Google Scholar]
- Júnior, J.R.S.M.; Nogueira, R.A.; de Araújo, R.O.; Donato, T.A.G.; Arana-Chavez, V.E.; Claro, A.P.R.A.; Moraes, J.C.S.; Buzalaf, M.A.R.; Grandini, C.R. Preparation and Characterization of Ti-15Mo Alloy used as Biomaterial. Mater. Res. 2011, 14, 107–112. [Google Scholar] [CrossRef]
- Ho, W.-F. A comparison of tensile properties and corrosion behavior of cast Ti-7.5Mo with c.p. Ti, Ti-15Mo and Ti-6Al-4V alloys. J. Alloys Compd. 2008, 464, 580–583. [Google Scholar] [CrossRef]
- Tang, J.; Luo, J.; Huang, Y.; Sun, J.; Zhu, Z.; Xu, J.; Dargusch, M.; Yan, M. Immunological response triggered by metallic 3D printing powders. Addit. Manuf. 2020, 35, 101392. [Google Scholar] [CrossRef]
- Wang, C.H.; Yang, C.D.; Liu, M.; Li, X.; Hu, P.F.; Russell, A.M.; Cao, G.H. Martensitic microstructures and mechanical properties of as-quenched metastable β-type Ti–Mo alloys. J. Mater. Sci. 2016, 51, 6886–6896. [Google Scholar] [CrossRef]
- Luo, J.; Huang, Y.; Xu, J.; Sun, J.; Dargusch, M.; Hou, C.; Ren, L.; Wang, R.; Ebel, T.; Yan, M. Additively manufactured biomedical Ti-Nb-Ta-Zr lattices with tunable Young’s modulus: Mechanical property, biocompatibility, and proteomics analysis. Mater. Sci. Eng. C 2020, 114, 110903. [Google Scholar] [CrossRef]
- Cheng, H. Additive Manufacturing and Mechanical Properties of Functionally Graded Medical Ti–35Nb–7Zr–5Ta Porous Scaffolds. J. Physics Conf. Ser. 2021, 1986, 012036. [Google Scholar] [CrossRef]
- Jamuna-Thevi, K.; Bakar, S.; Ibrahim, S.; Shahab, N.; Toff, M. Quantification of silver ion release, in vitro cytotoxicity and antibacterial properties of nanostuctured Ag doped TiO2 coatings on stainless steel deposited by RF magnetron sputtering. Vacuum 2011, 86, 235–241. [Google Scholar] [CrossRef]
- Labieniec, M.; Gabryelak, T.; Falcioni, G. Antioxidant and pro-oxidant effects of tannins in digestive cells of the freshwater mussel Unio tumidus. Mutat. Res. Toxicol. Environ. Mutagen. 2003, 539, 19–28. [Google Scholar] [CrossRef]
- Parashar, U.K.; Kumar, V.; Bera, T.; Saxena, P.S.; Nath, G.; Srivastava, S.K.; Giri, R.; Srivastava, A. Study of mechanism of enhanced antibacterial activity by green synthesis of silver nanoparticles. Nanotechnology 2011, 22, 415104. [Google Scholar] [CrossRef]

| Samples | σ0.2 (MPa) | UTS (MPa) | Elongation (%) | E (GPa) | Hardness (Hv) | Ref. |
|---|---|---|---|---|---|---|
| As-printed, dense | 816 ± 4.5 | 910 ± 9.3 | 19 ± 3.0 | 82.1 ± 2.5 | 391.9 ± 7.0 | This article |
| As-cast | 802 ± 3.3 | 905 ± 8.7 | 15 ± 5.0 | 78.3 ± 1.7 | 319.8 ± 7.9 | This article |
| Ti-15Mo (in situ alloyed by PBF-LB, 1100 °C treated) | 1170 ± 17 | 1180 ± 22 | 1.6 ± 0.2 | 86.3 ± 1.9 | 379.3 ± 13 | This article |
| Ti-15Mo | 584 | 934 | 14 | / | 321 | [66,67] |
| Ti-15Mo (cast) | 745 ± 13 | 921 ± 19 | 25 ± 2 | 84 ± 1 | 310 ± 10 | [68] |
| Structures | Tensile Tests Results | ||||
|---|---|---|---|---|---|
| RD | YS (MPa) | UTS (MPa) | ε (%) | E (GPa) | |
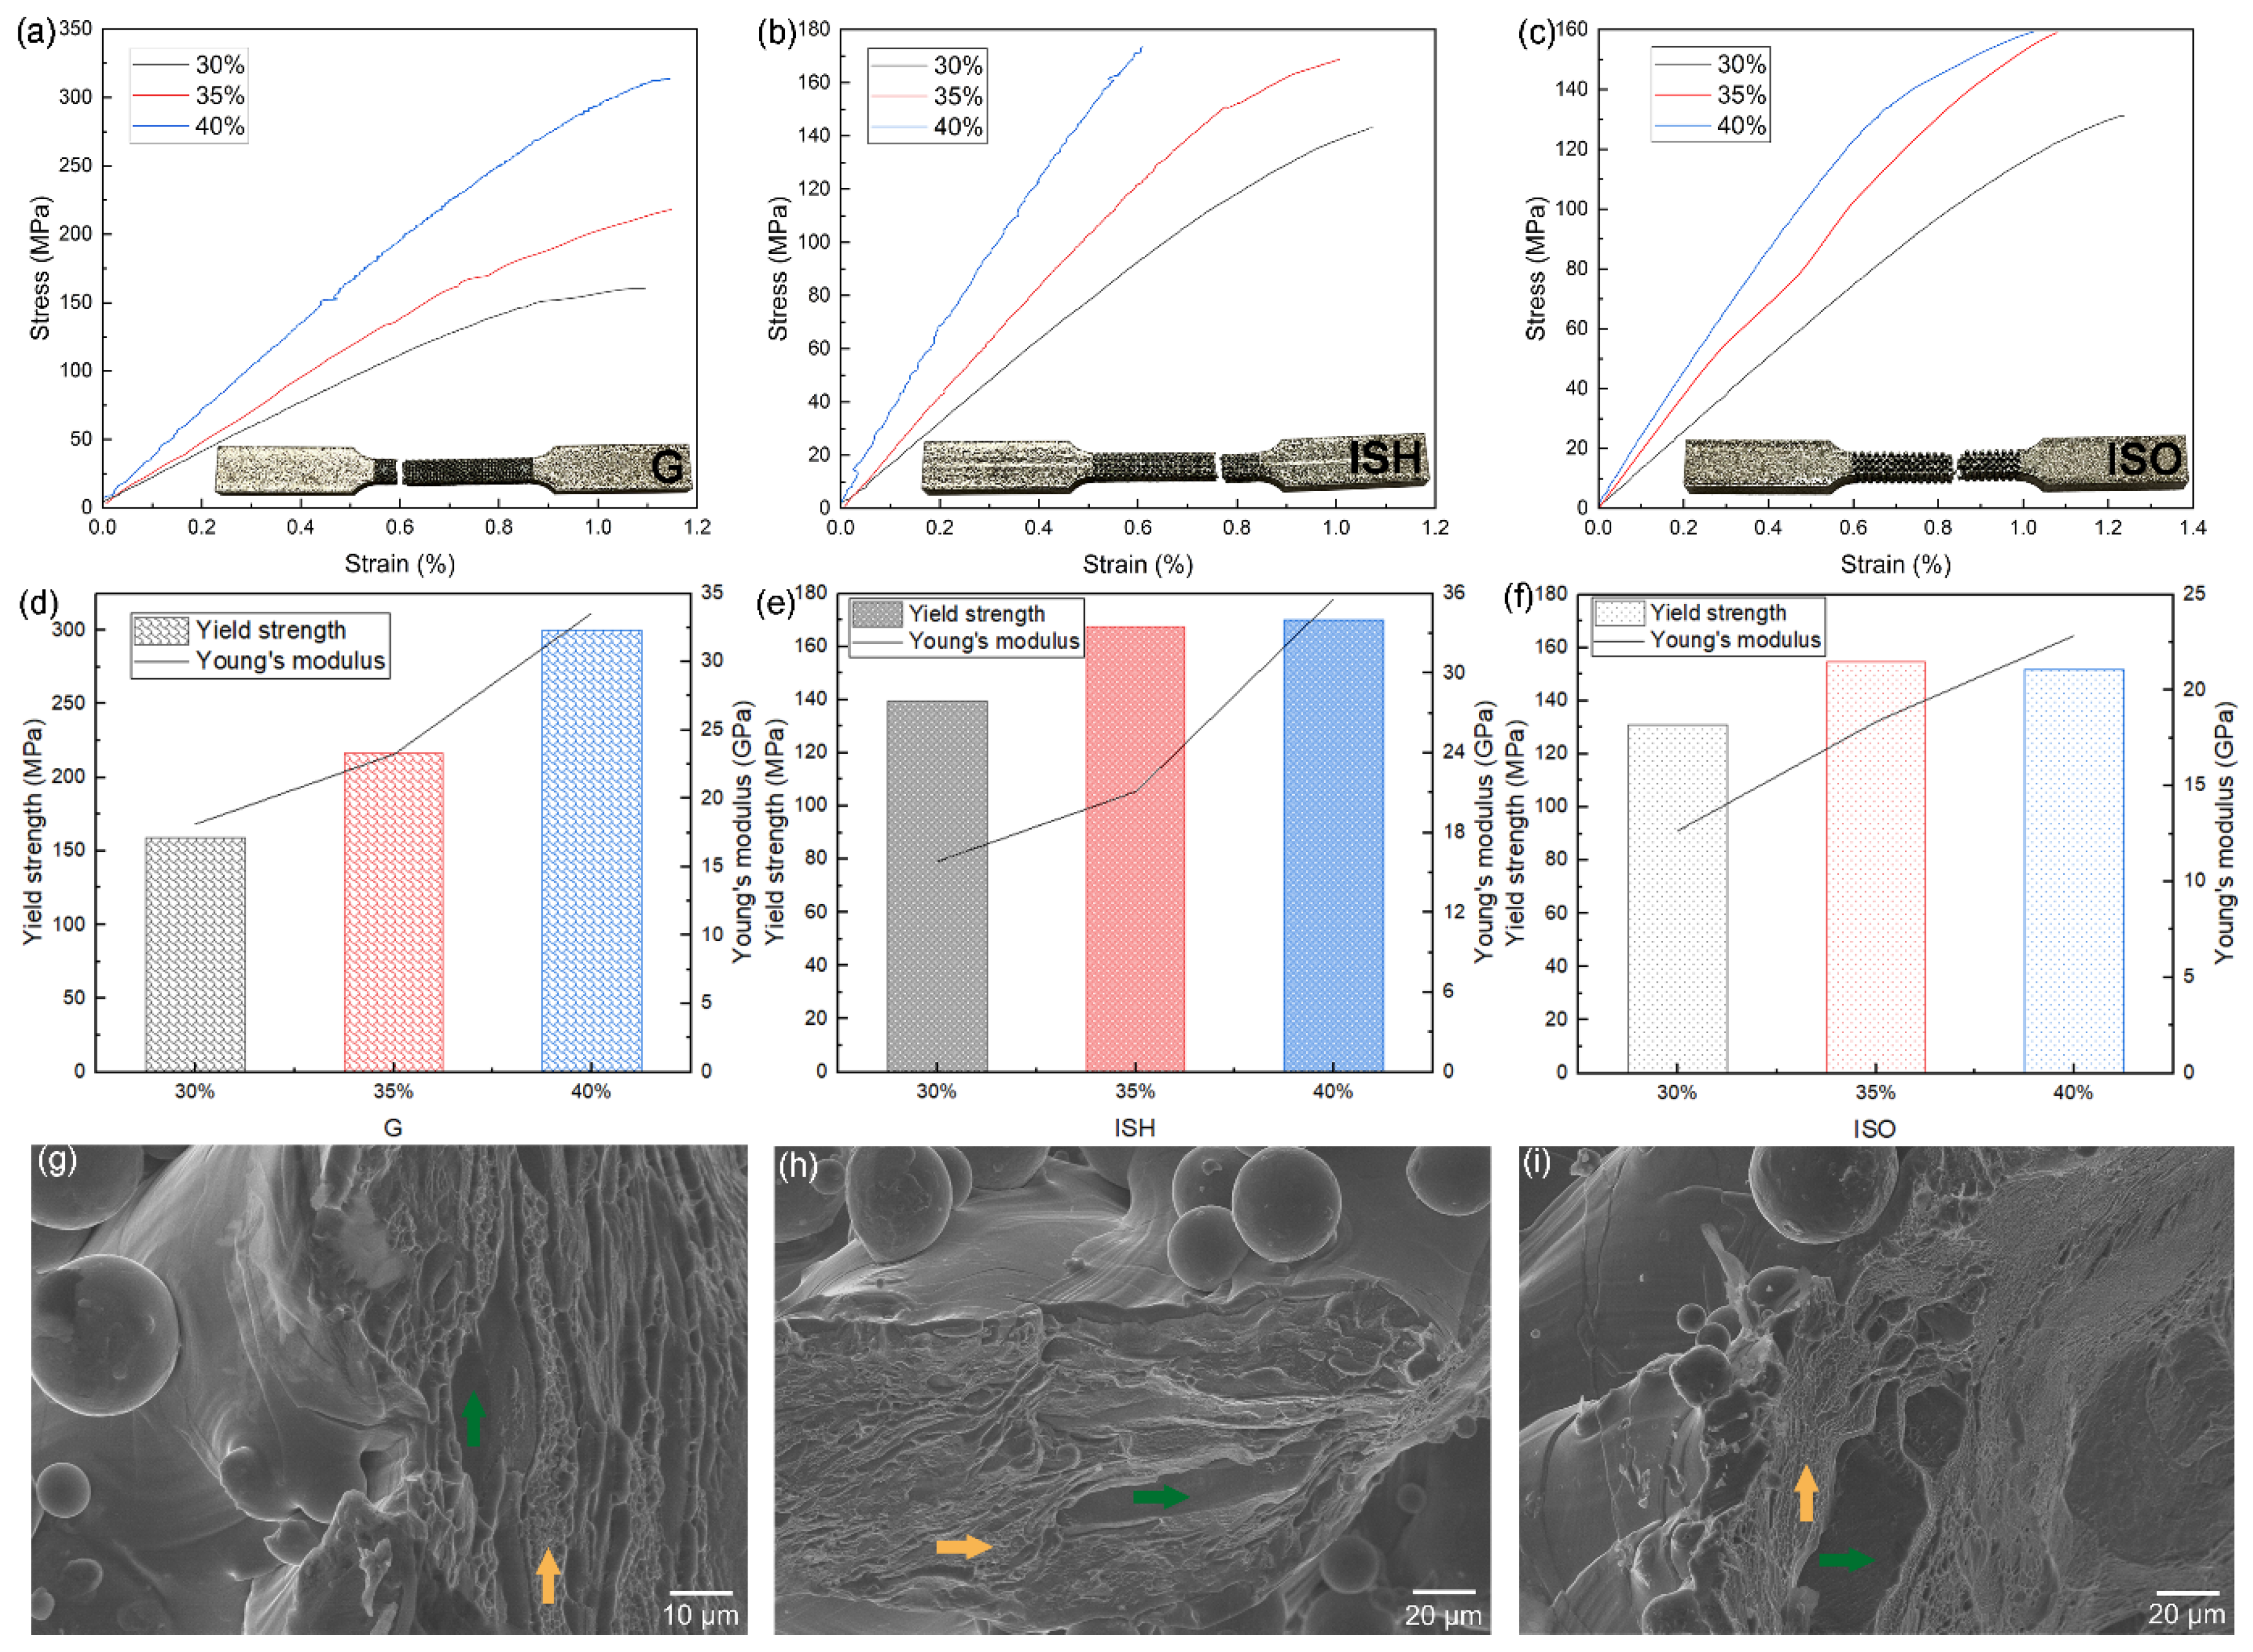
| G | 30% | 158.84 ± 2.62 | 160.10 ± 3.02 | 1.10 ± 0.12 | 18.16 ± 0.32 |
| 35% | 216.50 ± 4.17 | 217.98 ± 1.69 | 1.15 ± 0.17 | 23.24 ± 0.38 | |
| 40% | 300.11 ± 5.18 | 313.95 ± 2.66 | 1.15 ± 0.09 | 33.53 ± 0.45 | |
| ISH | 30% | 139.26 ± 3.31 | 143.04 ± 1.02 | 1.07 ± 0.07 | 15.80 ± 0.26 |
| 35% | 167.62 ± 1.44 | 168.73 ± 5.71 | 1.00 ± 0.04 | 21.10 ± 0.08 | |
| 40% | 170.04 ± 4.75 | 173.34 ± 2.54 | 0.61 ± 0.07 | 35.62 ± 0.17 | |
| ISO | 30% | 131.12 ± 5.29 | 131.21 ± 4.63 | 1.24 ± 0.10 | 12.65 ± 0.13 |
| 35% | 154.75 ± 3.85 | 158.96 ± 2.08 | 1.08 ± 0.06 | 18.38 ± 0.61 | |
| 40% | 151.85 ± 5.58 | 159.27 ± 0.94 | 1.02 ±0.11 | 22.84 ± 0.73 | |
| Structures | Compression Tests Results | ||||
|---|---|---|---|---|---|
| RD | σ0.2 (MPa) | Final Strength (MPa) | ε (%) | E (GPa) | |
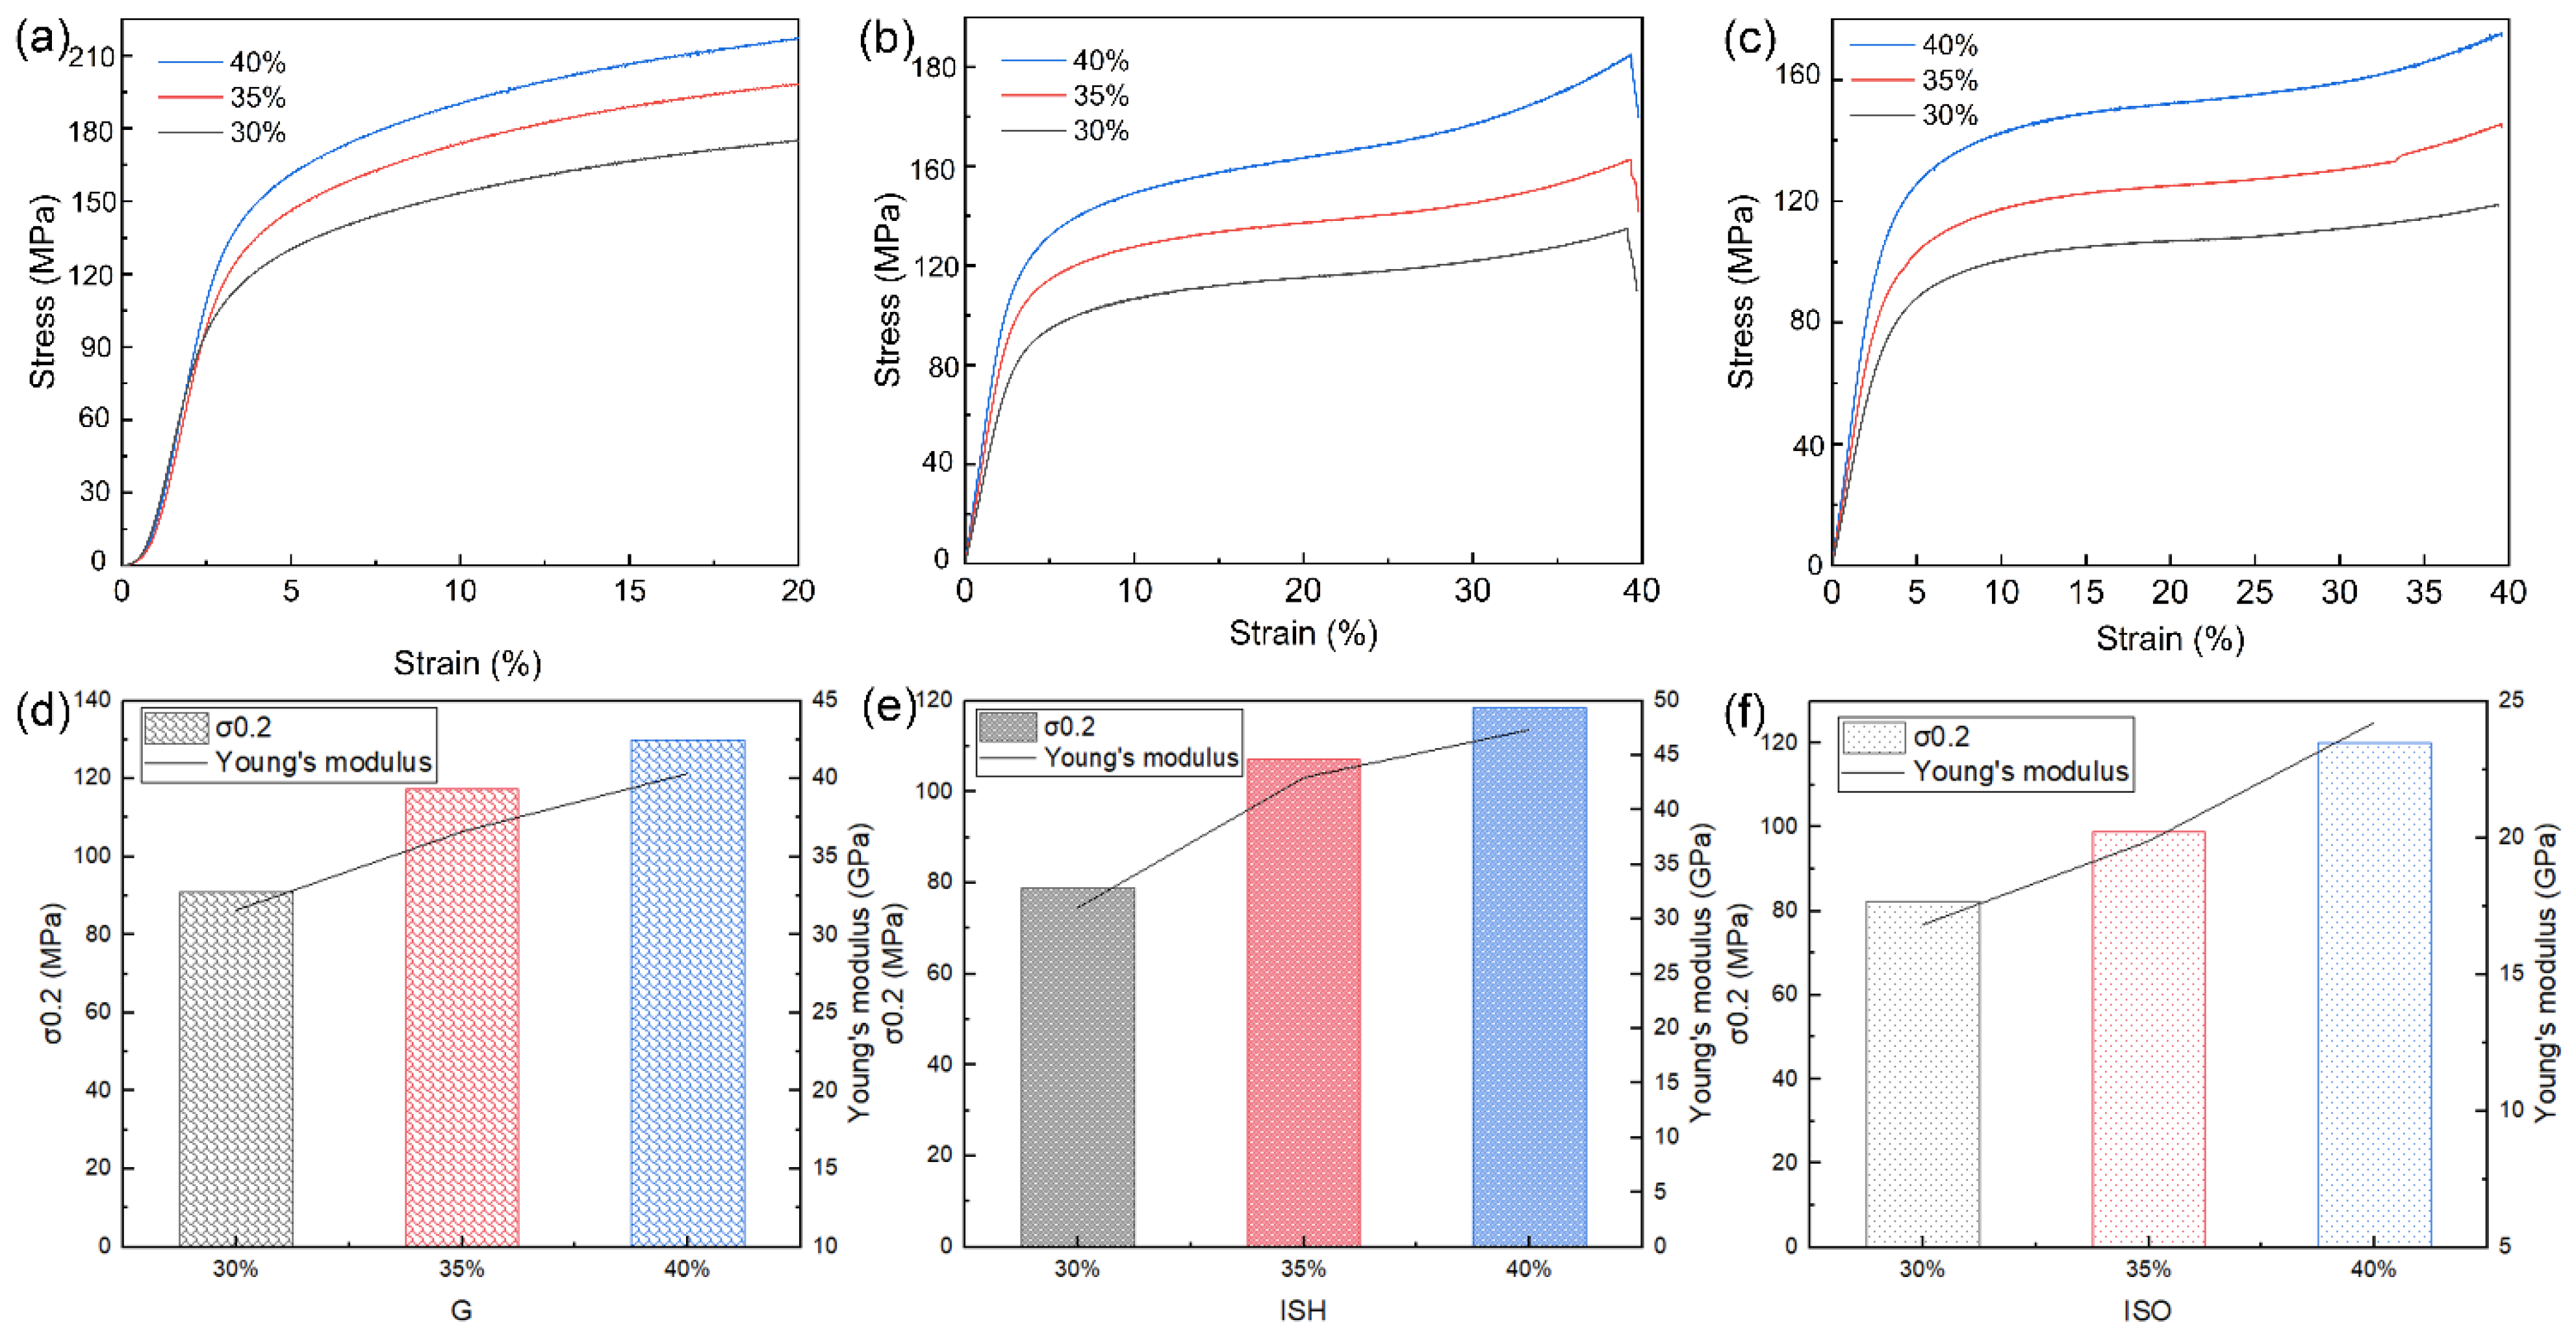
| G | 30% | 90.99 ± 2.11 | 167.85 ±3.24 | 20.2 ± 0.2 | 31.59 ± 0.26 |
| 35% | 117.40 ± 4.54 | 192.20 ± 4.72 | 20.1 ± 0.1 | 36.60 ± 0.07 | |
| 40% | 129.91 ± 2.86 | 213.62 ± 3.39 | 20.0 ± 0.2 | 40.37 ± 0.85 | |
| ISH | 30% | 78.82 ± 1.15 | 125.52 ± 2.13 | 39.3 ± 0.1 | 31.10 ± 0.06 |
| 35% | 107.10 ± 4.63 | 157.62 ± 2.41 | 39.3 ± 0.1 | 43.00 ± 0.73 | |
| 40% | 118.51 ± 3.75 | 183.83 ± 6.87 | 39.1 ± 0.3 | 47.3 ± 0.55 | |
| ISO | 30% | 82.31 ± 5.97 | 113.51 ± 2.24 | 39.2 ± 0.4 | 16.80 ± 0.34 |
| 35% | 98.92 ± 2.42 | 147.64 ± 4. 79 | 39.0 ± 0.2 | 19.90 ± 0.31 | |
| 40% | 120.10 ± 1.86 | 178.08 ± 4.58 | 39.0 ± 0.3 | 24.20 ± 0.17 | |
| Inhibition Zone/mm | G0.05 | ISH0.05 | ISO(M) |
|---|---|---|---|
| S. aureus | 0.75 ± 0.02 | 1.50 ± 0.01 | 0 |
| E. coli | 0.55 ± 0.01 | 1.00 ± 0.02 | 0 |
Disclaimer/Publisher’s Note: The statements, opinions and data contained in all publications are solely those of the individual author(s) and contributor(s) and not of MDPI and/or the editor(s). MDPI and/or the editor(s) disclaim responsibility for any injury to people or property resulting from any ideas, methods, instructions or products referred to in the content. |
© 2025 by the authors. Licensee MDPI, Basel, Switzerland. This article is an open access article distributed under the terms and conditions of the Creative Commons Attribution (CC BY) license (https://creativecommons.org/licenses/by/4.0/).
Share and Cite
Li, Z.; Xu, J.; Tang, J.; Sang, Z.; Yan, M. Additively Manufactured Biomedical Ti-15Mo Alloy with Triply Periodical Minimal Surfaces and Functional Surface Modification. Metals 2025, 15, 355. https://doi.org/10.3390/met15040355
Li Z, Xu J, Tang J, Sang Z, Yan M. Additively Manufactured Biomedical Ti-15Mo Alloy with Triply Periodical Minimal Surfaces and Functional Surface Modification. Metals. 2025; 15(4):355. https://doi.org/10.3390/met15040355
Chicago/Turabian StyleLi, Zerui, Jingyuan Xu, Jincheng Tang, Zhuo Sang, and Ming Yan. 2025. "Additively Manufactured Biomedical Ti-15Mo Alloy with Triply Periodical Minimal Surfaces and Functional Surface Modification" Metals 15, no. 4: 355. https://doi.org/10.3390/met15040355
APA StyleLi, Z., Xu, J., Tang, J., Sang, Z., & Yan, M. (2025). Additively Manufactured Biomedical Ti-15Mo Alloy with Triply Periodical Minimal Surfaces and Functional Surface Modification. Metals, 15(4), 355. https://doi.org/10.3390/met15040355