Article

Effect of Lead in Antimony and Tin Dissolution from Recycled Lead–Acid Battery Dross in Hydrobromic Acid Solution

by
Arturo Hirata-Miyasaki
* and
Corby G. Anderson
Kroll Institute for Extractive Metallurgy, Colorado School of Mines, Golden, CO 80401, USA
*
Author to whom correspondence should be addressed.
Metals 2025, 15(4), 356; https://doi.org/10.3390/met15040356
Submission received: 19 February 2025 / Revised: 19 March 2025 / Accepted: 21 March 2025 / Published: 24 March 2025
(This article belongs to the Special Issue Advances in Mineral Processing and Hydrometallurgy—3rd Edition)

Abstract

:
Demand and prices for antimony have increased over the last few years. Recycling supplied 15% of domestic consumption in the US, while the remaining 85% was imported. Hydrometallurgical processes have long used alkaline sulfide systems and hydrochloric acid, closing doors on new approaches. Bromine compounds have been recently used to recover PGMs and REEs successfully; thus, antimony leaching with bromine compounds is theoretically feasible. This research was conducted to develop a viable technology for hydrobromic acid between 50 °C and 70 °C as a leaching reagent on dross through single- and two-stage leaching using design of experiment (DoE) and adding sustainability to current industrial processes while minimizing waste products in recycling processes. The preliminary results showed that bromine, specifically hydrobromic acid, can be used as a leaching reagent for antimony dissolution. By decreasing the lead content in the solids and increasing the concentration, temperature, and reaction time, antimony leaching from the dross was increased from 20% to 50%. The findings, coupled with acid regeneration, can be implemented as an alternative to other reagents in industrial plants.

Graphical Abstract

1. Introduction

Current antimony global reserves can supply short-term demand for the United States, but the development of antimony recycling is necessary to reduce dependency on China’s antimony imports [1]. In the United States of America, many products are recycled, with car batteries being the most recycled. However, the focus of these plants is to recover lead, acid, and plastics, whereas strengthening and corrosion-resistant alloying metals, such as antimony, do not receive further treatment. While traditional pyrometallurgical and hydrometallurgical approaches have been widely used, the introduction of bromine-based lixiviants, particularly HBr, remains largely unexplored. This study focuses on the recovery of antimony from the byproducts of the recycling process, specifically dross from lead acid recycling plants using bromine compounds.
Lead dross, a byproduct of lead smelting and refining, contains valuable metals such as lead, tin, and antimony. Traditional processing methods rely on pyrometallurgy for high-temperature oxidation and reduction. Glencore’s Nordenham plant has upgraded its process by using a Top-Submerged Lance (TSL) smelting furnace coupled with a Side-Blown Furnace (SBF) to treat lead-rich slag and dross. These pyrometallurgical stages have allowed for an increase in metal recovery [2]. However, hydrometallurgical techniques have gathered interest as a better alternative due to their capabilities for selective leaching and refining, and are viewed as a greener alternative. Recent advancements have significantly improved the efficiency, selectivity, and environmental sustainability of these methods. Drzazga and Ciszewski discovered that hydrometallurgical methods have enabled the recovery of valuable elements, such as germanium, that in some cases are lost in pyrometallurgical routes [3].
Antimony has been traditionally recovered through pyrometallurgical processes. Volatilization is used for low-grade sulfide ores (5–25% antimony) to produce antimony trioxide, which is later reduced in reverberatory furnaces to obtain antimony metal; intermediate-grade (25–40% antimony) ores go through blast furnace smelting to produce antimony metal; and rich-grade (45–60% antimony) ores are treated through iron precipitation to form iron sulfide and antimony metal [4].
Hydrometallurgy is advantageous because it can treat simple antimony feeds as well as complex ones. There are two main processes, followed by electrodeposition or precipitation. In summary, the first one uses an alkaline sulfide system (sodium sulfide and sodium hydroxide). Sodium sulfide (Na2S) forms sodium thioantimoniate in solution and is later treated with a sodium polysulfide (Na2S2) formed when combining sodium hydroxide and elemental sulfur (Equations (1) and (2)). The second method uses hydrochloric acid (HCl) or ferric chloride to form antimony chloride. The solution containing the chloride complex is further refined through electrowinning to produce the antimony metal (Equations (3) and (4)).
3Na2S + Sb2S3 (stibnite) = 2Na3SbS3
Na3SbS3 + Na2S2 = Na3SbS4 + Na2S
Sb2S3 + 6HCl = 2SbCl3 + 3H2S
Sb2O3 (valentinite) + 6HCl = 2SbCl3 + 3H2O
In 2021, Palden and Machiels used HCl and ethanol to demonstrate that antimony can be selectively leached from lead-rich dross with minimal lead dissolution. In the processes, the antimony-bearing feed dissolved into the solution while the lead remained as insoluble PbCl2, achieving 90% antimony dissolution with only 0.4% of lead co-dissolved [5]. At the same time, Kim proposed a pyro-hydrometallurgical flowsheet to selectively recover Pb, Sn, and Sb from the lead-refining dross [6]. The pyrometallurgical process consisted of air oxidation followed by sulfuric acid sulfate roasting to convert lead into its oxidized form and isolate the antimony. Subsequently, leaching and selective precipitation were employed to recover each metal, achieving 95.4% and 86.3% of tin and antimony recovery from the dross, respectively.
Although significant progress has been made in lead dross processing over the last couple of years, pyrometallurgical and hydrometallurgical advancements have made use of the same reagents to increase the recovery of metals like antimony and tin [7,8]. However, some reagents have yet to be studied in depth to fully understand their capabilities and potential to selectively and effectively recover antimony from lead dross, as is the case for bromine compounds.

2. Hydrobromic Acid

Bromine is a great oxidizer that has been studied for the recovery of rare earth elements through bromination, in addition to the search for new alternatives for the recovery of precious metals [9,10,11,12,13,14,15,16,17]. In 1964, Sullivan and Cattoir prepared a high-purity vanadium metal by electrorefining commercial vanadium in a molten sodium bromide, potassium bromide, and vanadium dibromide electrolyte. Bromide electrolytes were used because of their low operating temperatures and the possibility of electrorefining vanadium to a lower iron and oxygen content [18]. In 1982, Groves and Beasley used bromine chloride for cyanide destruction. Although chlorine oxidation was effective in destroying the CN ion, excess chlorine was needed to drive the reaction to completion [19]. In 2020, Varvara, Dornanu, and Hao’s leaching on waste-printed circuit board material on a bromine-based (potassium bromide, sodium bromide, liquid bromide, and hydrobromic acid) system provided an alternative for lixiviants in the hydrometallurgical route of metal recovery, for which we believe that an alternative lixiviant for antimony can be found in hydrobromic acid [20,21].
Hydrobromic acid (HBr) is one of the strongest mineral acids known, but there are few to no records showing the potential of HBr as a leaching reagent, especially for antimony [22,23]. Hydrochloric acid has been widely used as a reagent for antimony and tin, and limited work has been carried out on HBr as a leaching reagent for antimony and tin. Thus, developing a technology that utilizes HBr for antimony and tin is important.
Since bromine and chlorine are both halogens, we can assume that HBr and HCl behave similarly, as they can form a compound with antimony (Figure 1 and Figure 2). We can replace HCl with HBr and obtain Equations (5)–(8).
Sb2S3 + 6HBr (g) = 2SbBr3 + 3H2S (g)
Sb2O3 + 6HBr (g) = 2SbBr3 + 3H2O
Sn + 2HBr (g) = SnBr2 + H2 (g)
SnO2 + 4HBr (g) = SnBr2 + H2O + 2Br
From the figures, the formation of antimony tribromide (SbBr3) seems to be stable in solution at pH ranges of 0 to 2 and Eh (V) ranges of 0 to 0.7 V. For tin, the formation of stannic bromide or tin (IV) bromide (SnBr4) seems stable in solution at pH ranges of 0 to 1.75 and Eh (V) ranges of 0.25 to 0.75 V. These ranges are key for the formation of the complexes and should be kept in mind. Although the formation of antimony–bromide complexes can form, lead is still one of the main elements that reduces the amount of available bromide ions and bromine to obtain a higher recovery of antimony. Figure 3 demonstrates the theoretical effect of lead in the dissolution of antimony.

3. Materials and Methods

While developing the procedure, the focus was on testing scenarios that would represent the general behavior of antimony in hydrobromic acid (HBr). The chosen variables were temperature, residence time, acid concentration, and liquid-to-solid ratio (Table 1). A second set of experiments was designed to determine the effect of hydrobromic acid (HBr) (MilliporeSigma, Burlington, MA, USA) on the sample after initially treating it with nitric acid (HNO3) (MilliporeSigma, Burlington, MA, USA) to remove part of the lead content (Table 2). The quantitative analysis of this material prior to treatment is presented in Table 3.
Additionally, the sample was sent for mineral characterization. 
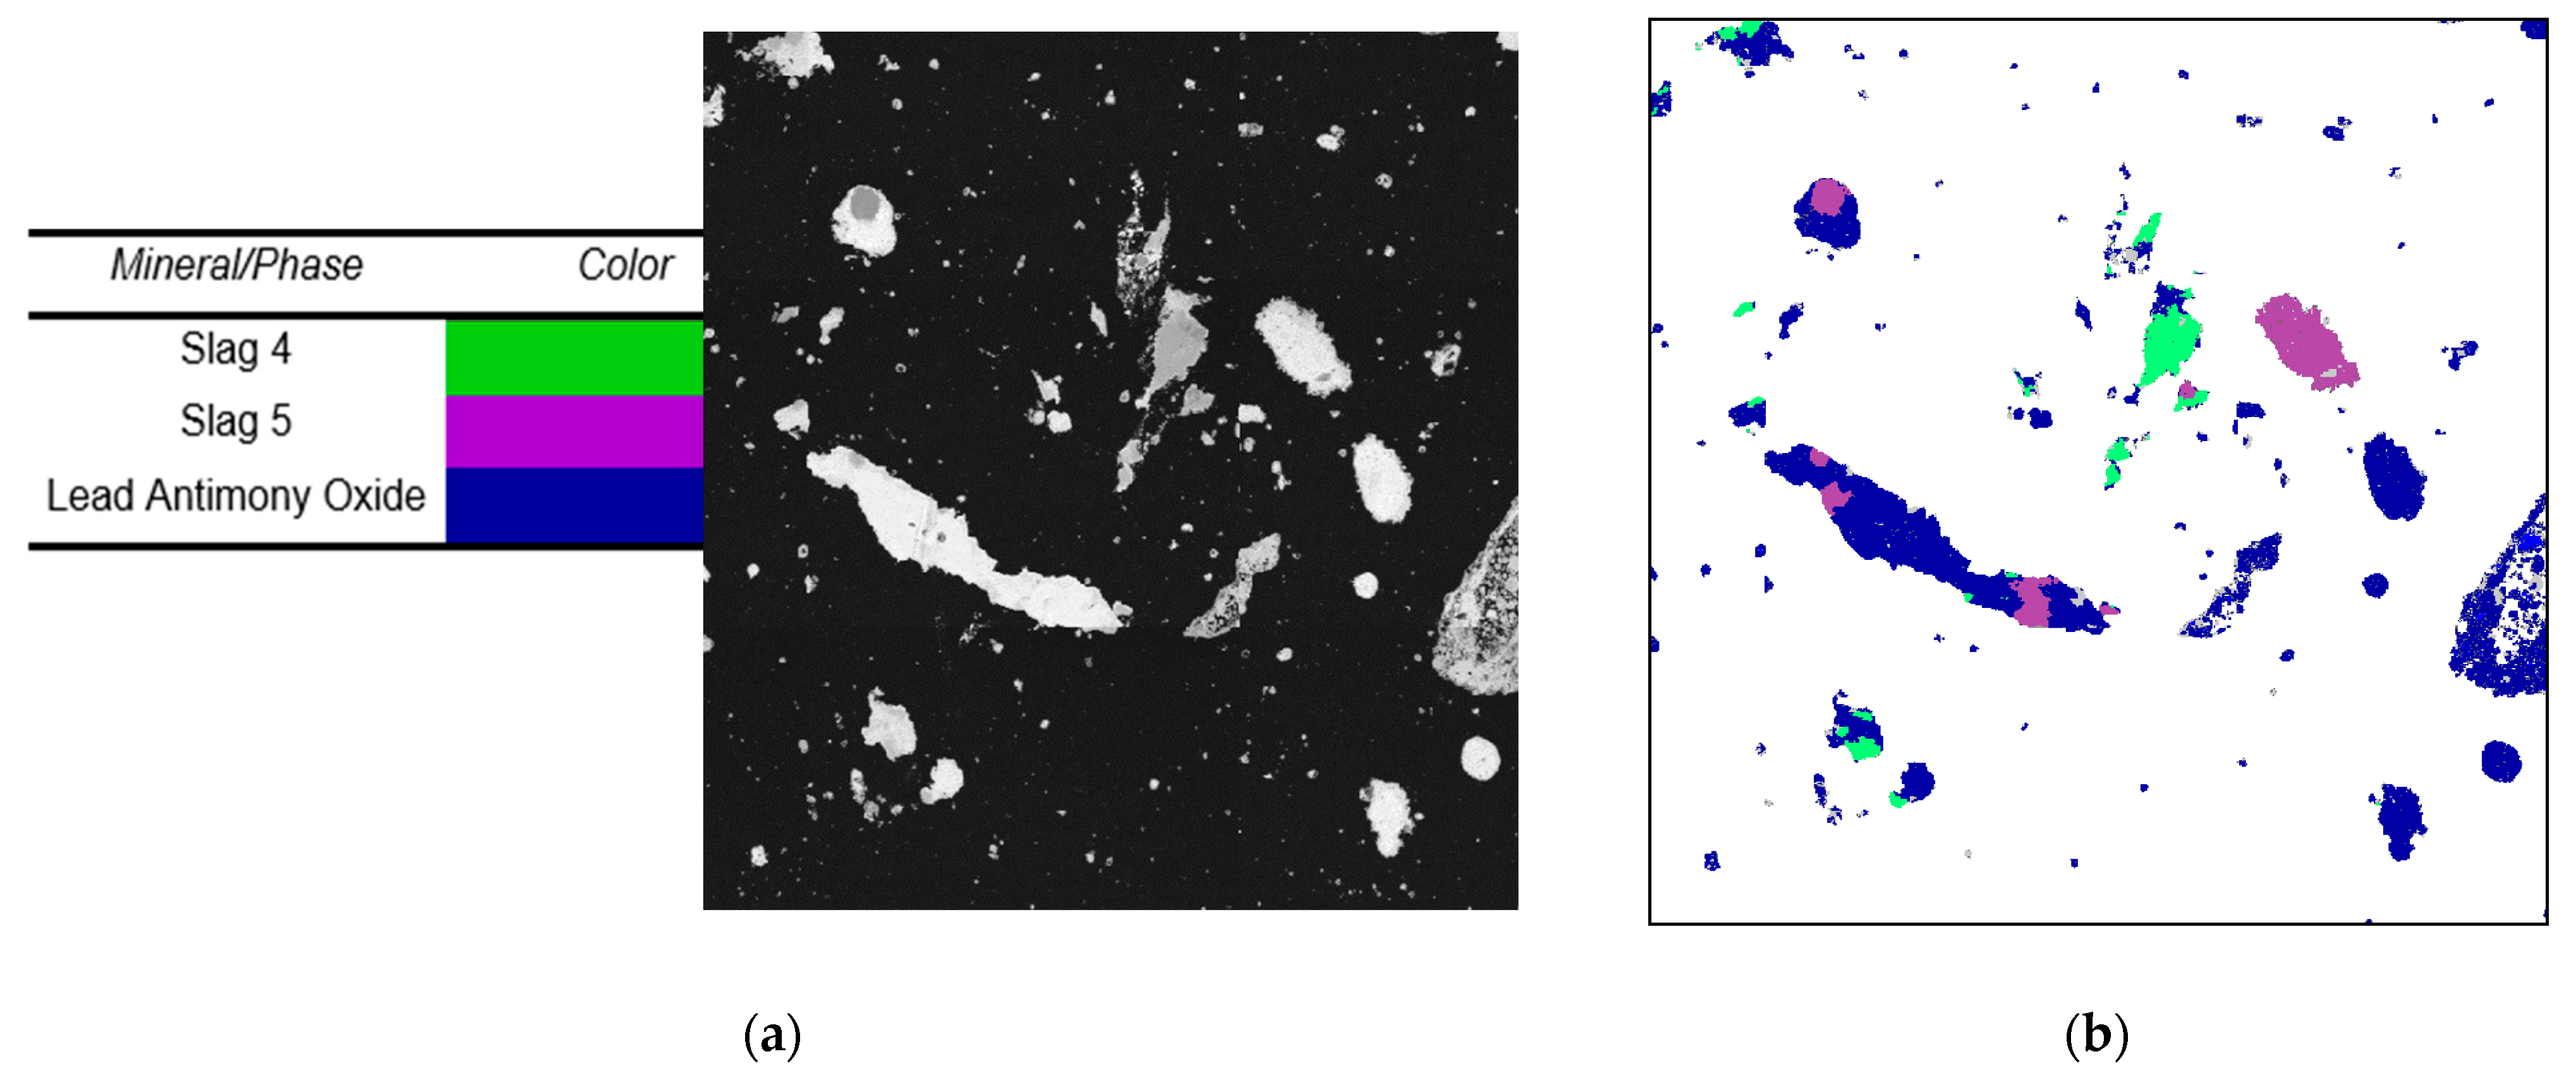
Figure 4 shows the backscatter images received from the SEM and AMICS (Automated Material Identification and Classification System) for the sample. The SEM and AMICS reports received labeled two multi-element phases as slag 4 and 5 due to how complex the samples received were. When comparing the SEM, AMICS, and safety data sheet provided by the supplier, we were able to determine that the phases for lead, tin, and antimony are lead monoxide (PbO), tin oxide (SnO), and antimony trioxide (Sb2O3).
Detailed information on the slag phase composition can be found in Table 4, which allows us to see that most elements are in an oxide phase.
The bulk samples from the lead–acid battery recycling plant were crushed in a Massco single-toggle jaw crusher (Mine & Smelter Supply Co., Denver, CO, USA) for each experiment to a particle size of <2 cm, ground with a Bico VP-1989 ring (BICO Inc., Burbank, CA, USA), puck pulverizer to a particle size < 150 μm, and separated by particle size utilizing a Tyler RX-29 mechanical sieve shaker (W.S. Tyler, Mentor, OH, USA). Then, the samples were carefully split into smaller sample sizes adequate for one leach test. Solutions were prepared for the leaching test. The first leach test solutions were prepared from ACS 48% HBr diluted with di-ionized water. The second leach test solutions were prepared from ACS 68% HNO3 diluted with di-ionized water. The solution was then added to the beaker and heated to the appropriate temperature.
For the first set of experiments, a total volume of 250 milliliters of hydrobromic acid was added to a 500 mL beaker and heated on a hot plate to the appropriate temperature (Table 1). Additionally, a magnetic stirring bar was used to agitate the solution to 400 RPM, which was monitored throughout the test. Once the temperature had been reached, the appropriate solids were added to the hot solution. The beaker was then sealed from the top and the leaching timer was started. Upon completion, the beaker was removed from the hot plate and the leach slurry was filtered and measured volumetrically while the solids were rinsed with di-ionized water, dried to remove excess moisture, and carefully weighed.
For the second set of experiments, a total volume of 250 milliliters of nitric acid was added to a 500 mL beaker and heated in a hot plate to the appropriate temperature with a magnetic stirring bar to agitate the solution to 400 RPM (Table 2). Once the temperature had been reached, 10 g of solid feed was added to the hot solution. The beaker was then sealed from the top and the leaching timer for 2 h was started. Once the two hours had passed, the beaker was removed from the hot plate and the leach slurry was filtered and measured volumetrically while the solids were rinsed with di-ionized water, dried to remove excess moisture, and carefully weighed. Once the solids were completely dried, we split the solids to have a representative sample of 0.5 g for elemental analysis while the rest went on to the next acid stage.
To continue the second set of experiments, the same procedure presented in the nitric acid stage was used; however, we changed the acid from nitric acid to hydrobromic acid and the concentrations used.
One of the best ways to represent the behavior of antimony in hydrobromic acid was to perform a design of experiment (DoE). The first set of experiments consisted of a total of 40 laboratory experiments (
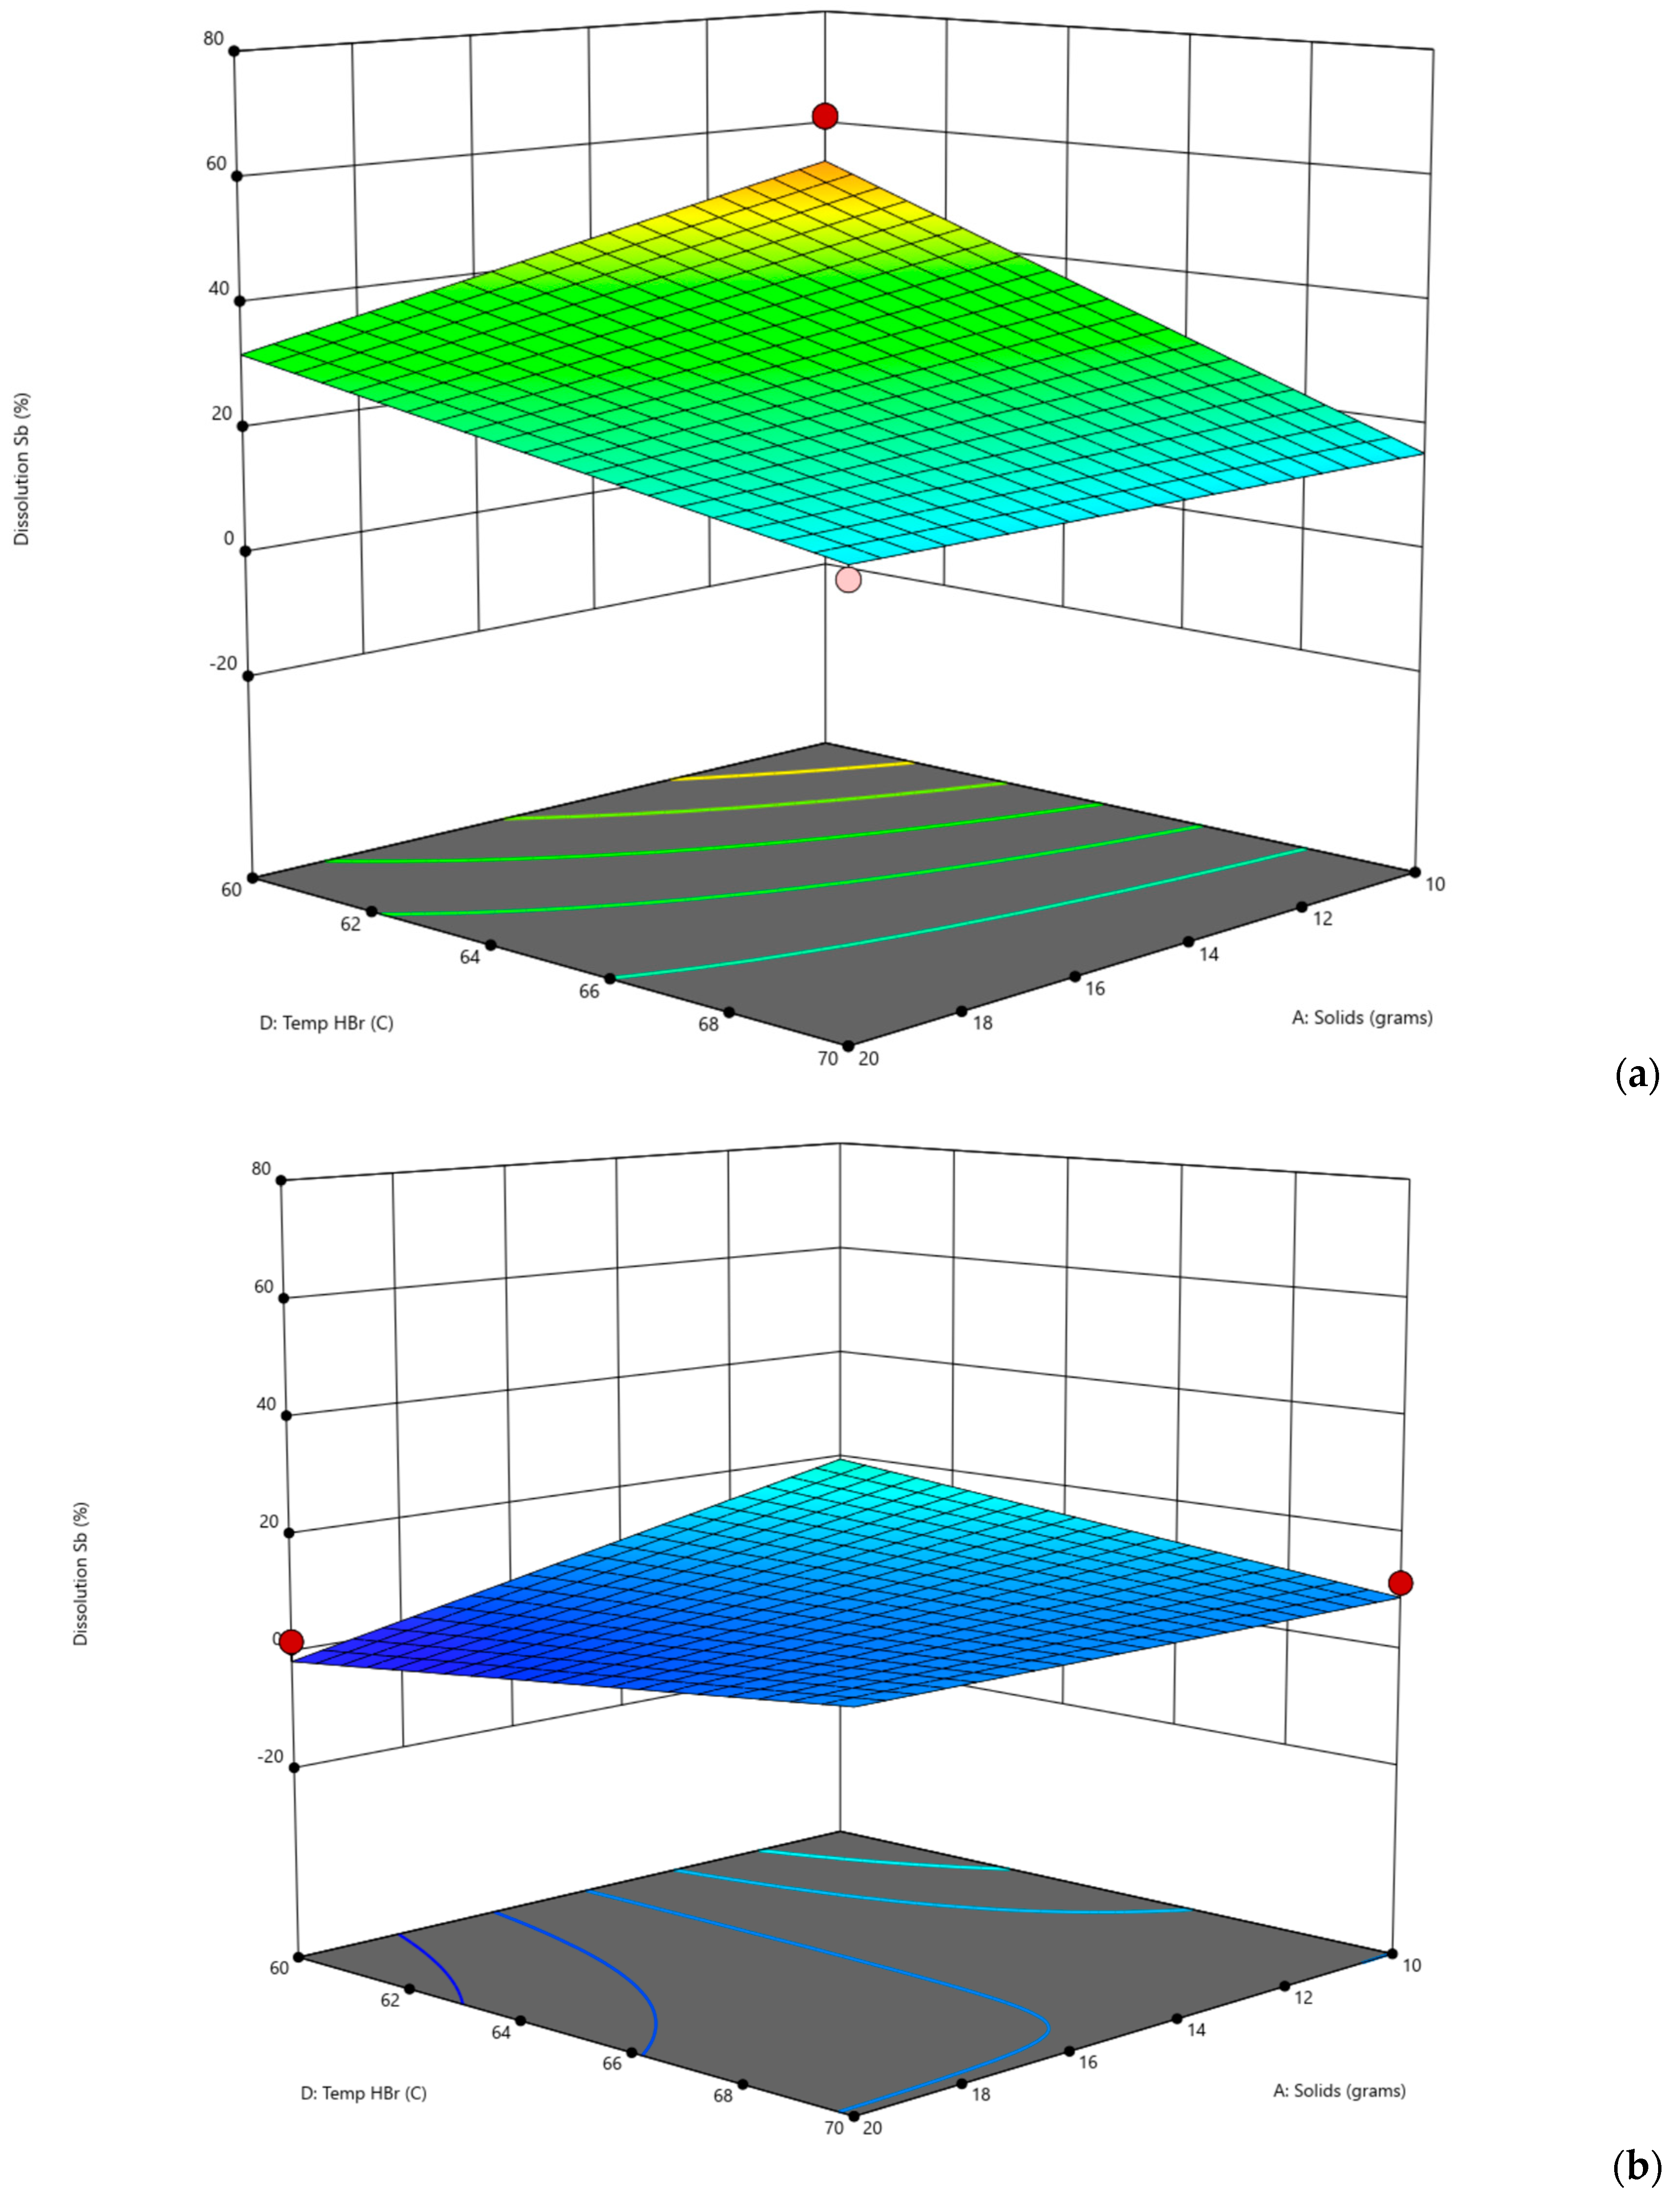
Table 5). For the DoE, temperatures of 50 °C, 60 °C, and 70 °C were selected to avoid higher temperatures; reaction times of 1, 2, and 3 h were selected for shorter times and test reaction rates; HBr concentrations of 0.5 M, 0.75 M, and 1 M were selected; however, there is a lack of studies with hydrobromic acid as a leaching reagent, for which we decided to use a slightly wider range of concentrations.
The second set of experiments consisted of a total of 16 laboratory experiments (
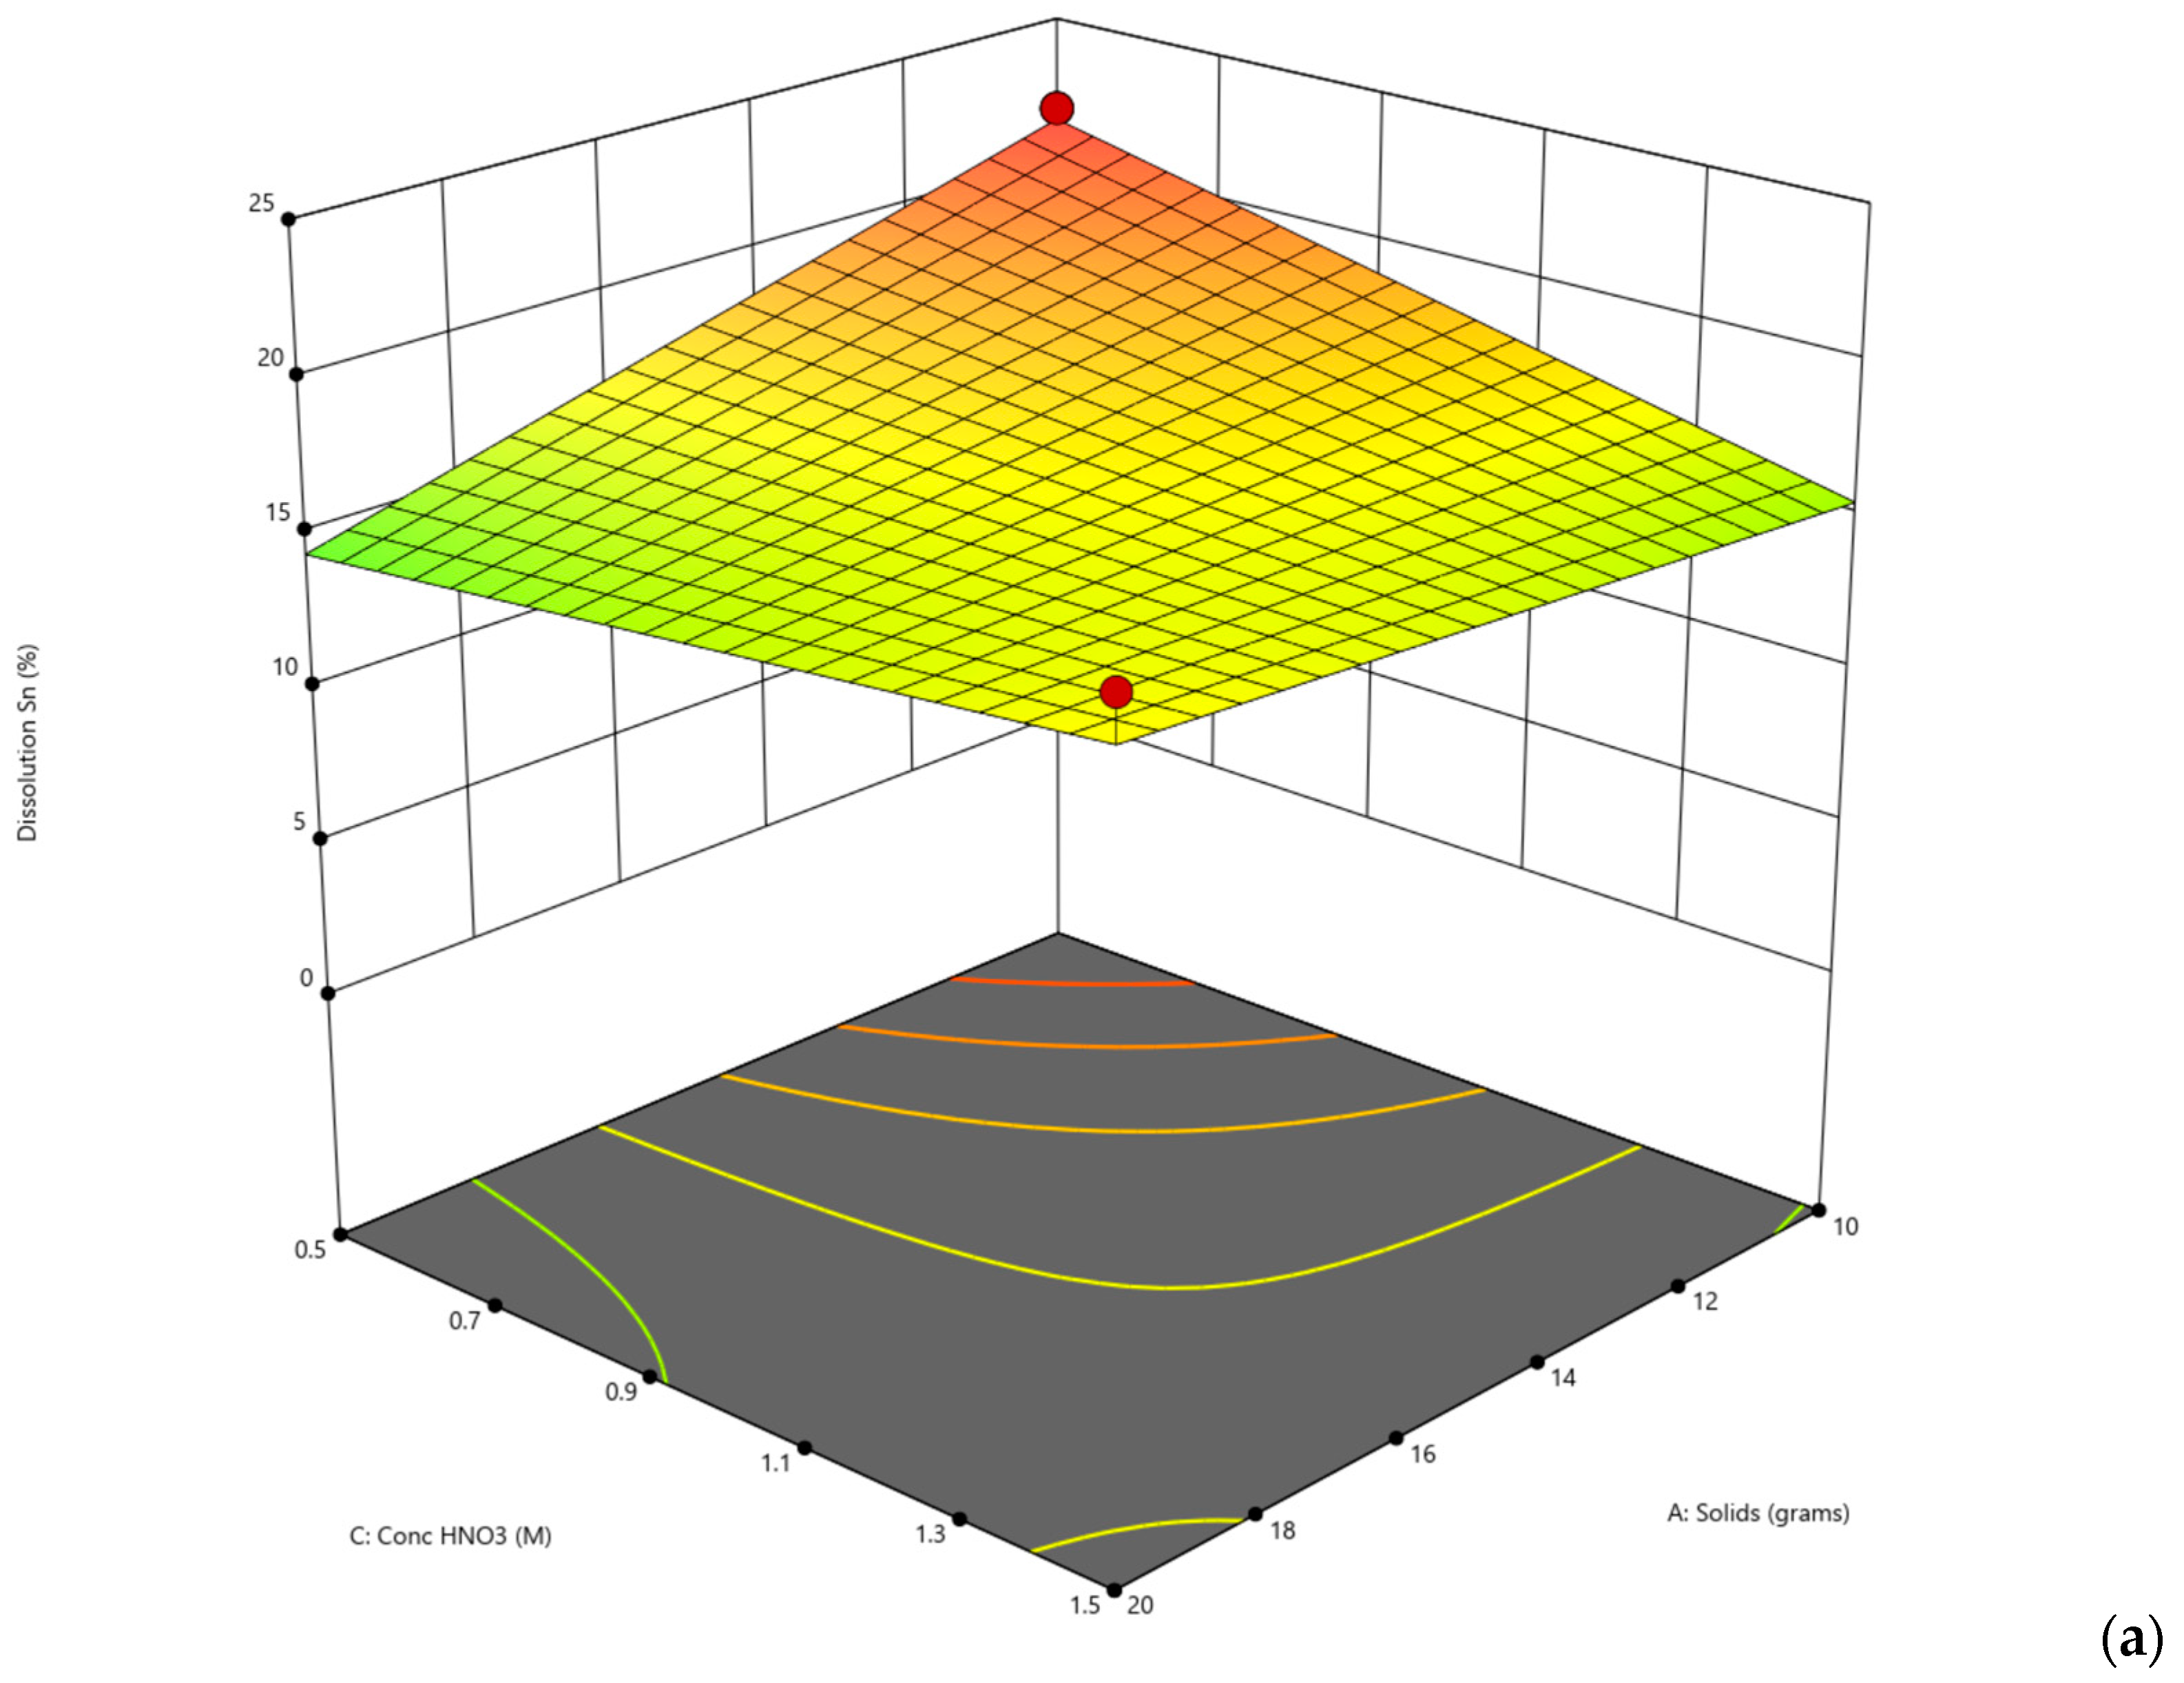
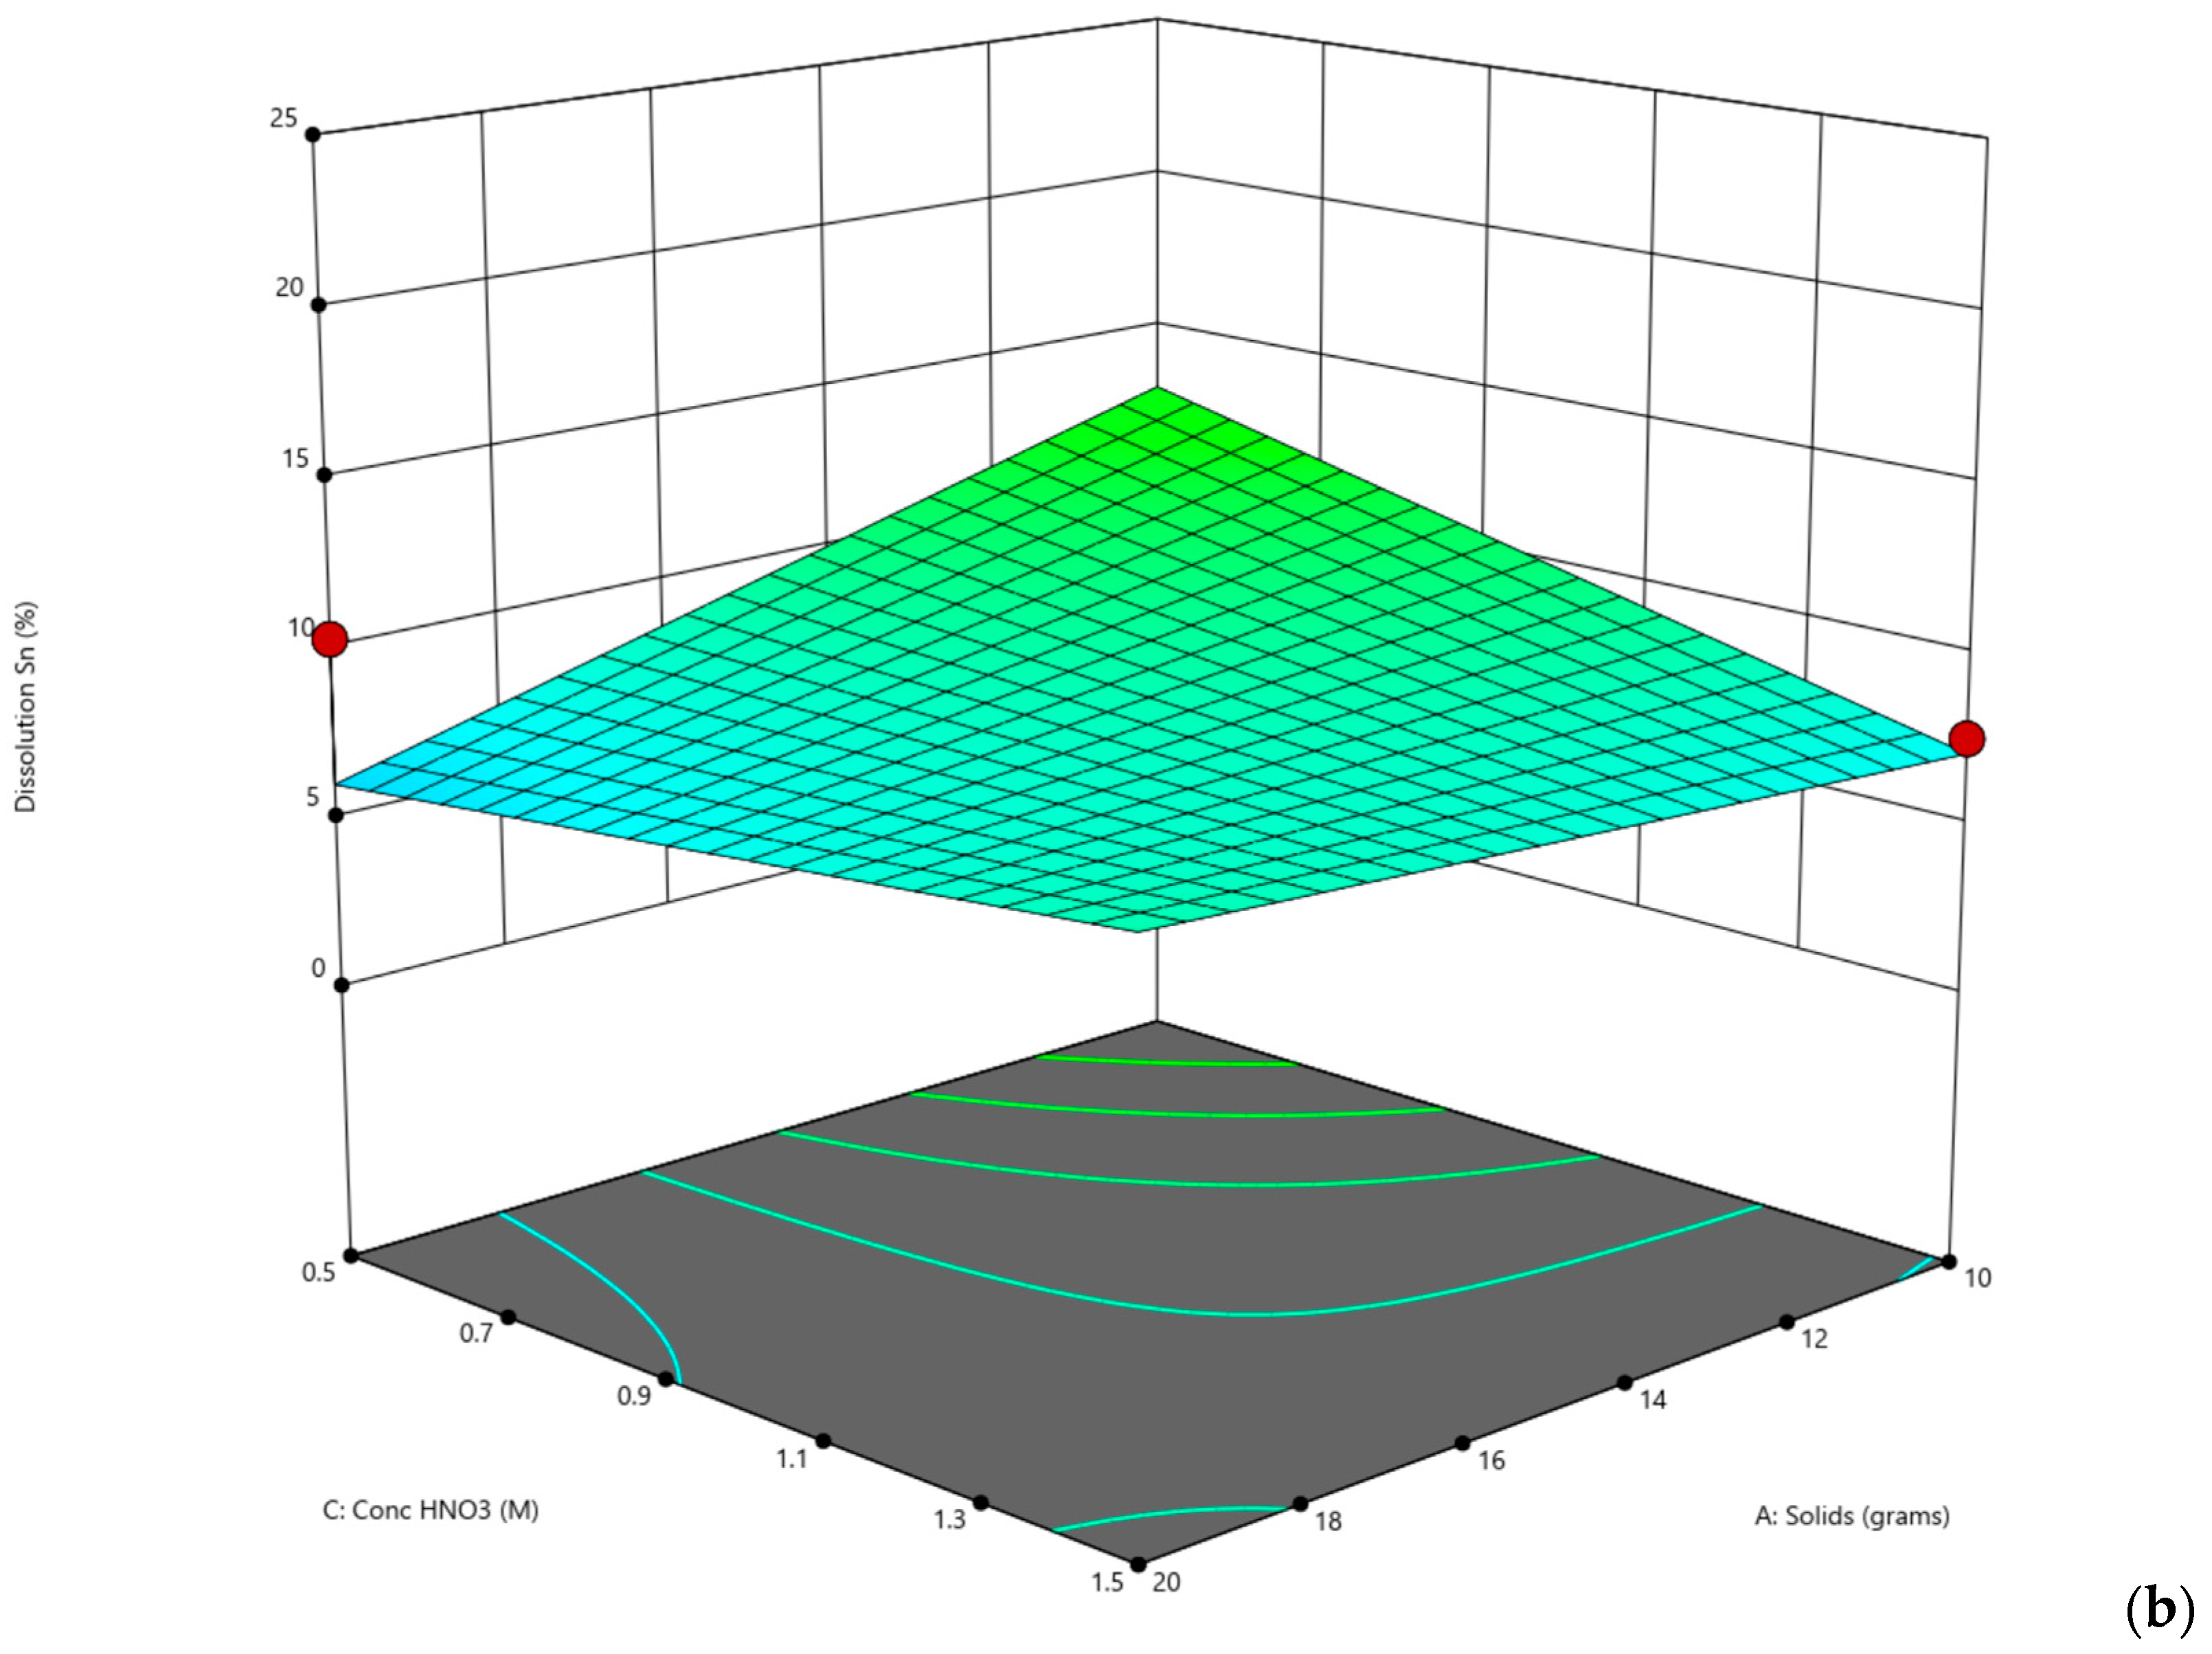
Table 6). For the DoE, the level in each variable was reduced from 3 to 2. The nitric acid values for both temperature and concentration were selected from Ichlas’ paper on selective nitric acid leaching [24]. The hydrobromic acid values for temperature were selected based on the first set of experiments since they yielded better results, while the concentration selected was higher, since not much antimony was dissolved into the solution.

3.1. Digestion Method for Elemental Analysis

The samples were dissolved using a two-acid method or aqua regia (3-part HCl and 1-part HNO3). The process involved 0.5 g of the desired dry sample to be analyzed in a Teflon beaker. To ensure the best dissolution of the samples, two digestion cycles were used, with less than 0.05 g left behind as solids. For the first cycle, 24 mL of HCl (37% w/v) and 8 mL of HNO3 (69% w/v) were added to the beaker with the sample and heated at 100 °C for 30 min on a hot plate. The open surface of the beaker was covered during the heating process with a glass watch to minimize the evaporation and release of toxic gases. Once 45 min had passed, the second cycle was started by adding 12 mL of HCl (37% w/v), 4 mL of HNO3 (69% w/v), and 5 mL of deionized water to the beaker. The solution was covered again with the glass watch and heated to 100 °C for 45 min. To finish, the solution was cooled to room temperature and filtered to remove any undissolved particles in case there were some left. The filtered solution was collected in a 50 mL vial after recording the mass to be used in the dilution section.

3.2. Elemental Analysis

Atomization and absorbance measurements of the diluted solutions were performed with a PerkinElmer PinAAcle 900F Spectrometer (PerkinElmer Inc., Waltham, MA, USA) according to the user manual provided by the company. Each element has a characteristic concentration and linear range. For antimony, the range was established at 1–45 ppm. For lead, the range was established at 1–40 ppm. Finally, the tin was established at 1–400 ppm. To ensure the reproducibility and reliability of the results, the equipment was calibrated before each measurement cycle. The diluted solutions were run five times with a 2 s delay between each measurement, rejecting any value with a relative standard deviation (%RSD) greater than 2%, which was given by the instrument’s software.

4. Results

Antimony bromide and tin bromide stable complex formation in solution required narrow Eh and pH values for them to happen. Table 7 and Table 8 demonstrate such values through HBr leaching during their trial from the DoE. In single-stage HBr leaching, the final Eh decreases slightly while the pH increases compared to the initial values. In the two-stage HBr leaching, the same behavior can be observed. The final Eh decreases slightly while the pH increases compared to the initial values. The values do not change dramatically and are still within the ranges for which the stable complexes can form in solution. We are aware that human and equipment errors influence the data recorded, which should be kept in mind, but the difference between readings is not significant enough to be a concern.

4.1. Single-Stage Acid Leach

4.1.1. Effect of Hydrobromic Acid

The dissolution of antimony and tin was significantly determined by the hydrobromic acid concentration. As we increased the acid concentration, the antimony dissolution increased as the temperature increased at intervals of 50 °C, 60 °C, and 70 °C. The antimony dissolution greatly increases at 1 M compared to 0.5 M and 0.75 M because there are more bromine ions and bromine available to form the SbBr3 complex [25]. The highest dissolution achieved was 21.48% under the conditions of 1 M and 3 h. The initial antimony grade was 3.2%, which is low, and achieving 21.48% recovery makes this process unfeasible due to the low recovery. Additionally, longer leaching times were not evaluated in this project, but there is a high possibility that the recovery of antimony would not surpass 30% recovery due to the amount of lead present in the system. Although the formation of antimony–bromide complexes had only a small area in the Pourbaix diagrams above, lead was still one of the main elements that reduced the amount of available bromide ions and bromine to obtain a higher recovery of antimony.
In terms of tin, the increase in bromine increased the dissolution of tin. The highest recovery of tin was 17.56% at 1 M of HBr at 3 h. This is lower than antimony’s highest recovery, but this can be explained by the solubility of tin. Due to the high content of bromine, tin is assumed to be dissolved into tin–bromide complexes. Consequently, it is likely that a tin–bromide complex or antimony–bromide complex precipitated out of the solution and was lost during the filtration process, resulting in lower dissolution rates.

4.1.2. Effect of Temperature

Given that the boiling point of hydrobromic acid is 122 °C, the temperatures chosen in this study were lower than 122 °C in order to prevent the excessive loss of bromine, as the reaction is exothermic; thus, 50 °C, 60 °C, and 70 °C were chosen to perform the leaching experiments. Generally, the behavior was largely the same as the effect of acid concentration. In antimony, the increase in temperature gradually increases the dissolution rate with longer times. However, at a temperature of 70 °C, the dissolution of antimony at 1 h is lower at 12.48% compared to the 1 M of HBr at 1 h at 14.20%, but the dissolution is higher at a temperature of 50 °C at 8.64% compared to the 0.5 M of HBr at 1 h at 7.69%. This could be because when the solids come into contact with the acid, the high acid concentration has a faster reaction rate than high temperatures, but the lower high temperature has a faster reaction rate than the lower acid concentration. Additionally, at a temperature of 50 °C, the dissolution of antimony after 3 h starts to slow down, but this is not as visible at a temperature of 70 °C.
The excessive amount of bromine has been an ongoing challenge for bromine to be used as a leaching reagent [3,4,5,6,7]; thus, the effect of the solid–liquid ratio was studied. The quantities of solids chosen in this study were 5 g, 7.5 g, and 10 g per 250 mL of leaching solution. The effect of the solid–liquid ratio in antimony recovery follows the same trend seen with the other conditions studied. However, the highest dissolution of antimony was 18.79%, which is significantly lower compared to the experiments performed before. The increase in solids in the solution decreased the dissolution. In terms of tin, the increase in solids in the solution increased the dissolution of it. Consequently, the dissolution of tin did not increase between 1 and 2 h, like when testing the effect of temperature. The dissolution increase in tin between these two leaching times was >1%, but at 3 h of leaching time, the increase was <5%. Figure 5 and Figure 6 demonstrate the highest recoveries of antimony and tin per variable tested.
However, the recoveries are low, which can be attributed to lead content. Lead is one of the main components in the sample, and it reduced the amount of available bromide ions and bromine to obtain a higher recovery of antimony and tin.

4.2. Nitric and Hydrobromic Acid Leach

Although antimony and tin can form a bromine complex, lead has an easier path to form a bromine complex than the elements previously mentioned; thus, reducing the lead concentration should potentially increase the recovery of both. We tested this theory with the parameters in Table 2. After treating the sample with nitric acid leach, a spectrum of lead dissolution was achieved while retaining most of the antimony and tin in the solid residue (Table 9).
For the recovery data, it can be seen that lead is being removed from the feed at the nitric acid leach, but there is still a considerable amount that moves on to the hydrobromic acid leach. Since we achieved the goal of reducing the lead concentration without affecting antimony, in theory, treating with HBr should produce a higher dissolution of antimony and tin. However, the dissolution of antimony and tin does not look great (Table 10). There are some cases where the recovery greatly increased compared to the results from the first set of experiments, but in general, they are not great. The primary element of interest, antimony, is still not successfully transferred to the aqueous phase. Although there is room for improvement, reducing the amount of lead does increase the antimony dissolution. In Figure 7, the surface response for antimony from the DoE is shown. It can be seen that there is a considerable difference depending on the values associated with each variable.
For tin, there was no considerable increase in dissolution after decreasing the lead concentration (Figure 8). The surface response follows the same behavior as antimony’s surface response. The higher concentrations of HBr are necessary for a good dissolution of antimony and tin; however, this would not be economically feasible, as initially discovered by Shaffer on precious metals in 1882. The values obtained cannot be considered as successful due to the low dissolution rates, but if we compared the results of the single HBr leach stage to the two-stage acid leach of HNO3 and HBr, we can see, at least for antimony, that there is room to gather better results if further experimentation and optimization is performed.

5. Conclusions

This study demonstrated the effectiveness of hydrobromic acid (HBr) as a leaching reagent for recovering antimony from recycled lead–acid battery dross. Key parameters such as acid concentration, solid-to-liquid ratio, reaction time, and temperature were investigated, revealing that lead dissolution occurs prior to any significant reaction between antimony and bromine.
In single-stage leaching, antimony dissolution reached a maximum of 21.48% under optimal conditions (1 M HBr, 3 h, 70 °C), while tin dissolution reached 17.56%. These dissolution rates were limited by lead interference, which consumed bromine and reduced the efficiency. The introduction of a two-stage acid leach was proposed to increase dissolution rates for antimony. In the initial leaching stage, 1.5 M of HNO3 at room temperature was found to be the optimal condition and necessary to reduce lead concentration. In the second stage, the optimal conditions for HBr leaching were determined to be 2 M HBr at 70 °C, which enhanced the antimony dissolution by 2.5 times compared to the untreated dross. Despite this improvement, the high residual lead content (over 80% in the original sample) remained a significant barrier to further increasing antimony recovery. Additionally, tin recovery did not see significant enhancement, indicating the need for further process.
Overall, the findings suggest that while HBr can selectively dissolve antimony and tin, its effectiveness is hindered by the high lead content and the associated loss of bromide ions. To enhance antimony and tin recoveries, future studies should explore additional process optimizations, such as alternative oxidants, extended leaching durations, or selective precipitation methods, to minimize lead interference and improve extraction efficiency. Additionally, given that high HBr concentrations are required to achieve dissolution rates above 90%, the economic feasibility of HBr regeneration should be examined to reduce operational costs and improve process sustainability. By refining these parameters, HBr-based leaching could become a more viable and sustainable alternative for recovering critical metals from lead–acid battery recycling waste streams.

Author Contributions

Conceptualization, C.G.A. and A.H.-M.; methodology, C.G.A. and A.H.-M.; formal analysis, A.H.-M.; investigation, A.H.-M.; data curation, A.H.-M.; writing—original draft preparation, A.H.-M.; writing—review and editing, C.G.A.; supervision, C.G.A. All authors have read and agreed to the published version of the manuscript.

Funding

This research was funded by the Center for Resource, Recovery, and Recycling (CR3).

Data Availability Statement

The original contributions presented in this study are included in the article. Further inquiries can be directed to the corresponding author.

Conflicts of Interest

The authors declare no conflict of interest.

References

  1. Carlin, J.F., Jr. Antimony: U.S. Geological Survey Mineral Commodity Summaries; USGS: Reston, VA, USA, 2020; pp. 18–19.
  2. Llamas, A.; Kandalam, A.; Zschiesche, C. Understanding the side-blown furnace slag system at Glencore Nordenham’s lead plant—From theory to industrial application. In Proceedings of the 12th International Conference of Molten Slags, Fluxes and Salts MOLTEN 2024 Proceedings, Brisbane, Australia, 17–19 June 2024. [Google Scholar]
  3. Drazga, M.; Cizcewski, M. Leaching of liquation-feeding furnace dross as a first step for germanium recovery. BMC Res. Notes 2024, 17, 180. [Google Scholar]
  4. Anderson, C.G. The metallurgy of antimony. Geochemistry 2012, 72 (Suppl. S4), 3–8. [Google Scholar]
  5. Palden, T.; Machiels, L. Antimony Recovery from Lead-Rich Dross of Lead Smelter and Conversion into Antimony Oxide Chloride. ACS Sustain. Chem. Eng. 2021, 9, 5074–5084. [Google Scholar]
  6. Woo Kim, K.; Sangyun, S. A study on pyro-hydrometallurgical process for selective recovery of Pb, Sn, and Sb from lead dross. J. Hazard. Mater. 2021, 417, 126071. [Google Scholar]
  7. Ibrahim, A.; Aboelgamel, M. Production of high-grade antimony oxide from smelter slag via leaching and hydrolysis process. J. Sep. Purif. Technol. 2025, 354, 129355. [Google Scholar]
  8. Liang, K.; Ma, B.; An, Y.; Zhang, Y.; Chen, Y.; Wang, C. A Summary of Smelting and Secondary Recovery Process of Antimomy. JOM 2025, 77, 2666–2683. [Google Scholar] [CrossRef]
  9. Shaeffer, C.A. Process of Extracting Gold and Silver from Their Ores. U.S. Patent 267723, 21 November 1882. [Google Scholar]
  10. Hinman, B.C. Process of Extracting Gold. U.S. Patent 545890, 10 September 1895. [Google Scholar]
  11. Dadgar, A. Inorganic Perbromide Compositions and Methods of Use Thereof. U.S. Patent 5607619A, 4 March 1997. [Google Scholar]
  12. Hess, P.L. Gold and Silver Recovery Processes by Electrolytic Generation of Active Bromine. U.S. Patent 4904358A, 27 February 1990. [Google Scholar]
  13. Cui, H. Hydrometallurgical Treatment of E-Scrap. Ph.D. Dissertation, Colorado School of Mines, Golden, CO, USA, 2018. [Google Scholar]
  14. Wang, C. Antimony: Its History, Chemistry, Mineralogy, Geology, Metallurgy, Uses, Preparations, Analysis, Production, and Valuation; with Complete Bibliographies, 2nd ed.; Charles Griffin & Company, Ltd.: London, UK, 1919; 217p. [Google Scholar]
  15. Greenwood, N.N.; Earnshaw, A. Chemistry of the Elements, 2nd ed.; Butterworth-Heinemann: Oxford, UK, 1997. [Google Scholar]
  16. Iizuka, A. Separation of Arsenic and Recovery of Antimony and Tin from Silicate Slag in a Nonferrous Smelter; Canadian Institute of Mining, Metallurgy and Petroleum: Montreal, QC, Canada, 2019. [Google Scholar]
  17. Mineralogical Society of America. Handbook of Mineralogy; Mineralogical Society of America: Chantilly, VA, USA, 2023; Volume III. [Google Scholar]
  18. Sullivan, T.A.; Cattoir, F.R. Electrorefining Vanadium in Molten Bromide Electrolyte; Report of Investigations 6631; US Department of the Interior, Bureau of Mines: Washington, DC, USA, 1965.
  19. Groves, K.O.; Beasly, D.K. The Use of Bromine Chloride for Cyanaide Destruction. In Proceedings of the Society of Mining Engineers of AIME, Dallas, TX, USA, 13–15 September 1982. [Google Scholar]
  20. Scott, A. Preparation of Pure Hydrobromic Acid. J. Chem. Soc. Trans. 1900, 77, 648–651. [Google Scholar]
  21. Goldschmidt, F. A Simple Method for the Preparation of Hydrobromic Acid. J. Soc. Chem. Ind. 1947, 66, 444–445. [Google Scholar]
  22. McCall, A.S.; Cummings, C.F.; Bhave, G.; Vanacore, R.; Page-McCaw, A. Bromine Is an Essential Trace Element for Assembly of Collagen IV Scaffolds in Tissue Development and Architecture. Cell 2014, 157, 1380–1392. [Google Scholar] [CrossRef] [PubMed]
  23. Brauer, G. Handbook of Preparative Inorganic Chemistry, 2nd ed.; Academic Press: New York, NY, USA, 1963; Volume 1, p. 285. [Google Scholar]
  24. Ichlas, Z.T.; Rustandi, R.A.; Mubarok, M.Z. Selective nitric acid leaching for recycling of lead-bearing solder dross. J. Clean. Prod. 2020, 264, 121675. [Google Scholar]
  25. US National Library of Medicine. Antimony Tribromide. National Center for Biotechnology Information. PubChem Compound Database. Available online: https://pubchem.ncbi.nlm.nih.gov/compound/Antimony-tribromide (accessed on 27 February 2025).
Figure 1. Eh-pH diagram for (a) Sb-Cl-H2O and (b) Sb-Br-H2O systems at 298.15 K.
Metals 15 00356 g001aMetals 15 00356 g001b
Figure 2. Eh-pH diagram for (a) Sn-Cl-H2O and (b) Sn-Br-H2O systems at 298.15 K.
Metals 15 00356 g002aMetals 15 00356 g002b
Figure 3. Eh-pH diagram for Sb-Pb-Br-H2O system at 298.15 K.
Metals 15 00356 g003
Figure 4. BSE images from (a) SEM and (b) AMICS for dross sample.
Metals 15 00356 g004
Figure 5. Antimony dissolution from single-stage hydrobromic acid leach.
Metals 15 00356 g005
Figure 6. Tin dissolution from single-stage hydrobromic acid leach.
Metals 15 00356 g006
Figure 7. Surface response for antimony at (a) minimum HNO3 conditions and maximum HBr concentrations, and (b) maximum HNO3 conditions and minimum HBr concentrations.
Metals 15 00356 g007
Figure 8. Surface response for tin at (a) maximum HBr concentration and (b) minimum HBr concentration.
Metals 15 00356 g008aMetals 15 00356 g008b
Table 1. Experimental conditions for single-stage leaching.
Temperature (°C) Time (Hours)HBr (M)Solids (Grams)
703110
6020.757.5
5010.55
Table 2. Experimental conditions for nitric and hydrobromic acid leach.
HNO3 Temp. (°C)HNO3 (M)HBr Temp. (°C)HBr (M)
301.5702
250.5601
Table 3. Sample concentrate analysis.
ElementFe, %Ca, %Cu, %Si, %Al, %Mg, %
0.480.060.510.220.080.12
ElementNa, %Sn, %Pb, %Sb, %Ni, %O, %
0.360.2483.213.40.3710.94
Table 4. Slag and phase chemistry of dross samples.
Elementwt. (%)
Slag 4Slag 5
Aluminum4.0-
Antimony26.0-
Calcium3.0-
Copper-21.0
Iron-20.0
Lead4.0-
Magnesium6.0-
Nickel18.0-
Oxygen16.044.0
Silicon11.0-
Sodium-15.0
Sulfur--
Tin12.0-
Table 5. Experimental design of tests conducted in single-stage leaching.
TrialTemperature (°C)Time (Hours)HBr (M)Solids (Grams)
1701110
270217.5
35030.7510
46010.510
57020.757.5
67020.7510
77020.55
85010.510
97010.755
105020.510
1170215
127010.57.5
1350115
147010.57.5
15502110
165030.55
177030.757.5
1870315
1960215
206030.510
216020.57.5
2250317.5
23703110
246010.55
255010.757.5
26601110
277020.510
287030.510
2960317.5
305030.7510
317010.7510
325020.757.5
335020.57.5
345020.755
356030.755
3650117.5
377030.57.5
3860217.5
396020.7510
406010.757.5
Table 6. Experimental design of tests conducted in two-stage leaching for 3-h reaction time.
TrialHNO3 Temp. (°C)HNO3 (M)HBr Temp. (°C)HBr (M)
1300.5602
2250.5602
3300.5701
4301.5602
5301.5601
6251.5702
7250.5701
8251.5602
9300.5702
10251.5701
11300.5601
12301.5702
13250.5601
14301.5701
15250.5702
16251.5601
Table 7. Eh and pH before and after single-stage treatment from design of experiment.
Trial Eh (mV) BeforepH BeforeEh (mV) AfterpH After
13900.018367.80.54
23920.15362.80.63
3376.80.11357.30.72
4388.40.45332.71.13
53900.16375.90.71
63880.19356.10.79
7397.40.29358.30.94
8386.90.46348.21.11
9389.40.18359.60.68
10373.90.60350.11.08
113880.2362.80.63
12395.40.33336.81.07
133790.3367.80.54
14389.30.32337.91.05
153800.29366.20.57
16383.20.54348.41.12
17390.40.16351.090.82
18395.20.009363.10.62
193870.19364.80.59
20388.60.44326.11.24
213870.48333.31.13
223780.31365.20.59
23394.30.1361.30.65
24384.90.42335.81.09
25380.20.34357.50.72
263830.25365.70.58
27394.30.34333.61.12
28396.30.3330.21.18
293800.28365.70.58
30388.90.19357.60.71
313920.15357.70.71
32375.90.413560.74
33383.70.55331.61.16
34376.40.4357.80.71
35394.70.1361.90.64
36382.10.28366.20.57
37397.10.073560.74
383830.22364.30.6
393860.23357.70.71
40396.30.26385.60.7
Table 8. Eh and pH before and after second-stage treatment from design of experiment.
TrialEh (mV) BeforepH BeforeEh (mV) AfterpH After
14900.08467.80.44
24920.05462.80.53
3476.80.11457.30.62
4488.40.05432.70.93
54900.12475.90.61
64880.03456.10.69
7497.40.19458.30.74
8486.90.03448.20.91
9489.40.08459.60.48
10473.90.13450.10.98
114880.15462.80.53
12495.40.03436.80.97
134790.13467.80.44
14489.30.12437.90.95
154800.09466.20.57
16483.20.14448.40.92
Table 9. Elemental recoveries (%) for nitric acid leaching tests after 3 h from DoE of Table 6.
TrialTinAntimonyLead
10.0220%0.0317%22.66
20.0000%0.0961%55.37
30.0000%0.0283%23.10
40.5106%1.2207%53.63
50.0000%0.2129%26.21
60.7602%0.7628%71.79
70.0000%0.1105%57.15
80.0000%0.2122%35.54
90.0000%0.1213%45.61
100.0000%0.1576%33.88
110.0000%0.0716%43.37
120.0000%0.2416%27.30
130.0000%0.0413%27.00
140.2988%1.7016%53.96
150.0000%0.0494%30.34
160.0506%1.0982%59.88
Table 10. Elemental recoveries (%) for two-stage leaching tests after 3 h from DoE of Table 6.
TrialAntimonyTinLead *
119.4411.9822.66
252.5220.3255.37
318.8610.3723.10
48.2615.5753.63
53.148.8826.21
62.1016.0171.79
75.2313.0757.15
821.7816.2435.54
96.2421.8945.61
102.657.7533.88
117.5813.8943.37
123.7418.5627.30
1321.62.0727.00
149.817.5653.96
1523.0816.6430.34
1640.166.1759.88
* Values displayed are from nitric acid leach only.
Disclaimer/Publisher’s Note: The statements, opinions and data contained in all publications are solely those of the individual author(s) and contributor(s) and not of MDPI and/or the editor(s). MDPI and/or the editor(s) disclaim responsibility for any injury to people or property resulting from any ideas, methods, instructions or products referred to in the content.

