Abstract
Primary and low-strain creep represents a very important integrity challenge to large, complex structures, like fusion reactors. Here, we develop a predictive empirical primary creep model for 9Cr tempered martensitic steels (TMS), relating the applied stress (σ) to strain (ε), time (t) and temperature (T). The most accurate model is based on the applied σ normalized by the steel’s T-dependent ultimate tensile stress (σo), σ/σo(T). The model, fit to 17 heats of 9Cr TMS, yielded a σ root mean square error (RMSE) of ≈±11 MPa. Notably, the model also provides robust predictions for all the other TMS, when calibrated only by the fusion candidate Eurofer97 database. The model was extended to explore two possible effects of neutron irradiation, which produces both displacements per atom (dpa) and helium (He in atomic parts per million, appm) damage. These effects, which have not been previously considered, include: (a) softening, as a function of dpa, at T > ≈400–450 °C, in low-He fission environments (<1 He/dpa); and (b) subsequent re-hardening in high-He (≥10 He/dpa) fusion first-wall environments. The irradiation effect models predict (a) accelerated primary creep due to irradiation softening; and (b) fully arrested creep due to high-He re-hardening.
1. Introduction and Background
Thermal creep predictions typically focus on minimum rates and rupture times. However, rapidly accumulating primary and low-strain creep are absolutely critical for the large interconnected, gradient-dominated structures, like fusion reactors, which require both conservative safety margins and precise dimensional tolerances and stability [1]. Here, we develop an empirical primary and low-strain creep model, for 9Cr tempered martensitic steels (TMS), relating the applied stress (σ) to strains (ε) from 0.2 to 5%, times (t) from 10 h to 8 × 10⁴ h and temperatures (T) from 375 to 550 °C. Note that while the primary creep regime is generally restricted to ε of ≈1–3%, our model accurately extends to 5%, which is often in, or close to, the tertiary creep regime. However, for convenience, we will subsequently refer to our model as being for primary creep.
It is well-known that neutron irradiation extends the time-dependent accumulation of ε down to a T range that is much lower than that for thermal creep [2,3]. This, so-called, irradiation creep (IC) is not addressed in this work. However, thermal creep can also be affected by irradiation-service. Thus, for the first time, we consider neutron irradiation-enhanced softening of TMS at T >≈ 400 to 450 °C. We further show that fusion reactor environments lead to re-hardening, above a threshold transmutant He content, essentially arresting creep. Here, we focus on these irradiation effects in a fusion candidate TMS, reduced-activation ferritic–martensitic (RAFM) steel Eurofer97.
Notably, outstanding summaries of a wide range of RAFM property data and correlations, developed over many decades of international research, do not, or only minimally, address primary creep [4,5,6,7]. Thus, new, quantitatively predictive primary creep models, including the effects of irradiation, are needed for the design and operation of fission and fusion structures, which can functionally fail due to modest dimensional instabilities. These models are not only needed for assuring Design and Regulatory Code-imposed σ limits but also for constitutive models such as reported in [1]. The quantitatively predictive models developed here are intended to begin filling this major fusion energy property gap.
The primary creep model was derived in the following sequence. Various data-fitting models were first evaluated, including (i) the Larson–Miller parameter (LMP); (ii) the applied stress (σ) normalized to the temperature (T)-dependent either 0.2% tensile yield stress [σ/σy(T)] or ultimate tensile stress σo [σ/σo(T)], as measured in static tensile tests; and (iii) a threshold stress that scales with either σy or σo, as (σ − Cσy) or (σ − Cσo). We found that the σ/σo(T) model, championed by Wilshire et al. [8], performed the best. The primary creep models were least square fit (LSF) to a database for 17 heats of 9Cr TMS [9,10,11,12], resulting in a predicted σ RMSE of ≈±11 MPa and a mean error (ME) of ≈0. The effect of irradiation softening in low-He fission environments was also tested, using a simple empirical model for increases in σ/σo, found by fitting the corresponding decrease in σo, with the log (dpa). Furthermore, primary creep rates in fusion environments were predicted by fitting He-hardening data. The threshold dpa for He hardening is higher than that for softening. Thus, due to re-hardening beyond the threshold He, σ/σo decreases, following an initial softening increase, depending on the He/dpa ratio. The model predicts that re-hardening essentially arrests creep, at a dpa that depends on the saturation primary strain (εxs), σ, T and He/dpa. The fitting models and methods are described in the following section.
Typical creep behavior is schematically illustrated in Figure 1a, showing ε as a function of the log of time (t) for increasing T and σ [13,14]. Figure 1b illustrates that creep may manifest secondary either steady-state or minimum rates (ε′), with the latter behavior typical of 9Cr TMS. Figure 1c shows the σ dependence of the time (tx) to εx = 1%, for Eurofer97, fit to a simple Norton power law creep model, tx = εx/[Aσp exp (−Q/RT)], with a typically large p ≈ 18 [8,9]. We found that ε and ε′, as a function of σ/σo, are very similar for various TMS.
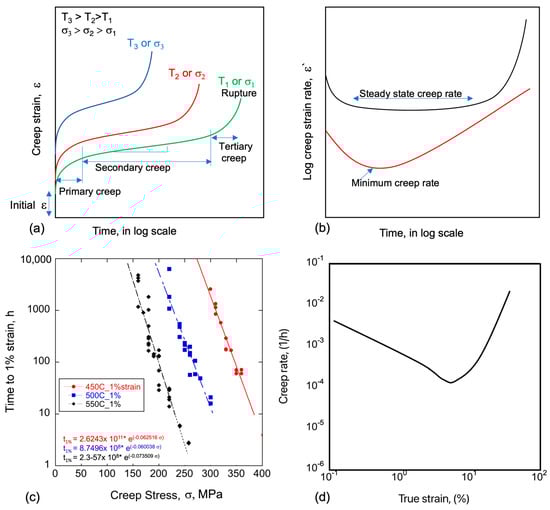
Figure 1.
(a) A schematic illustration of ε versus t as a function of σ and T; (b) a schematic illustration of ε′ versus t, showing both an extended steady-state and shorter ε′m range [13,14]; (c) tx to εx = 1%, as a function of σ at various T for 8 Eurofer97 heats [9] (the Norton Law p here is ≈18 ± 1); and (d) a representative schematic of εx′ versus εx, plotted on log–log scales, as typically observed in 9Cr TMS.
Figure 1 illustrates that there are three regimes, of primary, minimum (or secondary) and tertiary creep. Here, we mainly focus on primary creep rates, which rapidly decrease with strain, as illustrated in Figure 1d, for widely observed 9Cr TMS, such as in 9Cr-1-4W TMS [15]. TMS typically exhibit primary creep behavior, typically up to ≈ 2%, followed by rapidly increasing tertiary creep, typically starting by ≈5% [15]. Hence, from a design and operation perspective, primary and low-strain creep is very important for avoiding functional failure due to dimensional instabilities, especially in large and complex structures, like fusion first-wall energy conversion systems [1].
A detailed discussion of the mechanisms controlling primary creep is beyond the scope of this paper. However, briefly, the primary ε′ down to a minimum (or secondary) creep rate (ε′m) can be phenomenologically represented by
ε′(ε) = ε′m + (ε′o − ε′m) exp (−ε/εxp)
Here, ε′o is the initial creep rate as t → 0, and εxp is a primary creep relaxation strain, which is a phenomenologically fit parameter. The initial decrease in (ε′o − ε′m) is mainly due to hardening, associated with the build-up of dislocation structures, in a manner roughly analogous to strain hardening in static tensile tests [8,13,14,16]. This build-up reaches a steady-state condition, at ε′ = ε′m, when the generation and annihilation of dislocations balance [14,16]. Precipitation hardening can also reduce the rate of primary creep with an increasing ε [15]. Note that this phenomenological description is sometimes couched in terms of decaying internal back stress [14,15].
Thus, primary creep rates are mediated by an evolving alloy microstructure, which is also, to some extent, reflected in the initial strength and strain-hardening rates observed in static tensile tests [8]. Although quantitative details certainly differ, and are a function of both T and t, normalizing σ by σo captures some of these physics [8]. Another advantage of using normalized σ/σo is that it permits the use of the model for various 9Cr TMS, with a corresponding range of static σo. Finally, σ/σo models also allow treating time-dependent changes in σo, here, those due to the effects of fission and fusion neutron irradiation.
2. Materials and Methods
2.1. Materials and the Creep Database
The creep database used for fitting the σ/σo model was composed of 4 alloy classes, including 8 heats from the Rieth et al. compilation for fusion candidate TMS 9Cr-1W Eurofer97 [9]. The database also included 4 heats of 9Cr-1Mo-V-Nb (Gr91 of T91/P91) from the National Institute for Materials Science (NIMS, Tsukuba, Japan) [10], 4 heats of NIMS 9Cr-0.5Mo-1.8W-V-Nb (Gr92 of T92/P92) [11], and 1 heat of Holmstrom’s 9Cr-1Mo-V-N (Gr91) [12].
The chemical compositions of the alloy classes used in this study are shown in Table 1, while the details of their heat treatment procedures can be found in [9,10,11,12]. TMS are characterized by a tempered martensitic microstructure, with lath-packets in larger prior austenite grains. Heat treatments vary. For example, the reference condition of TMS Eurofer97 is austenitizing at ≈1040 °C for 4 h, air-cooling (normalizing) and tempering at ≈750 °C for 1 h, leading to a room-temperature (RT) yield stress (σy) of ≈550 ± 50 MPa and ultimate tensile stress (σo) of ≈700 ± 50 MPa [9,10,11,12,17]. More generally, Gr91/92 steels have a range of σy and σo and contain a variety of precipitates, including secondary hardening carbides, like Mo2C, as well as other metal carbonitrides, like TaC [5,10,11,18,19,20,21]. At high temperatures and service stresses, these microstructures evolve over time in association with processes like a loss of matrix-strengthening solutes to coarse-scale precipitates, coarsening of fine-scale precipitates, dislocation and subgrain structural recovery, and, in some cases, lath-scale instabilities [15,19,21,22,23,24,25,26].

Table 1.
Compositions (wt.%) of Eurofer97 [9] and Gr91/92 steels [10,11,12] used in this study.
Notably, these evolutions occur at lower temperatures and shorter times under neutron irradiation [22]. This is believed to be primarily due to radiation-enhanced diffusion (RED) [22,27]. Note here that we do not include advanced variants of 9Cr TMS, which are strengthened by very-fine-scale alloy (M) carbide, nitride and oxide MX phases [28]. Rather, we mainly focus on Eurofer97, which is in an alloy class often referred to as reduced-activation ferritic–martensitic (RAFM) steels [21,29,30]. Reduced activation is achieved by substituting W for Mo and controlling the contents of various alloying elements and impurities to reduce the inventory of long-lived radioactive isotopes [30,31]. Establishing the close relationship between fusion-relevant RAFM and Gr91/92 steels is of great benefit, since the latter have been used since the early 1980s, are ASME BPVC Section 3 Division 5 [32,33] qualified and are resistant to void swelling [21,33,34]. Our 17 heat TMS primary creep database covers a wide range of strains, εx, for x from ≈0.2 to 5%, T from 375 to 550 °C, σ from 160 to 420 MPa (depending on the T) and tx from <10 to 8 × 10⁴ h [9,10,11,12]. Thus, as shown below, it is particularly important that the σ/σo model calibrated only to the Eurofer97 database predicts the entire 17 heat TMS database with high accuracy. This enables the use of regulatory and design guidance on issues like negligible creep and deformation primary creep limit conditions, such as εx = 0.2% and 1%, respectively.
Note that our compiled database also includes other creep properties, which have also been modeled. Our database does not generally include the full creep curves, so discrete σ, t, T, εx and tx data points were used for LSF optimization of the models. The LSF criteria include a minimum predicted (P) minus measured (M) σ RMSE, augmented by a negligible mean error (ME), the absence of residual bias for the key variables and 1/1 fitting of the P versus M σ/σo, with a 0/0 intercept.
2.2. The σ/σo Model for Primary Thermal Creep
As noted above, Wilshire et al. [8] proposed a creep model based on normalizing the applied σ with the temperature-dependent ultimate tensile stress, σo(T), as follows:
ε′ = A(σ/σo)n exp(−Q/RT).
A is a fit constant and Q an activation energy, generally related to, but not fully controlled by, self-diffusion [8,13,14]. The time increment (tx) needed to accumulate a strain of εx where A(σ/σo)n exp(−Q/RT) is the average ε′ is as follows:
εx = A(σ/σo)n exp(−Q/RT)tx.
This can be re-arranged as follows:
εx/[Aexp(−Q/RT)tx] = [σ/σo]n.
The [σ/σo] can then be expressed in terms of the log of a temperature-compensated time (txc) as follows:
where txc = tx exp(−Q/RT). The normalized stress, σ/σo, expression can be further re-arranged as follows:
σ/σo = {εx/[Aexp(−Q/RT)tx]}1/n = [εx/A]1/n [txc]−1/n.
log[σ/σo] = [1/n]log[εx/A] − [1/n]log[tx exp(−Q/RT)] = k(εx) − log(txc)/n(εx).
The k and n are the LSF-optimized parameters for σ/σo vs. txc data on a log–log scale. For a given Q and T, the fitted k and n only depend on εx. Figure 2a shows that log(σ/σo) is a linear function of the log(txc) at various εx. Here, k is the fit constant at σ/σo = 1 and 1/n is the log–log slope, again which were found by fitting the log(σ/σo) and log(txc) data at various εx. The resulting functions for k(εx), n(εx) were then modeled by cross-fitting to εx, using a second-order polynomial function as follows:
log[σ(εx,T)/σo(T)] = {C0 + C1εx + C2εx2 + (C3 + C4εx + C5εx2)log[tx exp(−Q/RT)]
σ(εx,T) = σo(T)10{C0 + C1εx + C2εx2 + (C3 + C4εx + C5εx2)log[tx exp(−Q/RT)]}
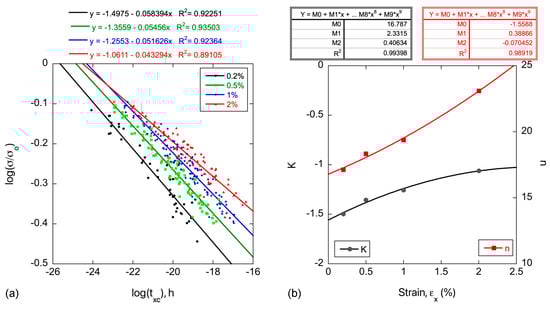
Figure 2.
(a) The log(σ/σo) versus log(txc) data and LSF lines for εx from 0.2 to 2%, for 17 heats and tx > 10 h with n ≈ 19.5 ± 2.6; and (b) the LSF k and n fit data and their corresponding cross-fits, used to determine C1–6 as a function of εx.
Note that the LSF also simultaneously optimizes Q. Thus, Equations (4a) and (4b) constitutes a primary creep model, relating σ(εx,T) to εx, tx and T, with known values for C1–6 and Q. For the σ(εx,T)/σo(T) shown in Figure 2a, the best-fit Q = 335 kJ/mole.
2.3. Static Tensile Properties
The tensile σo and σy data used in this study are shown in Figure 3 [9,10,11,12] for T from 375 to 550 °C, marking the likely use limits of standard 9Cr TMS for extended irradiation services. The σo and σy for T that were not directly available were interpolated between the two adjacent values. Figure 3 shows that both the σy and σo differ by about 80 to 180 MPa for the various TMS. These variations reflect differences in the TMS compositions and, especially, their heat treatments [9,10,11,12].
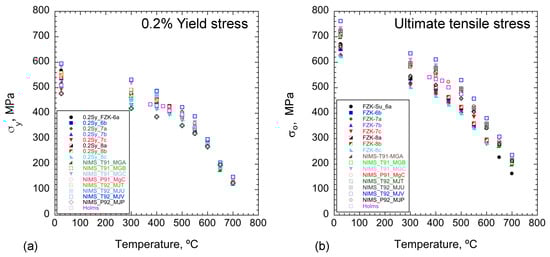
Figure 3.
(a) σy (T) and (b) σo(T) for the 17 heats of 9Cr TMS used in this study [9,10,11,12].
2.4. Softening Model
There is modest literature on the softening of 9Cr TMS under long-term high-temperature aging, typically at T > 550–600 °C for 1000 to 100,000 h or more [20,21,25,35,36,37,38,39]. Notably, thermal softening is recognized in ASME and other design and safety codes [32,33]. Again, however, neutron irradiation shifts thermal-aging effects to a lower T and shorter t [22]. Note, most reported data for irradiation hardening and softening are for Δσy, rather than Δσo. Both thermal-aging and irradiation effects can be expressed in terms of the irradiated (i) and unirradiated (u) yield and ultimate stress ratios, σyi/σyu and or σoi/σou, which are a strong function of T, as derived from the data in [40,41,42,43,44,45,46,47,48,49,50]. Here, the σyi and σyu data are for similar irradiation and tensile test temperatures. Typical fission reactor irradiations, with He/dpa ratios << 1, cause hardening at T ≤ 400 °C, while again, they lead to gradual softening at T > ≈400–450 °C.
The primary irradiation-enhanced mechanism shifting softening to a lower T is believed to be radiation-enhanced diffusion (RED) [22]. Note that there are also other possible irradiation-enhanced softening effects of neutron displacement damage, including cascade ballistic mixing [51] and dislocation climb and recovery [24]. When assuming solute diffusion primarily takes place due to an increased steady-state vacancy concentration, the RED diffusion coefficient, D*, is approximately given by [27]
D* = ηϕσdpa/Zv + Dth(T) = Gv/Zv + Dth(T).
Here, Dth(T) is the thermal coefficient, Gv = ηϕσdpa is the vacancy production rate per atom and Zv is the total sink strength for annihilating vacancies (here taken as 2 × 10¹⁴/m2). η (≈0.33) is the number of vacancies generated per dpa, σdpa is the fast fission dpa production cross-section (≈1.5 × 10⁻²¹/cm2) and ϕ is the neutron flux (n/cm2-s, E > 1 MeV) [52,53]. This D* model assumes that there is no recombination of diffusing vacancies and self-interstitials [27]. Figure 4a shows D* and Dth, taken here as the self-diffusion coefficient, as a function of 1/T, for a nominal dpa rate of 10−6/s, corresponding to fluxes of ϕ ≈ 1015 (fast fission) and 5 × 10¹⁴ n/cm2-s (fusion first wall), respectively [52,53,54,55]. In the absence of recombination, between T ≈ 450 and 550 °C, D* is approximately athermal. At higher temperatures, D*/Dth ≈ 1. At lower temperatures, irradiation hardening increasingly dominates. The softening T range where D*/Dth is >1 is marked by the dashed vertical lines. The corresponding D*/Dth irradiation-softening acceleration factor is shown in Figure 4b. Figure 4c is discussed below.
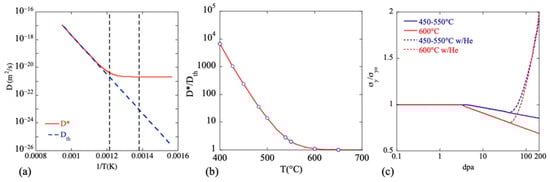
Figure 4.
(a) Log Dth and D* as a function of 1/T, (b) D*/Dth as a function of T, and (c) σyi/σyu vs. dpa softening and re-hardening curves, based on the fits shown Figure 5 and Figure 6 below. The σyi/σyu softening fits are averaged from 450 to 550 °C (solid blue line) and are also shown for 600 °C (solid red line). As discussed below, the fitted data symbols in Figure 5 are for both RED-adjusted thermal (unfilled) and irradiated (filled) conditions. The re-hardening predictions (dashed lines), here at He/dpa = 10, are derived from analysis of the data in Figure 6.
A simple softening model was fit to both irradiation and the long-term RED-adjusted thermal-aging time (ta), producing taDth/D* σyi/σyu data at 450, 500, 550 and 600 °C, as shown in Figure 5. The softening data suggest a bi-linear fit form, with a threshold dpat, and a subsequent σyi/σyu slope as a function of log(dpa):
σyi/σyu = 1 dpa ≤ dpat
σyi/σyu = 1 − B[log dpa − log dpat] dpa > dpat
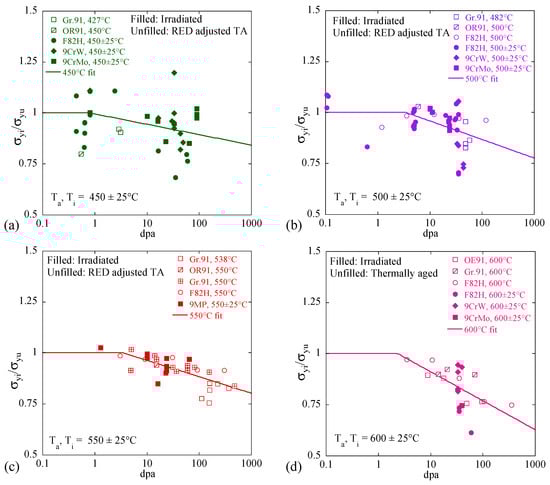
Figure 5.
Bi-linear threshold fits to σyi/σyu versus log dpa data for irradiated (filled) and RED-adjusted thermally aged (unfilled), at (a) 450 °C; (b) 500 °C; (c) 550 °C; and (d) 600 °C.
The filled and unfilled symbols in Figure 5 are for the irradiated and the RED acceleration factor (see Figure 4b)-adjusted taDth/D* σyi/σyu data, respectively. As shown in Figure 5a–c, up to ≈200 dpa, the LSF results are very similar between 450 and 550 °C. The corresponding B and dpat average 0.088 ± 0.034 and 4.4 ± 2.1, respectively, while they are 0.14 and 3.4 at 600 °C. The similar behavior between 450 and 550 °C is not surprising, given the corresponding athermal D*, again as indicated by the vertical dashed lines in Figure 4a. As expected, softening is faster at 600 °C, consistent with the dominance of an increasing Dth at higher T, with Dth ≈ D* (Figure 5d). The average σyi/σyu softening trends are shown as the solid lines in the previous Figure 4c. The softened σyi/σyu RSME and ME are 0.085 and −0.007, respectively. The corresponding ultimate stresses, σoi/σou, are assumed to be approximately equal to σyi/σyu [56].
2.5. He-Re-Hardening Model
It is well-established that high levels of He can make a significant hardening contribution (σHe) beyond a threshold concentration (Het) [57]. A primary source of this hardening is believed to be He bubbles, which act as obstacles to dislocation glide [57]. Spallation proton irradiation (SPI) results in a very high He (appm)/dpa, ranging from ≈50 to 87 [57,58,59,60]. The main source of SPI data is an extensive program led by Yong Dai at the Paul Sherrer Institute in Switzerland [57,59,60]. Other possible high-He-hardening mechanisms include enhanced-dislocation loop formation [61,62] and precipitation of insoluble solid transmutants generated in SPI [63,64,65]. Other approaches to studying the effects of high He on the microstructure and properties of TMS, such as Ni and B doping, isotope tailoring, in situ He injection (ISHI), single-ion He implantation and dual ion irradiation, are reviewed in [57].
Assessing the isolated He hardening requires σHe de-superposition from other contributions to the net σyi from various dislocation obstacles, existing both prior to and following irradiation. Superposition is the way various hardening contributions are combined to result in a net σy [66,67]. In practice, superposition is complex, and the net σy generally falls between the limits of the linear sum (LS) and root square sum (RSS) laws, which properly weight the various individual contributions. The LS-RSS balance depends on the strength of the individual obstacles [66,67]. The de-superposition process is even more complex.
Estimates of σHe as a function of He at the same Ti and dpa, based on the differences between SPI (high He) and neutron irradiation (low He) Δσy after de-superpositioning, are shown in Figure 6a. An LSF of σHe suggests a threshold Het ≈ 433 appm, yielding the following:
σHe = 28.4(√He − 20.8) MPa He ≥ 433 appm
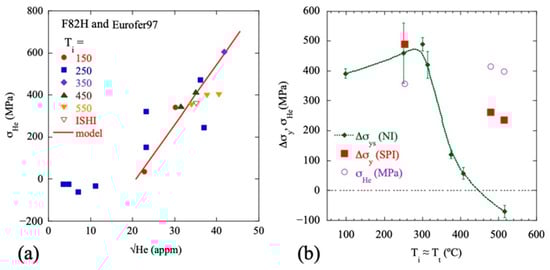
Figure 6.
(a) De-superimposed σHe data as a function of the square root of He for a wide range of T; (b) measured neutron-irradiated (green diamonds) and SPI (red squares) Δσy and decomposed SPI σHe (purple circles) as a function of irradiation and test temperature. Notably, σHe is essentially athermal.
While the data are scattered, with a RSME and ME of 110 and −0.1 MPa, respectively, the mean trend is reasonable. These results are also supported by a microstructure-based assessment of Δσy for neutron-irradiated Eurofer97, which was simultaneously subjected to in situ helium injection (ISHI) from a NiAl implanter coating, as shown by the red open triangle symbol. Figure 6b shows the T dependence of Δσy for both low-He neutron irradiations of TMS F82H with loop-hardening saturation at >10–20 dpa (green line and diamond symbols) and for SPI irradiations at 15 ± 1 dpa and 1320 ± 100 appm He (red squares). The de-superimposed σHe (purple circles) are approximately athermal between 250 and 520 °C. The isolated σHe, from Equation (7), must be re-superimposed with the other contributions in assessing the net hardening, shown as the red squares. The combined softening and re-hardening predictions’ effects as a function of the log of dpa, used in the following analysis, are shown as the dashed lines in the previous Figure 4c.
He re-hardening would be expected to greatly retard creep in fusion environments, if softening failure (by whatever metric) did not occur sooner. We applied the same approach for re-hardening as we used for softening, but in this case, based on the dpa- and He/dpa-dependent σ/σo. The primary creep curves as a function of dpa were obtained by first dividing εx by εx′ to determine the creep time under irradiation, tx, which was then multiplied by the dpa rate, here taken as 10−6 dpa/s. The results of irradiation softening and He re-hardening are described in the next section.
3. Results
3.1. Primary Creep Models for 375 to 550 °C
We first LSF the σ/σo primary creep model to the datasets for all 17 heats 9Cr TMS for primary strains (εx) from 0.2 to 2%, temperatures (T) from 375 to 550 °C and times (tx) from ≈10 h to 8 × 10⁴ h [9,10,11,12]. Fits to the temperature-compensated txc = tx exp(−Q/RT) for the 17-heat database at various εx (Equation (3d)) are shown in Figure 2a. The corresponding polynomial fit cross-plots for Ci as a function of εx are shown in Figure 2b. In this case, the LSF-optimized Q = 335 kJ/mole. This is higher than that for self-diffusion in iron and steels, which ranges from ≈250 to 300 kJ/mol in a wide range of references. However, this is not abnormal. For instance, Wilshire et al. [8] used a Q value of 300 kJ/mol for their σ/σo creep model analysis of Gr91/92 steels. Our creep model predicts a slightly higher Q, based on a least square fit to the data, which we do not choose to defy, and a model which is clearly described as being “data-driven”. The activation energy for creep alloys is influenced by an interplay of multiple factors and mechanisms. For example, the higher Q may reflect deviations from pure diffusion control due to factors such as the approximation in using the temperature dependence of σo(T) to normalize σ.
The predicted versus measure (P/M) fit results shown in Figure 7a have an RMSE and ME of 11.3 MPa and −0.004 MPa, respectively. The 1:1 line P/M intercept is 0/0. P-M residual plots are well-centered and show no systematic bias in the independent variables (T, εx and tx). The LSF lines in the σ/σo versus txc data for εx = 1% in Figure 7b show only small differences between the various TMS [9,10,11]. For an ε = 1% in Eurofer97 at tx = 8670 h (1 year), the predicted σ/σo is ≈0.44 at 550 °C (σ ≈ 150 MPa). We also LSF the data for the eight heats of Eurofer97 over a narrower T range of 450 to 550 °C [9], as shown in Figure 7c. The LSF Q is again 335 kJ/mole. The RMSE and ME are 10.6 and −0.005 MPa, with a P/M slope of 1/1 and a P/M intercept of 0/0. Again, the residual plots are well-centered and show no systematic bias. The fit parameters for the data in Figure 7a,c are summarized in Table 2. Figure 7d shows the σ P/M plot for all 17 heats in our database using the LSF model for the eight Eurofer97 heats, again over a narrower range of creep conditions. In that case, the RMSE and ME are 11.7 MPa and 1.148 MPa, respectively, with a P/M slope of 1.036 and a P/M intercept of −7.3 MPa. While the fit to all the data is slightly worse, in this case, it is tremendously significant that the Eurofer97 model predicts the σ/σo so well for a much wider range of TMS heats and creep conditions.
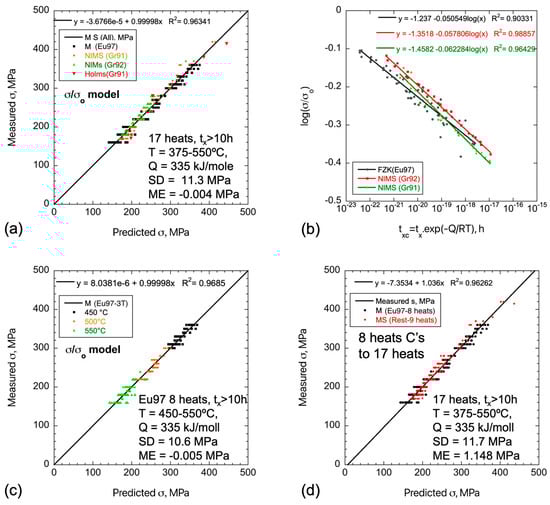
Figure 7.
(a) The σ P/M plot for the σ/σo model calibrated to all 17 TMS heats in our database; (b) log σ/σo versus log txc data and fits, at εx = 1%, for 16 TMS heats; (c) the σ P/M plot for the σ/σo model calibrated to the 8 heats of Eurofer97, between 450 and 550 °C; and (d) the σ P/M plot for all 17 heats using the LSF model for 8 heats of Eurofer97. The black and red symbols are for the 8 Eurofer97 and 9 other TMS heats, respectively.
Table 2.
LSF parameters, RMSEs and MEs for normalized σ/σo primary creep models.
3.2. Primary Creep Curve ε(σ, T, t) Predictions
Most data sources do not include continuous creep curves [9,10,11,12]. In our work, the primary creep results were used to model continuous creep curves, ε(σ,T,t) and ε′(σ,T,t), by first fitting the discrete εx − tx data points and then taking the corresponding fitted ε(σ,T,t) curve derivative to evaluate ε′(σ,T,t). Further, Equation (2) can be rewritten with εx′ at tx as
Here, the Ai and ni are LSF parameters that were optimized for ε′ rather than σ. The corresponding tx(h) is found by dividing ε(x) by ε′(x).
ε′(x) = (A1 + A2εx +A3εx2)(σ/σo)[n1 + n2ln(εx)] exp(−Q/RT)
The P/M tx for Eurofer97 ε′(x) curves [9] in Figure 8a, for σ from 300 MPa to 360 MPa at 450 °C, show the results for tx down to 0.2 h. While the range of σ is small, the corresponding tx varies by a factor of >104 due to the large n ≈ 20. As a result of the large n, the predicted tx (txp) uncertainties are larger than those for σ/σo. For the tx > 10 h calibration, the mean bias of txm/txp ranges from 0.46 to 2.63 with a mean of ≈1.09 and RMSE ≈±0.48, corresponding to a 2 RMSE minimum txm ≈ 0.13txp. Notably, however, for n ≈ 20, reducing σ/σo by a modest factor of ≈0.9 leads to txm ≈ txp.
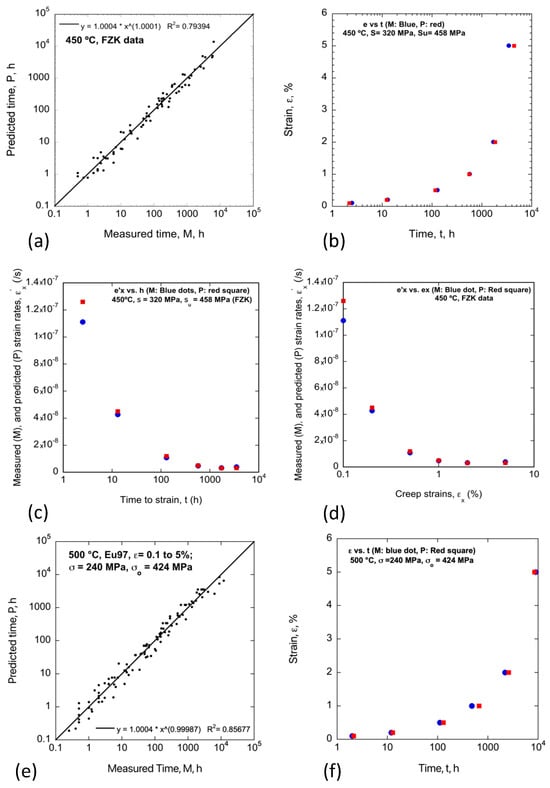
Figure 8.
(a) The σ/σo model M/P tx at 450 °C for the Eurofer97 database [9]; (b–d) creep curves at 450 °C and σ/σo = 0.71 (σ = 450 MPa) for (b) εx(t); (c) ε′x(tx); and (d) ε′x(εx) [9]; (e) the P/M tx for σ/σo = 0.57 (σ = 240 MPa) at 500 °C; and (f) the 500 °C creep curve for σ/σo = 0.57 (σ = 240 MPa) [9]. Here, the red and blue data symbols are for the predictions and the reported measured data or data fits, respectively.
Figure 8b–d show the predicted ε(t), ε′x (tx) and ε′x (εx) curves, respectively, for σ/σo = 0.7 at 450 °C. Here, the red and blue data symbols are for the predicted and measured values, respectively. Figure 8e shows the P/M tx and the ε(tx) curve for σ/σo = 0.57 at 500 °C. Here, the mean txm/txp ≈ 1.1 with an RMSE ± 0.51, and the 2 RMSE minimum txm ≈ 0.09txp. Again, however, reducing σ/σo by a factor of slightly less than 0.9 results in a similar increase in txp. Note that these estimated margins do not account for the uncertainty in σo. Overall, we estimate that a σ/σo safety factor of 0.85 will conservatively bind all the Eurofer97 txm and account for reasonable values of other sources’ uncertainties, including T. In any event, the effects of such estimated uncertainties on σ/σo and tx can be quantitatively evaluated, as discussed in Section 6. Finally, Figure 8f shows the 500 °C creep curve for σ/σo = 0.57 (σ = 240 MPa).
4. A Primary Creep Model with Irradiation-Enhanced Softening
The solid blue line in Figure 4c shows the estimated average athermal σo(dpa) softening between 450 and 550 °C. Here, softening is treated by replacing the constant σ/σo with the corresponding σ/σo(dpa) ratio from Equations (6a) and (6b). Thus, softening increases σ/σo(dpa) beyond the dpat threshold. The ε′ in Equation (8) was adjusted in small ε increments of 0.01% from 0.1 to 5%, to determine the tx at εx as tx = εx/εx′. The discrete tx(εx) was integrated to derive the continuous creep curves. The tx was then converted to dpax by multiplying by 10−6 dpa/s. The dpax for at least 10 to 15 σ at each T was evaluated. Figure 9a shows an example of thermal (black) and irradiation-softening (green) creep curves at 550 °C and a pre-softening σ/σo = 0.4 (σ = 140 MPa). A larger tx and higher dpa (longer t) increase the effect of softening. This is shown in Figure 9b in the log–log plot of the predicted thermal (dpat) versus the irradiation-softening (dpas) from εx = 0.2 to 5% for the Eurofer97 database [9]. The data points fall in a reasonably tight band, with dpas ≈ 2.13 (±0.1) dpat2/3, for εx ≈ 1 to 5%. For example, softening only decreases for dpat = 10 to dpas ≈ 9.7, while for dpat = 200, the softened dpas is ≈70.
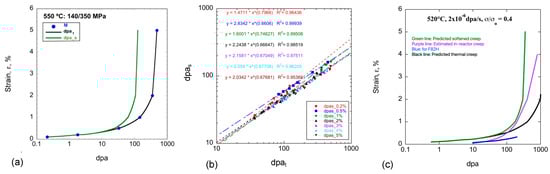
Figure 9.
(a) Creep εx(dpa) curves at 550 °C and σ/σo = 0.4 (σ = 140 MPa) with (green) and without (black) softening; (b) the dpax without versus with softening for εx = 0.2 to 5% for T from ≈450 to 550 °C and σ from 80 to 340 MPa; and (c) predicted in-reactor thermal primary creep curves for Eurofer97 (black) and F82H (blue) [6] compared to predictions for an in-reactor F82H creep rate curve (purple) [68], all at 520 °C and σ = 140 MPa. Here, the results have been interpolated to 520 °C between 500 and 550 °C, as needed. Again, the green curve is the corresponding σ/σo softening model prediction.
It would be useful to compare the predicted effects of softening with data obtained from in-reactor pressurized tube creep experiments. Unfortunately, while there is a substantial in-reactor creep database for austenitic stainless steels, this is not the case for 9Cr TMS. Furthermore, most in-reactor TMS experiments are intended to measure both IC and stress-enhanced void swelling at T less than 500 °C [3]. Perhaps the most relevant data were reported by Kohyama for irradiations of F82H at 520 °C, where creep occurs at a much greater rate than at a lower T [68].
Here, the in-reactor creep ε was given by
where the 550 °C B ≈ 3 × 10⁻⁶%/MPa3/2-dpa, compared to ≈5 × 10⁻⁷%/MPa3/2-dpa at 450 °C. The in-reactor creep rate tends to increase at a higher T and σ [41,69,70,71,72,73,74,75,76], as expected, in the thermal creep regime. The purple line in Figure 9c shows that the 520 °C in-reactor ε rate of F82H is reasonably consistent with the softening predictions. Note that this may be a somewhat apples-and-oranges comparison due to differences in the steels and their corresponding unirradiated properties, as well as uncertainties in the creep parameters in Equation (9). Furthermore, the σ power n dependence of 1.5 is inconsistently low compared to the thermal primary creep p ≈ 18 ±1 (note that the hardening exponents p and n are σp for creep and (σ/σo)n for normalized creep(σ/σo)n). The low value of p may indicate that some component of IC is present.
ε = Bσ1.5 dpa
More generally, the in-reactor creep database is extremely limited, and it is insufficient to reliably predict n. Finally, an equation in reference [6], shown by the blue line in Figure 9c, predicts an even lower thermal primary creep rate in F82H than either in-reactor or thermal primary creep in Euofer97. In principle, this might reflect strengthening, due to the higher W content in F82H. However, the empirical and physical basis for the F82H primary creep equation is not known. Nevertheless, these observations are qualitatively consistent with the higher T irradiation softening model concept.
5. Primary Creep with Irradiation Softening Followed by High-He Re-Hardening
The dashed blue line in the previous Figure 4c shows the athermal re-hardening effect on σy/σyu at a He/dpa = 10, between 450 and 550 °C. The effects of softening are reversed due to a decreasing σ/σo beyond the re-hardening threshold at Het ≈ 432 appm. Given the high (σ/σo)n sensitivity of ε′ (n ≈ 20), re-hardening is expected to greatly reduce the creep rate. To assess the effect of re-hardening, a subsequently decreasing σ/σo(dpa) in Equation (6b) was again used in the εx(dpa) creep model. Notably, re-hardening not only slows but also effectively arrests creep at a saturated εxs, which is a function of σ and T. Figure 10a shows the thermal εt(dpa) (black), softened εs(dpa) (green) and re-hardened εh(dpa) (red) curves, at 550 °C and σ/σo = 0.4 (σ = 140 MPa). Figure 10b shows the corresponding ε′(dpa) curves. Softening reduces the minimum creep condition from ≈480 to ≈125 dpa, while increasing the corresponding ε′m to 1.43 × 10⁻⁶/h from 3.75 × 10⁻⁷/h. The high-He-re-hardening creep rate starts to decrease rapidly near ≈43 dpa, and it effectively saturates at 1% by ≈120 dpa. Figure 10c plots the softening dpas and re-hardening dpah versus the thermal dpat at εx = 1%. Initially, the dpas and dpah are much less than dpat, but the re-hardening dpah increases rapidly, starting at about 120 dpat, marking the effective arrest of creep. Similar behavior was generally observed at other εx, with creep arrest between ≈120 and 150 dpa. Figure 10d summarizes the re-hardening σ as a function of εx (from 0.2 to 5%) and T. Figure 10e shows εxs as a function of σ/σo from 0.2 to 2%, and T at 450, 500 and 550 °C. σ/σo(εxs) are similar at 500 and 550 °C, but they are shifted to much higher values at 450 °C.
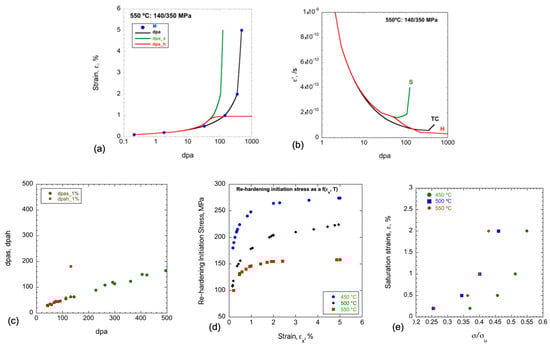
Figure 10.
Thermal creep (t, black), softened (s, green) and hardened (h, red) creep curves: (a) ε(dpa) at 550 and σ/σo = 0.4 (σ = 140 MPa); (b) ε′(dpa) at 550 and σ/σo = 0.4; (c) dpas (green) and dpah (red) dpa up to dpat 200 dpa at εx =1%; (d) re-hardening initiation σ as a function of εx at various T; and (e) εxs versus σ/σo, at various T.
6. Negligible Creep and Strain Limits for Eurofer97
Figure 11 shows Eurofer97 σ versus T plots, for times of 104, 5 × 10⁴ and 105 h, at what might be considered negligible creep and deformation limit conditions, here taken as εx = 0.2% and 1%, respectively. The Eurofer97 8-heat σ/σo model was used to predict σ, for σo of 455 ± 10, 418 ± 9 and 356 ± 12 MPa at 450, 500 and 550 °C, respectively, as the average σo of Eurofer97 heats fitted to a second-order polynomial was used to estimate σo at 5 °C intervals. As noted previously, the model can also be used to estimate the effects of uncertainties or variations in σo, as well as service conditions, like T and irradiation. For example, the effects of variations in T on σ/σo are primarily controlled by Q; thus,
σ(T1)/σ(T2) = {exp(−[Q/R](1/T1 − 1/T2)}1/n
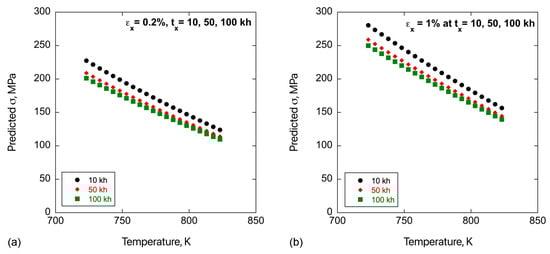
Figure 11.
Predicted σ, using Eurofer97 8 heat model, needed to reach 10, 50 and 100k h at εx: (a) 0.2% and (b) 1%.
Assuming Q = 335 and a nominal n ≈20, an increase in T by 20° C would reduce σ/σo by about 4%. The same creep rates would occur when fractional reductions σo were matched by similar reductions in σ. Other such assessments are left to the reader. Overall, we estimated that reductions in σ by a factor of 0.85 provide conservative evaluations of primary creep.
7. Summary, Caveats, Context and Implications
Empirical thermal creep models typically focus on minimum rates and rupture times. However, the accumulation of ε during rapid primary creep cannot be neglected, especially for large, interconnected, gradient-dominated, complex, high-precision structures, like in fusion reactors. The main objective of this research was to calibrate a new, easy-to-use primary creep model for 9Cr TMS. An important secondary objective was to evaluate the consistency of the 17 TMS heat fitted model with primary creep in 8 heats of RAFM Eurofer97. Several predictive approaches were evaluated, but the most accurate was provided by a model based on the applied stress (σ) normalized by the steel’s temperature-dependent ultimate tensile stress (σo), σ/σo(T). We showed that the σ/σo approach, championed by Wilshire et al. [8], is a robust method of predicting primary creep σ(εx) for a wide range of TMS with different unirradiated properties and conditions. We believe that the new σ/σo(T) model is unique and, for the first time as far as we know, uses a convenient cross-fitting procedure to accurately predict σ as a function of εx, for times tx from 10 to 8 × 10⁴ h, εx from 0.2 to 5% and T from 375 to 550 °C. The σ/σo(T) model, which was fit to primary creep data for 17 heats of 9Cr TMS, resulted in a predicted σ root mean square error (RMSE) of ≈±11 MPa and a mean error (ME) of ≈0. We also showed that the σ/σo model can also be used to predict continuous creep curves, ε(σ, T).
The σ/σo(T) model predictions should be verified for any specific heat of 9Cr TMS. For example, here, we focused on a narrower calibration for the eight-heat Eurofer97 database [9], with a σ RSME ≈ 10.6 MPa. Recalibration for other new alloys intended for actual service will also be required. But it is both encouraging and important that the predictions for Eurofer97 are very consistent with those of other TMS and wide ranges of T, εx and tx. Additional comparisons and recalibrations are also warranted, especially for newer, advanced TMS variants.
A second objective was to explore the potential effects of irradiation service phenomena, which were not previously considered. Notably, we showed that the σ/σo(T) model can be used to treat possible effects of irradiation service which result in time-dependent σo(T) as a function of dpa and He. The irradiation effects include (a) softening, as a function of dpa, at T above ≈400–450 °C, in low-He fission (<<1 He/dpa) environments; and (b) subsequent re-hardening, in high-He (≈10 He/dpa) fusion first-wall environments. While these irradiation effects on primary creep are not yet experimentally verified, so we do not claim that our predictions are quantitatively accurate, they highlight currently unrecognized, but potentially very important phenomena. These include the acceleration of primary creep at a low He/dpa (fission) and arrest of creep at a high He/dpa (fusion).
Our treatment of irradiation effects involves a number of assumptions, approximations and limitations. Most notably, there are almost no direct data on the softening and He effects on primary thermal creep in 9Cr TMS, from in-reactor pressurized tube studies including post irradiation hardness tests. We further assume that the complex, multiscale, multi-mechanism physics of softening and re-hardening can be captured in simple, analytic LSF empirical models. Furthermore, data on irradiation softening and high-He re-hardening are themselves scattered and limited. Thus, it is encouraging it appears that irradiation-enhanced softening can be reasonably understood in terms of a shift in thermal aging effects to lower T and t, primarily due to RED. Notably, however, the severe effects of σ on softening [25,35,36,37,77] and, especially, cyclic loading [75,76] are not treated. Furthermore, while the predicted effects of high-He re-hardening are reasonably consistent with known microstructure–property relations, they require further refinement and verification. Thus, we categorize the predictions of these irradiation effects on thermal primary creep, due to an evolving σo(T, dpa, He), as qualitatively reasonable and pointing in the right direction. However, they are likely underestimates of primary creep rates for actual in-service creep conditions, which are subject to synergistic effects of irradiation, σ and low, most notably, low cycle fatigue. Note that these σ/σo(T, dpa) models of irradiation effects apply to dislocation creep, and not to lower T IC at lower T, or low σ–high T diffusion creep. Furthermore, calibration involved only the base metal (plate) product form.
Nevertheless, recognizing possible effects of an evolving σo(T, dpa) brings into focus the research needed to develop physical models of primary creep under irradiation, which are more quantitative and predictive. For example, this research could involve extending detailed modeling studies of thermal softening mechanisms [20,23] to include the effects of RED. Post-irradiation hardness measurements on crept in-reactor pressurized tubes would be very useful to characterize the effect of σ on softening [36]. Softening under ion irradiation might also be explored. Refinement of high-He-re-hardening mechanisms, like targeted studies of He bubbles, enhanced dislocation loops and SPI solid transmutants’ strengthening, are also needed.
Finally, from a structural integrity perspective, it is important to consider all potential sources of dimensional instabilities, including void swelling and IC [1]. For example, if high He suppresses thermal creep in fusion environments, then swelling, which is likely stress-assisted, will present a major alternative life-limiting concern.
Author Contributions
Conceptualization, M.E.A. and G.R.O.; methodology, M.E.A., T.Y. and G.R.O.; software, M.E.A. and T.Y.; validation, M.E.A., T.Y. and G.R.O.; formal analysis, M.E.A. and G.R.O.; investigation, M.E.A., T.Y. and G.R.O.; data curation, M.E.A. and T.Y.; writing—original draft, M.E.A.; writing—review and editing, M.E.A., T.Y. and G.R.O.; visualization, M.E.A., T.Y. and G.R.O.; supervision, G.R.O.; project administration, G.R.O.; funding acquisition, G.R.O. All authors have read and agreed to the published version of the manuscript.
Funding
This research was funded by the U.S. Department of Energy through the Office of Fusion Energy Sciences (DE-FG02-94ER54275 and DE-SC0023092). The APC was waived by the journal, Metals (Invoice No: 3527626).
Data Availability Statement
The data used to analyze and model in this study are openly available in M. Rieth 2003 [9], NIMS-D1 (2007) [10], NIMS-48B (2018) [11] and S. Holmstrom 2016 [12]. However, details of the data curation and model coefficient will be available upon request.
Acknowledgments
We acknowledge the support provided by the U.S. Department of Energy through the Office of Fusion Energy Sciences (DE-FG02-94ER54275 and DE-SC0023092). We also thank the researchers who generated the creep data that we analyzed, with special thanks going to Michael Rieth (Karlsruhe, Germany), Stefan Holmstrom (Petten, Netherlands) and the researchers at NIMS (Tsukuba, Japan).
Conflicts of Interest
The authors declare no conflict of interest.
References
- Ghazari, A.; Forte, R.; Yamamoto, T.; Odette, R.; Ghoniem, N. Radiation Effects on Stress Evolution and Dimensional Stability of Large Fusion Energy Structures. Fusion Eng. Des. 2021, 172, 112756. [Google Scholar]
- Was, G.S. Fundamentals of Radiation Materials Science: Metals and Alloys, 2nd ed.; Springer: New York, NY, USA, 2017. [Google Scholar]
- Onimus, F.; Jourdan, T.; Xu, C.; Campbell, A.A.; Griffiths, M. Irradiation creep in materials: Comprehensive Nuclear Materials, 1st ed.; Konings, R., Stoller, R., Eds.; Elsevier: Amsterdam, The Netherlands, 2021; pp. 310–366. [Google Scholar]
- Bhattacharya, A.; Zinkle, S.J.; Henry, J.; Levine, S.M.; Edmondson, P.D.; Gilbert, M.R.; Tanigawa, H.; Kessel, C.E. Irradiation damage concurrent challenges with RAFM and ODS steels for fusion reactor first-wall/blanket: A review. JPhys Energy 2022, 4, 034003. [Google Scholar] [CrossRef]
- Cabet, C.; Dalle, F.; Gaganidze, E.; Henry, J.; Tanigawa, H. Ferritic-martensitic steels for fission and fusion applications. J. Nucl. Mater. 2019, 523, 510–537. [Google Scholar] [CrossRef]
- Nozawa, T.; Tanigawa, H.; Kojima, T.; Itoh, T.; Hiyoshi, N.; Ohata, M.; Kato, T.; Ando, M.; Nakajima, M.; Hirose, T.; et al. The status of the Japanese material properties handbook and the challenge to facilitate structural design criteria for DEMO in-vessel components. Nucl. Fusion 2021, 61, 116054. [Google Scholar] [CrossRef]
- Gorley, M.; Diegele, E.; Gaganidze, E.; Gillemot, F.; Pintsuk, G.; Schoofs, F.; Szenthe, I. The EUROfusion materials property handbook for DEMO in-vessel components—Status and the challenge to improve confidence level for engineering data. Fusion Eng. Des. 2020, 158, 111668. [Google Scholar] [CrossRef]
- Wilshire, B.; Scharning, P.J. A new methodology for analysis of creep and creep fracture data for 9–12% chromium steels. Int. Mater. Rev. 2008, 53, 91–104. [Google Scholar] [CrossRef]
- Rieth, M.; Schirra, M.; Falkenstein, A.; Graf, P.; Heger, S.; Kempe, H.; Lindau, R.; Zimmermann, H. EUROFER97. Tensile, charpy, creep and structural tests; No. FZKA—6911. Wiss. Berichte FZKA. 2003. Available online: https://inis.iaea.org/records/qjevg-ch908 (accessed on 16 March 2025).
- NIMS-D1, NIMS Creep Datasheet: Atlas of Creep Deformation Property, Vol. D-1, Creep Deformation Properties of 9Cr1MoVNb Steel for Boiler and Heat Exchangers, 2007. Available online: https://dice.nims.go.jp/notification/2023/01/20230117-3.html (accessed on 16 March 2025).
- Sawada, K.; Kimura, K.; Watanabe, T.; Ohba, T.; Abe, F.; Miyazaki, H.; Sekido, K.; Nojima, T.; Kushima, H.; Taniuchi, Y.; et al. NIMS-48B, NIMS Creep Data Sheet: No. 48B Data Sheet on the Elevated Temperature Properties of 9Cr-0.5Mo-1.8W-V-Nb Steel Tubes and Pipes for Power Boilers and High Temperature Service; National Institute for Materials Science: Ibaraki, Japan, 2018. [CrossRef]
- Holmström, S. Defining a negligible creep temperature curve for Gr. 91 steel. Int. J. Press. Vessel. Pip. 2016, 146, 198–202. [Google Scholar] [CrossRef]
- Callister, W.D.; Rethwisch, D.G. Materials Science and Engineering; John Wiley & Sons: Hoboken, NJ, USA, 2011. [Google Scholar]
- Nabarro, F.R.N.; de Villiers, F. Physics of Creep and Creep-Resistant Alloys; CRC Press: Boca Raton, FL, USA, 2018. [Google Scholar] [CrossRef]
- Abe, F. Effect of Fine Precipitation and Subsequent Coarsening of Fe2W Laves Phase on the Creep Deformation Behavior of Tempered Martensitic 9Cr-W Steels. Metall. Mater. Trans. A 2005, 36, 321–332. [Google Scholar] [CrossRef]
- Ren, F.; Tang, X. Study on creep behavior of Grade 91 heat-resistant steel using theta projection method. AIP Conf. Proc. 2017, 1890, 040003. [Google Scholar] [CrossRef]
- Spätig, P.; Chen, J.-C.; Odette, G.R. Ferritic and Tempered Martensitic Steels. In Structural Alloys for Nuclear Energy Applications, 1st ed.; Odette, G.R., Zinkle, S., Eds.; Elsevier: Boston, MA, USA, 2019; pp. 485–527. [Google Scholar] [CrossRef]
- Henry, J.; Maloy, S.A. Irradiation-resistant ferritic and martensitic steels as core materials for Generation IV nuclear reactors. In Structural Materials for Generation IV Nuclear Reactors; Elsevier Inc.: Amsterdam, The Netherlands, 2017; pp. 329–355. [Google Scholar] [CrossRef]
- Klueh, R.L.; Nelson, A.T. Ferritic/martensitic steels for next-generation reactors. J. Nucl. Mater. 2007, 371, 37–52. [Google Scholar] [CrossRef]
- Li, M.; Chen, W.Y. Microstructure-based prediction of thermal aging strength reduction factors for grade 91 ferritic-martensitic steel. Mater. Sci. Eng. A 2020, 798, 140116. [Google Scholar] [CrossRef]
- Klueh, R.L.; Harries, D.R. High-Chromium Ferritic and Martensitic Steels for Nuclear Applications; ASTM International: West Conshohocken, PA, USA, 2001. [Google Scholar]
- Yamamoto, T.; Odette, G.R.; Kishimoto, H.; Rensman, J.-W.; Miao, P. On the effects of irradiation and helium on the yield stress changes and hardening and non-hardening embrittlement of ∼8Cr tempered martensitic steels: Compilation and analysis of existing data. J. Nucl. Mater. 2006, 356, 27–49. [Google Scholar] [CrossRef]
- Li, M.; Natesan, K.; Chen, W. Report on Understanding and Predicting Effects of Thermal Aging on Microstructure and Tensile Properties of Grade 91 Steel for Structural Components; ANL-ART-108, August 2017; Argonne National Laboratory (ANL): Argonne, IL, USA, 2017. [Google Scholar]
- Mordehai, D.; Martin, G. Enhanced annealing of the dislocation network under irradiation. Phys. Rev. B 2011, 84, 14115. [Google Scholar] [CrossRef]
- Panait, C.G.; Bendick, W.; Fuchsmann, A.; Gourgues-Lorenzon, A.F.; Besson, J. Study of the microstructure of the Grade 91 steel after more than 100,000 h of creep exposure at 600 °C. Int. J. Press. Vessel. Pip. 2010, 87, 326–335. [Google Scholar] [CrossRef]
- Abe, F. Coarsening behavior of lath and its effect on creep rates in tempered martensitic 9Cr-W steels. Mater. Sci. Eng. A 2004, 387–389, 565–569. [Google Scholar] [CrossRef]
- Odette, G.R.; Yamamoto, T.; Williams, T.J.; Nanstad, R.K.; English, C.A. On the History and Status of Reactor Pressure Vessel Steel Ductile to Brittle Transition Temperature Shift Prediction Models. J. Nucl. Mater. 2019, 526, 151863. [Google Scholar]
- Tan, L.; Katoh, Y.; Tavassoli, A.A.F.; Henry, J.; Rieth, M.; Sakasegawa, H.; Tanigawa, H.; Huang, Q. Recent status and improvement of reduced-activation ferritic-martensitic steels for high-temperature service. J. Nucl. Mater. 2016, 479, 515–523. [Google Scholar] [CrossRef]
- Tanigawa, H.; Gaganidze, E.; Hirose, T.; Ando, M.; Zinkle, S.J.; Lindau, R.; Diegele, E. Development of benchmark reduced activation ferritic/martensitic steels for fusion energy applications. Nucl. Fusion 2017, 57, 092004. [Google Scholar] [CrossRef]
- Lindau, R.; Möslang, A.; Rieth, M.; Klimiankou, M.; Materna-Morris, E.; Alamo, A.; Tavassoli, A.A.F.; Cayron, C.; Lancha, A.M.; Fernandez, P.; et al. Present development status of EUROFER and ODS-EUROFER for application in blanket concepts. Fusion Eng. Des. 2005, 75–79, 989–996. [Google Scholar] [CrossRef]
- Ehrlich, K.; Cierjacks, S.W.; Kelzenberg, S.; Möslang, A. The development of structural materials for reduced long-term activation. In Effects of Radiation on Materials: 17th International Symposium; ASTM International: West Conshohocken, PA, USA, 1996. [Google Scholar]
- American Society of Mechanical Engineers (ASME). BPVC.III.5—BPVC Section III-Rules for Construction of Nuclear Facility Components-Division 5-High Temperature Reactors; Section III, Division 5; ASME: New York City, NY, USA, 2023; pp. 1–674. [Google Scholar]
- American Society of Mechanical Engineers (ASME). BPVC, Boiler and Pressure Vessel Code, Section II-Materials, Part A—Ferrous Materials Specification; Section II; ASME: New York City, NY, USA, 2023; pp. 1–804. [Google Scholar]
- Tavassoli, F. Eurofer steel, development to full code qualification. Procedia Eng. 2013, 55, 300–308. [Google Scholar] [CrossRef]
- Lee, H.-Y.; Kim, W.G. Influence of Thermal Aging on Material Strength Behavior in Grade 91 Steel. Trans. Korean Nucl. Soc. Autumn Meet. 2015, 3–5. [Google Scholar]
- Yano, Y.; Tanno, T.; Sekio, Y.; Oka, H.; Ohtsuka, S.; Uwaba, T.; Kaito, T. Tensile properties and hardness of two types of 11Cr-ferritic/martensitic steel after aging up to 45,000 h. Nucl. Mater. Energy 2016, 9, 324–330. [Google Scholar] [CrossRef]
- Nagasaka, T.; Ando, M.; Tanigawa, H.; Sakasegawa, H.; Tanaka, T.; Muroga, T.; Sagara, A. Tensile properties of F82H steel after aging at 400–650 °C for 1000–30,000 h. Fusion Eng. Des. 2017, 124, 1011–1014. [Google Scholar] [CrossRef]
- Klueh, R.L.; Vitek, J.M. Elevated-temperature tensile properties of irradiated 9Cr-1MoVNb steel. J. Nucl. Mater. 1985, 132, 27–31. [Google Scholar] [CrossRef]
- Klueh, R.L.; Maziasz, P.J. Effect of irradiation in HFIR on tensile properties of Cr-Mo steels. J. Nucl. Mater. 1992, 187, 43–54. [Google Scholar] [CrossRef]
- Kimura, A.; Morimura, T.; Narui, M.; Matsui, H. Irradiation hardening of reduced activation martensitic steels. J. Nucl. Mater. 1996, 233, 319–325. [Google Scholar] [CrossRef]
- Kohno, Y.; Kohyama, A.; Hirose, T.; Hamilton, M.L.; Narui, M. Mechanical property changes of low activation ferritic/martensitic steels after neutron irradiation. J. Nucl. Mater. 1999, 271–272, 145–150. [Google Scholar] [CrossRef]
- Kurishita, H. Tensile properties of reduced activation Fe-9Cr-2W steels after irradiation. J. Nucl. Mater. 1994, 271–272, 730–735. [Google Scholar] [CrossRef]
- Klueh, R.L.; Maziasz, P.J.; Zvitek, J.M. Postirradiation tensile behavior of nickel-doped ferritic steels. J. Nucl. Mater. 1986, 141–143, 960–965. [Google Scholar] [CrossRef]
- Seran, J.L.; Levy, V.; Dubuisson, P.; Gilbon, D.; Maillard, A.; Fissolo, A.; Touron, H.; Cauvin, R.; Chalony, A.; Le Boulbin, E. Behavior under neutron irradiation of the 15-15Ti and EM10 steels used as standard materials of the Phénix fuel subassembly. In Effects of Radiation on Materials: 15th International Symposium; No. CEA-CONF—10217; ASTM International: West Conshohocken, PA, USA, 1990. [Google Scholar]
- Klueh, R.L.; Vitek, J.M. Postirradiation tensile behavior of nickel-doped ferritic steels. J. Nucl. Mater. 1987, 150, 272–280. [Google Scholar] [CrossRef]
- Seran, J.L.; Alamo, A.; Maillard, A.; Touron, H.; Brachet, J.C.; Dubuisson, P.; Rabouille, O. Pre-and post-irradiation mechanical properties of ferritic-martensitic steels for fusion applications: EM10 base metal and EM10/EM10 welds. J. Nucl. Mater. 1994, 212, 588–593. [Google Scholar] [CrossRef]
- Sokolov, M.A.; Klueh, R.L.; Odette, G.R.; Shiba, K. Hiroyasu Tanigawa, Fracture Toughness Characterization of Irradiated F82H in the Transition Region. In Effects of Radiation on Material, 21th International Symposium, ASTM STP 1447; ASTM International: West Conshohoken, PA, USA, 2004; p. 408. [Google Scholar]
- Alamo, A.J.; Brachet, C.; Averty, X.; Shiba, K. Preliminary Results on Irradiation Experiment Performed in Osiris-Reactor at 325 °C Including RAF/M Steels; JAERI: Tokyo, Japan, 1997; pp. 256–264. [Google Scholar]
- Nanstad, R.K.; McClintock, D.A.; Hoelzer, D.T.; Tan, L.; Allen, T.R. High temperature irradiation effects in selected Generation IV structural alloys. J. Nucl. Mater. 2009, 392, 331–340. [Google Scholar] [CrossRef]
- Klueh, R.L.; Vitek, J.M. Tensile properties of 9Cr-1MoVNb and 12Cr-1MoVW steels irradiated to 23 dpa at 390 to 550 °C. J. Nucl. Mater. 1991, 182, 230–239. [Google Scholar]
- Nastasi, M.; Mayer, J.W. Ion beam mixing in metallic and semiconductor materials. Mater. Sci. Eng. R 1994, 12, 1–52. [Google Scholar]
- Iwamoto, Y.; Meigo, S.; Hashimoto, S. Estimation of reliable displacement-per-atom based on athermal recombination-correlated model in radiation environments a nuclear fission, fusion, and accelerator facilities. J. Nucl. Mater. 2020, 538, 152261. [Google Scholar]
- Frost, H.J.; Ashby, M.F. Deformation-Mechanism Maps: The Plasticity and Creep of Metals and Ceramics; Franklin Book Company; Pergamon Press: Oxford, UK, 1982. [Google Scholar]
- Greenwood, L.R. Neutron Interactions and Atomic Recoil Spectra. J. Nucl. Mater. 1994, 216, 29–44. [Google Scholar]
- Messina, L.; Nastar, M.; Sandberg, N.; Olsson, P. Systematic electronic-structure investigation of substitutional impurity diffusion and flux coupling in bcc iron. Phys Rev B Condens Matter Mater Phys 2016, 93, 184302. [Google Scholar] [CrossRef]
- Foulds, J.; Ren, W. Thermal Aging Effects on the Yield and Tensile Strength of 9Cr-1Mo-V (Grade 91). J. Press. Vessel. Technol. 2022, 144, 061505. [Google Scholar] [CrossRef]
- Dai, Y.; Odette, G.R.; Yamamoto, T. The effects of helium in irradiated structural alloys. Compr. Nucl. Mater. 2012, 1, 141–193. [Google Scholar] [CrossRef]
- Knitel, S.; Spätig, P.; Yamamoto, T.; Seifert, H.P.; Dai, Y.; Odette, G.R. Evolution of the tensile properties of the tempered martensitic steel Eurofer97 after spallation irradiation at SINQ. Nucl. Mater. Energy 2018, 17, 69–77. [Google Scholar] [CrossRef]
- Peng, L.; Dai, Y. Helium-induced hardening effect in ferritic/martensitic steels F82H and Optimax-A irradiated in a mixed spectrum of high energy protons and spallation neutrons. J. Nucl. Mater. 2011, 417, 996–1000. [Google Scholar]
- Vieh, C. Hardening Induced by Radiation Damage and Helium in Structural Materials. Ph.D. Thesis, École Polytechnique Fédérale de Lausanne, Lausanne, Switzerland, 2015. [Google Scholar]
- Jung, H.J.; Edwards, D.J.; Kurtz, R.J.; Yamamoto, T.; Wu, Y.; Odette, G.R. Structural and chemical evolution in neutron irradiated and helium-injected ferritic ODS PM2000 alloy. J. Nucl. Mater. 2017, 484, 68–80. [Google Scholar] [CrossRef]
- Jung, H.J.; Edwards, D.J.; Kurtz, R.J.; Odette, G.R.; Wu, Y.; Yamamoto, T. Microstructural Summary of ODS Ferritic Alloys (14YW, 14YWT, 12YWT, MA957FR, PM2000) and RAFM Steels (F82H Mod.3-CW, Eurofer97) from JP27 In-Situ He Injection (ISHI) Experiment at 500 °C; Fusion Semi-Anual Report DOE-ER-031; U.S. Department of Energy, Office of Scientific and Technical Information: Oak Ridge, TN, USA, 2015; pp. 55–65.
- Cui, L.; Li, J.; Gerstl, S.; Pouchon, M.; Dai, Y. Quantitative APT analysis of solid transmutants in ferritic-martensitic steels after irradiation in SINQ targets: Experimental validation of neutronic calculations. Nucl. Instrum. Methods Phys. Res. B 2021, 502, 1–9. [Google Scholar] [CrossRef]
- Peng, L.; Xie, Y.; Ge, H.; Dai, Y.; Huang, Q.; Wan, Y. Correlation between microstructure and hardening of 9Cr ferritic/martensitic steels irradiated in spallation neutron source. J. Nucl. Mater. 2024, 597, 155122. [Google Scholar] [CrossRef]
- Dai, Y.; Krsjak, V.; Kuksenko, V.; Schäublin, R. Microstructural changes of ferritic/martensitic steels after irradiation in spallation target environments. J. Nucl. Mater. 2018, 511, 508–522. [Google Scholar] [CrossRef]
- Odette, G.R.; Lucas, G.E. Recent progress in understanding reactor pressure vessel steel embrittlement. Radiat. Eff. Defects Solids 1988, 144, 189–231. [Google Scholar]
- Bhattacharyya, D.; Yamamoto, T.; Wells, P.; Marquis, E.; Bachhav, M.; Wu, Y.; Davis, J.; Xu, A.; Odette, G.R. Microstructural changes and their effect on hardening in neutron irradiated Fe-Cr alloys. J. Nucl. Mater. 2019, 519, 274–286. [Google Scholar] [CrossRef]
- Kohyama, A.; Kohno, Y.; Asakura, K.; Yoshino, M.; Namba, C.; Eiholzer, C.R. Irradiation creep of low-activation ferritic steels in FFTF/MOTA. J. Nucl. Mater. 1994, 212–215, 751–754. [Google Scholar]
- Toloczko, M.B.; Grambau, B.R.; Garner, F.A.; Abe, K. Comparison of Thermal Creep and Irradiation Creep of HT9 Pressurized Tubes at Test Temperatures from ~490 °C to 605 °C. In Effects of Radiation on Materials: 20th International Symposium; ASTM International: West Conshohocken, PA, USA, 2001. [Google Scholar]
- Ando, M.; Li, M.; Tanigawa, H.; Grossbeck, M.L.; Kim, S.; Sawai, T.; Shiba, K.; Kohno, Y.; Kohyama, A. Creep behavior of reduced activation ferritic/martensitic steels irradiated at 573 and 773K up to 5dpa. J. Nucl. Mater. 2007, 367–370, 122–126. [Google Scholar] [CrossRef]
- Uehira, A.; Mizuta, S.; Ukai, S.; Puigh, R.J. Irradiation creep of 11Cr–0.5 Mo–2W, V, Nb ferritic–martensitic, modified 316, and 15Cr–20Ni austenitic SS irradiated in FFTF to 103–206 dpa. J. Nucl. Mater. 2000, 283, 396–399. [Google Scholar]
- Yano, Y.; Yamashita, S.; Ohtsuka, S.; Kaito, T.; Akasaka, N.; Shibayama, T.; Watanabe, S.; Takahashi, H. Mechanical properties and microstructural stability of 11Cr- ferritic/martensitic steel cladding under irradiation. J. Nucl. Mater. 2010, 398, 59–63. [Google Scholar]
- Garner, F.A.; Puigh, R.J. Irradiation creep and swelling of the fusion heats of PCA, HT9 and 9Cr-1Mo irradiated to high neutron fluence. J. Nucl. Mater. 1991, 179, 577–580. [Google Scholar]
- Garner, F.A.; Toloczko, M.B.; Sencer, B.H. Comparison of swelling and irradiation creep behavior of fcc-austenitic and bcc-ferritic/martensitic alloys at high neutron exposure. J. Nucl. Mater. 2000, 276, 123–142. [Google Scholar] [CrossRef]
- Führer, U.; Aktaa, J. Modeling the cyclic softening and lifetime of ferritic-martensitic steels under creep-fatigue loading. Int. J. Mech. Sci. 2018, 136, 460–474. [Google Scholar] [CrossRef]
- Aktaa, J.; Walter, M.; Angella, G.; Cippo, E.P. Creep-fatigue design rules for cyclic softening steels. Int. J. Fatigue 2019, 118, 98–103. [Google Scholar] [CrossRef]
- Masuyama, F.; Yamaguchi, T. New ferritic steels beyond Grade 92 and its creep degradation assessment by hardness method for Grade 91. In ASME Symposium on Elevated Temperature Application of Materials for Fossil, Nuclear, and Petrochemical Industries; American Society of Mechanical Engineers: Seattle, WA, USA, 2014; pp. 1–8. [Google Scholar]
Disclaimer/Publisher’s Note: The statements, opinions and data contained in all publications are solely those of the individual author(s) and contributor(s) and not of MDPI and/or the editor(s). MDPI and/or the editor(s) disclaim responsibility for any injury to people or property resulting from any ideas, methods, instructions or products referred to in the content. |
© 2025 by the authors. Licensee MDPI, Basel, Switzerland. This article is an open access article distributed under the terms and conditions of the Creative Commons Attribution (CC BY) license (https://creativecommons.org/licenses/by/4.0/).