Article

Numerical Analysis of Thermal and Flow Behaviors with Weld Microstructures During Laser Welding with Filler Wire for 2195 Al-Li Alloys

1
College of Missile Engineering, Rocket Force University of Engineering, Xi’an 710025, China
2
College of Chemistry and Materials Science, Jinan University, Guangzhou 510632, China
*
Authors to whom correspondence should be addressed.
Metals 2025, 15(4), 348; https://doi.org/10.3390/met15040348
Submission received: 4 February 2025 / Revised: 13 March 2025 / Accepted: 20 March 2025 / Published: 23 March 2025
(This article belongs to the Special Issue Advances in Welding and Joining of Alloys and Steel)

Abstract

This study investigates the effects of heat transfer and molten pool flow behavior on the final structure of laser filler wire welds, aiming to improve weld quality. Laser filler wire welding experiments and numerical simulations were performed on 2195 Al-Li alloy workpieces with varying welding parameters. Numerical simulation of the heat transfer and flow in the molten pool was carried out using the CFD method, and the moving filler wire was introduced from the computational boundary by secondary development. Simulation results indicated that reducing welding speed and increasing wire feeding rate enhanced the cooling rate of the weld. Additionally, energy absorbed by the filler wire contributed between 6% and 16% of the total energy input during the liquid bridge transition. Comparing experimental and simulation data revealed that the cooling rate significantly affected the weld’s micro-structure and hardness. Notably, the formation of the equiaxed grain zone (EQZ) was crucial for weld performance. Excessive cooling rates hindered EQZ formation, reducing flow in this critical region. These findings offer valuable insights for optimizing welding parameters to enhance weld quality and performance.

1. Introduction

Laser welding offers several advantages, including high energy efficiency, rapid welding speed, narrow welds, deep penetration, and a small heat-affected zone. These benefits make it a critical method for precision welding of metal materials in aerospace manufacturing. Compared to traditional welding techniques, laser welding offers additional merits, such as reduced distortion and improved penetration, which have led to its widespread adoption in metal joining applications [1]. The physical phenomena involved in laser welding are complex and interdependent, making the simulation of the process particularly challenging due to the coupling of multiple physical processes [2,3,4].
Laser welding with filler wire is a more complex dynamic process than deep penetration laser welding, as it involves the interaction between the filler wire and the workpiece. This process is highly intricate, involving multiple physical dynamics. In recent years, many researchers have highlighted the significant influence of weld pool dynamics on the formation of defects and the mechanical properties of the weld. Numerous studies have focused on examining weld pool behavior through both experimental approaches and numerical simulations. Nath et al. [5] used a high-speed camera to investigate the impact of the vertical distance between the laser–wire intersection and the workpiece on the droplet transition during the welding process. They discussed the differing movement characteristics of the liquid bridge transition and the globular transition. Dhanaraj et al. [6] compared various wire front geometries and melt transitions under different welding parameters. They observed that the melt transfers from the wire tip to the keyhole and proposed a formula to calculate the angle between the oblique section of the molten wire flow and the laser beam based on energy balance. Wang et al. [7] measured the reflected power of the laser beam from the melted wire surface and found that higher laser power results in a greater proportion of reflected power. They also determined that weld quality is optimal when the wire feeding angle is between 45°and 60° relative to the horizontal direction. Li et al. [8] proposed a hybrid numerical model for gas tungsten arc (GTA) welding, considering both 2D and 3D perspectives. Their simulation showed that the weld pool depth decreases when filler wire is used, and that the energy absorbed by the wire accounts for nearly 10% of the total energy transferred to the workpiece. Yang et al. [9] found that a well-designed groove, stable wire feeding, an appropriate liquid bridge transfer mode, and properly increased heat input can significantly improve welding quality. Meng et al. [10] developed a multi-physical model for filler wire laser welding with electromagnetic stirring and employed the ray tracing method. They obtained the element distribution from the filler wire in the weld and found that electromagnetic stirring enhances the mixing of the filler wire in the weld pool. Currently, there is limited research on the relationship between microstructure and molten pool flow in laser welding. Tan et al. [11] used a macro-scale dynamic model to predict fluid flow and heat transfer in the weld pool. They then used the thermal history from the macro simulation as input for a three-dimensional cellular automata model to predict meso-scale grain growth. Alexander Malikov et al. demonstrated that post-weld heat treatment (quenching and aging) of Al-2.8Cu-1.7Li joints homogenized the solid solution, promoted δ’(Al3Li) precipitation, and enhanced tensile strength to 93% of the base metal (510 MPa) via partial T1/T2 phase formation [12]. S. Jabar et al. optimized steel-to-aluminum joints using laser beam shaping, achieving 16% higher weld strength and 50% reduced interfacial intermetallic compound (IMC) thickness by stabilizing keyhole dynamics through core/ring beam power ratio adjustments [13]. Xinyi Zhang et al. reported that AA2060 Al-Li alloy welded with AlSi12 filler exhibited 80% base metal tensile strength (416 MPa), attributed to LiAlSi and CuAl2 phases in the fusion zone (FZ), despite reduced FZ microhardness (90–120 HV0·1) [14]. Wenchao Ke et al. developed a numerical model for laser oscillating welding of 5A06 aluminum alloy, showing that infinity-oscillating paths at 200 Hz fully suppressed porosity, validated by FLUENT-based simulations [15]. Lin Shi et al. further linked oscillating laser welding (OLBW) to <0.6% porosity in 304 stainless steel via enhanced bubble migration and keyhole absorption mechanisms (keyhole velocity ≥504.6 mm/s) [16]. Chu Han et al. established a 3D multi-scale phase-field model for Al-Li alloy welding, revealing nucleation-dependent equiaxed-columnar grain transitions and non-dendritic equiaxed grain formation near fusion boundaries [17]. Then they identified dendrite fragmentation via helical molten flow and reheating-induced remelting as the grain refinement mechanism in oscillating laser welds of 2024 aluminum alloy. Collectively, these studies highlight advancements in phase control, beam modulation (oscillation, shaping), and multi-physics modeling to optimize joint strength, minimize defects, and tailor microstructures in laser welding [18]. P. Shi et al. modeled keyhole-induced pore formation, attributing porosity to high-frequency keyhole oscillations and bubble-solidification competition, validated by particle level-set simulations [19]. Yuewei Ai et al. correlated molten pool Rayleigh instability with weld defects, showing horizontal/vertical oscillations directly caused defect formation during cooling [20]. Tongtong Liu et al. reduced porosity in 7075 aluminum alloy by sinusoidal beam oscillation, which stabilized fluid flow (amplitude reduction at 100 Hz) and enlarged keyhole diameter, weakening surface tension effects [21]. Meng Jiang et al. compared pulsed-wave (PW) and continuous-wave (CW) modes, revealing PW’s superior penetration depth, periodic fluid flow, and refined dendrite structures due to rapid cooling [22].
In this study, three welding experiments with varying parameters, alongside their corresponding numerical simulations, were conducted. The numerical model incorporated a moving filler wire, allowing for the consideration of the interaction between the welding process and the workpiece. By analyzing the heat transfer and flow characteristics of the laser filler wire welding process, the study investigated the impact of these factors on the weld microstructure. The liquid bridge transition was identified as the primary mode of interaction between the filler wire and the weld pool in this experiment. A comparison between the calculated and experimental results served to validate the accuracy of the numerical simulation. The integration of experimental and simulation approaches facilitated an examination of the weld structure under different heat input conditions, providing insight into the influence of dynamic and thermodynamic factors on the resulting weld microstructure.

2. Mathematical Model

2.1. Governing Equations

Figure 1 illustrates the process of laser welding with filler wire. In this study, the welding wire flowed into the weld pool via the liquid bridge transfer mode upon melting. A numerical model was developed using the Eulerian numerical method. The model accounted for the interaction of multiple physical processes, including melting, evaporation, and solidification within the weld pool region, as well as heat transfer and multiphase flow throughout the entire system.
The computational domain size was set to 8 mm × 8 mm × 6.5 mm. The numerical calculations were performed using CFD software Fluent R2021. The mesh size from the edge of the computational domain to the middle zone of heat transfer and fluid flow occurred was reduced from 0.2 mm to 0.05 mm. A total of ~100,000 cells were present in the computational domain. For the computational setup, the iteration step was 0.0000025 s and the simulating time for different welding condition was 15 s. The boundary conditions in the metal phase region were set to ‘wall’ and those in the top face were set to ‘velocity inlet’. The remaining boundary surfaces were all set to ‘pressure outlet’. The workstation used in this study had double a EPYC AMD 7742 128-Core processor. Using transient mode calculations in the simulation, it was found that the simulation process was in a steady state after the wire touched the substrate. The computational domain parameters are shown in Figure 1.
In order to verify the mesh independence, we chose the boundary at the bottom of the computational domain, which was the pressure outlet, as the mesh consistency evaluation criterion. Since only air and no metallic material existed at this boundary, there were relatively few parameters. We compared the outlet pressure in terms of the mass flow rate of the outlet air and the outlet temperature at different mesh sizes (~55,000, ~70,000, ~85,000, ~100,000). Throughout the calculations, we simulated a 15 s laser filler wire welding process. For simulations with smaller mesh sizes, the computational accuracy and convergence need to be ensured by increasing the number of iterations for a single time step, which is about 100 iterations for a single time step for a mesh of 55,000. In contrast, a mesh size of 10,000 took just 20 iterations to convergence accuracy. We selected data from time milestone that were in steady state during the computation time for comparison. We finally selected data from the 8 s in the entire time step accumulation. The comparison results of three parameters for the calculation are shown in Figure 2. According to the comparison results, the values of different cell sizes float less and the mesh independence is better.
The continuity equation is described as:
ρ t + ρ u = 0
The momentum equations are described as:
ρ t u + ρ u u = p + μ u + S u
The momentum equation incorporates surface and volume forces, which are defined as source terms and included in the equation. In the above equation, u is velocity, μ is material viscosity, t is time, ρ is material density. The relationship between material properties and the surrounding environment is complex. In this context, viscosity is defined as a function of temperature, as referenced in previous research [23]. Similarly, thermal conductivity plays a significant role in heat transfer. Previous research provides substantial data obtained through extensive experimentation [24]. To simplify the calculations, other thermophysical parameters are assumed to be constant.
The energy equation is described as:
ρ h t + ρ u h = k T + S h
where h represent enthalpy, k is thermal conductivity and source term S h includes energy changes from surface convection, radiation, the latent of melt, evaporation, and solidification.
In the numerical model, the volume of fluid (VOF) model was employed to track the free interface between the gas and liquid phases in multiphase flow. The dynamic surface of the welding wire was also tracked in the simulation using the VOF method. Determining the spatial location of the welding wire within the computational domain is crucial for calculating the flow dynamics and energy transfer between the welding wire and the weld pool in this model.
The free interface can be determined using the following equation, where F represents the phase fraction of the metal phase within the computational domain.
F t + u F = 0

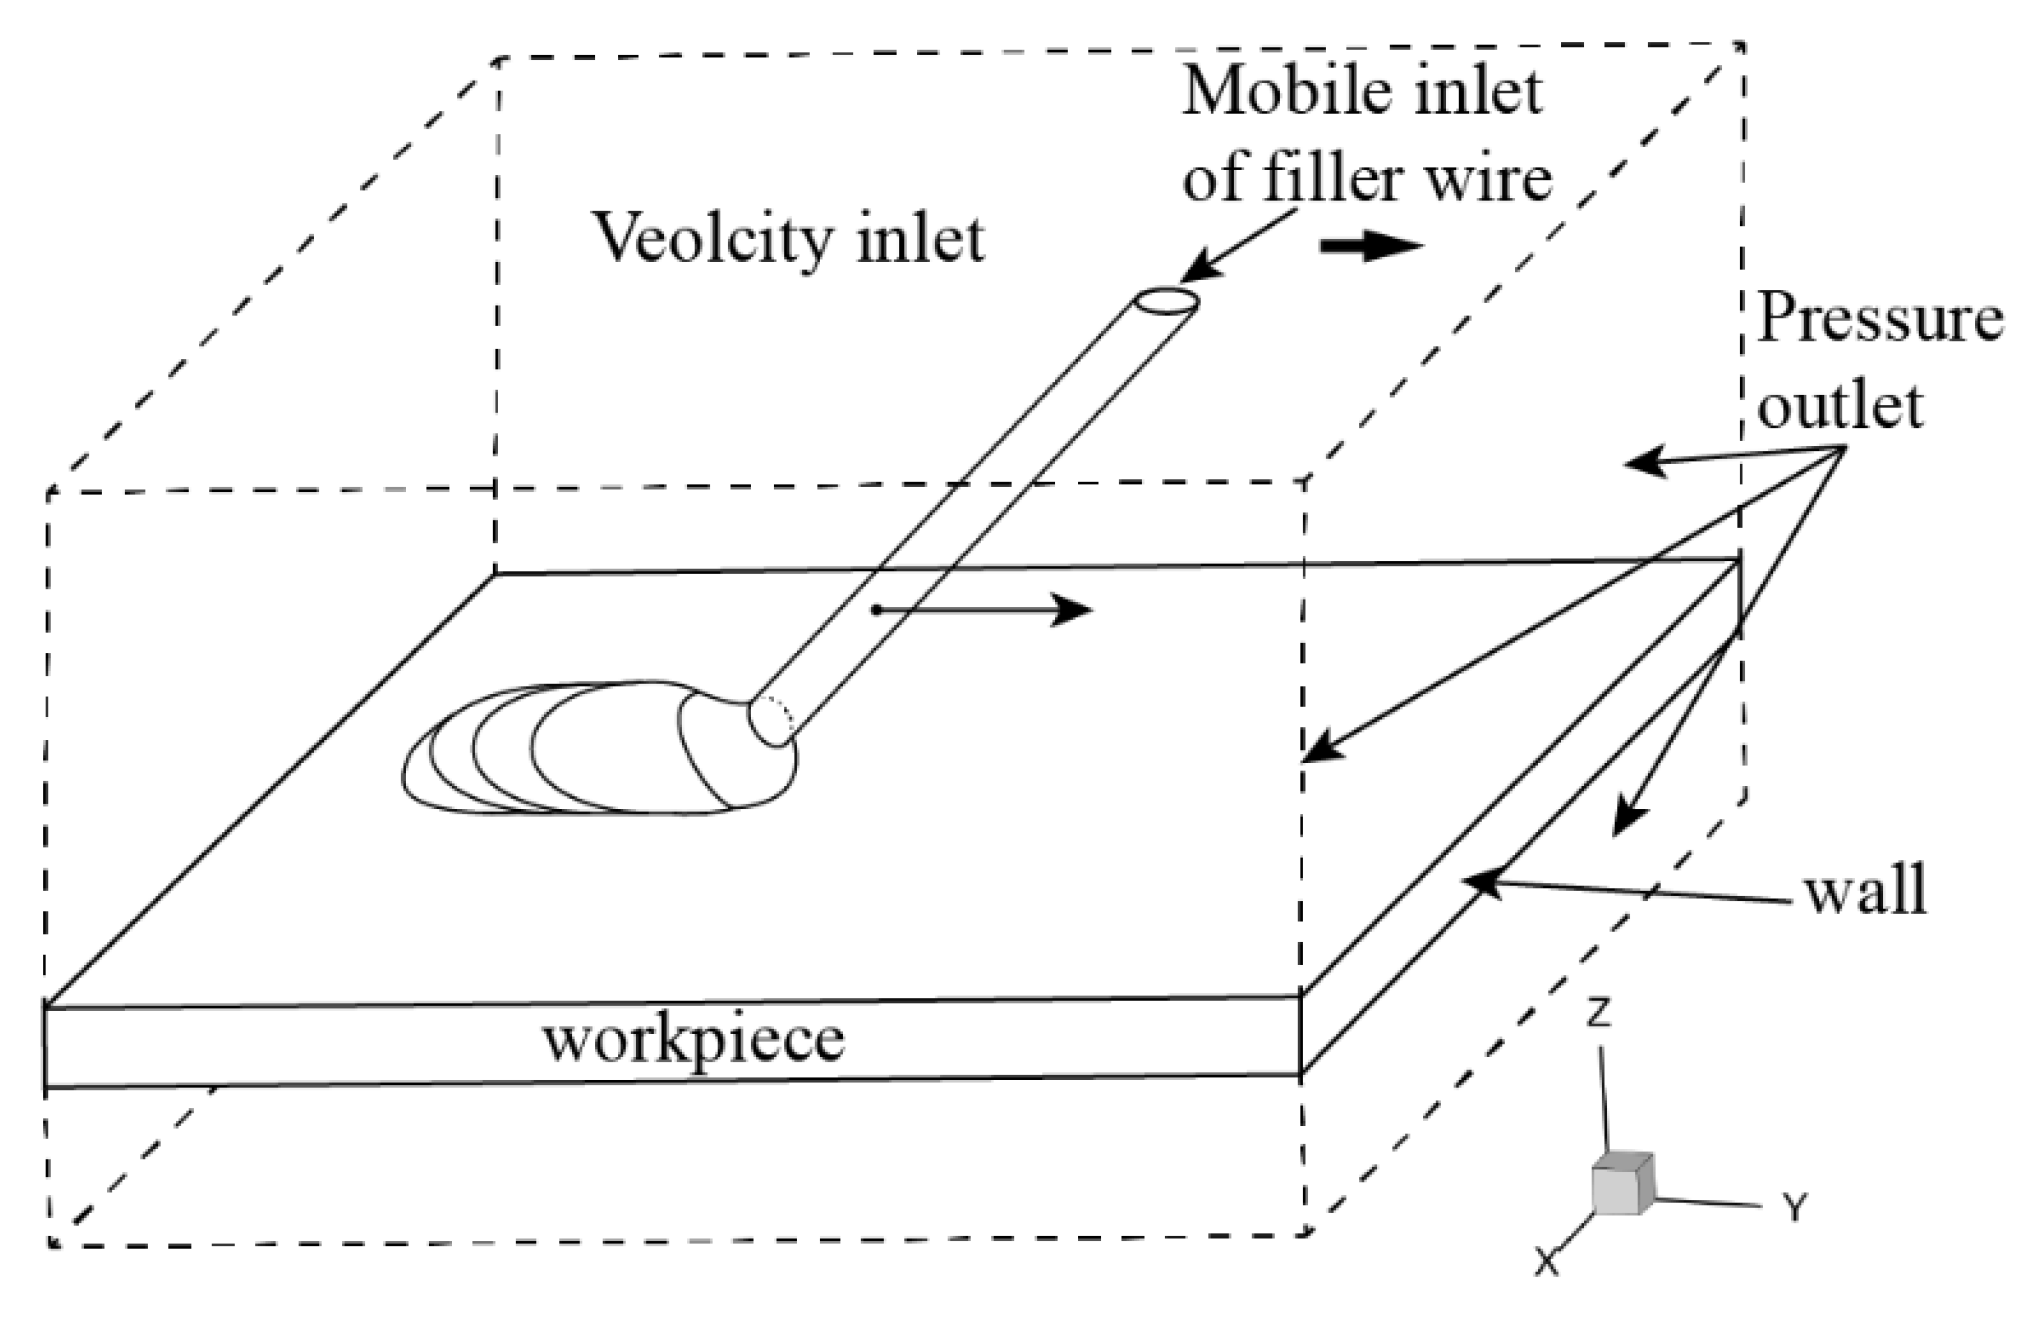
2.2. Boundary Condition and Contributing Factors
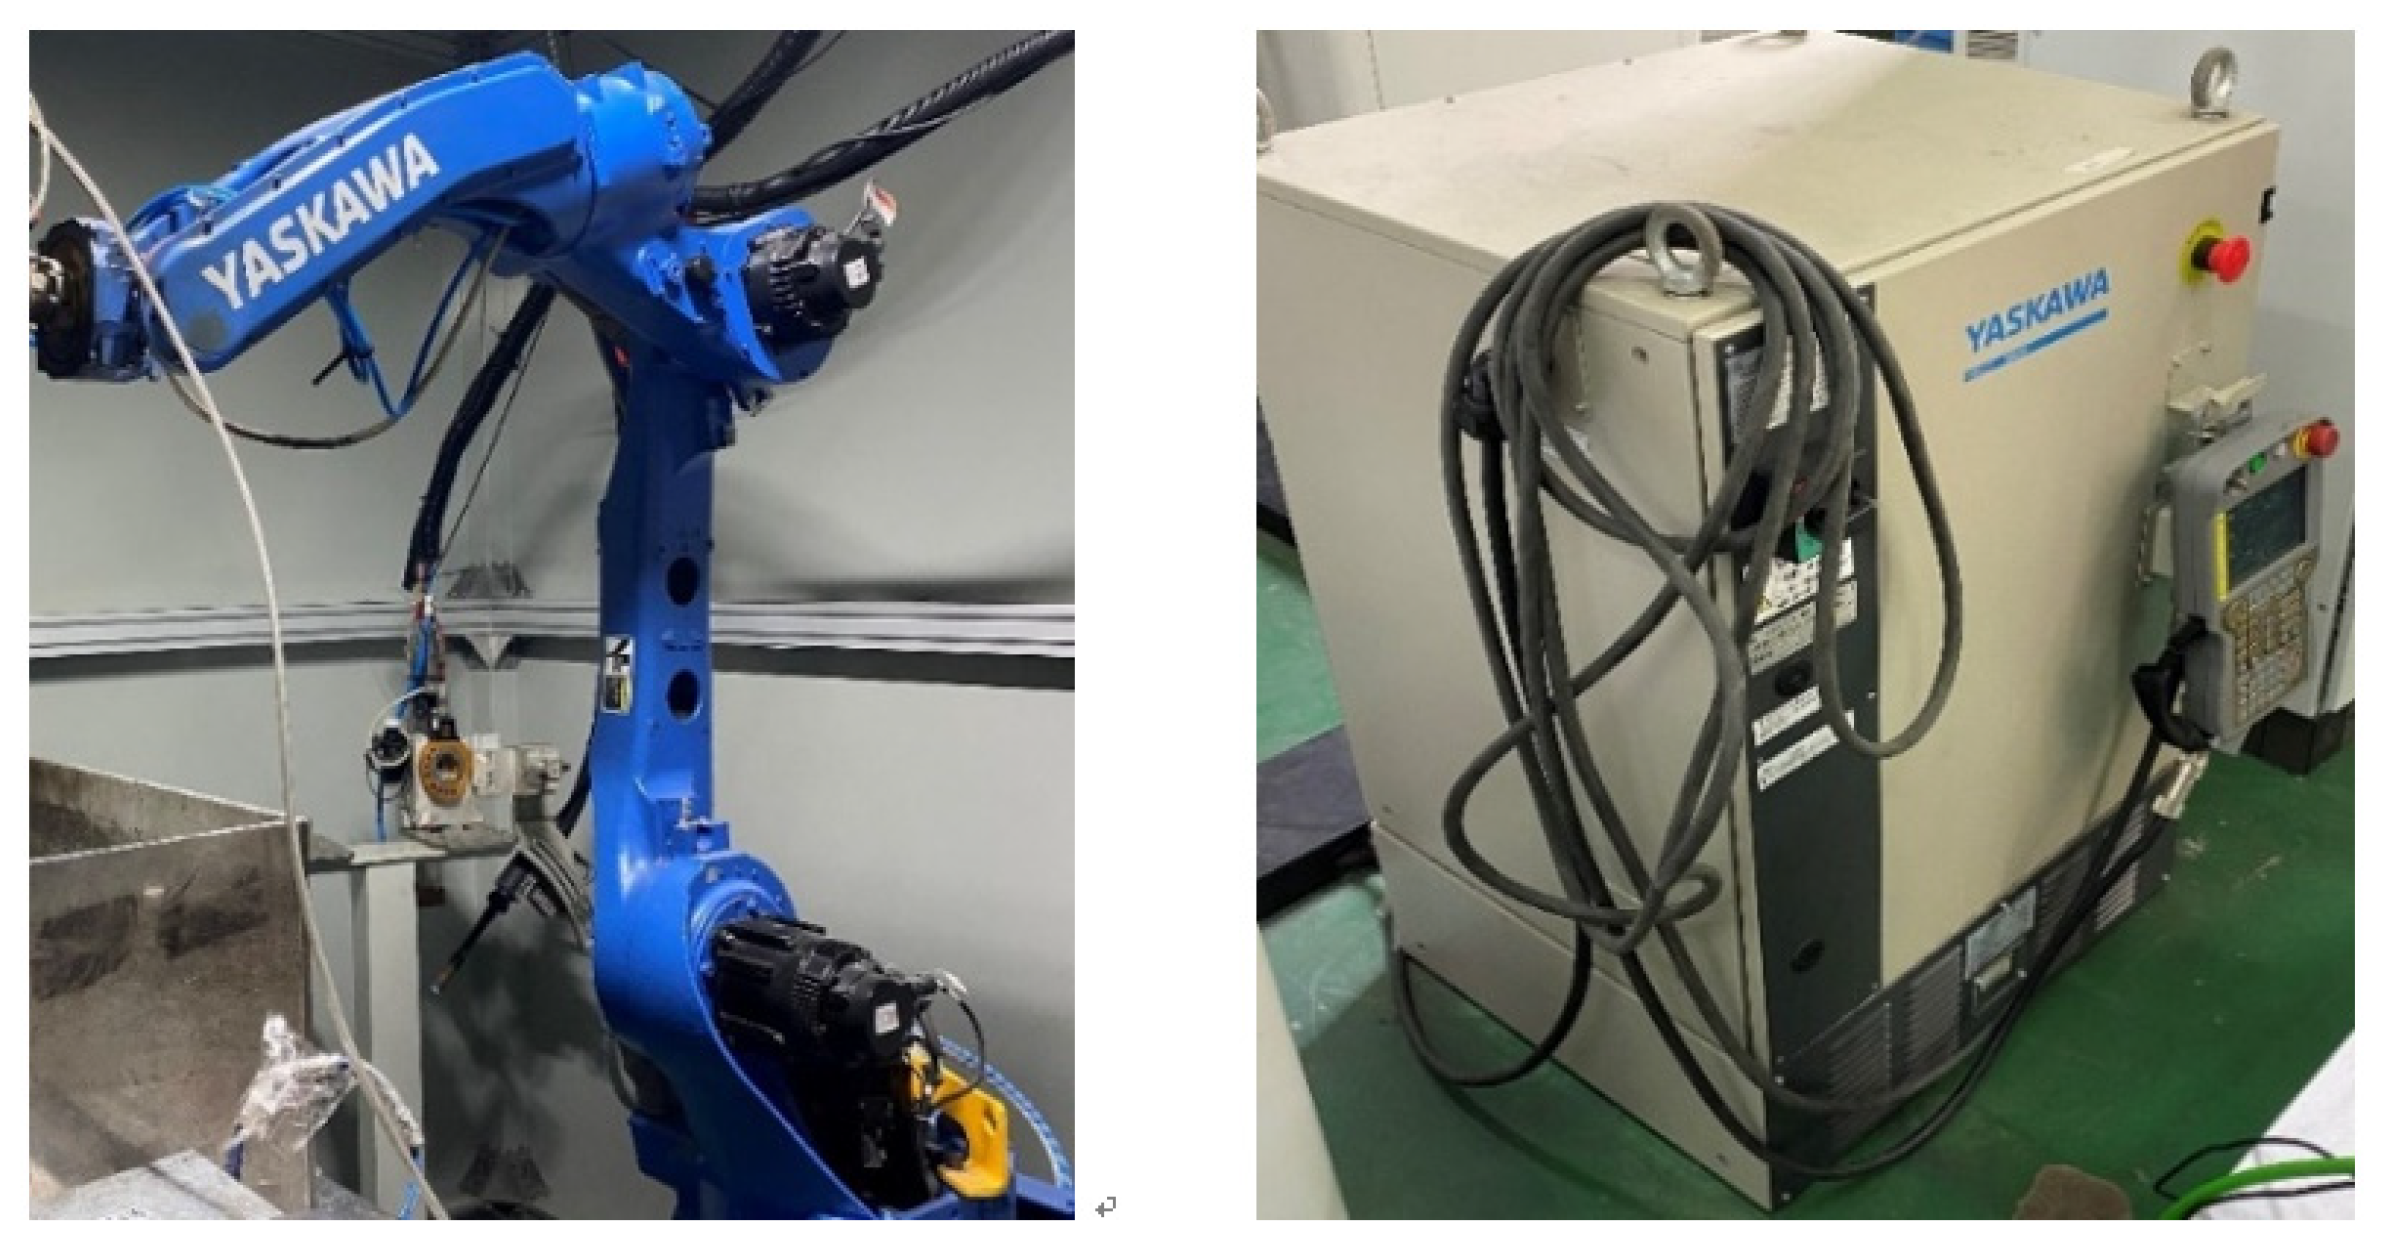
Metal and ambient air are considered distinct phases, and the phase boundary can be tracked using the VOF method. While surface tension, convection, radiation, and recoil pressure typically act on the phase boundary, which lies at the interface between different phases, these factors can be effectively defined as source terms at the phase boundary. The source terms in the momentum equation include buoyancy, gravity, and Darcy resistance, all of which are volume forces. Meanwhile, recoil pressure, surface tension, and Marangoni shear stress are treated as surface forces acting on the free interface at the workpiece.
The keyhole can be produced by recoil pressure after a laser beam irradiates the workpiece. The recoil pressure depends on the liquid’s surface temperature T.
P r = A B 0 T 1 2 e U T ;   U = M a L v N a k b
The value of coefficient A is 0.55. Ma is the material molar mass, Lv is the latent heat of evaporation, Na is Avogadro’s number, kb is Boltzmann’s constant. B0 is a vaporization constant, which is equal to 2.05 × 10¹² for aluminum [25,26].
The influence of buoyancy on the weld pool is calculated by the Boussinesq model. β is the coefficient of thermal expansion, g is the acceleration of gravity, and reference temperature Tr was set to 300 K. The role of buoyancy is defined as:
S f = ρ g β ( T T r )
Darcy resistance is calculated using the enthalpy-porous model, which introduces a reaction force source term to control the reduction of flow velocity to zero in the solid region. At this point, the reaction force is significant, but the entire computational domain is still treated as a fluid. The source term is expressed by the Kozeny–Carman equation [18]:
S k x = c 1 f L 2 f L 3 + b u S k y = c 1 f L 2 f L 3 + b v v 0 S k z = c 1 f L 2 f L 3 + b w
where c is the damping constant associated with the morphology of the solid and molten regions, typically set in the range of 105 to 108. fL is the volume fraction of the regional liquid, also known as porosity, b is a small calculation constant introduced to avoid being divided by 0, and TL is the liquidus temperature, TS is the solidus temperature. The liquid volume fraction is defined as a temperature-dependent step function.
f L = 1       T > T L T T S T L T S       T S T T L 0       T < T S
This numerical model employs the continuum surface force (CSF) model to calculate the surface tension [27]:
P σ = κ σ κ = F F
where κ is curvature of the interface between liquid and gas, which can be calculated by the VOF method. σ is the fluid surface tension coefficient. It is a temperature function for 2195 Al-Li alloys and defined as σ = 0.8 0.00035 T .
The Marangoni shear stress due to gradient of surface tension is given as:
f M = f L σ T T
where σ / T is the temperature coefficient of surface tension, and ∇T is the temperature gradient.
The source term S h in the discretized energy equation includes the energy change during convection, radiation, the material latent of melt, solidification, evaporation, and laser energy input.
S h = Q l a s e r S c S r S L S V + S c r y s t a l l
The energy of the laser beam incident on the workpiece is defined as Slaser. In this numerical simulation, the laser source is modeled as an adaptive rotated Gaussian heat source. As the keyhole depth decreases, the unfolded area of the keyhole becomes smaller, resulting in a higher heat flux per unit area. This dynamic process is reflected in the heat source model [28]:
Q l a s e r = 9 P l a s e r η π H t R 0 2 1 e 3 exp 9 x 2 + y 2 R 0 2 ln H t / z
Q l a s e r is absorbed energy in the workpiece and P l a s e r is laser power. R0 is the effective radius of laser beam. η is the absorptivity. The variable H(t) is keyhole depth, which is a function of time. Using the VOF method can trace it in every time step. This flow chart is shown in Figure 3.
Lm is the latent heat of melting. Latent heat of melting is defined as a source term in energy equation [29]:
S L = ρ u i Δ h
Δ h = f L L m T > T L 0 T < T L
The convective heat loss from the surface of the workpiece can be expressed by the following equation:
S c = h c T T r
where hc is convection heat transfer coefficient.
The energy loss due to radiation can be calculated using the following equation:
S r = ϑ δ 0 T 4 T r 4
where δ0 = 5.6697 × 10⁻⁸, which is the Stefan–Boltzmann constant and ϑ is emissivity.
SV is the heat loss when molten metal evaporates. ρv is vapor density; Vev is the surface recession speed due to the evaporating mass flux [30,31,32].
S V = V e v ρ V L V
Materials exhibit exothermic behavior during solidification. This study incorporated the latent heat of solidification based on this characteristic. The phenomena of latent heat of melting, which absorbs energy, and latent heat of solidification, which releases energy, occur at different stages of the welding process. The latent heat of solidification is defined as a source term in the energy equation:
S c r y s t a l l = ρ L m f s
fs is the solidification path in weld pool, which is a temperature-dependent property. Thermo–Calc was used to calculate the solidification path. The liquid phase fraction was calculated using the Scheil–Gulliver solidification model built into the software. By finishing calculation of Al-Li alloys phase diagram, a functional relation is fitted for fs and T.
f s = 1 . 3937360736 × 10 8 × T 4 + 4 . 6149286456 × 10 4 × T 3 0 . 0572464575 × T 2 + 31 . 5281316784 × T 6 . 503551 × 10 3
Figure 4 illustrates the computational domain and boundary conditions. Within the framework of a fixed mesh for the Eulerian numerical method, simulating the motion of the welding wire presents a significant challenge. While the unmelted filler wire is solid, it must be treated as a fluid and modeled with motion characteristics akin to those of a solid due to the limitations of the numerical method. In this study, a column of liquid metal was formed by injecting it through a small inlet hole at the top boundary, which simulated the behavior of the solid welding wire. For the wire modeling approach, a moving velocity inlet boundary condition was set at the top of the computational region, and the entry velocity was set to the “wire velocity × sin (wire feed angle)”. The shape of this velocity inlet was set to be elliptical, so you can imagine the cross section of a cylinder after cutting it diagonally. The temperature of the liquid column remained at ambient temperature until it approached the workpiece. The wire feeding apparatus supported the solid welding wire, generating a force that counteracted gravity, resulting in a net force of zero. In the simulation, two methods were used to handle this situation. The VOF traced the region of welding wire, then closed the gravity source term or added a source term S a n t i g r a v in z direction of the momentum equations to beat the gravity if it was ubiquitous. Once the wire reaches its melting temperature, it loses the supporting force from the wire feeding apparatus and is subsequently accelerated by gravity.
S a n t i g r a v = 9.81 ρ
In this model, both the welding wire and the workpiece are treated as the same phase, indicating the presence of ambient air and the metal phase throughout the entire computational domain, with surface tension at their interface. Since the welding wire is solid in its initial state, the surface tension is set to zero when the wire has not yet melted. The source term for surface tension is set to zero when the welding wire is below its melting point, as tracked using the VOF method. This approach facilitates the establishment of a steady process for the liquid bridge transition, enabling heat and mass transfer.

3. Experiment

The workpiece consisted of two 2195 Al-Li alloy plates joined together, with a thickness of 2 mm. Three different laser welding experiments with filler wire were conducted in this study. As shown in Figure 5, the laser source was produced by an Nd:YAG laser welding machine (JK2003SM, GMP SA, Renens, Switzerland) with a wavelength of 1.06 µm. The workpiece was positioned horizontally, and the filler wire was fed in front of the laser focus on the workpiece, with a distance of 1 mm between them. The filler wire was fed at a 45° angle to the workpiece, and pure argon shielding gas was applied behind the laser focus, as depicted in Figure 1. For material property characterization, the hardness test used the Vickers hardness test system (HV1000, Shandong SHANCAI, Laizhou, China). The mechanical properties of weld testing used a universal mechanical testing system (LE5106, LISHI, Shanghai, China). The 2195 alloys and ER2319 filler wire procured from material producers (Juaster Advanced Industrial Technology Co., Ltd., Guangzhou, China).
The detailed technological parameters are provided in Table 1. Table 2 presents the chemical composition of the workpiece and filler wire. During the experimental process, the workpiece was fixed, while the laser machine and filler wire were mounted on a linear motion platform. Upon completion of the experiment, the cross section of the weld was polished and etched. Finally, the weld sample was examined using an optical microscope.

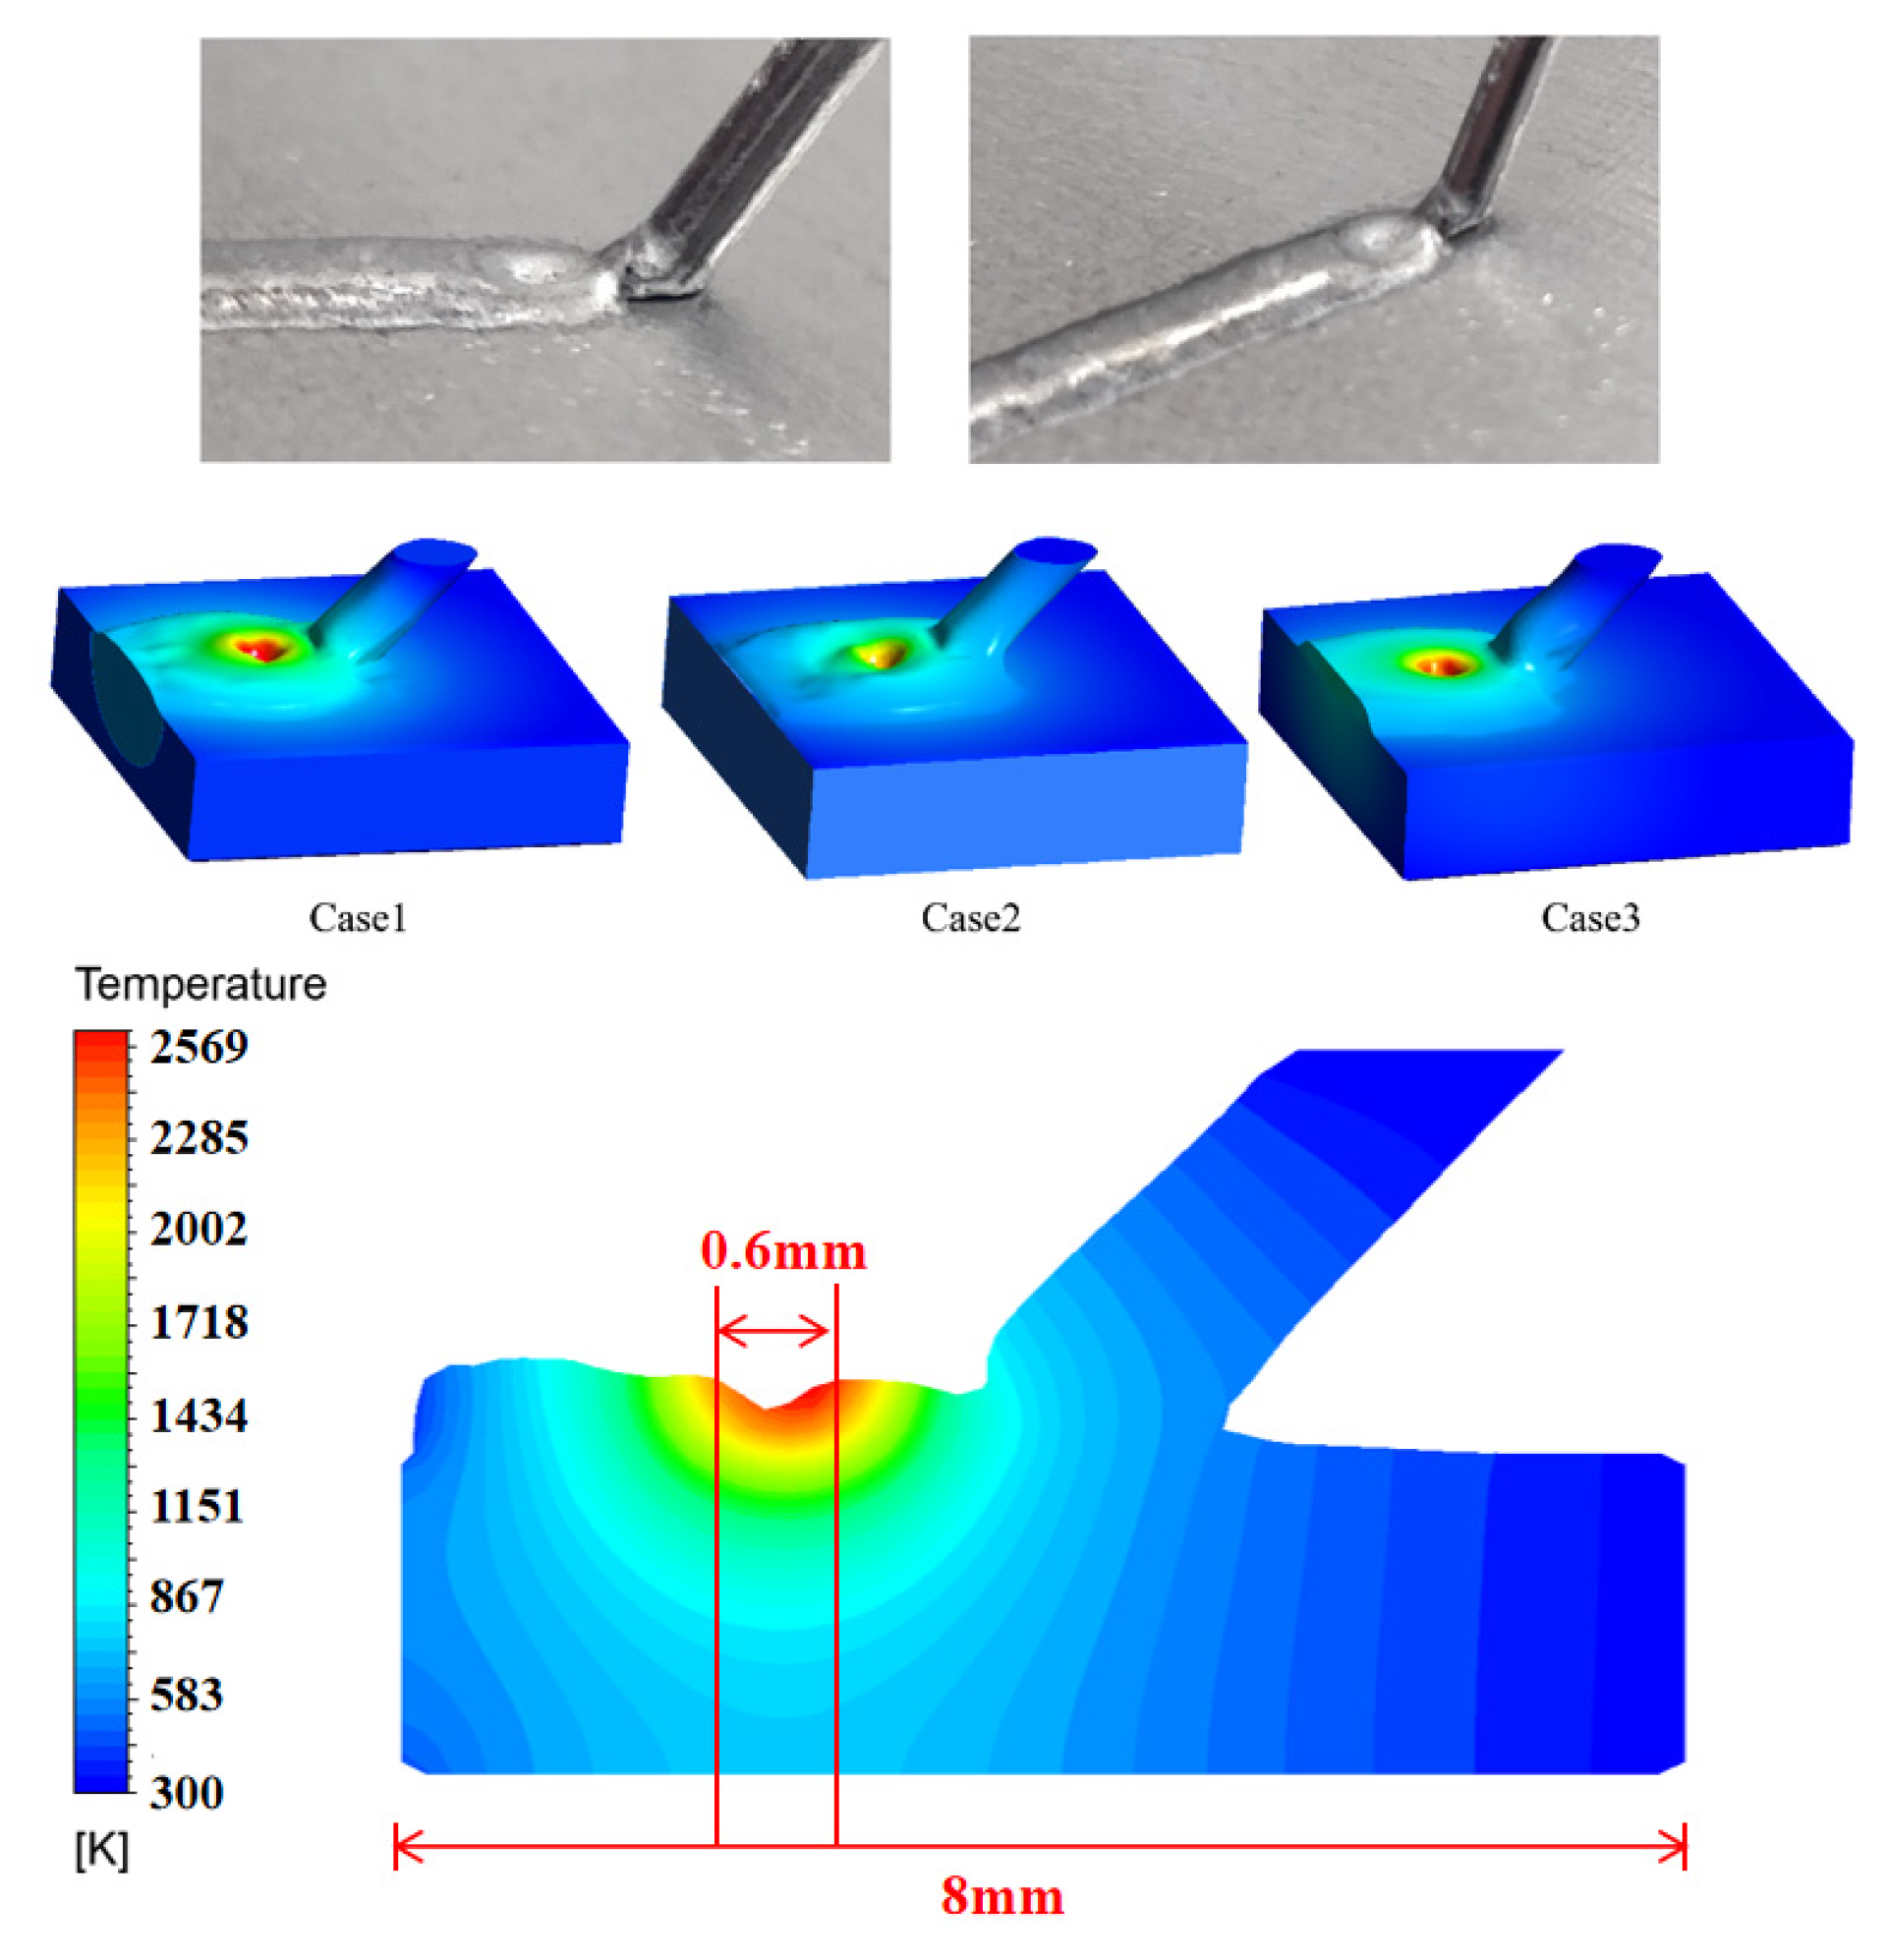
4. Validation of the Simulation Results

In this simulation, a welding wire entity was constructed within the computational domain, allowing for the simulation of energy transfer into the welding wire. Figure 6 presents the 3D simulation results alongside the experimental results of the surface morphology during the liquid bridge transition for three cases. A comparison reveals that the weld pool surface morphology observed in the simulation closely matches the experimental results. In the work process, a 0.6 mm spot was used for laser welding, and the power density of the laser irradiation was as high as 5 × 10³ W/cm2. For aluminum alloys, when the laser power density is greater than 105 W/cm2, the metal surface temperature is greater than the boiling point and concave under recoil pressure. Although it is very difficult to measure the melt pool temperature directly by experiment, it is feasible to determine the temperature by indirect methods. Since the welding spot exceeded the power density threshold for the evaporation of aluminum alloy, we can assume that the liquid surface temperatures in the areas illuminated by the spot all reached the boiling point. In Figure 6, the surface temperature in the depressed region reached the boiling point of the aluminum alloy (2450–2520 °C) in a range that matched the spot size, which also shows the accuracy of the model.
Figure 7 presents a comparison between the calculated zone, where the temperature exceeds the solidus, and the experimental partially melted zone (PMZ) boundary line shape for three cases. In the numerical simulation, each cell was assigned a variable to be used to perform logical judgment, whether or not the maximum temperature of the cell was greater than the liquid phase temperature of the aluminum alloy throughout the thermal history. If it was greater, the variable was set to 1, otherwise it was set to 0. The area of Figure 5 where the variable was set to 1 is shown in red and the opposite is shown in blue. With the exception of Case 2, the welded seam fully penetrated through the base metal (BM) in the experiment, with a discernible overlap height. Two distinct regions are clearly visible in Figure 5: the BM at the periphery and the fusion zone (FZ) at the center of the weld pool. Additionally, an equiaxed grain zone (EQZ) is distinctly observed at the boundary between the FZ and PMZ in Cases 1 and 2.
Compared to Figure 7, the shape of the weld obtained from the simulation was consistent with the weld observed in the experimental results. This indicates that the temperature field results from the simulation are accurate.

5. Effect of Heat Transfer on Weld Microstructure

In the experiment, three different welding parameters were employed for laser wire-fed welding. The microstructure of the welded joints for each case is shown in Figure 8a. The evolution of the microstructure in the welded joint, from the fusion zone (FZ) to the base metal (BM), is represented by the heat-affected zone (HAZ), partially melted zone (PMZ), columnar-shaped crystals with a coarse rolling-aged structure, and a mixed zone containing equiaxed dendrites and equiaxed crystals. Among the cases, Case 1 and Case 2 achieved full penetration through the workpiece, while Case 3 did not. Notably, the equiaxed grain zone (EQZ) was observed only in Case 1 and Case 2.
Additionally, the columnar crystal region is located at the periphery of the weld pool. From the fusion line to the center of the weld, the columnar crystals at the weld boundary gradually transformed into equiaxed dendrites. The solidified crystal grains at the fusion line acted as nucleation sites, facilitating the attachment of new crystal grains through heterogeneous nucleation. As a result, the crystal grains grew in the form of columnar crystals, oriented perpendicular to the fusion line, extending inward into the weld. As the solidification process progressed, the temperature gradient at the center of the weld became negligible, causing the grains to grow uniformly in all directions. With no additional nucleation sites or particles for attachment within the weld center, the grains underwent homogeneous nucleation, resulting in the formation of fine, equiaxed grains.
Figure 8b illustrates the location of the weld hardness test, which also corresponds to the location of subsequent sampling data. In the hardness test, cross sections of four different samples with the same laser parameters were cut. Hardness tests were also performed at the same location and eventually de-averaged to minimize data volatility. A horizontal straight line was drawn across the cross section of the weld, positioned at half the thickness of the workpiece. This line extended from the boundary of the partially melted zone (PMZ) at one end of the cross section to the corresponding symmetric position at the other end. After the welding experiment was completed, the weld was sampled, and the hardness was tested. The results of the hardness test are presented in Figure 8c. Hardness measurements reflect the strength distribution of the weld at various locations. The hardness was lowest at the center of the fusion zone (FZ), and as one moved from the center of the weld toward the edge, the hardness initially decreased to a minimum, primarily located in the PMZ and heat-affected zone (HAZ), before rising due to the transition to the base metal (BM). Consequently, the weld hardness followed a W-shaped distribution trend.
In the hardness test results, Case 3 exhibited the highest hardness across all weld areas, while the hardness of Case 2 was similar to that of Case 1. The welding speed of Case 3 was 1 mm/s faster than that of Case 2 and Case 1, while the wire feeding speed was the same as in Case 2. As a result, the laser energy input per unit time in Case 3 was the lowest, leading to a hardness increase of approximately 15% in the weld center compared to the other cases. Similarly, due to the faster wire feeding speed, the laser energy loss from wire absorption in Case 2 was higher than in Case 1. The hardness in the fusion zone (FZ) at the weld center was nearly identical between Case 2 and Case 1, but the heat-affected zone (HAZ) at the weld edge in Case 2 was more than 15% harder than that in Case 1. Consequently, the hardness curve shown in Figure 8c illustrates that increasing the laser energy input per unit time led to a reduction in weld hardness, primarily due to the softening of the weld during prolonged high-temperature exposure.
Two sampling points were placed at the center of the weld and at the boundary of the fusion zone (FZ), with their locations shown in Figure 9. Thermal cycle curves were extracted from the simulation results at these points for different cases. The welding speed for Case 1 and Case 2 was 3 mm/s, while Case 3 had a welding speed of 4 mm/s. With the laser power and other conditions held constant, the energy input per unit time for Case 1 and Case 2 was higher than for Case 3. As a result, the peak temperature in Case 3 was approximately 1500 K lower than that in the other cases, as shown in Figure 9a. The wire feeding speed of Case 1 was slower than that of Case 2 by about 2 mm/s, leading to a lower energy loss due to wire heat absorption. Consequently, the temperature in Case 1 was consistently higher than in Case 2 during the heating stage. When the laser focus moved above the sampling point, the melt evaporated to form a keyhole after the temperature reached the boiling point. At this stage, the second sampling point for Case 1 and Case 2 was located inside the keyhole, causing the temperature to exceed the boiling point, reaching approximately 2800 K in the thermal cycle curve. In contrast, the second sampling point for Case 3 did not reach the boiling point throughout the welding process, remaining below the keyhole.
In Figure 9b, the changes in the curves for different cases are generally consistent with those shown in Figure 9a. During the heating stage, the temperature of Case 1 was slightly higher than that of Case 2, and the peak temperature of Case 3 remained the lowest. Due to the faster wire feeding speed in Case 2, the appearance of the peak temperature occurred later than in Case 1, and the duration of the high-temperature grain coarsening was shorter in Case 2 than in Case 1, which resulted in improved hardness. It is evident that the hardness in Case 3 was greater than that in Case 1 and Case 2 in both regions. Case 3 was exposed to high temperatures for a shorter duration, as its cooling rate during the cooling stage was higher than that of the other cases. This faster cooling rate limited the coarsening of the crystallization, thereby enhancing the strength and hardness of the weld.
The welding speed of Case 1 was the same as that of Case 2, but the wire feeding speed differed, so the primary difference in their thermal cycle curves is attributed to the varying energy absorption by the wire. In the numerical model, the spatial location of the workpiece and wire was determined by looping through the entire computational domain. The energy variations were extracted and recorded at these locations. Figure 10 presents the change curve of the total absorbed energy of the filler wire, as well as the change curve of its internal energy, for the three different parameter sets in the numerical simulation. This curve represents the total energy variation of the filler wire, rather than just its internal energy. Therefore, it included energy losses due to conduction, convection, radiation, and the cumulative energy loss from the boundary heat flux.
Comparing the wire heat absorption rate curves for different cases, the wire feeding speed in Case 2 was 2 mm/s faster than in Case 1, while the heat source and welding speed remained the same. As a result, the average energy absorption by the wire in Case 2 was approximately 16% higher. Since the energy input in Case 3 was the smallest, the least amount of energy was absorbed by the welding wire. Furthermore, the absorption ratio in Case 2 was slightly greater than in Case 1, while the absorption ratio in Case 3 was the highest. Although the wire feeding speed in Case 3 was the same as in Case 2, the welding speed was increased by 1 mm/s, resulting in the highest absorption ratio. It is believed that the increase in welding speed led to a reduction in the total input energy, at the same wire feeding speed, which had a more significant effect than the change in the energy absorbed by the wire, thus increasing the ratio of energy absorbed by the wire to the total input energy.
It is evident that the energy absorbed by the welding wire constituted approximately 6% to 16% of the total energy absorbed by the workpiece. Furthermore, by comparing the curves in Figure 9, the area under the temperature-time variation curve represents the total energy absorbed during the corresponding time period. It can be observed that the areas enclosed by the Case 1 and Case 2 curves are nearly identical in size, indicating that the total energy absorbed by the workpiece was also similar for both cases. This phenomenon suggests that, although the wire feeding speed was faster in Case 2, the total energy absorbed by the workpiece experienced only a slight change. The welding wire was continuously heated before entering the weld pool, already reaching a high temperature. Consequently, the process of feeding the welding wire into the weld pool can be viewed as a heat and mass transfer process, where convective heat transfer occurs from the wire to the weld pool through mass transport. Based on these results, we propose that there exists a competitive energy absorption mechanism between the workpiece and the welding wire in laser welding with filler wire. One mechanism involves the welding wire absorbing energy from the workpiece through heat conduction, while the other involves the welding wire transferring heat to the workpiece through convection during wire feeding.
After the welding process reaches a steady state, the rate of temperature change within the weld at this stage is extracted, with the extraction locations shown in Figure 8b. Figure 11 presents the curve of the temperature variation rate in different weld sections. Data acquisition was performed at cross sections of the completed weld at distances of 0 mm, 1 mm, 2 mm, and 3 mm from the current laser focus. The section at a distance of 0 mm from the laser beam served as the main reference section, which was in the heating stage of the thermal cycle, while the other sections were in the cooling stage. As shown in Figure 8a, comparing the grain size in the fusion zone (FZ) at the center of the weld, it is evident that the grain refinement effect in Case 3 was more pronounced than in the other two cases. This is also reflected in the hardness distribution curve, where Case 3 exhibits the highest hardness. Upon comparing the cooling stages in Figure 8, it is clear that the differences in these microstructures were influenced by the cooling rate, which was consistently highest in Case 3 at different locations, while the cooling rates for Case 1 and Case 2 were similar.
It is obvious that the temperature change rate at the equiaxed grain zone (EQZ) position in Case 1 and Case 2 during the cooling stages of the thermal cycle was consistently higher than the temperature change rate at the EQZ position in Case 3. The cooling rate difference at the EQZ position between Case 3 and Case 1/Case 2 exceeded 100 K/s. As shown in Figure 8, EQZ was not observed in Case 3, while it was clearly present in both Case 1 and Case 2. A high cooling rate corresponds to a higher degree of undercooling. Heterogeneous nucleation is widely accepted as the primary cause of EQZ formation [31]. Based on the numerical results, the subcooling in Case 3 was significantly higher than in the other cases. Excessive undercooling can inhibit heterogeneous nucleation, which may explain why EQZ was absent in Case 3. This suggests that a higher welding speed resulted in a higher temperature change rate, which can prevent the formation of EQZ.

6. Effect of Melt Flow on Weld Microstructure

A comprehensive consideration of the flow, heat transfer, wire movement, and heat absorption within the welding pool is essential. Figure 12 illustrates the velocity field of the weld cross section at the laser focus. The keyhole was formed only in the region near the focus, where the flow field was most complex, and the flow trend played a critical role in the weld crystallization process. The simulated velocity field in Figure 12 shows that the energy changes caused by welding wire absorption significantly influenced the keyhole depth and energy transfer. It is observed that, for all three process parameters, the keyhole depth remained relatively shallow, and the keyhole did not penetrate the workpiece, indicating a transitional state between thermal conduction welding and deep penetration welding. In Figure 12a, the melt flow moves from the keyhole wall toward the weld pool surface. Upon collision with the unmelted workpiece at the weld pool boundary, the flow moves downward and forms a vortex. A pair of symmetrically mirrored vortices forms on either side of the keyhole. Previous research has demonstrated that different welding speeds lead to significantly different weld pool shapes and velocity fields [33,34,35,36]. The streamlines in Figure 12 display this flow trend within the weld pool, which closely aligns with the experimental results in the reference. This flow pattern is primarily driven by Marangoni shear stress and thermal buoyancy [37]. While the welding speed and wire feeding speed caused variations in the magnitude of the weld pool velocity field in different cases, the flow patterns across all three cases were largely similar.
Comparing Figure 12b, the melt reached its maximum speed at the top of the keyhole surface. This location, which was close to the laser focus, exhibited a high energy density and experienced the maximum velocity across all three cases due to the combined effects of recoil pressure and surface tension. The flow velocity near the keyhole was approximately 5–10 mm/s, and this region corresponded to the equiaxed crystal zone in the fusion zone (FZ). This is attributed to the convective heat transfer induced by the melt flow, which resulted in a nearly uniform temperature gradient, thereby promoting the formation of equiaxed crystals. In the region near the boundary of the weld pool, the velocity decreased to below 1 mm/s, where the effect of heat conduction outweighed that of convective heat transfer. At the boundary of the FZ, which included the partially melted zone (PMZ), equiaxed grain zone (EQZ), and heat-affected zone (HAZ), the temperature gradient was oriented perpendicular to the fusion line. Nucleated particles crystallized and grew along this gradient, forming columnar crystals.
Upon examining Figure 11, the most notable difference is the presence of a narrow equiaxed grain zone (EQZ) along the boundary of the partially melted zone (PMZ) in the full penetration welds of Case 1 and Case 2. However, in the unpenetrated weld of Case 3, the EQZ at the boundary of the PMZ is scarcely visible and difficult to observe. The EQZ primarily consisted of nearly spherical equiaxed crystals with random crystal orientations, and the average crystal grain diameter was approximately 10–12 microns. The presence of the EQZ significantly influences the tensile strength, fracture resistance, and corrosion properties of weld joints [38,39]. According to the literature [40], it has been observed that the EQZ often fails first during tensile testing, with the tensile fracture propagating in the direction of the EQZ. Furthermore, it is believed that the EQZ forms as a result of the appropriate undercooling during the solidification of Al-Li alloys.
Currently, there is no definitive conclusion regarding the formation mechanism of the equiaxed grain zone (EQZ), nor is there any quantitative study linking its formation to the molten pool. Two primary theories have been proposed to explain the formation of the EQZ. The first hypothesis posits that the EQZ, located in the partially melted zone (PMZ), forms through a recrystallization mechanism [41,42]. The second theory suggests that heterogeneous nucleation occurs in the molten layer near the fusion line, which is a relatively quiescent liquid region [33]. Additionally, the literature [43] indicates that nucleated particles can form the EQZ at the bottom of the weld pool along the fusion line due to buoyancy flow and Marangoni convection.
To investigate the effect of melt flow on the formation of the equiaxed grain zone (EQZ), Figure 13 presents the velocity curve at specific locations within the EQZ and fusion zone (FZ). Similar to Figure 11, the data were extracted from the weld cross section at the laser focus position. The location of the extraction is shown in Figure 8b, and the calculated velocity results for different cases were collected at this position. By comparing the velocity fields of Case 2 and Case 3, it is clear that the flow velocity around the keyhole in the weld pool was higher. As the distance from the keyhole increased, the flow velocity decreased, and at the edge of the molten pool, the flow velocity at the EQZ position approached zero. This is because the EQZ was located at the boundary of the FZ, near the liquid–solid mixing zone, where the viscosity was significantly higher, resulting in a very slow flow rate that was nearly zero. The temperature near the EQZ remained close to the liquidus temperature, hindering flow within the melt. Consequently, flow effects such as thermal buoyancy and Marangoni convection were weak, making it difficult for these factors to influence the formation of the EQZ. The literature [33] proposes that heterogeneous nucleation occurs in the static liquid metal layer near the fusion boundary to form the EQZ. This suggests that flow reduces the number of heterogeneous nucleated particles, which aligns with the findings from numerical simulations.

7. Effect of Thermal History on Weld Mechanical Property and Microstructure

Welded joints for the three parameters were fabricated into dog bone tensile specimens for uniaxial tensile testing at room temperature. The cracks of the different specimens all appeared in the fusion zone, indicating that the fusion zone was the weakest link in the mechanical properties of the welded joint. The engineering stress–strain curves obtained in tension are shown in Figure 14. Four specimens were cut out along the same weld in every case, the average value of stress corresponding to each strain was taken after stretching, and the engineering stress–strain curves obtained are shown in Figure 13. With the increasing load, the curve increase slows down, the specimen yields and changes from the elastic stage to the plastic stage, of which the strain of the curve corresponding to Case 2 is the largest, indicating that it had the best strength and plasticity. The maximum tensile strength of Case 1 was 353 MPa, while the tensile strength of the parent material was 587 MPa, which was 60.1% of the strength of the parent material. Comparing Case 2 with Case 1, the maximum tensile strength value was higher, 372 MPa, and was 63.3% of the strength of the parent material. Analyzed in conjunction with Figure 9, the Case 2 filler wires were faster than those of Case 1, and the melt pool heat input was less, so that the joint porosity was reduced and the size of the pores became smaller, so it had better mechanical properties. Comparing Case 3 with Case 1, the tensile strength value was lower, 283 MPa, and was 48% of the strength of the base material, due to the lack of heat input, which resulted in the weld not being fully penetrated, leading to a decrease in strength. On the other hand, Case 2 did not show the serious problems of Case 1: the backside of the weld had lower porosity and fewer defects, and it had the best mechanical properties among all the cases.
As shown in Figure 15, the SEM images of the different cases at the fracture site show mainly brittle fractures, which correspond to the low elongation in the tensile curve of Figure 12. The three case sections were observed at the largest pores, as shown in the Figure 13 SEM image of localized pores in the specimen sections. Comparing the SEM images of the different cases, it is clear that the pores between the grains of Case 3 were the smallest, with a size of 5–15 µm, which was similar to that of the grains; on the other hand, the pores between the grains of Case 1 were larger, with a greater depth and the highest number. In contrast, the pores between the grains of Case 1 were larger, deeper, and the most numerous, with a size of 5–20 µm, and there were small pores inside the larger pores, which further aggravated the stress concentration when the specimen was loaded, forcing a serious decline in physical properties, such as the tensile strength (the above experiments proved that the tensile strength of Case 1 was the lowest). The pores between the grains of Case 2 were smaller than those of Case 1, and the depth of the pores was shallower, and therefore, the decrease in the physical properties’ amplitude was lower.
Based on the above analysis, the dimensions of the diameter of the pores in each case in descending order were Case 1, Case 2, Case 3. It has been derived from the numerical simulation in Figure 9, Figure 10 and Figure 11 that the corresponding heat input to the melting pool of each case was also, in descending order, Case 1, Case 2, Case 3. Therefore, the SEM plots further verified that the increase of the heat input to the melting pool resulted in the increase of pore size within the joints in the specimens, which ultimately reduced the mechanical properties of these joints. In addition, as can be seen in Figure 15d–f, the grains around the pores were arranged in a circular pattern around the pores as a whole, and there were grains of different sizes at the internal boundaries of the pores, and the grains within the pores of Case 1 were the largest in size, which may be due to the fact that they were subjected to the extrusion effect of the bubbles. Correspondingly, Case 1 had the largest pores, with the largest heat input and the lower cold rate, which resulted in the most serious coarsening of the grains in Case 1. It is worth noting that the gaps between these grains were large, separated from each other by a certain distance, with obvious cracks, which made it easy to generate stress concentrations when subjected to external loads and caused the cracks to expand rapidly to the periphery, which seriously reduced the physical properties of the specimen. Another phenomenon in Figure 15d–f is distribution of independent small-sized pores in or around the pores, indicating that they were still in the stage of pore polymerization. At the end of the cooling and solidification process, they were stagnant in the final moments, resulting in the formation of the current shape. The independent small-sized pores of the pores of Case 1 were the largest. When two air holes were very close to each other, the cracks of the large air holes extended to the small air holes next to them and combined with the cracks they generated, which further aggravated the failure of the specimen.

8. Conclusions

In this study, a numerical model for laser welding with filler wire during the liquid bridge transition was developed, and a series of experiments were conducted. The characteristics of flow and energy transfer between the welding wire and the weld pool were investigated. Additionally, the impact of flow and energy transfer within the weld pool on the weld microstructure were examined. The following conclusions can be drawn from the results of the present study.
(1)
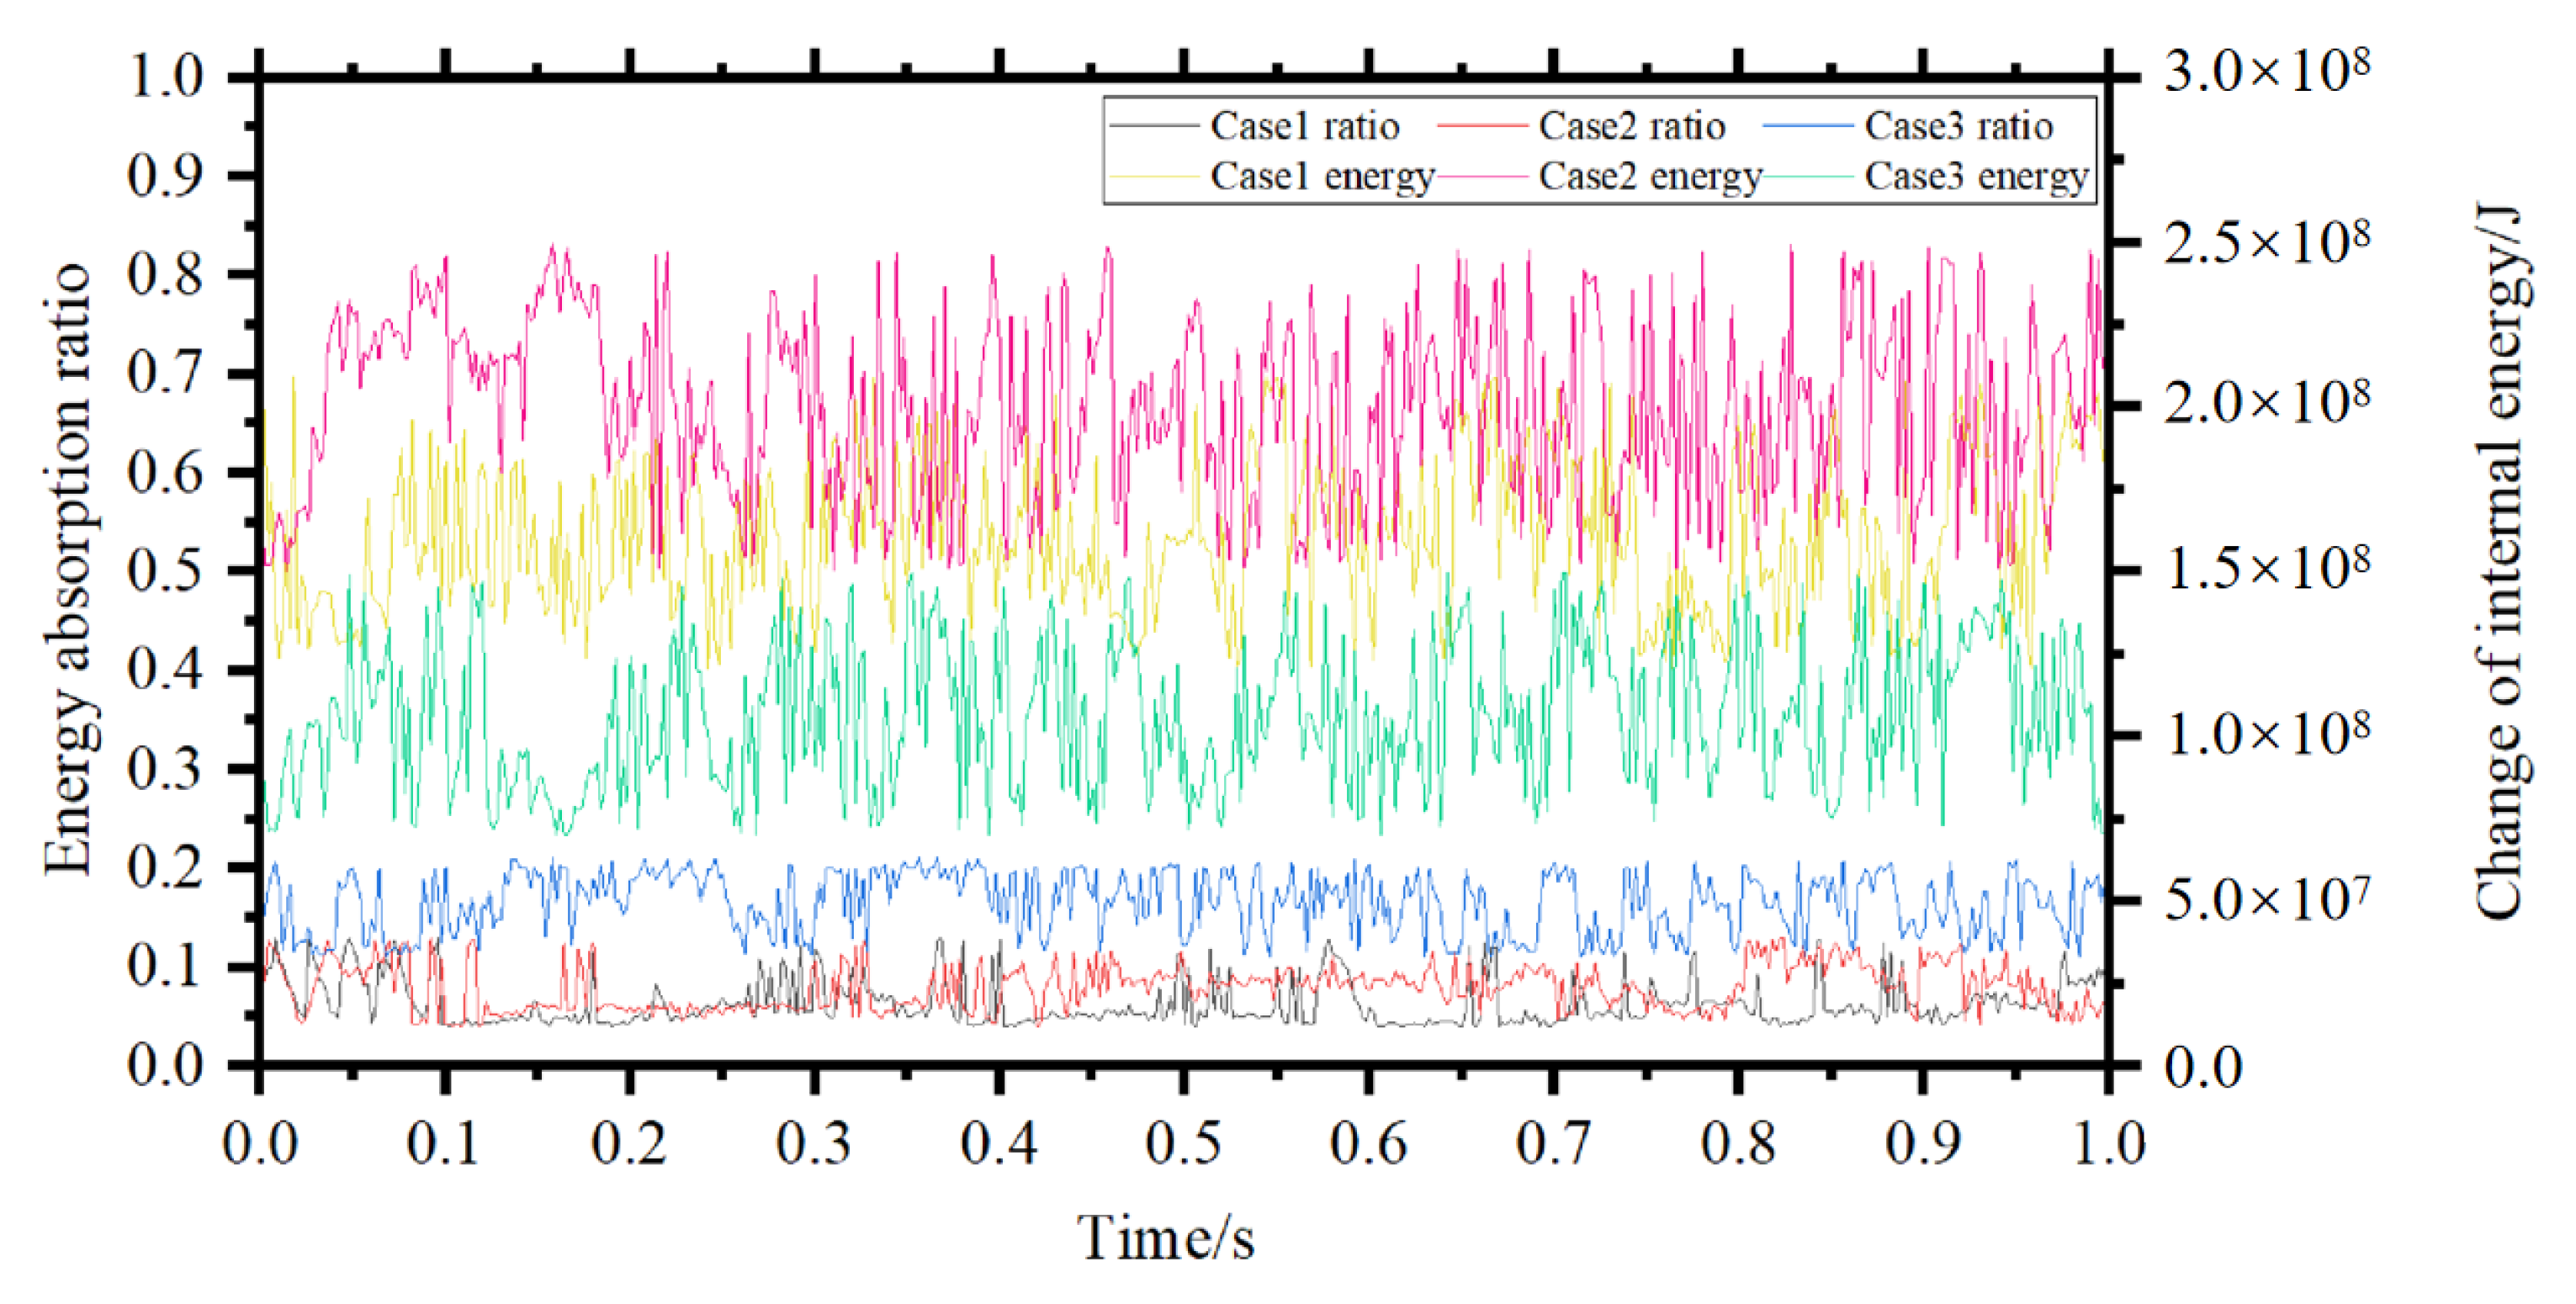
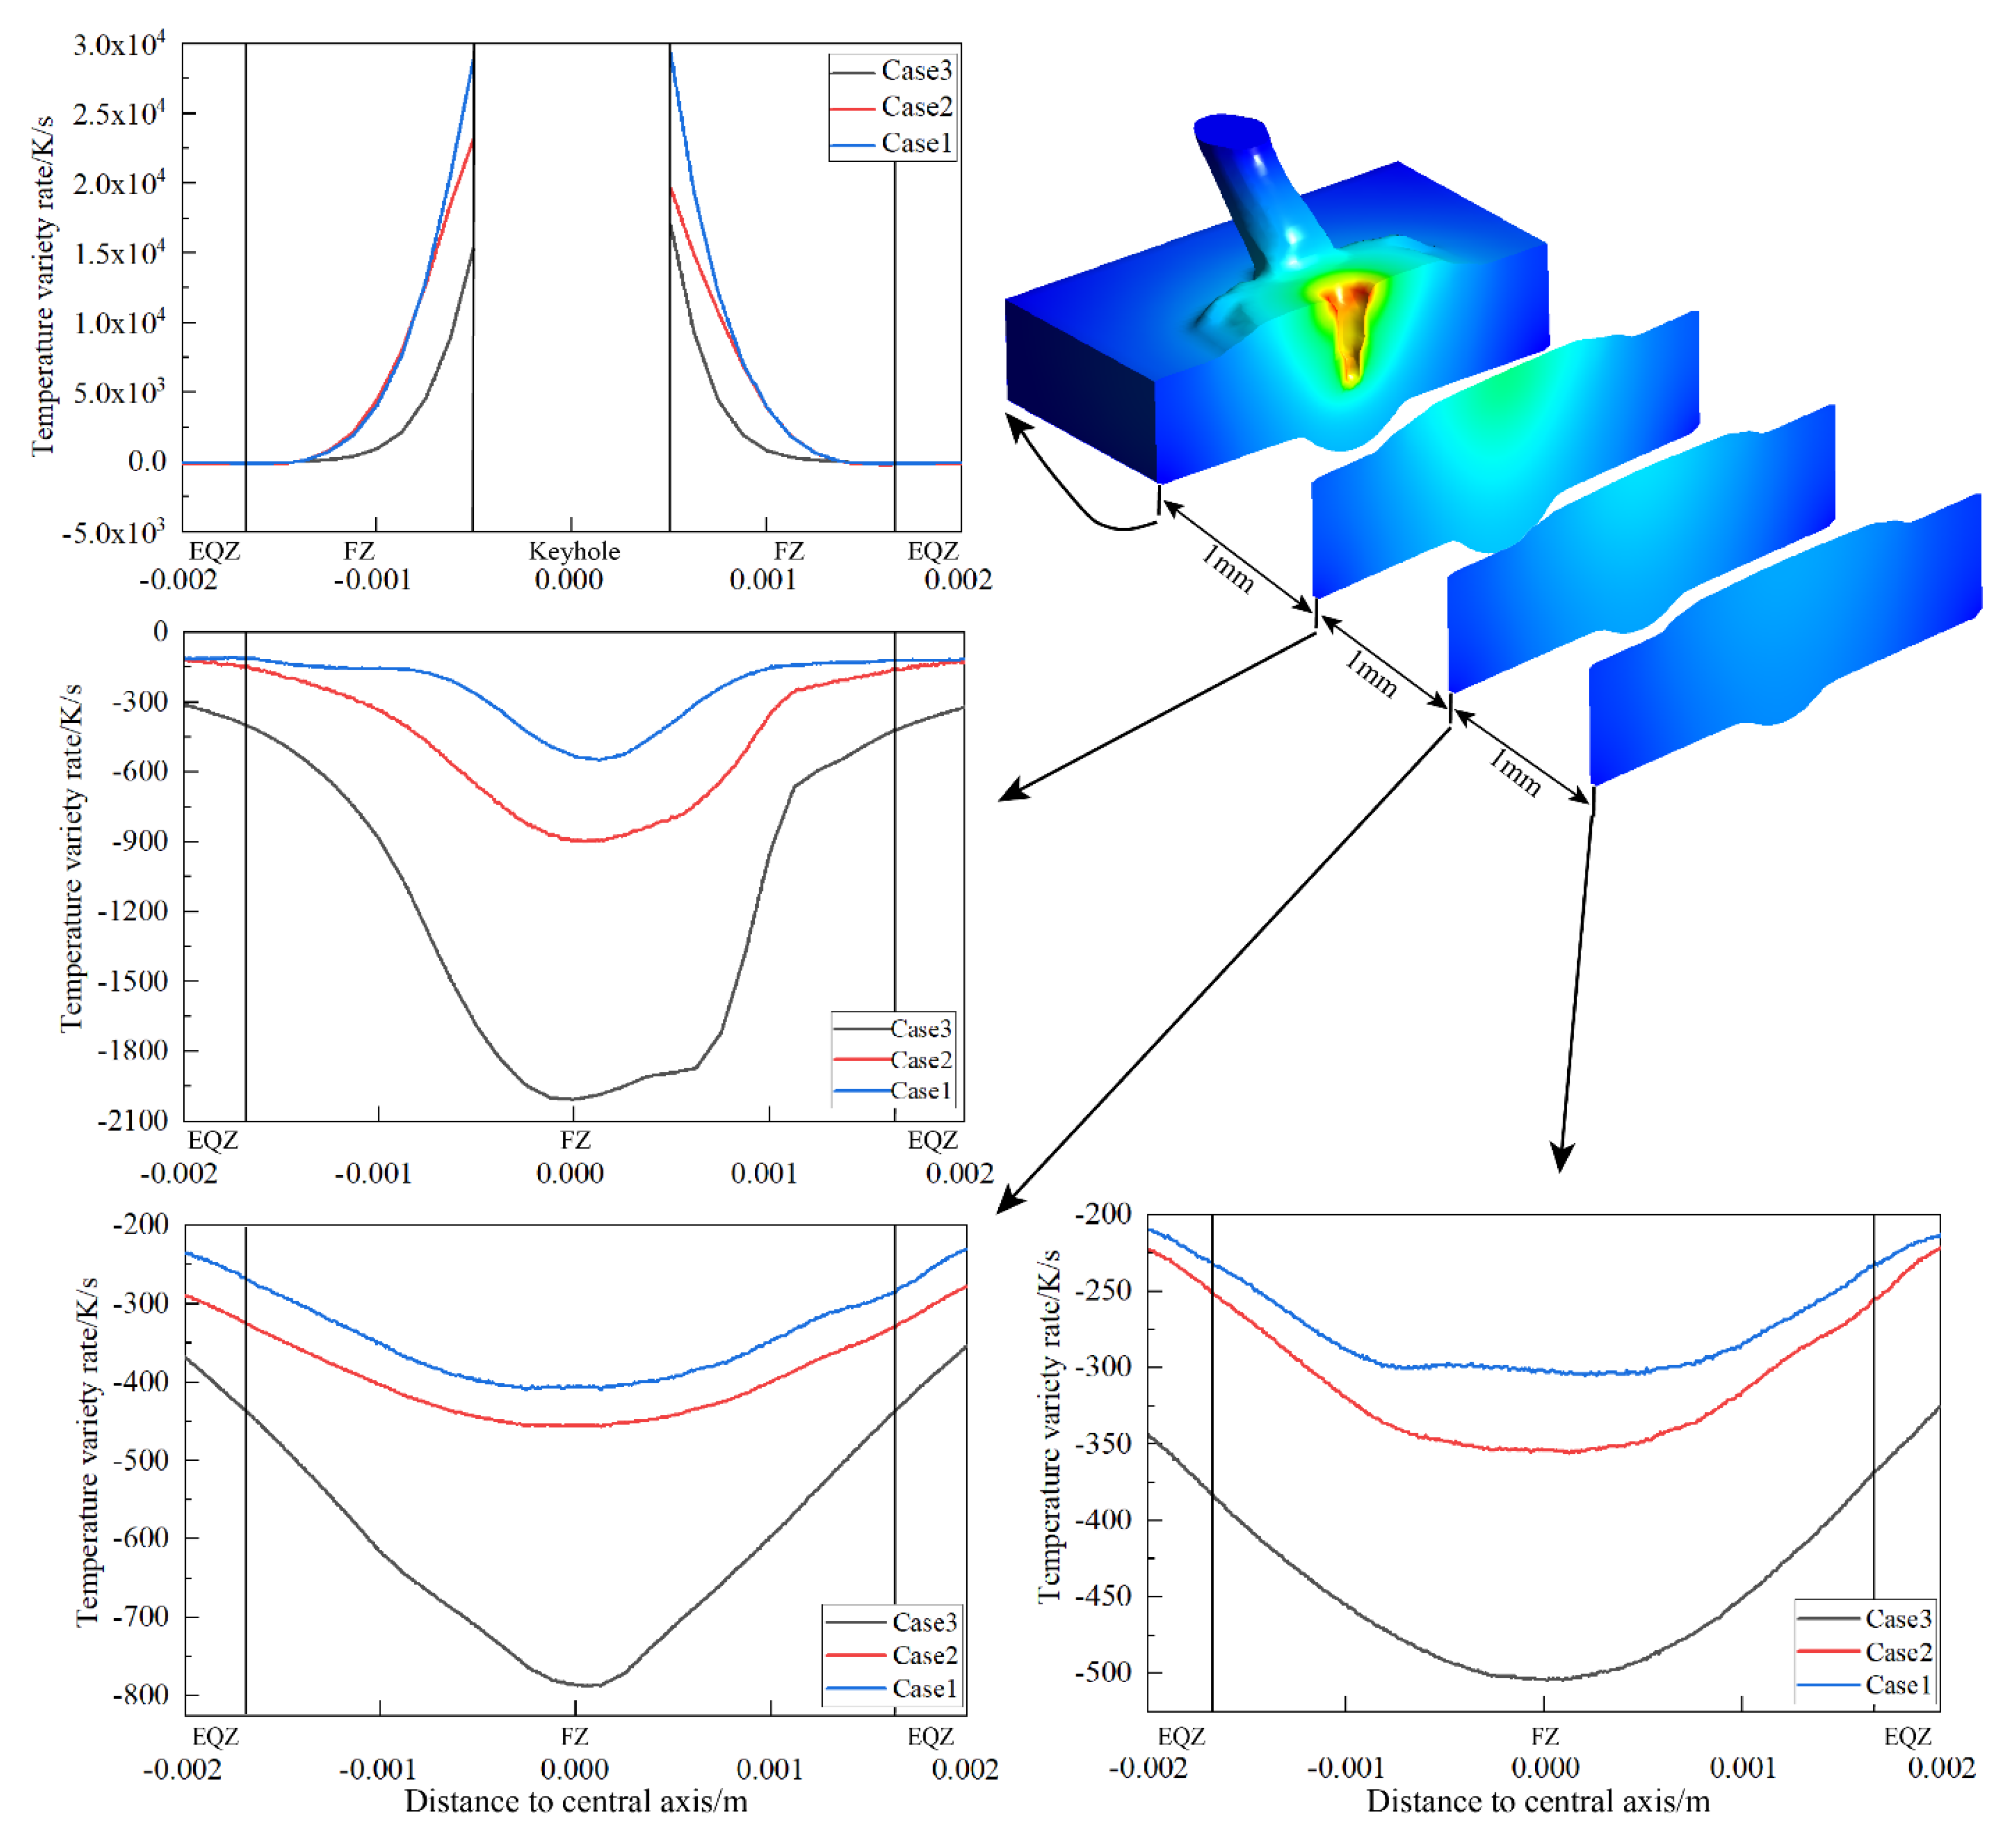
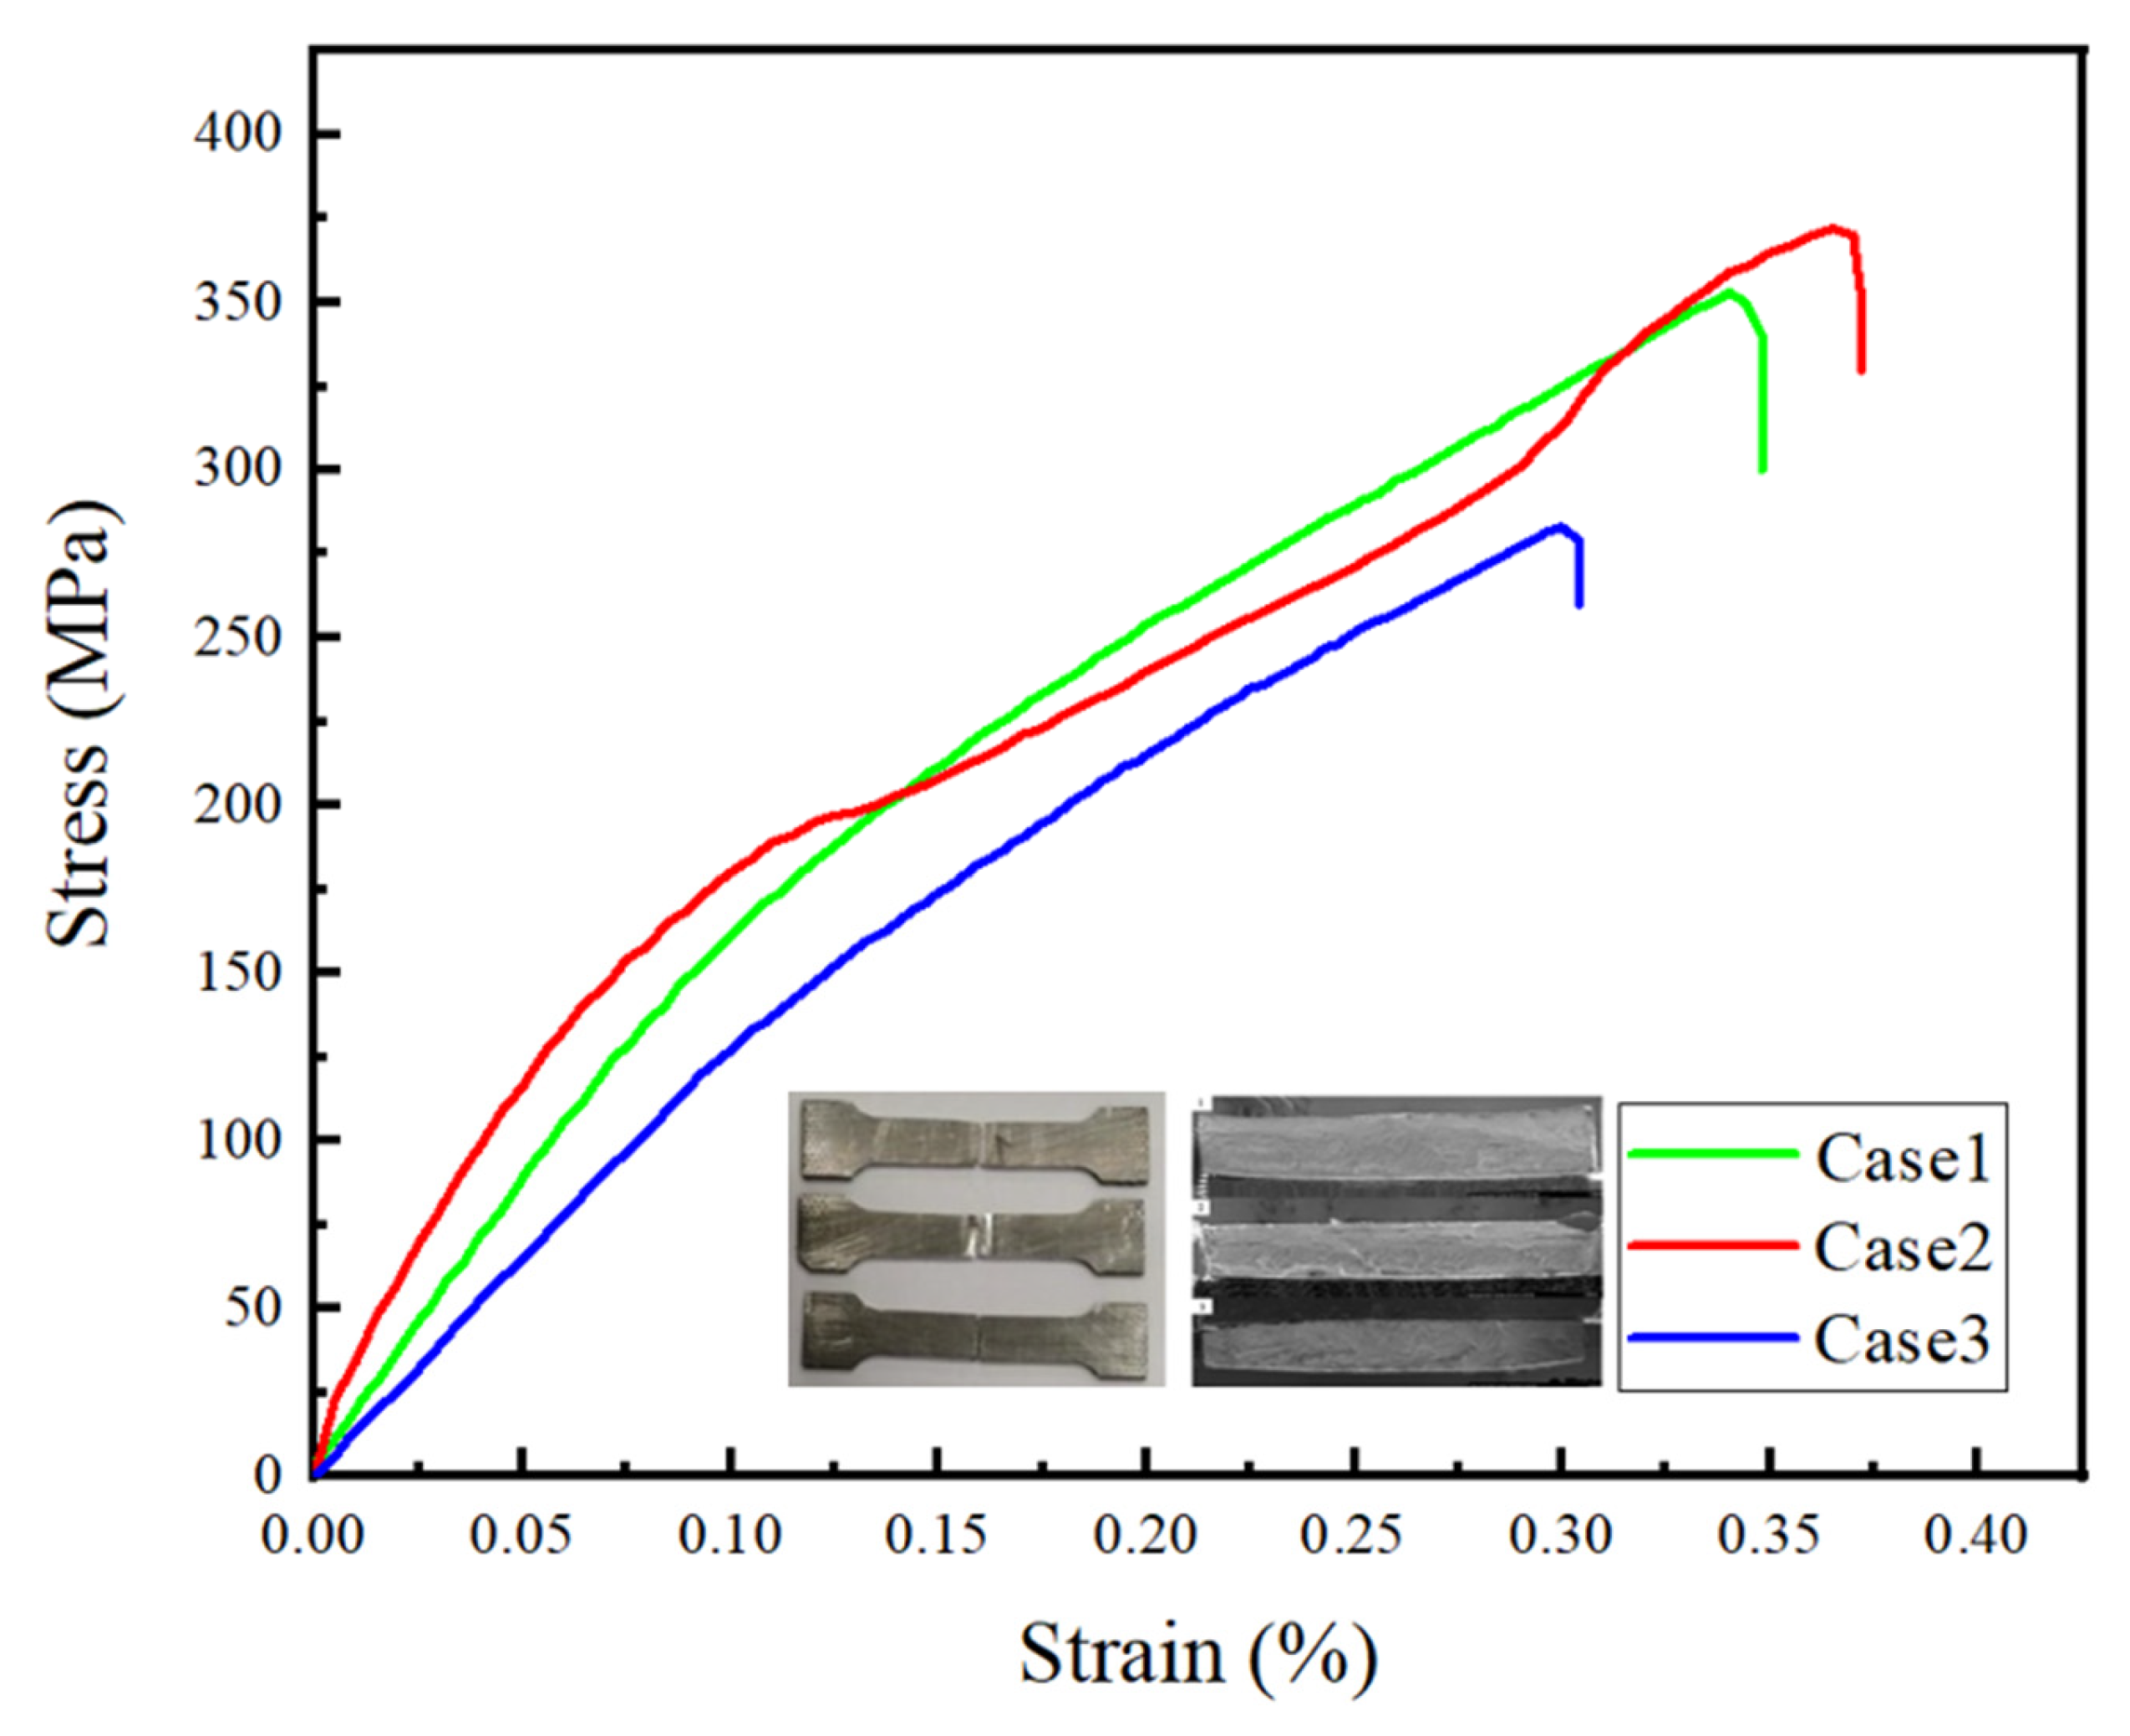
In our study, we successfully constructed a complex process of laser filler wire welding and quantitatively evaluated the effect of filler wire on the heat history of the weld. Simulations showed that the welding wire absorbed about 6% to 16% of the total energy in the workpiece. The heat absorbed by the welding wire had a significant effect on the temperature distribution of the workpiece. When the wire feed speed was increased from 2 to 4 mm/s, the energy absorbed by the melting of the wire was enhanced by 25% and the average cooling rate in the melting zone of the weld increased by about 50 K/s, while the cooling rate at the center of the weld increased by 400 k/s. This study can provide quantitative guidance for process optimization of laser filler wire welding.
(2)
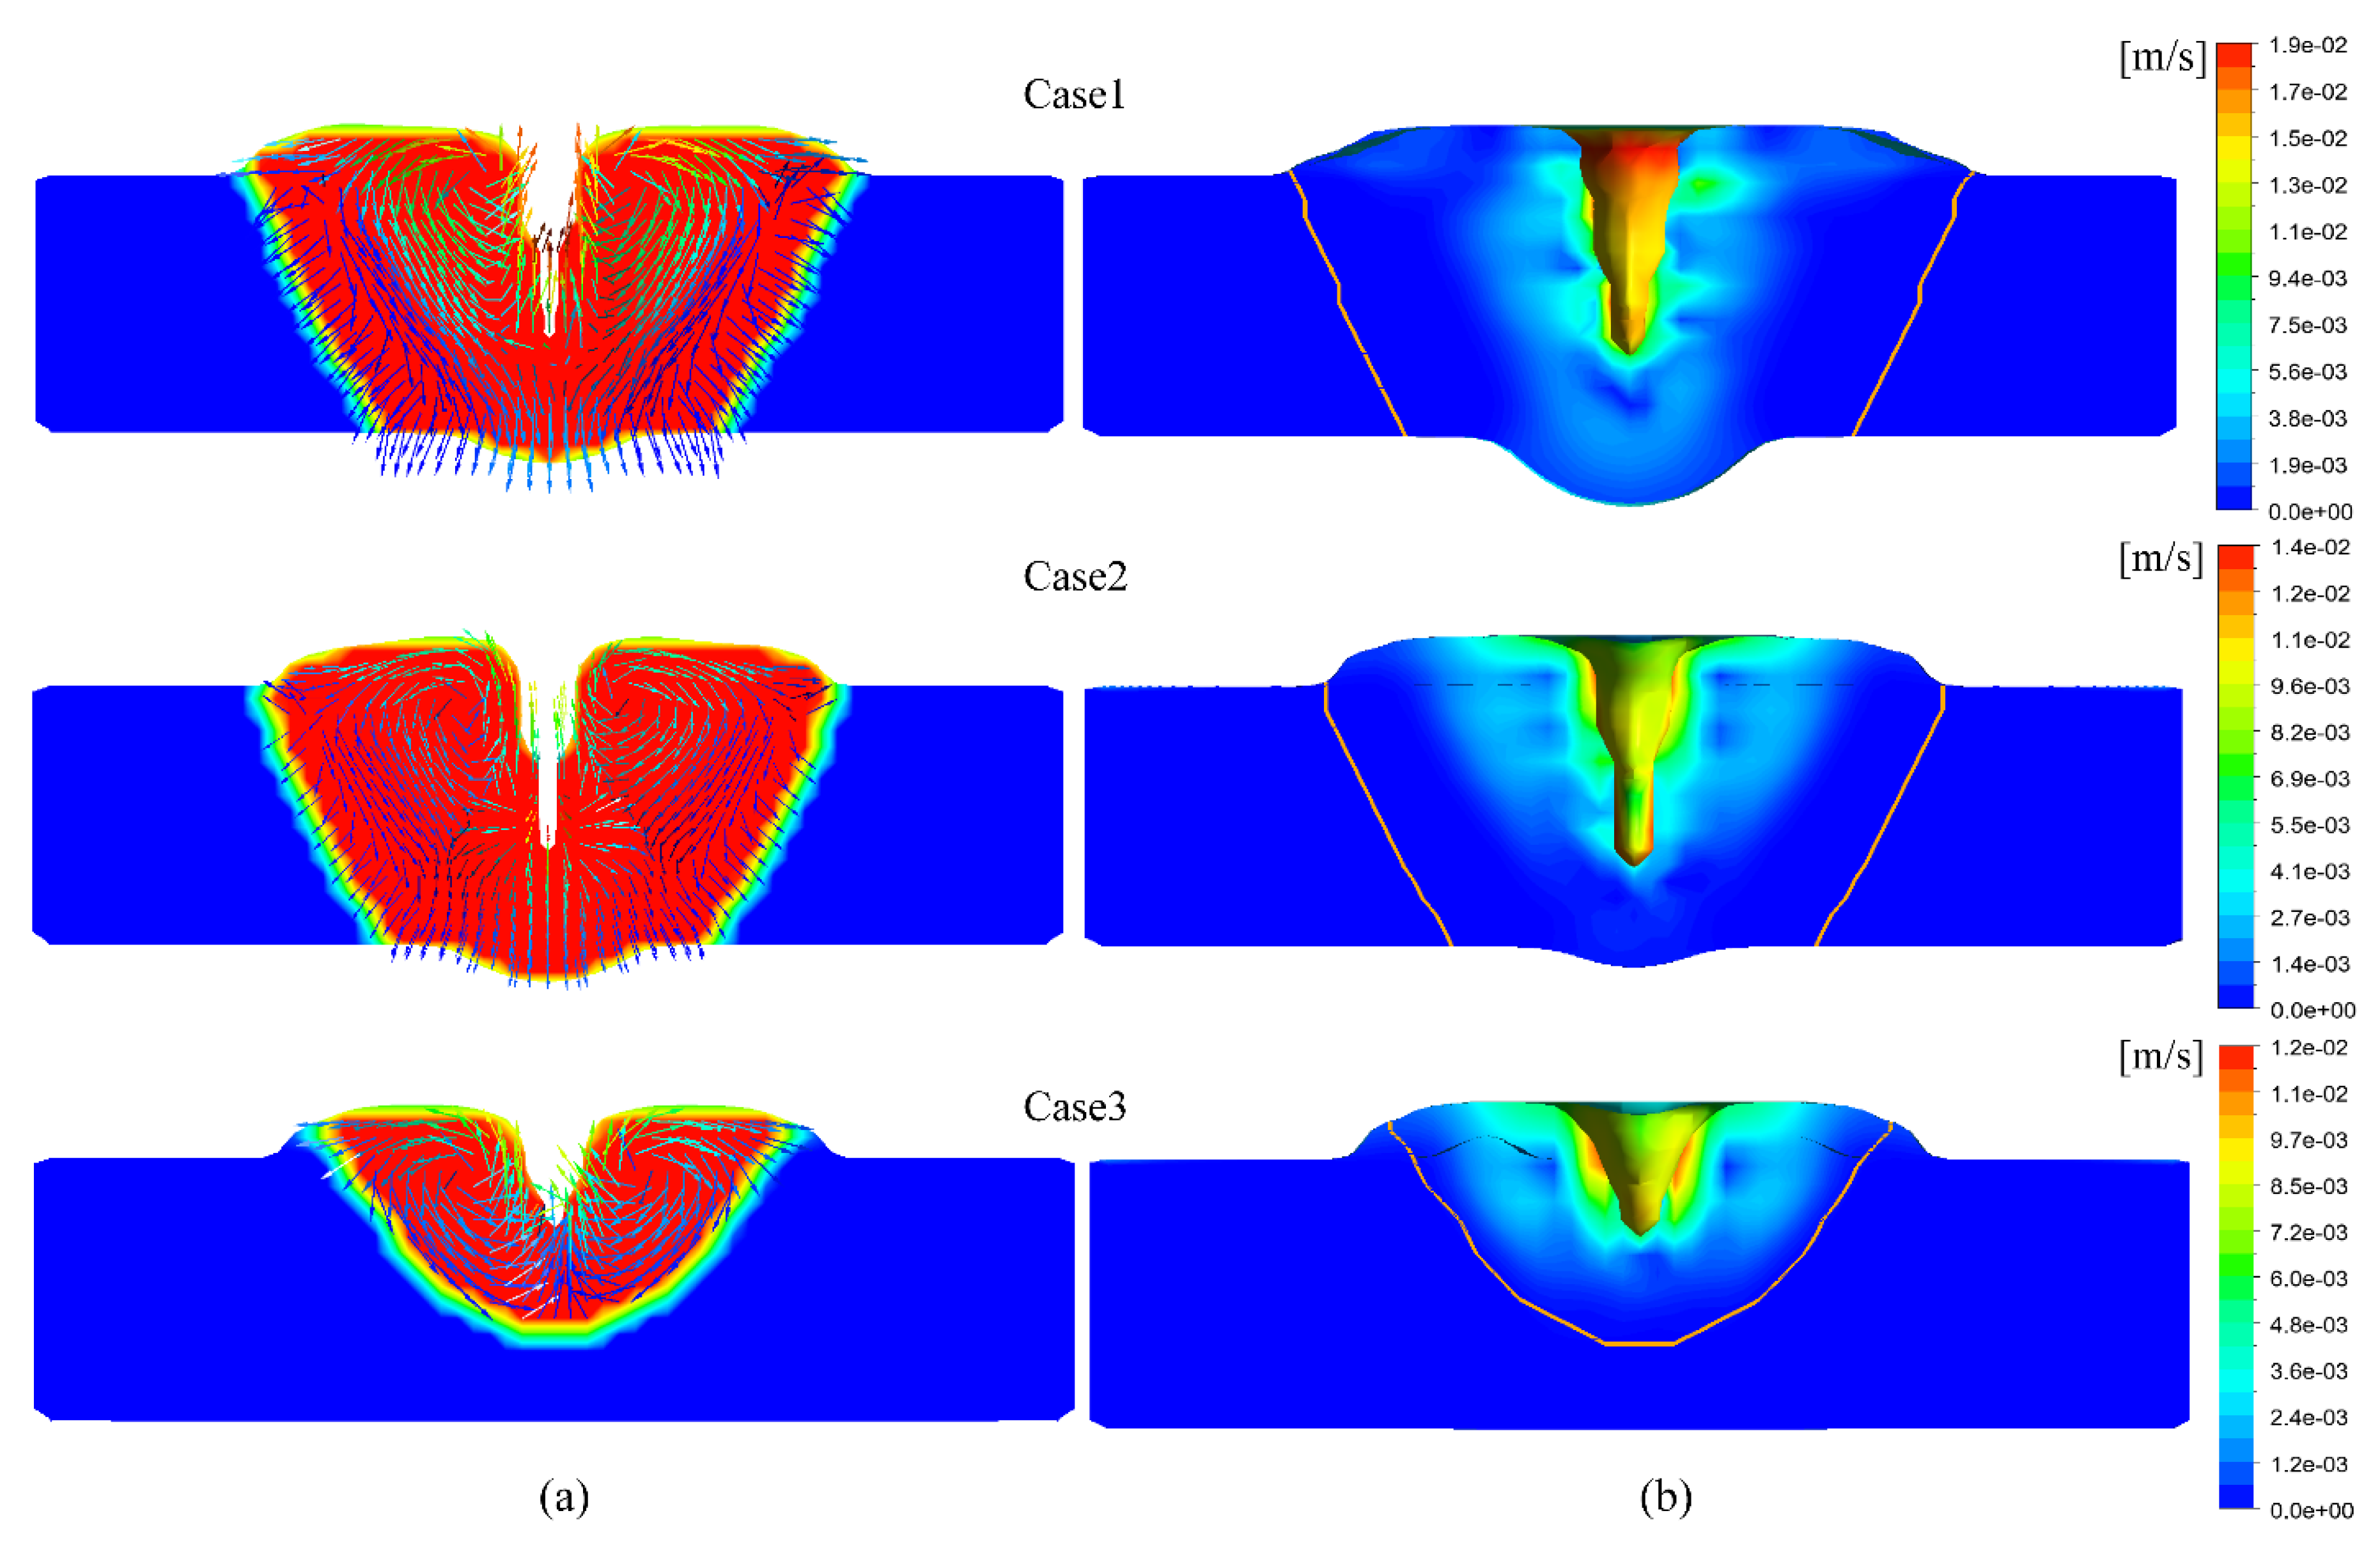
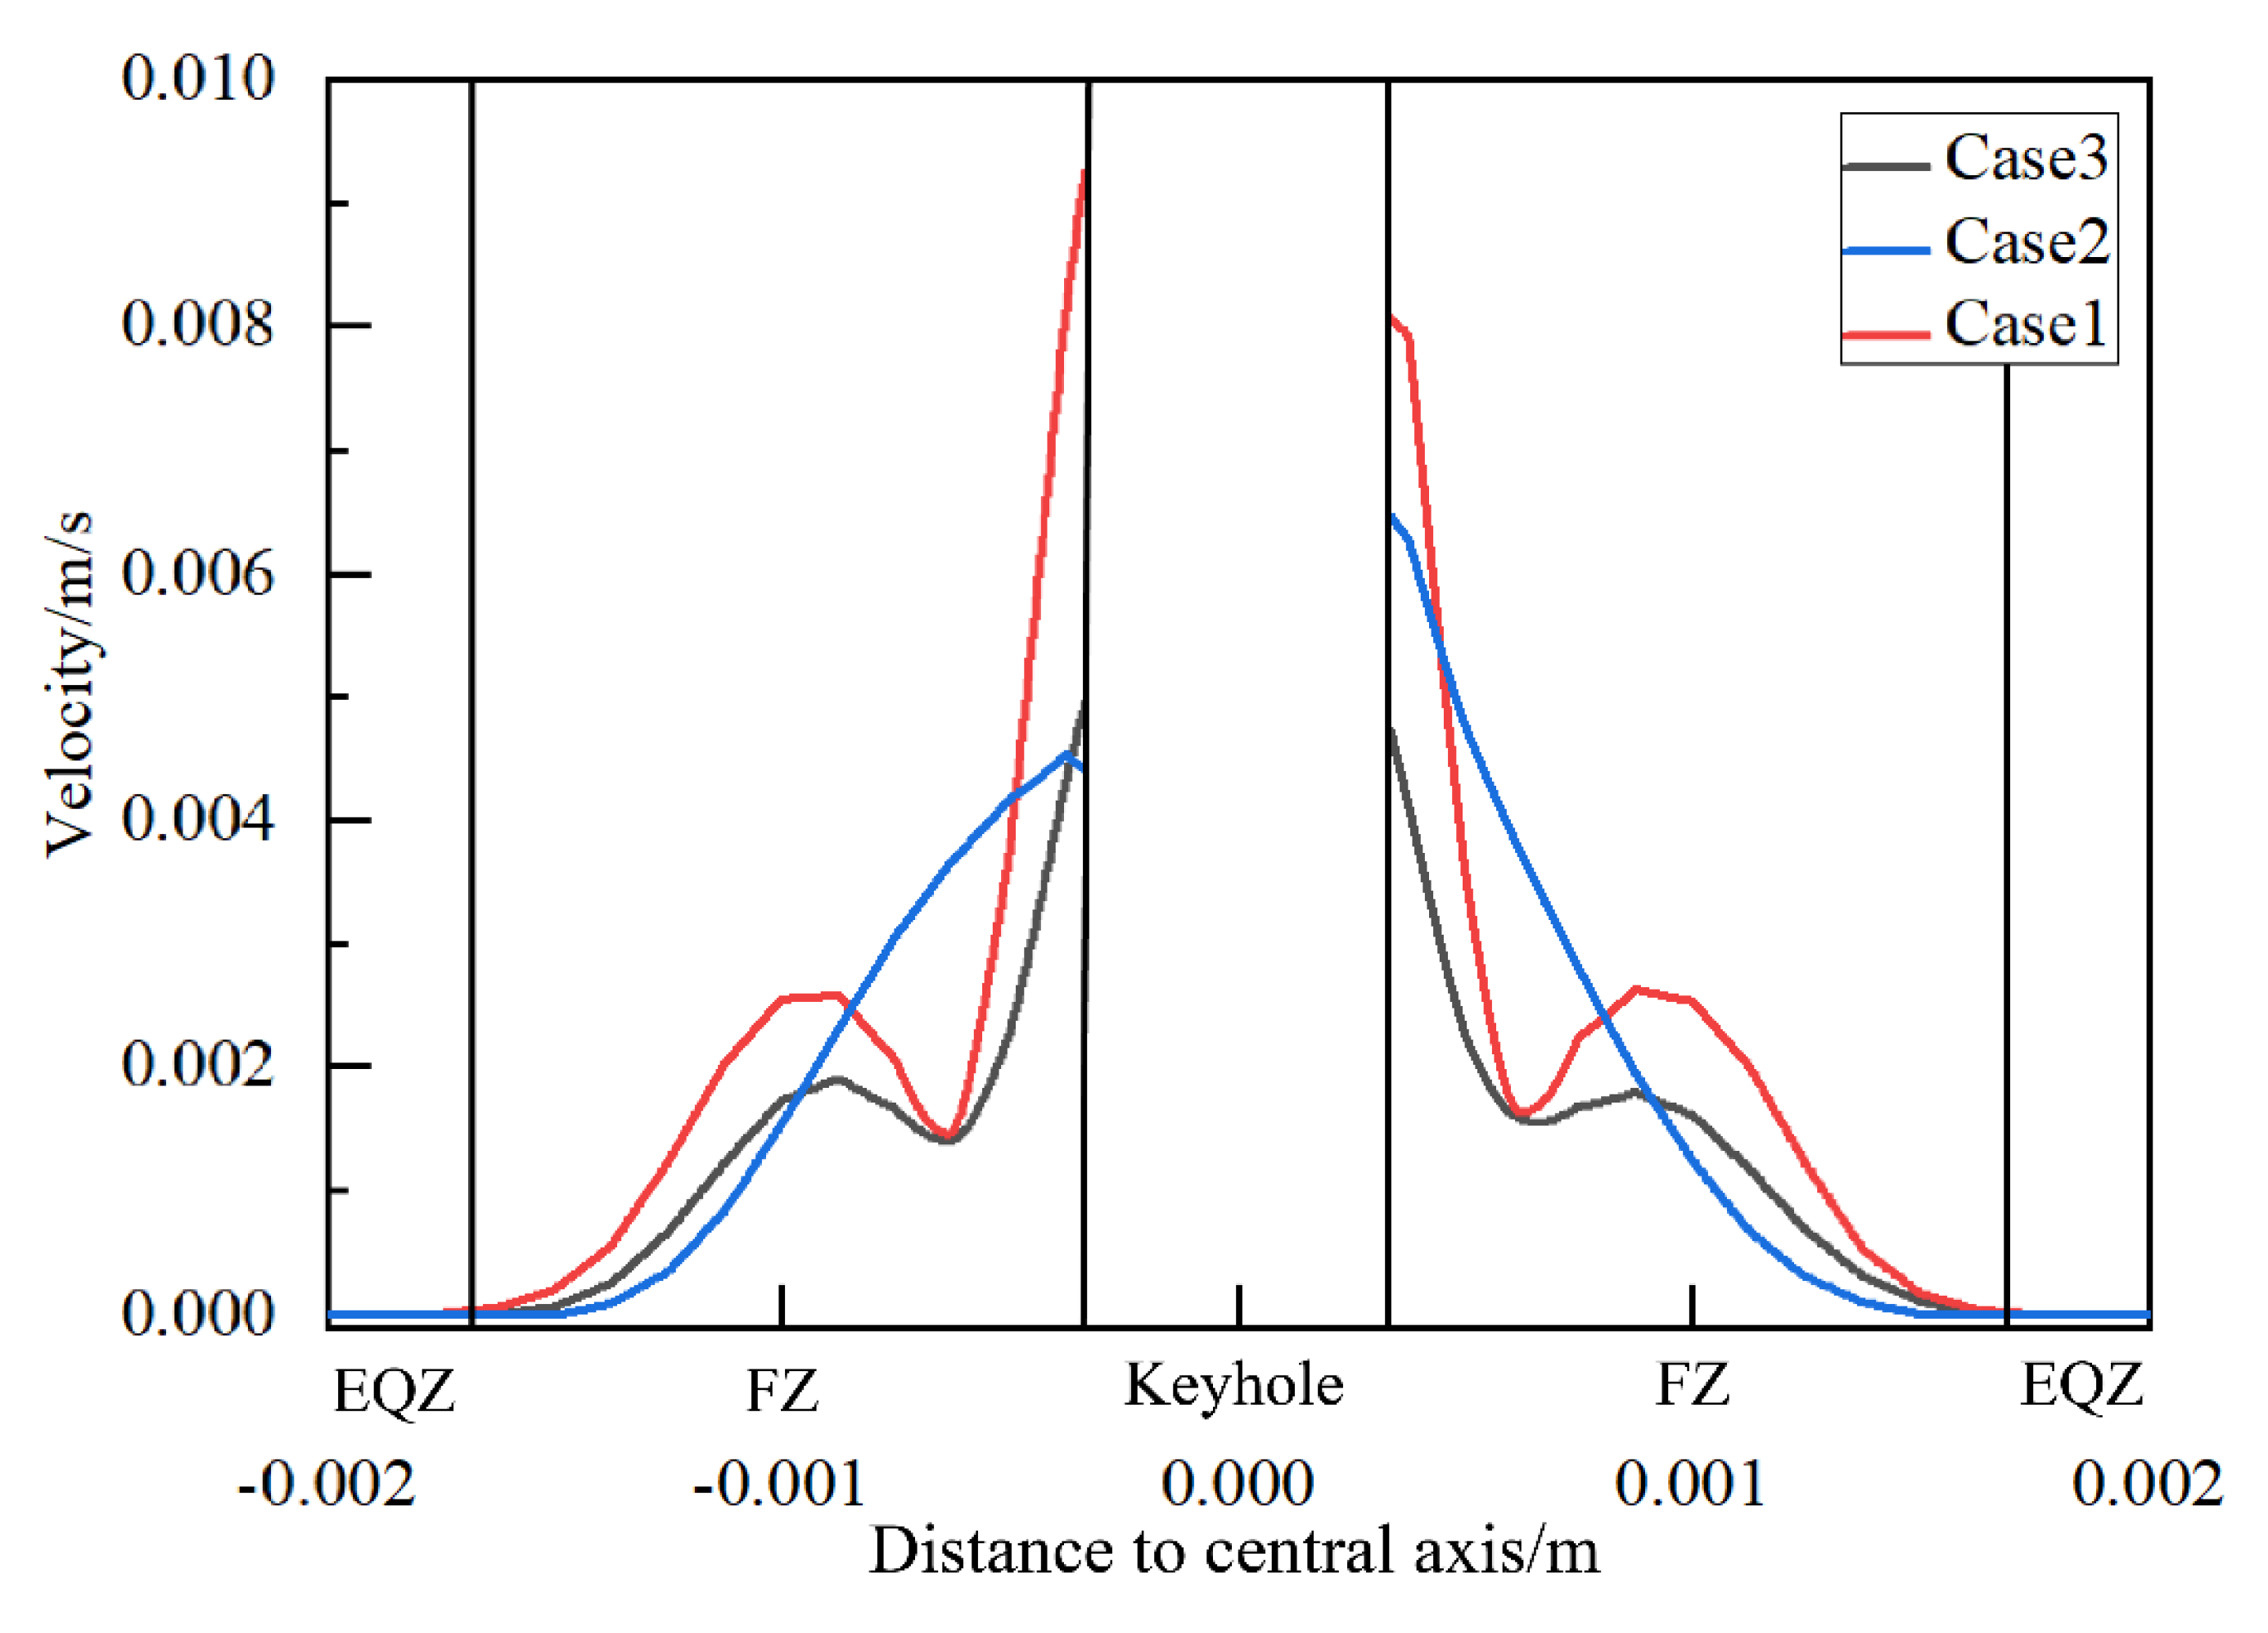
For Al-Li alloy workpieces, the weld morphology showed minimal difference with varying laser wire filler welding parameters. Increasing welding speed increased the cooling rate, which refined the grain structure. EQZ did not form in welds with a lower cooling rate, but appeared in welds with a higher cooling rate. Additionally, there was little flow near the EQZ in the molten pool. The main factor for EQZ formation was a higher cooling rate, with flow being a contributing factor. This study provides a guideline for developing a process strategy for laser filler wire welding to suppress EQZ generation by fine-tuning the wire feed rate.

Author Contributions

D.L.: investigation, conceptualization, formal analysis, visualization, writing—original draft, writing—review and editing. Q.X. and G.T.: supervision, project administration, conceptualization, formal analysis, investigation, visualization, writing—original draft, writing—review and editing, funding acquisition. L.Z.: supervision, conceptualization, writing—review and editing, formal analysis. X.Y.: project administration, visualization, writing—review and editing. M.L.: conceptualization, formal analysis, writing—review and editing. All authors have read and agreed to the published version of the manuscript.

Funding

National Natural Science Foundation of China (No. 52272446) and Projects for Key—Discipline Development in Guangdong Province (No. 2024ZDJS096).

Data Availability Statement

The original contributions presented in this study are included in the article. Further inquiries can be directed to the corresponding authors.

Conflicts of Interest

The authors declare no conflict of interest.

References

  1. Florian, N.; Dominic, B.; Richard, R.; Michael, S. Influence of Novel Beam Shapes on Laser-Based Processing of High-Strength Aluminium Alloys on the Basis of EN AW-5083 Single Weld Tracks. J. Manuf. Mater. Process. 2023, 7, 93. [Google Scholar] [CrossRef]
  2. Upama, D.; Aparna, D.; Souren, M. Modelling and optimization of laser welding of Al2024 aluminium alloy. World J. Eng. 2023, 21, 741–753. [Google Scholar]
  3. Zhao, Y.; Li, X.; Liu, Z.; Wang, J.; Li, Y.; Zhan, X. Stability enhancement of molten pool and keyhole for 2195 Al Li alloy using fiber-diode laser hybrid welding. J. Manuf. Process. 2023, 85, 724–741. [Google Scholar]
  4. Zhao, Y.; Li, Y.; Liu, R.; Li, Y.; Zhan, X. Effect of energy coupling mechanism on molten pool stability during fiber-diode hybrid laser welding of 2195 al-li alloy. Int. Conf. Comput. Exp. Eng. Sci. 2024, 30, 1. [Google Scholar] [CrossRef]
  5. Nath, U.; Yadav, V. On the Laser Forming Process of 6061 Aluminium Alloy Sheets with Angular Segment Irradiating Scheme: A Numerical and Statistical Investigation. Int. J. Precis. Eng. Manuf. 2024, 25, 2249–2262. [Google Scholar]
  6. Dhanaraj, P.S.; Rathinasuriyan, C. Optimization of fiber laser welding parameters for high strength aluminium alloy AA7075-T6. Mater. Today Proc. 2022, 52, 283–289. [Google Scholar]
  7. Wang, M.; Xia, P.Y.; Guo, J.Z.; Yin, Y.; Zhan, X.; Feng, X. Study on the microstructure and mechanical properties of continuous/pulsed hybrid laser shallow penetration welding joints of 6061 aluminium alloy. Optics Laser Technol. 2025, 180, 111390. [Google Scholar]
  8. Li, H.Y.; Yao, Q.M.; Wang, X. CFD numerical simulation of melt flow and weld pool formation in semiconductor laser direct welding of 6061 aluminium alloy with PET based on surface microtextured. Opt. Laser Technol. 2025, 183, 112236. [Google Scholar] [CrossRef]
  9. Yang, T.; Liu, J.; Zhuang, Y.; Sun, K.; Chen, W. Studies on the formation mechanism of incomplete fusion defects in ultra-narrow gap laser wire filling welding. Opt. Laser Technol. 2020, 129, 106275. [Google Scholar]
  10. Meng, X.; Bachmann, M.; Artinov, A.; Rethmeier, M. Experimental and numerical assessment of weld pool behavior and final microstructure in wire feed laser beam welding with electromagnetic stirring. J. Manuf. Process. 2019, 45, 408–418. [Google Scholar]
  11. Tan, W.; Shin, Y.C. Multi-scale modeling of solidification and microstructure development in laser keyhole welding process for austenitic stainless steel. Comput. Mater. Sci. 2015, 98, 446–458. [Google Scholar]
  12. Malikov, A.; Orishich, A.; Golyshev, A.; Karpov, E. Manufacturing of high-strength laser welded joints of an industrial aluminum alloy of system Al-Cu-Li by means of post heat treatment. J. Manuf. Process. 2019, 41, 101–110. [Google Scholar]
  13. Jabar, S.; Hayat, Q.; Barenji, A.B.; Chianese, G.; Kotadia, H.; Ceglarek, D.; Franciosa, P. Investigations of weld profiling and intermetallic formation in laser welding of steel-to-aluminium: A multi-physics CFD approach using beam shaping. Procedia CIRP 2024, 124, 559–564. [Google Scholar]
  14. Zhang, X.; Huang, T.; Yang, W.; Xiao, R.; Liu, Z.; Li, L. Microstructure and mechanical properties of laser beam-welded AA2060 Al-Li alloy. J. Mater. Process. Technol. 2016, 237, 301–308. [Google Scholar]
  15. Ke, W.; Bu, X.; Oliveira, J.P.; Xu, W.; Wang, Z.; Zeng, Z. Modeling and numerical study of keyhole-induced porosity formation in laser beam oscillating welding of 5A06 aluminum alloy. Opt. Laser Technol. 2021, 133, 106540. [Google Scholar]
  16. Shi, L.; Li, X.; Jiang, L.; Gao, M. Numerical study of keyhole-induced porosity suppression mechanism in laser welding with beam oscillation. Sci. Technol. Weld. Join. 2021, 26, 349–355. [Google Scholar]
  17. Han, C.; Jiang, P.; Geng, S.; Ren, L. Multi-physics multi-scale simulation of unique equiaxed-to-columnar-to-equiaxed transition during the whole solidification process of Al-Li alloy laser welding. J. Mater. Sci. Technol. 2024, 171, 235–251. [Google Scholar]
  18. Han, C.; Jiang, P.; Geng, S.N. Nucleation mechanism in oscillating laser welds of 2024 aluminium alloy: A combined experimental and numerical study. Opt. Laser Technol. 2023, 158, 108812. [Google Scholar]
  19. Shi, P.; Wan, Q. Numerical simulation of formation process of keyhole-induced pore for laser deep penetration welding. In Proceedings of the 2016 International Conference on Advanced Electronic Science and Technology (AEST 2016), Shenzhen, China, 19–21 August 2016; Atlantis Press: Dordrecht, The Netherlands, 2016; pp. 68–373. [Google Scholar]
  20. Ai, Y.; Liu, X.; Huang, Y.; Yu, L. Numerical analysis of the influence of molten pool instability on the weld formation during the high speed fiber laser welding. Int. J. Heat Mass Transf. 2020, 160, 120103. [Google Scholar]
  21. Liu, T.; Mu, Z.; Hu, R.; Pang, S. Sinusoidal oscillating laser welding of 7075 aluminum alloy: Hydrodynamics, porosity formation and optimization. Int. J. Heat Mass Transf. 2019, 140, 346–358. [Google Scholar]
  22. Jiang, M.; Li, B.; Chen, X.; Tan, C.; Lei, Z.; Zhao, S.; Chen, Y. Numerical study of thermal fluid dynamics and solidification characteristics during continuous wave and pulsed wave laser welding. Int. J. Therm. Sci. 2022, 181, 107778. [Google Scholar]
  23. Bunaziv, I.; Akselsen, O.M.; Ren, X.B.; Nyhus, B.; Eriksson, M. Laser beam and laser-arc hybrid welding of aluminium alloys. Metals 2021, 11, 1150. [Google Scholar] [CrossRef]
  24. Leitner, M.; Leitner, T.; Schmon, A.; Aziz, K.; Pottlacher, G. Thermophysical properties of liquid aluminium. Metall. Mater. Trans. A 2017, 48, 3036–3045. [Google Scholar]
  25. Xv, Q.; Tian, G.; Zhang, W.; Yang, Z.; Ming, A. Effect of the weld parameter strategy on mechanical properties of double-sided laser-welded 2195 Al–Li alloy joints with filler wire. High Temp. Mater. Process. 2022, 41, 92–110. [Google Scholar]
  26. Semak, V.; Matsunawa, A. The role of recoil pressure in energy balance during laser materials processing. J. Phys. D-Appl. Phys. 1997, 30, 2541–2552. [Google Scholar]
  27. Khalloufi, M.; Mesri, Y.; Valette, R.; Massoni, E.; Hachem, E. High fidelity anisotropic adaptive variational multiscale method for multiphase flows with surface tension. Comput. Methods Appl. Mech. Eng. 2016, 307, 44–67. [Google Scholar]
  28. Zhao, H.; Niu, W.; Zhang, B.; Lei, Y.; Kodama, M.; Ishide, T. Modelling of keyhole dynamics and porosity formation considering the adaptive keyhole shape and three-phase coupling during deep-penetration laser welding. J. Phys. D Appl. Phys. 2011, 44, 485302. [Google Scholar]
  29. Unni, A.K.; Vasudevan, M. Computational fluid dynamics simulation of hybrid laser-MIG welding of 316 LN stainless steel using hybrid heat source. Int. J. Therm. Sci. 2023, 185, 108042. [Google Scholar]
  30. Lin, Y.; Lüthi, C.; Afrasiabi, M. Enhanced heat source modelling in particle-based laser manufacturing simulations with ray tracing. Int. J. Heat Mass Transf. 2023, 214, 124378. [Google Scholar]
  31. Cetin, B.; Kuşcu, Y.F.; Çetin, B.; Tümüklü, Ö.; Cole, K.D. Semi-analytical source (SAS) method for 3-D transient heat conduction problems with moving heat source of arbitrary shape. Int. J. Heat Mass Transf. 2021, 165, 120692. [Google Scholar]
  32. Li, X.; Zhao, S.N.; Jiang, L.H.; Lu, Y.; Gong, M.; Zhang, C.; Gao, M. Droplet detachment and motion behaviors in laser-MIG hybrid welding of aluminium alloy. Int. J. Heat Mass Transf. 2023, 210, 124165. [Google Scholar]
  33. Kostrivas, A.; Lippold, J.C. Fusion boundary microstructure evolution in aluminium alloys. Weld World 2006, 50, 24–34. [Google Scholar] [CrossRef]
  34. Kouraytem, N.; Li, X.; Cunningham, R.; Zhao, C.; Parab, N.; Sun, T.; Rollett, A.D.; Spear, A.D.; Tan, W. Effect of laser-matter interaction on molten pool flow and keyhole dynamics. Phys. Rev. Appl. 2019, 11, 064054. [Google Scholar] [CrossRef]
  35. Sohail, M.; Han, S.-W.; Na, S.-J. Characteristics of weld pool behavior in laser welding with various power inputs. Weld World 2014, 58, 269–277. [Google Scholar] [CrossRef]
  36. Hua, K.; Zhao, Z.J.; Zou, J.L.; Wang, Z.; Huang, Z. The influence of laser-induced plume in the keyhole on the welding process. Hanjie Xuebao/Trans. China Weld. Inst. 2023, 44, 20–26. [Google Scholar]
  37. Chen, Y.T.; Yang, Z.D.; Xu, K.; He, P.; Shi, M.; Chen, S.; Fang, C. Effect of energy parameters on droplet transfer behavior and weld formation in laser-arc hybrid welding with cable-type welding wire. J. Mater. Res. Technol. 2023, 26, 4191–4205. [Google Scholar]
  38. Han, B.; Tao, W.; Chen, Y. Double-sided laser beam welded T-joints for aluminium-lithium alloy aircraft fuselage panels: Effects of filler elements on microstructure and mechanical properties. Opt. Laser Technol. 2017, 93, 99–108. [Google Scholar]
  39. Wang, Z.Y.; Gong, M.C.; Zhou, L.Z. A Review of Numerical Simulation of Laser-Arc Hybrid Welding. Materials 2023, 16, 3561. [Google Scholar]
  40. Li, L.Y.; Luo, Z.Y.; Hu, Y. Influence mechanism of laser power on hybrid laser-MAG welding undercut defect. Weld. World 2023, 67, 765–776. [Google Scholar] [CrossRef]
  41. Li, J.R.; Yu, M.; Wang, L.; Vogel, F.; Wang, X.N.; Shen, X.J.; Song, B.N.; Nagaumi, H. Effect of filling materials on microstructure and properties of CMT-laser beam oscillation hybrid welding behavior of dissimilar Al-Mg-Si alloys. J. Mater. Res. Technol. 2023, 26, 8272–8288. [Google Scholar] [CrossRef]
  42. Chen, S.J.; Liu, J.B.; Jiang, F. Gravity effects on temperature distribution and material flow in the keyhole pool of VPPA Al welding. Int. J. Heat Mass Transf. 2022, 191, 122823. [Google Scholar] [CrossRef]
  43. Liu, T.; Zhan, X.; Fu, R.; Liu, D. Study on the formation mechanism of fine equiaxed grain ribbons along the fusion lines during 2060/2099 Al-Li alloys dual laser-beam synchronous welding process. Mater. Res. Express 2019, 6, 126506. [Google Scholar] [CrossRef]
Figure 1. Schematic diagram of laser weld with filler wire and computational domain meshing methods.
Metals 15 00348 g001aMetals 15 00348 g001b
Figure 2. Result of mesh independence verification.
Metals 15 00348 g002
Figure 3. The flow chart of tracing the keyhole depth.
Metals 15 00348 g003
Figure 4. Computational domain and boundary condition.
Metals 15 00348 g004
Figure 5. The laser welding system (JK2003SM laser source and YASKAWA robot arm).
Metals 15 00348 g005
Figure 6. 3D simulation and experimental results.
Metals 15 00348 g006
Figure 7. Comparison between calculated and experimental fusion zone.
Metals 15 00348 g007
Figure 8. Weld microstructure and hardness: (a) crystal structure distribution; (b) sampling position; (c) hardness distribution.
Metals 15 00348 g008
Figure 9. The simulated welding thermal cycle curves: (a) curve for the second sampling point; (b) curve for the first sampling point.
Metals 15 00348 g009
Figure 10. Energy absorption curve for filler wire.
Metals 15 00348 g010
Figure 11. Rate of temperature variation in different weld sections.
Metals 15 00348 g011
Figure 12. Flow field in weld section: (a) trend of velocity field; (b) velocity field.
Metals 15 00348 g012
Figure 13. Velocity curve in weld section.
Metals 15 00348 g013
Figure 14. The engineering stress–strain curves for different case.
Metals 15 00348 g014
Figure 15. SEM maps of tensile fractures: Case 1 (a,d); Case 2 (b,e); Case 3 (c,f).
Metals 15 00348 g015
Table 1. Experimental parameters.
ParametersCase 1Case 2Case 3
Power (W)150015001500
Welding speed (mm/s)334
Feeding wire speed (mm/s)244
Shield gas flux (L/min)202020
Defocus distance (mm)160160160
Table 2. Chemical composition of workpiece and filler wire (%).
Workpiece
Al (2195)CuLiAgZrFeMgTi
Balance3.70.80.20.10.10.20.068
Filler Wire
Al (ER2319)CuFeMnMgSiZnTiV
Balance5.60.30.30.20.20.10.150.1
Disclaimer/Publisher’s Note: The statements, opinions and data contained in all publications are solely those of the individual author(s) and contributor(s) and not of MDPI and/or the editor(s). MDPI and/or the editor(s) disclaim responsibility for any injury to people or property resulting from any ideas, methods, instructions or products referred to in the content.

