Comparison of Industrial Quenching Oils
Abstract
1. Introduction
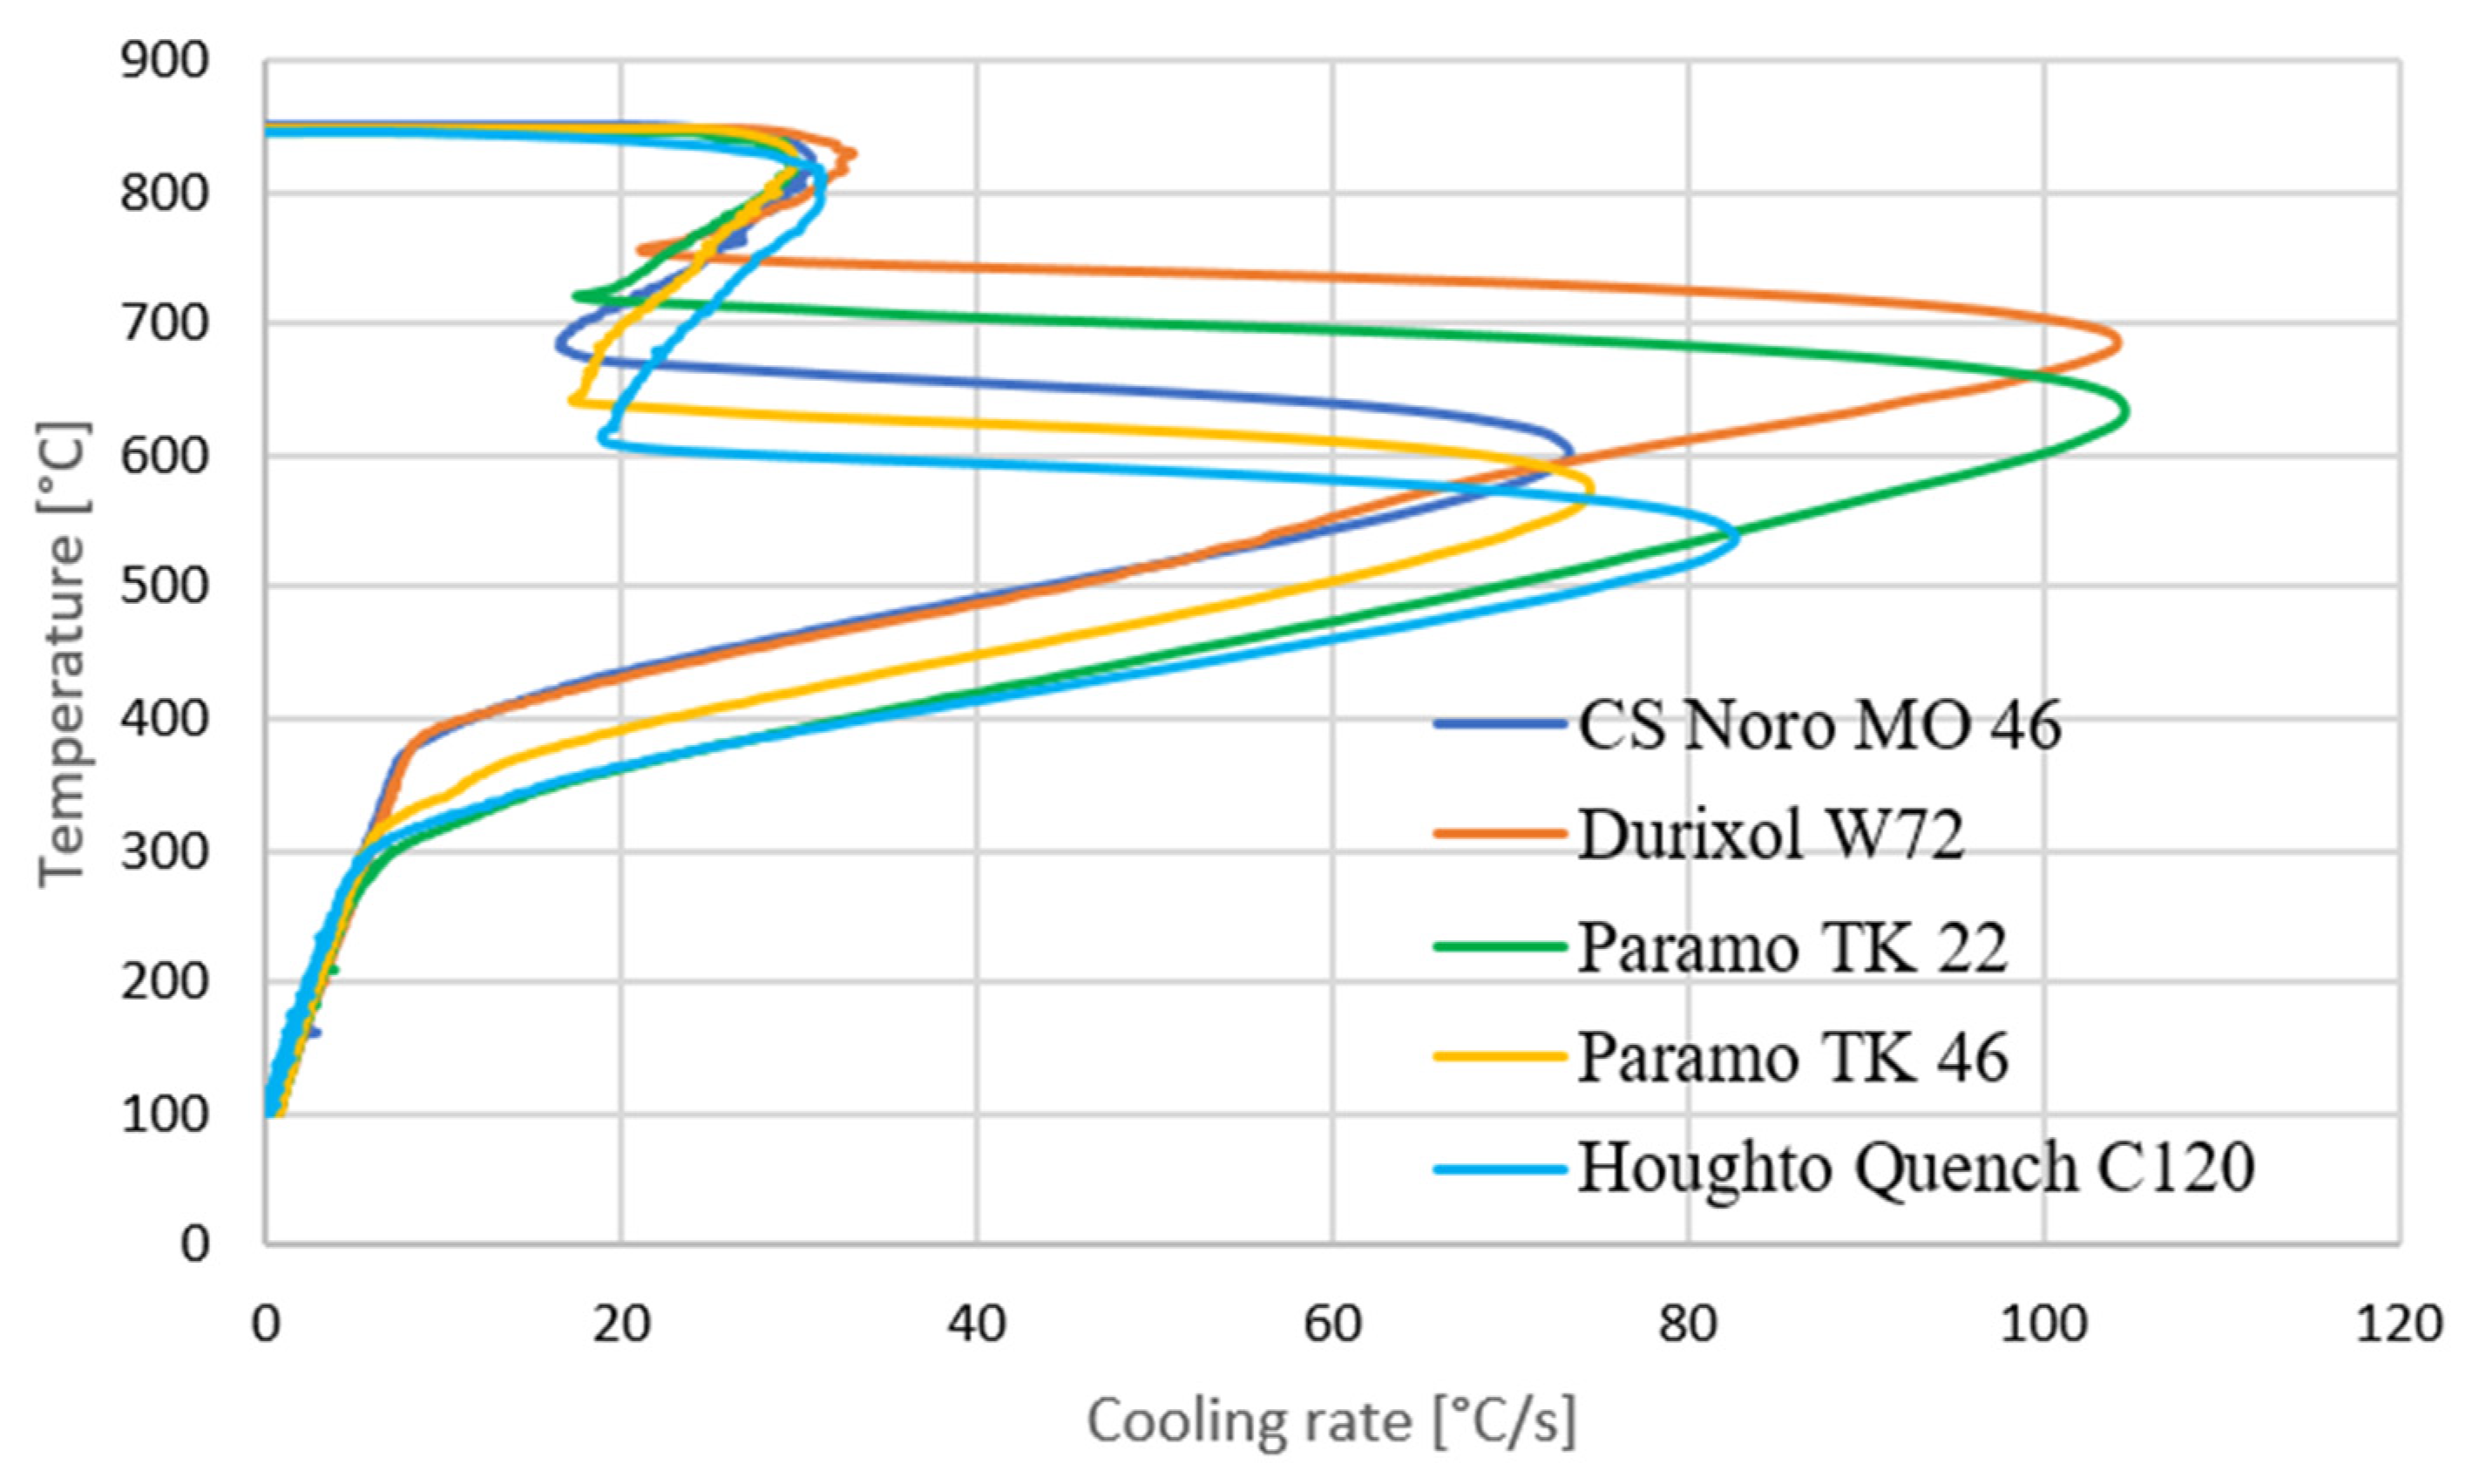
- Cooling curve (including the cooling rate and time to cool to certain temperatures) according to ISO 9950. This part of the experiment is based on [1].
- V-value was developed by Tamura, and reflects the steel grade or, more appropriately, its CCT curves [6].
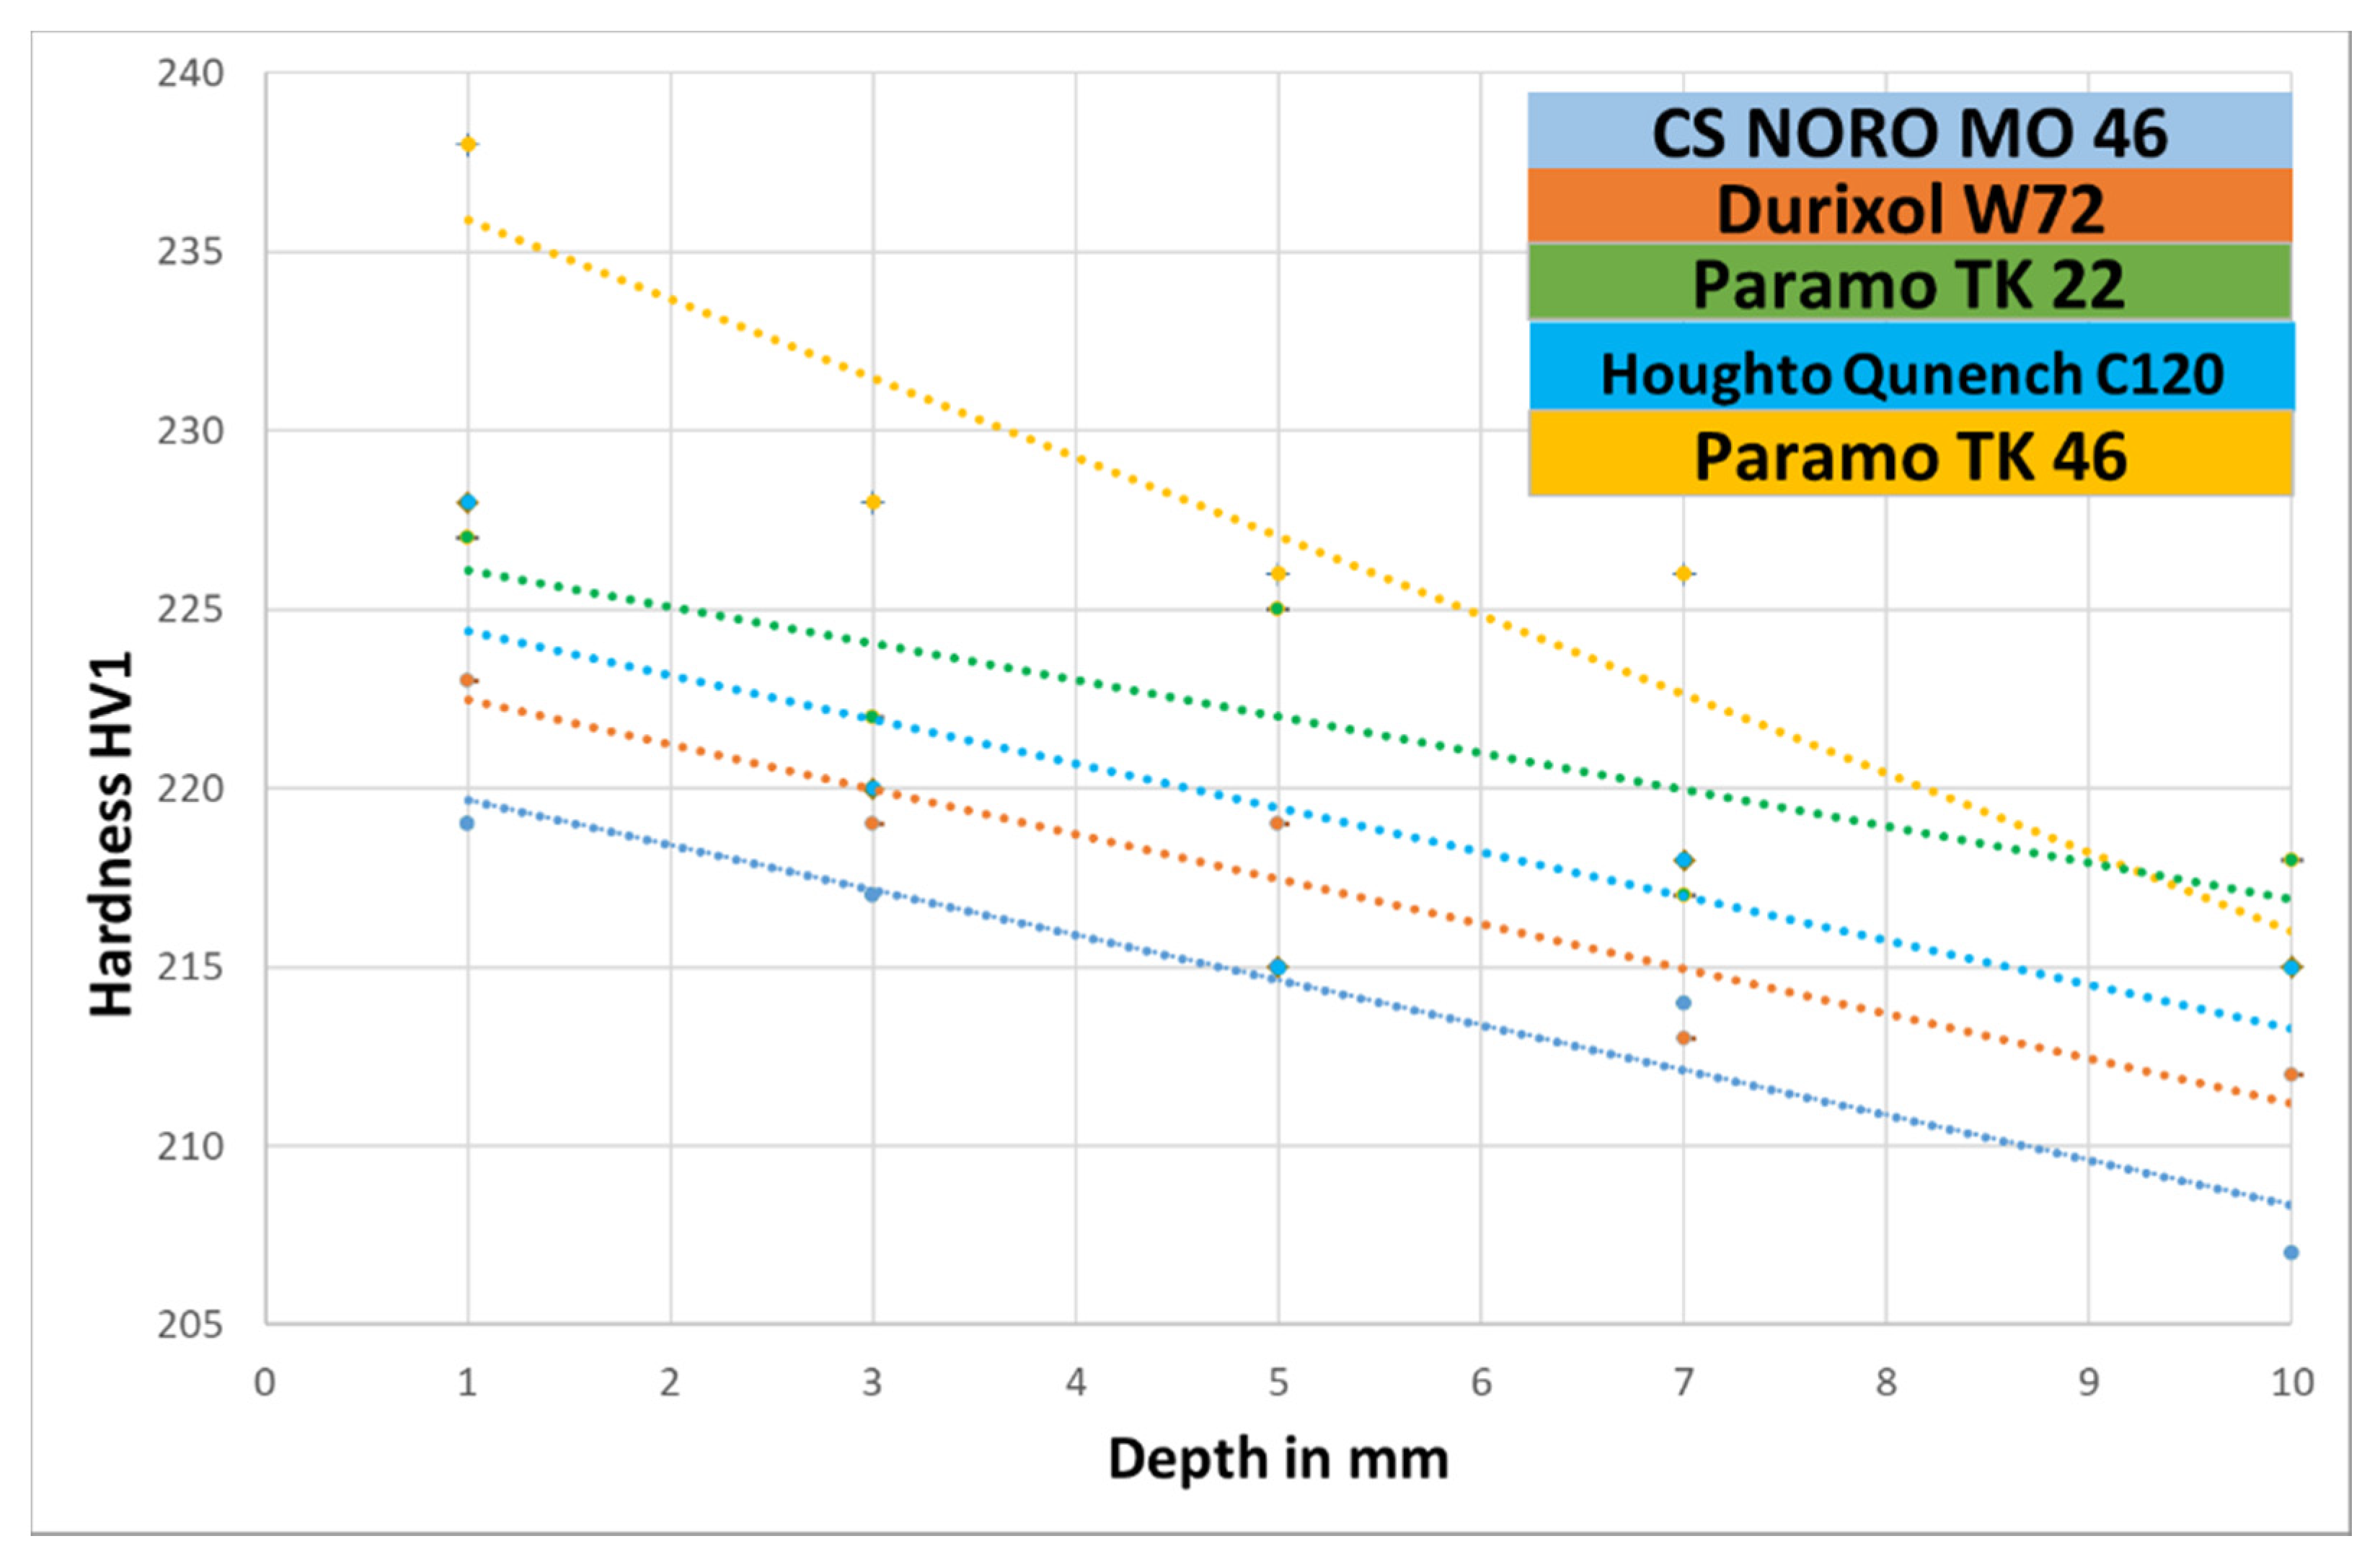
- Profile of hardness and microstructure on a section through a cylinder made from EN C35E steel for a particular oil.
2. Identification of an Appropriate Criterion for Assessing of Quenching Oils
2.1. Comparison of Quenching Oils Based on Hardness and Microstructure of EN C35E Steel
2.2. Cooling Curves According to ISO 9950
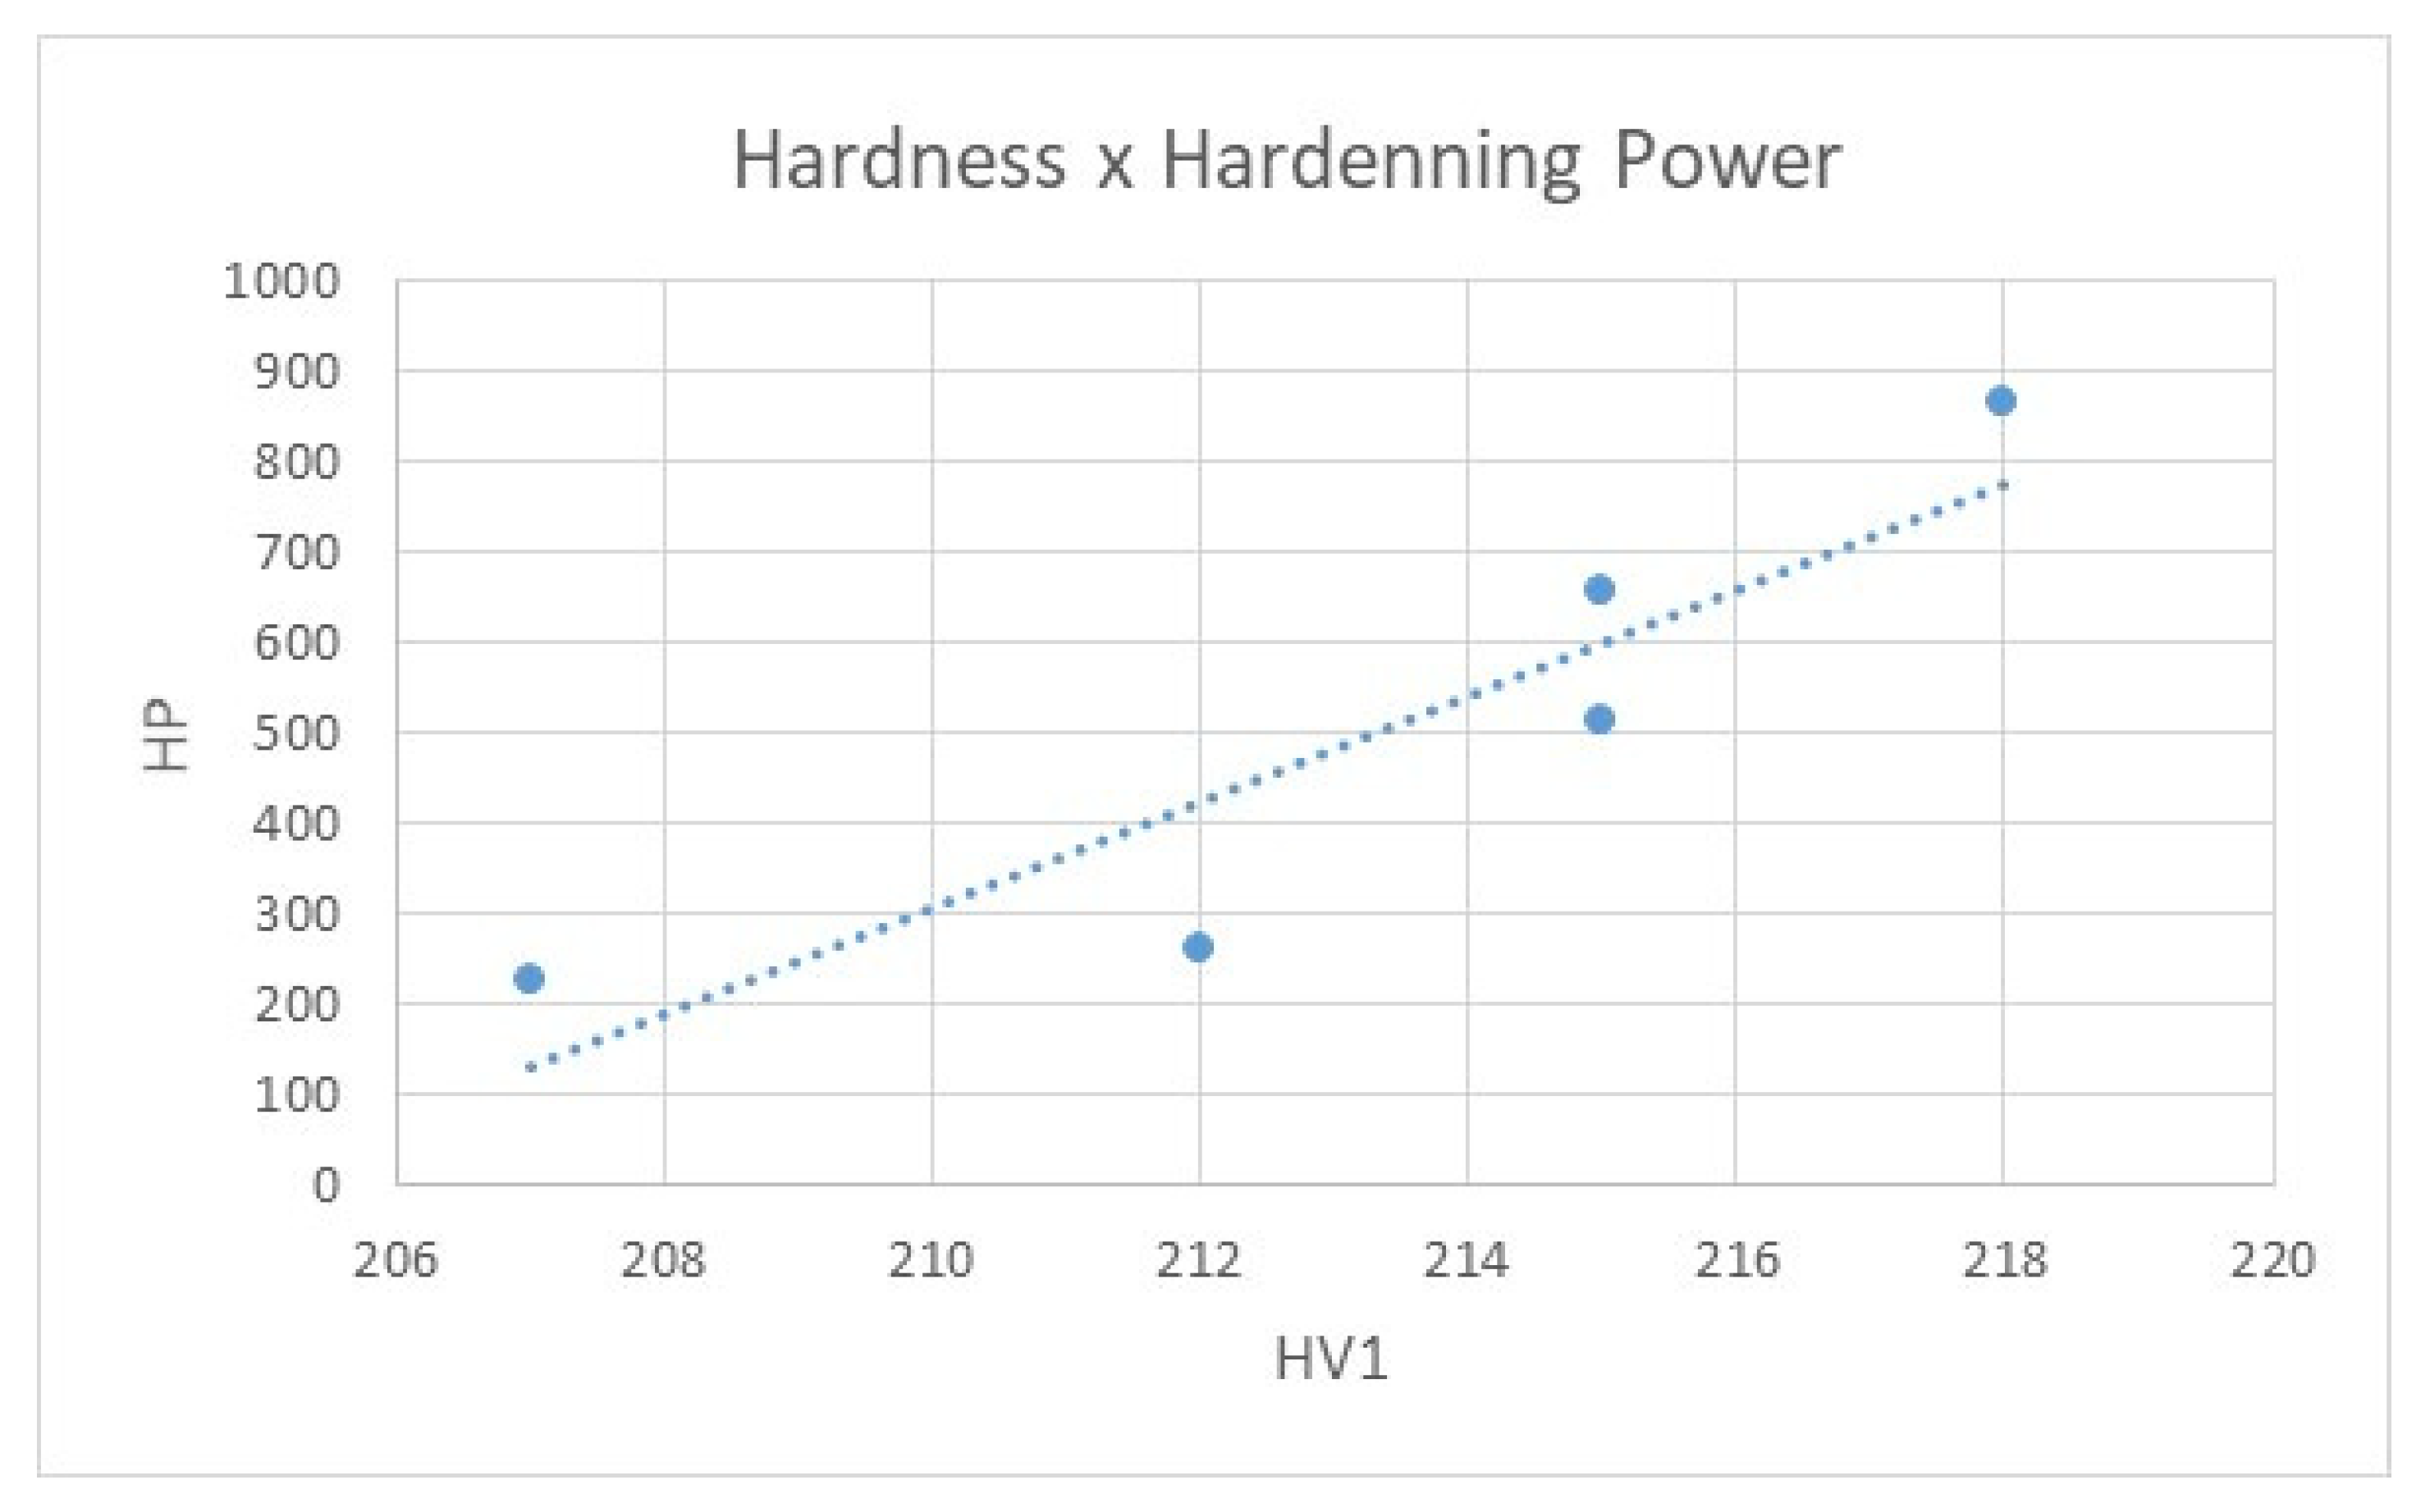
2.3. Hardening Power
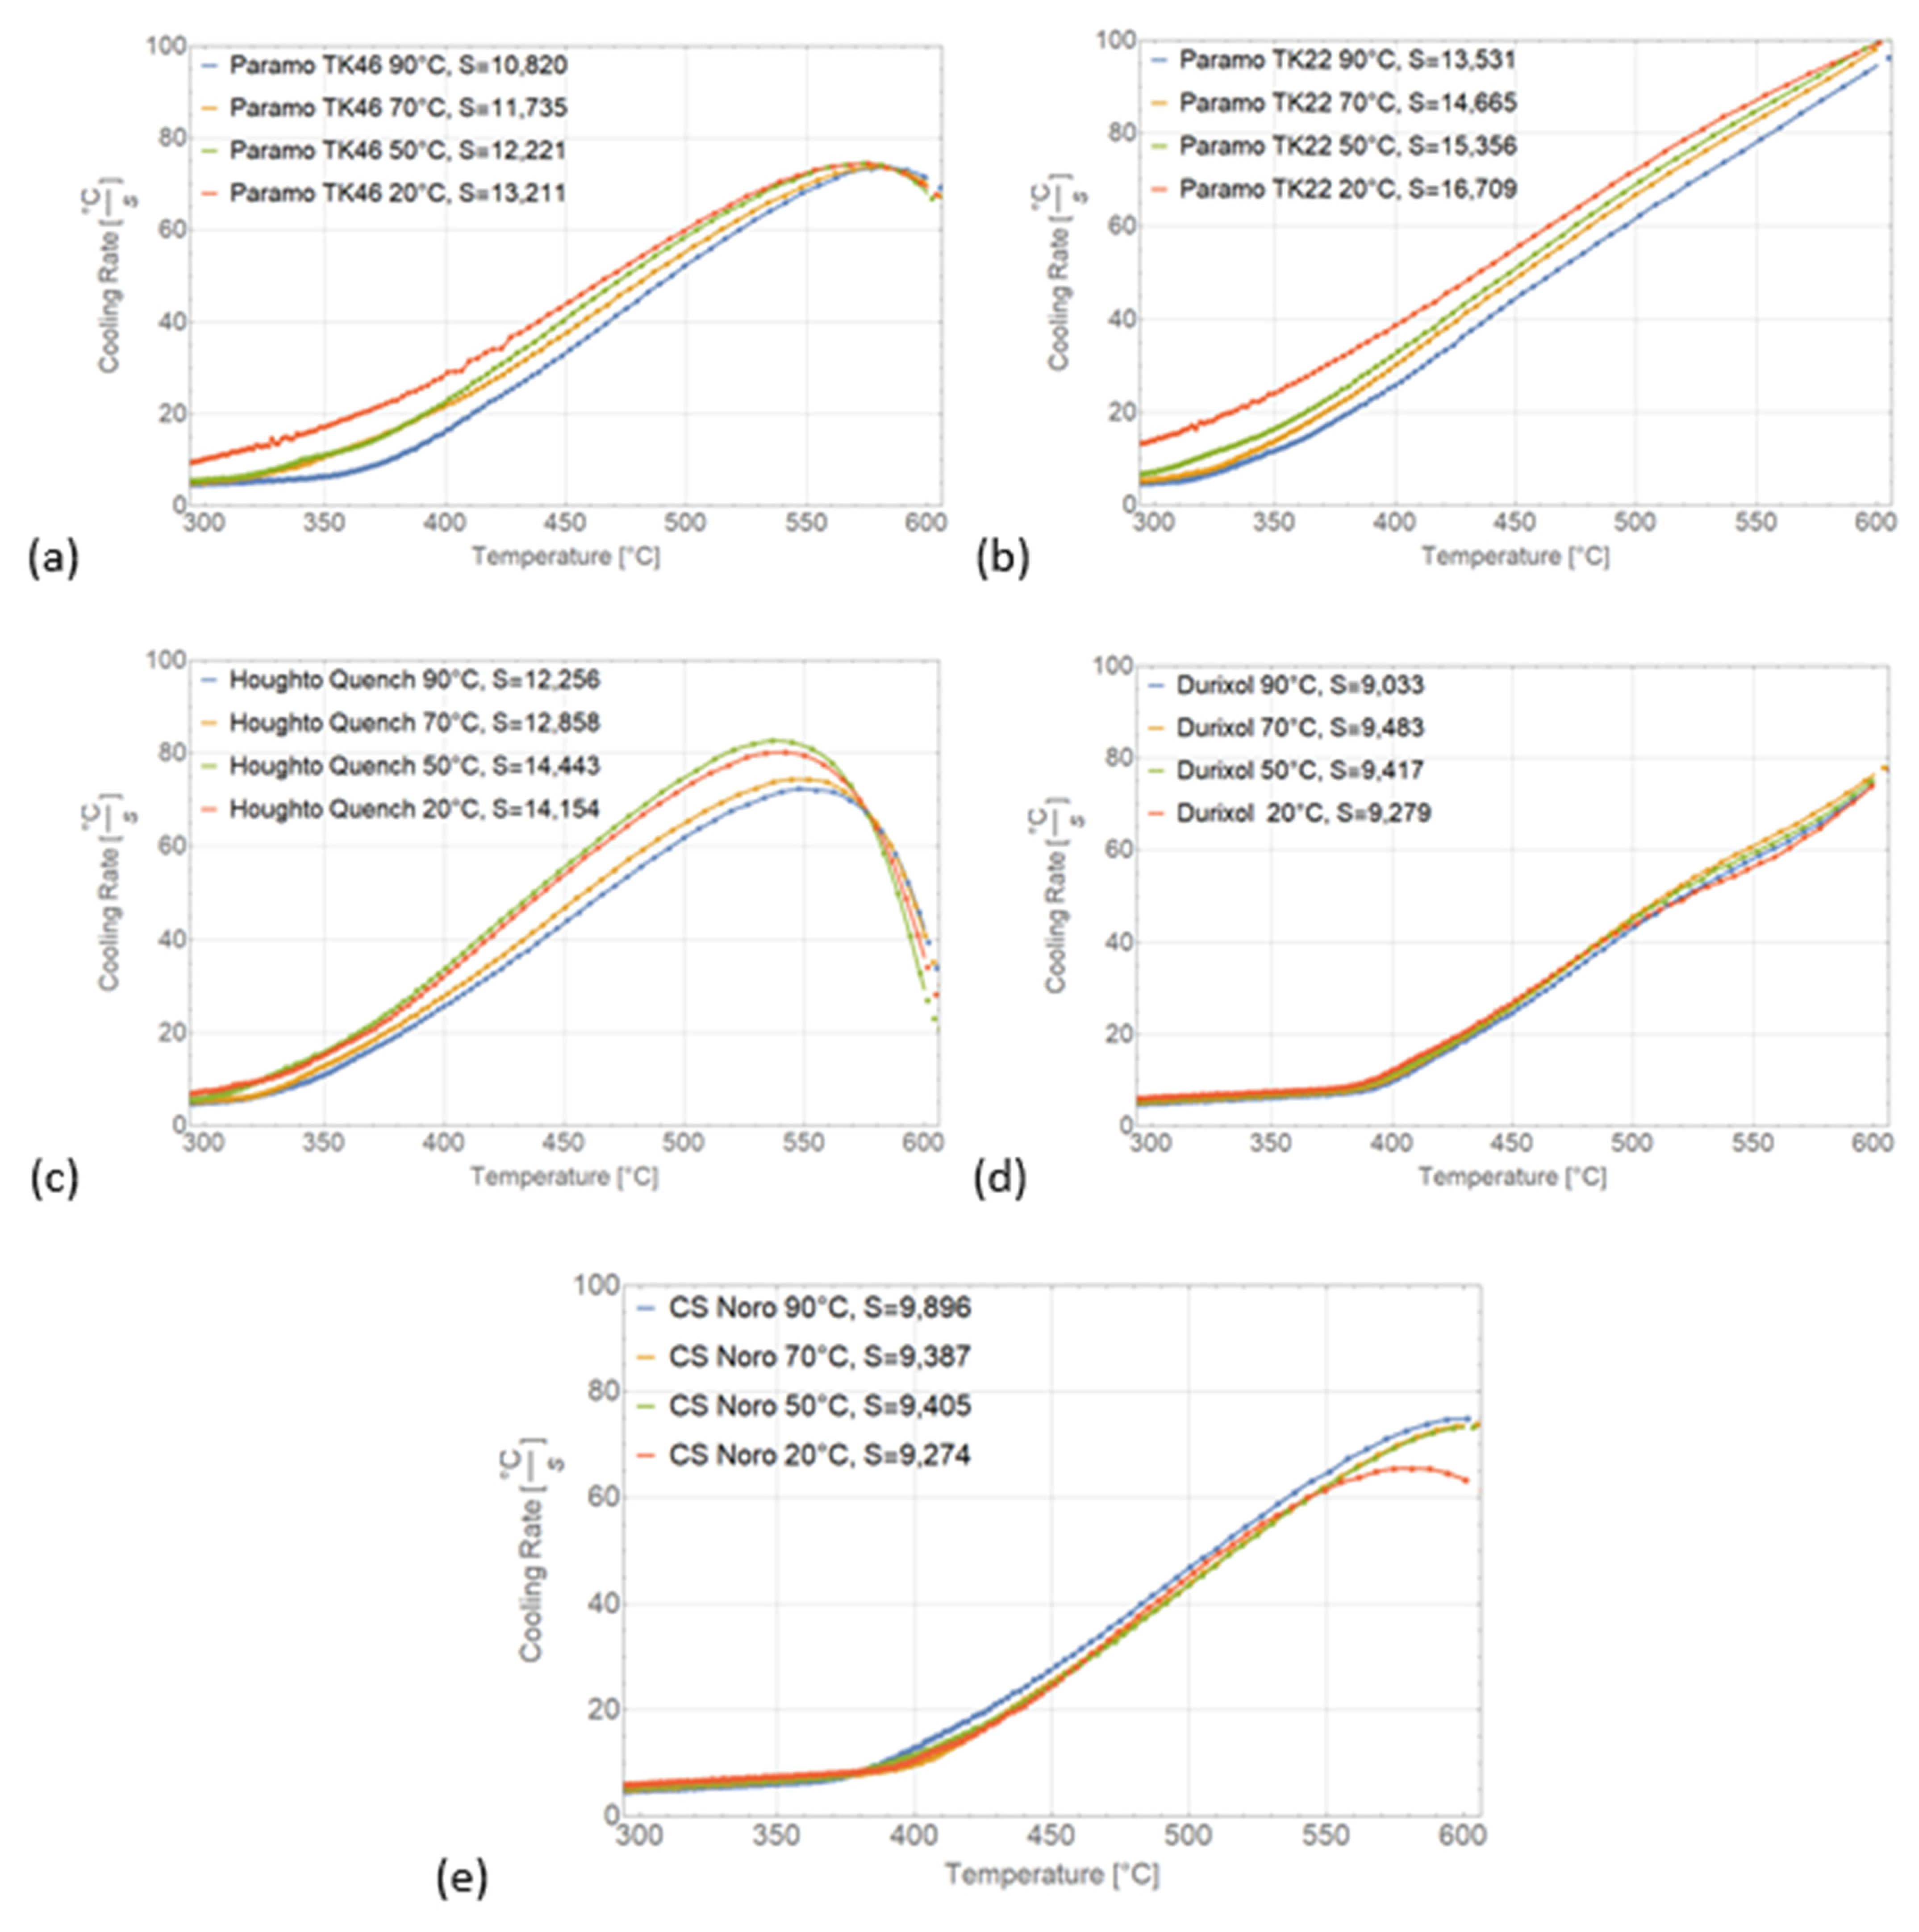
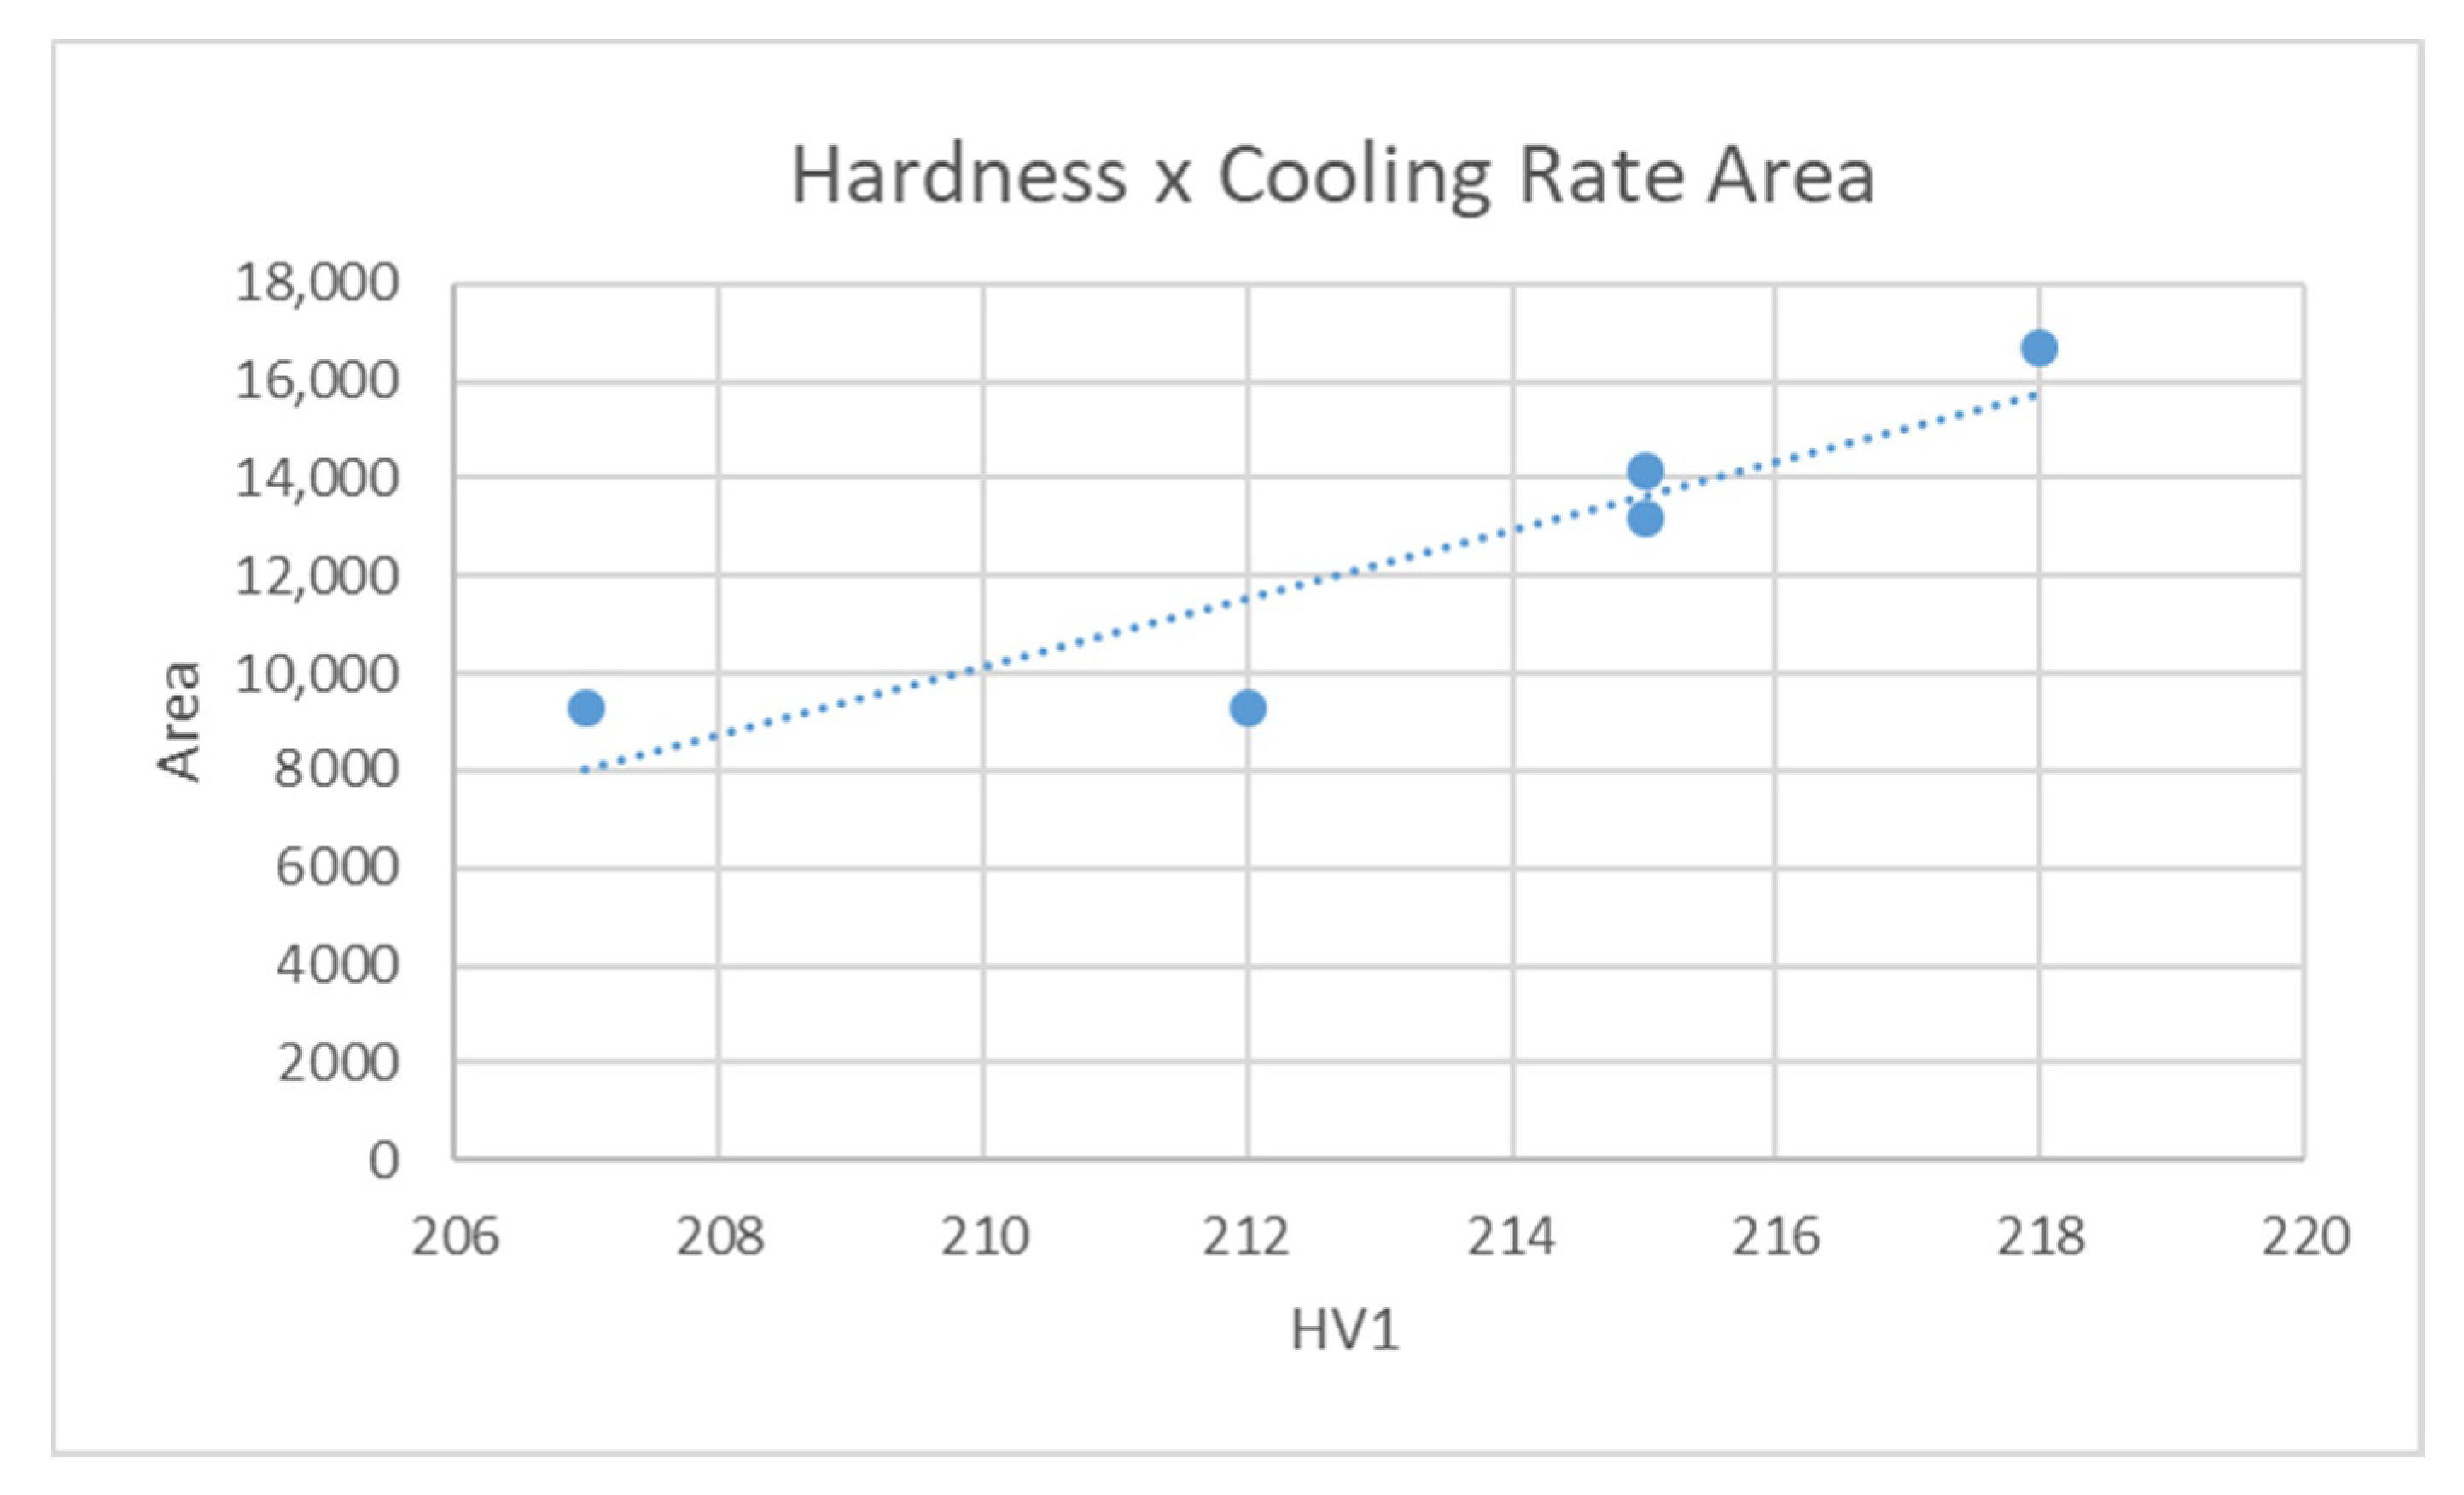
2.4. Assessment Based on the Area under the Cooling Curve Depending on Temperature
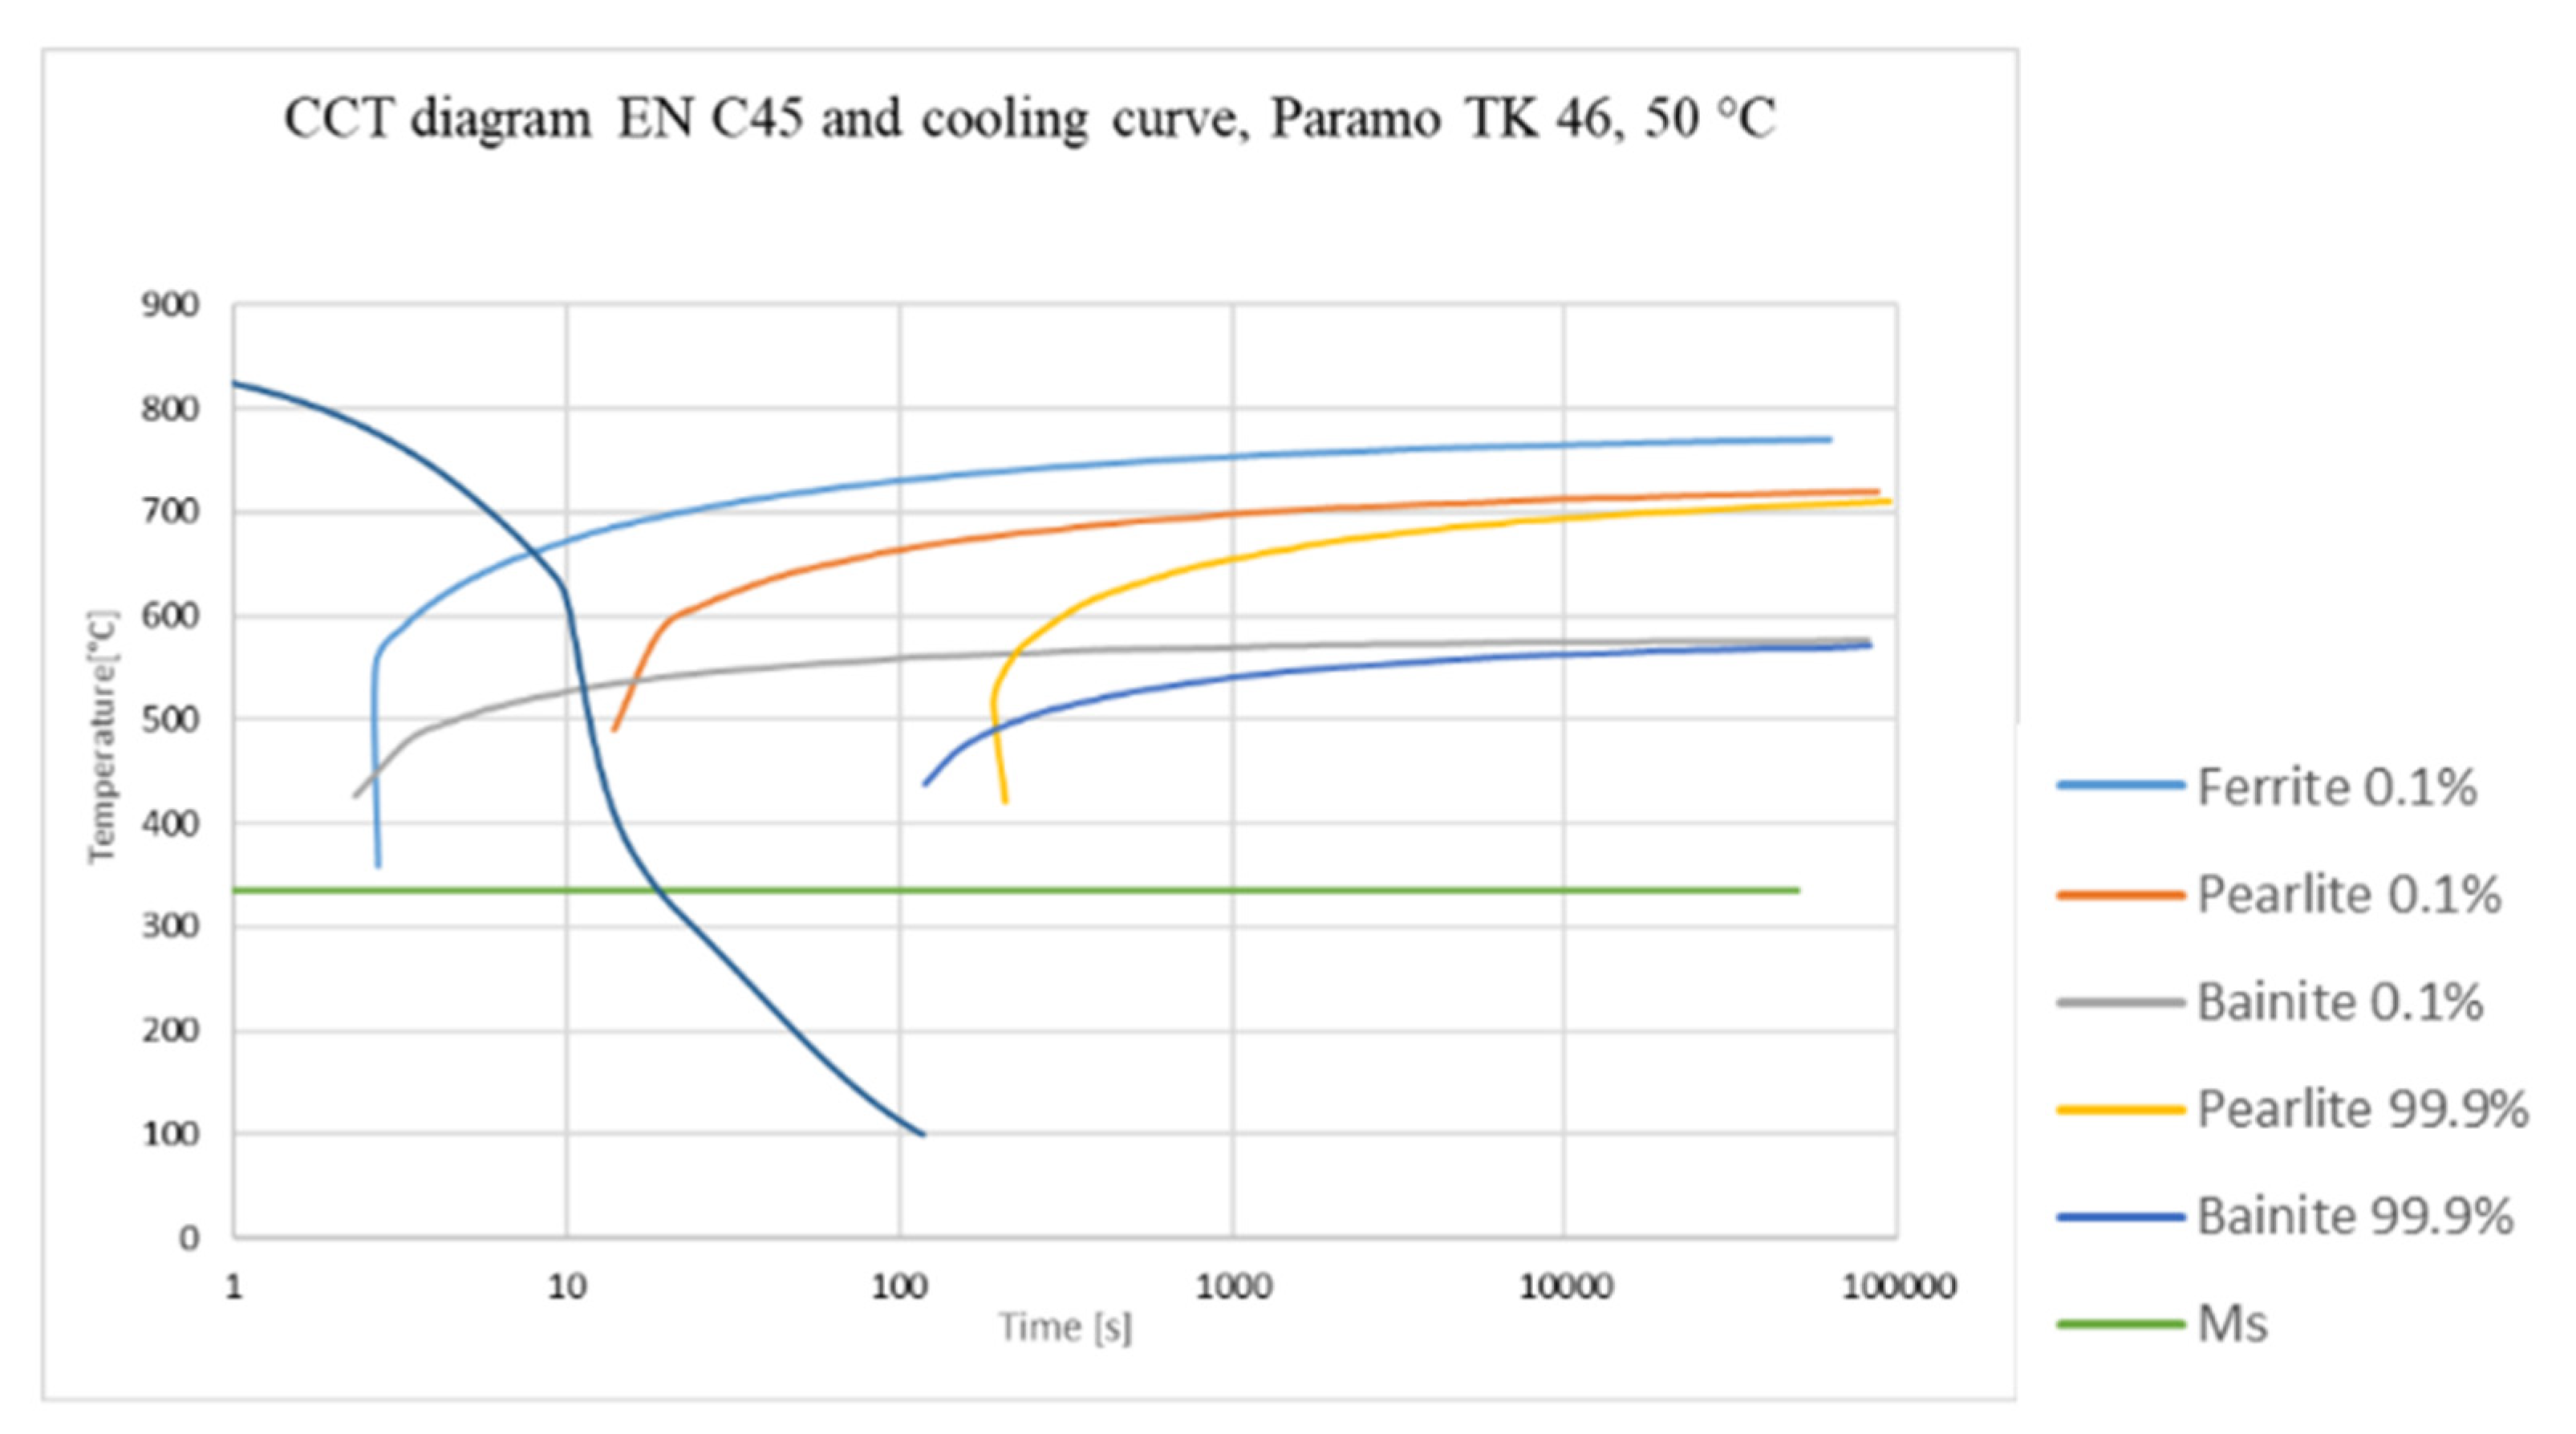
2.5. V-Value
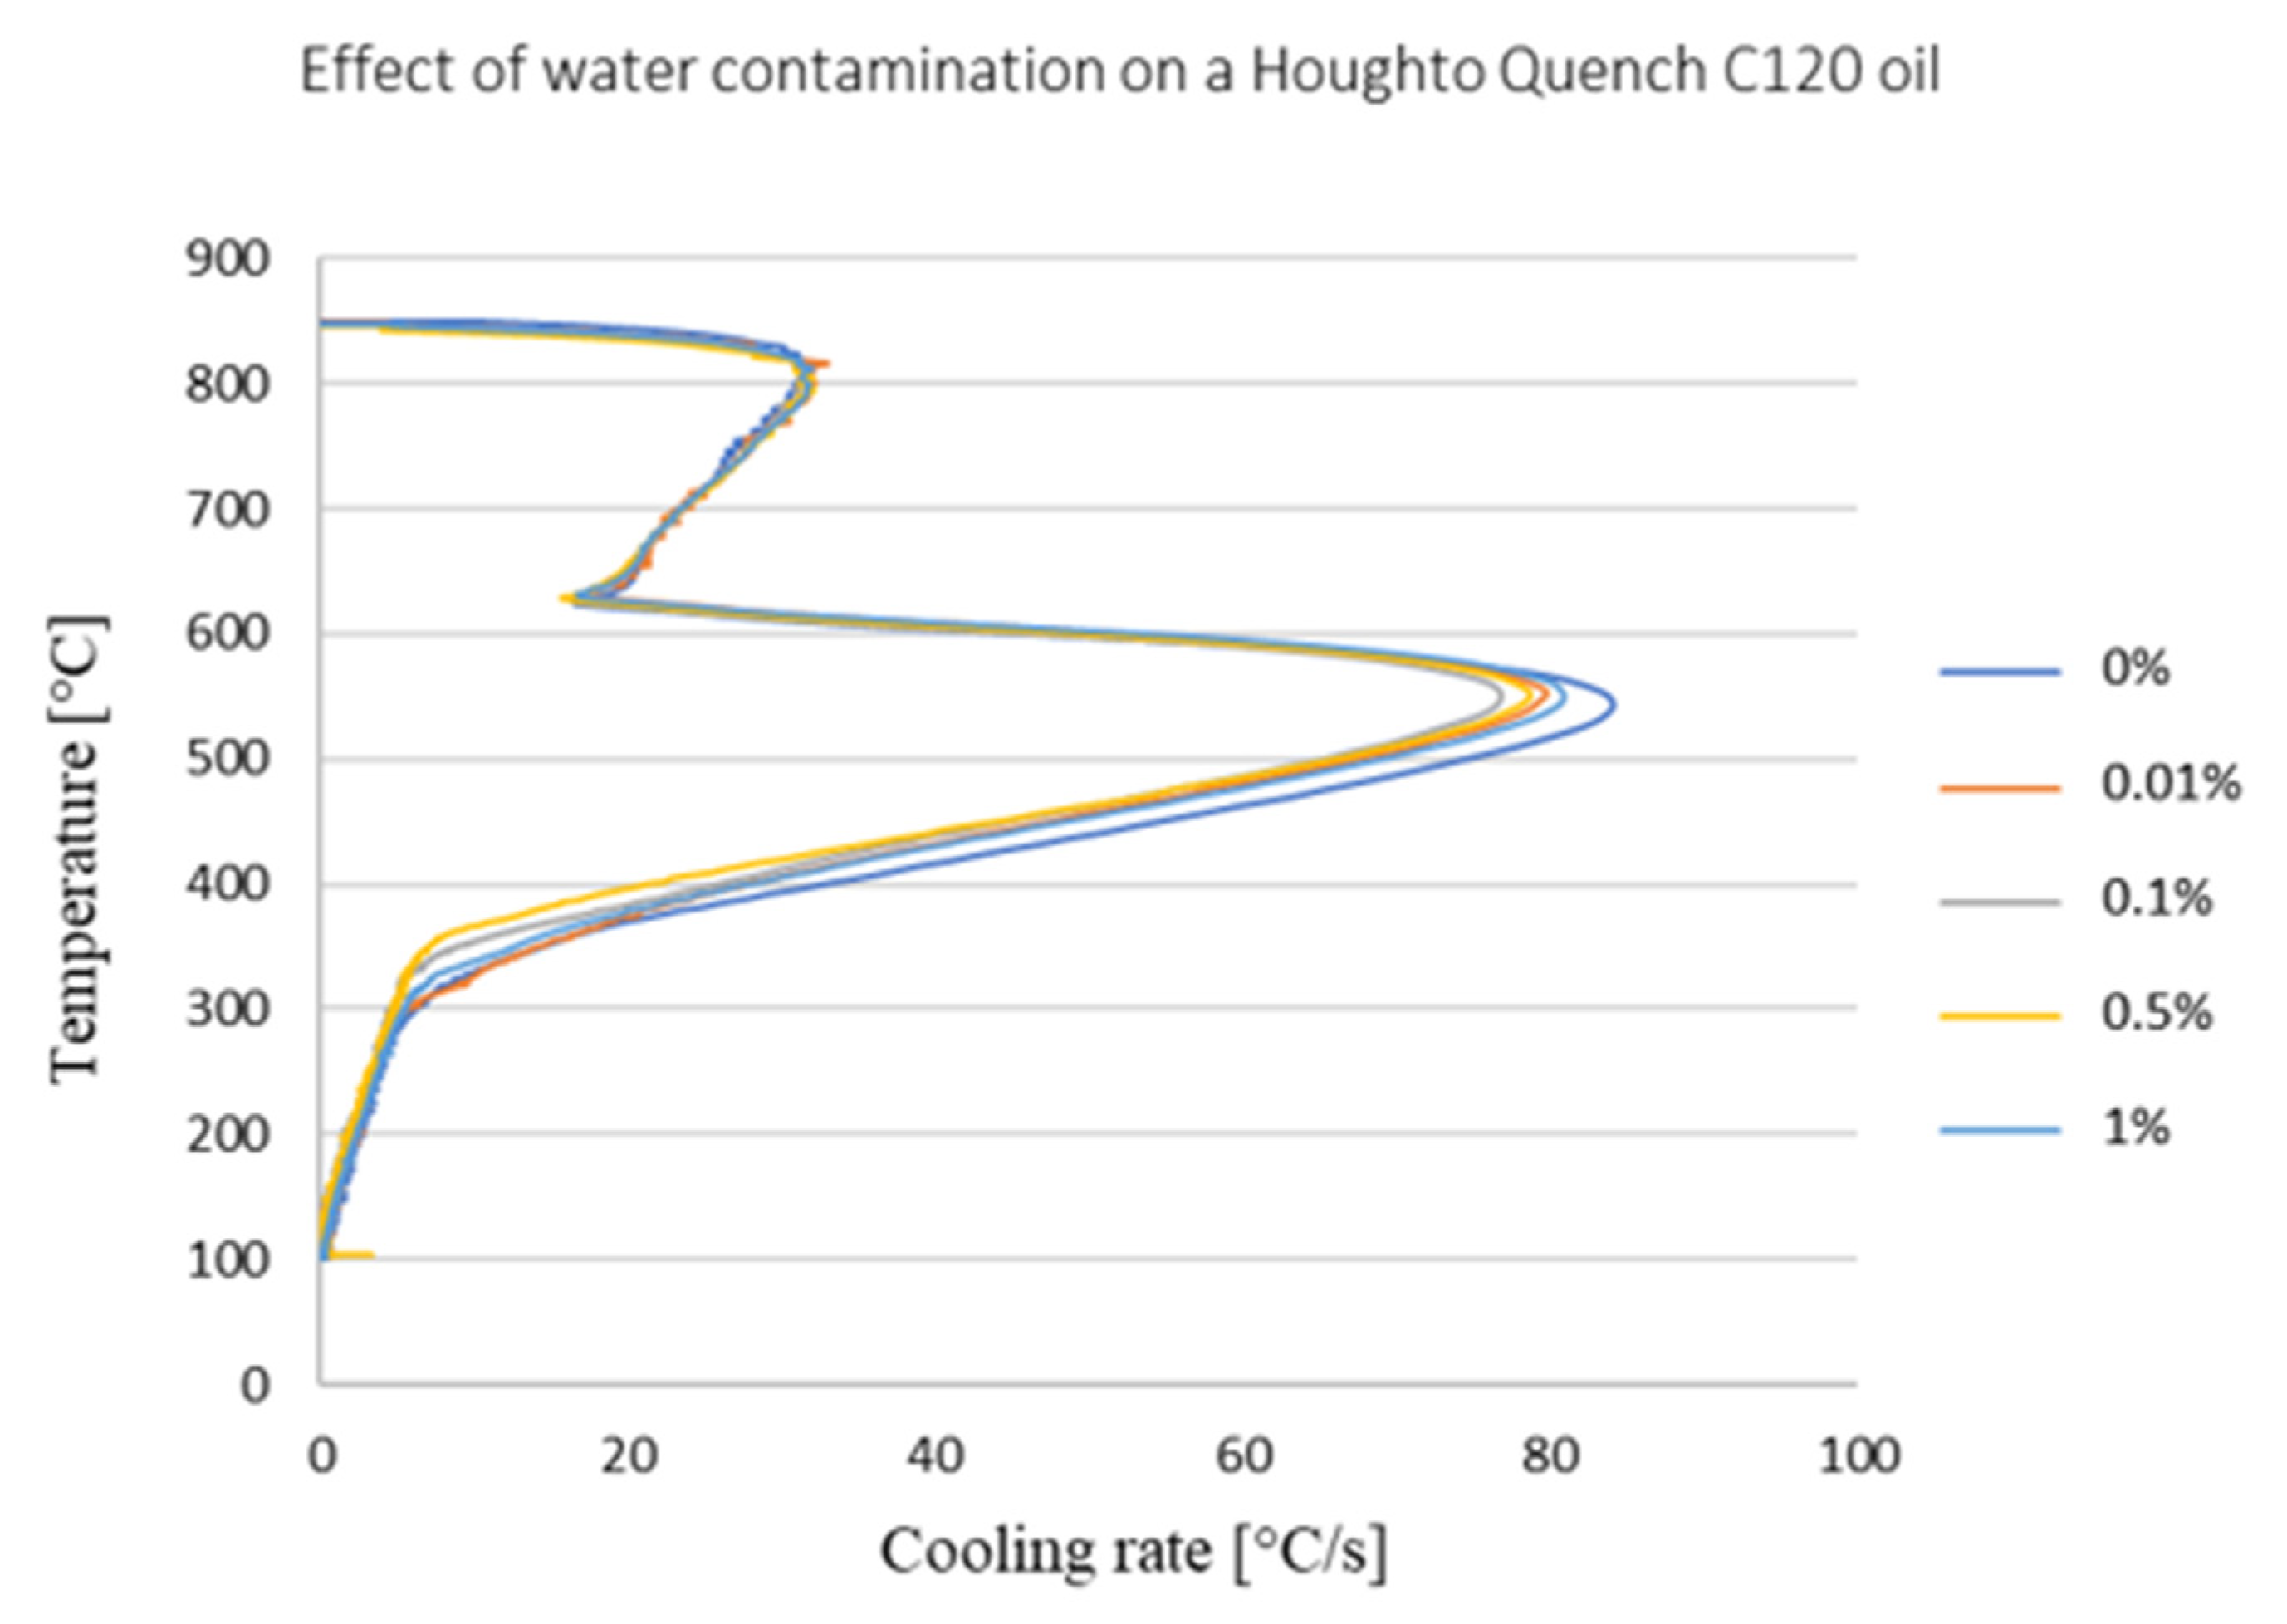
3. Effect of Water Content on Cooling Efficiency of Selected Oils
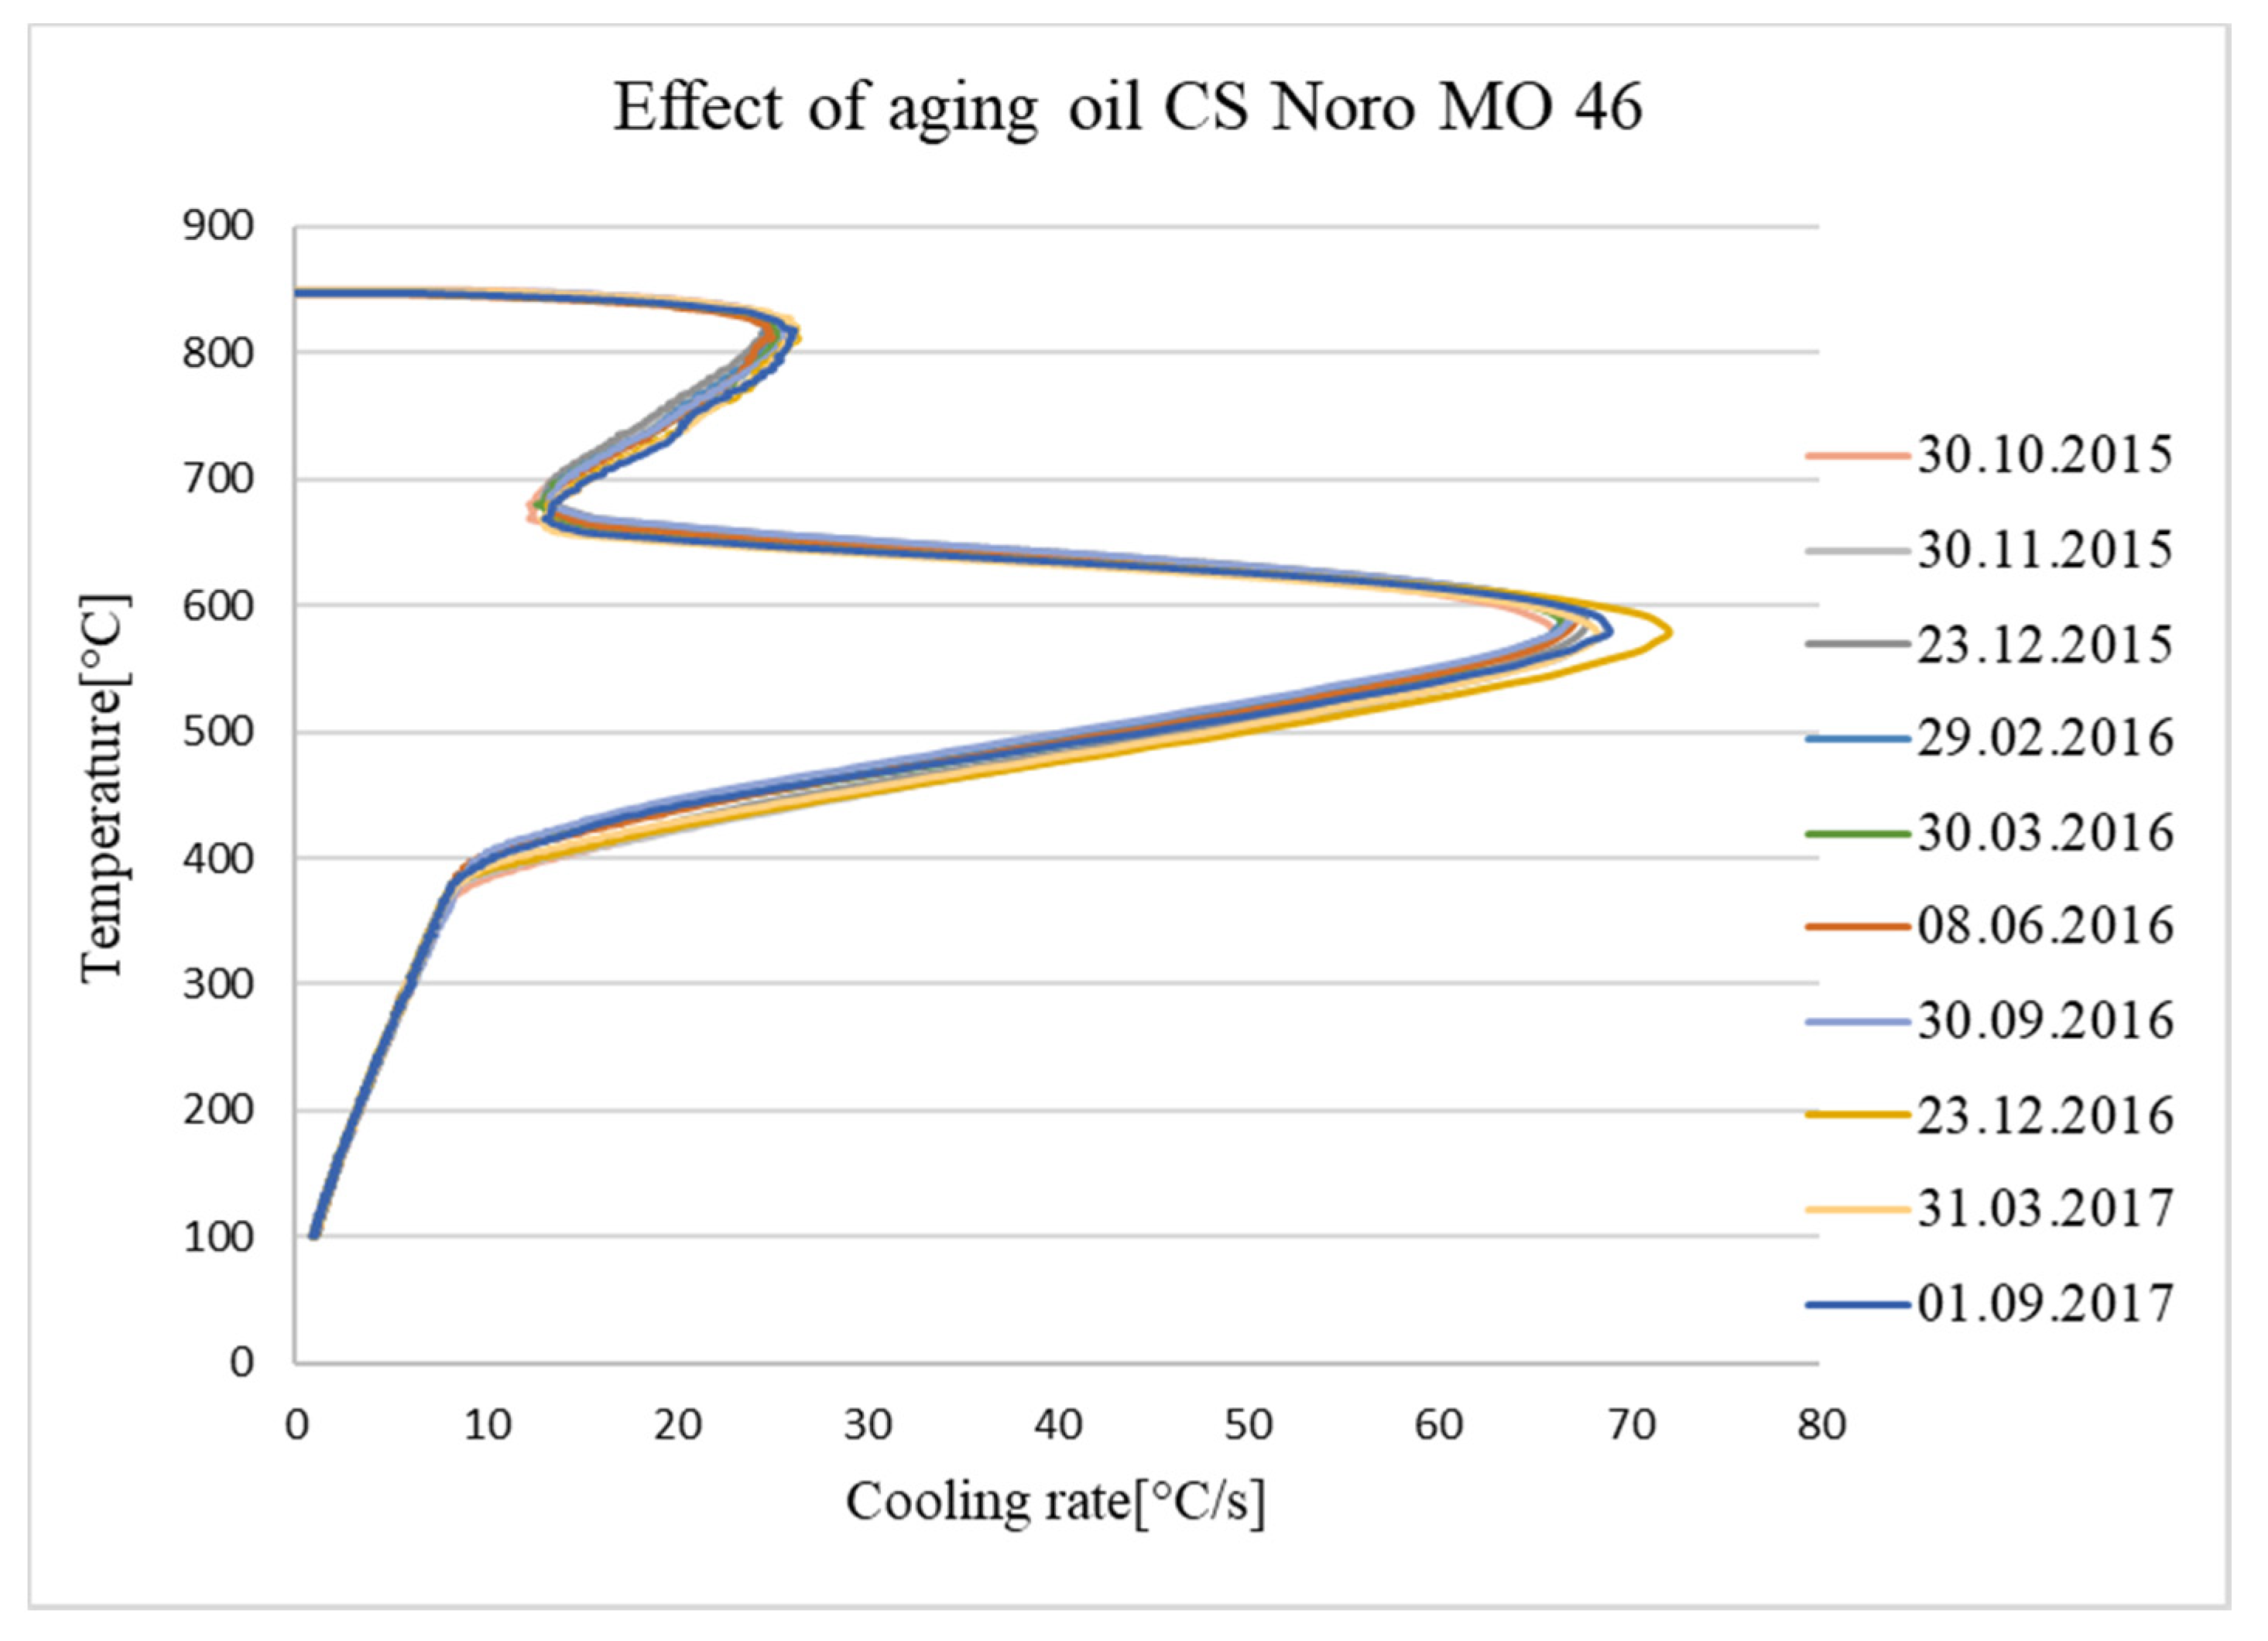
4. Monitoring Ageing Oil in a Hardening Shop
5. Measurement of Flash Point and Fire Point of Quenching Oils
6. Discussion
6.1. As-Quenched Hardness
6.2. Cooling Curves of Quenching Oils
6.3. Hardening Power
6.4. Area under the Cooling Curve
6.5. V-Value
7. Conclusions
- The most relevant criterion for the hardening power of an oil is the area under the cooling curve, which characterizes its ability to remove heat from a part. The criterion must be evaluated within a temperature interval governed by the type of steel. The area between 600 °C and 300 °C is the most versatile option that is appropriate for the majority of structural steels.
- The HP criterion is useful for comparing medium-speed and fast oils. HP is less sensitive to changes in quenching characteristics than the area under the curve.
- The V-value appears to be the least suitable for this purpose, mainly because it is complicated to evaluate. In addition, one must always tailor the experiment to the materials and products to be quenched.
- In our experiment, the main criterion was the core hardness of a steel cylinder from EN C35E. Specimens with a larger diameter and a steel with higher hardenability would be a better choice. The authors recommend a cylinder of 50 mm diameter from EN 42CrMo4 steel.
Author Contributions
Funding
Informed Consent Statement
Conflicts of Interest
References
- MacKenzie, D.S. Understanding the Cooling Curve Test. Thermal Proc. 2017, 6, 28–32. [Google Scholar]
- Ma, S.; Maniruzzaman, M.; Sisson, D.R. Characterization of the performance of mineral oil based quenchants using CHTE Quench Probe System. Master’s Thesis, Worcester Polytechnic Institute, Worcestesr, MA, USA, 2002. [Google Scholar]
- Xinmin, L.; Totten, G. Evolution from Cooling Modeling to Cooling Engineering of the Steel Quenching process: A Technology Overview. Mater. Perform. Charact. 2018, 8, 213–240. [Google Scholar]
- Thelning, K.E. Correlation of the Measured Quenching Intensity with Hardness Distribution in Quenched Parts, IFHT Task 4. In Proceedings of the 5th Congress on Heat Treatment of Materials, Budapest, Hungary, 20–24 October 1986; Scientific Society of Mechanical Engineers (GTE): Budapest, Hungary, 1986; pp. 96–105. [Google Scholar]
- Ksenofontov, A.; Shevchenko, S. Criteria for evaluating the cooling capacity of quenching media. Metal Sci. Heat Treat. 1998, 40, 408–411. [Google Scholar] [CrossRef]
- Tamura, I.; Shimizu, N.; Okada, T. A Method to judge quench hardening of steel from cooling curves of quenching oils. J. Heat Treat. 1984, 3, 335–343. [Google Scholar] [CrossRef]
- MacKenzie, D.S.; Graham, G.; Jankowski, J. Effect of Contamination on the Cooling Rate of Quench Oils. In Proceedings of the 6th International Quenching an Control of Distortion Conference, Chicago, IL, USA, 9–13 September 2012; pp. 239–245. [Google Scholar]
- Dlouhý, J.; Podaný, P.; Džugan, J. Influence of Martensite Deformation on Cu Precipitation Strenghening. Metals 2020, 10, 282. [Google Scholar] [CrossRef]
- Hernandez-Morales, B.; Brimacombe, J.K.; Hawbolt, E.B. Application of inverse techniques to determine heat- transfer coefficients in heat- treating operations. J. Mater. Eng. Perform. 1992, 1, 763–771. [Google Scholar] [CrossRef]
- Kobasko, N.I.; Marques, A.; Canale, L.C.F.; Totten, G.E.; Dobryvechir, V.V. Cooling Capacity of Petroleum Oil Quenchants as a Function of Bath Temperature. Mater. Perform. Charact. 2013, 2, 468–488. [Google Scholar] [CrossRef]
- Voort, G.F. Atlas of Time-Temperature Diagrams for Irons and Steels; ASM International: Cleveland, OH, USA, 1991; p. 14. [Google Scholar]
- Reddy, A.; Akers, D.; Chuzoy, L.; Pershing, M.; Woldow, R.A. Simple Method Evaluates Quenches. Heat Treat. Prog. 2001, 1, 40–42. [Google Scholar]
- Hajek, J.; Rot, D.; Jiřinec, J. Distortion in induction-hardened cyldrical part. Defect and Diffusion Forum 2019, 395, 30–40. [Google Scholar] [CrossRef]



| C | Mn | Si | P | S |
|---|---|---|---|---|
| 0.36 | 0.6 | 0.22 | 0.011 | 0.015 |
| Depth [mm] | Oil | ||||
|---|---|---|---|---|---|
| CS Noro MO 46 | Paramo TK 46 | Durixol W72 | Paramo TK 22 | Houghto Quench C120 | |
| HV1 Mean and Standard Deviation | |||||
| 1 | 219 ± 3 | 238 ± 3 | 223 ± 4 | 227 ± 2 | 228 ± 3 |
| 3 | 217 ± 3 | 228 ± 3 | 219 ± 4 | 222 ± 3 | 220 ± 3 |
| 5 | 215 ± 4 | 226 ± 4 | 219 ± 3 | 225 ± 3 | 215 ± 3 |
| 7 | 214 ± 3 | 226 ± 3 | 213 ± 2 | 217 ± 3 | 218 ± 3 |
| 10 | 207 ± 4 | 215 ± 3 | 212 ± 4 | 218 ± 2 | 215 ± 4 |
| Oil | CRmax [°C/s] | Temperature When Reaching CRmax [°C] |
|---|---|---|
| CS Noro Mo 46 | 73 | 603 |
| Durixol W72 | 104 | 681 |
| Paramo TK 22 | 104.5 | 636 |
| Paramo TK 46 | 74 | 574 |
| Houghto Quench C120 | 83 | 537 |
| Oil | Hardening Power |
|---|---|
| Houghto Quench C120 | 659 |
| CS Noro MO 46 | 229 |
| Durixol W72 | 260 |
| Paramo TK 22 | 866 |
| Paramo TK 46 | 515 |
| Oil | Steel | |||
|---|---|---|---|---|
| C45 | C80 | 100Cr6 | 25CrMo4 | |
| CS Noro MO 46 | 1 | 1 | 0.98 | 0.96 |
| Durixol W72 | 1 | 0.8 | 0.81 | 0.86 |
| Paramo TK 22 | 1 | 0.73 | 0.77 | 1 |
| Paramo TK 46 | 0.87 | 1 | 1 | 1 |
| Houghto Quench C120 | 0.68 | 0.74 | 1 | 1 |
| Oil | Flash Point [°C] |
|---|---|
| CS Noro MO 46 | 220 |
| Paramo TK 22 | 191 |
| Paramo TK 46 | 216 |
| Durixol W72 | 216 |
| Houghto Quench C120 | 196 |
Publisher’s Note: MDPI stays neutral with regard to jurisdictional claims in published maps and institutional affiliations. |
© 2021 by the authors. Licensee MDPI, Basel, Switzerland. This article is an open access article distributed under the terms and conditions of the Creative Commons Attribution (CC BY) license (http://creativecommons.org/licenses/by/4.0/).
Share and Cite
Hájek, J.; Dlouha, Z.; Průcha, V. Comparison of Industrial Quenching Oils. Metals 2021, 11, 250. https://doi.org/10.3390/met11020250
Hájek J, Dlouha Z, Průcha V. Comparison of Industrial Quenching Oils. Metals. 2021; 11(2):250. https://doi.org/10.3390/met11020250
Chicago/Turabian StyleHájek, Jiří, Zaneta Dlouha, and Vojtěch Průcha. 2021. "Comparison of Industrial Quenching Oils" Metals 11, no. 2: 250. https://doi.org/10.3390/met11020250
APA StyleHájek, J., Dlouha, Z., & Průcha, V. (2021). Comparison of Industrial Quenching Oils. Metals, 11(2), 250. https://doi.org/10.3390/met11020250


