Article

Effect of Tool Pin Geometry on the Microhardness and Surface Roughness of Friction Stir Processed Recycled AA 6063

SIG, Machine Design and Tribology, Centre for Advanced Mechanical and Green Technology, Faculty of Engineering and Technology, Multimedia University, Jalan Ayer Keroh Lama, Melaka 75450, Malaysia
*
Author to whom correspondence should be addressed.
Metals 2021, 11(11), 1695; https://doi.org/10.3390/met11111695
Submission received: 29 August 2021 / Revised: 26 September 2021 / Accepted: 14 October 2021 / Published: 25 October 2021

Abstract

:
Friction stir processing was experimented on recycled aluminum alloy 6063 to investigate the effects of varying friction stir tool pin geometry and friction stir processing parameters on the microhardness and surface roughness. Different tool pin geometry has great influence on the outcome as it alters the ability to provide localized heating and better material flow. This study was performed using two different types of tool pin geometry, namely, the cylindrical threaded and the taper threaded pins, across varying rotational speeds and feed rates. The mechanical properties of the processed workpiece were inspected and analyzed in terms of microhardness, microstructure, and surface roughness. The results show that the taper threaded tool offers the highest improvement in microhardness up to 63% at the lowest rotational speed and highest feed rate at 1150 rpm and 30 mm/min, respectively, and this is supported by microscopy images showing finer grains with the compact and homogenous distribution. The taper threaded tool also provided a better surface roughness than the cylindrical threaded tool. However, the surface produced by cylindrical threaded at 30 mm/min feed rates is as smooth and consistent as that of taper threaded tool.

1. Introduction

Recycling metal alloy scraps and chips into dense bulk products has become a common practice in manufacturing as it promotes conservation of natural resources, consumes significantly lesser energy to produce and results in a lesser carbon footprint [1,2]. Aluminum alloy 6xxx series has major alloying elements of magnesium and silicon [3]. It is recyclable and has low density, high strength to weight ratio, good corrosion resistance, and high thermal conductivity that make it suitable for structural applications in automotive and aerospace industry [4].
Aluminum alloy 6063 (AA 6063) is widely used in architectural applications such as window and door frames, bridge railings as well as transportation equipment, and like many other metals, it can be recycled repeatedly and efficiently with the advancement of solid-state recycling rather than conventional re-melting methods [2,5,6]. Some research conducted states that the mechanical properties and yield strength of solid-state recycled AA 6063 are nearly as good as the base material [7]. The medium strength and poor wear resistance of recycled AA 606X aluminum give limitations to its tribological applications [4,8]. Therefore, to encourage the usage of recycled aluminum alloys as well as to improve the viability of this material in engineering industry, further improvements are necessary. Such enhancement of AA 6063 in the strength and wear resistance can make it fit for use in modern architectural applications. For instance, space-saving sliding mechanisms and supporting frames present in modern furniture and cabinets are commonly fabricated using AA 6063 due to their lightweight material with a smooth and aesthetically pleasing surface finish. However, higher strength and wear resistance are required to withstand the repeated fatigue loading due to the sliding motion. This will minimize wear damage and prolong life span of the sliding surface in contact.
Friction stir processing (FSP) is a developing technology derived from friction stir welding (FSW) [9]. It is a solid-state process of altering the mechanical and metallurgical properties of a metal through plastic deformation whereby it adopts the basic principles of FSW [9,10]. A non-consumable rotating tool is inserted in a monolithic metal workpiece and it is revolved in a stirring motion as it is pushed laterally through the workpiece [9]. The material undergoes severe plastic deformation leading to localized microstructural modification and specific property enhancement [11]. FSP results in a metal product of refined microstructure with increased microhardness and improved wear resistance without the defects of porosities and thermal cracks [9].
FSP manufactured products can be optimized to achieve a desired metal property specification and the quality is highly dependent on how well the FSP parameters and tool geometry are optimized to a selected material [12]. Main FSP process parameters that play a significant role in the outcome of FSP products are the rotational speed of tool (rpm), tool transverse speed (mm/min), depth of tool penetration into a material (mm), and angle of tool inclination [10]. In terms of tool geometry, recent research shows multiple methods of optimizing effective FSP tool geometry to produce a specific metal property [13]. An FSP tool has three main functions of providing localized heating through friction between tool and material to soften the material and allow plastic deformation, altering the material flow during the process before remolding as well as heat containment of hot metal beneath the FSP tool [14].
The tool geometry usually being optimized can be classified into two main features namely the shoulder surface and the pin profile [15,16]. The pin profile is responsible to provide plastic deformation of the material at the stir zones (SZ) and also thermo-mechanical affected zones (TMAZ) [17]. There are many pin profiles that have been used in previous FSP works such as cylindrical profiles [18] and polygonal profiles [15,19]. Polygonal pin profiles include triangle [10,20,21], square [10,15,20,21], and pentagon pin profiles. Other features include threaded [10,16,18,20], conical and tapered faces [10,18,20], and tri-flutes [11,22]. On the other hand, the shoulder surface encloses heat in the stir zone and provides friction to the top surface. Variety of shoulder patterns includes spiral grooves, concentric cylinders, and concave shoulders [11,14,22]. The findings are rather inconsistent and there is no clear conclusion on tool pin geometry or profile that offers the best quality of friction stir processing despite the extensive research on FSP tool pin geometries. The majority of the research concludes that the tapered threaded design offers the best results [16] while others also claim that triangular and square pin profiles result in the least defects in FSP [23,24]. Therefore, the current work is aimed to investigate the effects of FSP tool geometry on the microstructure and surface roughness of AA 6063. The enhancement of microhardness and wear resistance upon FSP can be determined through the study of the microstructure of the material. A test on surface roughness of the raw FSP surface determines the smoothness of the surface for sliding applications and the need for post-processing for improved productivity in manufacturing. Based on the two selected FSP tool geometry, the study is also performed with varying FSP parameters, namely, tool rotational speed (rpm) and feed rate (mm/min) for a more comprehensive analysis.

2. Materials and Methods

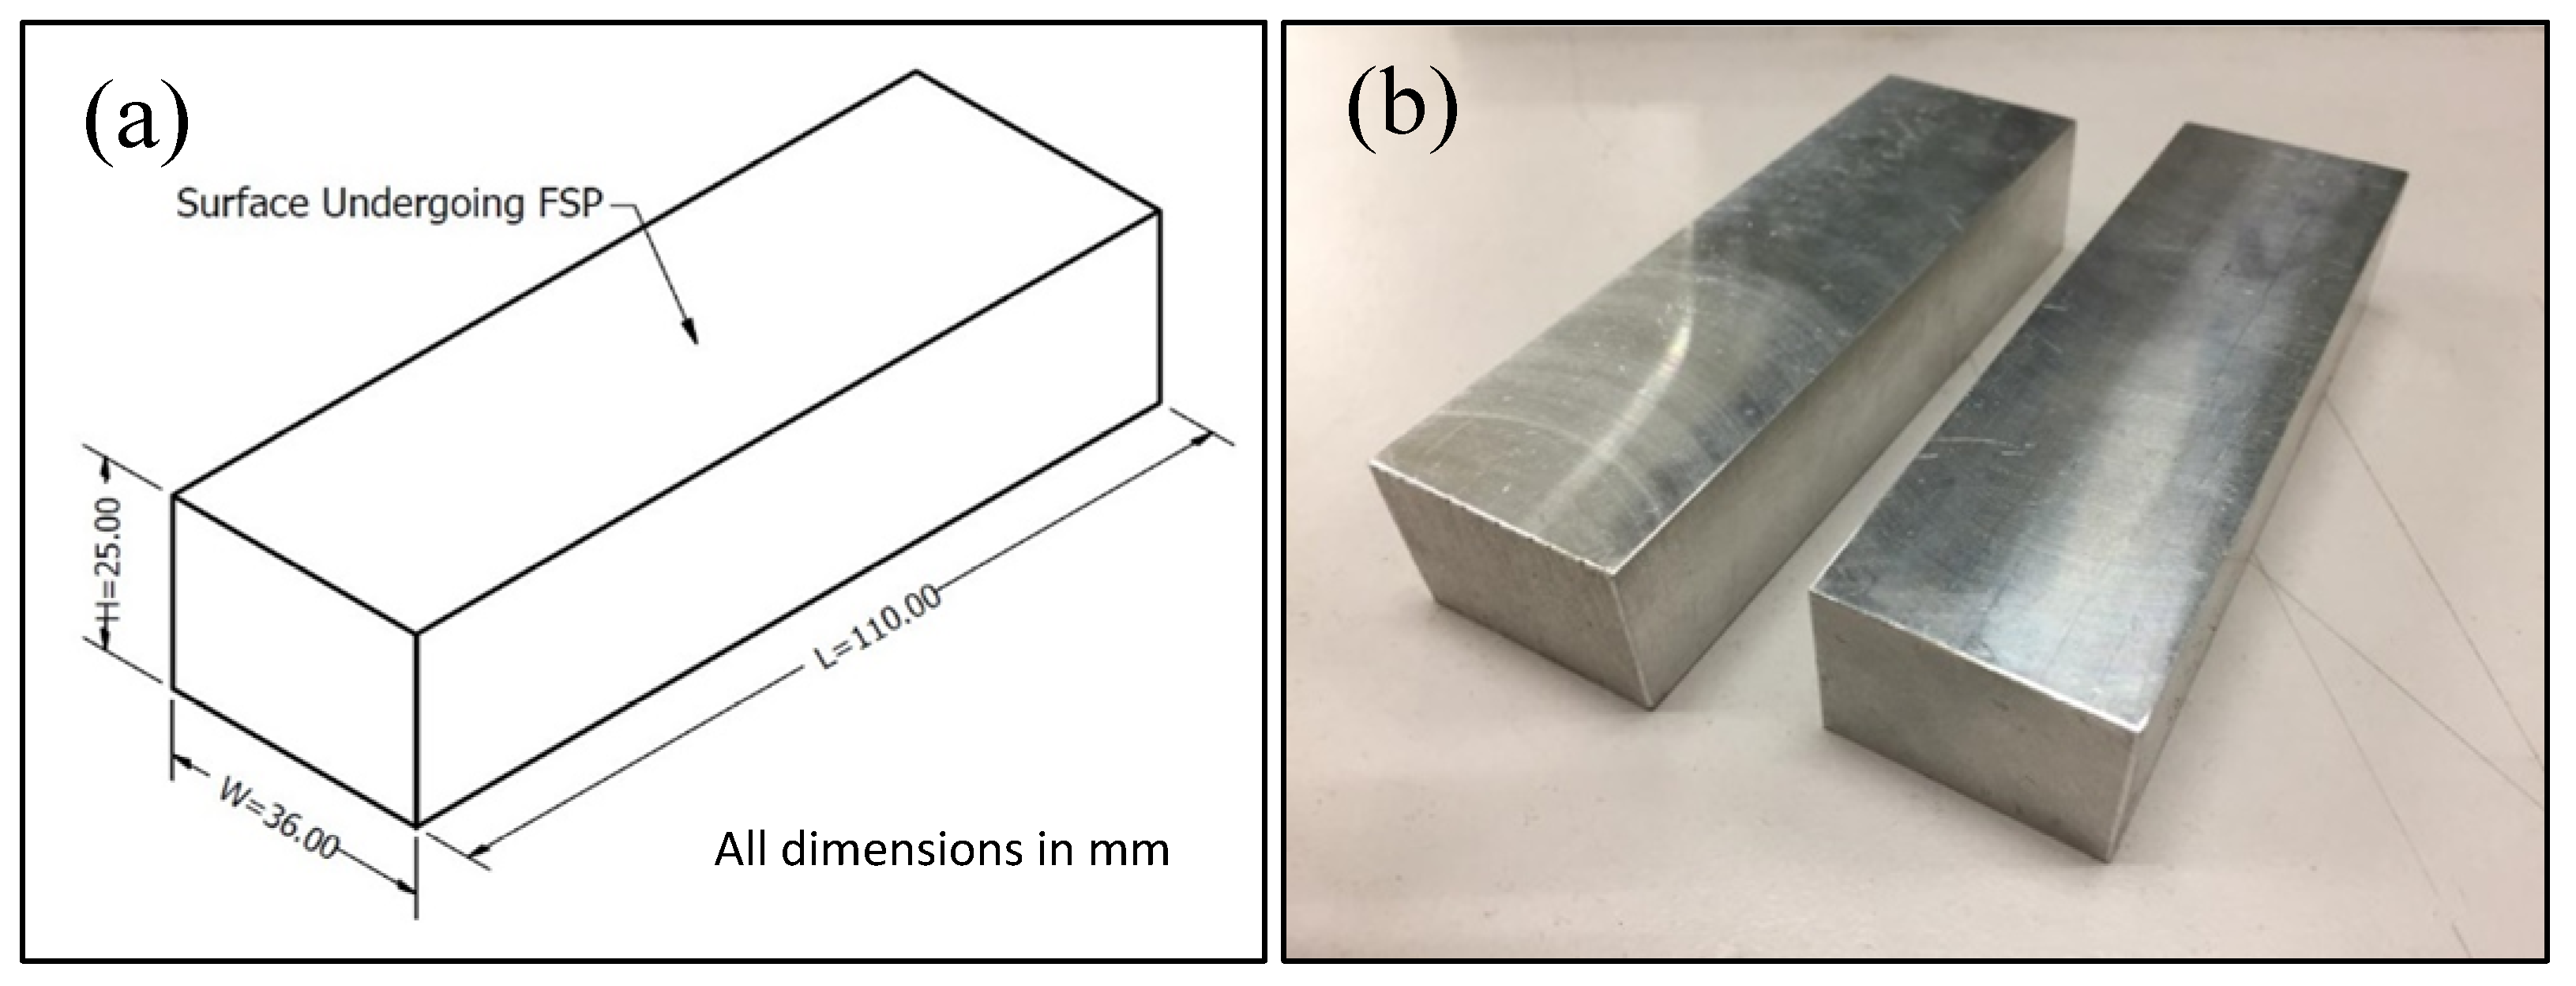
2.1. Substrate Material

Recycled AA 6063 was used as the substrate in this study and its chemical composition is shown in Table 1. The substrates used had dimensions of 110 mm × 36 mm × 25 mm (L × W × H) as shown in Figure 1.

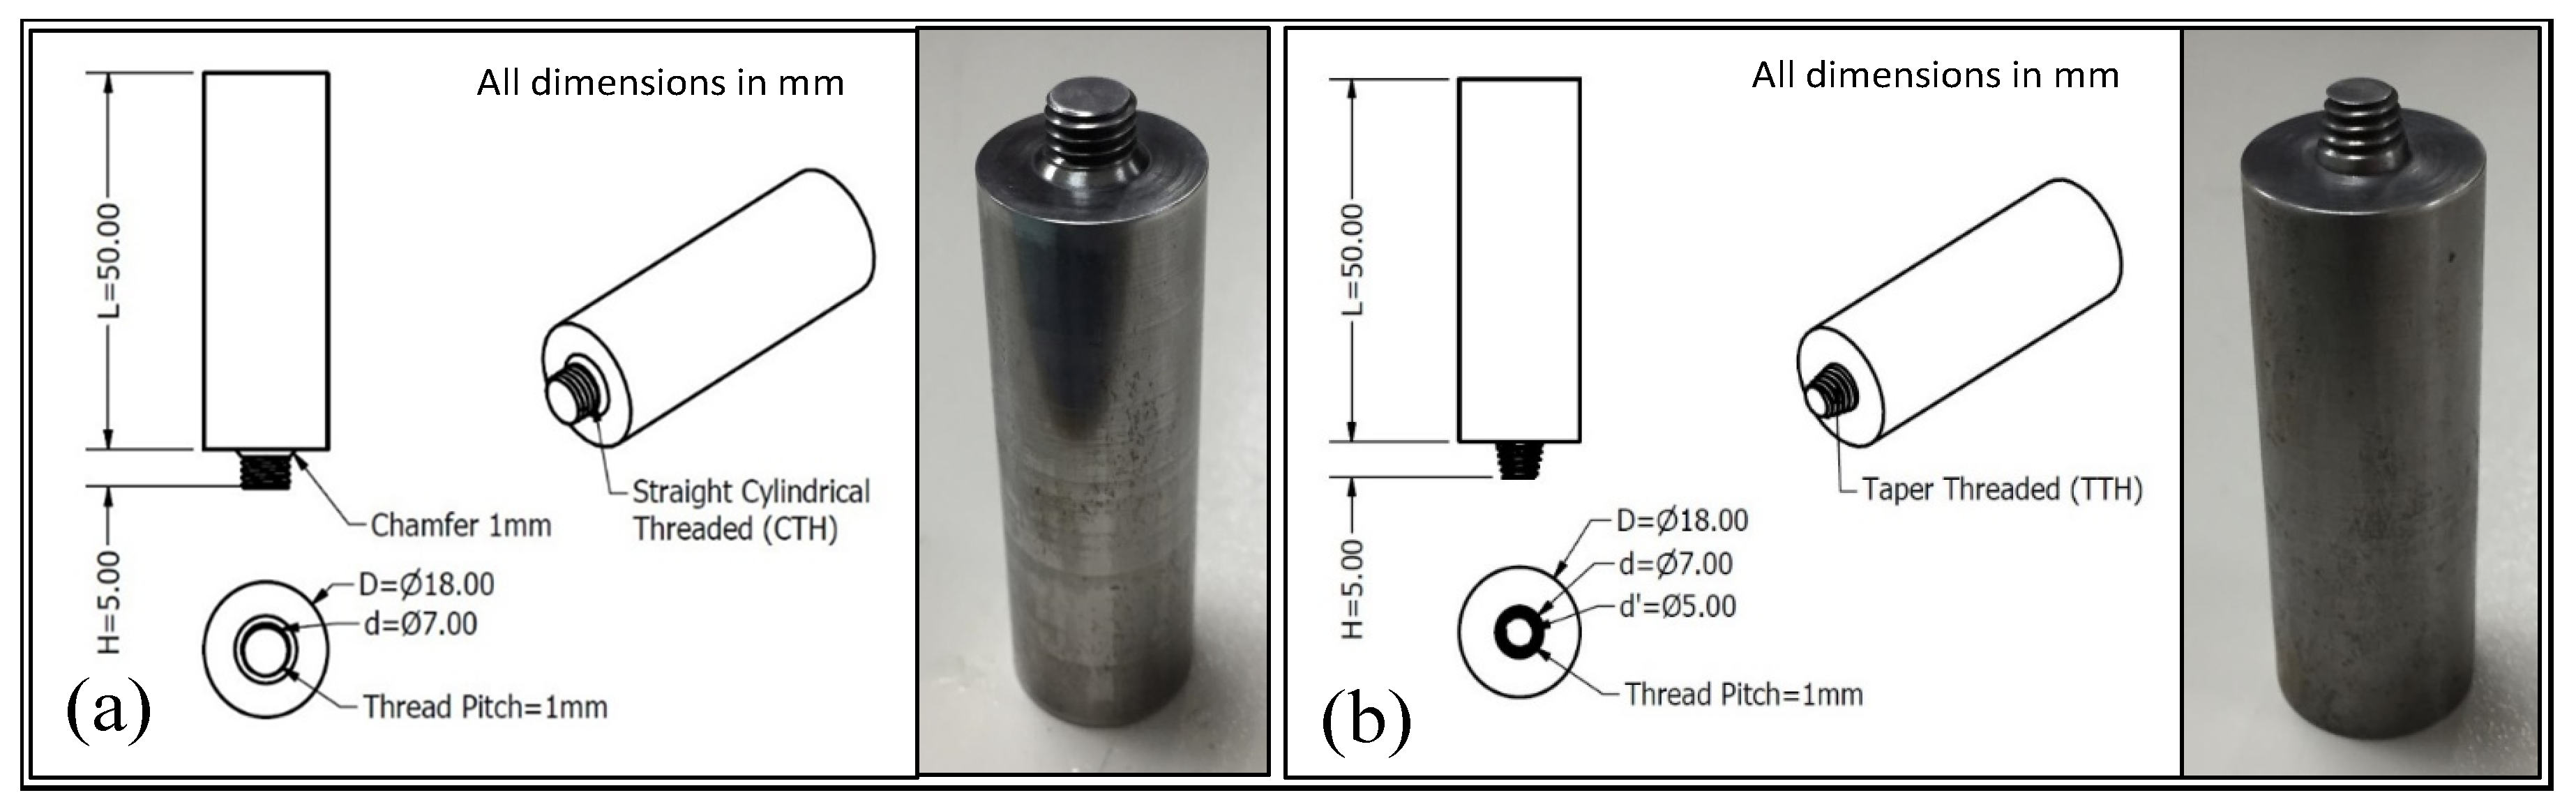
2.2. FSP Tool Design and Set-Up

The tool pin geometry designs that were selected for this work are Straight Cylindrical Threaded (CTH) and Tapered Threaded (TTH). Figure 2 illustrates the CAD drawing with full dimensions and actual images of the FSP tools. For both FSP tools, the shoulder diameter, D, and pin diameter, d, are set at 18 mm and 7 mm, respectively, to maintain the D/d ratio to 2.57. For the TTH tool, the tapered pin end diameter, d’, is 5 mm. The threaded pitch for both CTH and TTH is set at 1 mm. The pin height and tool shoulder length are maintained at a constant of 5 mm and 50 mm, respectively, for both FSP tools. The FSP tools are fabricated using ASP23 high speed steel (HSS) cutting tool material with the Rockwell Hardness of 60 HRC.
This work was conducted using the CNC Milling Machine (Mazak, Japan). The selected FSP tool rotational speeds were 1150 rpm, 1200 rpm, and 1250 rpm while the feed rates tested were 10 mm/min, 20 mm/min, and 30 mm/min. A lower feed rate may produce a better surface roughness. Higher rotational speed will lead to higher temperature which will result in grain growth and thermal softening of the selected substrate material [25,26]. Hence, the low feed rates and relatively low rotational speeds were selected for the current work. The plunge depth of the FSP tool shoulder is maintained at 0.5 mm. Two specimens were produced for each combination of parameters mentioned (combination of spindle speed and feed rate) and they were labelled as the set A and set B, whose use will be described. Figure 3 shows the actual FSP of recycled AA 6063.

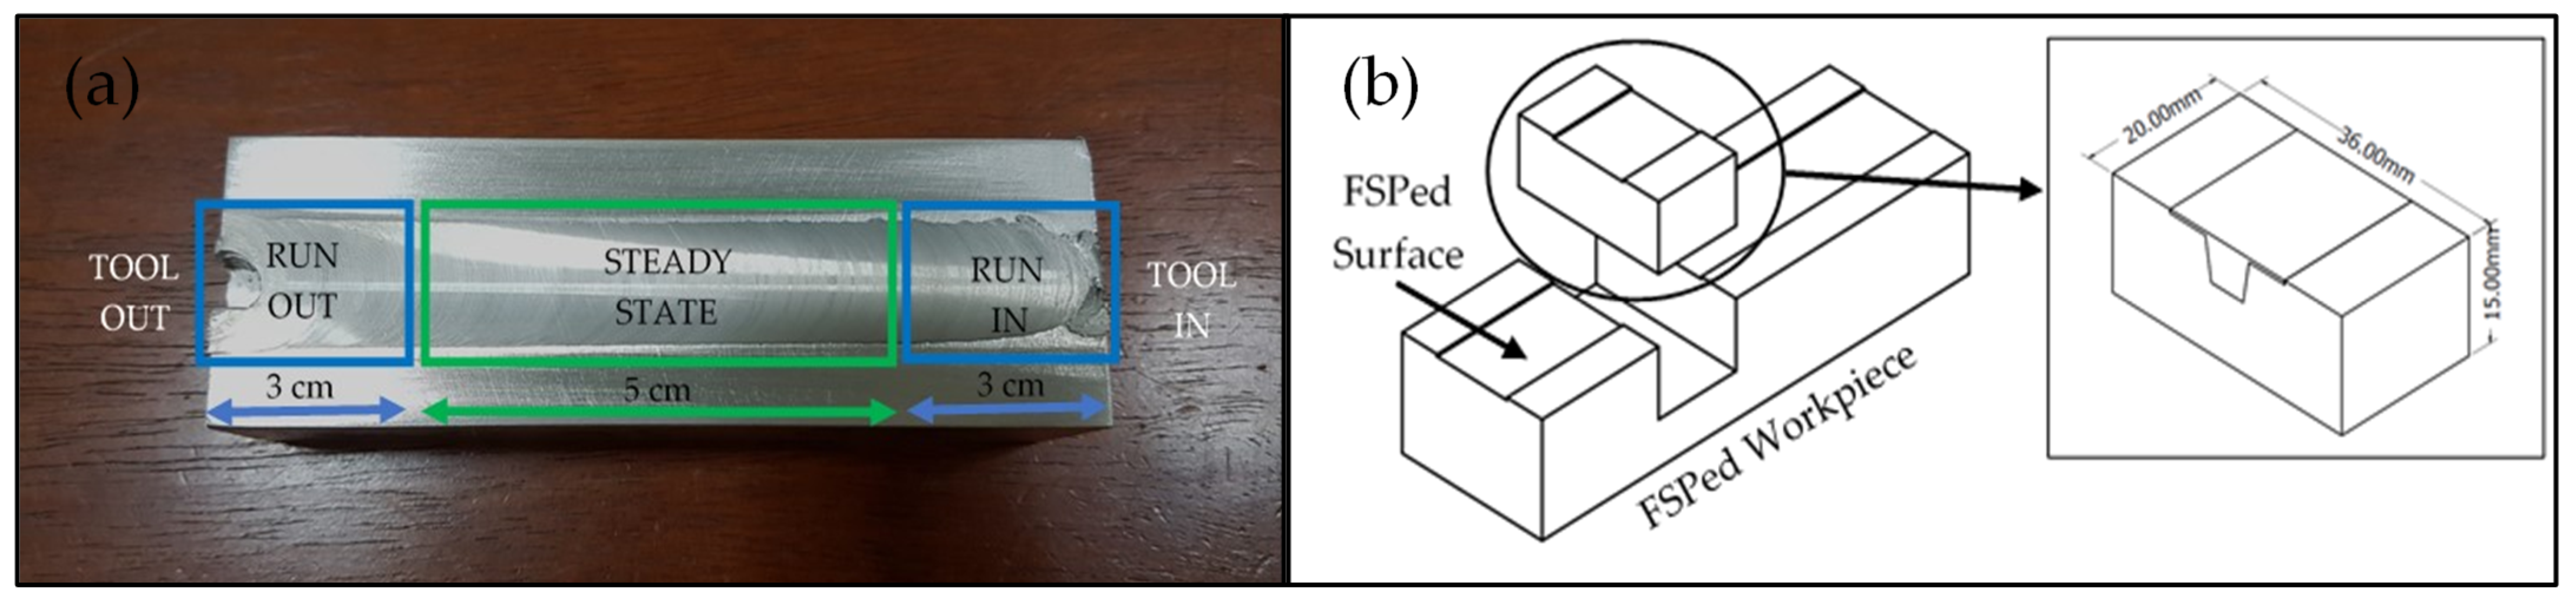
2.3. FSPed Samples Preparation

Two test samples were cut out from the steady-state region of each specimen (labelled set A and set B) as highlighted in Figure 4a. One sample from each set A and set B were used for surface roughness measurement. Regardless of labels, one test sample was used for microhardness test, and the remaining for microstructure examination. The steady-state region is closed to zero defects, after having achieved sufficient temperature build-up during FSP, thus producing a more consistent outcome. The samples have dimensions of 20 mm × 36 mm × 15 mm (L × W × H) as shown in Figure 4b.

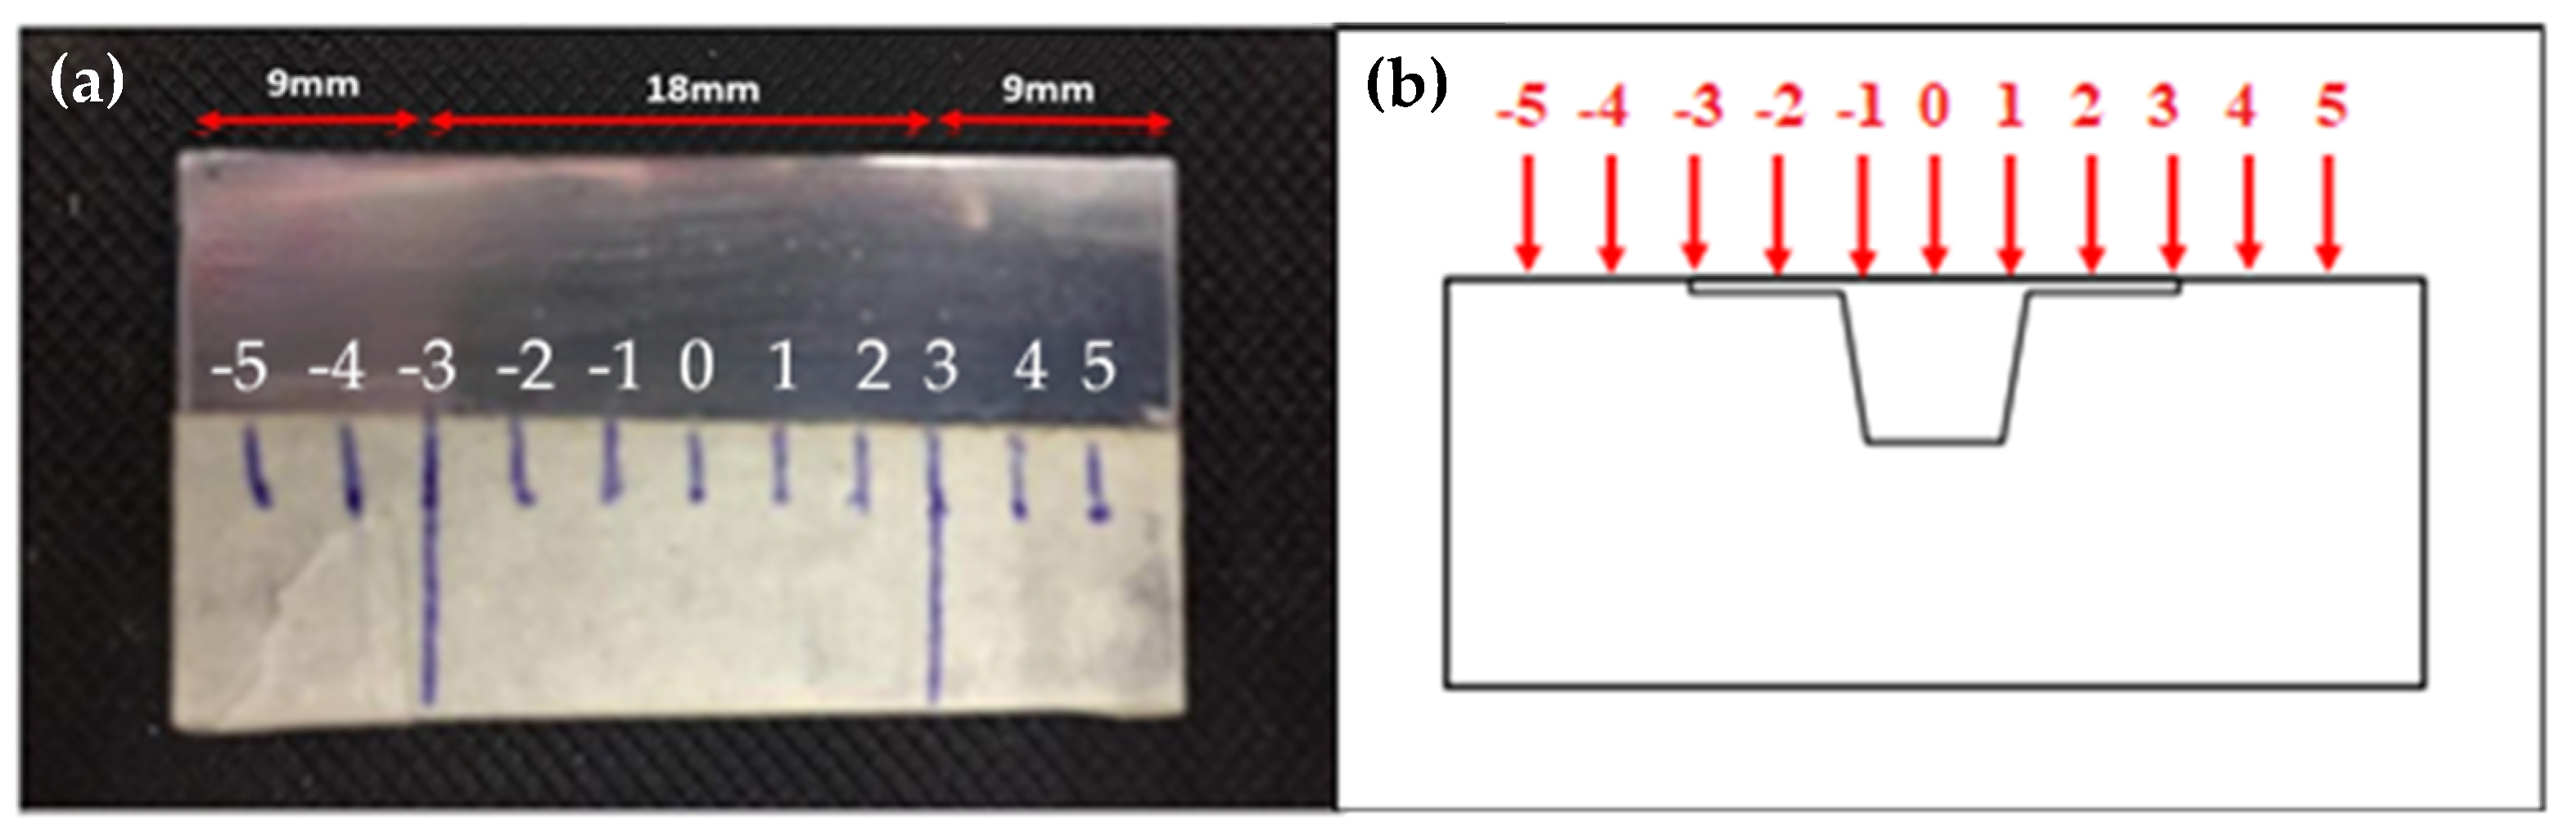
2.4. Microhardness and Microstructure Analysis

The Vickers Hardness Tester 430-SVD (Wolpert, Germany) was used for the microhardness measurement. The samples were properly ground and polished prior to microhardness test. Eleven indentations are taken in a straight line along the width of the stir zone at the top FSPed surface and the location of each indentation taken is labelled as shown in Figure 5. The microhardness was measured with a load of 1 kgf and dwell time of 10 s. The microstructure of FSPed samples were inspected using the high-power metallurgical microscope (Meiji, Japan). All the polished samples were etched using Keller’s Reagent before microstructure observation.

2.5. Surface Roughness Measurement

The MarSurf M400 Mobile Surface Measuring Instrument surface profilometer (Mahr, Germany) was used for the surface roughness measurement. The surface roughness is measured on the steady-state region with a cut-off length of 5 mm. For each sample, a total of eight surface roughness measurements of the FSPed surface are taken along different paths, which is parallel to the length with equally spaced from right to left with an interval of 2.25 mm (labelled as location number 1 to 8 of FSPed surface).

3. Results and Discussion

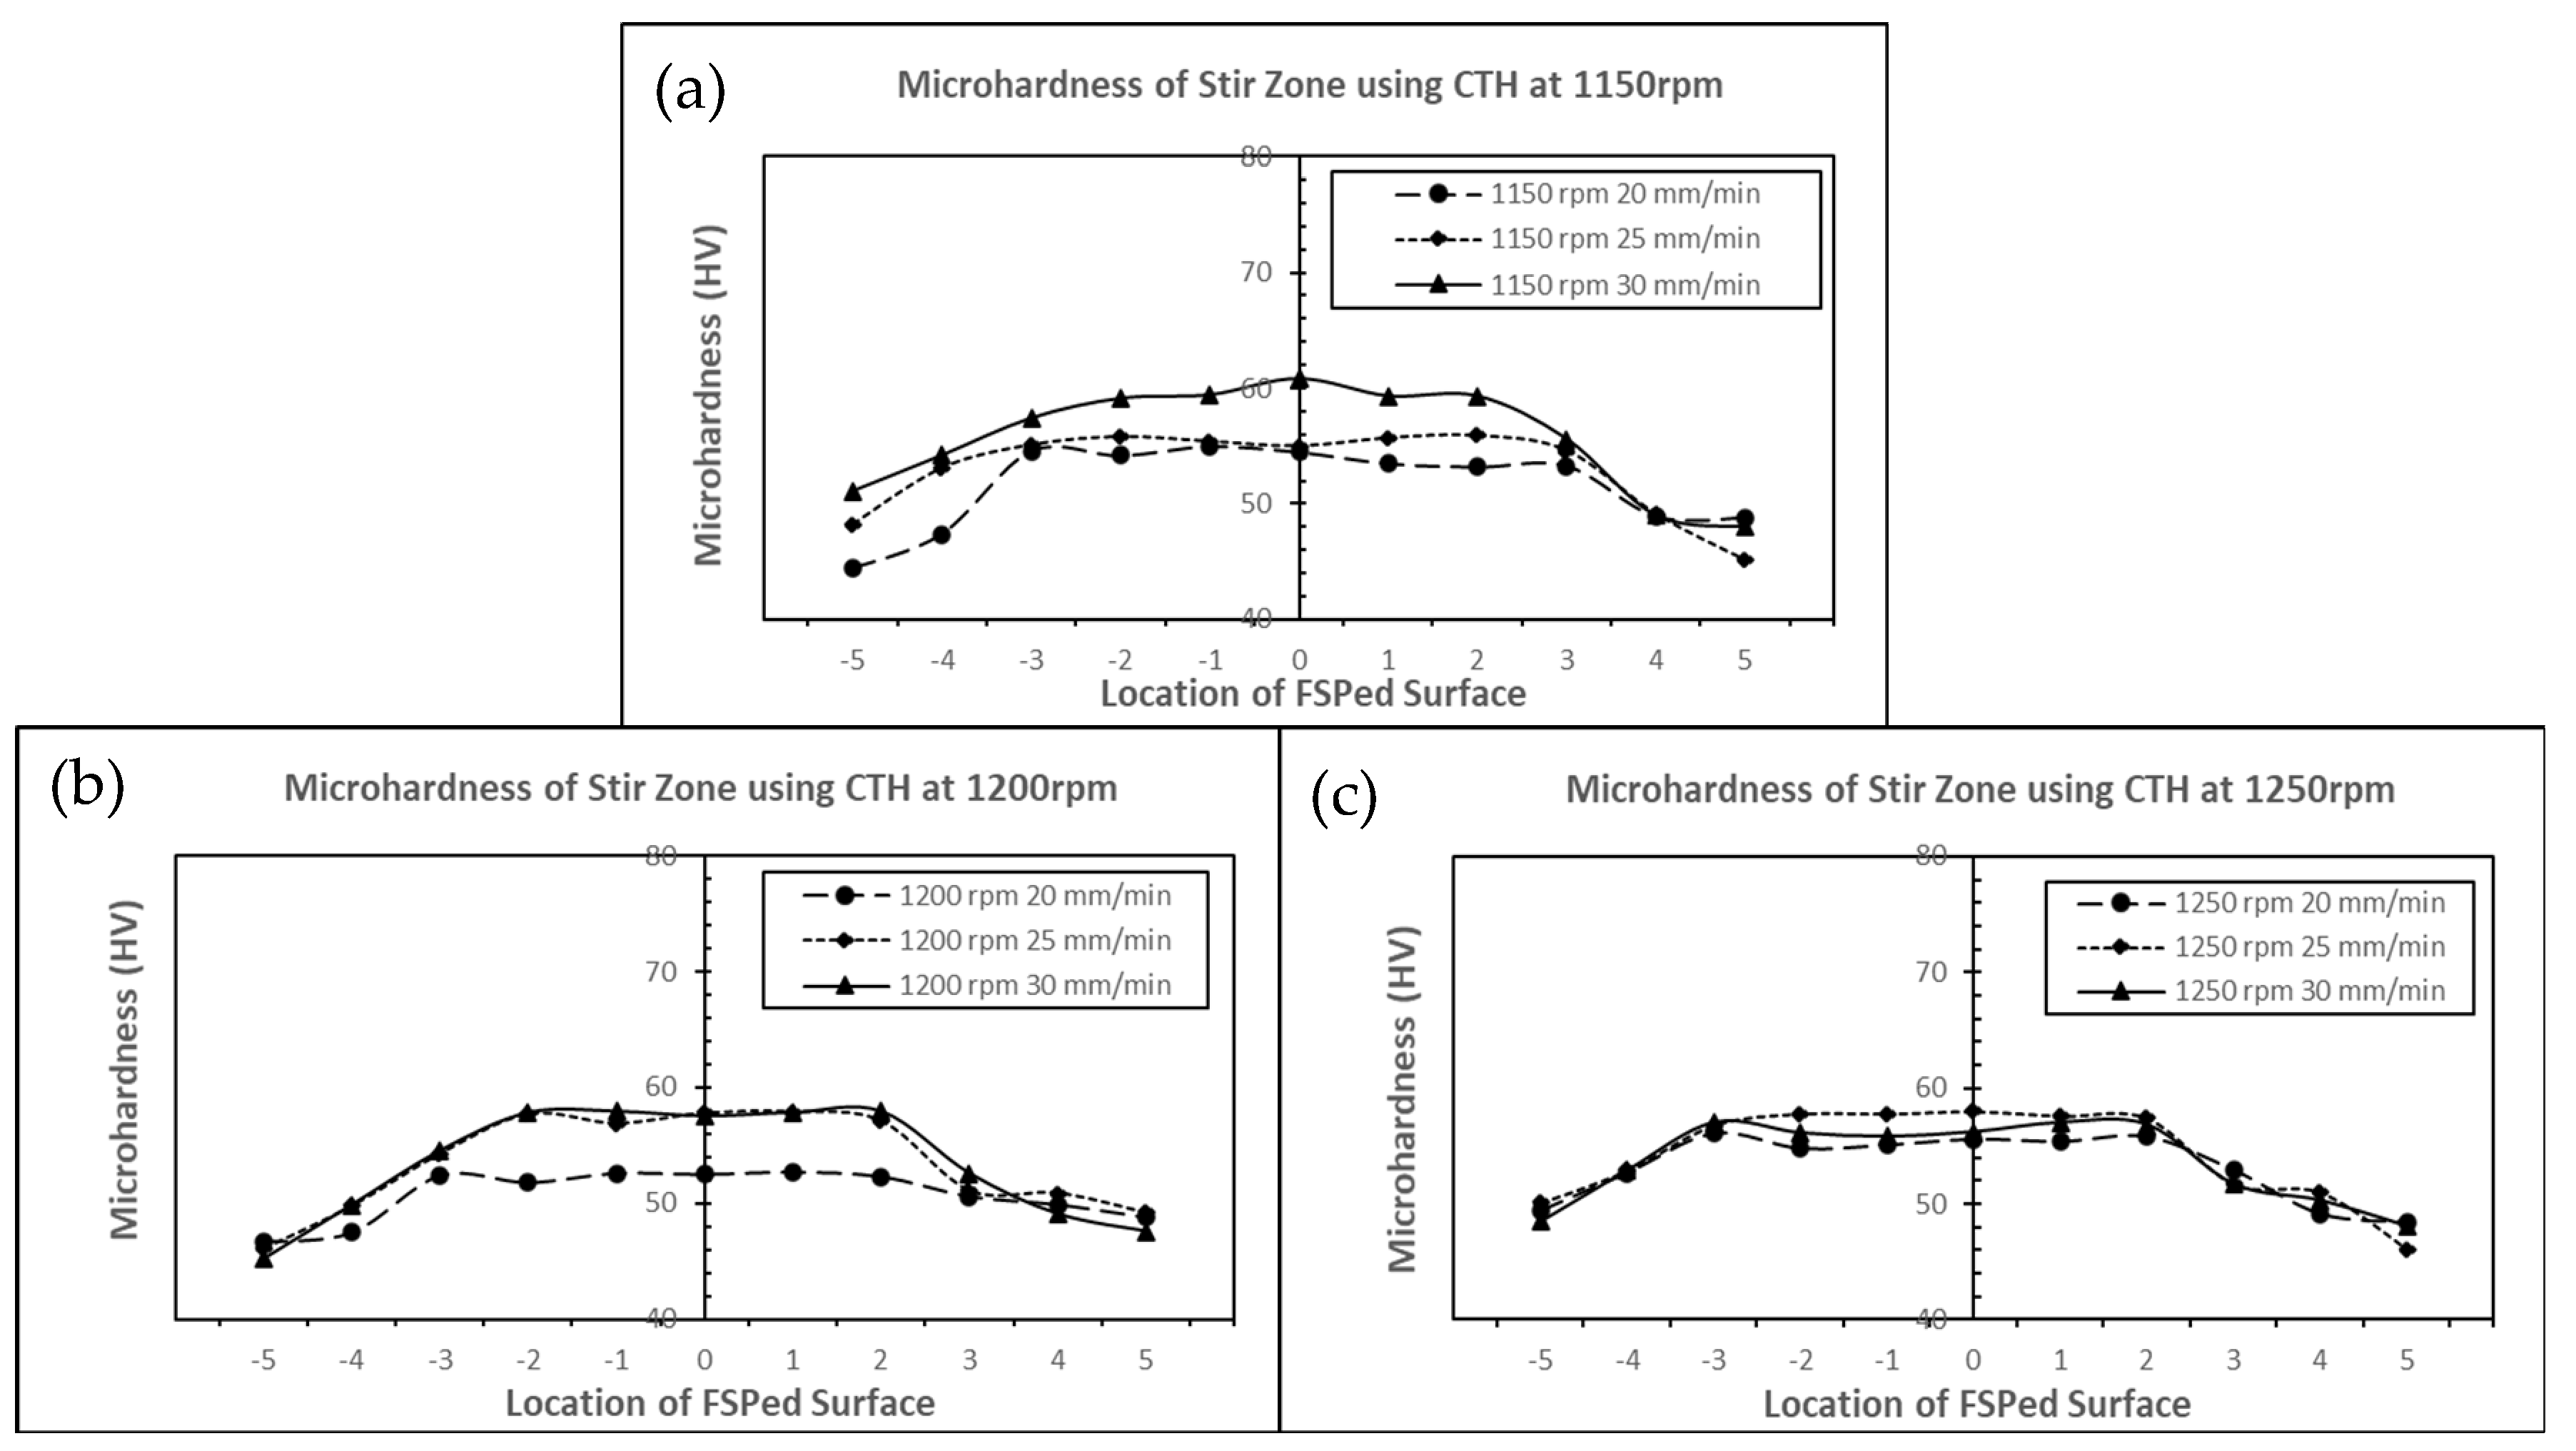
3.1. Microhardness Test

The unprocessed substrate of recycled AA 6063 has an average microhardness of 37.8 HV1. Figure 6 presents a bar chart showing the relationship between the average microhardness of the stir zones using both TTH and CTH tools produced by different rotational speeds (rpm) and feed rates (mm/min).
The sample produced at 1150 rpm and 30 mm/min yielded the maximum average microhardness of 62.1 HV1 and 59.6 HV1, for both TTH and CTH FSP tools, respectively. All FSPed samples regardless of the tool pin geometry or FSP parameters, achieved enhancement of 40% to 56% in microhardness. The microhardness of the samples FSPed using TTH tool was further enhanced by a maximum of 63% at 1150 rpm and 30 mm/min. This enhancement is attributed to the fine equiaxed grains formed under dynamic recrystallization as well as the dense precipitate distribution during FSP [24]. Microscopy images of the phenomenon will be presented in Section 3.3.
There is a noticeable pattern whereby a decrease in operating spindle speed contributes to superior microhardness characteristics of the test samples. In addition, for rotational speeds at 1150 rpm and 1200 rpm, an increment in feed rate improves the overall microhardness. The results support the inverse correlation between microhardness and the heat generated during FSP. FSP at the lowest rotational speed of 1150 rpm yielded relatively low peak temperature and enhanced microhardness, and vice versa for higher spindle speed at 1200 rpm. Abrahams [16] confirmed that low spindle speeds generate lower heat as the stirring is less violent than the higher speeds, regardless of tool design, and this prevents grain growth of the material, thus ensuring improved microhardness. However, FSP at rotational speed 1250 rpm did not exhibit similar trend. This might be due to the FSPed samples achieving an exceedingly high temperature at rotational speed 1250 rpm, leading to thermal softening or grain growth [25,26].
The poor microhardness of samples FSPed at the lowest feed rate of 20 mm/min may be attributed to prolonged exposure to high heat induced during FSP that is for a duration of around three minutes. Previous research on heat treatment of AA 6063 stated that the material is not to be exposed to excessive heat for a long period to avoid deterioration in strength. At the temperatures of 200 °C, AA 6063 can withstand reheating up to half an hour without affecting overall strength. However, at 230 °C onwards, this period drops to only five minutes [25]. This exposure to heat may have led to a dip in microhardness when FSPing at 20 mm/min feed rates [27].
Overall, a comparison of the resulting microhardness of FSPed samples produced by both TTH and CTH tools shows that the TTH tool yielded the greatest enhancement. This bodes well with Beygi et al.’s findings [28] in friction stir welding that the taper threaded tools provide good welding outcomes in terms of strength and soundness as the material flow is not as high to prevent weakening due to micro voids.
The variations of microhardness with respect to labelled positions in Figure 5 are presented in Figure 7; Figure 8 for TTH and CTH tools, respectively. Regions 4, 5, –4, and –5 represent the two far ends of the heat-affected zone (HAZ) which does not undergo FSP while the others represent the stir zone. The HAZ regions are observed to have lower microhardness compared to the centre as this area is subjected to enhancement only through heat treatment generated during the FSP. On the other hand, the stir zones subjected to FSP experienced enhancement in microhardness which usually peaks at the stir zone nugget region at points −1, 0, and 1. All samples regardless of tool geometry, rotational speed and feed rates also exhibit a similar trend along the width of material samples, justifying that the enhancement of microhardness is reliable and consistent. It can be noticed that all FSPed samples with feed rates of 30 mm/min shows a consistently high microhardness across stir zones with minimal fluctuations except the condition at 1250 rpm for the CTH tool.

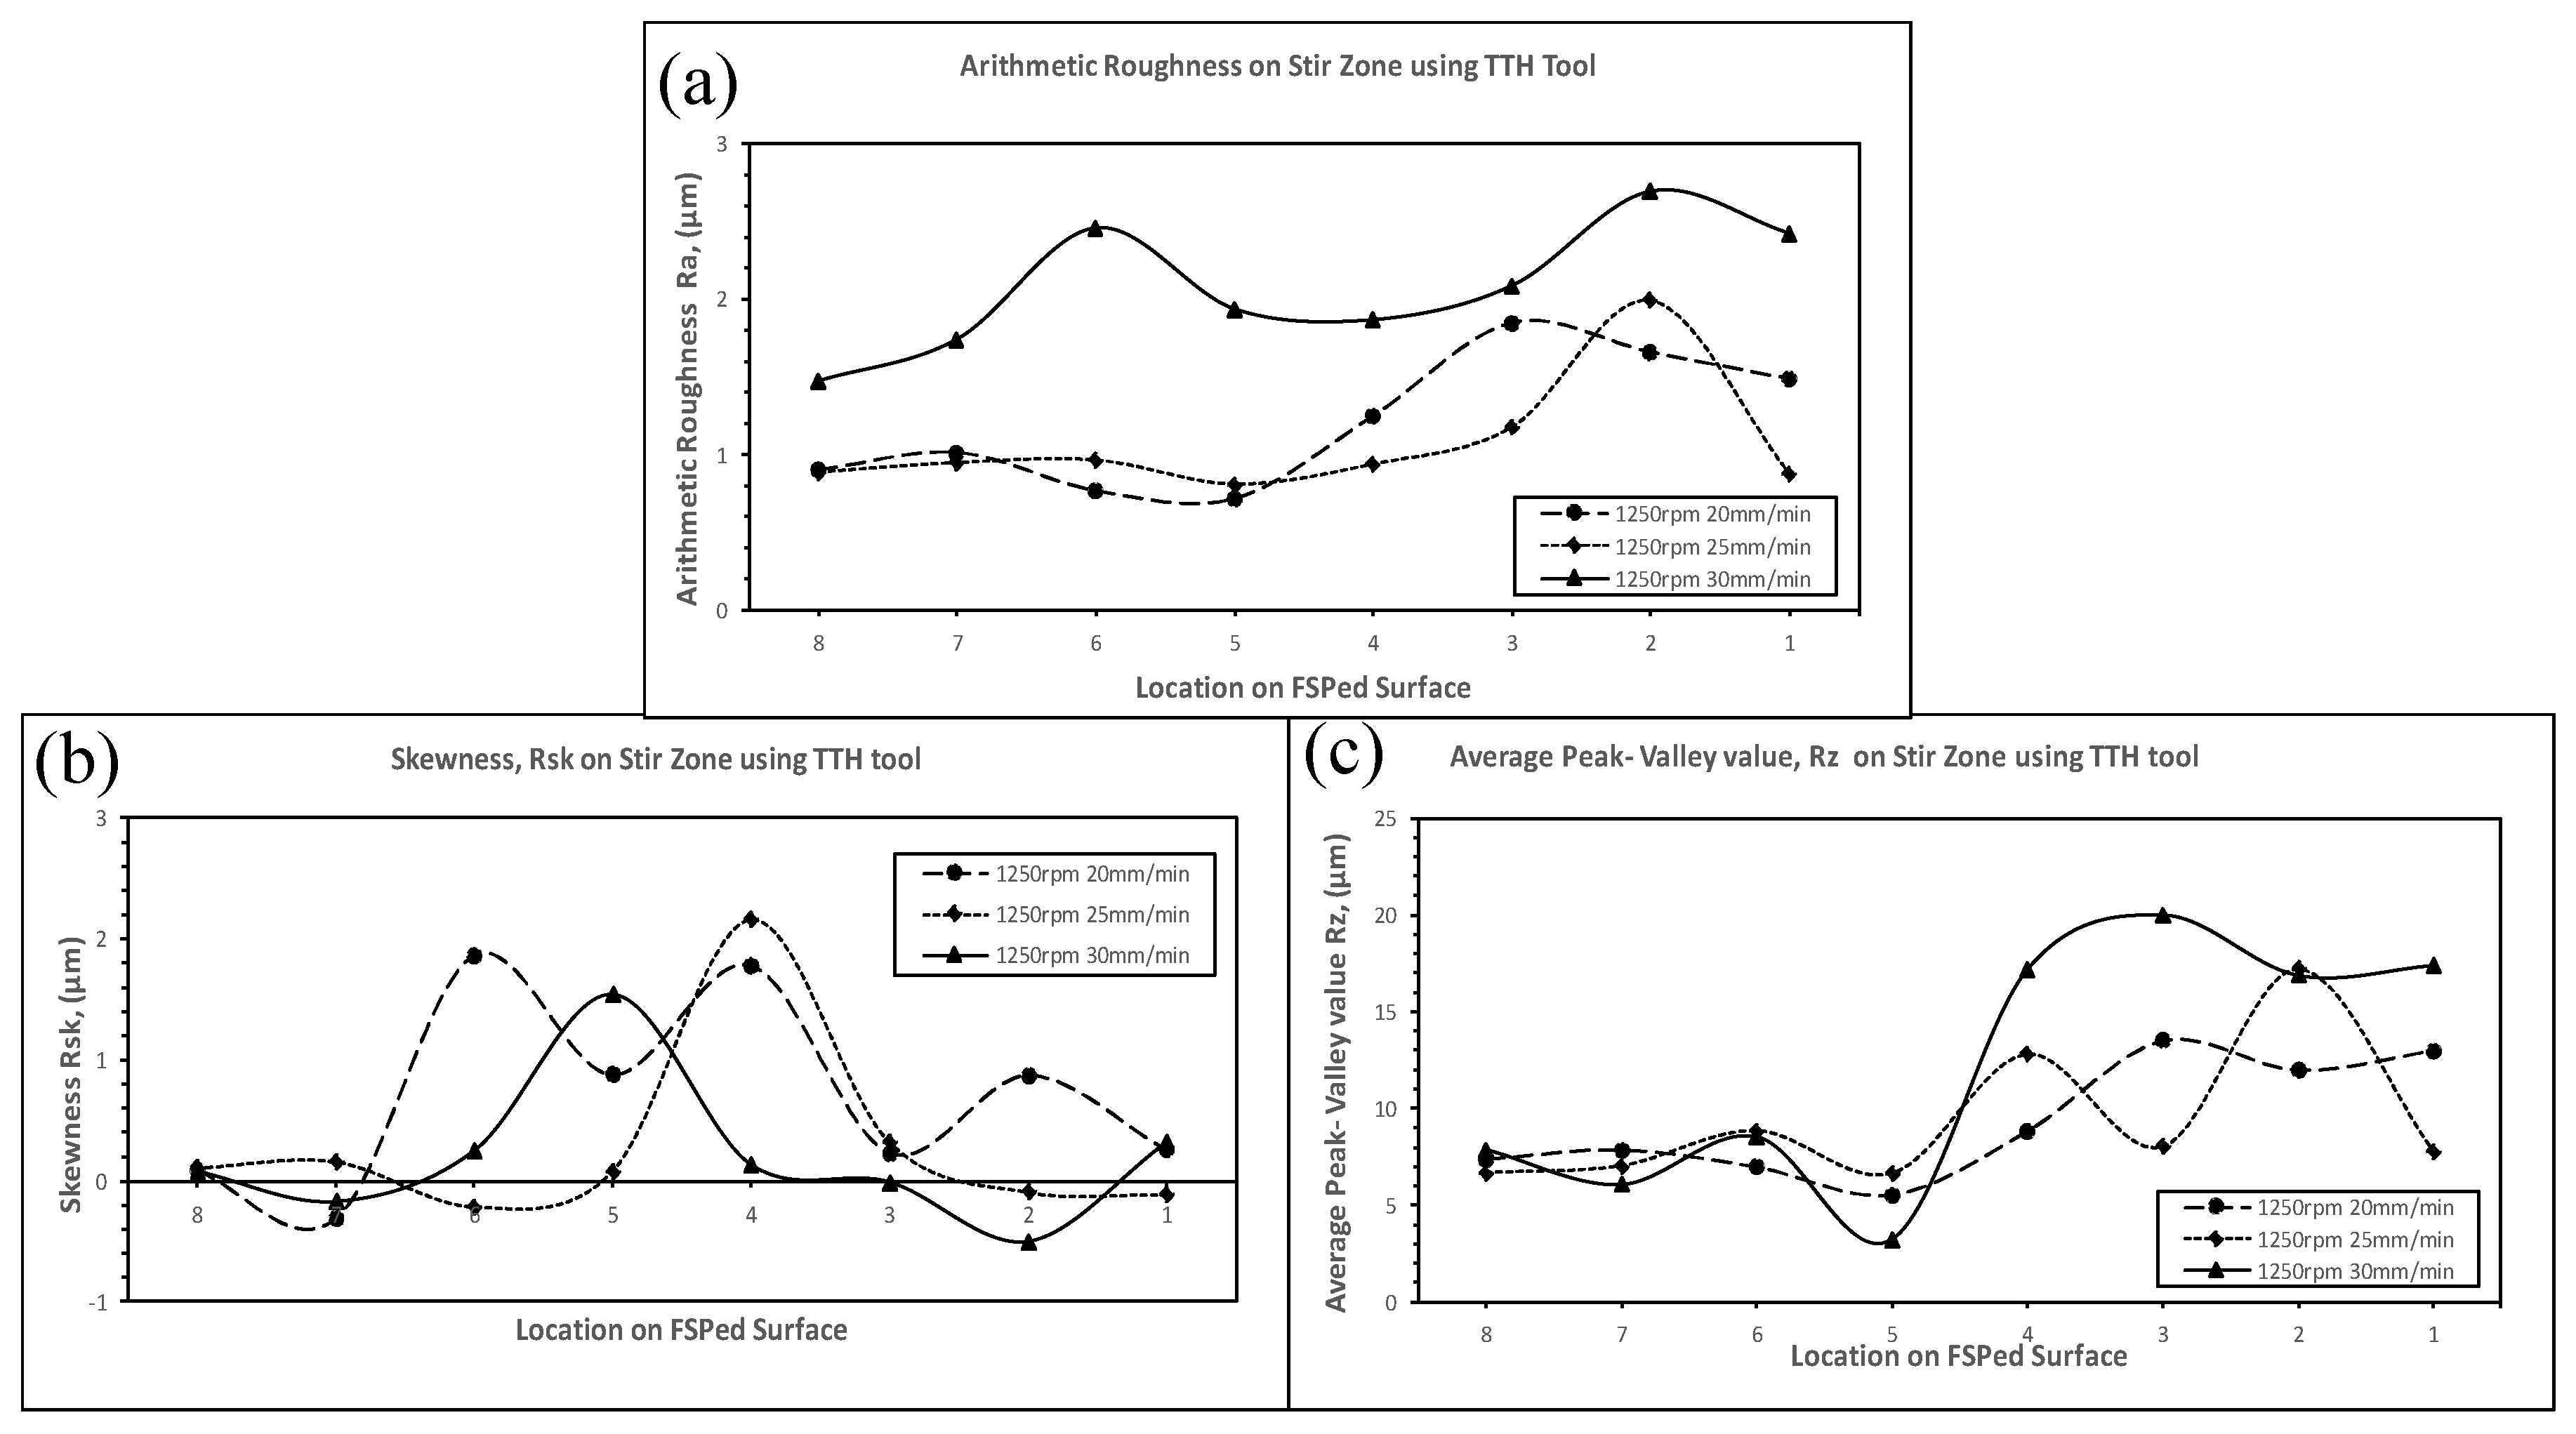
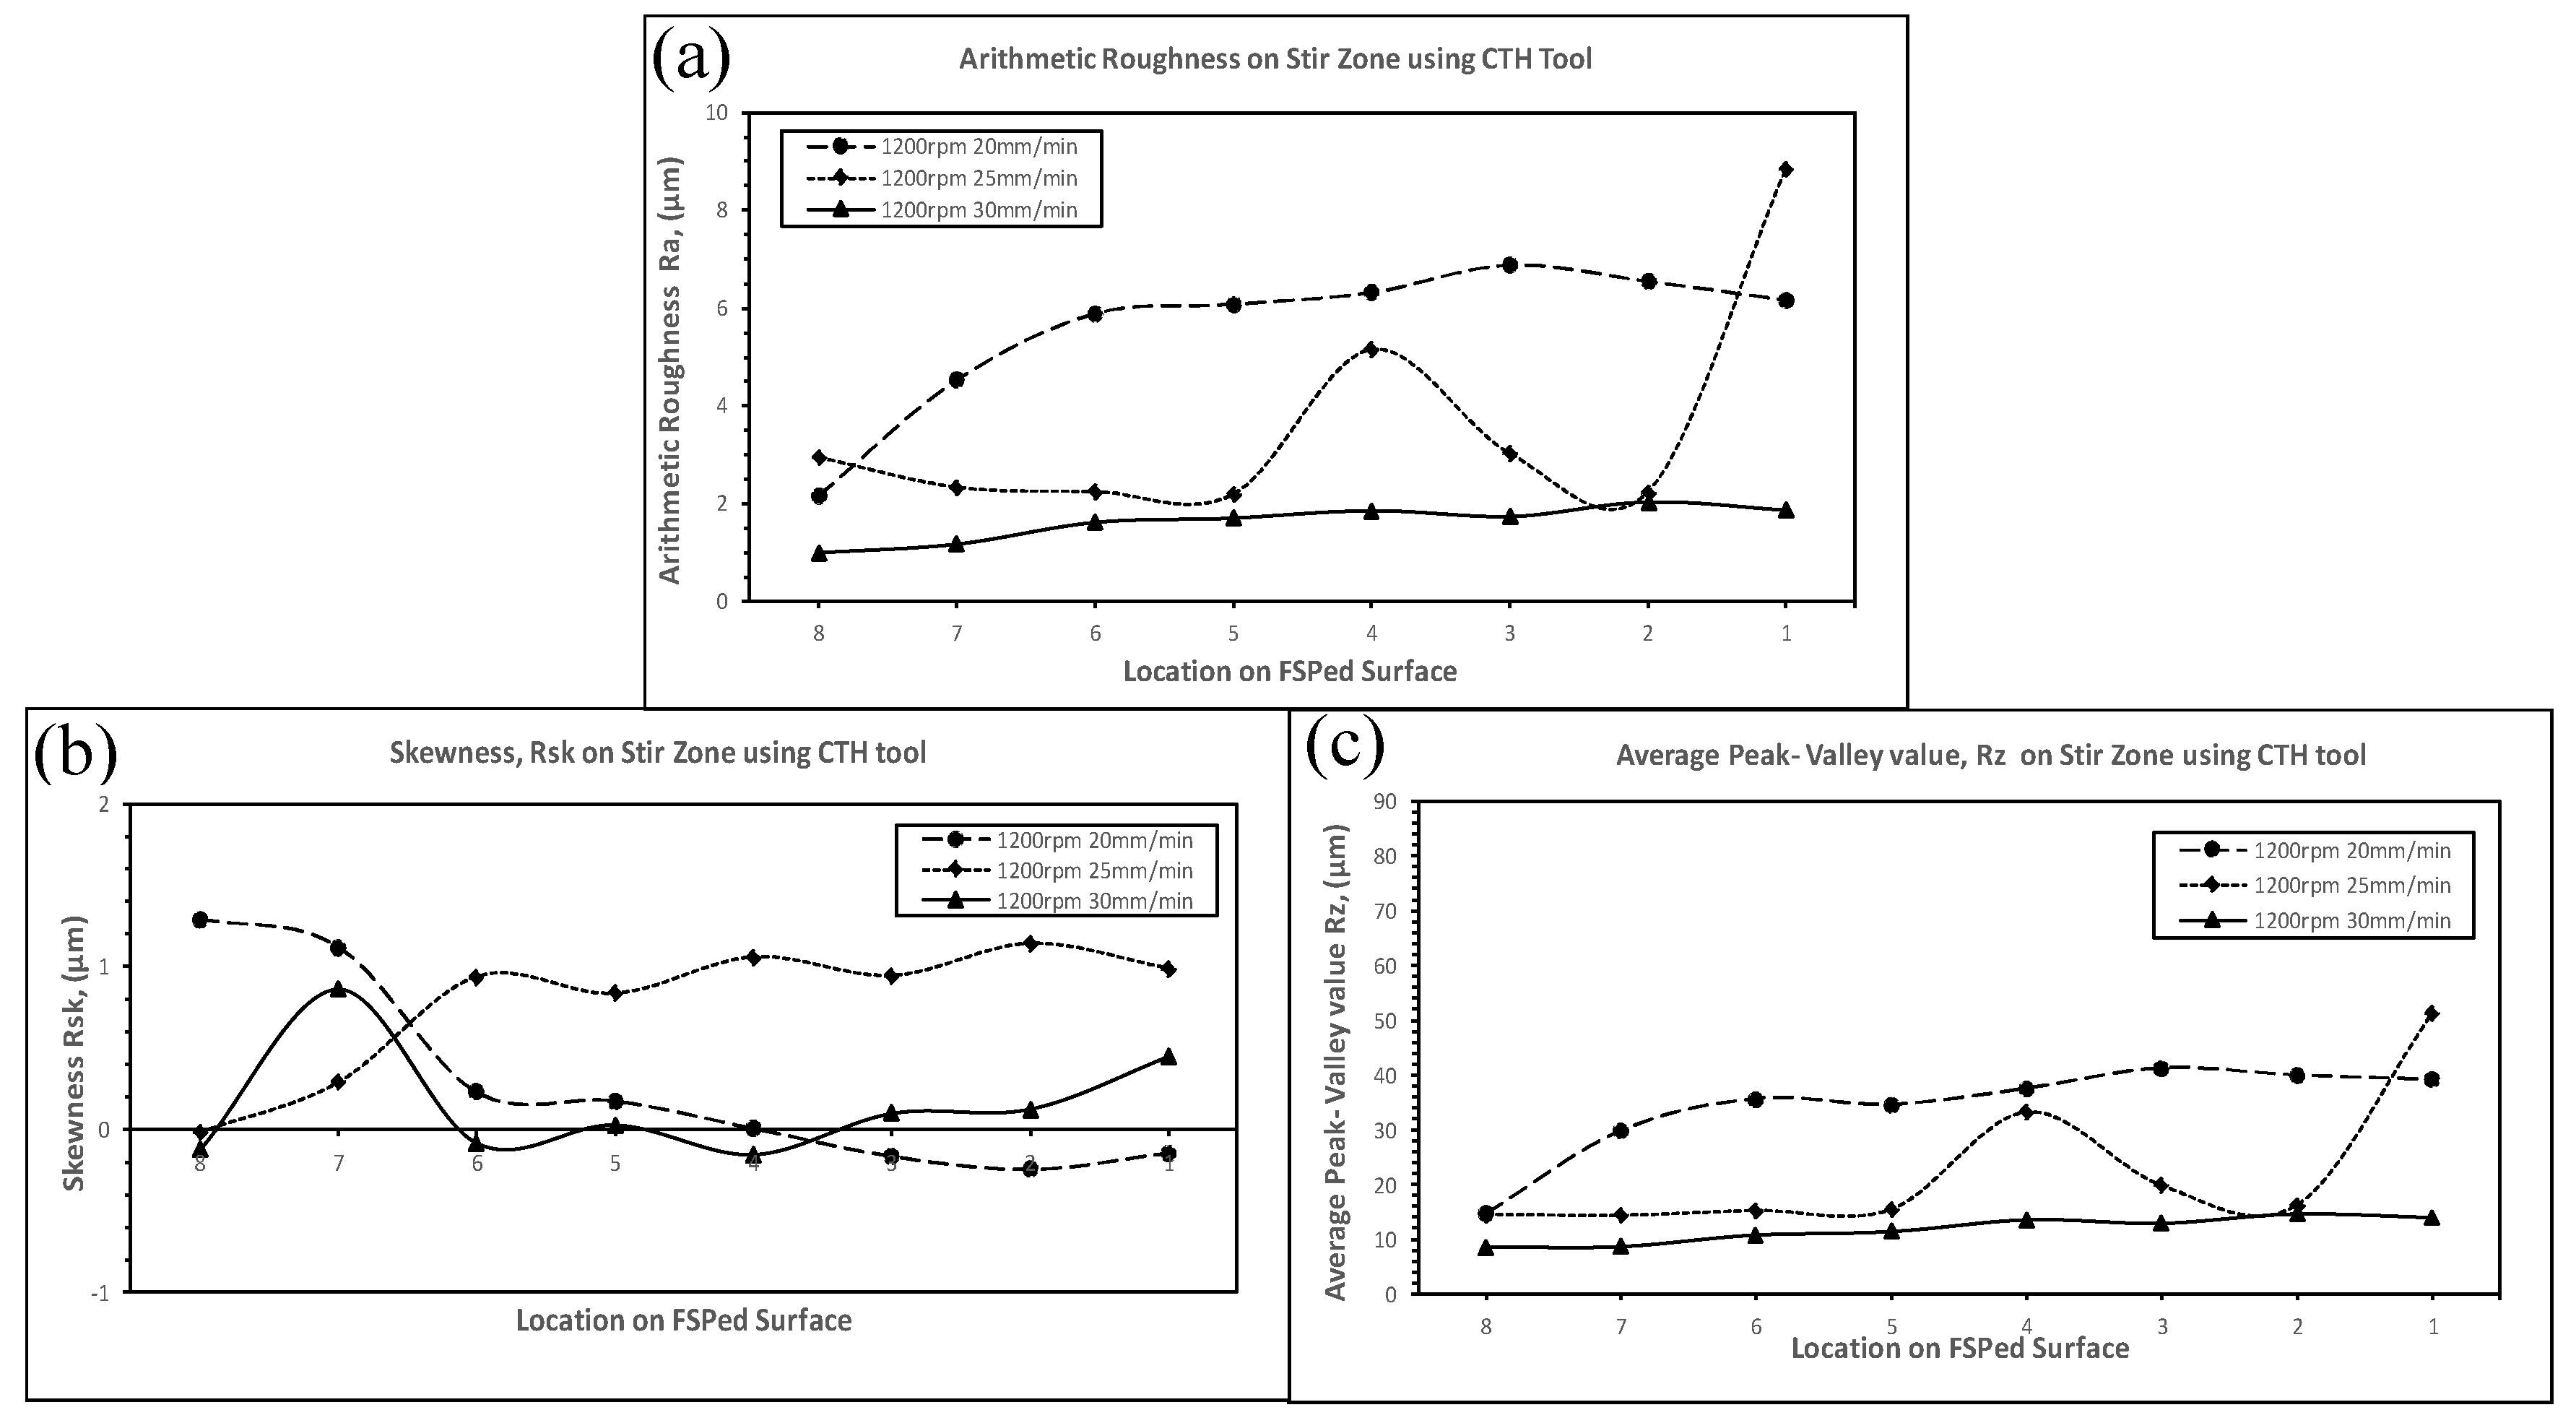
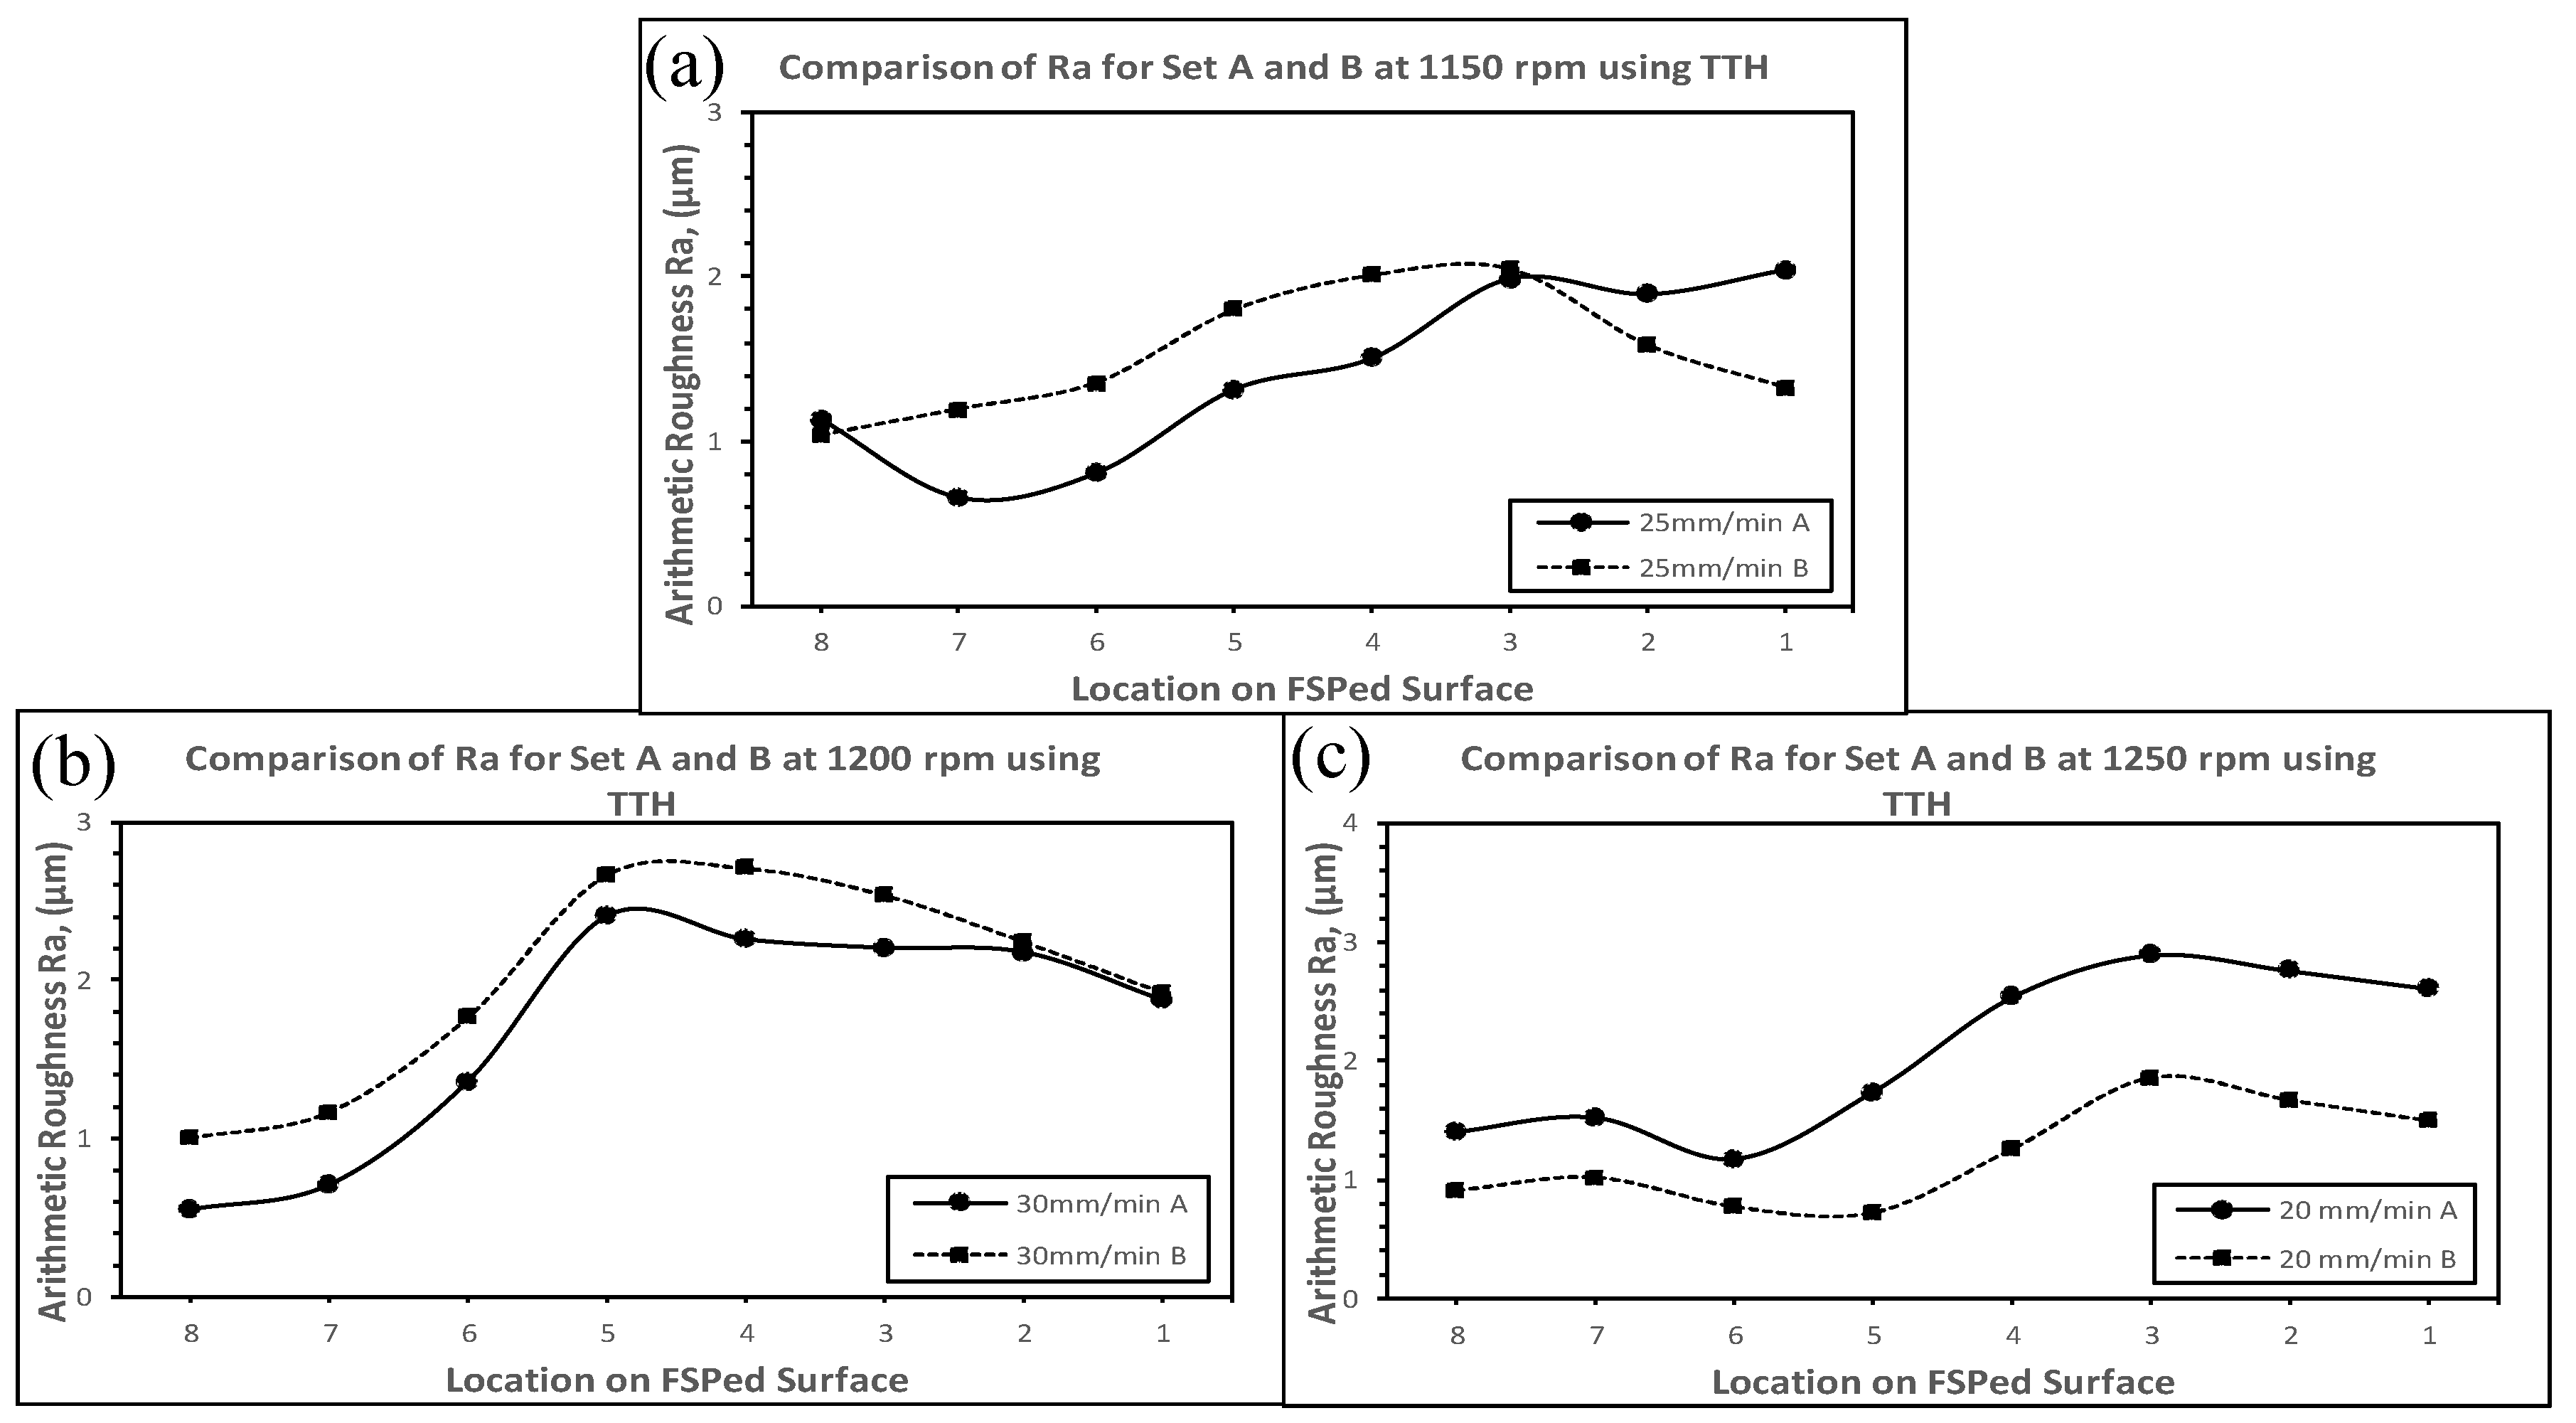
3.2. Surface Roughness Measurement

Figure 9, Figure 10, Figure 11, Figure 12, Figure 13 and Figure 14 present all the roughness measurements on test sample ‘A’ produced by varying FSP tools, rotational speeds and feed rates. For the FSPed surface produced by the TTH tool, Figure 9, Figure 10 and Figure 11 show that the arithmetic roughness, Ra distribution across all three rotational speeds is consistent with fluctuations not exceeding 2 µm. Changing rotational speeds of the FSP gives minimal influence to any difference in the surface roughness as the range of Ra obtained across all spindle speeds is similar, falling just short of the value of 3 µm. It is observed that lower feed rates of 20 mm/min and 25 mm/min generate surfaces of lower Ra values, and the surfaces produced at 25 mm/min feed rate depict more negative skewness (Rsk) values, making them the smoothest. The average peak-valley (Rz) values are found to be higher for that of 30 mm/min feed rates, making it the roughest among the three speeds tested for the TTH tool.
As for the surface topography for the CTH tool, it is observed that the readings recorded across all three roughness parameters show more noticeable and steady trends with minimal fluctuations. Referring to Figure 12, Figure 13 and Figure 14 an increase in rotational speed will result in a higher Ra value. However, this trend does not apply to the FSPed surfaces processed at 30 mm/min as the Ra values obtained were consistently low across all three rotational speeds. This trend is supported by the distribution of Rsk values of this feed rate being closer to zero compared to the rest. The trend of Rz values indicates the opposite to that of FSP by the TTH tool, whereby lower feed rates result in rougher surface profiles. Based upon attentive observation, it can be deduced that the TTH tool offers consistently smoother surfaces regardless of the parameters set than the CTH tool. Rotational speeds are insignificant to any changes of roughness values, while a lower feed rate reduces Ra values to as low as 50% from that of the highest feed rate.
For the CTH tool, increasing the rotational speed and reducing the feed rates result increased in roughness which is not ideal for any form of engineering application. It is likely that the CTH tool had not offered the best flow of material within the nugget regions of the pin, thus inadequate material was displaced into the shoulder, causing poor roughness. However, FSP produced using the CTH tool at 30 mm/min feed rate does show promising results at low Ra values and most importantly, the resulting surface is consistently smooth along the width of the stir zone.
In terms of the application of FSPed surfaces in sliding and wear engineering industries, the TTH tool is more suitable than the CTH tool at lower feed rates. As for applications that utilize higher feed rates, the CTH tool is more viable as it not only offers a smoother finish but also provides consistent roughness along the width of the stir zone across different rotational speeds. A smooth surface in a mechanical part often reduces the need for post-processing and this results in increased efficiency of the manufacturing process. Moreover, given a favorable outcome, a higher feed rate is desirable as it improves the operational time of the manufacturing process by as much as 50%, leading to corresponding cost-saving.
Table 2 shows the maximum roughness values of FSPed surfaces produced by different processing parameters with two different FSP tool pin geometries. The surface produced by TTH tool pin geometry has the smaller average arithmetic roughness value and average peak-valley value compared to CTH tool. However, the CTH tool produced surface with relatively low skewness value than the TTH tool in this study.
Since the surface roughness data were collected for two separate samples (set A and set B), graphs comparing results between the two sets are plotted as presented in Figure 15 and Figure 16 to justify the consistency and reliability of the data measured. Arithmetic roughness, Ra, data for six sets of parameter combinations are selected to be compared with each of them representing the two FSP tools used as well as all ranges of rotational speed and feed rates.
Based on the graphs of comparison plotted, both sets of data for the TTH tool show a fairly similar and consistent roughness pattern along with the measured location. The percentage error for both 1150 rpm and 1200 rpm is calculated to be only approximately 15%, but the samples FSPed at 1250 rpm exhibits a significantly higher percentage error of around 40%. On the other hand, the CTH tool also produces consistent readings with only 20% percentage error for samples FSPed at 1150 rpm and 1200 rpm but with higher percentage errors up to 45% for samples FSPed at 1250 rpm. In other word, similarly high deviation in roughness profiles at the highest spindle speed was observed on both tools. This shows that the repetition of the experiment using similar conditions produces consistent results each time and it is possible to replicate the desired roughness profile with a known combination of tool geometry used, spindle speed and feed rate settings. This consistency is especially useful as it promotes reliability in future mass production for engineering industry applications.

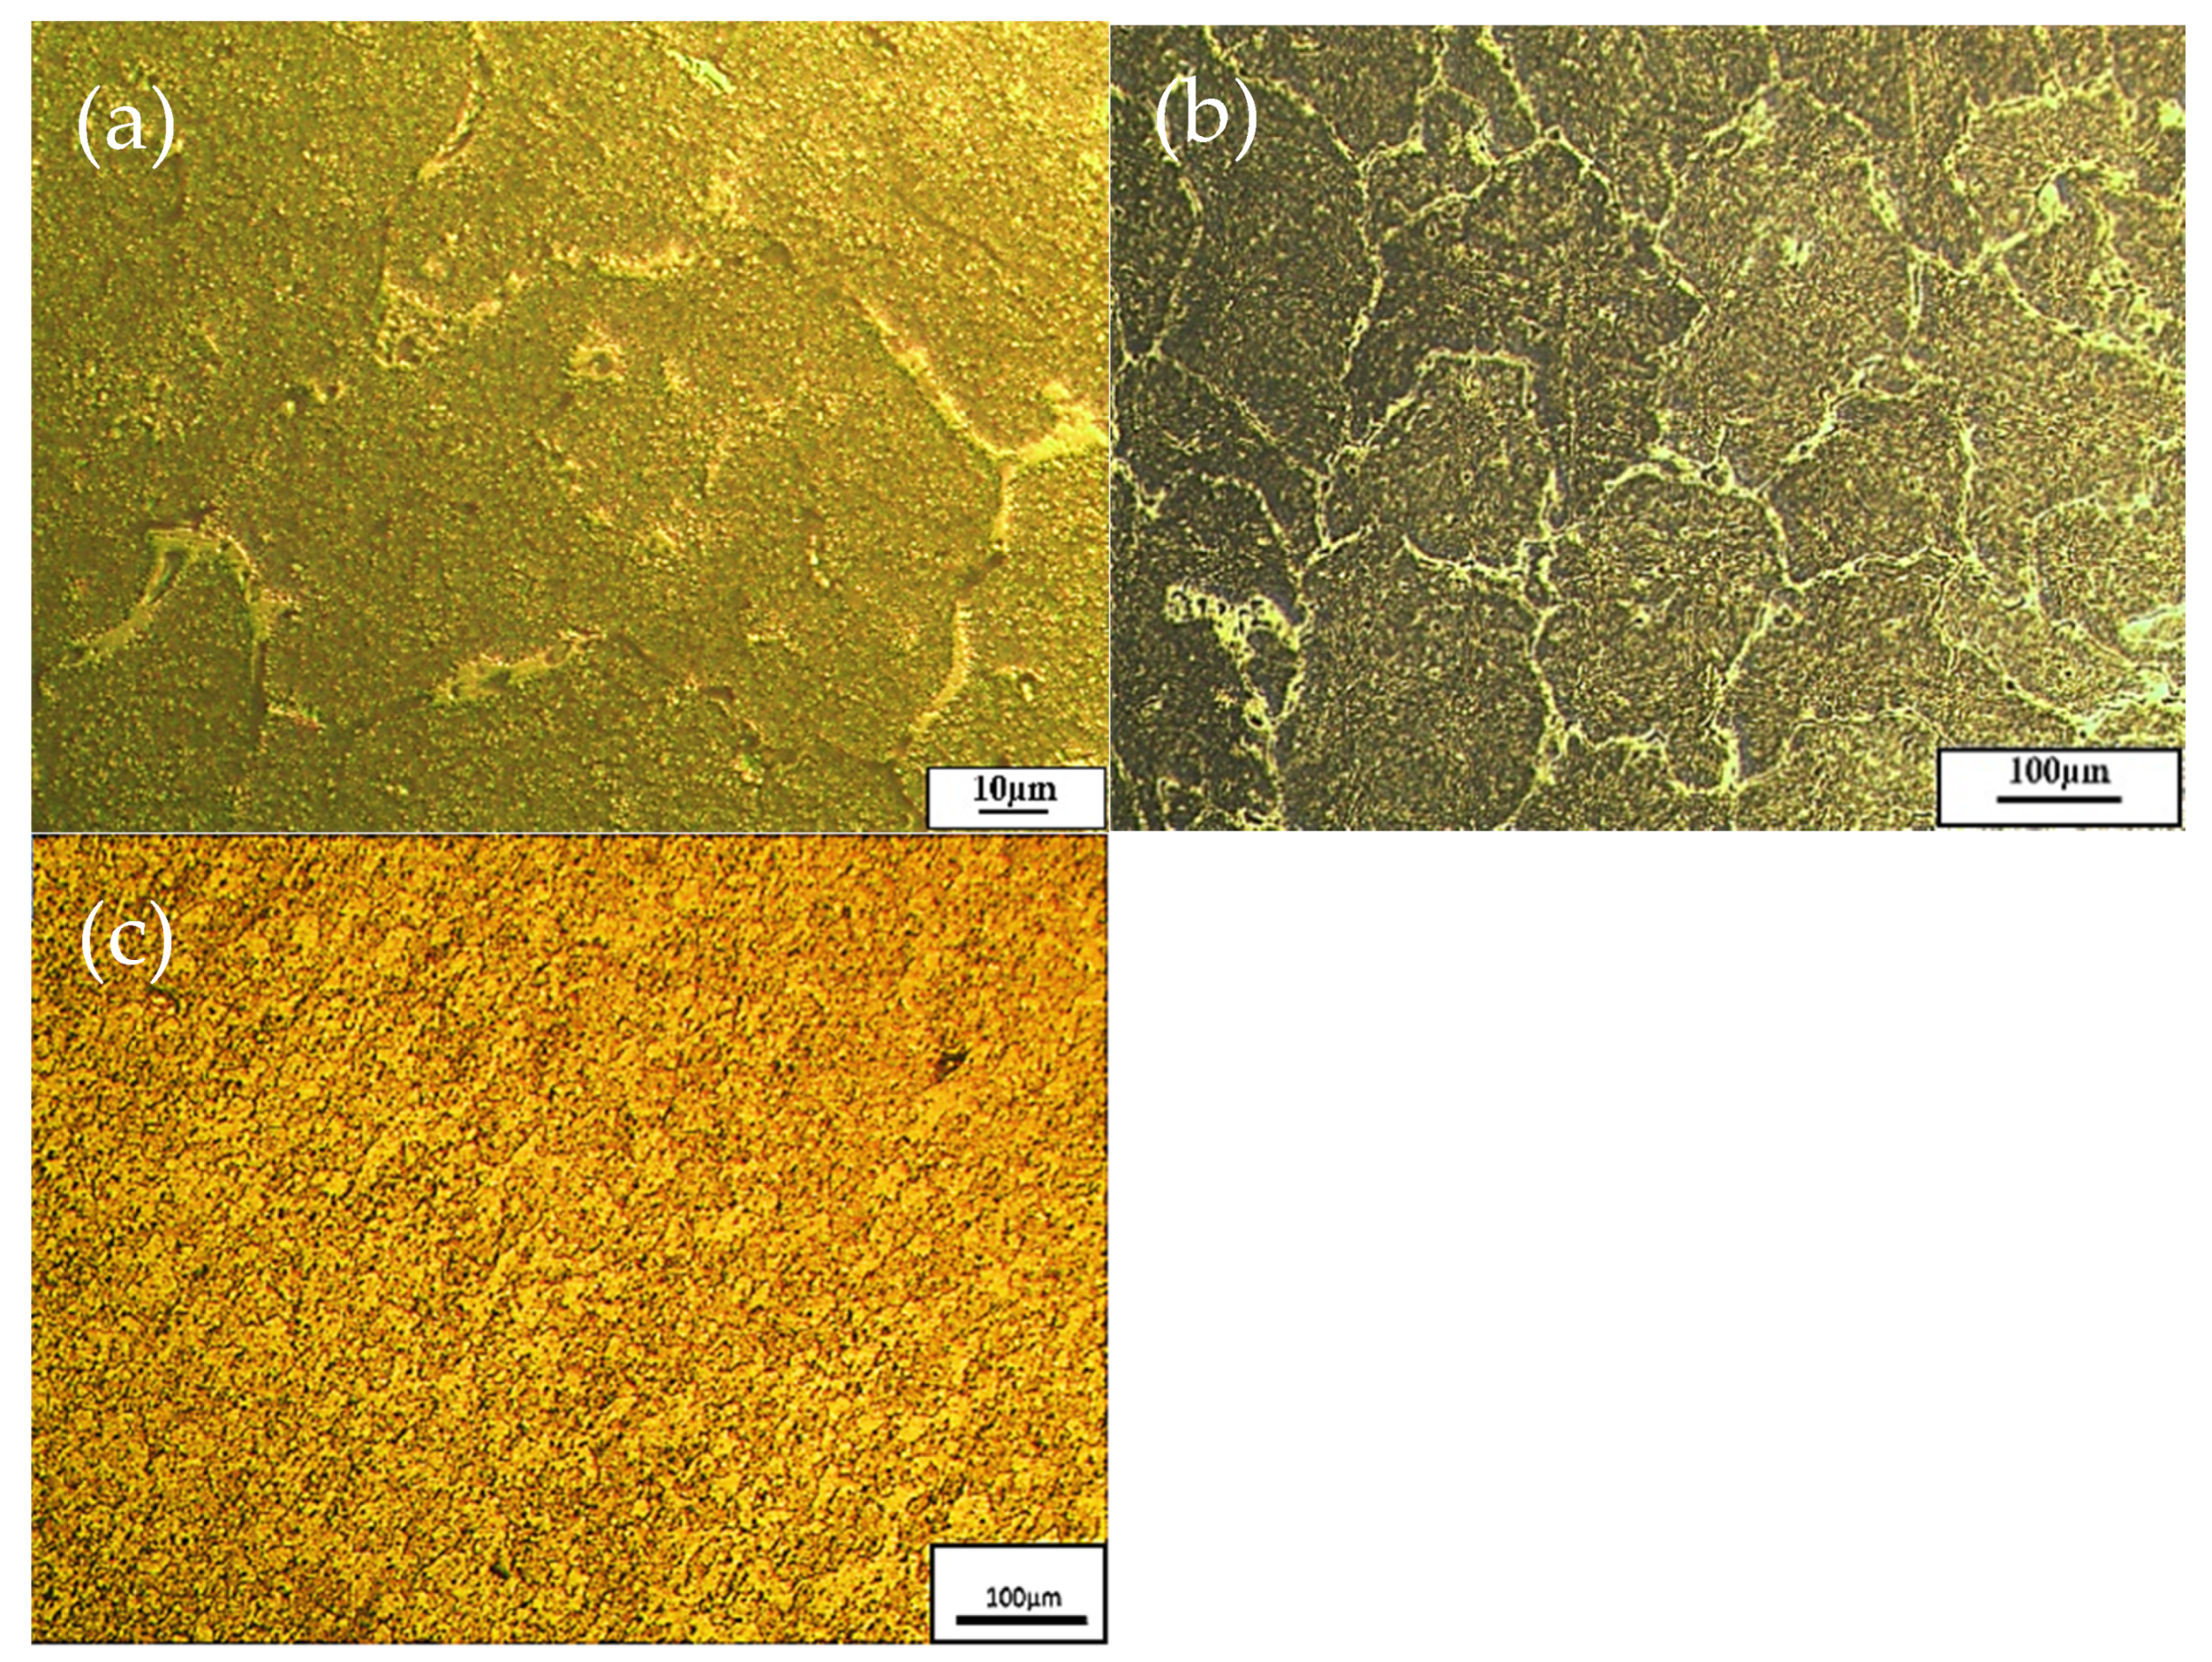
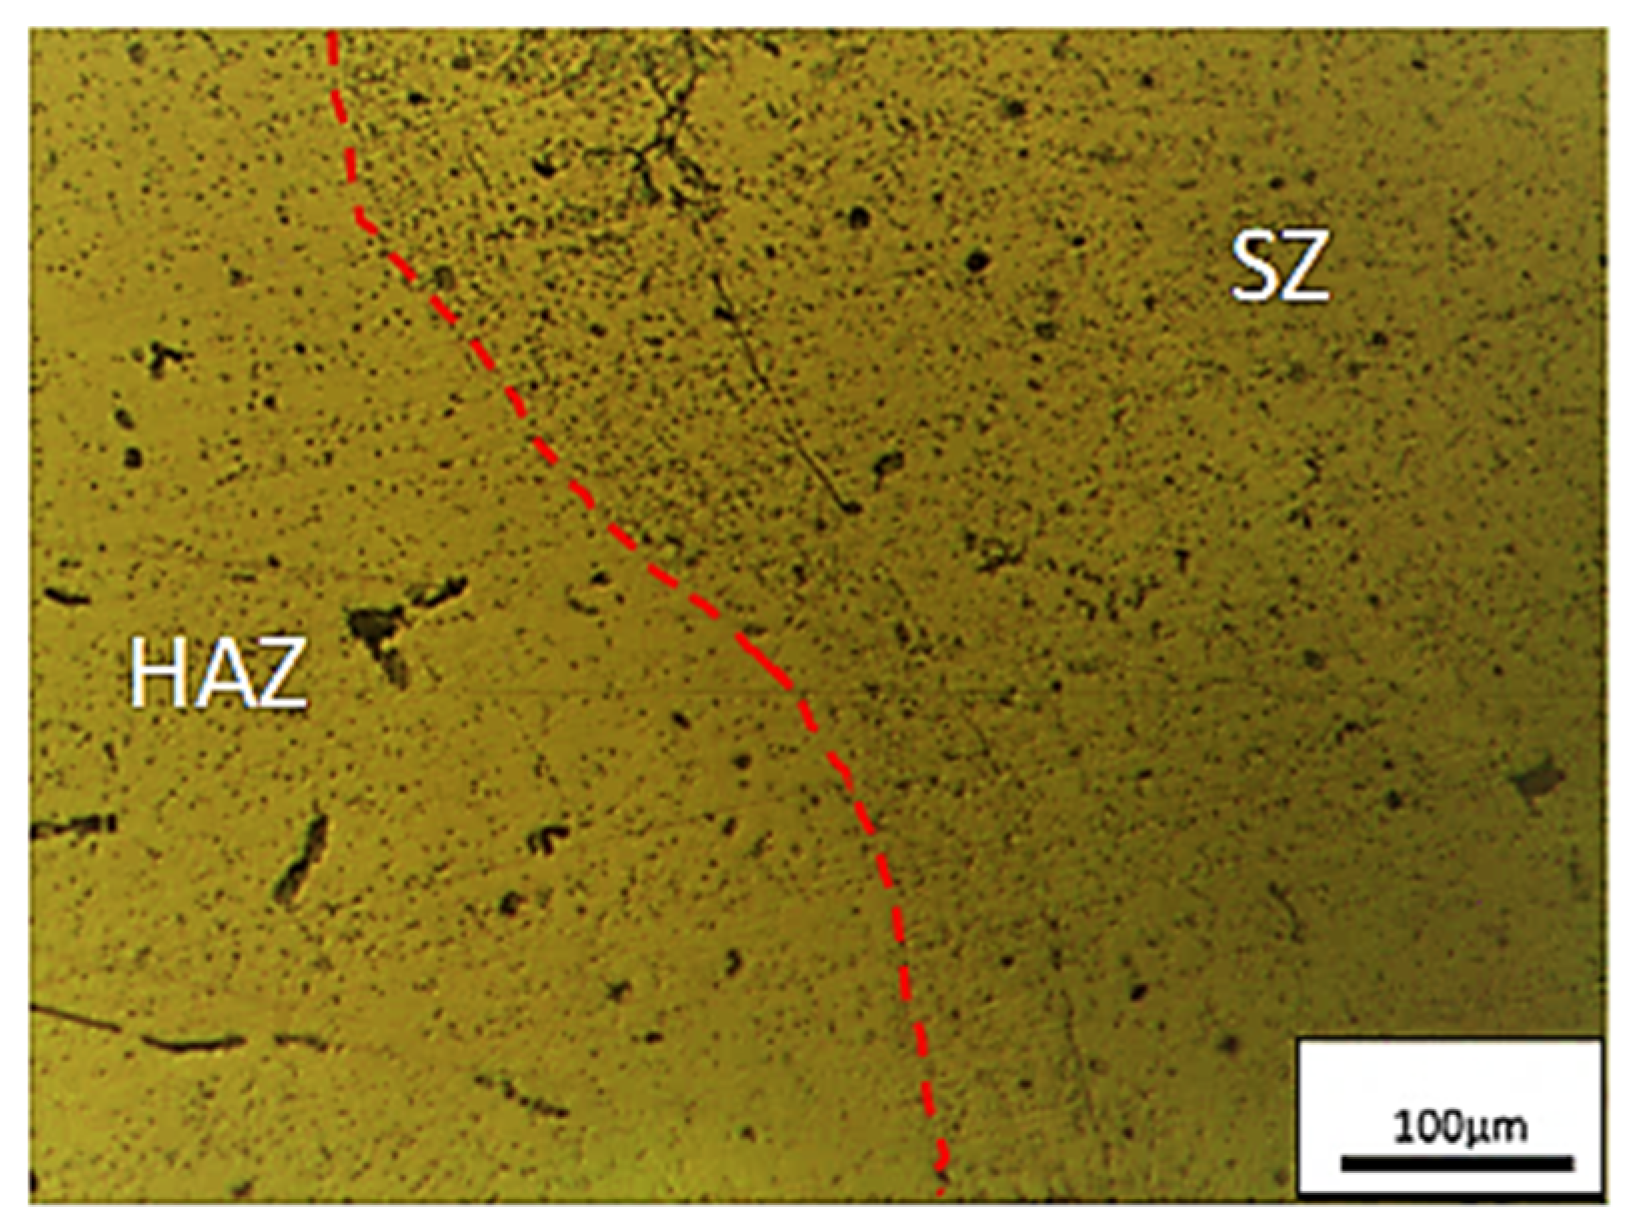
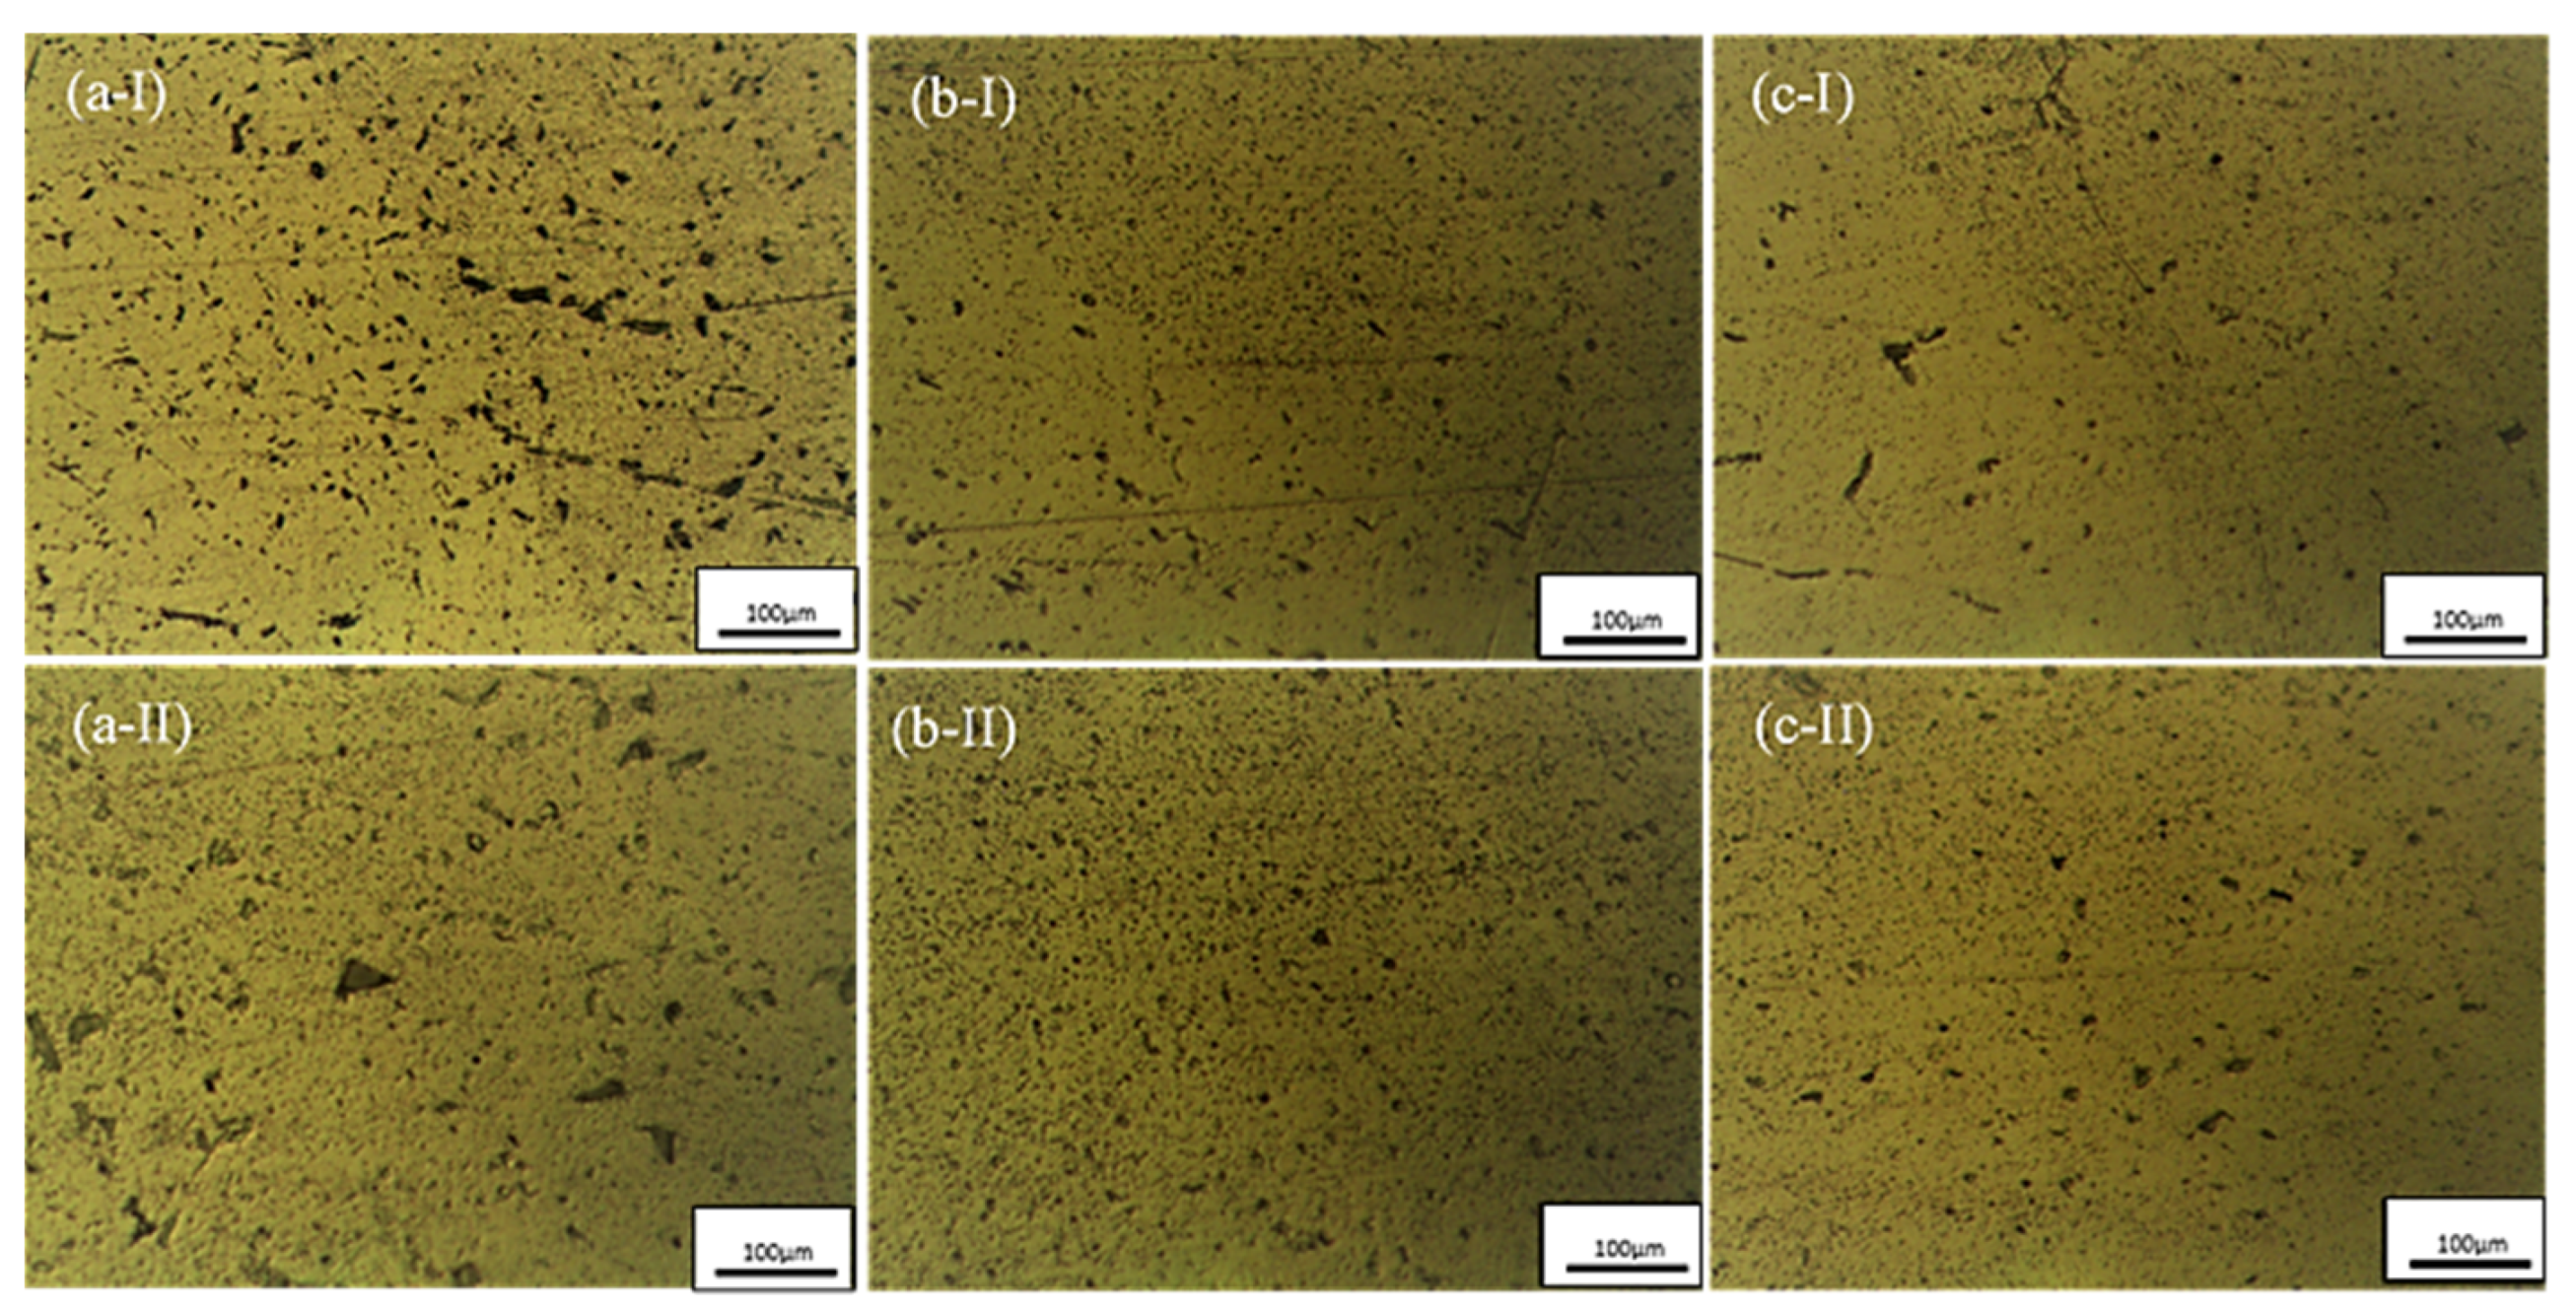
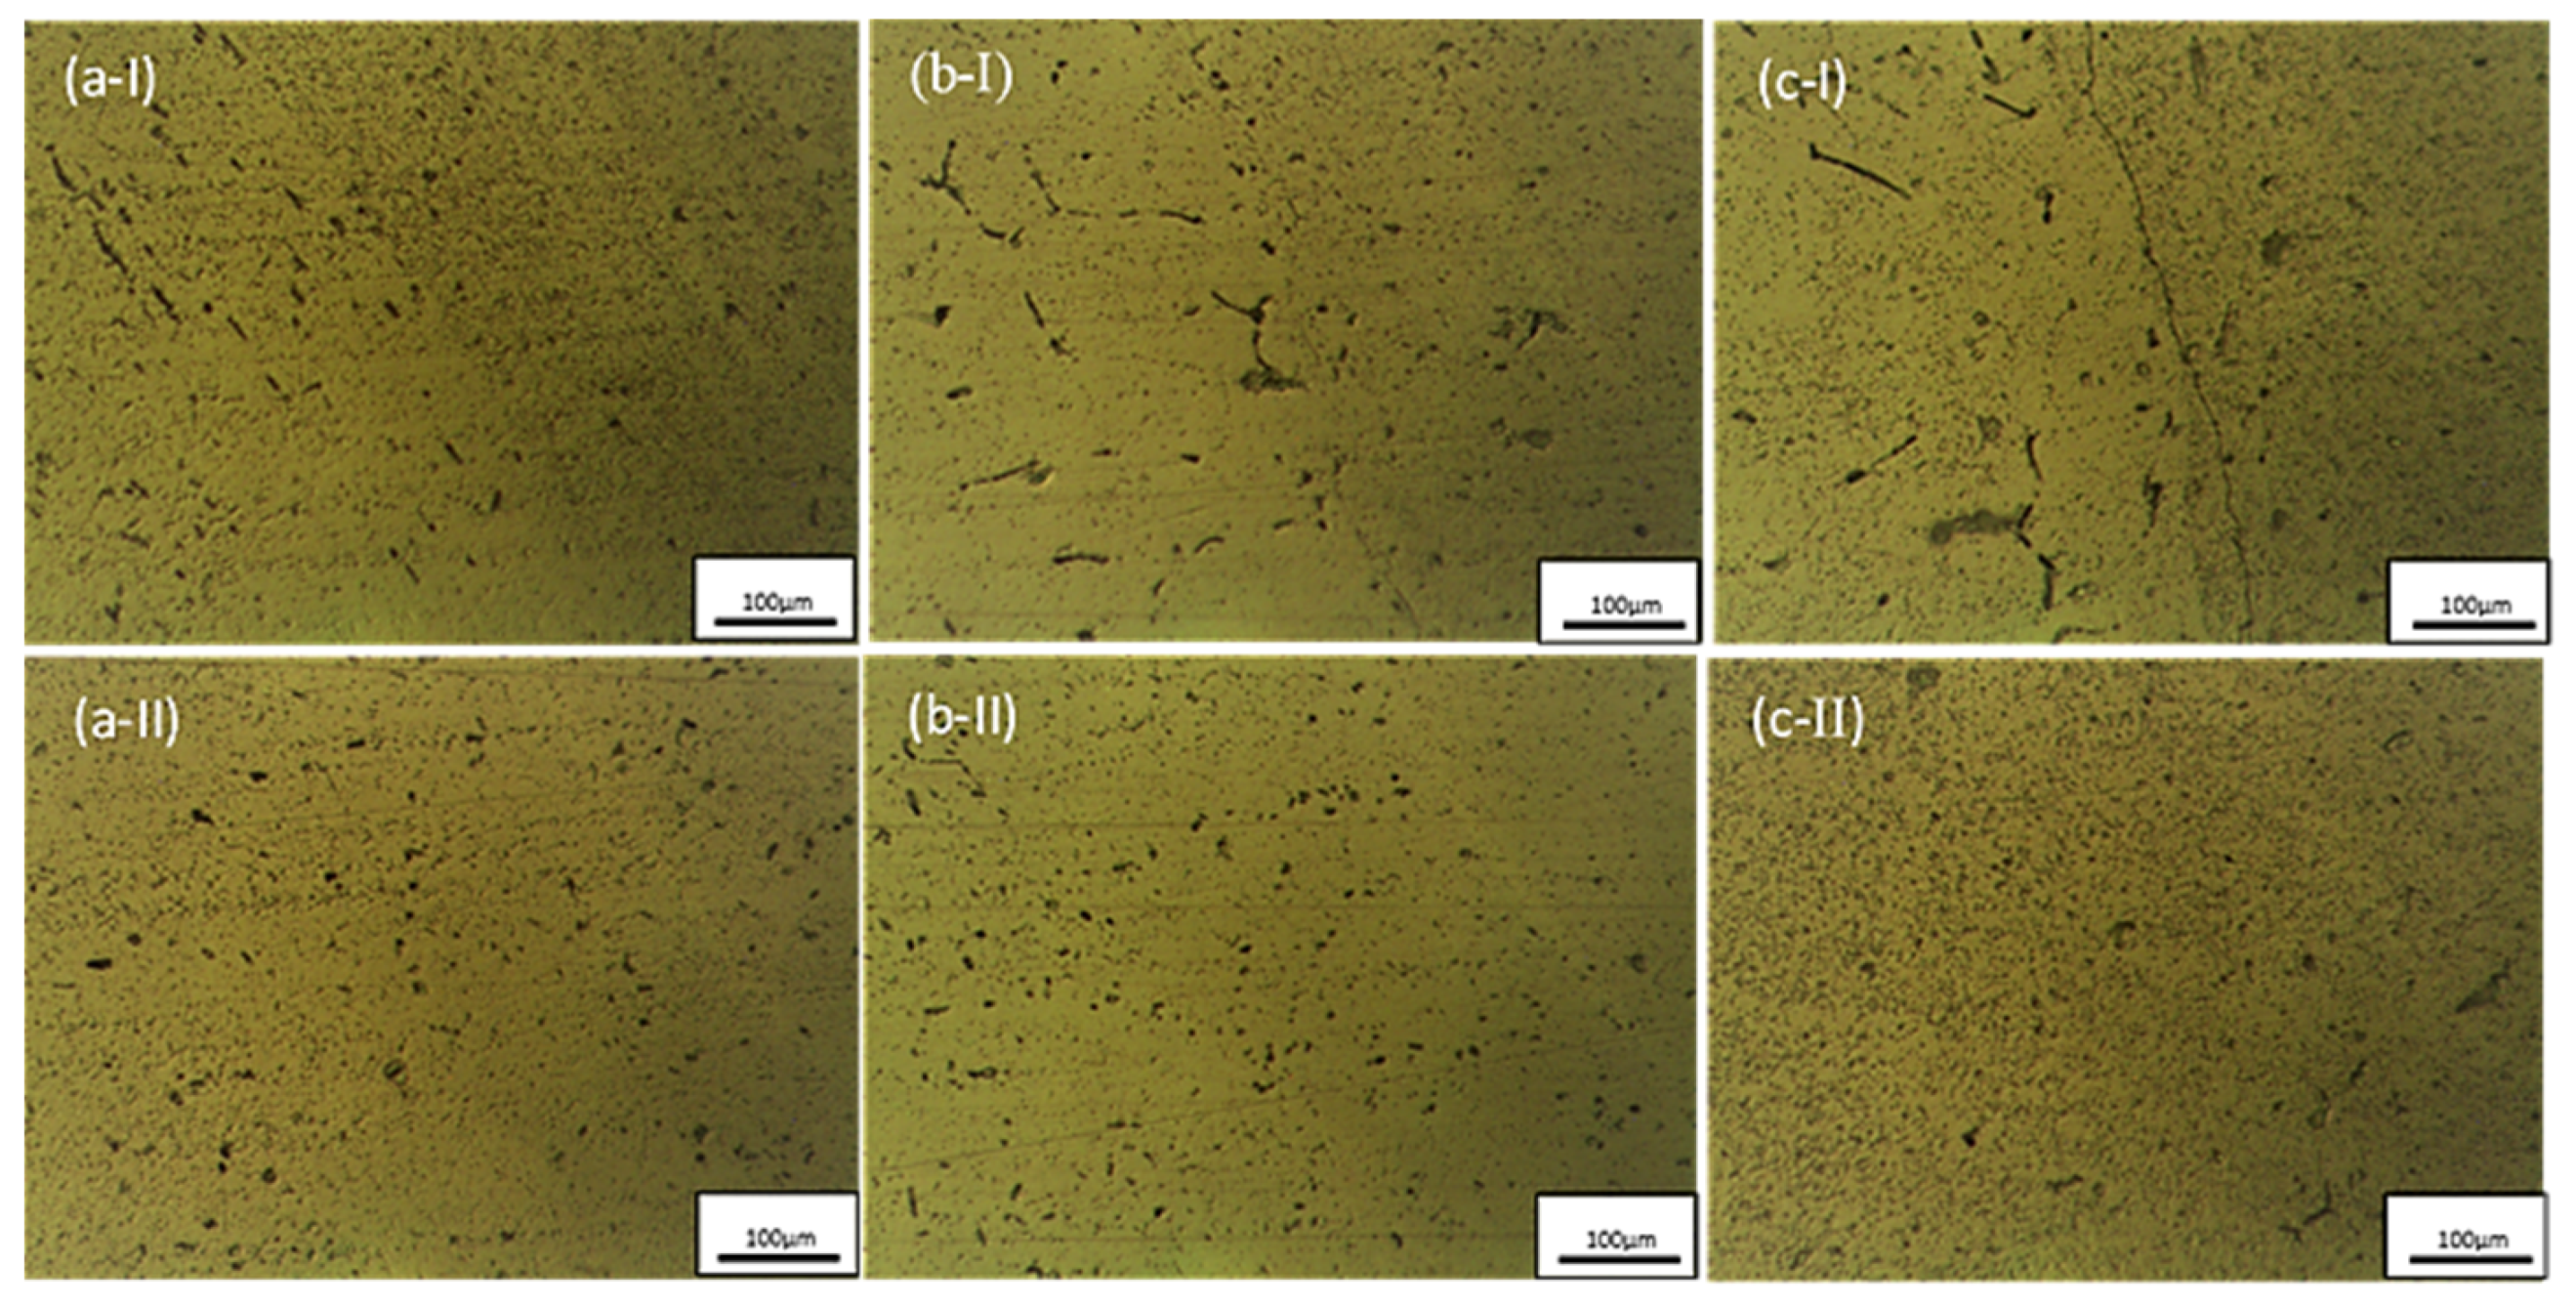
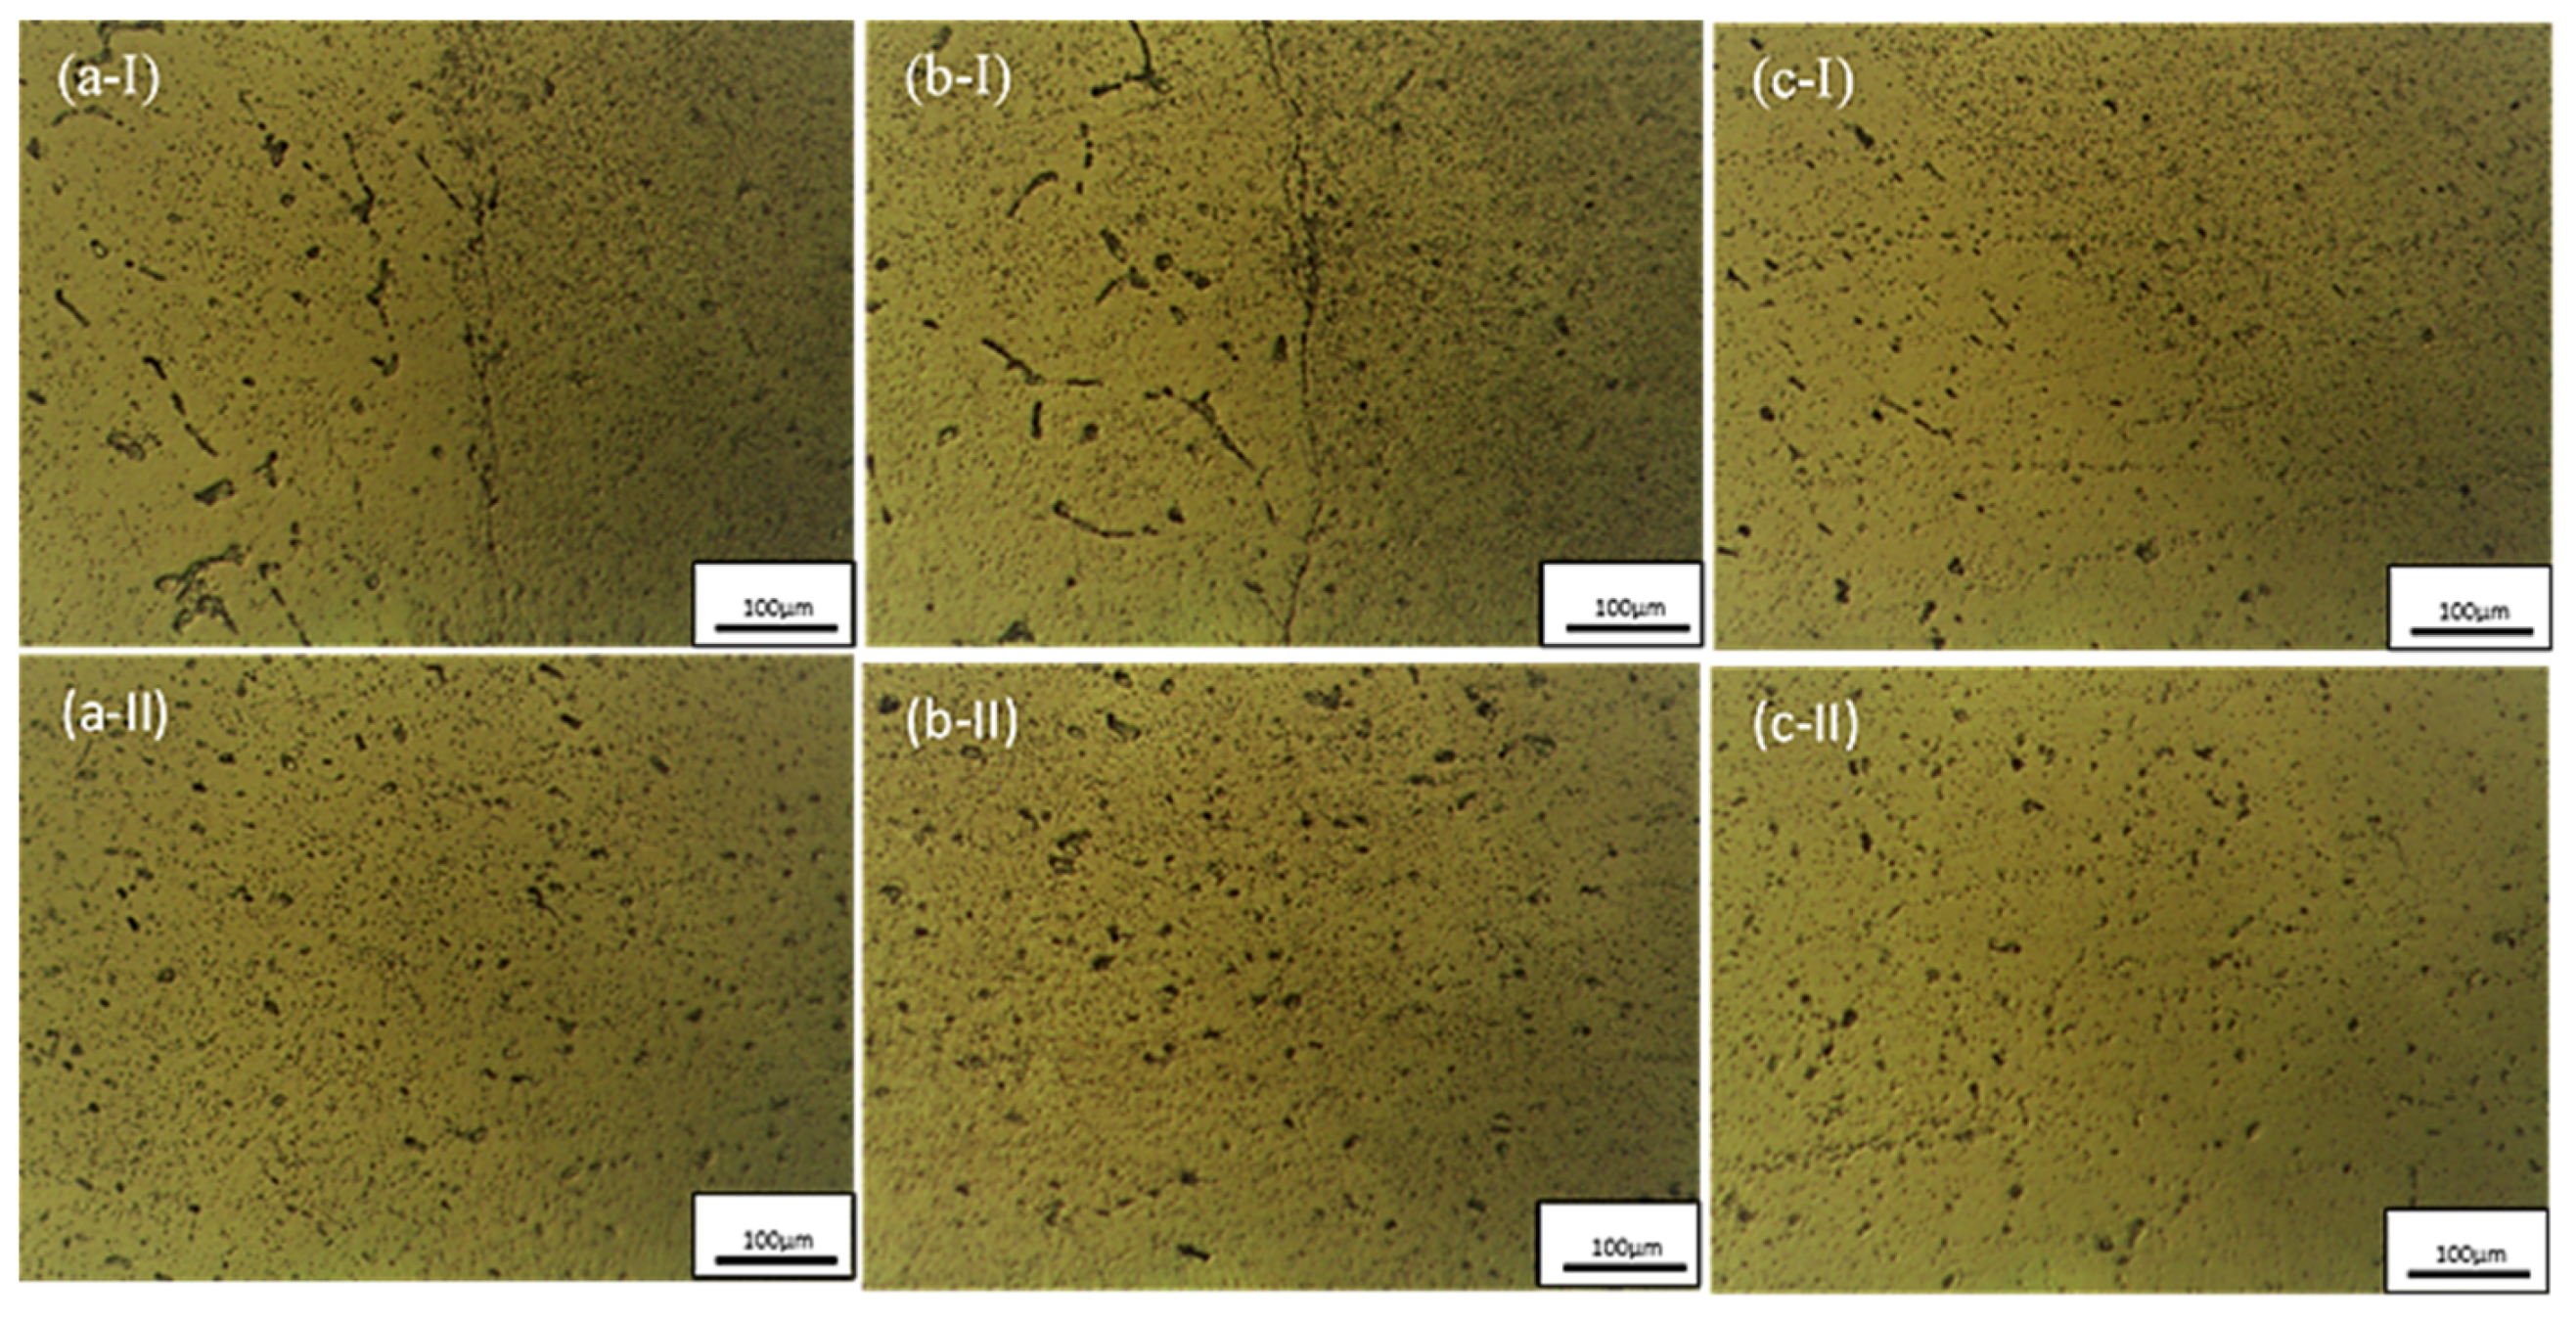
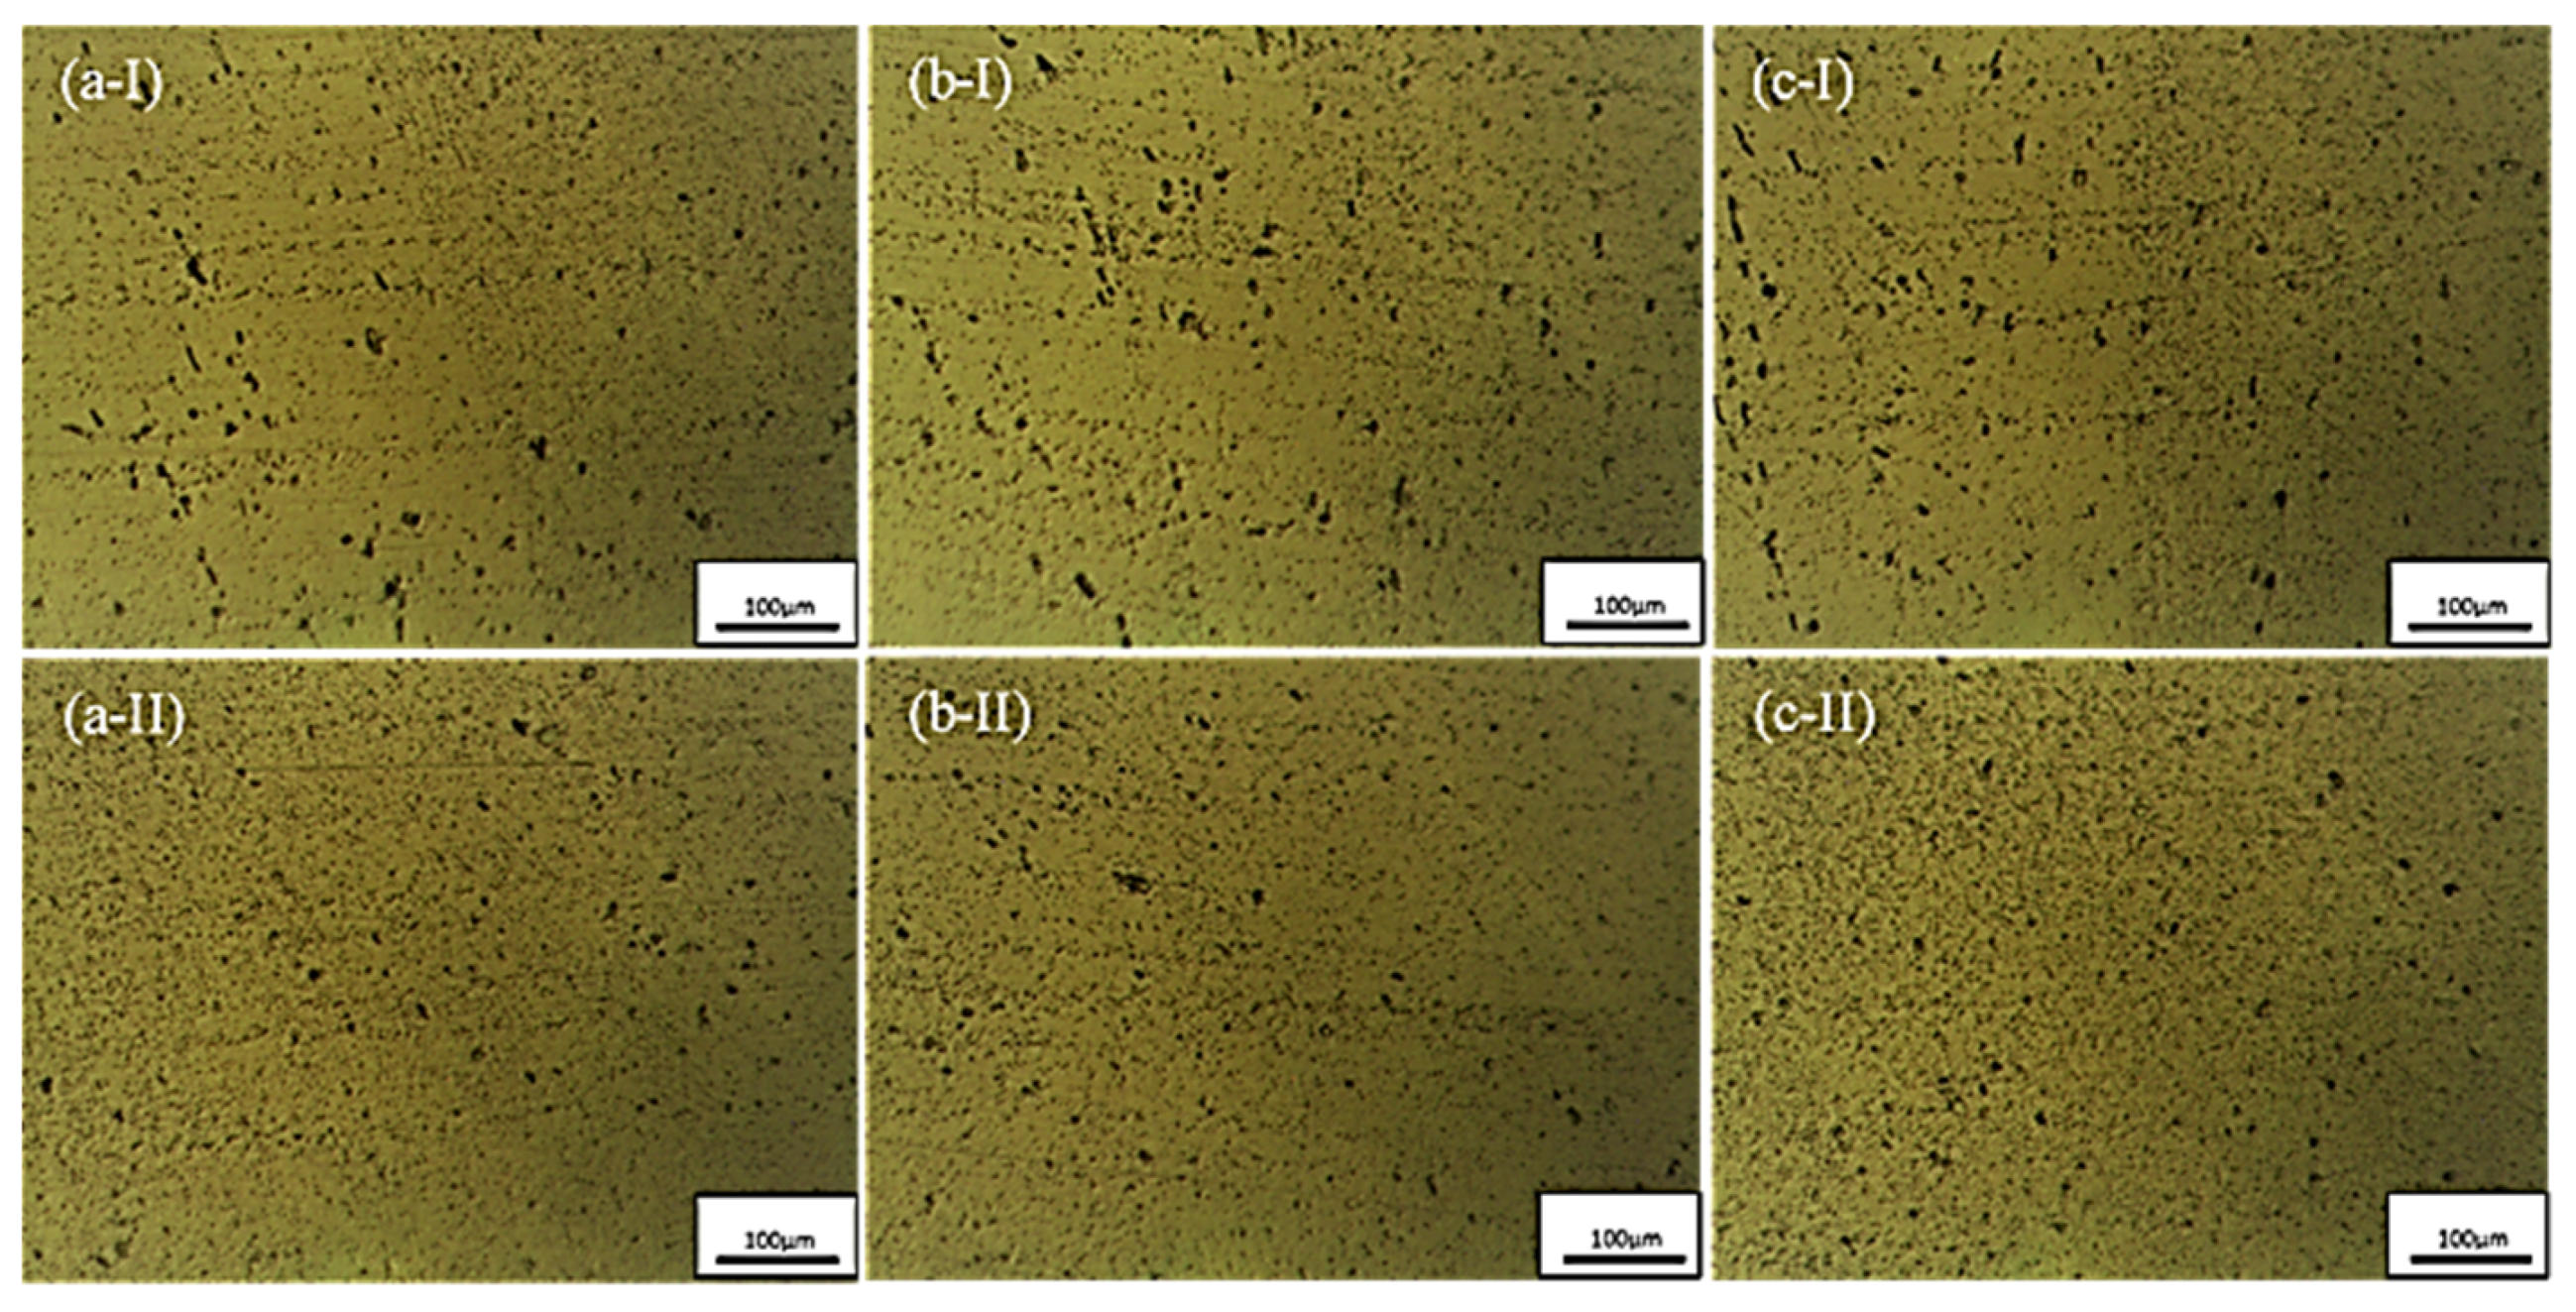
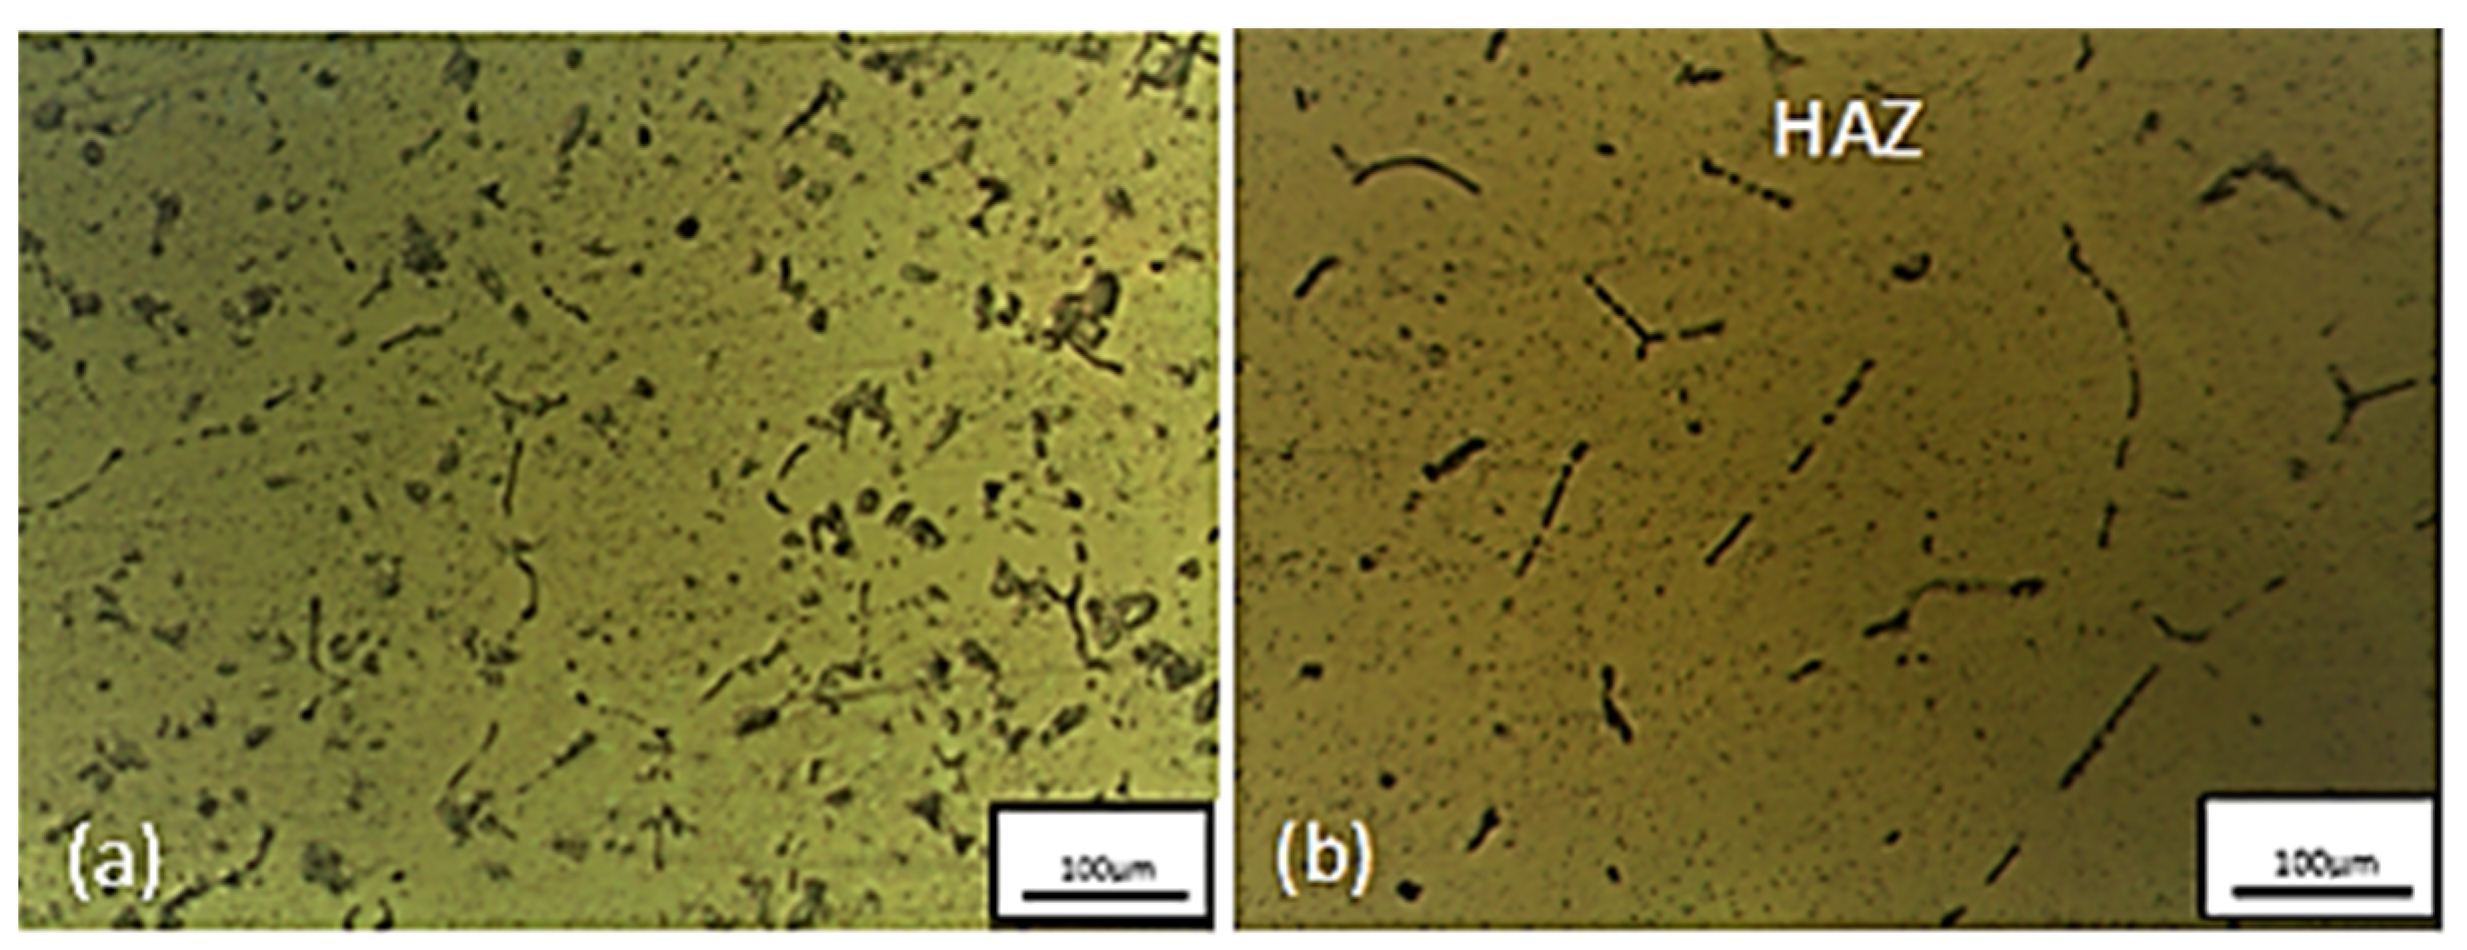
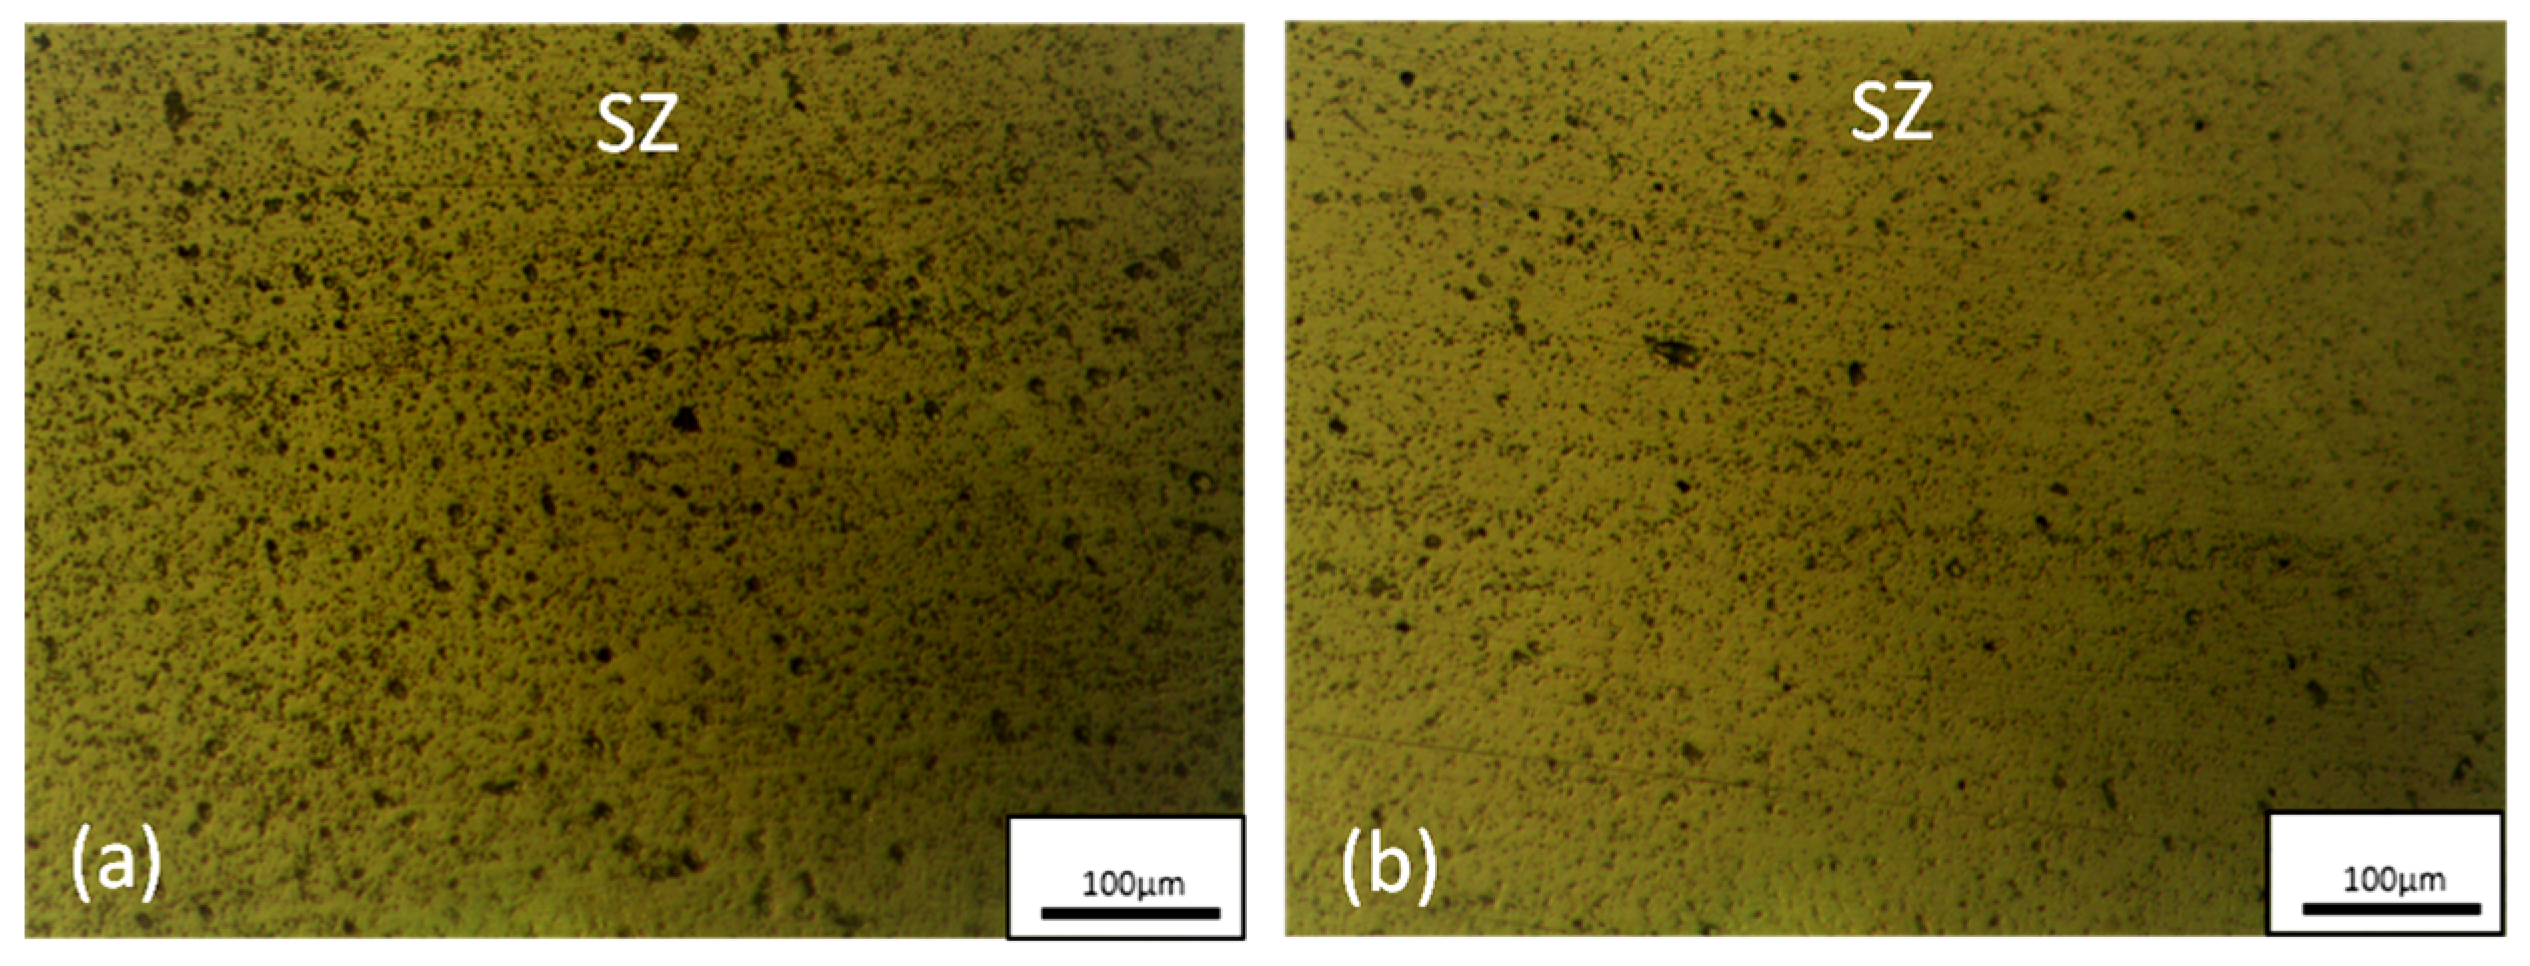
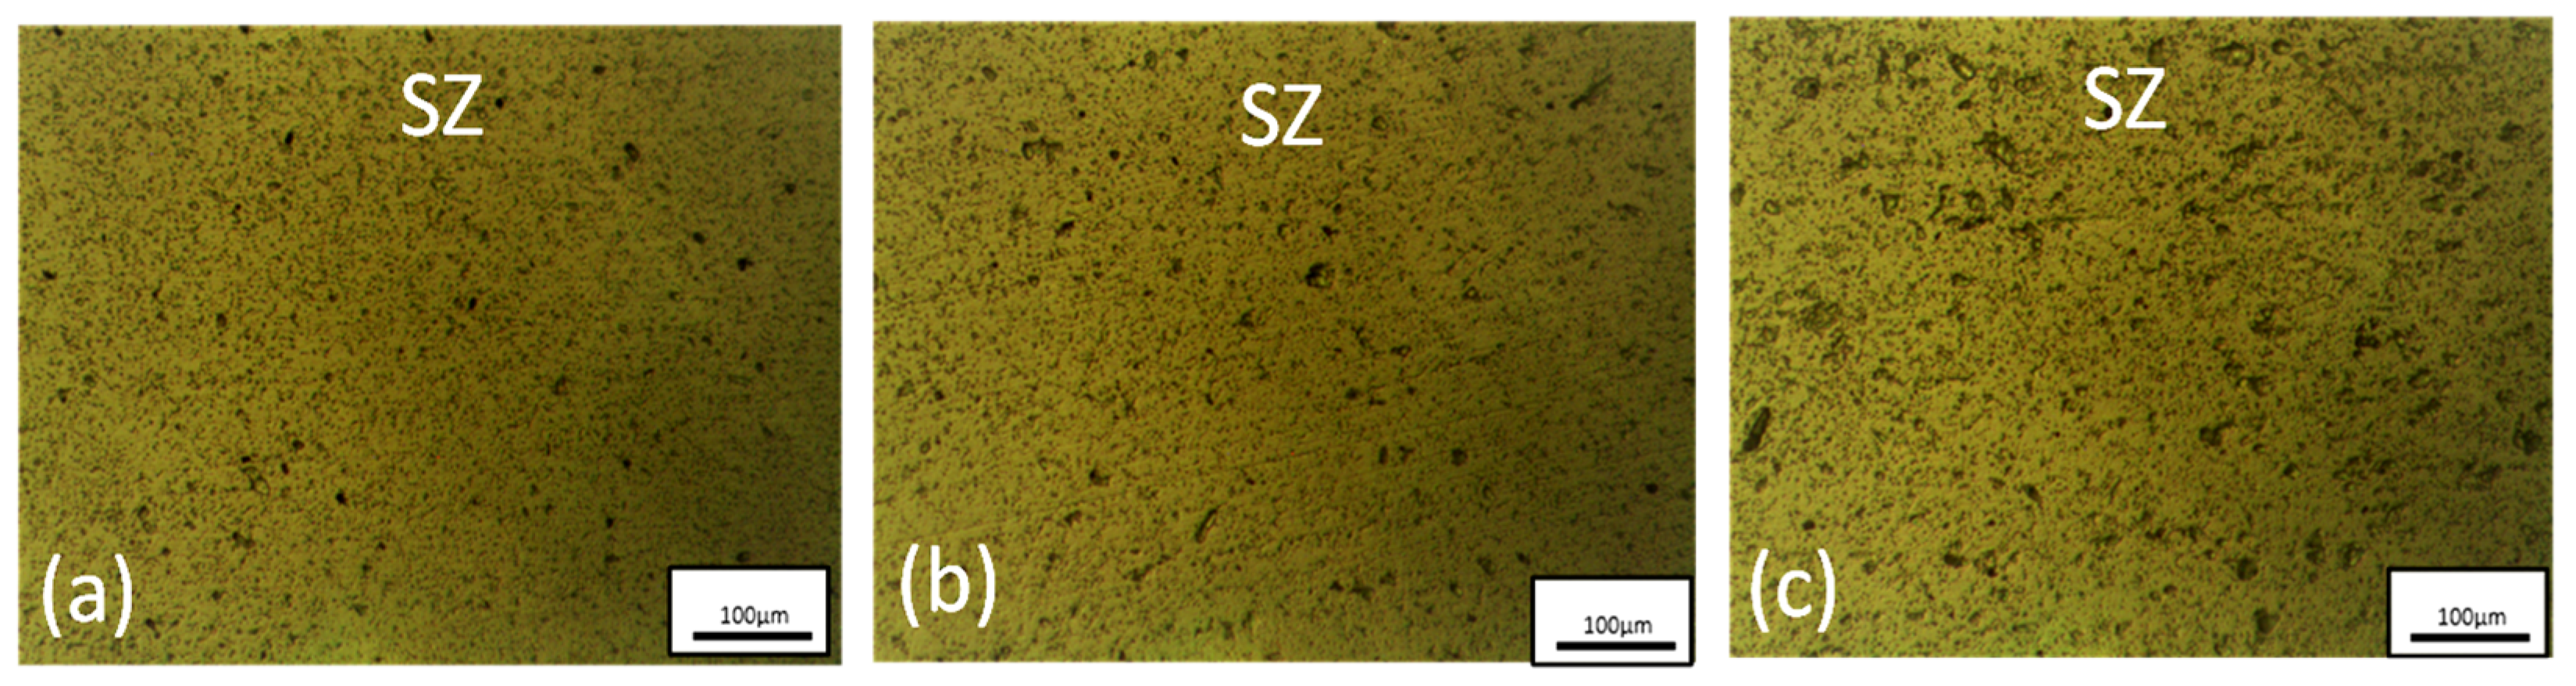
3.3. Microstructure Analysis

There are two distinct regions observed on the FSPed test samples, namely the stir zone (SZ) and the heat-affected zone (HAZ) [16]. All microstructure images of the FSPed surfaces are captured at 50× magnifications except Figure 17b,c. Microscopy images of all the tested samples that highlighting the HAZ-SZ boundary and SZ are used for comparison. The microstructure of the parent material and stir zone are shown in Figure 17. Meanwhile, Figure 17b,c shows the microstructures used for grain size measurement. The average radius of grain size for AA 6063 substrate is ranging from 110 to 130 μm, while the stir zone’s average radius of grain size is about 4 μm.
The distinctive features of the HAZ and SZ of the FSPed sample can be described based upon the microscopy image shown in Figure 18. The HAZ exposes clear features of the grains of the material after undergoing high temperatures while the SZ shows fine equiaxed grain microstructures, which have fairly uniform distribution that resulted from the dynamic recrystallization during FSP [15,29]. By reviewing the microstructure images of the FSPed samples produced using both CTH and TTH tools in Figure 19, Figure 20, Figure 21, Figure 22, Figure 23 and Figure 24, it can be noticed that the microstructure in the respective zones is more or less similar.
By observing the micrographs, it is observed that all FSPed stir zones regardless of FSP tool, spindle speed and feed rates have almost zero defects and only occasional tiny pin-hole defects. The threaded feature of both pins provides excellent mobility of the material particles, offering smooth flow transitions for consolidation and recrystallizations. Having no defects also proves that the tool design offers adequate material flow for effective plastic deformations [18].
As stated in previous research that the formation of equiaxed fine grains does contribute to superior microhardness and improved mechanical properties [17,26]. Therefore, the results on average microhardness obtained would serve as a reference for comparisons between respective microstructures. The microstructure of the pure aluminum to the microscopy images obtained from FSP is somewhat similar to that of HAZ in general. Its grains are visible but it appears to be segmented and not continuous in comparison with the sharper and more defined grains in HAZ as shown in Figure 25. Garcia-Bernal et al. [11] mentioned that the defined grain boundaries at the HAZ are the effect of precipitation due to heat treatment. In addition, the stir zone consists of fine grains formed through broken grains and recrystallization during the stirring effect of FSP. The general observation of the microstructure image at each region does conclude that smaller grains improve the microhardness and this is further justified by the microhardness results.
The microstructures of the samples with highest and lowest microhardness are compared, namely that FSPed using TTH at 1150 rpm and 30 mm/min versus that using CTH at 1200 rpm and 20 mm/min. It appears that the 1150 rpm and 30 mm/min stir zones have significantly finer grain sizes than the other as shown in Figure 26, thus justifying the extreme difference in microhardness between the two.
Next, to compare the influence of the tool geometry at constant FSP parameters, samples FSPed using both TTH and CTH tools are observed at operating parameters of 1150 rpm and 25 mm/min. The comparisons show that the TTH tool generates finer grains that are compact and uniformly distributed than the CTH tool as shown in Figure 27. This is attributed to the taper feature, which facilitates downward material flow within the stir region, producing uniformly distributed and fine grain boundaries [28].
Next, to inspect the significance of varying feed rates, stir zones of TTH FSPed samples at 1200 rpm are scrutinized. Figure 28 shows how increasing feed rates contributes to a more homogenous and dense distribution of grains across the stir zones, thus justifying improved hardness at higher feed rates.
Besides, the effect of varying the rotational speed of the CTH tool at constant feed rate of 30 mm/min can be observed in Figure 29. Microstructure images of the lowest and highest rotational speed do show a vast difference whereby at 1150 rpm, the resulting stir zones of higher microhardness are visibly more compact and uniformly distributed in equiaxed grains; whereas, at 1250 rpm, there are occasional tiny gaps between them. This finding is supported by previous work conducted by Abrahams et al. in which the lowest operating speeds resulted in a more homogenous microstructure in the stir zone regardless of the tool used [16].
The microhardness of the FSPed surface is greatly influenced by the grain size of the material. The grains and sub-grain boundaries become the primary obstacles for the slip of dislocations. Grains of the material, which are fine, homogenous, and densely compact, would have greater microhardness or strength as the composition of the grains might impose added restrictions to any dislocations [29]. Thus, the analysis of the microstructure images may serve as concrete evidence to justify the microhardness results.

4. Conclusions

From this study, FSP is capable to enhance the microhardness properties of recycled AA 6063.
TTH tool offers better results than the CTH tool and this is attributed to the downward and smoother material flow of the taper feature with minimized peak temperatures;
FSP at 1150 rpm and 30 mm/min exhibits superior microhardness as it is of the lowest spindle speed and highest feed rate among the range of parameters tested;
TTH tool offers FSPed surfaces with consistently lower Ra values, making it a smoother surface and more ideal for applications. Surfaces produced by TTH tools are not influenced by the rotational speed while higher feed rates may further improve the Ra values due to higher temperatures which may soften materials in contact with the FSP tool shoulder for a smoother finish;
CTH tool offers very poor material flow and further increasing the rotational speeds might amplify the roughness of the surface. This is true except for surfaces FSPed using CTH tool at 30 mm/min, whereby the surfaces obtained are consistent across all rotational speeds and also relatively smooth with low Ra values;
TTH tool offers better outcomes in terms of microhardness and surface roughness in comparison with CTH tool. In terms of FSP parameters, the combination of 1150 rpm and 30 mm/min produces superior and desirable outcomes.

Author Contributions

Conceptualization, K.W.L. and Y.Z.C.; methodology, K.W.L., Y.Z.C. and G.S.T.; formal analysis, K.W.L. and Y.Z.C.; investigation, K.W.L., Y.Z.C., G.S.T. and C.K.K.; resources, K.W.L.; data curation, Y.Z.C. and G.S.T.; writing—original draft preparation, K.W.L. and Y.Z.C.; writing—review and editing, K.W.L., C.K.K. and G.S.T.; supervision, K.W.L.; project administration, K.W.L.; funding acquisition, K.W.L. and C.K.K. All authors have read and agreed to the published version of the manuscript.

Funding

This research was funded by Fundamental Research Grant Scheme, [FRGS/1/2019/TK03/MMU/02/6].

Acknowledgments

This work was supported by Fundamental Research Grant Scheme (FRGS), Ministry of Higher Education, Malaysia. The authors gratefully acknowledge EL Aluminium Billet Sdn. Bhd. and Impressive Edge Sdn. Bhd. for the technical and partial financial support rendered. Special thanks to the Faculty of Engineering and Technology of Multimedia University for their support in allowing this research to be carried out.

Conflicts of Interest

The authors declare no conflict of interest.

References

  1. Wan, B.; Chen, W.; Lu, T.; Liu, F.; Jiang, Z.; Mao, M. Review of solid state recycling of aluminum chips. Resour. Conserv. Recycl. 2017, 125, 37–47. [Google Scholar] [CrossRef]
  2. Baffari, D.; Reynolds, A.P.; Masnata, A.; Fratini, L.; Ingarao, G. Friction stir extrusion to recycle aluminum alloys scraps: Energy efficiency characterization. J. Manuf. Process. 2019, 43, 63–69. [Google Scholar] [CrossRef]
  3. Rao, P.N.; Kaurwar, A.; Singh, D.; Jayaganthan, R. Enhancement in strength and ductility of Al-Mg-Si alloy by cryorolling followed by warm rolling. Procedia Eng. 2014, 75, 123–128. [Google Scholar] [CrossRef] [Green Version]
  4. Qu, J.; Xu, H.; Feng, Z.; Frederick, D.A.; An, L.; Heinrich, H. Improving the tribological characteristics of aluminum 6061 alloy by surface compositing with sub-micro-size ceramic particles via friction stir processing. Wear 2011, 271, 1940–1945. [Google Scholar] [CrossRef]
  5. Das, G.; Das, M.; Ghosh, S.; Dubey, P.; Ray, A.K. Effect of aging on mechanical properties of 6063 Al-alloy using instrumented ball indentation technique. Mater. Sci. Eng. A 2010, 527, 1590–1594. [Google Scholar] [CrossRef]
  6. Shamsudin, S.; Lajis, M.A.; Zhong, Z.W. Evolutionary in solid state recycling techniques of aluminium: A review. Procedia CIRP 2016, 40, 256–261. [Google Scholar] [CrossRef] [Green Version]
  7. Tekkaya, A.E.; Schikorra, M.; Becker, D.; Biermann, D.; Hammer, N.; Pantke, K. Hot profile extrusion of AA-6060 aluminum chips. J. Mater. Process. Technol. 2009, 209, 3343–3350. [Google Scholar] [CrossRef]
  8. Dhayalan, R.; Kalaiselvan, K.; Sathiskumar, R. Characterization of AA6063/SiC-Gr surface composites produced by FSP technique. Procedia Eng. 2014, 97, 625–631. [Google Scholar] [CrossRef] [Green Version]
  9. Li, K.; Liu, X.; Zhao, Y. Research status and prospect of friction stir processing technology. Cast 2019, 9, 129. [Google Scholar] [CrossRef] [Green Version]
  10. Sarmadi, H.; Kokabi, A.H.; Seyed Reihani, S.M. Friction and wear performance of copper–graphite surface composites fabricated by friction stir processing (FSP). Wear 2013, 304, 1–12. [Google Scholar] [CrossRef] [Green Version]
  11. García-Bernal, M.A.; Mishra, R.S.; Verma, R.; Hernández-Silva, D. Influence of friction stir processing tool design on microstructure and superplastic behavior of Al-Mg alloys. Mater. Sci. Eng. A 2016, 670, 9–16. [Google Scholar] [CrossRef]
  12. Emamikhah, A.; Abbasi, A.; Atefat, A.; Besharati Givi, M.K. Effect of tool pin profile on friction stir butt welding of high-zinc brass (CuZn40). Int. J. Adv. Manuf. Technol. 2013, 1–10. [Google Scholar] [CrossRef]
  13. Aissani, M.; Gachi, S.; Boubenider, F.; Benkedda, Y. Design and optimization of friction stir welding tool. Mater. Manuf. Process. 2010, 25, 1199–1205. [Google Scholar] [CrossRef]
  14. Ullegaddi, K.; Murthy, V.; Harsha, R.N. Manjunatha, Friction stir welding tool design and their effect on welding of AA-6082 T6. Mater. Today Proc. 2017, 4, 7962–7970. [Google Scholar] [CrossRef]
  15. Patel, V.V.; Badheka, V.; Kumar, A. Effect of polygonal pin profiles on friction stir processed superplasticity of AA7075 alloy. J. Mater. Process. Technol. 2017, 240, 68–76. [Google Scholar] [CrossRef]
  16. Abrahams, R.; Mikhail, J.; Fasihi, P. Effect of friction stir process parameters on the mechanical properties of 5005-H34 and 7075-T651 aluminium alloys. Mater. Sci. Eng. A 2019, 751, 363–373. [Google Scholar] [CrossRef]
  17. Palani, K.; Elanchezhian, C.; Vijaya Ramnath, B.; Bhaskar, G.B.; Naveen, E. Effect of pin profile and rotational speed on microstructure and tensile strength of dissimilar AA8011, AA01-T6 friction stir welded aluminum alloys. Mater. Today Proc. 2018, 5, 24515–24524. [Google Scholar] [CrossRef]
  18. Vijayavel, P.; Balasubramanian, V. Effect of pin profile volume ratio on microstructure and tensile properties of friction stir processed aluminum based metal matrix composites. J. Alloys Compd. 2017, 729, 828–842. [Google Scholar] [CrossRef]
  19. Venkata Rao, C.; Madhusudhan Reddy, G.; Srinivasa Rao, K. Influence of tool pin profile on microstructure and corrosion behaviour of AA2219 Al–Cu alloy friction stir weld nuggets. Def. Technol. 2015, 11, 197–208. [Google Scholar] [CrossRef] [Green Version]
  20. Elangovan, K.; Balasubramanian, V. Influences of pin profile and rotational speed of the tool on the formation of friction stir processing zone in AA2219 aluminium alloy. Mater. Sci. Eng. A 2007, 459, 7–18. [Google Scholar] [CrossRef]
  21. Azmal Hussain, M.; Zaman Khan, N.; Noor Siddiquee, A.; Akhtar Khan, Z. Effect of different tool pin profiles on the joint quality of friction stir welded AA 6063. Mater. Today Proc. 2018, 5, 4175–4182. [Google Scholar] [CrossRef]
  22. Yang, M.; Bao, R.-J.; Liu, X.-Z.; Song, C.-Q. Thermo-mechanical interaction between aluminum alloy and tools with different profiles during friction stir welding. Trans. Nonferrous Met. Soc. 2019, 29, 495–506. [Google Scholar] [CrossRef]
  23. Emamian, S. A review of friction stir welding pin profile. In Proceedings of the 2nd International Conference on Mechanical, Manufacturing and Process Plant Engineering, Kuala Lumpur, Malaysia, 23–24 November 2016; pp. 1–18. [Google Scholar]
  24. Muthu, M.F.X.; Jayabalan, V. Effect of pin profile and process parameters on microstructure and mechanical properties of friction stir welded Al–Cu joints. Trans. Nonferrous Met. Soc. 2016, 26, 984–993. [Google Scholar] [CrossRef]
  25. ASM International Materials Park. ASM Handbook, Heat Treating; ASM International Materials Park: Materials Park, OH, USA, 1991; pp. 841–879. [Google Scholar]
  26. Gan, W.-Y.; Zheng, Z.; Zhang, H.; Tao, P. Evolution of microstructure and hardness of aluminum after friction stir processing. Trans. Nonferrous Met. Soc. 2014, 24, 975–981. [Google Scholar] [CrossRef]
  27. Nandan, R.; DebRoy, T.; Bhadeshia, H.K.D.H. Recent advances in friction-stir welding—Process, weldment structure and properties. Prog. Mater. Sci. 2008, 53, 980–1023. [Google Scholar] [CrossRef] [Green Version]
  28. Beygi, R.; Mehrizi, M.Z.; Verdera, D.; Loureiro, A. Influence of tool geometry on material flow and mechanical properties of friction stir welded Al-Cu bimetals. J. Mater. Process. Technol. 2018, 255, 739–748. [Google Scholar] [CrossRef]
  29. Amirafshar, A.; Pouraliakbar, H. Effect of tool pin design on the microstructural evolutions and tribological characteristics of friction stir processed structural steel. Measurement 2015, 68, 111–116. [Google Scholar] [CrossRef]
Figure 1. Recycled AA 6063 substrate, (a) schematic diagram and (b) actual substrate.
Metals 11 01695 g001
Figure 2. Schematic diagram of FSP Tools, (a) Straight Cylindrical Threaded (CTH) and (b) Taper Threaded (TTH).
Metals 11 01695 g002
Figure 3. FSP of recycled AA 6063.
Metals 11 01695 g003
Figure 4. (a) Steady-state region of FSPed surface and (b) schematic diagram of testing sample for microhardness and microstructure test.
Metals 11 01695 g004
Figure 5. (a) Photograph of sample top view and (b) schematic diagram of sample sectional view with location number of indentations taken for the microhardness test.
Metals 11 01695 g005
Figure 6. Average microhardness versus rotational speed and feed rate for TTH and CTH tool.
Metals 11 01695 g006
Figure 7. Stir zone microhardness of FSPed sample produced at, (a) 1150 rpm, (b) 1200 rpm, and (c) 1250 rpm using TTH tool with different feed rates.
Metals 11 01695 g007
Figure 8. Stir zone microhardness of FSPed sample produced at, (a) 1150 rpm, (b) 1200 rpm, and (c) 1250 rpm using CTH tool with different feed rates.
Metals 11 01695 g008
Figure 9. (a) Arithmetic roughness, Ra, (b) Skewness, Rsk, and (c) average peak-valley, Rz, value for FSP using 1150 rpm and TTH tool at different feed rates.
Metals 11 01695 g009
Figure 10. (a) Arithmetic roughness, Ra, (b) skewness, Rsk, and (c) average peak-valley, Rz, value for FSP using 1200 rpm and TTH tool at different feed rates.
Metals 11 01695 g010
Figure 11. (a) Arithmetic roughness, Ra, (b) skewness, Rsk, and (c) average peak-valley, Rz, value for FSP using 1250 rpm and TTH tool at different feed rates.
Metals 11 01695 g011
Figure 12. (a) Arithmetic roughness, Ra, (b) skewness, Rsk, and (c) average peak-valley, Rz, value for FSP using 1150 rpm and CTH tool at different feed rates.
Metals 11 01695 g012
Figure 13. (a) Arithmetic roughness, Ra, (b) skewness, Rsk, and (c) average peak-valley, Rz, value for FSP using 1200 rpm and CTH tool at different feed rates.
Metals 11 01695 g013
Figure 14. (a) Arithmetic roughness, Ra, (b) skewness, Rsk, and (c) average peak-valley, Rz, value for FSP using 1250 rpm and CTH tool at different feed rates.
Metals 11 01695 g014
Figure 15. Comparison between Set A and Set B using TTH tool at, (a) 1150 rpm, 25 mm/min, (b) 1200 rpm, 30 mm/min, and (c) 1250 rpm, 20 mm/min.
Metals 11 01695 g015
Figure 16. Comparison between Set A and B using CTH tool at, (a) 1150 rpm, 30 mm/min, (b) 1200 rpm, 20 mm/min, and (c) 1250 rpm, 25 mm/min.
Metals 11 01695 g016
Figure 17. Microstructure of AA 6063 substrate at magnification of (a) 50×, (b) 10×, and (c) stir zone (SZ) at 10×.
Metals 11 01695 g017
Figure 18. Micrograph (50×) showing distinctive features of the HAZ and SZ.
Metals 11 01695 g018
Figure 19. Microstructure of FSPed surface using TTH tool at 1150 rpm for feed rates of, (a) 20 mm/min, (b) 25 mm/min, and (c) 30 mm/min of different regions, whereby (a-Ic-I) is HAZ-SZ boundary and (a-IIc-II) is the SZ.
Metals 11 01695 g019
Figure 20. Microstructure of FSPed surface using TTH tool at 1200 rpm for feed rates of, (a) 20 mm/min, (b) 25 mm/min, and (c) 30 mm/min of different regions, whereby (a-Ic-I) is HAZ-SZ boundary and (a-IIc-II) is the SZ.
Metals 11 01695 g020
Figure 21. Microstructure of FSPed surface using TTH tool at 1250 rpm for feed rates of, (a) 20 mm/min, (b) 25 mm/min, and (c) 30 mm/min of different regions, whereby (a-Ic-I) is HAZ-SZ boundary and (a-IIc-II) is the SZ.
Metals 11 01695 g021
Figure 22. Microstructure of FSPed surface using CTH tool at 1150 rpm for feed rates of, (a) 20 mm/min, (b) 25 mm/min, and (c) 30 mm/min of different regions, whereby (a-Ic-I) is HAZ-SZ boundary and (a-IIc-II) is the SZ.
Metals 11 01695 g022
Figure 23. Microstructure of FSPed surface using CTH tool at 1200 rpm for feed rates of, (a) 20 mm/min, (b) 25 mm/min, and (c) 30 mm/min of different regions, whereby (a-Ic-I) is HAZ-SZ boundary and (a-IIc-II) is the SZ.
Metals 11 01695 g023
Figure 24. Microstructure of FSPed surface using CTH tool at 1250 rpm for feed rates of, (a) 20 mm/min, (b) 25 mm/min, and (c) 30 mm/min of different regions, whereby (a-Ic-I) is HAZ-SZ boundary and (a-IIc-II) is the SZ.
Metals 11 01695 g024
Figure 25. Microscopy image of, (a) parent material and (b) HAZ using TTH tool at 1200 rpm, 25 mm/min.
Metals 11 01695 g025
Figure 26. Microscopy image of, (a) SZ at 1150 rpm, 30 mm/min and (b) SZ at 1200 rpm, 20 mm/min.
Metals 11 01695 g026
Figure 27. Microscopy image of SZ at 1150 rpm and 25 mm/min for, (a) TTH and (b) CTH.
Metals 11 01695 g027
Figure 28. Microscopy images of SZ at, (a) 20 mm/min, (b) 25 mm/min, (c) 30 mm/min and HAZ-SZ boundary at (d) 20 mm/min, (e) 25 mm/min, and (f) 30 mm/min.
Metals 11 01695 g028
Figure 29. Microscopy image of SZ at, (a) 1150 rpm, (b) 1200 rpm, and (c) 1250 rpm using CTH tool at 30 mm/min feed rate.
Metals 11 01695 g029
Table 1. Chemical composition of recycled AA 6063 (wt %).
SiFeCuMnMgCrNiZnTiAl
0.4300.3090.03380.02520.5610.03350.03330.03310.269Balance
Table 2. Maximum arithmetic roughness (Ra), skewness (Rsk), and average peak-valley (Rz) values produced by different processing parameters with different FSP tool pin geometry.
FSP ParametersTaper Threaded ToolCylindrical Threaded Tool
Rotational Speed (RPM)Feed Rate
(mm/min)
Max. Ra
(µm)
Max. Rsk
(µm)
Max. Rz
(µm)
Max. Ra
(µm)
Max. Rsk
(µm)
Max. Rz
(µm)
1150201.9720.83214.184.5330.74229.65
1150252.1432.27322.462.3130.57843.41
1150302.7141.00518.283.8930.71824.28
1200202.0820.78617.146.8781.29041.28
1200251.9140.99412.708.8491.14151.28
1200302.4040.93014.262.0370.86314.70
1250201.8511.86413.4918.360.88584.89
1250251.9952.16117.2111.901.39959.24
1250302.7010.24917.363.0741.58919.49
Publisher’s Note: MDPI stays neutral with regard to jurisdictional claims in published maps and institutional affiliations.

