Article

Modeling and Simulation of Non-Uniform Electrolytic Machining Based on Cellular Automata

1
College of Mechanical and Electrical Engineering, Zhongkai University of Agriculture and Engineering, Guangzhou 510225, China
2
College of Mechanical and Electrical Engineering, Guangdong University of Technology, Guangzhou 510006, China
*
Author to whom correspondence should be addressed.
Metals 2021, 11(11), 1694; https://doi.org/10.3390/met11111694
Submission received: 14 September 2021 / Revised: 17 October 2021 / Accepted: 21 October 2021 / Published: 24 October 2021
(This article belongs to the Special Issue Surface Modification Technology in Metals)

Abstract

:
Porous microstructure is a common surface morphology that is widely used in antifouling, drag reduction, adsorption, and other applications. In this paper, the lattice gas automata (LGA) method was used to simulate the non-uniform electrochemical machining of porous structure at the mesoscopic level. In a cellular space, the metal and the electrolyte were separated into orderly grids, the migration of corrosive particles was determined by an electric field, and the influences of the concentration gradient and corrosion products were considered. It was found that different pore morphologies were formed due to the competition between dissolution and diffusion. When the voltage was low, diffusion was sufficient, and no deposit was formed at the bottom of the pore. The pore grew faster along the depth and attained a cylindrical shape with a large depth-to-diameter ratio. As the voltage increased, the dissolution rates in all directions were the same; therefore, the pore became approximately spherical. When the voltage continued to increase, corrosion products were not discharged in time due to the rapid dissolution rate. Consequently, a sedimentary layer was formed at the bottom of the pore and hindered further dissolution. In turn, a disc-shaped pore with secondary pores was formed. The obtained simulation results were verified by experimental findings. This study revealed the causes of different morphologies of pores, which has certain guiding significance for non-uniform electrochemical machining.

Graphical Abstract

1. Introduction

Stainless steel has good physical properties, process properties, and corrosion resistance, and it is widely used in industrial production and daily life. With the reduction in research scale, it has been widely used in the field of micromachinery, such as microfluid transport, biomedical, and other aspects. Surface microstructure can improve surface properties. For example, due to its small surface density and large specific surface area, porous surface has good characteristics in antifouling [1,2], drag reduction [3,4], and adsorption [5,6].
The machining technology of porous surface should consider not only quality, but also efficiency and economy. At present, there are many reports on the processing methods of porous surfaces, which can be divided into two categories: one is point by point processing, and the other is batch processing. Point-by-point methods, such as laser processing [7,8,9], are not suitable for large-area manufacturing due to their high cost and low efficiency. Batch processing includes the template method and the non-template method. The template method is to copy the microstructure with a template, such as the electrochemical method, the corrosion method, etc. [10,11]. This kind of method is complicated and restricted by the size of the template. Non-template methods include anodic oxidation [12,13,14] and dealloying [15,16,17,18,19]. Anodic oxidation is economical, but it is only suitable for metals with porous oxides, such as aluminum, titanium, and magnesium. However, the porous structure processed by dealloying is not only on the surface but also inside the material, and it is only suitable for the alloy with a large potential electrode difference.
Stainless steel is a passive metal and is prone to pitting on the surface. This is a typical electrochemical localized corrosion. It is generally believed that pitting is destructive, so the research on stainless steel pitting mainly focuses on how to avoid it. According to the previous research, it is found that the formation of small pores can be promoted by an external electric field, which can be used for surface porous microstructure processing. However, current studies on electrochemistry mainly focus on polishing and molding. Little attention has been paid to the area between passivation and transpassivation [20,21,22,23,24]. Previous reports reveal that non-uniform corrosion generally occurs in this area and forms pores. Moreover, an electric field can promote the formation of a large number of pores [25,26].
In order to explore the relationship between pore morphologies and processing parameters, the formation process of pores has been simulated extensively. Previous researchers performed the simulation of electrochemical machining at the macroscopic level and ignored the effects of polarization and the concentration gradient [27,28,29]. It was assumed that dissolution only occurred by the electric field of the machining gap and that the process was uniform. For non-uniform electrochemical machining, the electric field was weak and there was no strong convective mass transfer effect. The transport of particles mainly depended on diffusion, so the polarization effect and concentration gradient could not be ignored [30,31]. Microscopic simulations, such as molecular dynamics, can describe the dissolution phenomenon at the atomic or electronic level; however, for tens of micrometer-scale pores, the current calculation level cannot meet the requirement. Therefore, mesoscopic simulations are more suitable to describe local corrosion. The existing mesoscopic scale simulation (pitting simulation) only considers the dissolution reaction of corrosive particles [32,33,34,35,36,37,38] and makes the simulation process simple without considering the effects of the concentration gradient and product particles [39,40]; however, this is quite different from the actual situation. In addition, an external electric field is required in this method. Thus, the dissolution rate must be associated with the electric field, and product particles and concentration gradients must be considered.
Lattice gas automata (LGA) is a mathematical model that is developed from cellular automata for liquid simulation. It is a discrete model of space, time, and state. It converts a complex system into a large number of simple grids through model abstraction and rule definition and then simulates them through iterative operations. In comparison to traditional modeling methods, LGA uses only simple evolution rules rather than establishing and solving complex differential equations. Therefore, it is more suitable to simulate a non-uniform electrochemical process.

2. Theoretical Basis for Model Construction

2.1. Mass Transfer

The theoretical basis of electrochemical processing is material transmission. According to the mass transfer equation of an electrochemical reaction system, the total transport N t , k of particle k at a distance x from the surface can be expressed as
N t , k = D k c k ( x ) x z k F R T D k c k ϕ ( x ) x + c k v ( x )
where N t , k is the total transport of particle k ,
  • D k is the diffusion coefficient of particle k ( m 2 / s ),
  • c k is the concentration of particle k ( mol / L ),
  • z k is the charge number of particle k ,
  • F is the Faraday’s constant (96,500 A · s / mol ),
  • R is the gas constant (8.313 J/mol),
  • T is temperature (K),
  • ϕ is voltage (V), and
  • v is convection velocity ( m / s ).
The concentration change of particle k in a volume unit is related to the change in flux density and chemical reactions.
d c k d t = N t , k + υ k
where υ k is the molar mass of particle k generated and consumed in microelements.
The concentration change rate in a volume unit can be expressed as
c k t = D k 2 c k v c k + z k D k F R T ( ϕ c k ) + G R
where G R is the concentration change caused by chemical reactions.

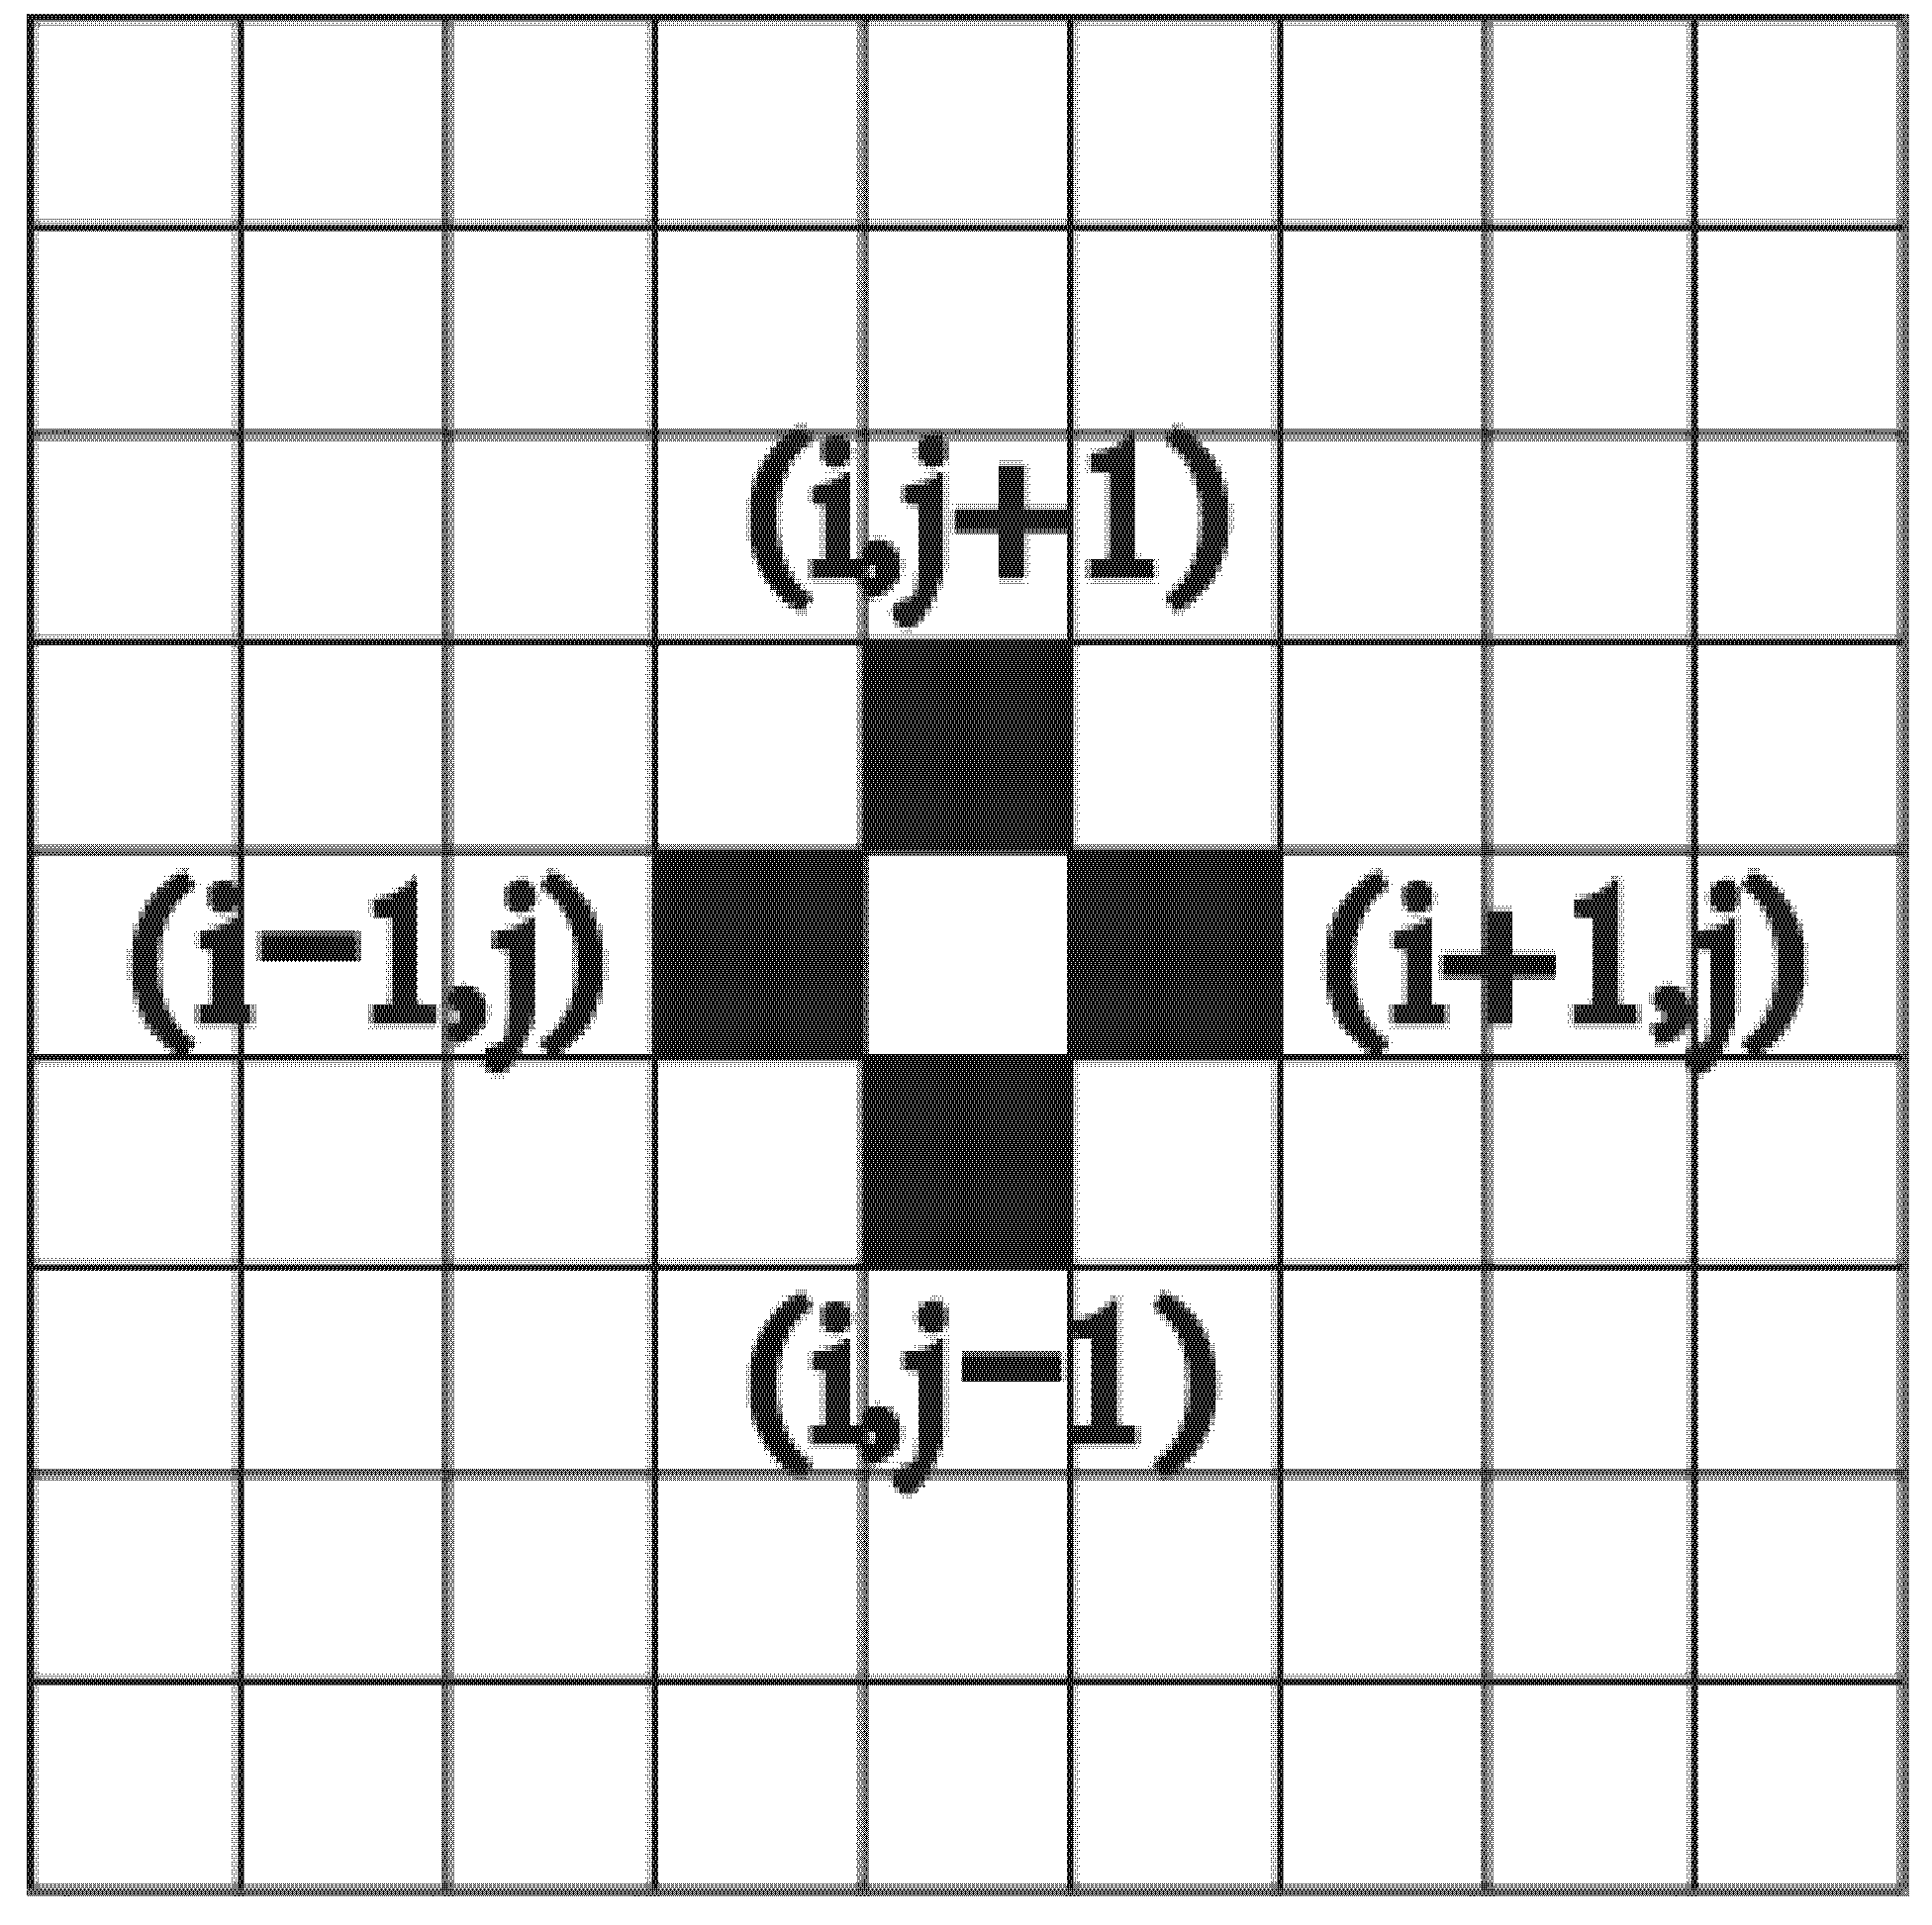
2.2. Particle Migration

Migration and collision are the two basic processes of particle evolution. Migration is the movement of a particle along its velocity direction to the nearest node. The motion state of a single particle can be expressed as
e a σ = c σ [ cos ( 2 π a / 4 ) , sin ( 2 π a / 4 ) ]
where a = { 1 , 2 ,   3 ,   4 } is the possible velocity direction of the particle,
  • σ is the type of the particle,
  • c σ is particle velocity, and
  • e a σ is the velocity vector of the particle.
The state of the node x at time t can be represented as a collection of the motion states of all particles.
s ( x , t ) = { n a σ ( x , t ) e a σ }
where n a σ ( x , t ) defines the presence of σ particles in the a direction of the node x at time t .
During a collision, when multiple particles simultaneously receive a node, they move according to pre-set rules. The state of particles before and after a collision must obey the conservation equations of mass, momentum, and energy.
Mass conservation equation:
( a n a σ m σ ) b e f o r e = ( a n a σ m σ ) a f t e r
Momentum conservation equation:
( a , σ n a σ p a σ ) b e f o r e = ( a , σ n a σ p a σ ) a f t e r
Energy conservation equation:
( a , σ n a σ ε σ ) b e f o r e = ( a , σ n a σ ε σ ) a f t e r
In order to obtain the result of the entire cell, microscopic particles must be counted. The total particle equation can be expressed as
N = a , σ n a σ

2.3. Preconditions

In the present work, pore dissolution was simulated in a two-dimensional space. The study was carried out in a static liquid, and convection was not considered. The model was developed based on the following assumptions.
(1)
A corrosion point already existed at the beginning of the simulation.
(2)
A passivation film hindered corrosion.
(3)
Particles moved by the concentration difference and the electric field and also obeyed the mass transfer equation of electrochemistry.
(4)
Electrochemical reactions were not considered during particle motion. Boundary conditions were used to simulate the dissolution of particles, the disappearance of the substrate, and the generation of product particles.

2.4. Calculation Process

The flowchart of the simulation is presented in Figure 1.

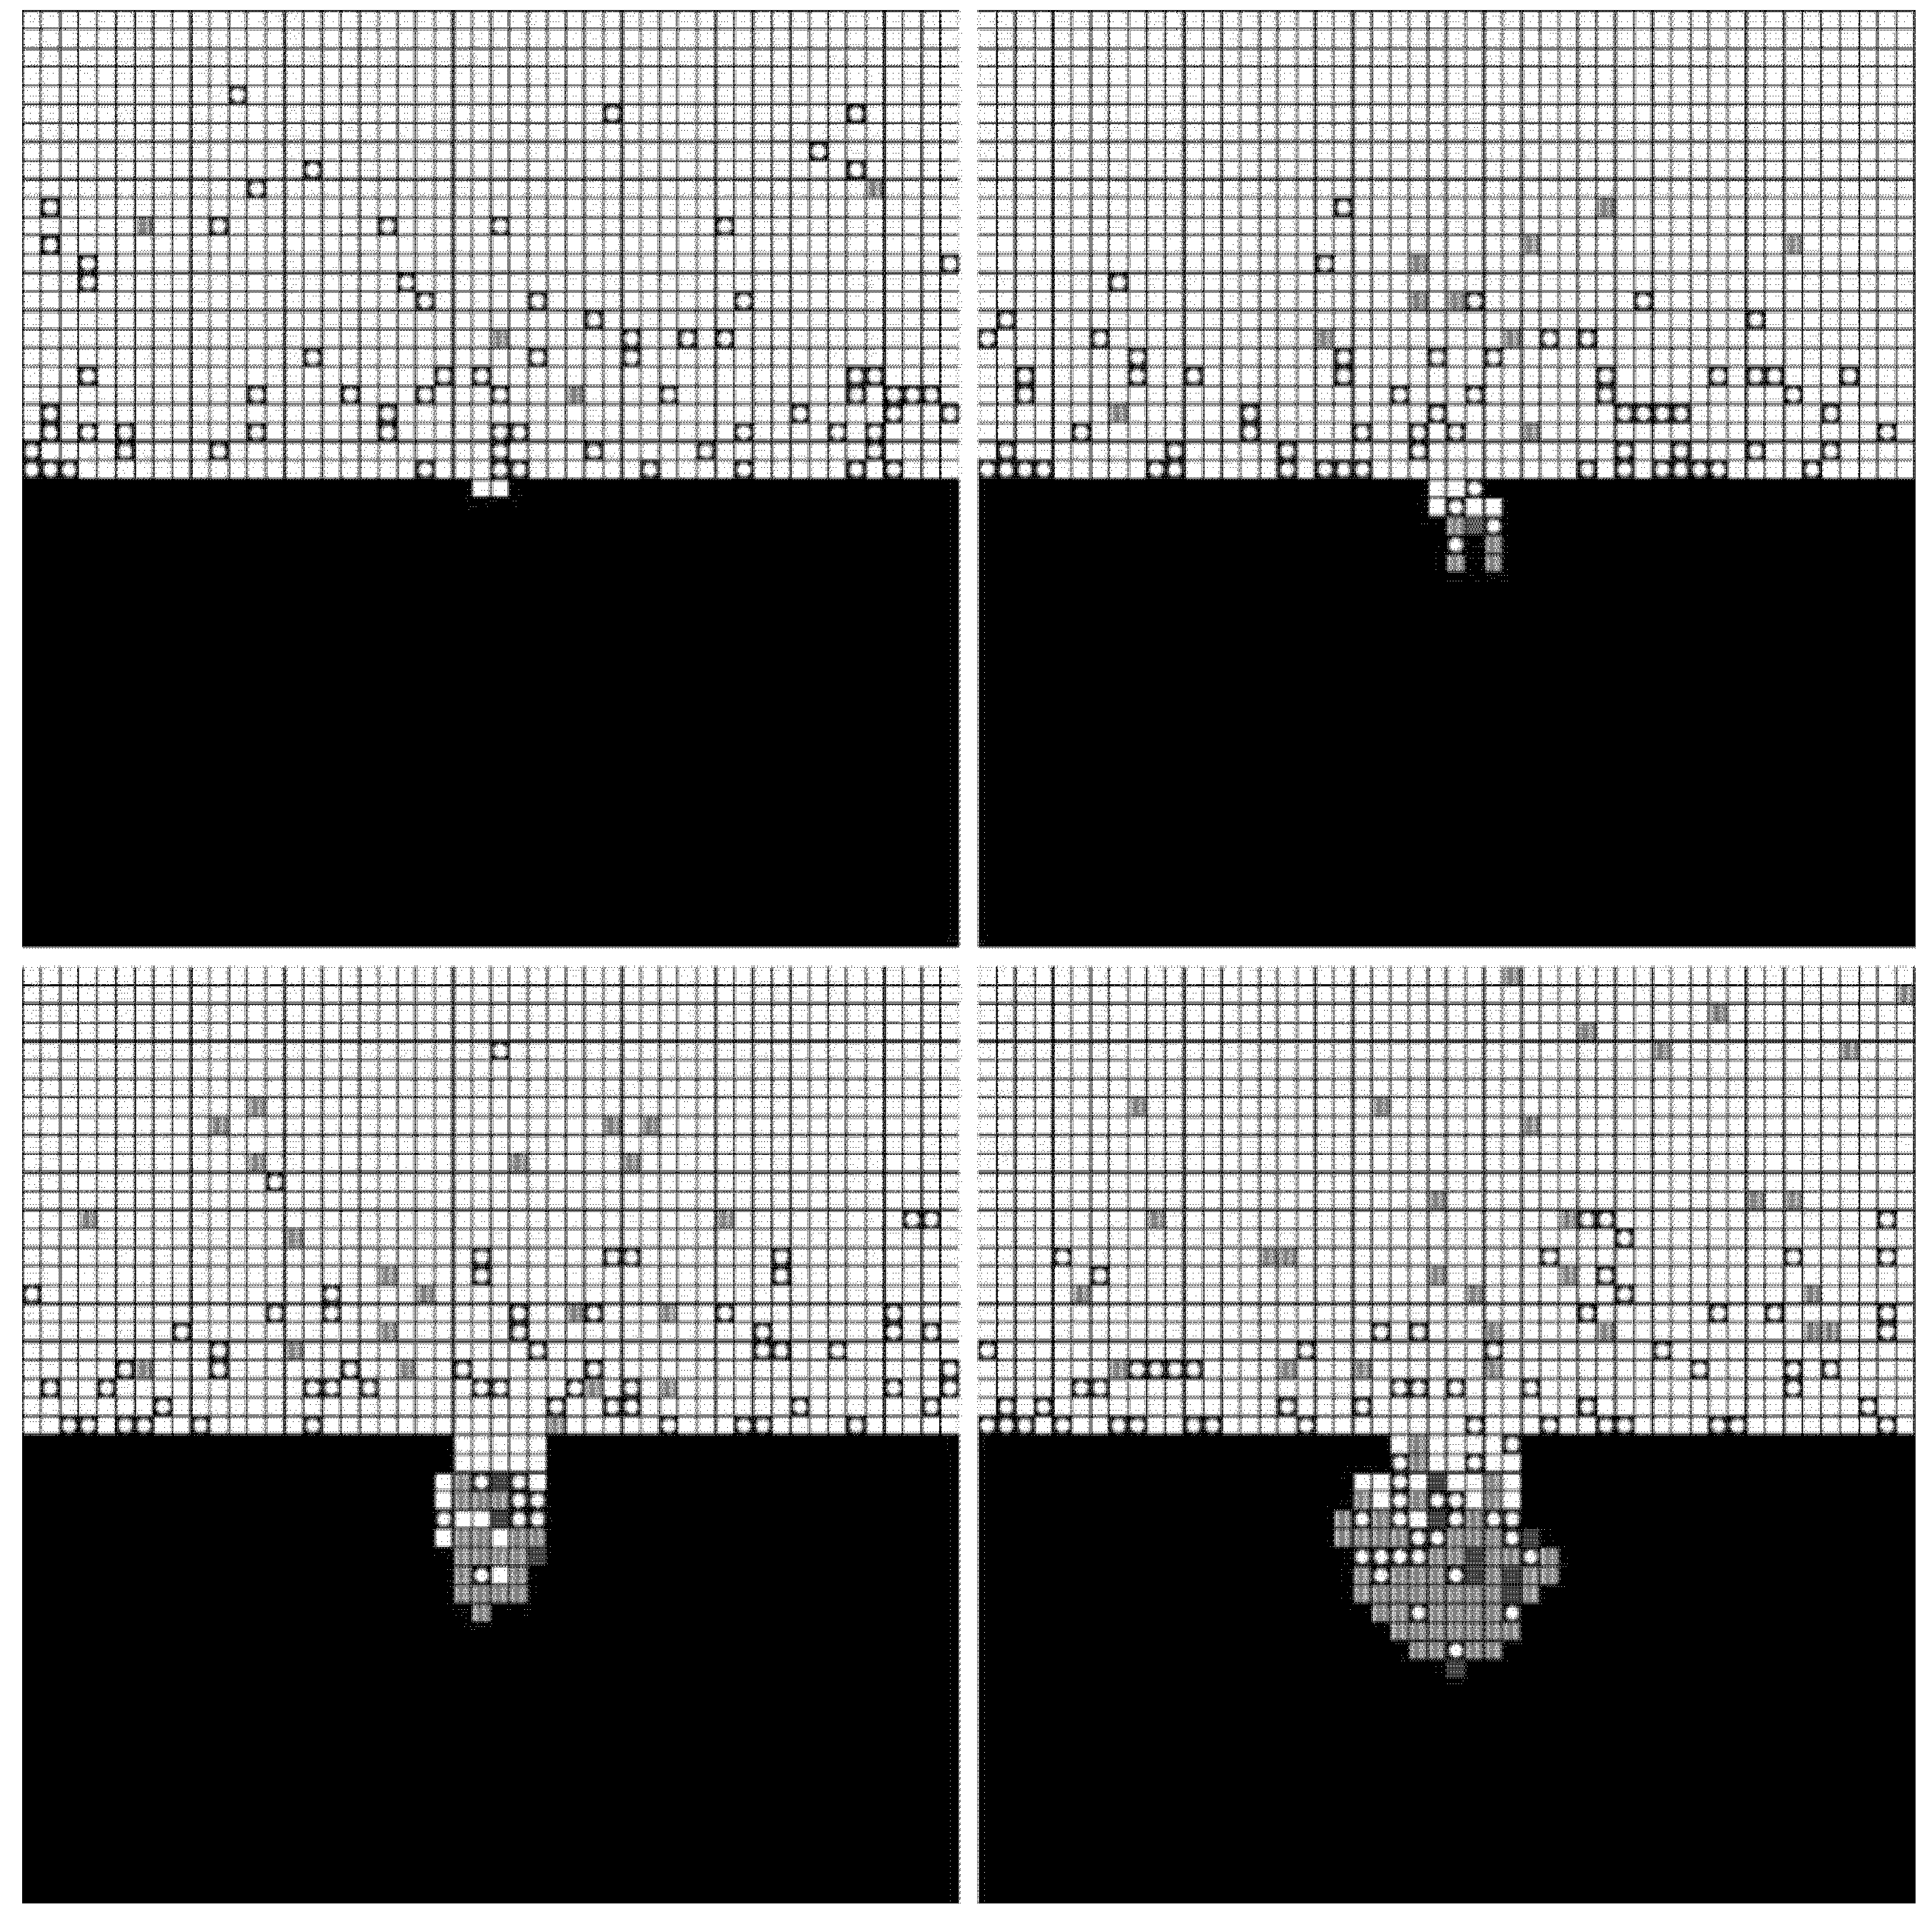
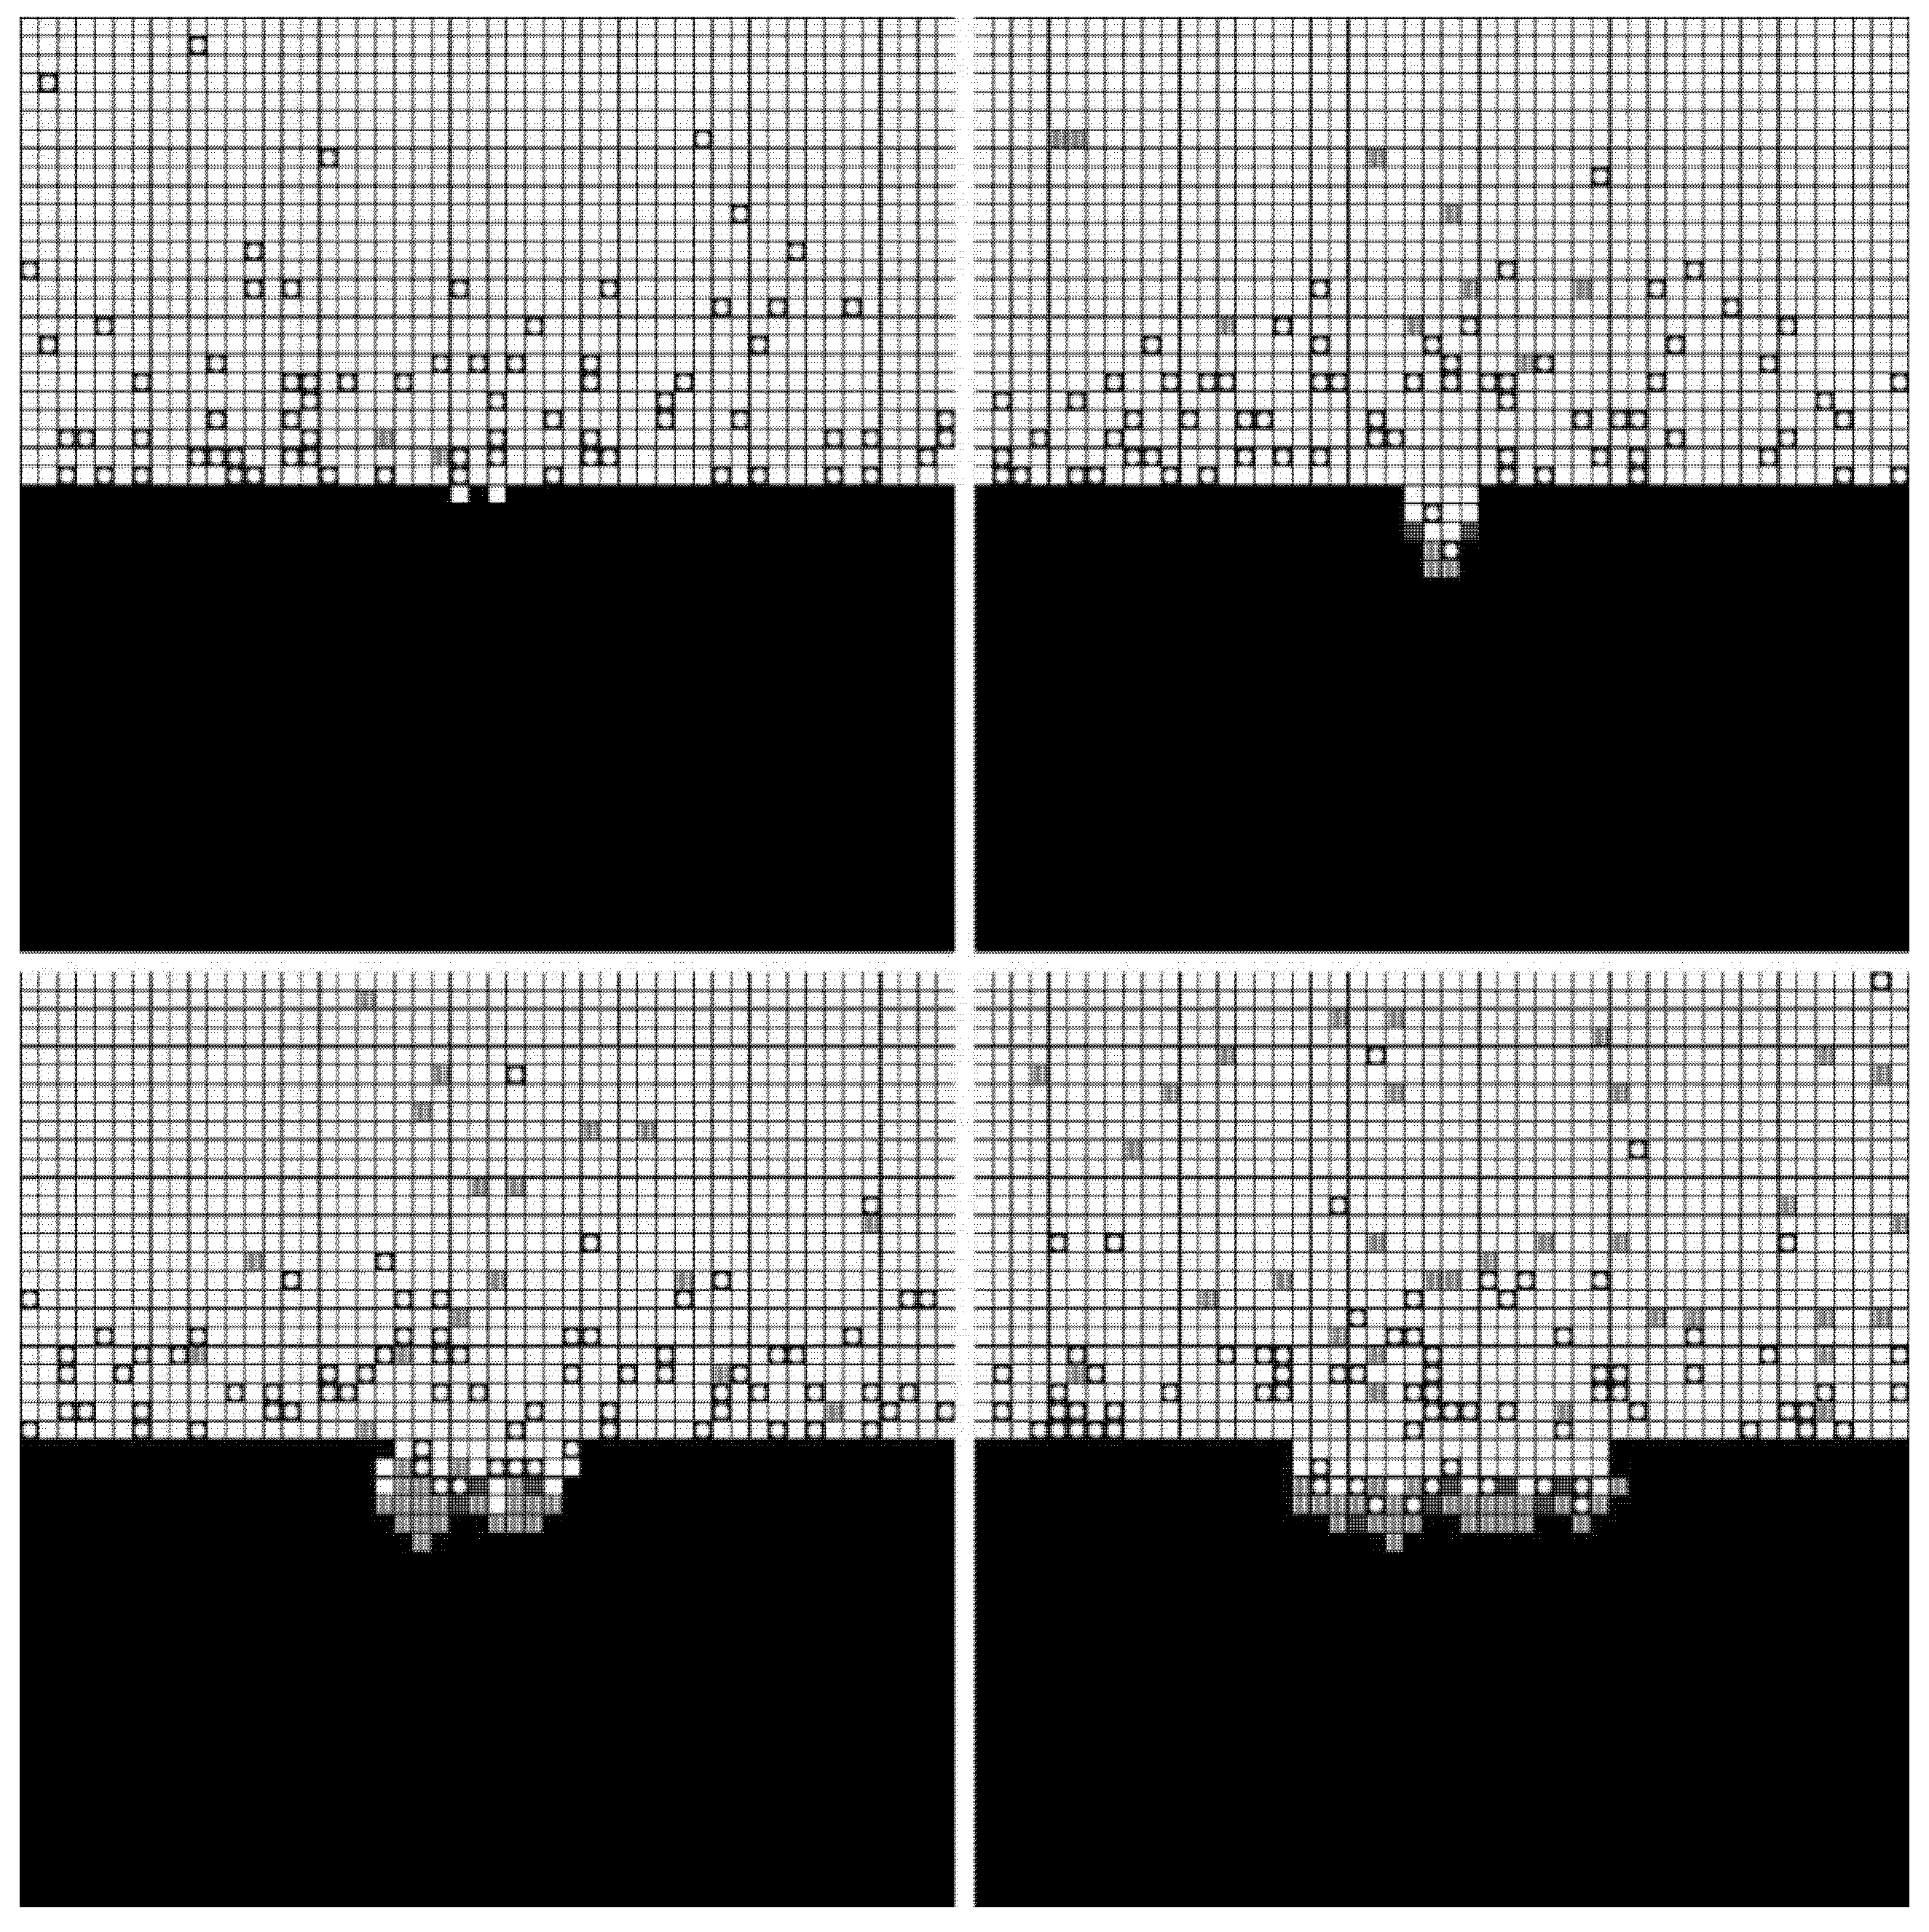
3. Numerical Simulation

3.1. Physical Model

A two-dimensional space was used to simulate the growth of a single pore. The metal, passivation, electrolyte, and corrosion products in the system were described by lattices, which used a two-dimensional array to define the state and direction of particle motion.
State represents the properties of a lattice, which is a collection of particles. The lattice was described as a phase with the highest concentrations of A, B, C, F, and M particles, where A is the particle that did not participate in the anodic reaction, B is the reaction particle, C is the product particle, F is passivation, and M is the substrate (Figure 2).
Orientation represents the moving direction of a lattice. In the present study, five different values were considered to define the orientation of the lattice: 0 for stationary, 1 for moving up, 2 for moving left, 3 for moving down, and 4 for moving right.
The lattice could change its state and orientation in each time step according to the evolution rule.

3.2. Calculation Rules

A two-dimensional lattice gas model space ECM = (Ad, S, N, f) was established, where A is the lattice gas space, d is the space dimension, S is the lattice state set, N = (S1, S2, …, Sn) define adjacent spaces, n is the number of adjacent lattices, and f is the state transition function.
The local evolution rule was used to describe any change in the lattice state. The Von Neumann-type neighborhood was employed according to Figure 3, where the state of a lattice is determined by the states of its four neighbors A ( i 1 , j ) , A ( i + 1 , j ) , A ( i , j 1 ) , A ( i , j + 1 ) .
The moving rules of different particles in the lattice space were defined as follows: particles F and M did not migrate, particles A and C migrated by the concentration difference, and particle B migrated by the concentration difference and the electric field.
The concentration distribution of a particle can be expressed as c k ( x , y , t ) ; therefore, the total particle concentration is
c = c k ( x , y , t )
If the concentration of particles does not change with time, then
c t = 0
Otherwise, the concentration gradient is
c = i c x + j c y
(1)
Free diffusion
The change rate of particle concentration caused by free diffusion in a unit volume can be defined as
( c i , j t + 1 c i , j t ) d = Δ t D ( Δ x ) 2 ( c i 1 , j + c i + 1 , j + c i , j 1 + c i , j + 1 4 c i , j )
(2)
Particle migration
Particle B was charged, and it also migrated by the external electric field. The concentration change of particle B caused by electromigration can be expressed as
( c i , j t + 1 c i , j t ) t o t a l = ( c i , j t + 1 c i , j t ) d ± ( c B i , j t + 1 c B i , j t ) m

3.3. Initial and Boundary Conditions

(1)
Initial conditions
Interelectrode voltage = E
The potential of each lattice is
i , j = { ( E | A ( i , j ) = ( M , : ) ) ( 0 | j = m a x ( j ) ) { j m a x ( j | A ( i , j ) = ( M , : ) ) max ( j ) m a x ( j | A ( i , j ) = ( M , : ) ) E } i = 1 , 2 ,
The initial concentrations of particles A, B, and C are c 0 A , c 0 B , and 0, respectively.
Therefore, the total particle concentration in the solution is
c 0 i , j = ( c 0 A + c 0 B | A ( i , j ) ( M , : ) )
The total particle concentration in the substrate is
( c 0 i , j = c M = 100 % | A ( i , j ) = ( M , : ) )
(2)
Boundary conditions
A semi-infinite boundary was used at the upper boundary (the cathode), and a periodic boundary was used in the left and right sides of the electrolyte.
The interface between the electrolyte and the substrate was an electrochemical anodic dissolution zone. Particle B reacted with particle M to become particle C or F. The charge was conserved during the entire reaction process.
According to Faraday’s law, the formation rate of particle C was related to the total current intensity I.
G C = I ε 1 v c n C F
The concentration of particle C in the boundary lattice increased to
( c C i , j t + 1 c C i , j t ) b = Δ t ε I ν C ( ϕ i 1 , j + ϕ i + 1 , j 2 ϕ i , j ) n C R s o l F ( Δ x ) 2
The dissolution rate of particle B can be calculated as
G B = I ε 1 v B n B F
The concentration loss of particle B can be calculated as
( c B i , j t + 1 c B i , j t ) b = Δ t ε I ν B ( ϕ i 1 , j + ϕ i + 1 , j 2 ϕ i , j ) n B R s o l F ( Δ x ) 2
Based on the redox reaction equation, the electrochemical impedance of the electrolyte can be calculated as
N B n B = ( N C + N F ) n c
Therefore, the formation rate of particle F can be calculated as
G F = n B n c G B G C
The concentration of particle F varied according to the following equation:
( c F i , j t + 1 c F i , j t ) b = Δ t ε I ( ν B ν C ) ( ϕ i 1 , j + ϕ i + 1 , j 2 ϕ i , j ) R s o l F n C ( Δ x ) 2
During the entire process, the anode maintained a constant potential.
φ i , j = E | A ( i , j ) = ( M , : )

3.4. Results

Numerical simulations of pore formation were carried out at different voltages (4 V, 5 V, and 6 V). The number of lattices in the simulated space was 100 × 100, and the number of calculation steps was 1000. The constants involved in the simulations are presented in Table 1.
The forming processes and morphologies of the pore at different voltages are displayed in Figure 4, Figure 5 and Figure 6.
The simulation results show that pore morphologies include three cases. When the voltage was low, the growth rate of the pore along the transverse direction was obviously higher than that of the longitudinal direction. The ratio of depth to diameter of the pore was large, and it was approximately cylindrical. (Figure 4) With the increase of the voltage, the growth rate along the transverse direction increased, which was equivalent to the longitudinal direction. Its morphology was close to spherical. (Figure 5) When the voltage continued to increase, the growth rate along the transverse direction was faster than that of the longitudinal direction, and the pore presented a shallow dish shape. (Figure 6).

4. Validation Test

In order to verify the obtained simulation results, the following experiment was carried out.

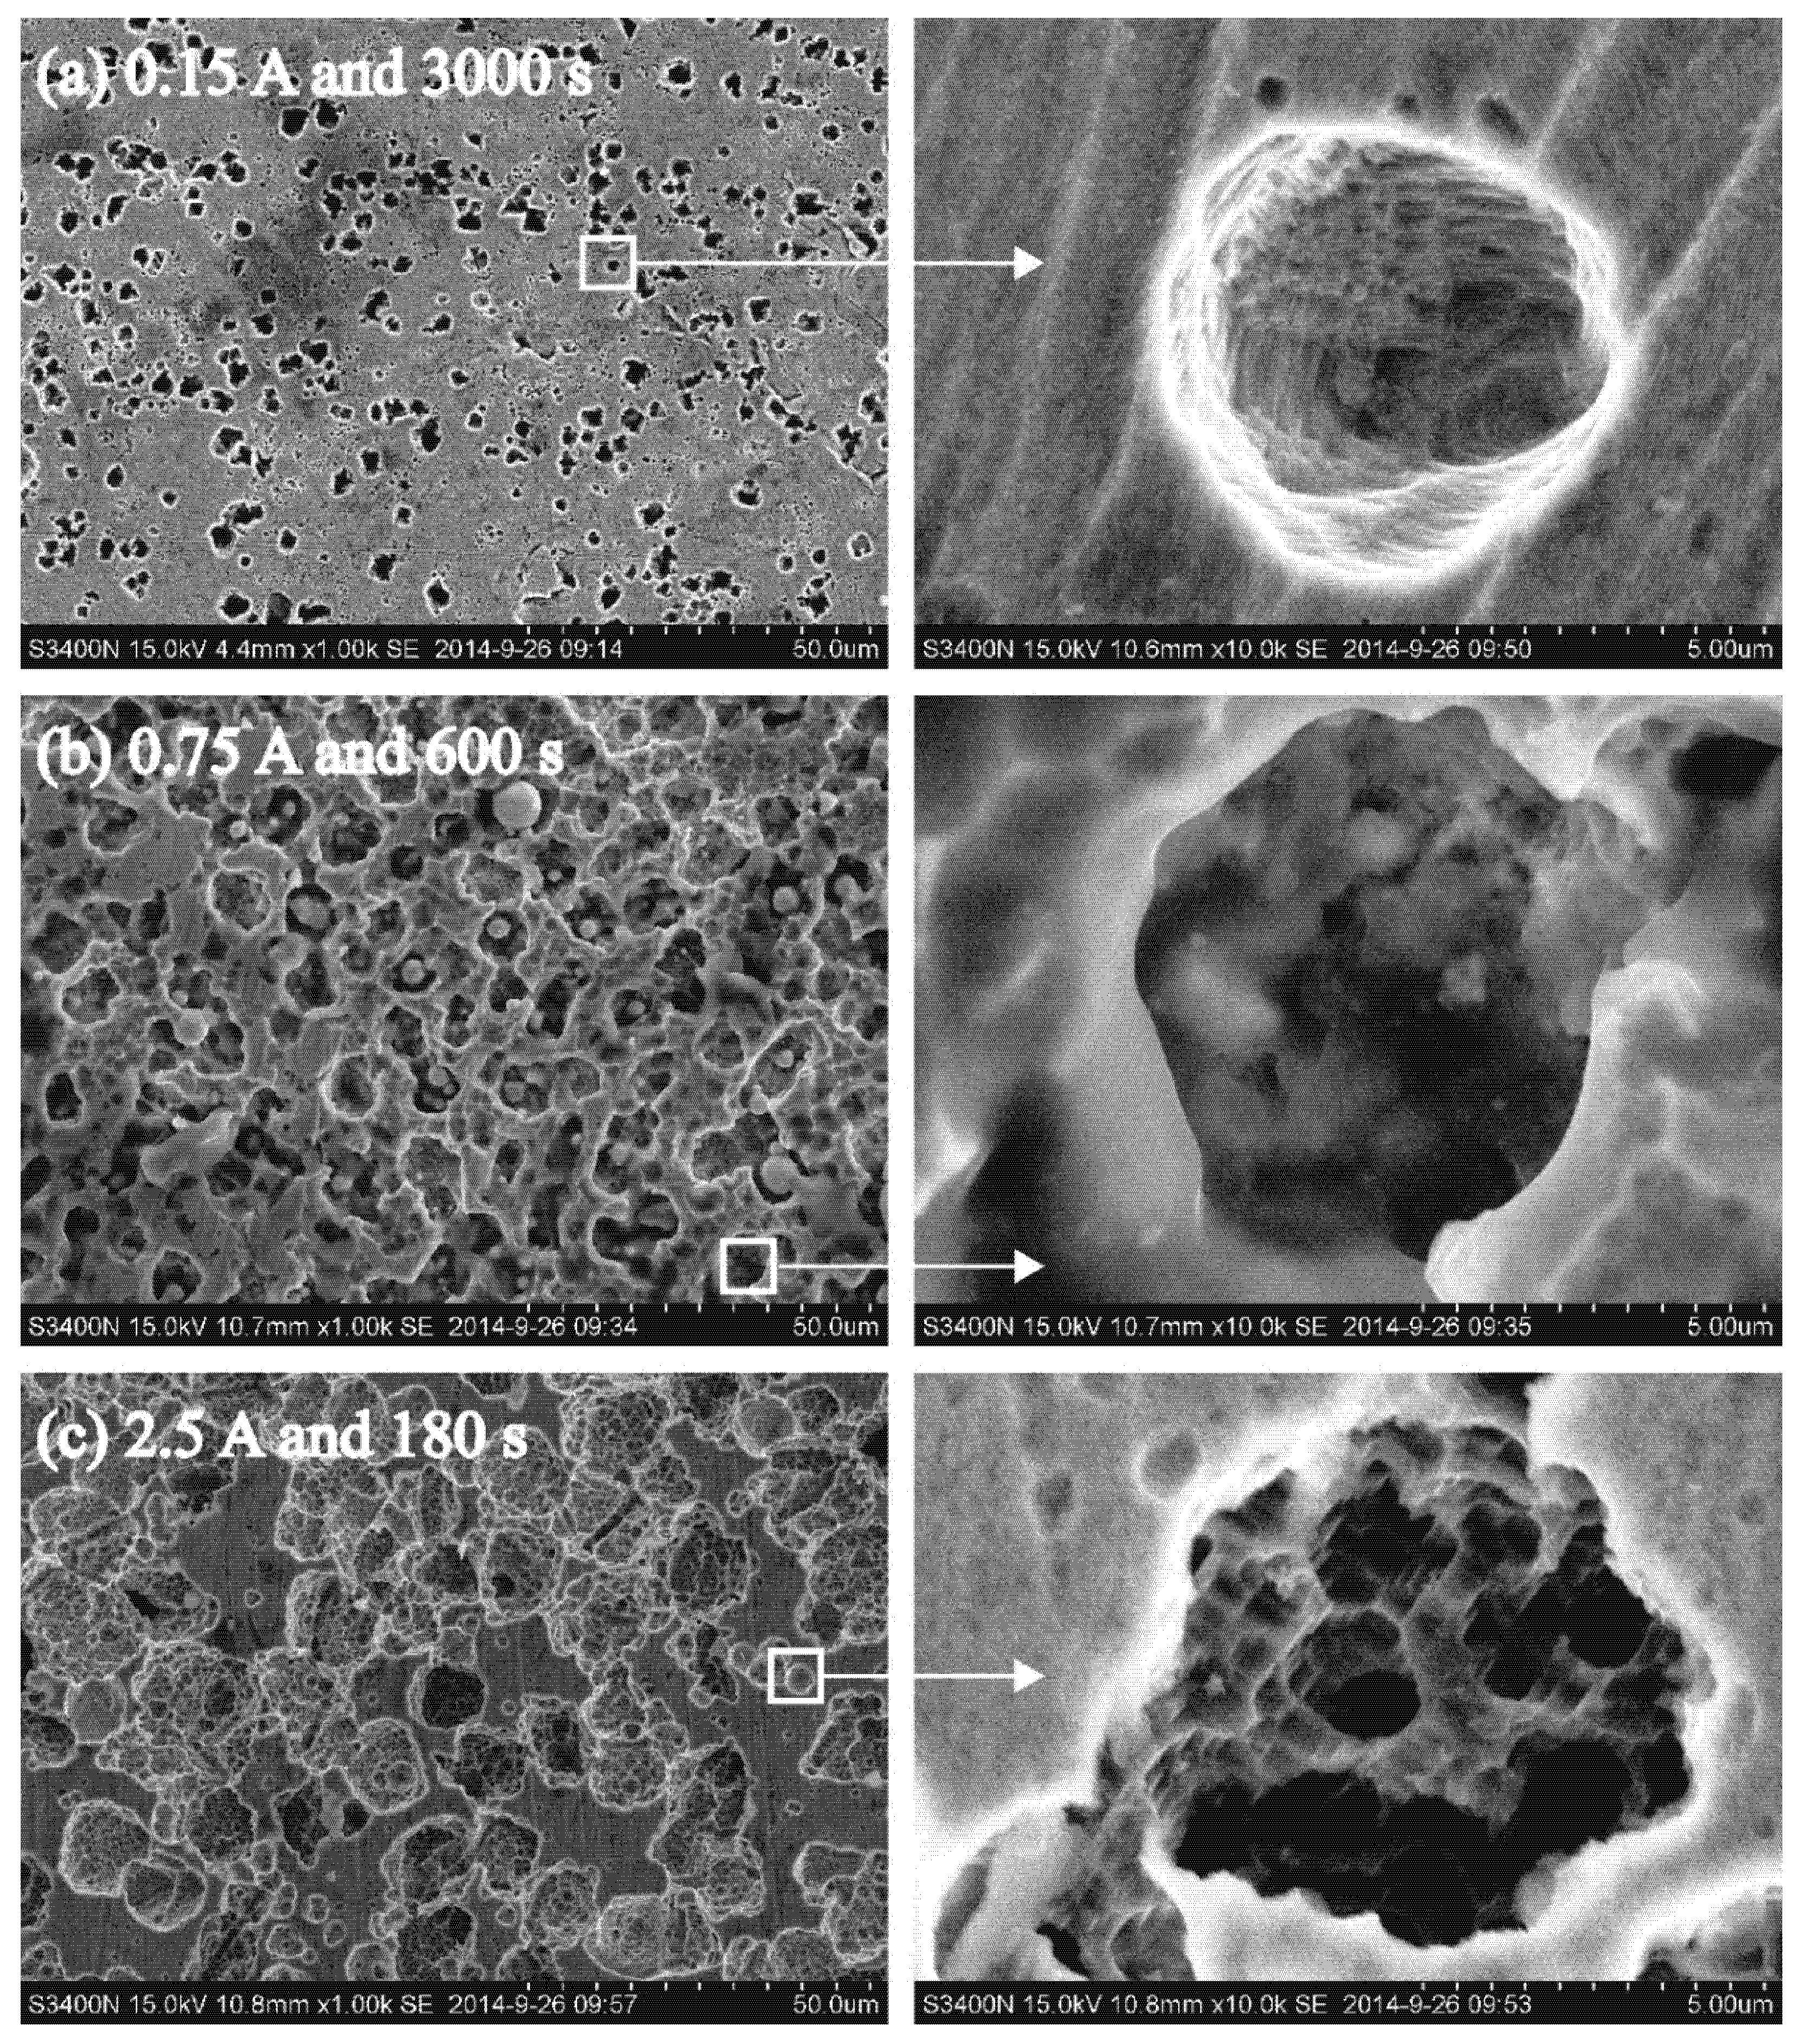
4.1. Materials and Methods

The chemical composition of 304 stainless steel is presented in Table 2. The sample size was 5 mm × 5 mm × 2 mm. All surfaces except the machined surface were insulated with epoxy.
The experiment was carried out in an electrochemical workstation equipped with a standard three-electrode system, where the platinum electrode acted as the auxiliary electrode and the Ag/AgCl electrode acted as the reference electrode. The electrolyte was a solution of 15% NaNO3 (Guangzhou Chemical Reagent Factory, Guangzhou, China).
The processed surface was polished with different grades of sandpapers (320#, 800#, 2000#, and 5000#) and cleaned by ultrasonication in acetone and pure water to remove oil and impurities. Finally, cold air drying was carried out to achieve a uniform surface state.
The experiment for each sample was carried out by the constant current method under the same diffusion condition, and an equal amount of current (450 coulombs) was passed through each sample. The specific processing parameters are presented in Table 3.

4.2. Results

Figure 7 displays the SEM images of three samples, and it is clear that current density had a significant effect on the pore morphology. Figure 7a expresses that when the current was low, the size of the pore was smaller (2.693–4.420 μm) and the depth was larger (7.325–9.747 μm), thus resulting in a depth-to-diameter ratio of approximately 2.4. The enlarged view of a single pore reveals that the pore was cylindrical. When the current increased, the diameter of the pore increased to 4.917–7.352 μm, and the depth was relatively shallow (5.037–6.949 μm). Thus, the pore became spherical with a depth-to-diameter ratio close to 1 (Figure 7b). When the current continued to increase, the diameter of the pore reached 10.692–15.076 μm, and the depth was only 3.052–5.684 μm. Thus, a shallow dish-shaped pore with a depth-to-diameter ratio of approximately 0.35 was formed, and secondary pores appeared at its bottom (Figure 7c).

4.3. Discussion

It can be seen from experiment and simulation that the morphology of pores has similar results, which were caused by the competition between dissolution and diffusion. It is noticeable that when the voltage was low, the low dissolution rate led to few corrosion products. The diffusion was relatively sufficient, and corrosion products at the bottom of the pore diffused out in time; therefore, no deposit was formed at the bottom of the pore. The electric field made corrosive particles move down more easily; thus, the longitudinal dissolution speed was faster than that in the transverse direction. Consequently, a cylindrical pore was formed. With the increase in the voltage, the dissolution rate and the amount of corrosion products increased. Corrosion products at the bottom of the pore could not diffuse out in time. The dissolution rate at the bottom of the pore decelerated, and the pore wall started to dissolve, thereby causing an increase in the pore diameter. Subsequently, the diffusion rate improved, and some of the deposited products at the bottom of the pore were expelled by diffusion; therefore, the dissolution reaction continued at the bottom. When the dissolution rates of the pore along the longitudinal and transverse directions were the same, the pore became approximately spherical. When the voltage continued to increase, the damaged area of the passivation film became larger, and the dissolution rate was faster, leading to the accumulation of corrosion products and hindering the transmission of corrosion particles. The surface was not covered by corrosion products at the bottom of the pore and dissolved to form secondary pores; however, the dissolution rate along the transverse direction was obviously higher than the one along the longitudinal direction.
This indicated that the morphology of a porous surface can be controlled by an electric field and a flow field. However, the electric field should not be too strong; the stronger the electric field, the larger the damage area of the passivation film, which makes the non-uniform electrochemical machining difficult to control. The flow field affected the transmission of particles. The stronger the mass transfer, the more conducive to non-uniform electrochemical machining and the better the surface porous structure. In this way, the passivation characteristics of stainless steel were used to form a natural template, which avoids the complex process and size limitation of the traditional template method.

5. Conclusions

In the present paper, a pore dissolution model was developed by the lattice gas automaton method, which took into account both the particle migration caused by an electric field and the effects of the solution concentration gradient and corrosion products. It was found that different pore morphologies were formed due to the competition between dissolution and diffusion. When the voltage was low, diffusion was sufficient, and no deposit was formed at the bottom of the pore. The pore dissolved faster along the longitudinal direction and attained a cylindrical shape with a large depth-to-diameter ratio. When the voltage increased, the dissolution rates in all directions were the same, and the pore attained a spherical shape. When the voltage continued to increase, the dissolution rate was too fast to discharge corrosion products. In turn, a deposition layer was formed at the bottom of the pore and hindered the dissolution reaction, thus forming a disc-shaped pore with secondary pores.
Templates are usually used in the processing of a porous surface. In this study, passivation film was used as a natural template, which has a simple process but poor controllability. Through the simulation of particle motion, the formation causes of pores with different morphologies were revealed in principle. The simulation provided a theoretical reference for the control of the electric field and the flow field in the process of non-uniform electrochemical machining. However, there was still a lack of accurate quantitative evidence for the control of porous surface morphology. Cross-scale simulation can combine macroscopic processing parameters with microscopic particle motion, which is of great significance to improve the controllability of non-uniform electrochemical processing.

Author Contributions

Data curation, H.W.; methodology, Z.G. and Z.M.; software, H.W. and Z.M.; validation, H.W.; Writing—original draft, H.W. and Z.G. All authors have read and agreed to the published version of the manuscript.

Funding

The authors would like to acknowledge the financial support from the Guangdong Natural Science Foundation of China (Grant no. 2017A030310587) and the National Natural Science Foundation of China and the Guangdong Province (Grant no. 2017A030313330).

Institutional Review Board Statement

Not applicable.

Informed Consent Statement

Not applicable.

Data Availability Statement

Data is contained within the article.

Acknowledgments

We thank LetPub (www.letpub.com, accessed on 10 September 2021) for its linguistic assistance during the preparation of this manuscript.

Conflicts of Interest

The authors declare no conflict of interest. No conflict of interest exits in the submission of this manuscript, and the manuscript is approved by all authors for publication. The work described was original research that has not been published previously and is not under consideration for publication elsewhere, in whole or in part.

References

  1. Ni, C.; Zheng, X.; Zhang, Y.; Zhang, X.; Li, Y. Multifunctional porous materials with simultaneous high water flux, antifouling and antibacterial performances from ionic liquid grafted polyethersulfone. Polymer 2021, 212, 123183. [Google Scholar] [CrossRef]
  2. Chen, S.; Fukazawa, K.; Inoue, Y.; Ishihara, K. Photoinduced Surface Zwitterionization for Antifouling of Porous Polymer Substrates. Langmuir 2019, 35, 1312–1319. [Google Scholar] [CrossRef]
  3. Qian, H.; Liu, B.; Wu, D.; Liu, W.; Chowwanonthapunya, T.; Zhang, D. Facile fabrication of slippery lubricant-infused porous surface with pressure responsive property for anti-icing application. Colloids Surf. A Physicochem. Eng. Asp. 2021, 618, 126457. [Google Scholar] [CrossRef]
  4. Zou, X.; Fang, X.; Chen, M.; Zhu, D. Investigation on mass transfer and dissolution localization of wire electrochemical machining using vibratory ribbed wire tools. Precis. Eng. 2018, 51, 597–603. [Google Scholar] [CrossRef]
  5. He, J.; Ma, P.; Xie, A.; Gao, L.; Zhou, Z.; Yan, Y.; Dai, J.; Li, C. From black liquor to highly porous carbon adsorbents with tunable microstructure and excellent adsorption of tetracycline from water: Performance and mechanism study. J. Taiwan Inst. Chem. Eng. 2016, 63, 295–302. [Google Scholar] [CrossRef]
  6. Zhang, B.; Yang, D.; Qiu, X.; Qian, Y.; Yan, M.; Li, Q. Influences of aggregation behavior of lignin on the microstructure and adsorptive properties of lignin-derived porous carbons by potassium compound activation. J. Ind. Eng. Chem. 2020, 82, 220–227. [Google Scholar] [CrossRef]
  7. Zhang, K.; Wang, Y.; Hillmyer, M.A.; Francis, L.F. Processing and properties of porous poly(l-lactide)/bioactive glass composites. Biomaterials 2004, 25, 2489–2500. [Google Scholar] [CrossRef]
  8. Oliveira, J.P.; Shen, J.; Zeng, Z.; Park, J.M.; Choi, Y.T.; Schell, N.; Maawad, E.; Zhou, N.; Kim, H.S. Dissimilar laser welding of a CoCrFeMnNi high entropy alloy to 316 stainless steel. Scr. Mater. 2021, 206, 114219. [Google Scholar] [CrossRef]
  9. Oliveira, J.P.; Shen, J.; Escobar, J.D.; Salvador, C.A.F.; Schell, N.; Zhou, N.; Benafan, O. Laser welding of H-phase strengthened Ni-rich NiTi-20Zr high temperature shape memory alloy. Mater. Des. 2021, 202, 109533. [Google Scholar] [CrossRef]
  10. Aung, N.N.; Wai, W.K.; Tan, Y. A novel electrochemical method for monitoring corrosion under insulation. Anti-Corros. Methods Mater. 2006, 53, 175–179. [Google Scholar] [CrossRef]
  11. Lengyel, B.; Mészáros, L.; Mészáros, G.; Fekete, É.; Janászik, F.; Szenes, I. Electrochemical methods to determine the corrosion rate of a metal protected by a paint film. Prog. Org. Coat. 1999, 36, 11–14. [Google Scholar] [CrossRef]
  12. Jiang, Y.; Zhao, H.; Liang, J.; Yue, L.; Li, T.; Luo, Y.; Liu, Q.; Lu, S.; Asiri, A.M.; Gong, Z.; et al. Anodic oxidation for the degradation of organic pollutants: Anode materials, operating conditions and mechanisms. A mini review. Electrochem. Commun. 2021, 123, 106912. [Google Scholar] [CrossRef]
  13. Singh, S.; Datta, J. Influence of Nafion template on the kinetics of anodic Pt based pluri-metallic catalyst for ethanol electro-oxidation. J. Electroanal. Chem. 2021, 882, 114974. [Google Scholar] [CrossRef]
  14. Chuang, M.; Chien, H.; Chain, Y.; Chi, G.; Lee, S.; Woon, W.Y. Local anodic oxidation kinetics of chemical vapor deposition graphene supported on a thin oxide buffered silicon template. Carbon 2013, 54, 336–342. [Google Scholar] [CrossRef]
  15. Shi, Y.; Yang, W.; Bai, Q.; Qin, J.; Zhang, Z. Alloying/dealloying mechanisms, microstructural modulation and mechanical properties of nanoporous silver via a liquid metal-assisted alloying/dealloying strategy. J. Alloys Compd. 2021, 872, 159675. [Google Scholar] [CrossRef]
  16. Mccue, I.; Benn, E.; Gaskey, B.; Erlebacher, J. Dealloying and Dealloyed Materials. Annu. Rev. Mater. Res. 2016, 46, 263–286. [Google Scholar] [CrossRef]
  17. Chen, Q.; Sieradzki, K. Mechanisms and Morphology Evolution in Dealloying. J. Electrochem. Soc. 2013, 160, C226–C231. [Google Scholar] [CrossRef]
  18. Chen, Q.; Ding, Y.; Chen, M. Nanoporous metal by dealloying for electrochemical energy conversion and storage. MRS Bull. 2018, 43, 43–48. [Google Scholar] [CrossRef] [Green Version]
  19. Abolusoro, O.P.; Akinlabi, E.T. Tribocorrosion Measurements and Behaviour in Aluminium Alloys: An Overview. J. Bio-Tribo-Corros. 2020, 6, 1–13. [Google Scholar] [CrossRef]
  20. Connolly, J.A.D.; Galvez, M.E. Electrolytic fluid speciation by Gibbs energy minimization and implications for subduction zone mass transfer. Earth Planet. Sc. Lett. 2018, 501, 90–102. [Google Scholar] [CrossRef]
  21. Ariana, M.; Désilets, M.; Proulx, P. On the analysis of ionic mass transfer in the electrolytic bath of an aluminum reduction cell. Can. J. Chem. Eng. 2014, 92, 1951–1964. [Google Scholar] [CrossRef]
  22. Gomez-Gallegos, A.A.; Mill, F.; Mount, A.R. Surface finish control by electrochemical polishing in stainless steel 316 pipes. J. Manuf. Process. 2016, 23, 83–89. [Google Scholar] [CrossRef] [Green Version]
  23. Klocke, F.; Harst, S.; Ehle, L.; Zeis, M.; Klink, A. Surface integrity in electrochemical machining processes: An analysis on material modifications occurring during electrochemical machining. Proc. Inst. Mech. Eng. Part B J. Eng. Manuf. 2018, 232, 578–585. [Google Scholar] [CrossRef]
  24. Choi, S.; Kim, S.; Choi, W.; Lee, E. The optimum condition selection of electrochemical polishing and surface analysis of the stainless steel 316L by the Taguchi method. Int. J. Adv. Manuf. Technol. 2016, 82, 1933–1939. [Google Scholar] [CrossRef]
  25. Kumar, M.R.P.; Prakasan, K.; Kalaichelvan, K. Experimental Investigation and Multiphysics Simulation on the Influence of Micro Tools with Various End Profiles on Diametrical Overcut of Holes Machined Using Electrochemical Micromachining for a Predetermined Optimum Combination of Process Parameters. Russ. J. Electrochem. 2015, 10, 949–954. [Google Scholar] [CrossRef]
  26. Danilov, I.; Hackert-Oschätzchen, M.; Zinecker, M.; Meichsner, G.; Edelmann, J.; Schubert, A. Process Understanding of Plasma Electrolytic Polishing through Multiphysics Simulation and Inline Metrology. Micromachines 2019, 10, 214. [Google Scholar] [CrossRef] [Green Version]
  27. Lei, L.; Xiaogang, L.; Chaofang, D.; Kui, X.; Lin, L. Cellular automata modeling on pitting current transients. Electrochem. Commun. 2009, 11, 1826–1829. [Google Scholar] [CrossRef]
  28. Leese, R.; Ivanov, A. Electrochemical micromachining: Review of factors affecting the process applicability in micro-manufacturing. Proc. Inst. Mech. Eng. Part B J. Eng. Manuf. 2018, 232, 195–207. [Google Scholar] [CrossRef]
  29. Qu, N.; Chen, X.; Li, H.; Zeng, Y. Electrochemical micromachining of micro-dimple arrays on cylindrical inner surfaces using a dry-film photoresist. Chin. J. Chem. Eng. 2014, 27, 1030–1036. [Google Scholar] [CrossRef] [Green Version]
  30. Wang, Y.; Shi, H.; Ren, S. Cellular Automata Simulations of Random Pitting Process on Steel Reinforcement Surface. Comput. Model. Eng. Sci. 2021, 128, 967–983. [Google Scholar] [CrossRef]
  31. Li, W.; Quandai, W.; Xiuqing, H.; Yucheng, D.; Bingheng, L. Finite element simulation and experimental study on the through-mask electrochemical micromachining (EMM) process. Int. J. Adv. Manuf. Technol. 2010, 51, 155–162. [Google Scholar] [CrossRef]
  32. Wang, H.T.; Han, E.H. Cellular automata simulation of interactions between metastable corrosion pits on stainless steel. Mater. Corros. 2015, 66, 925–930. [Google Scholar] [CrossRef]
  33. Wang, W.; Guan, B.; Wei, X.; Lu, J.; Ding, J. Cellular automata simulation on the corrosion behavior of Ni-base alloy in chloride molten salt. Sol. Energy Mater. Sol. Cells 2019, 203, 110170. [Google Scholar] [CrossRef]
  34. Wei, H.; Wang, G.; Liu, G.; Guo, Z. Formation of porous hydrophobic stainless steel surfaces by maskless electrochemical machining. Surf. Eng. 2016, 32, 132–138. [Google Scholar] [CrossRef]
  35. Volgin, V.M.; Lyubimov, V.V.; Davydov, A.D. Modeling and numerical simulation of electrochemical micromachining. Chem. Eng. Sci. 2016, 140, 252–260. [Google Scholar] [CrossRef]
  36. Rusyn, B.P.; Tors’ka, R.V.; Pokhmurs’kyi, A.Y. Modeling of the Evolution of Corrosion Pitting with the Use of Cellular Automata. Mater. Sci. 2015, 50, 706–713. [Google Scholar] [CrossRef]
  37. Li, Y.; Guan, L.; Wei, H.; Guo, Z.; Wang, G. Preparation of cell adhesive micropores by one-step potentiostatic polarization on 304 stainless steel. Proc. Inst. Mech. Eng. Part B J. Eng. Manuf. 2019, 233, 1914–1919. [Google Scholar] [CrossRef]
  38. Xiao, Z.; Jun, H.; Yuqi, W.; Maosheng, Z.; Zaoxiao, Z. Simulation of Pitting Corrosion for Ni-based Alloy Using a Cellular Automata Model. Rare Met. Mater. Eng. 2015, 44, 2347–2352. [Google Scholar] [CrossRef]
  39. Hou, Z.; Qu, N.; Chen, X. Electrochemical micromachining of large-area micro-dimple arrays with high machining accuracy. Proc. Inst. Mech. Eng. Part B J. Eng. Manuf. 2018, 232, 1918–1927. [Google Scholar] [CrossRef]
  40. Zhang, L.; Li, H.; Qi, R. Heat and mass transfer in PEM-based electrolytic air dehumidification element with an optimized anode-side electrochemical model. Int. J. Heat Mass Transf. 2019, 135, 1152–1166. [Google Scholar] [CrossRef]
Figure 1. Simulation flowchart.
Metals 11 01694 g001
Figure 2. Lattice gas model space.
Metals 11 01694 g002
Figure 3. Von Neumann-type neighborhood for a lattice.
Metals 11 01694 g003
Figure 4. Simulation results under 4 V.
Metals 11 01694 g004
Figure 5. Simulation results under 5 V.
Metals 11 01694 g005
Figure 6. Simulation results under 6 V.
Metals 11 01694 g006
Figure 7. (ac) Porous surface morphologies at different current densities.
Metals 11 01694 g007
Table 1. Simulation parameters.
ConstantDiffusion Coefficient of the Ternary System (cm2/s) Electrolyte   Equivalent   Impedance   ( Ω ) Temperature (K)
Value7.62 × 10−96.89300
Table 2. Chemical composition of 304 stainless steel (in mass fraction/%).
CSiMnPSCrNiFe
0.0350.5201.1800.0360.02617.598.03072.60
Table 3. Experimental parameters.
Sample Number123
Constant current (mA)1507502500
Processing time (s)3000600180
Publisher’s Note: MDPI stays neutral with regard to jurisdictional claims in published maps and institutional affiliations.

