2. Materials and Methods
Quaternary ingots with nominal equal atomic composition of AlCoCrNi (w/o Fe), AlCoFeNi (w/o Cr), AlCoCrFe (w/o Ni), AlCrFeNi (w/o Co), and CoCrFeNi (w/o Al) were prepared using an arc melting method. The purity of the raw elements was above 99.9%. The materials were melted in a water-cooled copper mold under an ultra-high purity (UHP) argon atmosphere. The ingots were re-melted five times in order to ensure chemical homogeneity. For x-ray diffraction (XRD), the specimens were cut and polished on 15 µm SiC lapping disks. Data were collected on a D/MAX-2000 diffractometer (Rigaku global corporation, Austin, TX, USA) equipped with a graphite monochromator for Cu Kα radiation (λ = 0.154056 nm).
Scanning electron microscopy (SEM) analysis was carried out on a FEI-VERIOS XHR 460L (ThermoFisher Scientific, Hillsboro, OR, USA). For SEM analysis, specimens were mounted in bakelite, mechanically ground on 4000 grit SiC papers, polished on 3 µm and 1 µm diamond paste, and 0.04 µm colloidal SiO2 suspension.
Transmission Electron Microscopy (TEM) analysis was performed on JEOL JEM-2100F operating at 200 kV equipped with JEOL JED-2300T Energy Dispersive x-ray Spectrometer (EDS) (JEOL LTD, Tokyo, Japan). For this purpose, discs of 3 mm in diameter were mechanically ground on 5 µm SiC paper down to a thickness of approximately 100 µm, polished on a Gatan dimple grinder, and ion milled using a Gatan Precision Ion Polishing System-PIPS2 (Gatan inc. Ametek, Pleasanton, CA, USA) with 3–5 keV Ar ions to achieve electron transparency.
Small punch test (SPT) samples were cut into 8 mm × 8 mm × ~0.5 mm (0.500 ± 0.015 mm) thick samples and polished on 1200 grit SiC paper. The ball diameter was 2.48 mm. The SPT was conducted in following way: (1) clamping of the specimen between the dies under 2500 N; (2) pre loading up to 15 N and balancing the stoke transducer (Instron COD); and (3) pushing the ball into the specimen under stroke control at a speed of 0.2 mm/min up to failure. The end test criterion was maximal load. Specimen failure fracture mode was characterized by SEM.
Vickers microhardness measurements were performed on a Micromet microhardness tester (Buehler, Lake Bluff, IL, USA). Measurements were made on polished samples using a 100 gr load applied for 10 s. Indent size was smaller than the dimensions of the studied area. Measurements were conducted 10 times on each specimen. Since the morphology of the dendrite and interdendrite areas was noticeably different, there was no problem in discerning the two areas while performing the microhardness tests.
3. Results and Discussion
At first, qualitative assessment of the phase content of studied quaternary alloys was performed by XRD.
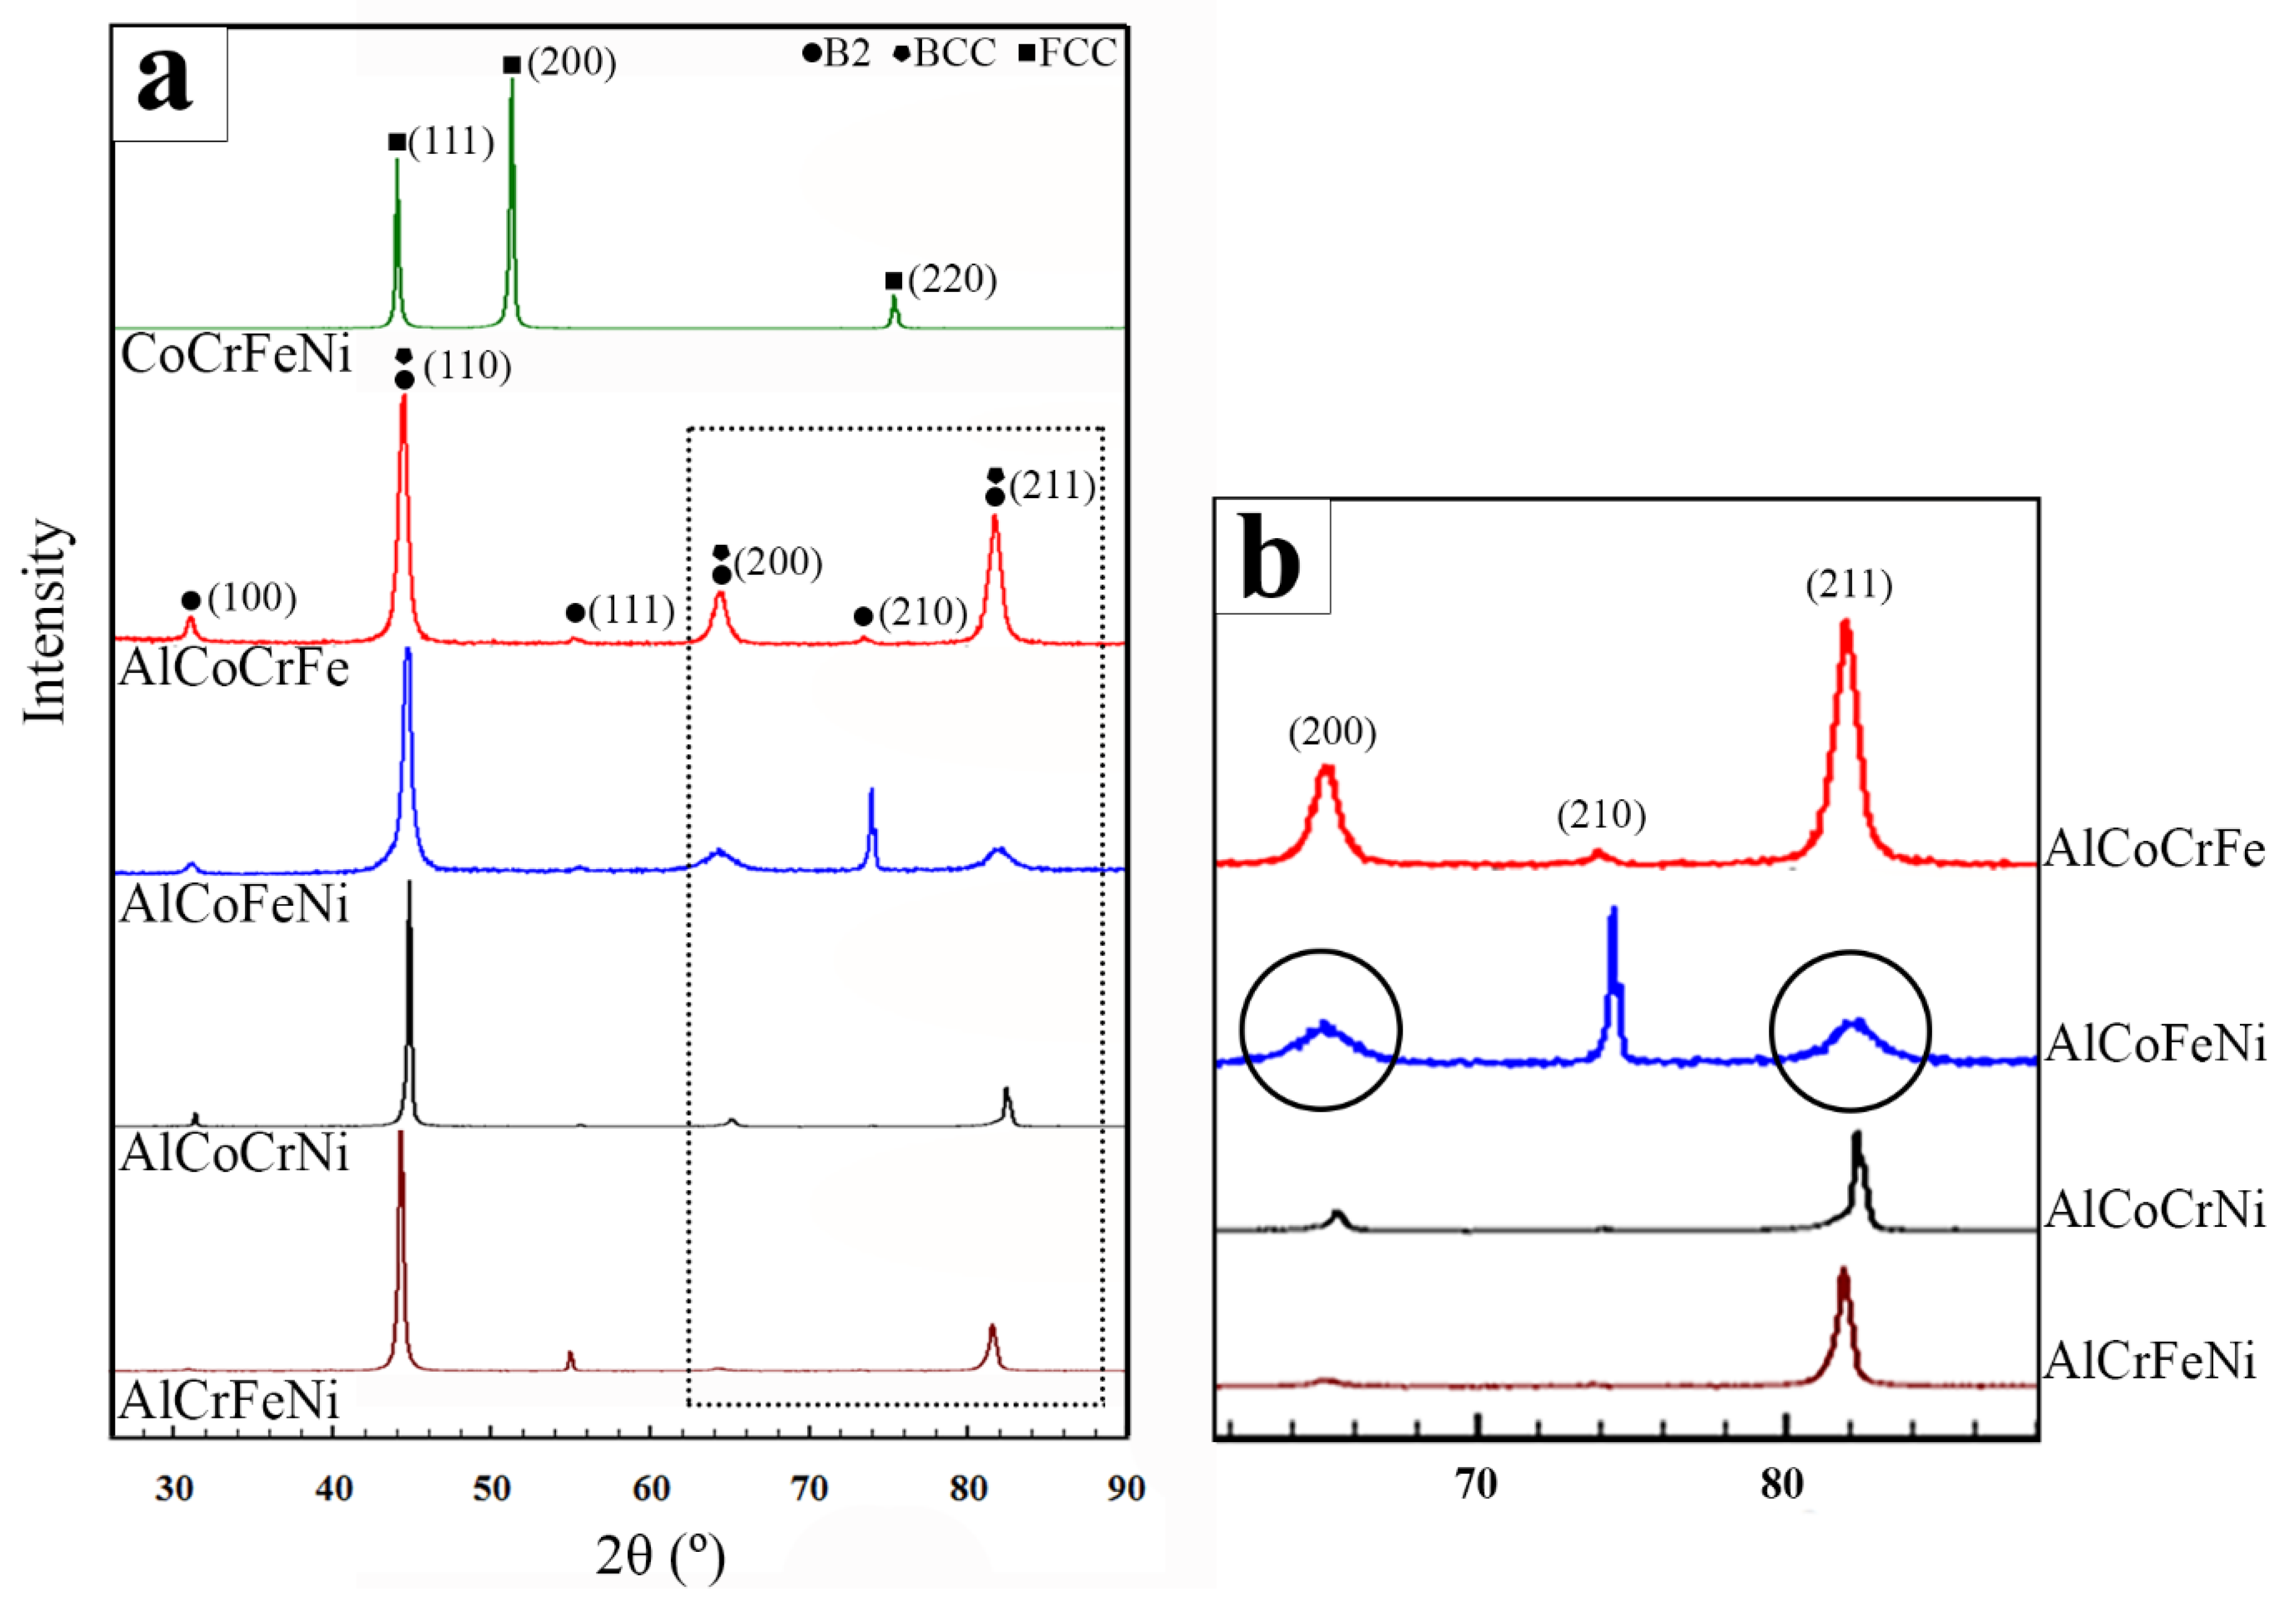
Figure 1 shows the XRD patterns taken from the studied alloys. Due to the almost identical lattice parameters of the BCC and B2 phases, it is impossible to differentiate between the BCC/B2 mixture and single B2 phase using only laboratory bulk x-ray diffraction, since the diffraction peaks corresponding to (110), (200), and (211) planes overlap and in the bulk specimens, strong preferred orientation exists. Thus, when (100) and (210) peaks of the primitive B2 appeared, the alloys’ phase content was regarded as a duplex structure of disordered BCC and B2, namely a BCC + B2 mixture, which was specified by TEM analysis. Consequently, it was concluded that all samples containing Al consisted of a disordered BCC and an ordered B2 phase mixture, similar to the quinary AlCoCrFeNi alloy, as reported in [
5]. For the AlCoFeNi (w/o Cr) alloy, the peaks that can be referred to both BCC and B2 phases were found to be broader, compared to those corresponding to B2 only (such as (210)), as seen in
Figure 1b. This observation implied on microstrains and/or small grain size of the BCC phase’s particles with respect to the B2.
CoCrFeNi (w/o Al) alloy is an exception among the studied alloys. Its XRD pattern (
Figure 1a) revealed that this alloy is a single-phase FCC solid-solution, which is in agreement with [
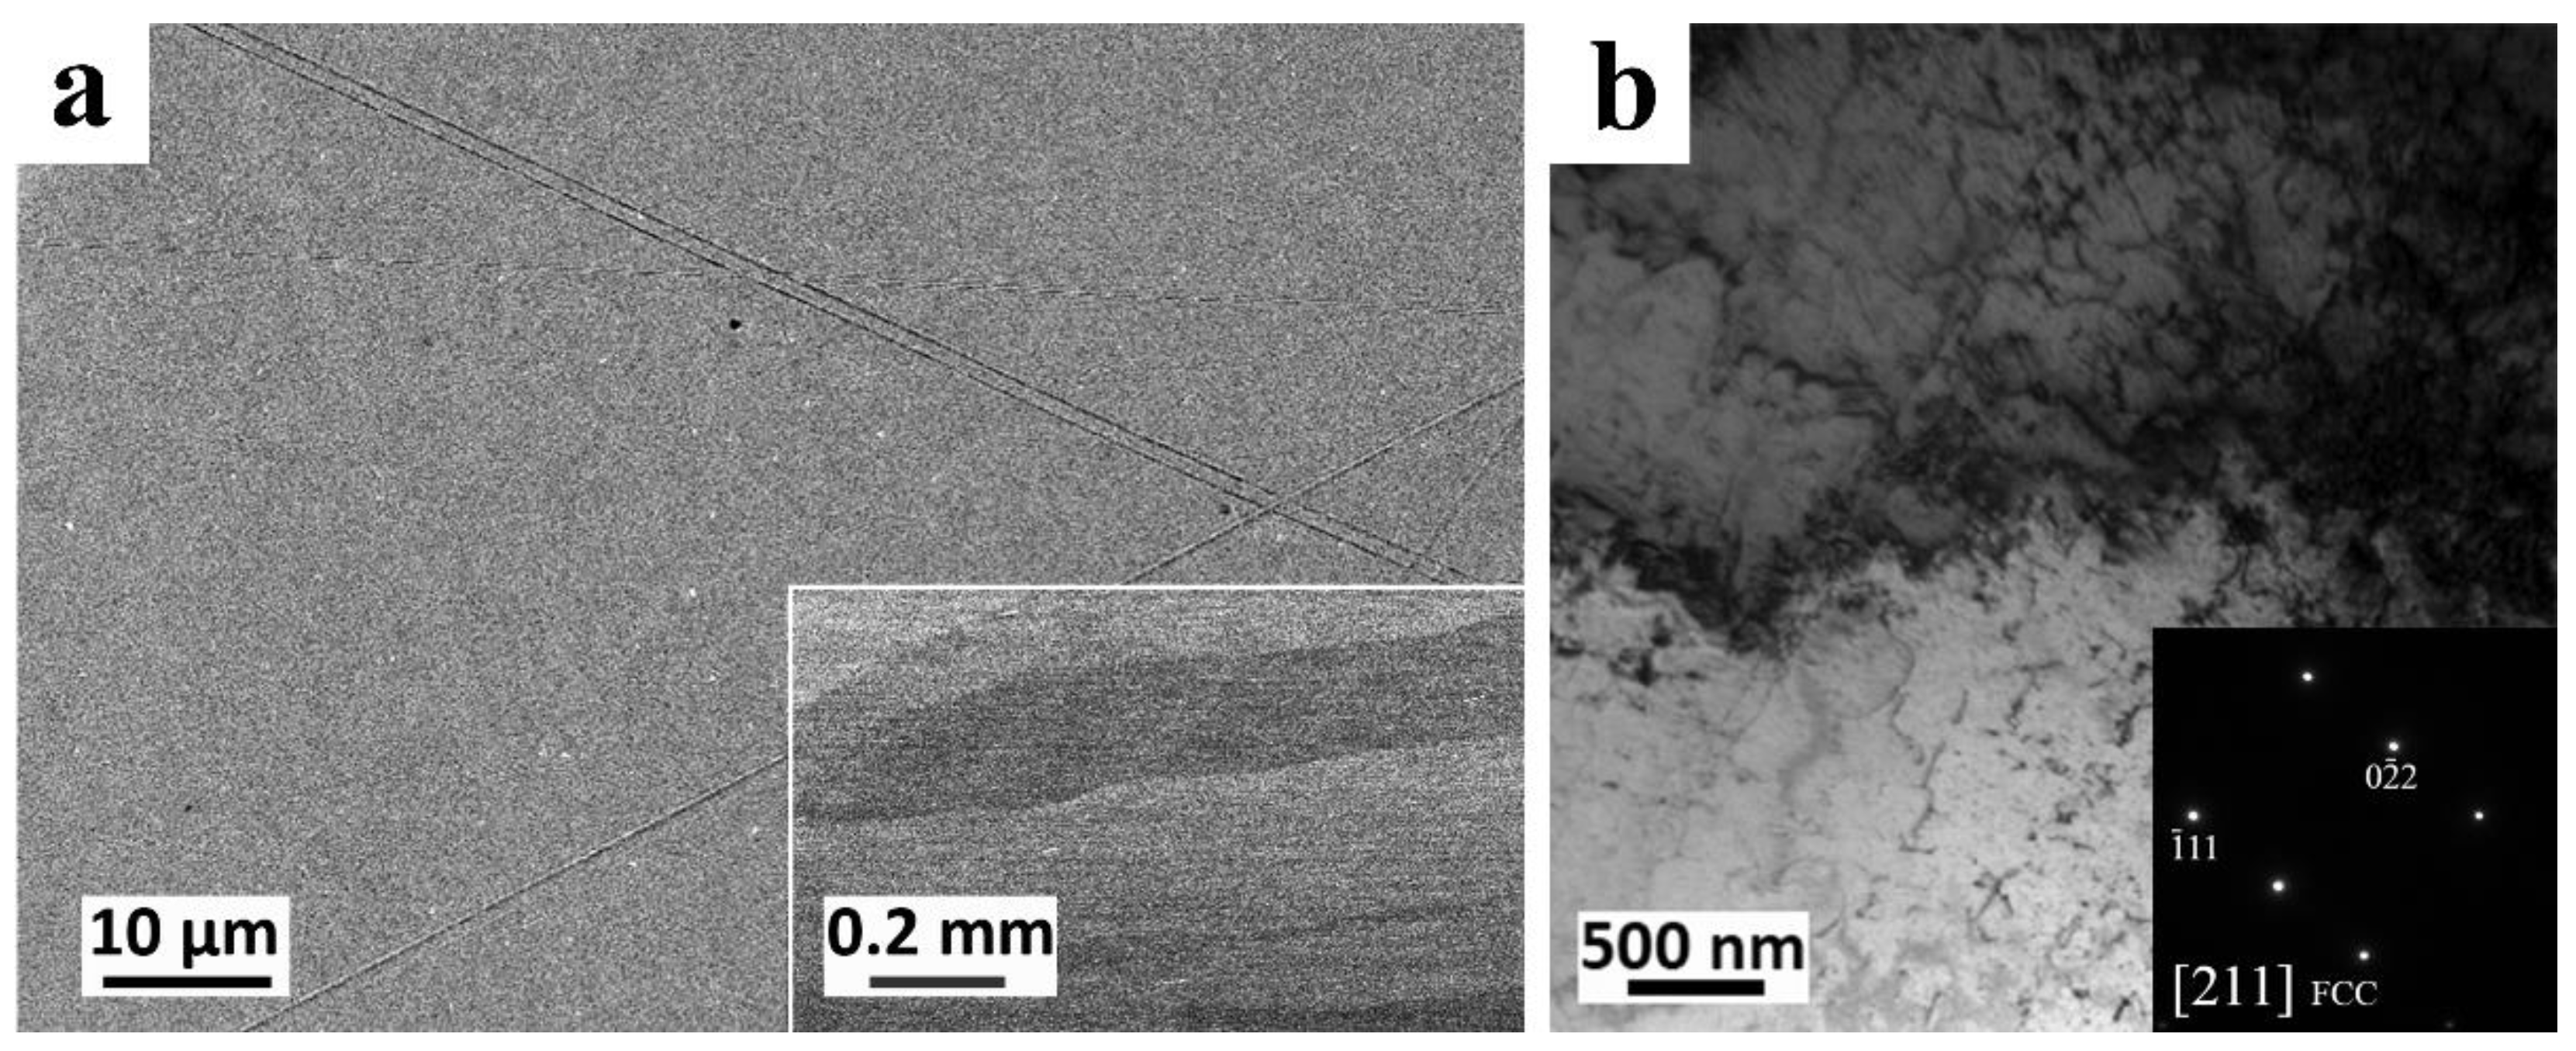
14]. SEM and TEM analysis confirmed this conclusion (see
Figure 2). CoCrFeNi (w/o Al) alloy consisted of grains exceeding 0.2 × 1.4 mm in size (see inset in
Figure 2a), containing relatively high dislocation density (see
Figure 2b). It should be noted that no ordered domains with the L1
2 structure were detected. Electron diffraction taken with a large selected area aperture, indexed in terms of the FCC structure with a ~3.6 Å, is shown in the inset of
Figure 2b. Thus, it can be inferred that Al stabilizes BCC/B2 formation, as was proposed in [
14].
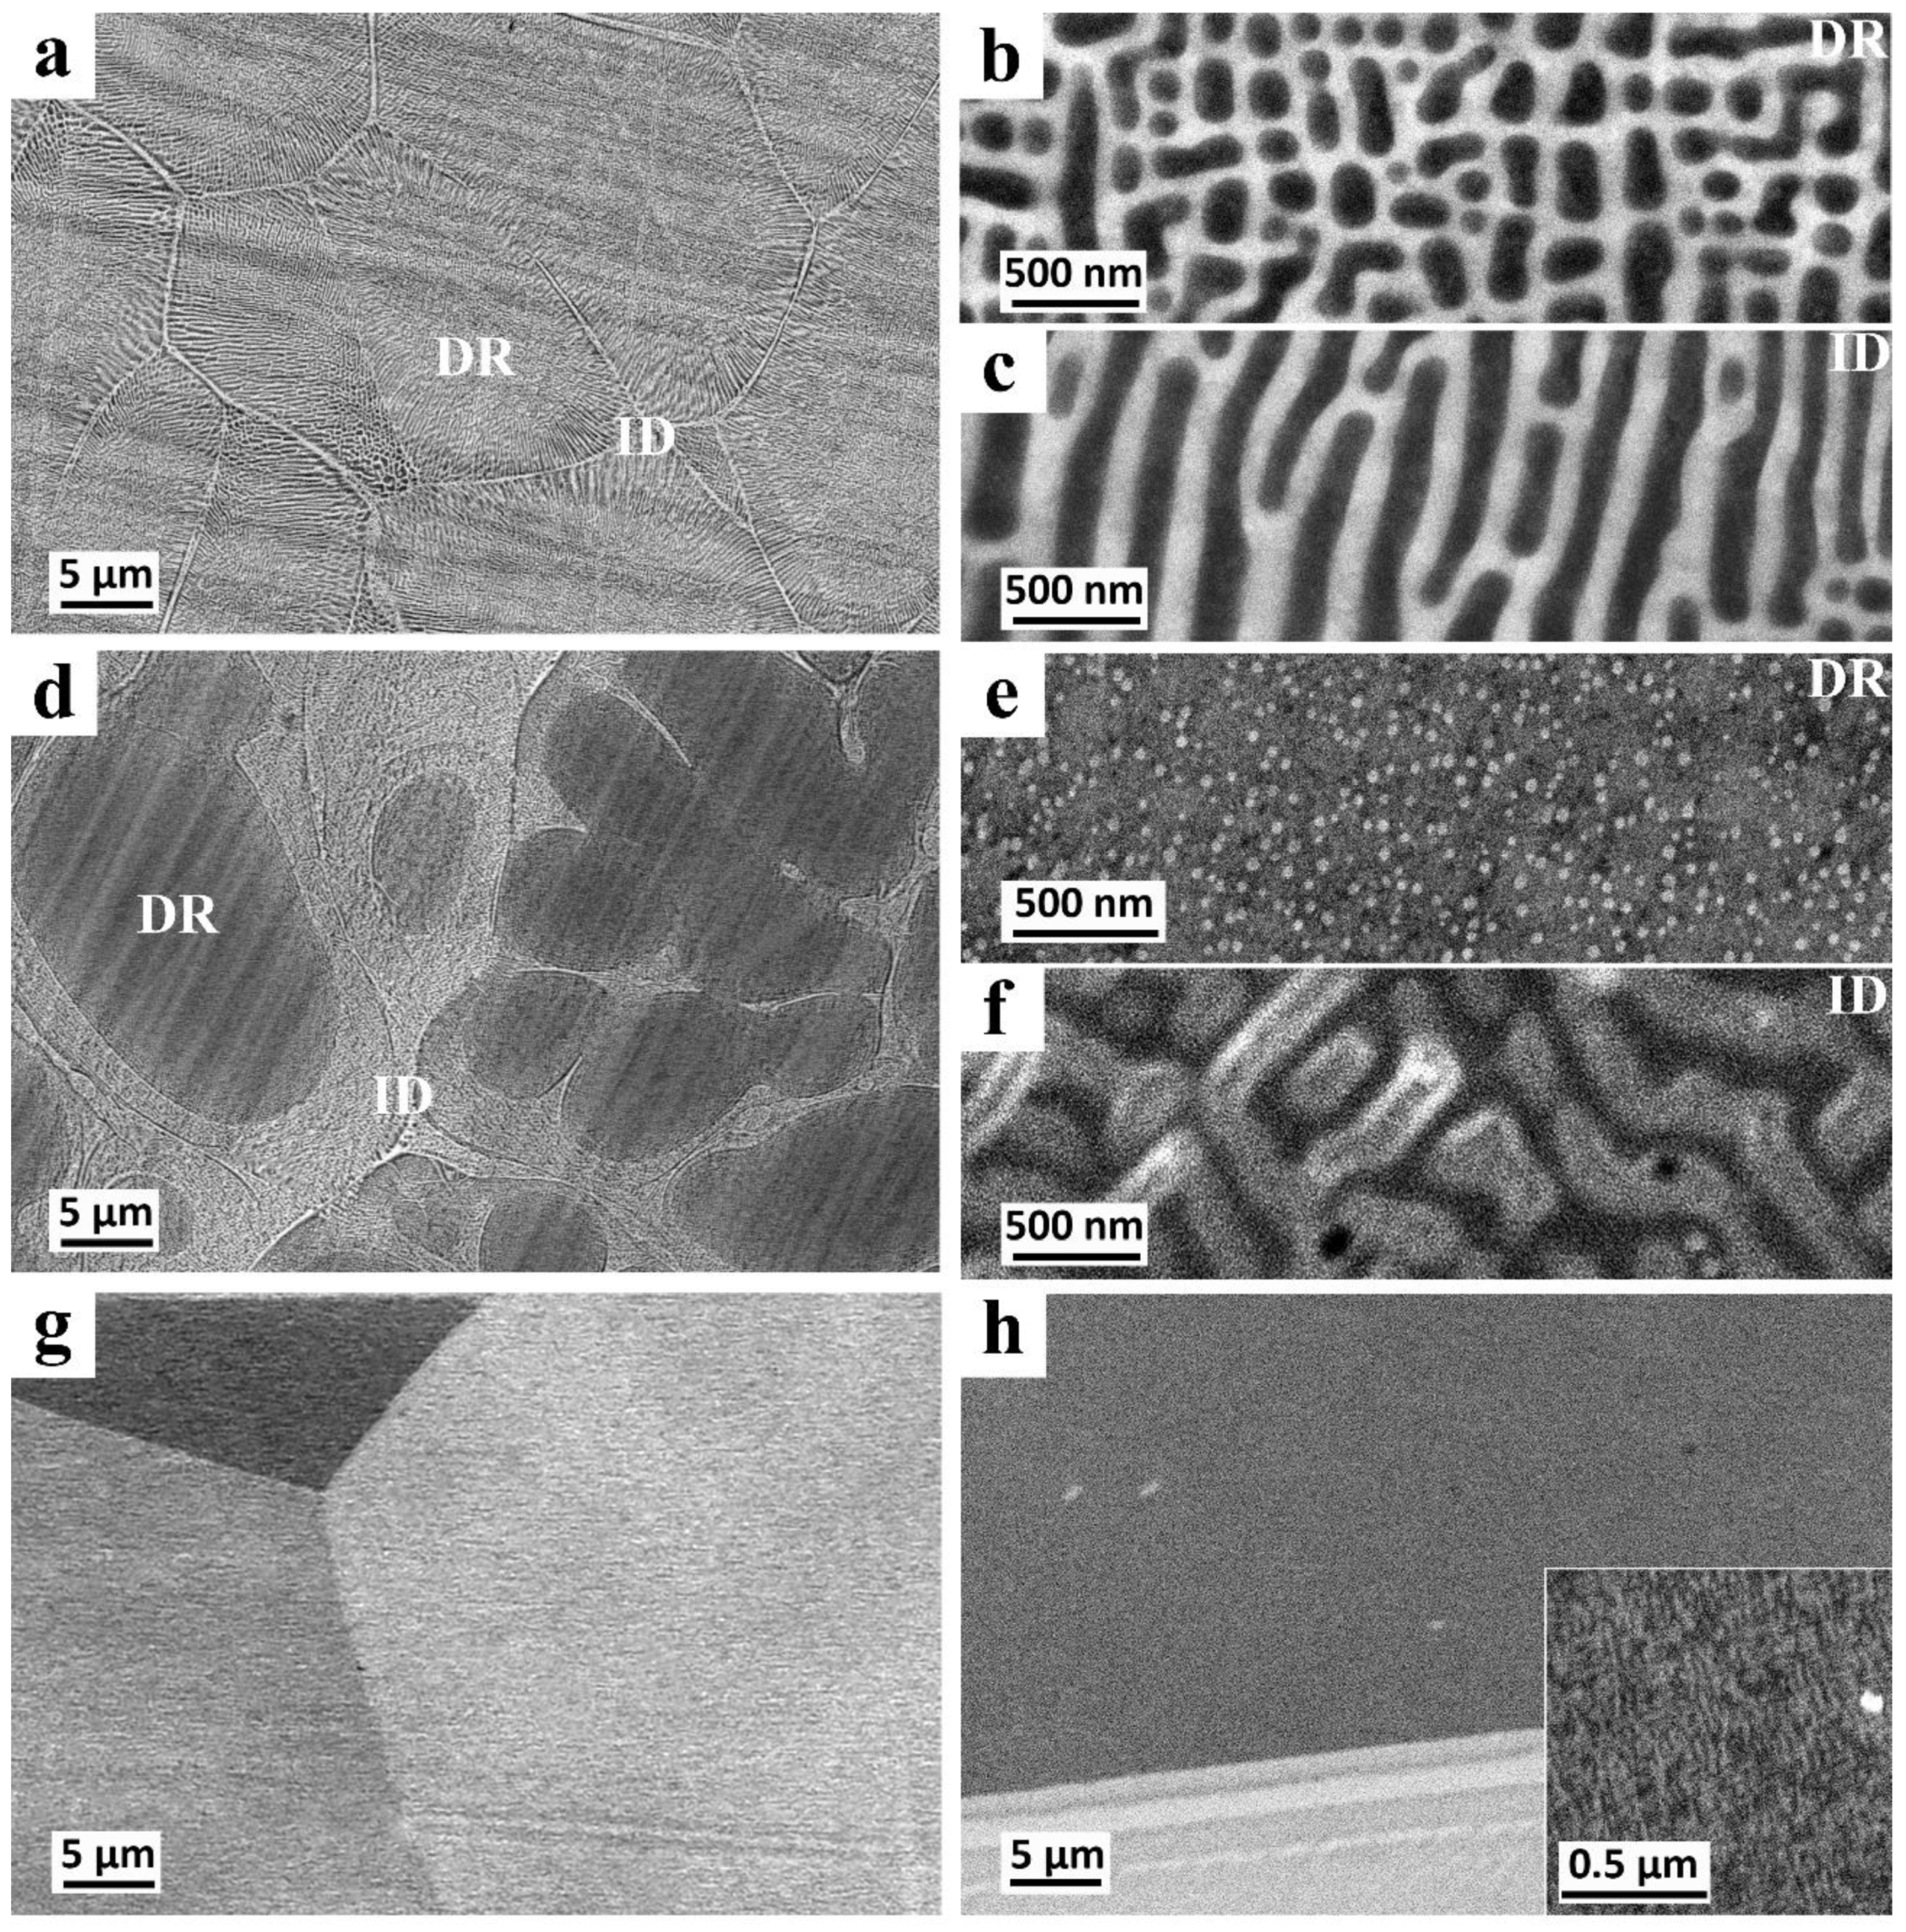
Initial microstructural evaluation of the BCC + B2 dual-phase alloys was performed using SEM (
Figure 3).
Figure 3a,d exhibit dendritic solidification of the AlCrFeNi (w/o Co) and AlCoCrNi (w/o Fe) alloys, respectively, which is similar to the quinary AlCoCrFeNi alloy [
5]. These two quaternary alloys presented different morphologies in the ID and DR regions: coarser and finer, respectively. Morphology of these different areas are shown in
Figure 3b,c for the AlCrFeNi (w/o Co) alloy, and
Figure 3e,f for the AlCoCrNi (w/o Fe) alloy. These differences also resemble the quinary AlCoCrFeNi alloy. Among these two alloys, pronounced compositional DR/ID differences were obtained only for the AlCoCrNi (w/o Fe) alloy, see
Table 1. The difference was mainly manifested by the variation of the Cr content. The coarse microstructure of the ID area contained high Cr content, with a B2/BCC phase ratio of approximately 44/56, while in the DR region, the Cr content was almost three times less with the B2/BCC phase ratio of approximately 85/15 (the measurements were performed on SEM images using ImageJ software [
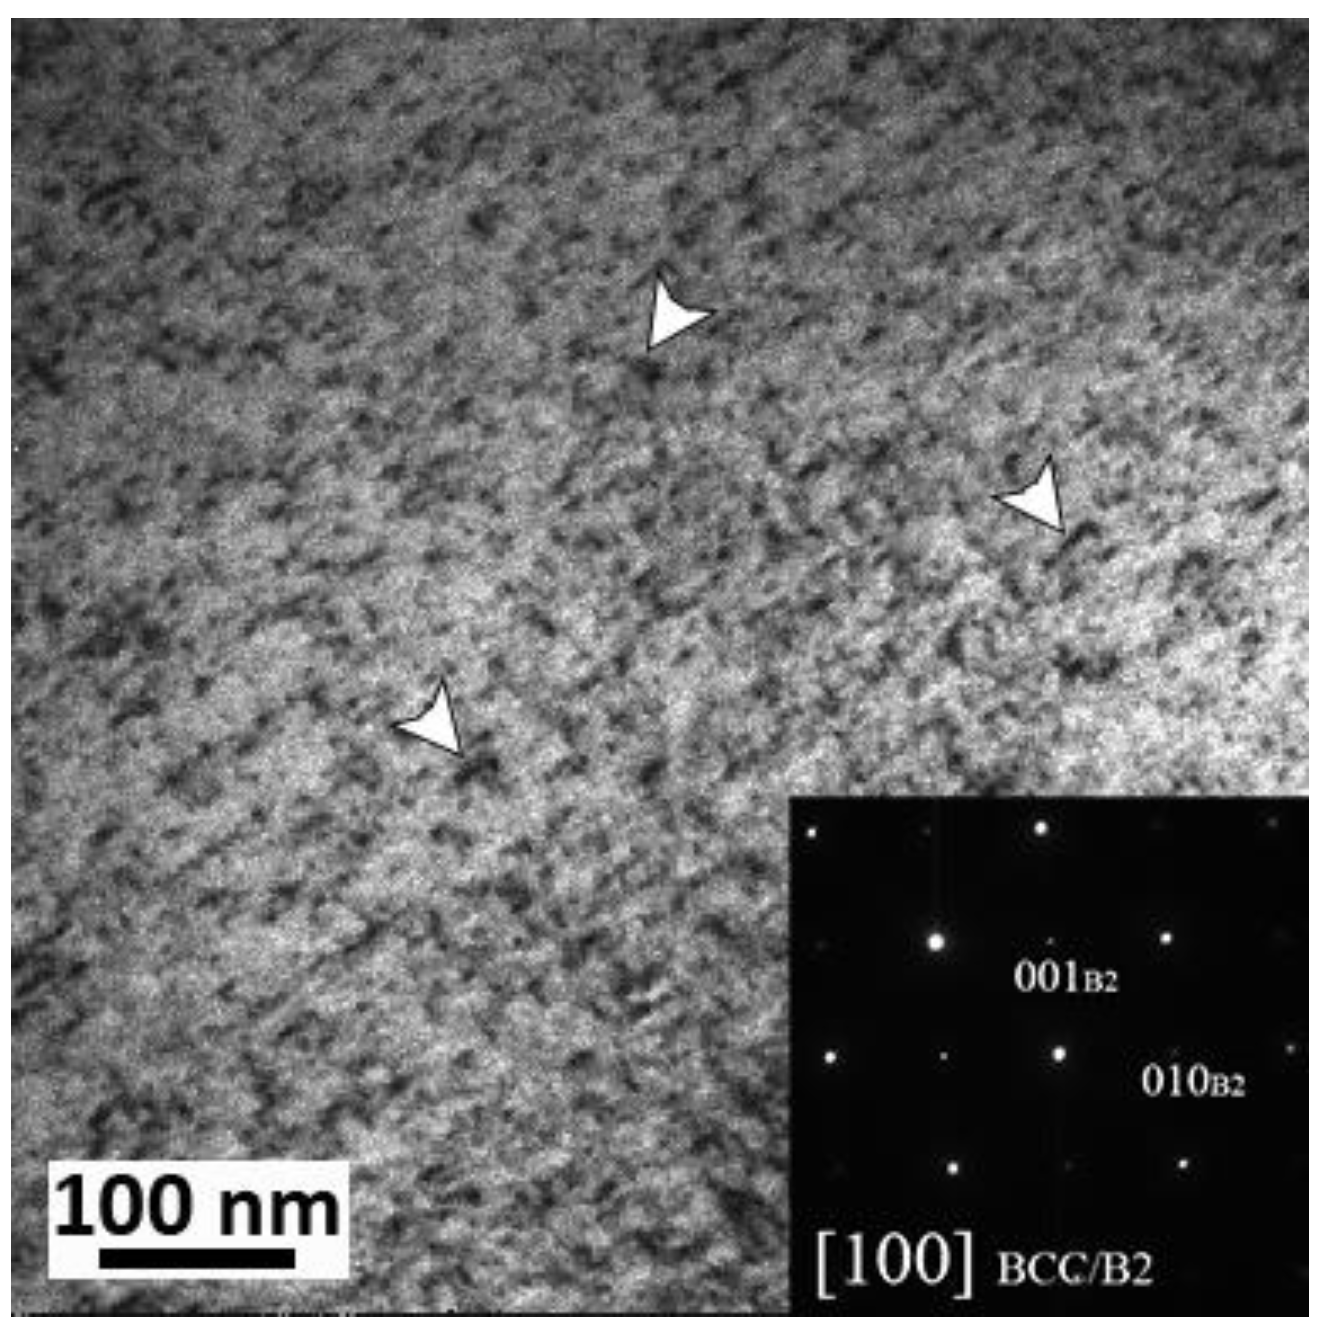
15]). This result implies that Cr promotes BCC formation on the expense of the B2. Investigation of the AlCoFeNi (w/o Cr) alloy confirmed this conclusion. In
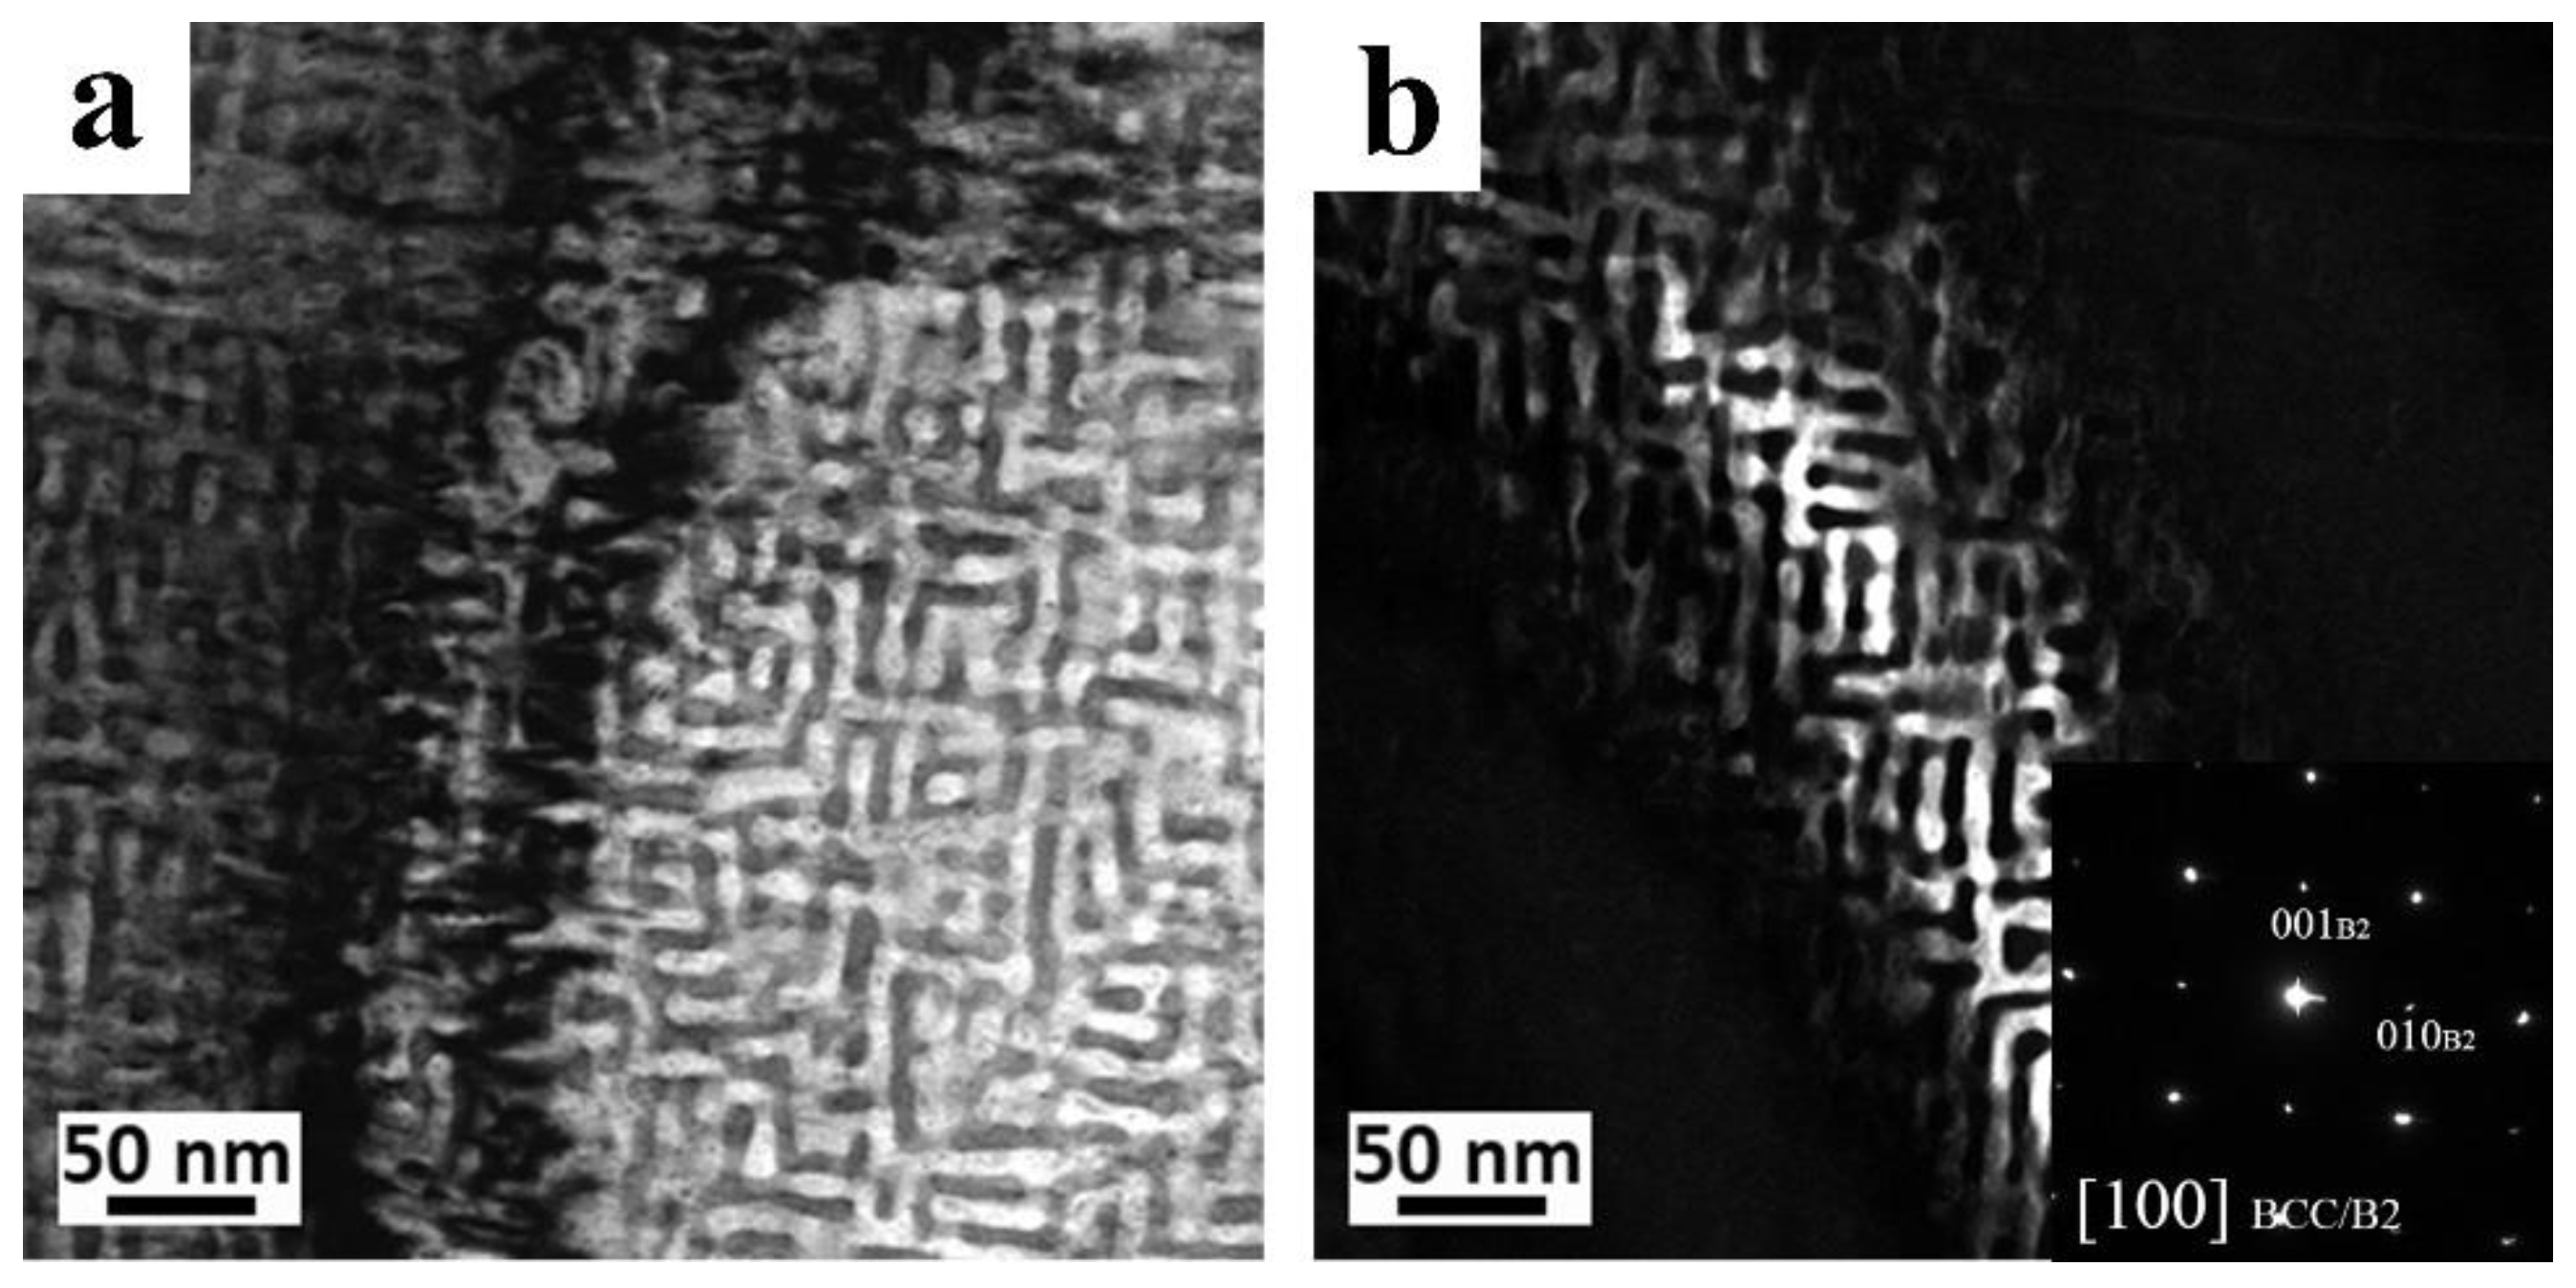
Figure 3g, the morphology of the AlCoFeNi (w/o Cr) appears uniform, possessing ~150 µm equiaxed grains. Detailed TEM analysis of this alloy confirmed that it mostly consists of the B2 phase with nanosized BCC inclusions (see
Figure 4). This result is in-line with [
11]. Moreover, the small size of the BCC inclusions explains the broadening of the overlapping B2/BCC peaks in the x-ray diffractogram (see
Figure 1b). Thus, it can be concluded that Cr stabilizes the BCC structure (i.e., reduces ordering phenomenon).
AlCoCrFe (w/o Ni) alloy exhibited a fine uniform microstructure, which might be a result of spinodal decomposition or eutectic solidification (see
Figure 3h and insert therein). This alloy was very brittle (essentially unmachinable) and exhibited exceptional hardness (will be discussed later in this manuscript). The TEM study of the AlCoCrFe (w/o Ni) alloy allowed concluding that the fine microstructure is a mixture of BCC and B2 phases (see
Figure 5a,b).
As noted earlier, the microstructures of AlCrFeNi (w/o Co) and AlCoCrNi (w/o Fe) were similar (see
Figure 3a–c and
Figure 3d–f, respectively). In both alloys, DR areas consist of small rounded BCC particles embedded in the B2 matrix. ID areas of the two alloys has the same phase content as DR, characterized by more elongated (than the DR particles) morphology and coarser particles (see
Figure 6 and
Figure 7). The difference between these alloys is manifested mainly by the size of particles: BCC particles in the DR area of the AlCrFeNi (w/o Co) alloy were an order of magnitude larger, 0.142 ± 0.061 µm
2, than those in the AlCoCrNi (w/o Fe) alloy at 0.022 ± 0.007 µm
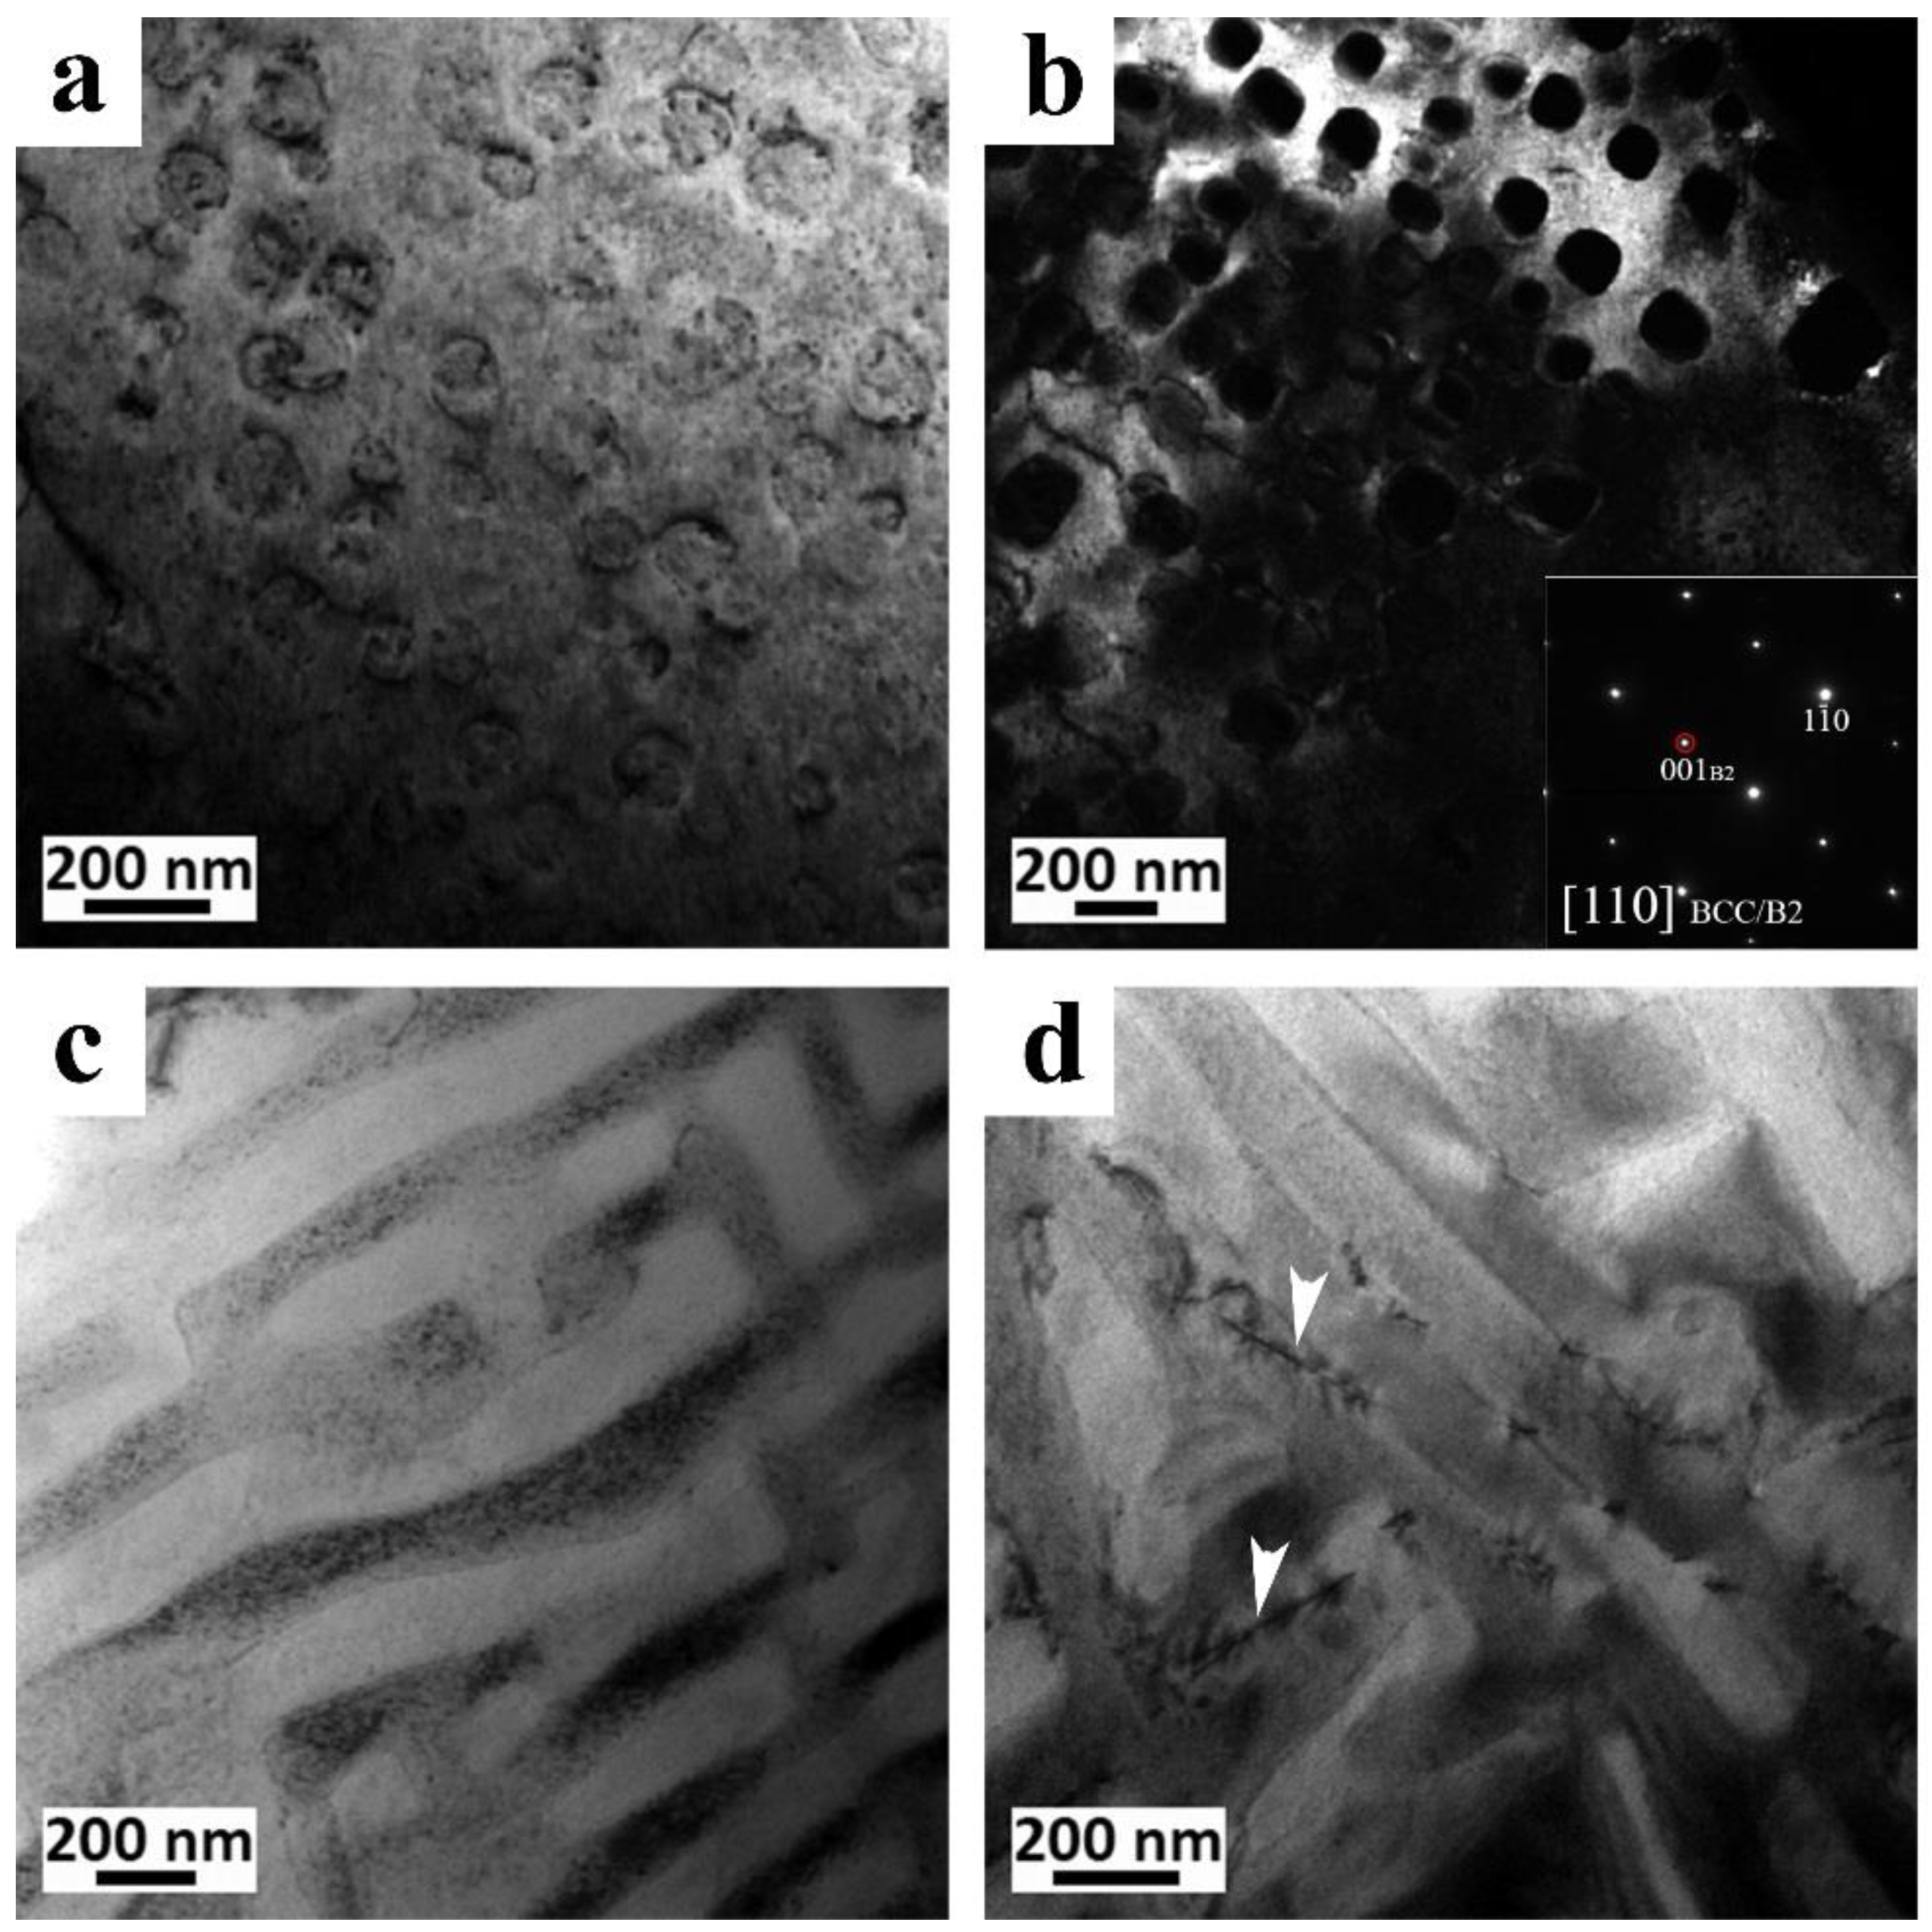
2. In addition, differences were observed in the specific shape of the particles in the ID regions. ID region of the AlCoCrNi (w/o Fe) alloy has a uniform BCC/B2, Chinese-letter like morphology, as shown in
Figure 6c,d, which is similar to the quinary AlCoCrFeNi alloy. This area displays a relatively high density of dislocations in both phases. Dislocations are marked by arrows in
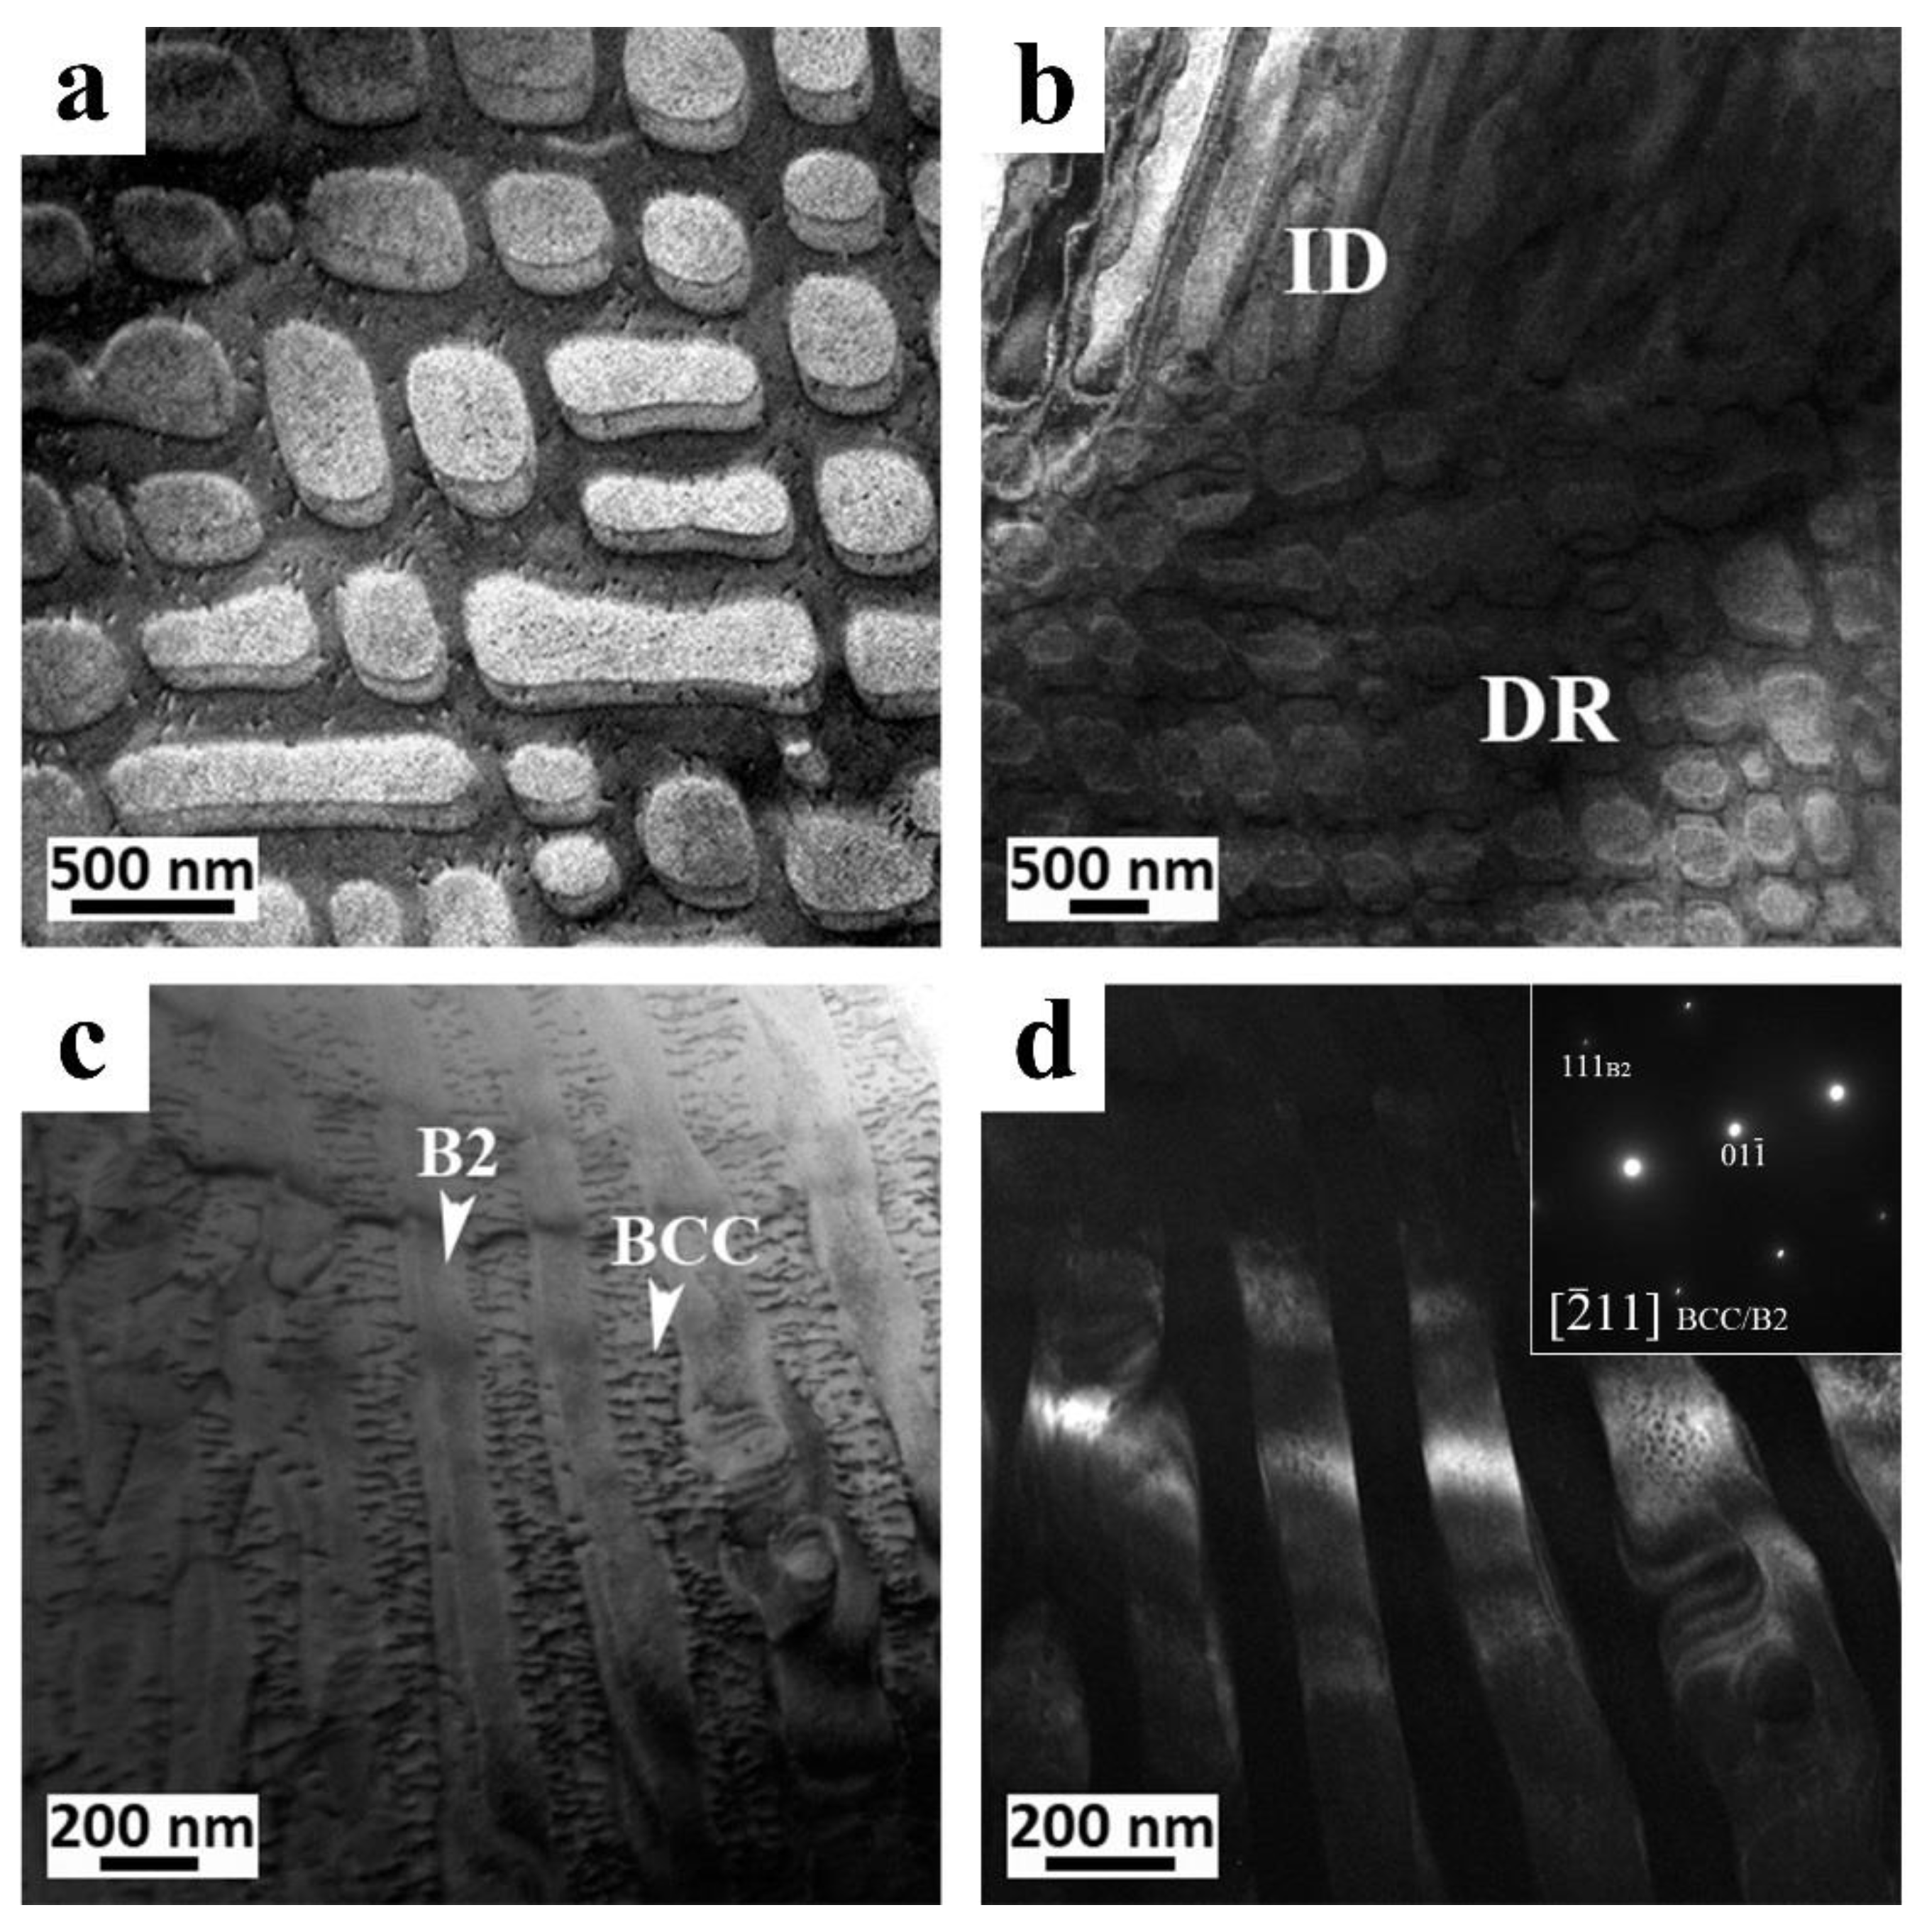
Figure 6d. The ID area of the AlCrFeNi (w/o Co) alloy was somewhat different, exhibiting an elongated parallel alternating B2/BCC particles, as shown in
Figure 7c,d. It is interesting to note that in this alloy, only the BCC phase exhibited a high density of dislocations (see
Figure 7a,c respectively), while B2 seemed to be dislocation free. This analysis was performed in 2-beam conditions [
16], which allowed us to conclude a/2<111> Burgers vector for the observed dislocations in the BCC particles. No superdislocations with <100> vector were detected. Since in [
5,
7], the quinary AlCoCrFeNi alloy was studied using the same TEM sample preparation methods as here and exhibited no dislocations, we believe that the dislocations observed in this case are not a result of the sample preparation method. The dislocations, obtained in these two alloys, probably point to some degree of misorientation between the B2 and BCC lattices, which was not observed in the quinary and other quaternary alloys. Thus, it is plausible to assume that both Fe and Co contribute to a reduction in this mismatch. This observation implies that the presence of dislocations in different phases does not depend only on the crystallographic structure, but also on the composition. Moreover, appearance of dislocation in both B2 and BCC phases in one alloy vs. high dislocation density, only in the BCC phases in the other alloy, implies different hardness values of the two phases, one with respect to the other. If the B2 and BCC phases exhibit similar hardness, dislocations will appear in both phases, as observed in the AlCoCrNi (w/o Fe) alloy (see
Figure 6d). Otherwise, dislocations will appear only in the softer phase, which is apparently BCC in the AlCrFeNi (w/o Co) alloy (see
Figure 7c). Appearance of the dislocations in the softer phase in complex systems is a known strain relief mechanism. As an example, in [
7], a high dislocation density in the FCC phase appearing in quinary AlCoCrFeNi HEA was reported. In that article, FCC appeared alongside with BCC, B2, and
σ phases, which did not exhibit dislocations and were considered to be much harder than the FCC phase. Going back to the discussed here quaternary alloys (i.e., w/o Fe and w/o Co), it was noted that in both alloys, the ID area exhibited higher dislocation density relative to the DR area, imposing higher micro-hardness values for the ID region (see
Table 2).
In general, the assessment of the mechanical properties of these alloys is not an easy task since the arc melting process produces a low amount of material. Here, we performed this evaluation using micro-hardness (
Table 2) and the small punch test (SPT). The results presented hereafter imply that the mechanical properties of these alloys are governed mainly by their microstructure. The CoCrFeNi (w/o Al) alloy exhibited the lowest hardness values (132 HV), which is in line with its FCC single phase content. The micro-hardness values of other studied here alloys, composed of BCC + B2 mixture, follows the Hall–Petch relationship (and not inverse Hall–Petch, despite the nano-size of the particles, which is in-line with the related study reported in [
17]). For the finest microstructure (AlCoCrFe w/o Ni alloy), the highest microhardness values were obtained. For the coarser microstructure (AlCoFeNi w/o Cr alloy, which was essentially single B2 phase with large B2 grains), the lowest (between the BCC + B2 dual phase alloys) value was measured. Both the AlCoCrNi (w/o Fe) and AlCrFeNi (w/o Co) alloys exhibited hardness values similar to the quinary alloy in the DR and in the ID areas, which correlates with their similar microstructures. Even in these similar alloys, the AlCoCrNi (w/o Fe) micro-hardness was found to be higher than that of the AlCrFrNi (w/o Co) alloy, since its microstructure was finer.
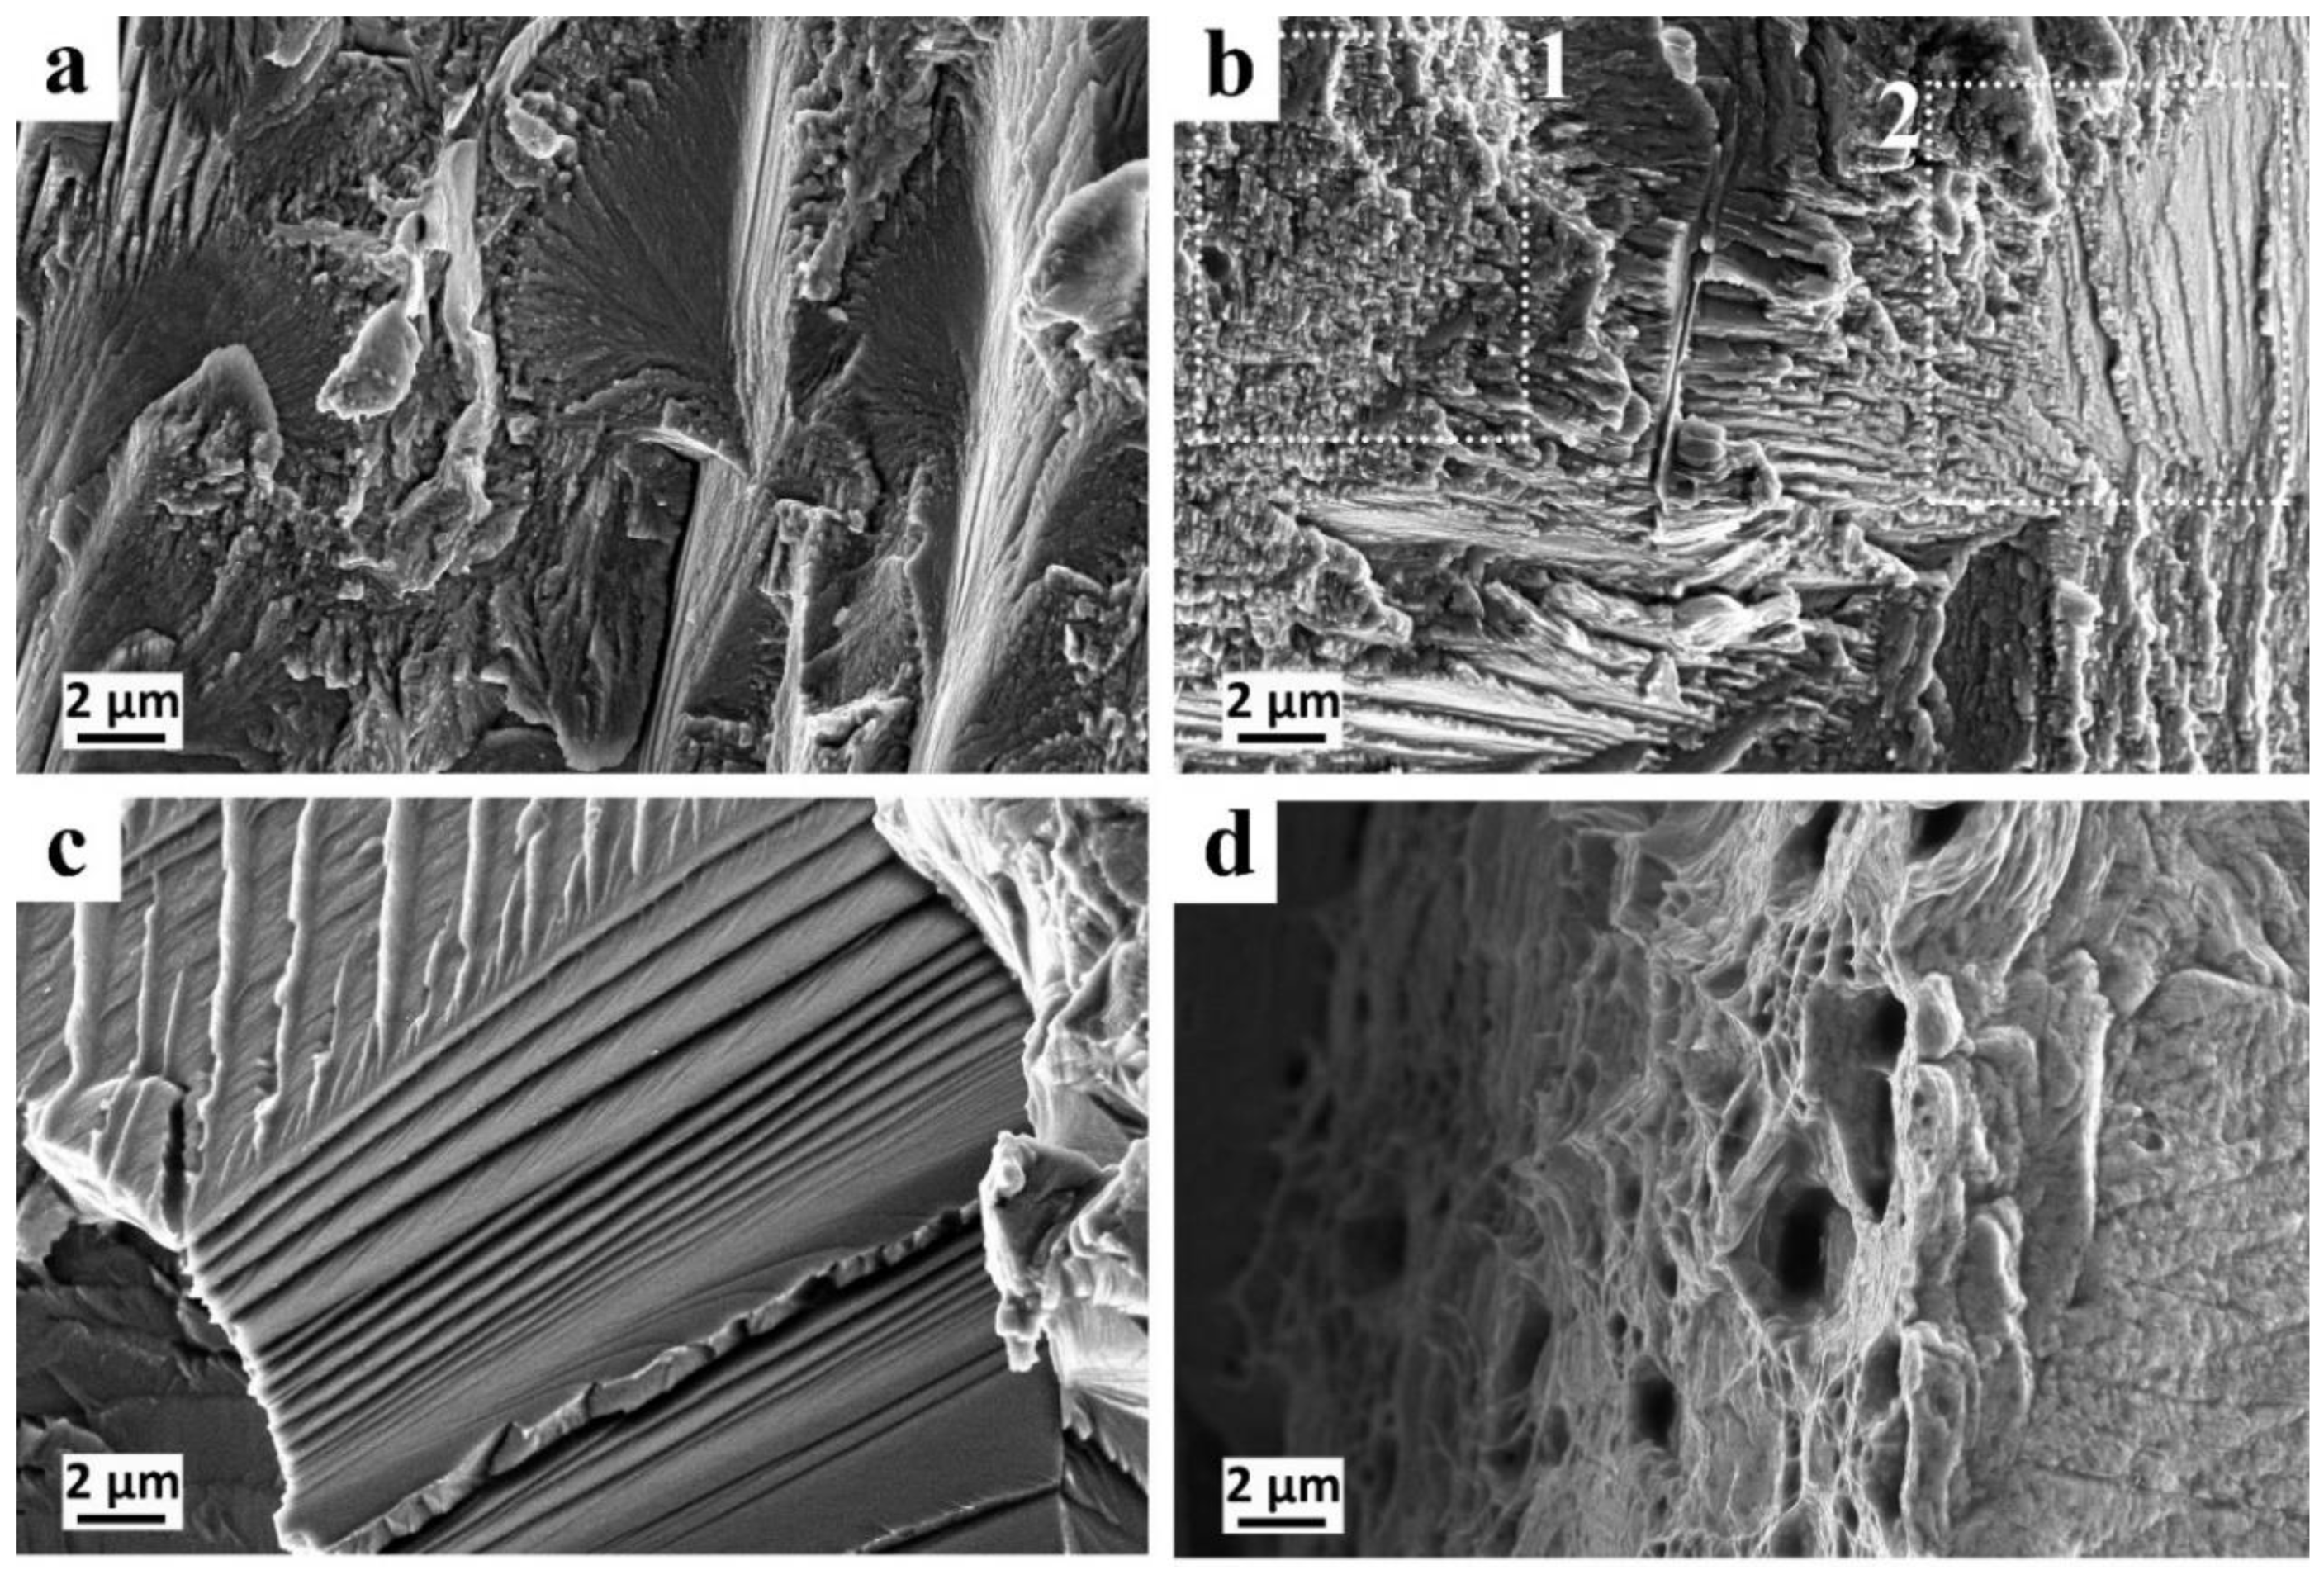
To further assess the mechanical properties, SPT was conducted on all investigated alloys, except for AlCoCrFe (w/o Ni) due to its high brittleness. After SPT, each alloy was subjected to a fractographic evaluation using SEM, in order to characterize the fracture type (see
Figure 8a–d). As expected, the FCC CoCrFeNi (w/o Al) alloy fractured in a ductile mode, manifested by dimples, characteristic of micro-void coalescence (see
Figure 8d). AlCoCrNi (w/o Fe), AlCrFeNi (w/o Co), and AlCoFeNi (w/o Cr) alloys displayed a brittle trans-granular fracture, as shown in
Figure 8a–c, respectively. The fracture in these alloys is of a cleavage type, characterized by facets caused by separation across crystallographic planes due to the crack propagation. Fracture of the AlCrFeNi (w/o Co) alloy, shown in
Figure 8b, exhibits micro-facets that can be correlated to differences in the morphology of the DR to ID regions, while the first was finer than the latter. The two areas of fractures are marked by rectangles 1 and 2 on
Figure 8b. Coarse microstructure of the AlCoFeNi (w/o Cr) alloy imposed coarser cleavages on the fractographic images (see
Figure 8c).
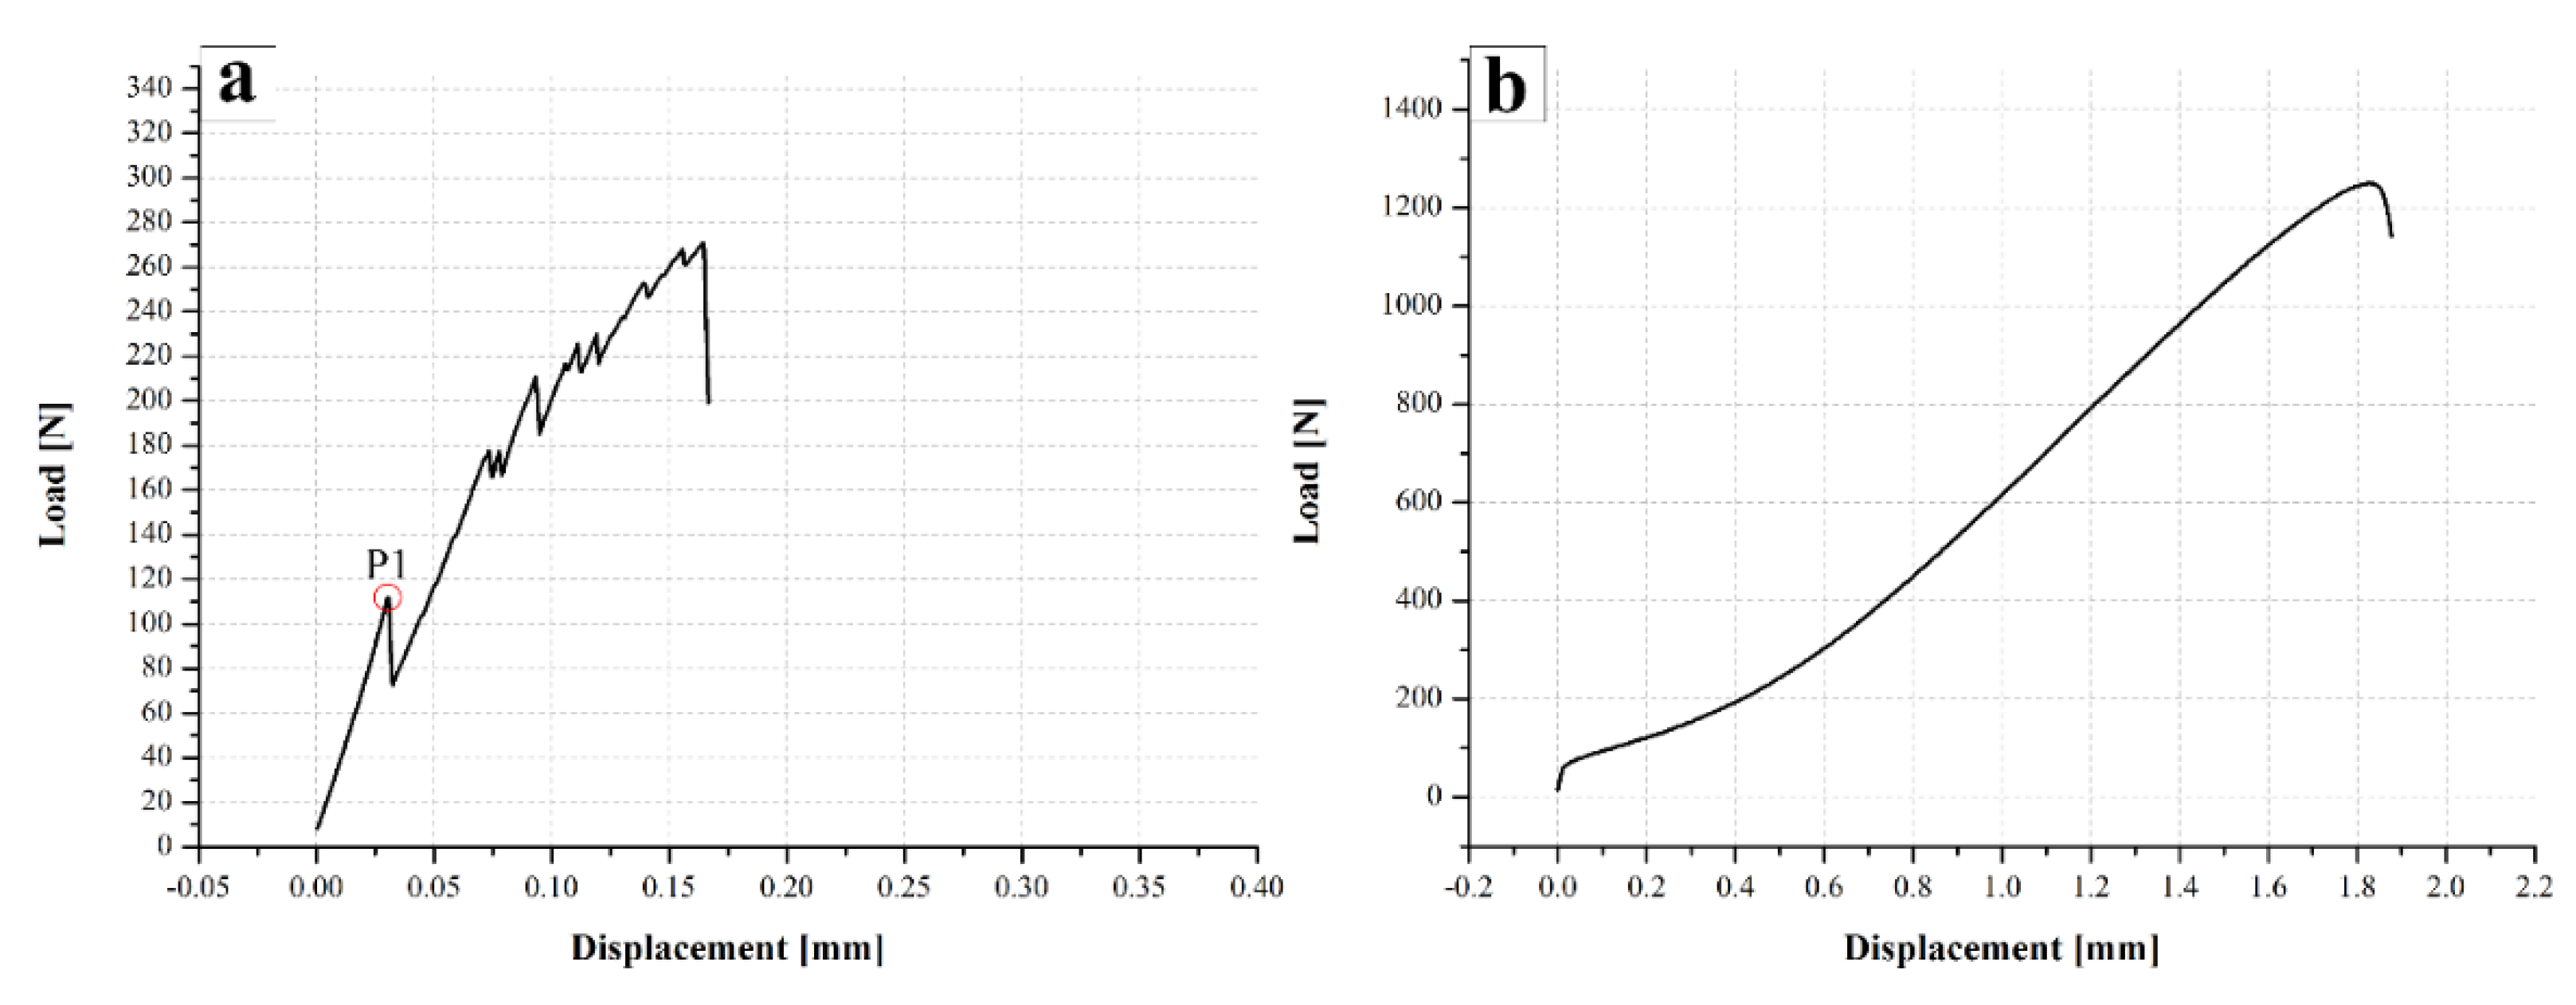
As expected, SPT force vs. displacement curves of the FCC and BCC + B2 dual phase alloys looked completely different, as seen in
Figure 9a,b for the AlCrFeNi (w/o Co) alloy (as an example of the BCC + B2 mixture alloys studied here) and CoCrFeNi (w/o Al) alloy, respectively. CoCrFeNi (w/o Al, i.e., FCC solid solution) presented a typical ductile material curve. Other studied alloys displayed a “zig-zag” shape curve with pop-ins in the load–displacement curves. Such pop-ins can be the result of discrete events of crack propagation and arrest, which were triggered by an increase of the load [
19,
20]. The weaved B2/BCC microstructure can explain this behavior. The P1 values for the brittle alloys (see
Figure 9a, and
Table 3) were measured at the first pop-in. The energy values, shown in
Table 3, represent the area under the load–displacement curve, until the first pop-in phenomenon (seen at
Figure 9a). The P1 values of the AlCoFeNi (w/o Cr) alloy were the largest, and the smallest were measured in the AlCoCrNi (w/o Fe) alloy. These values are in line with their micro-hardness, as shown in
Table 2.

 ,
, 


