1. Introduction
One of the most common and frequent maintenance items for vehicles and heavy equipment is changing of engine oil. Although some types of equipment have an indicator of remaining oil life, these indicators are generally based on distance or time of operation and do not account for variations in operation and oil quality. When an oil life indicator or manufacturer recommendation signals an oil change interval for engine oil that has considerable remaining life, it is considered low-cost insurance. However, if the remaining oil life expires before an oil change signal, expensive damage may occur to an engine. An accurate means of measuring oil life would reduce waste and minimize engine damage due to contaminated oil.
Oxidation is the primary process that shortens engine oil life, in the absence of external contaminants. Oxidation is the interaction between oxygen and hydrocarbons, which depends on operating conditions and oxidation resistance of the oil [
1]. The oxidation process generates harmful acids in engine oil [
1,
2,
3,
4]. Oil additives of antioxidants and detergents are critical to counteract oxidation. Antioxidants react with free radicals to form stable molecules and prevent hydrocarbon breakdown and carbon-based acid formation [
5]. Detergents are used to neutralize any acids present and to minimize acidic effects of corrosion and deposits on the metal surfaces of an engine [
3,
6]. If oil use continues after detergent additives have been reduced, sludge forms [
7] and oil viscosity increases [
4]. Standardized engine oil analysis methods [
8] are available to estimate the remaining ability of detergents to neutralize acids by measuring the total base number (TBN; mg·KOH/g) of engine oil. TBN is a measure of the detergent content in engine oil and thus its ability to neutralize acidic compounds [
3]. TBN was recommended as an indicator of when to change oil [
3] with a rejection limit of 50% of the TBN of new engine oil [
9] and experimental on-line sensors were developed for engines [
10].
Alternative methods of measuring oxidation resistance of engine oil have been studied as precursors to a real-time sensor system. These include custom sensors [
11,
12,
13,
14,
15,
16,
17,
18,
19,
20] and spectrometers [
2,
21,
22]. Terahertz (THz; 100 GHz to 10 THz) is a more recent spectroscopy advancement that uses terahertz waves with amplitude measured in the time domain for the desired sample and an empty sample holder (reference). The comparative results of the sample and reference are generally transformed into a frequency domain and characterized as the refractive index and absorption coefficient. THz time-domain spectroscopy (THz-TDS) has been applied to various lubricating oil products. An oil base stock and eight different levels of zinc dialkyldithiophosphate (ZDDP) additives were characterized by THz-TDS and distinguished, with the absorption coefficient increasing with ZDDP concentration [
23]. The THz-TDS absorption coefficient distinguished among three base oils and four oils with additives [
24]. The same study found noticeable differences in the absorption coefficient of the same engine oil when fresh, after six months of use, and after three years of use with the absorption coefficient increasing with time of use [
24]. A THz-TDS study of three grades (SAE 5W20, 10W30, 20W50) of gasoline engine oil found that the refractive index increased with oil viscosity [
25]. Hydraulic, diesel engine, gasoline engine, and gear oil were compared with THz-TDS and the refractive index was used to determine the type of oil based on its viscosity and different absorption coefficient peaks were noted for the oils [
26]. Gasoline engine oil (SAE 5W20) was contaminated with 0%, 4%, 8%, and 12% gasoline fuel and characterized by THz-TDS, resulting in both the refractive index and absorption coefficient being used to distinguish among the contamination levels [
27]. Both the refractive index and absorption coefficient of THz-TDS distinguished among 0%, 0.1% and 0.2% water contamination of diesel engine oil with the refractive index and absorption coefficient increasing with water contamination [
28]. When gasoline engine oil (SAE 5W20) was thermally oxidized for 0 h, 48 h, 96 h, and 144 h and submitted to THz-TDS, the absorption coefficient was able to distinguish among the four oxidation times when the same cuvette was used [
29].
This study used a similar approach to that of a prior study [
29], but with diesel engine oil that had a different additive package than gasoline engine oil. The same method for thermally oxidizing engine oil was used, but with six oxidation times at intervals of 24 h instead of 48 h.
2. Materials and Methods
2.1. Engine Lubricating Oil
A 9.5 L container of SAE 15W40 (Shell Rotella T; API Service CJ-4/SM) diesel engine oil was obtained from a local retailer in Carbondale, IL, USA. All samples for this study originated from this single container. SAE 15W40 oil is a multi-viscosity oil commonly used in diesel-powered equipment.
2.2. Thermal Oxidization System
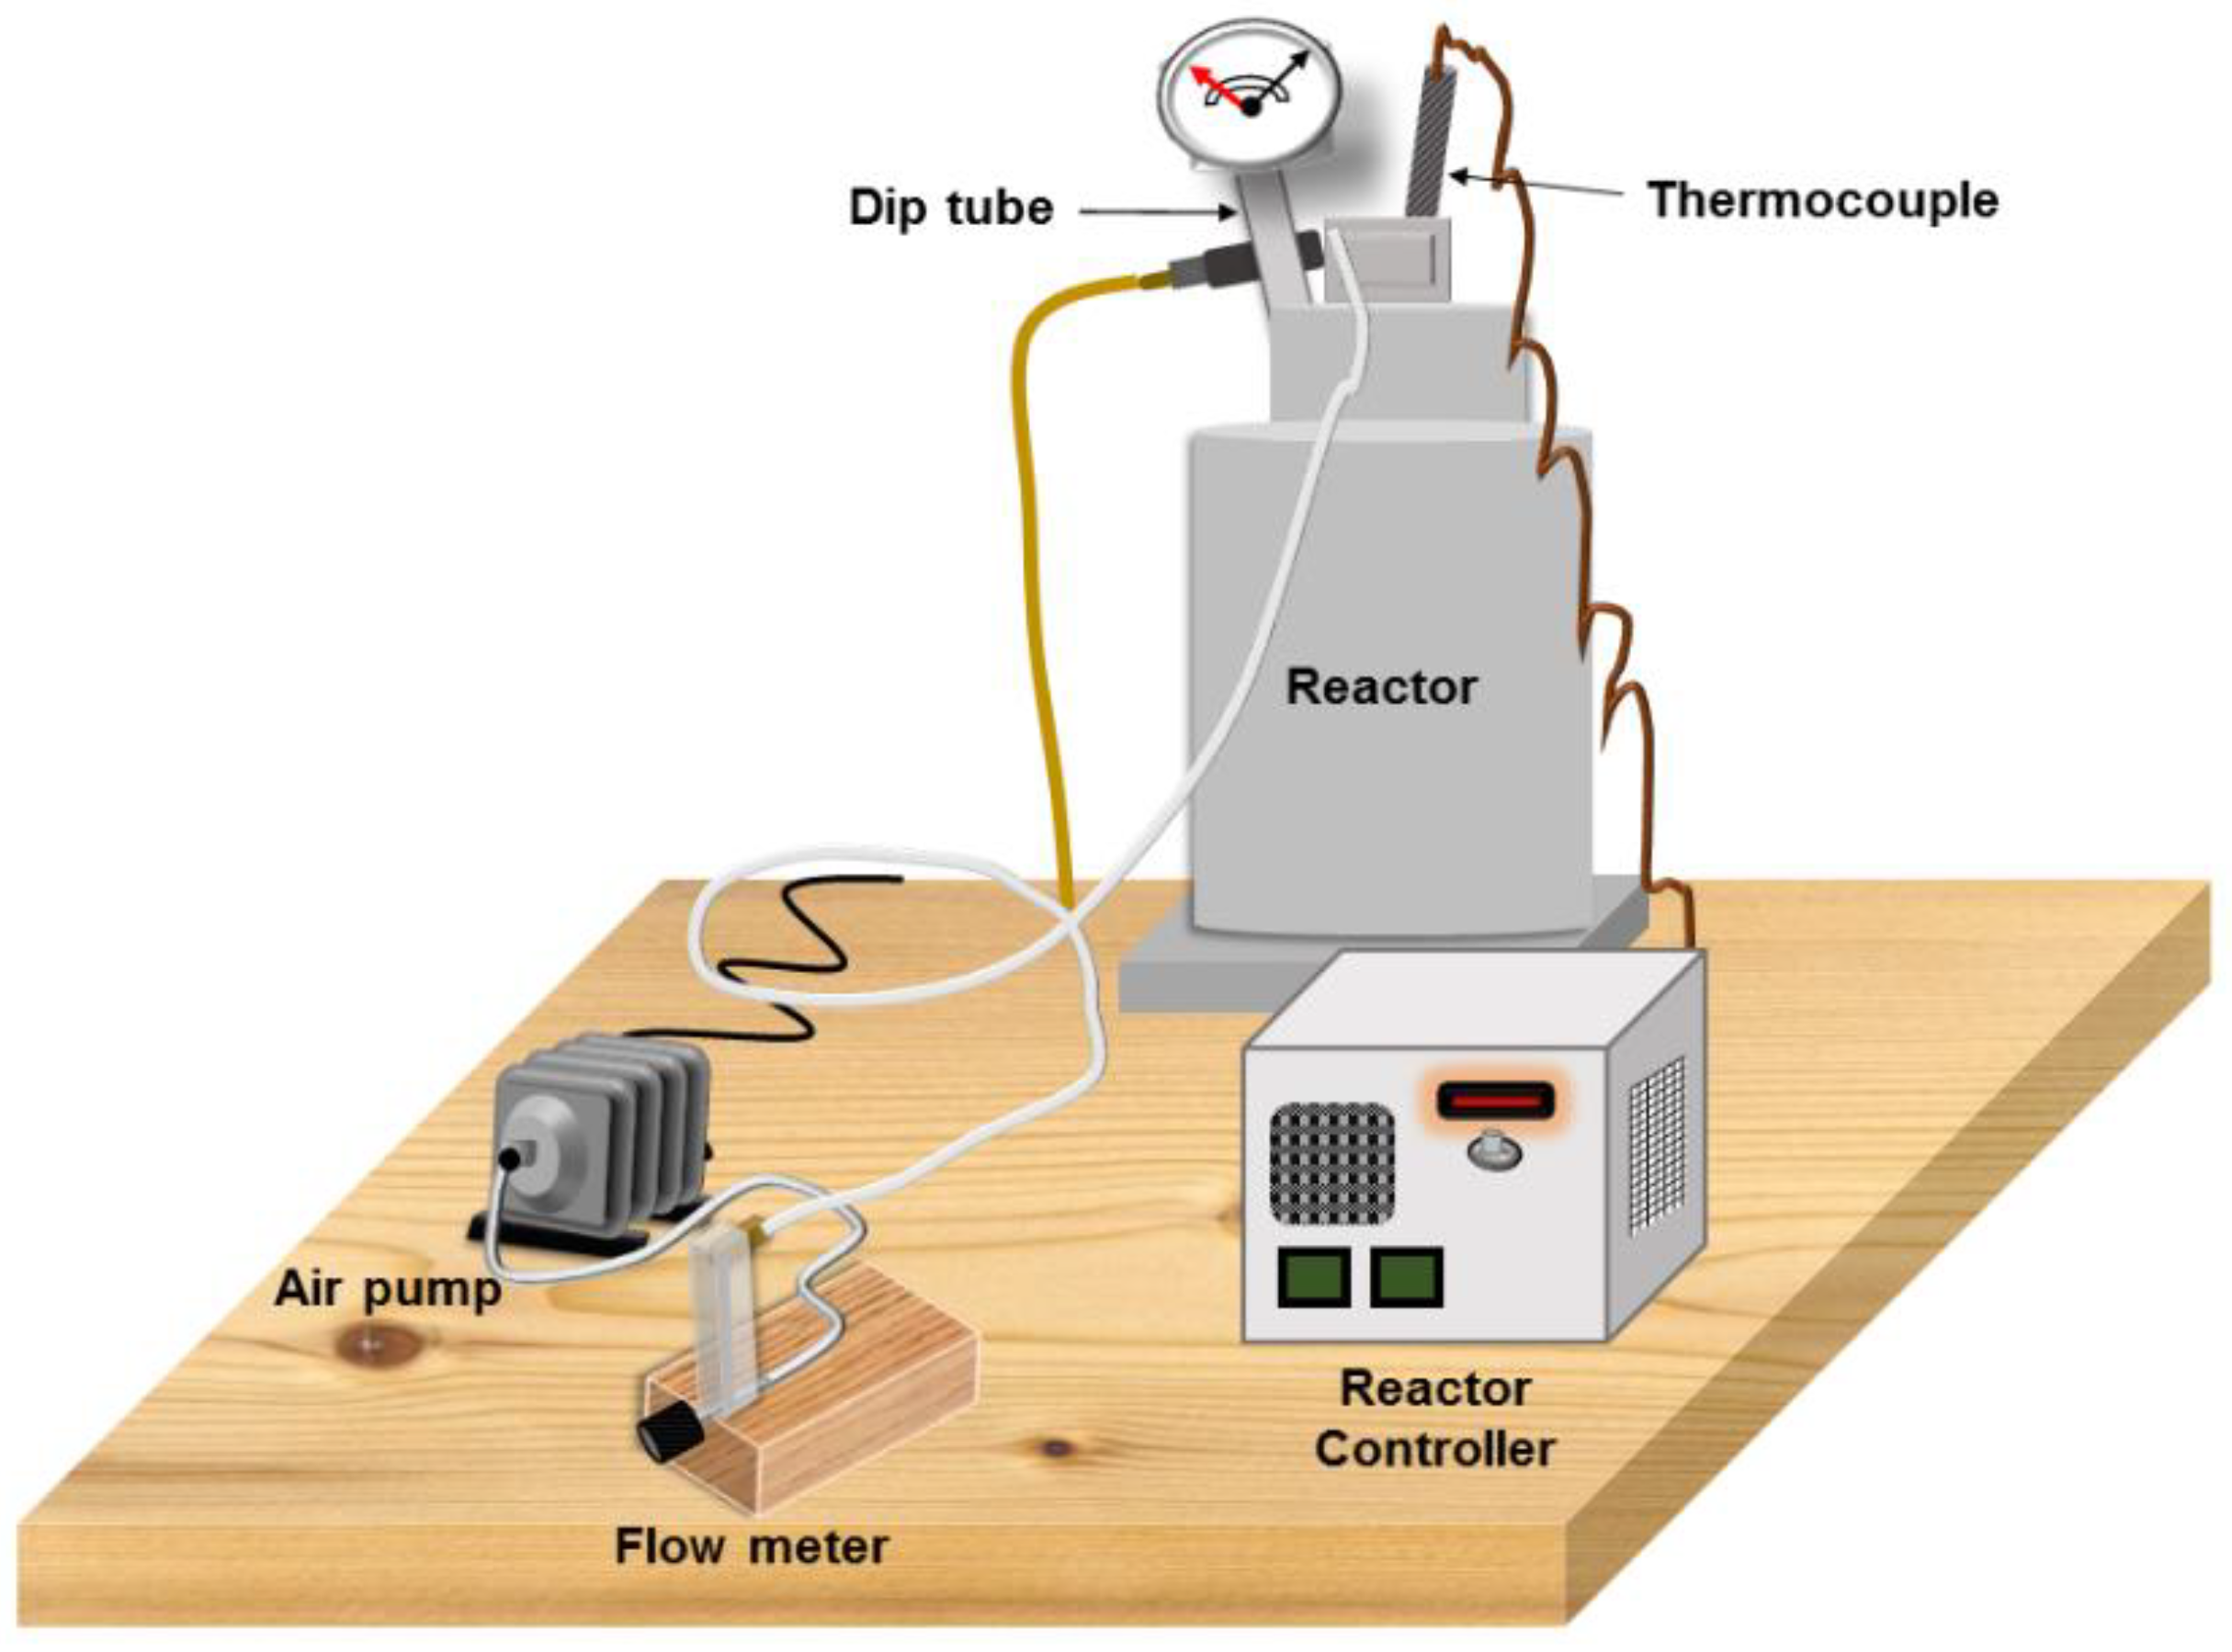
An available reactor (model 4838, Parr Instrument Company, Moline, IL, USA;
Figure 1) was used to thermally oxidize diesel engine oil. A 1200 mL cylinder with a bolt-on cylinder head was used to oxidize 500 mL of fresh engine oil for each desired oxidation period. A thermocouple inserted in the thermocouple well of the reactor cylinder head was connected to the reactor controller for temperature control within 1 °C of the 180 °C [
30,
31,
32] set temperature for oxidation. Ambient air was injected into the oil at a rate of 1 L/min [
30,
31,
32] via an air pump (AC0-002, Yuting, Zhoushan, Zhejiang, China), a flow meter (FL-2013, Omega Engineering, Inc., Norwalk, CT, USA), plastic tubing (6 mm I.D × 10 mm O.D), and a dip tube to inject air at the bottom of the oil volume. The air bubbled up through the oil and exited the reactor via an exhaust port in the cylinder head. Oxidation cycles of 24 h, 48 h, 72 h, 96 h, and 120 h were completed to provide the oxidized oil samples for this study. After allowing about 90 min for oil to cool, the oil was poured into a 500 mL amber glass container with a PTFE lined polypropylene cap (Thermo Fisher Scientific, Rockwood, TN, USA). An enclosed cabinet was used to store oil to limit light exposure.
The oxidation times used in this study were selected to achieve noticeable differences in viscosity and TBN. The times we used cannot be directly related to prior studies as oil formulations, temperatures, and air injection methods influence the speed of oxidation effects.
2.3. Oxidized Oil Sample Analysis
A sample (100 mL) from each of the oxidation times of the diesel engine oil and a fresh sample were poured into a separate plastic container provided by a commercial oil analysis lab. Blackstone Laboratories (Fort Wayne, IN, USA) was selected to analyze the oil since it had been used by other studies [
25,
33]. The laboratory performed a physical and chemical analysis, including TBN and kinematic viscosity at 40 °C using ASTM standards that were modified for production. Per oil analysis vendor, accuracy of the values was expected to be ±10% for TBN and viscosity.
The Experimental Semiconductor Physics Lab at Phillips University (Marbug, Germany) performed the THz-TDS measurements. Approximately 50 mL of fresh oil and 24 h, 48 h, 72 h, 96 h, and 120 h oxidized oil were placed in separate 60 mL amber Boston round glass containers, sealed with phenolic polycone caps (Fisher Scientific, Waltham, MA, USA), and shipped to Phillips University.
2.4. THz-TDS Spectrometer and Measurements
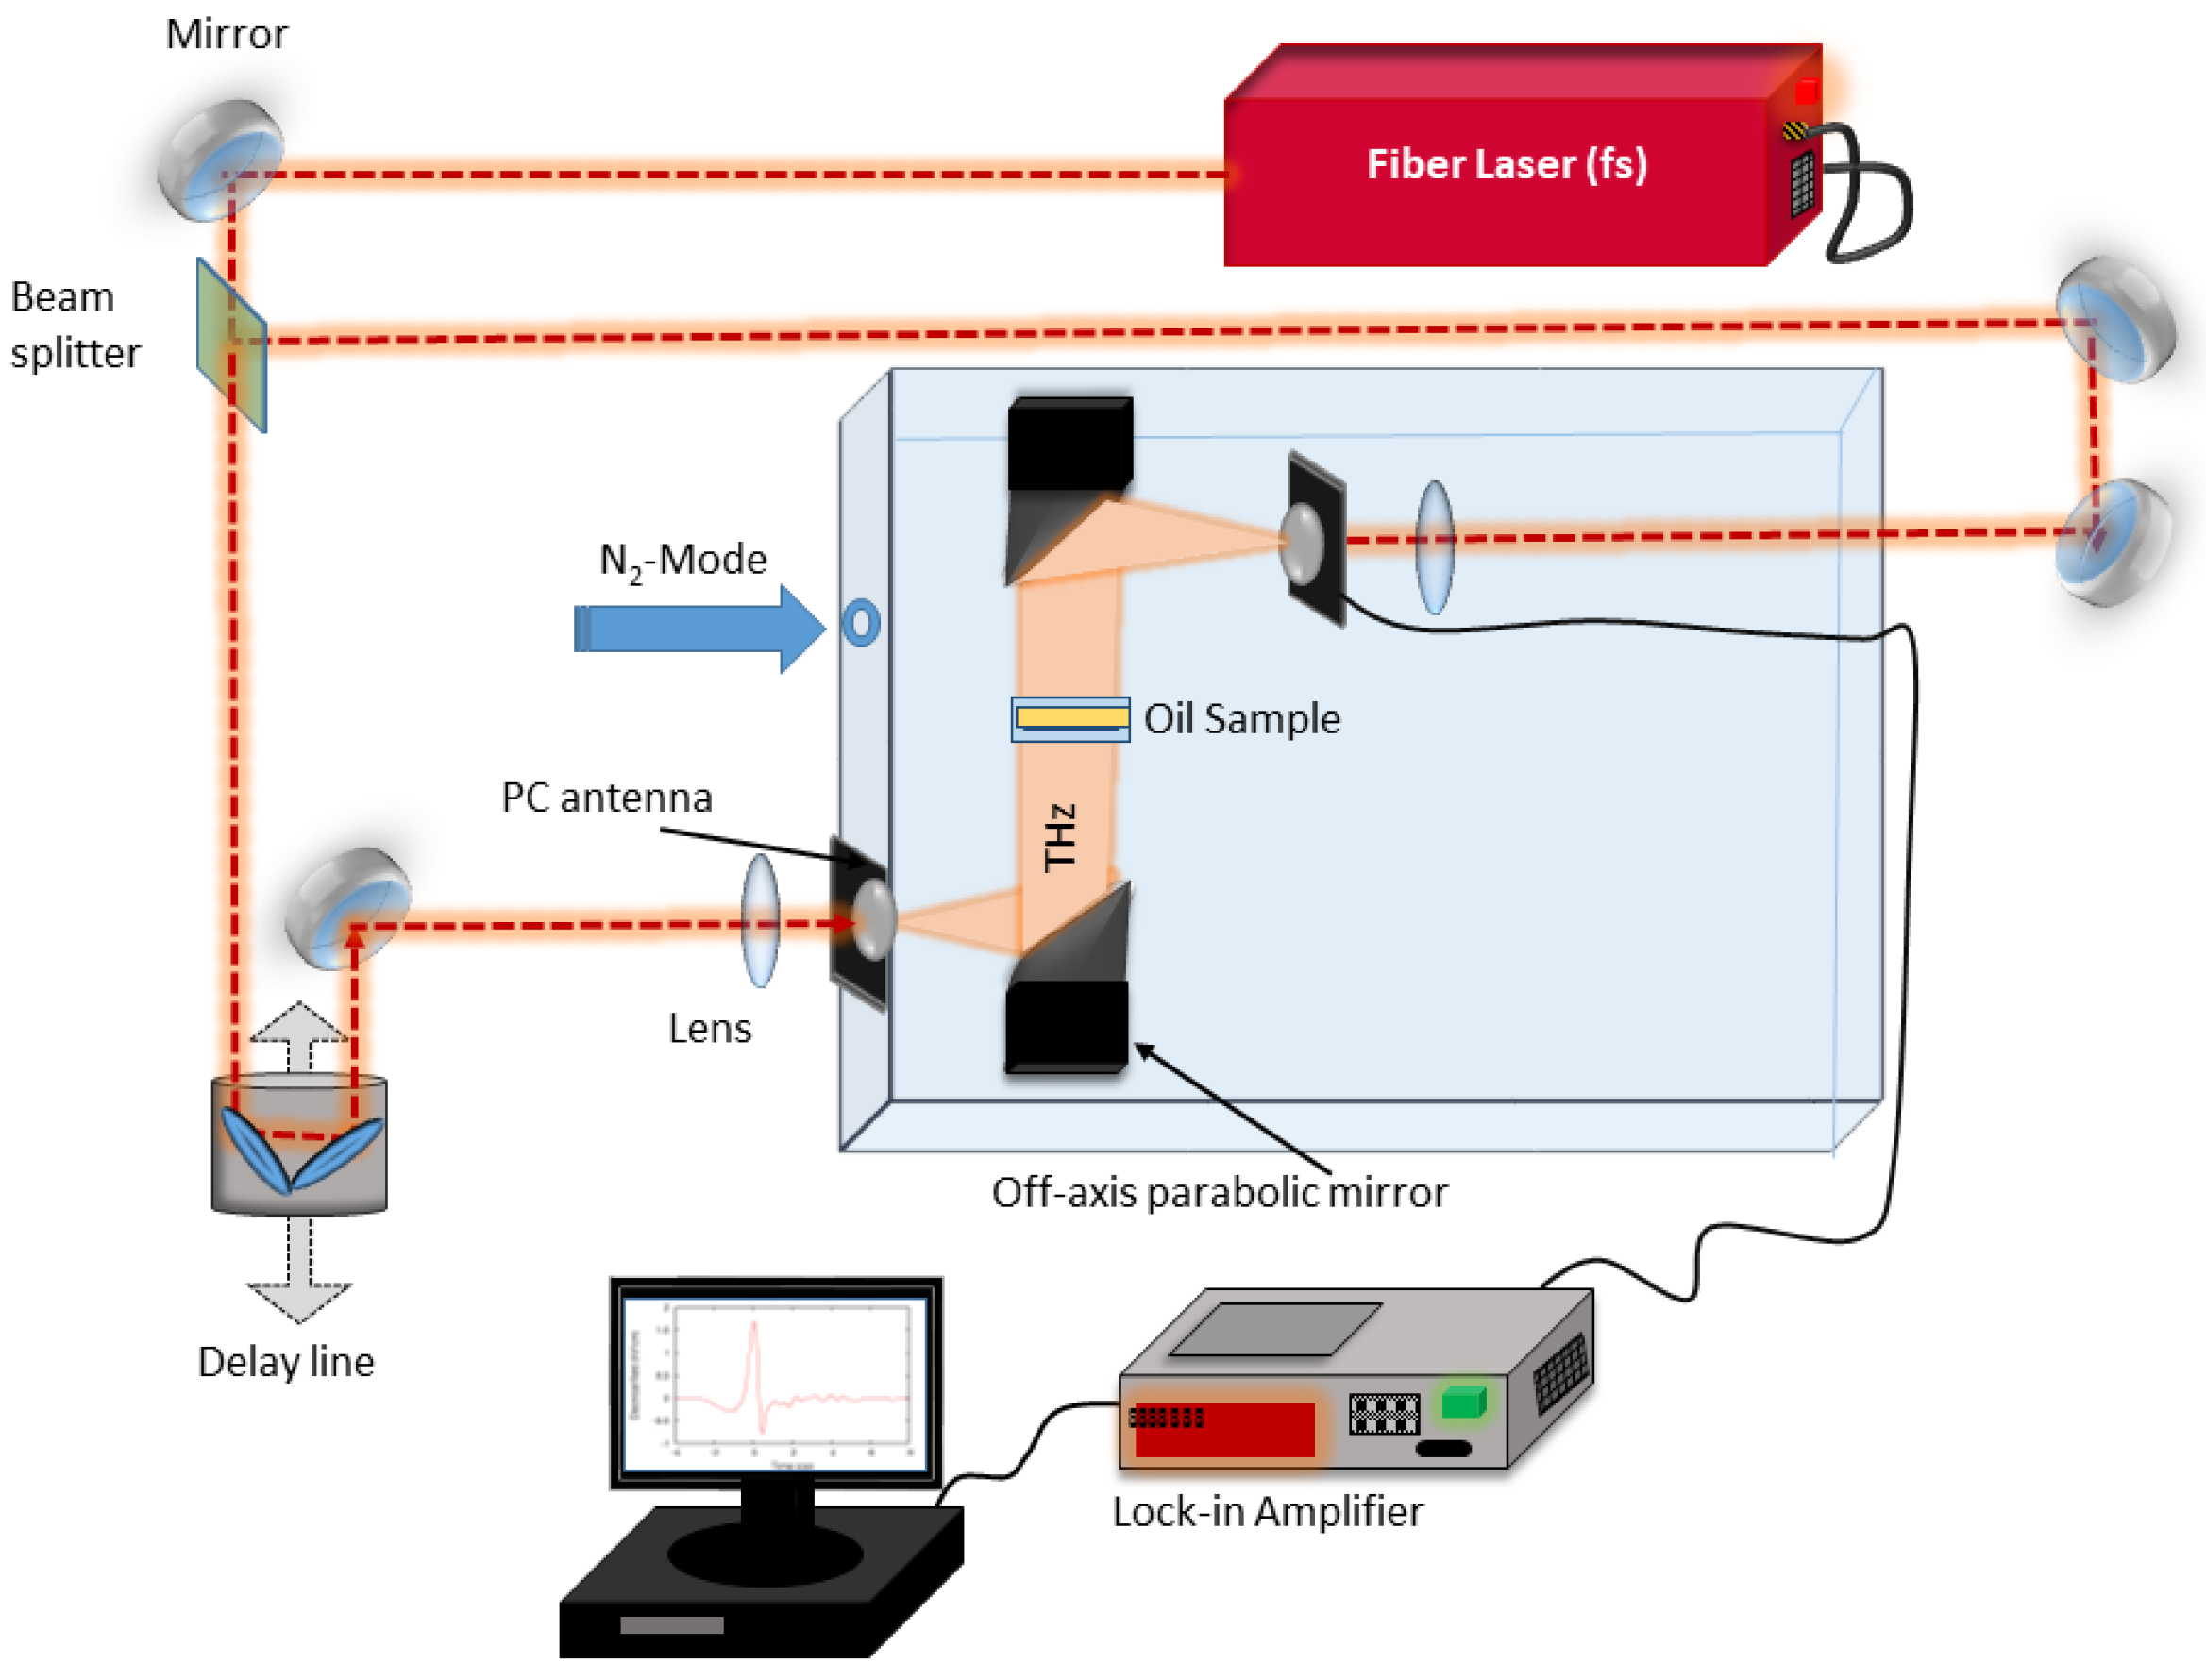
The THz-TDS spectrometer used in this study was similar to the one used in prior studies of oil [
34]. In the current setup, a fiber-based femtosecond laser (T-Light from Menlo Systems) with a central wavelength of 780 nm was used to excite charge carriers in the photoconductive antennas. Voltage applied to the emitter antenna was modulated and the lock-in technique was used for the current detection, which was induced by THz radiation hitting the detector. THz signals were recorded in the time-domain by gating the detector with time-delayed laser pulses. The pulse delay was controlled by a mechanical delay line. A pair of off-axis parabolic mirrors was used to collimate, guide and focus THz radiation. The sample was positioned into the collimated part of the THz beam path as shown in
Figure 2. Transmission measurements with the oil sample (sample measurement) and without the sample (reference measurement) were conducted under nitrogen atmosphere.
The extraction of the dielectric parameters from the reference and sample measurement was performed according to the algorithms previously described [
35,
36]. This way it was possible to characterize an unknown layer in a multilayer structure by knowing thicknesses and dielectric parameters of all other layers in the structure. A transmission measurement of a liquid placed in a cuvette presents such a three-layer structure. In this study, custom cuvettes were constructed of 700 μm thick, low absorbing (THz range) fused silica glass plates that were glued to metal holders yielding a surface area of 25.4 mm × 27.4 mm. For each glass plate, thickness and dielectric parameters were individually extracted before gluing them onto the metal holder. Once a cuvette was assembled, a transmission measurement with an empty cuvette was performed and its thickness was extracted. A set of five such cuvettes was assembled and characterized. Space between silica plates for oil samples was designed to be 5.9 mm, but varied up to 0.1 mm due to different glue layer thickness. These thickness variations did not affect the extraction of dielectric parameters as the thickness of the samples was taken into account during parameter extraction. All five cuvettes were filled with the same sample of oxidized engine oil. Then, the cuvettes were inserted into the THz-TDS setup and each cuvette was measured five consecutive times with both reference and sample measurements, resulting in 25 reference-sample pairs per oil sample. The cuvettes were cleaned and the process was repeated until all engine oil samples were measured.
2.5. Data Analysis
Descriptive statistics were calculated for each frequency and oxidation time for the refractive index and absorption coefficient. The values of the refractive index and absorption coefficient at 1.0 THz were reported to compare them with other studies. Analysis of variance (ANOVA; α = 0.05) was used to determine if there were significant differences among oxidation times and when significant, Fisher’s least significant difference (LSD) was used to determine which of the six oxidation times were different. One of the five cuvettes was randomly selected for analysis of a single cuvette setup and each of the five measurements was considered a pseudo-replication [
37]. When comparing among all five cuvettes, the mean of the five measurements of each cuvette was used for analysis. ANOVA and a Fisher’s LSD test were completed using SAS Enterprise Guide 7.1 software [
38].
3. Results and Discussion
Commercial engine oil analysis of TBN and kinematic viscosity (at 40 °C) from each oil sample was summarized in
Table 1. TBN generally decreased with oxidation time from 8.6 for fresh oil (0 h) to below 3.0 after 72 h. Although kinematic viscosity generally increased with oxidation time, as indicated by prior studies [
4,
7,
39], results of the testing lab were variable, presumably due to limited repeatability of the commercial lab analysis method.
Two measurement methods were used. The first method used the same cuvette for each sample and each sample was measured five times with THz-TDS. This measurement method represented a THz-TDS setup with a fixed cuvette, with measurement variation indicating homogeneity and repeatability of sampling. The second method used five cuvettes, with each cuvette used with each sample. This measurement method indicated variability when multiple cuvettes were used with the otherwise same THz-TDS setup. THz-TDS results were converted to a frequency domain with a resolution of about 10 GHz. In the range 0.3–1.7 THz, 141 frequencies were used for analysis.
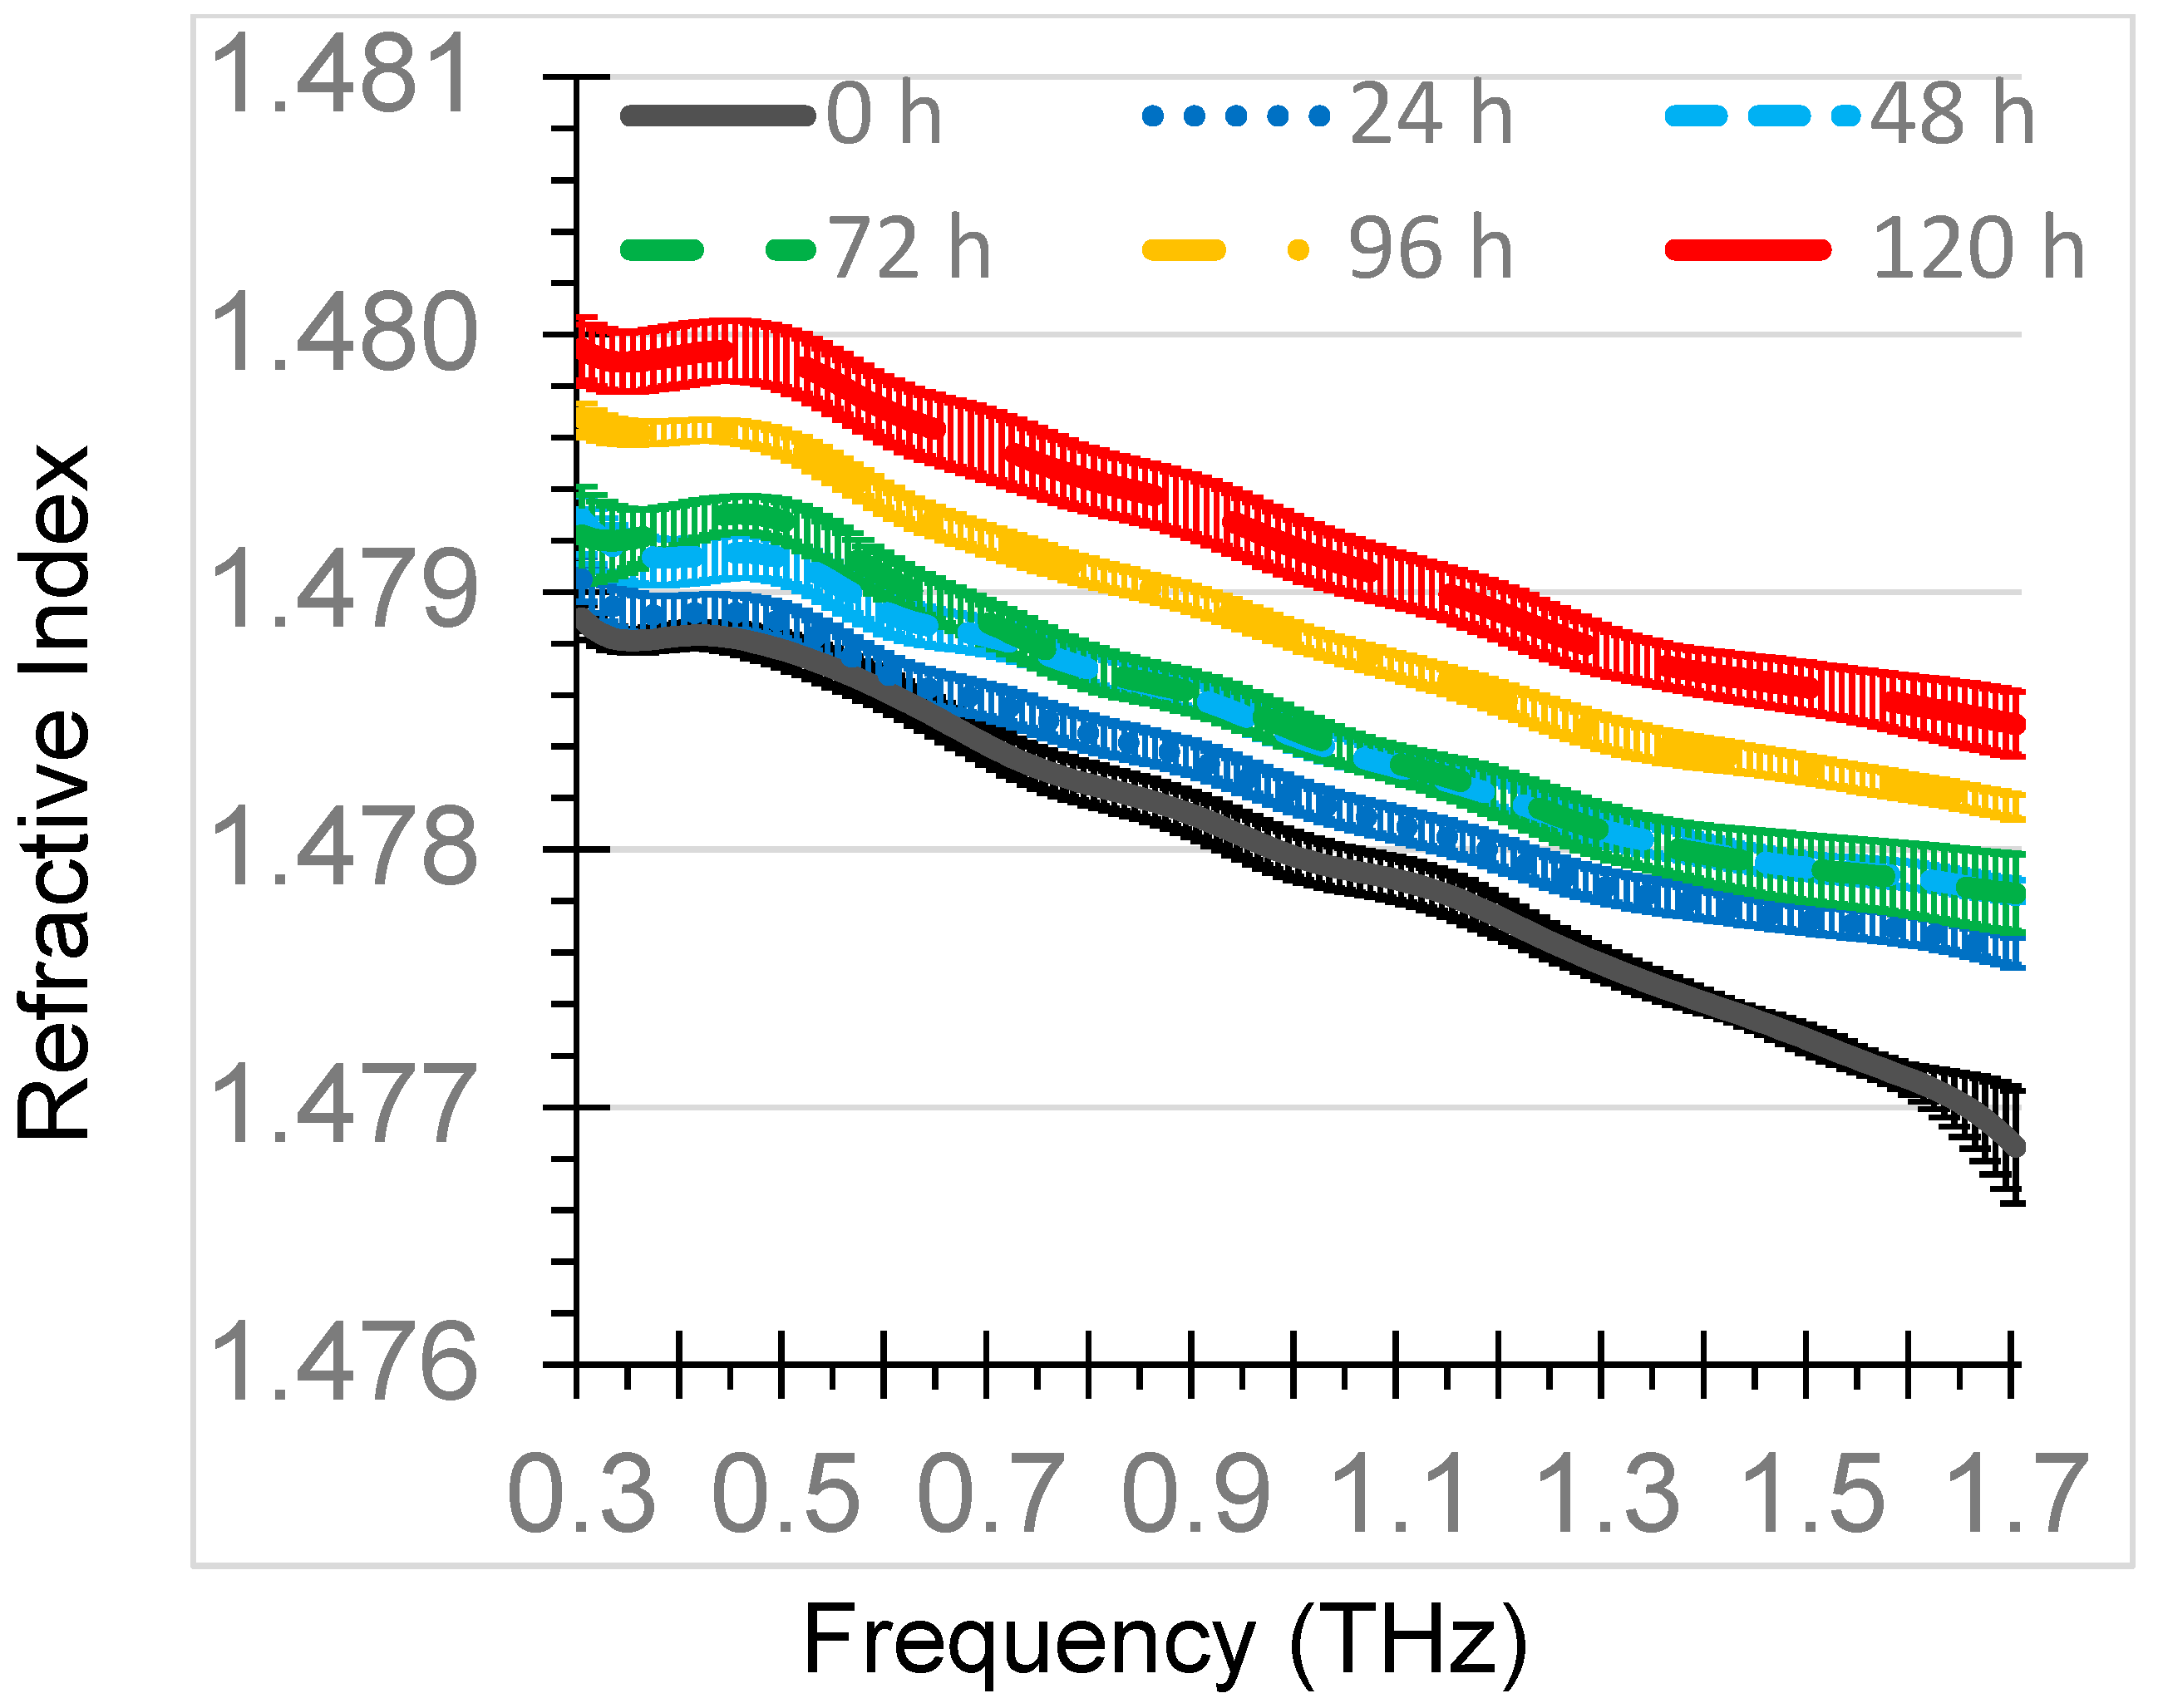
3.1. Refractive Index for Single Cuvette
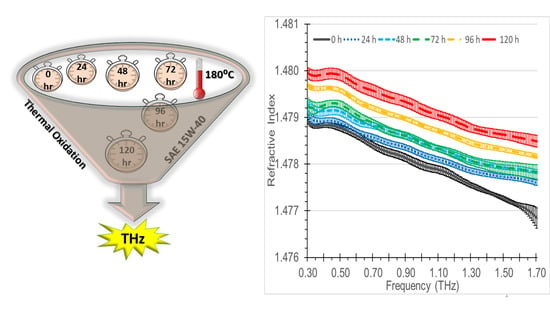
The mean refractive indices of THz-TDS of the oxidized diesel engine oil samples for each of the six oxidation times (0, 24, 48, 72, 96, 120 h) were summarized in
Figure 3. The refractive index only slightly decreased with an increase in frequency, ranging from about 1.480 at 0.3 THz to 1.477 at 1.7 THz. The refractive index values were generally unique among the thermal oxidation times with the exception of the 48 h and 72 h curves, which had considerable overlap.
The means of the refractive index at 1.0 THz for 0 h, 24 h, 48 h, 72 h, 96 h, and 120 h were 1.4780, 1.4782, 1.4784, 1.4785, 1.4788, and 1.4792, respectively. The highest standard deviation of measurements for the samples at 1.0 THz was 0.0001. The 1.0 THz refractive index of the 0 h sample was within 0.0001 of the refractive index of fresh diesel engine oil from a prior study using a similar THz-TDS configuration [
28]. The refractive indices of oxidized diesel engine oil were higher than oxidized gasoline engine oil refractive indices of 1.4666–1.4672 at 1.0 THz for thermal oxidation times of 0–144 h [
29]. These differences can be attributed to differences in gasoline and diesel engine oil formulations. The difference in the refractive index for fresh and 120 h oxidized diesel engine oil was 0.0012 at 1.0 THz, which was more than the difference in fresh and 144 h oxidized gasoline engine oil of 0.0006 at 1.0 THz, indicating that a diesel engine oil formulation may respond more in the THz range to oxidation than a gasoline engine oil formulation.
Increased oxidation time resulted in an increase in the refractive index for diesel engine oil, similar to water contamination [
28]. The increased refractive index with oxidation time was similar to oxidized gasoline engine oil [
29] and increased viscosity of gasoline engine oil [
25]. Most of the mean refractive index curves with 95% confidence interval bars did not overlap, indicating good discrimination among the oxidation times and good repeatability of the measurements.
Across the entire 0.3–1.7 THz range, there were highly significant differences (
p < 0.0001) among oxidation times, at each frequency. Each oxidation time was significantly different from others in the range 0.40–0.62 THz with the exception of no difference between 0 h and 24 h. In the range 0.66–1.7 THz, each oxidation time was significantly different from others with the exception of 48 h and 72 h. By combining frequency ranges, each oxidation time can be distinguished from all of the others. Diesel engine oil oxidized beyond 24 h had reached the less than 50% of fresh oil TBN discard level [
9] and this separation was discernable with this THz-TDS setup in the range of 0.66–1.7 THz.
Kinematic viscosity was expected to increase with oxidation time [
4,
7,
39] and molecular changes impacting viscosity possibly contributed to the increased refractive index along with other chemical changes that occurred due to decreased antioxidant additives, increased oxide formation, and decreased detergent additives. Additional studies are needed to determine which factors contributed to the increase in the refractive index. These data indicated good potential of THz-TDS to discriminate among all of the oil oxidation times, when the same cuvette and THz setup are used. With the same cuvette and THz setup, there may be systematic offsets that vary from the actual refractive index, but the offsets would be consistent among all measurements and thus the relative changes may be reliably discerned [
29].
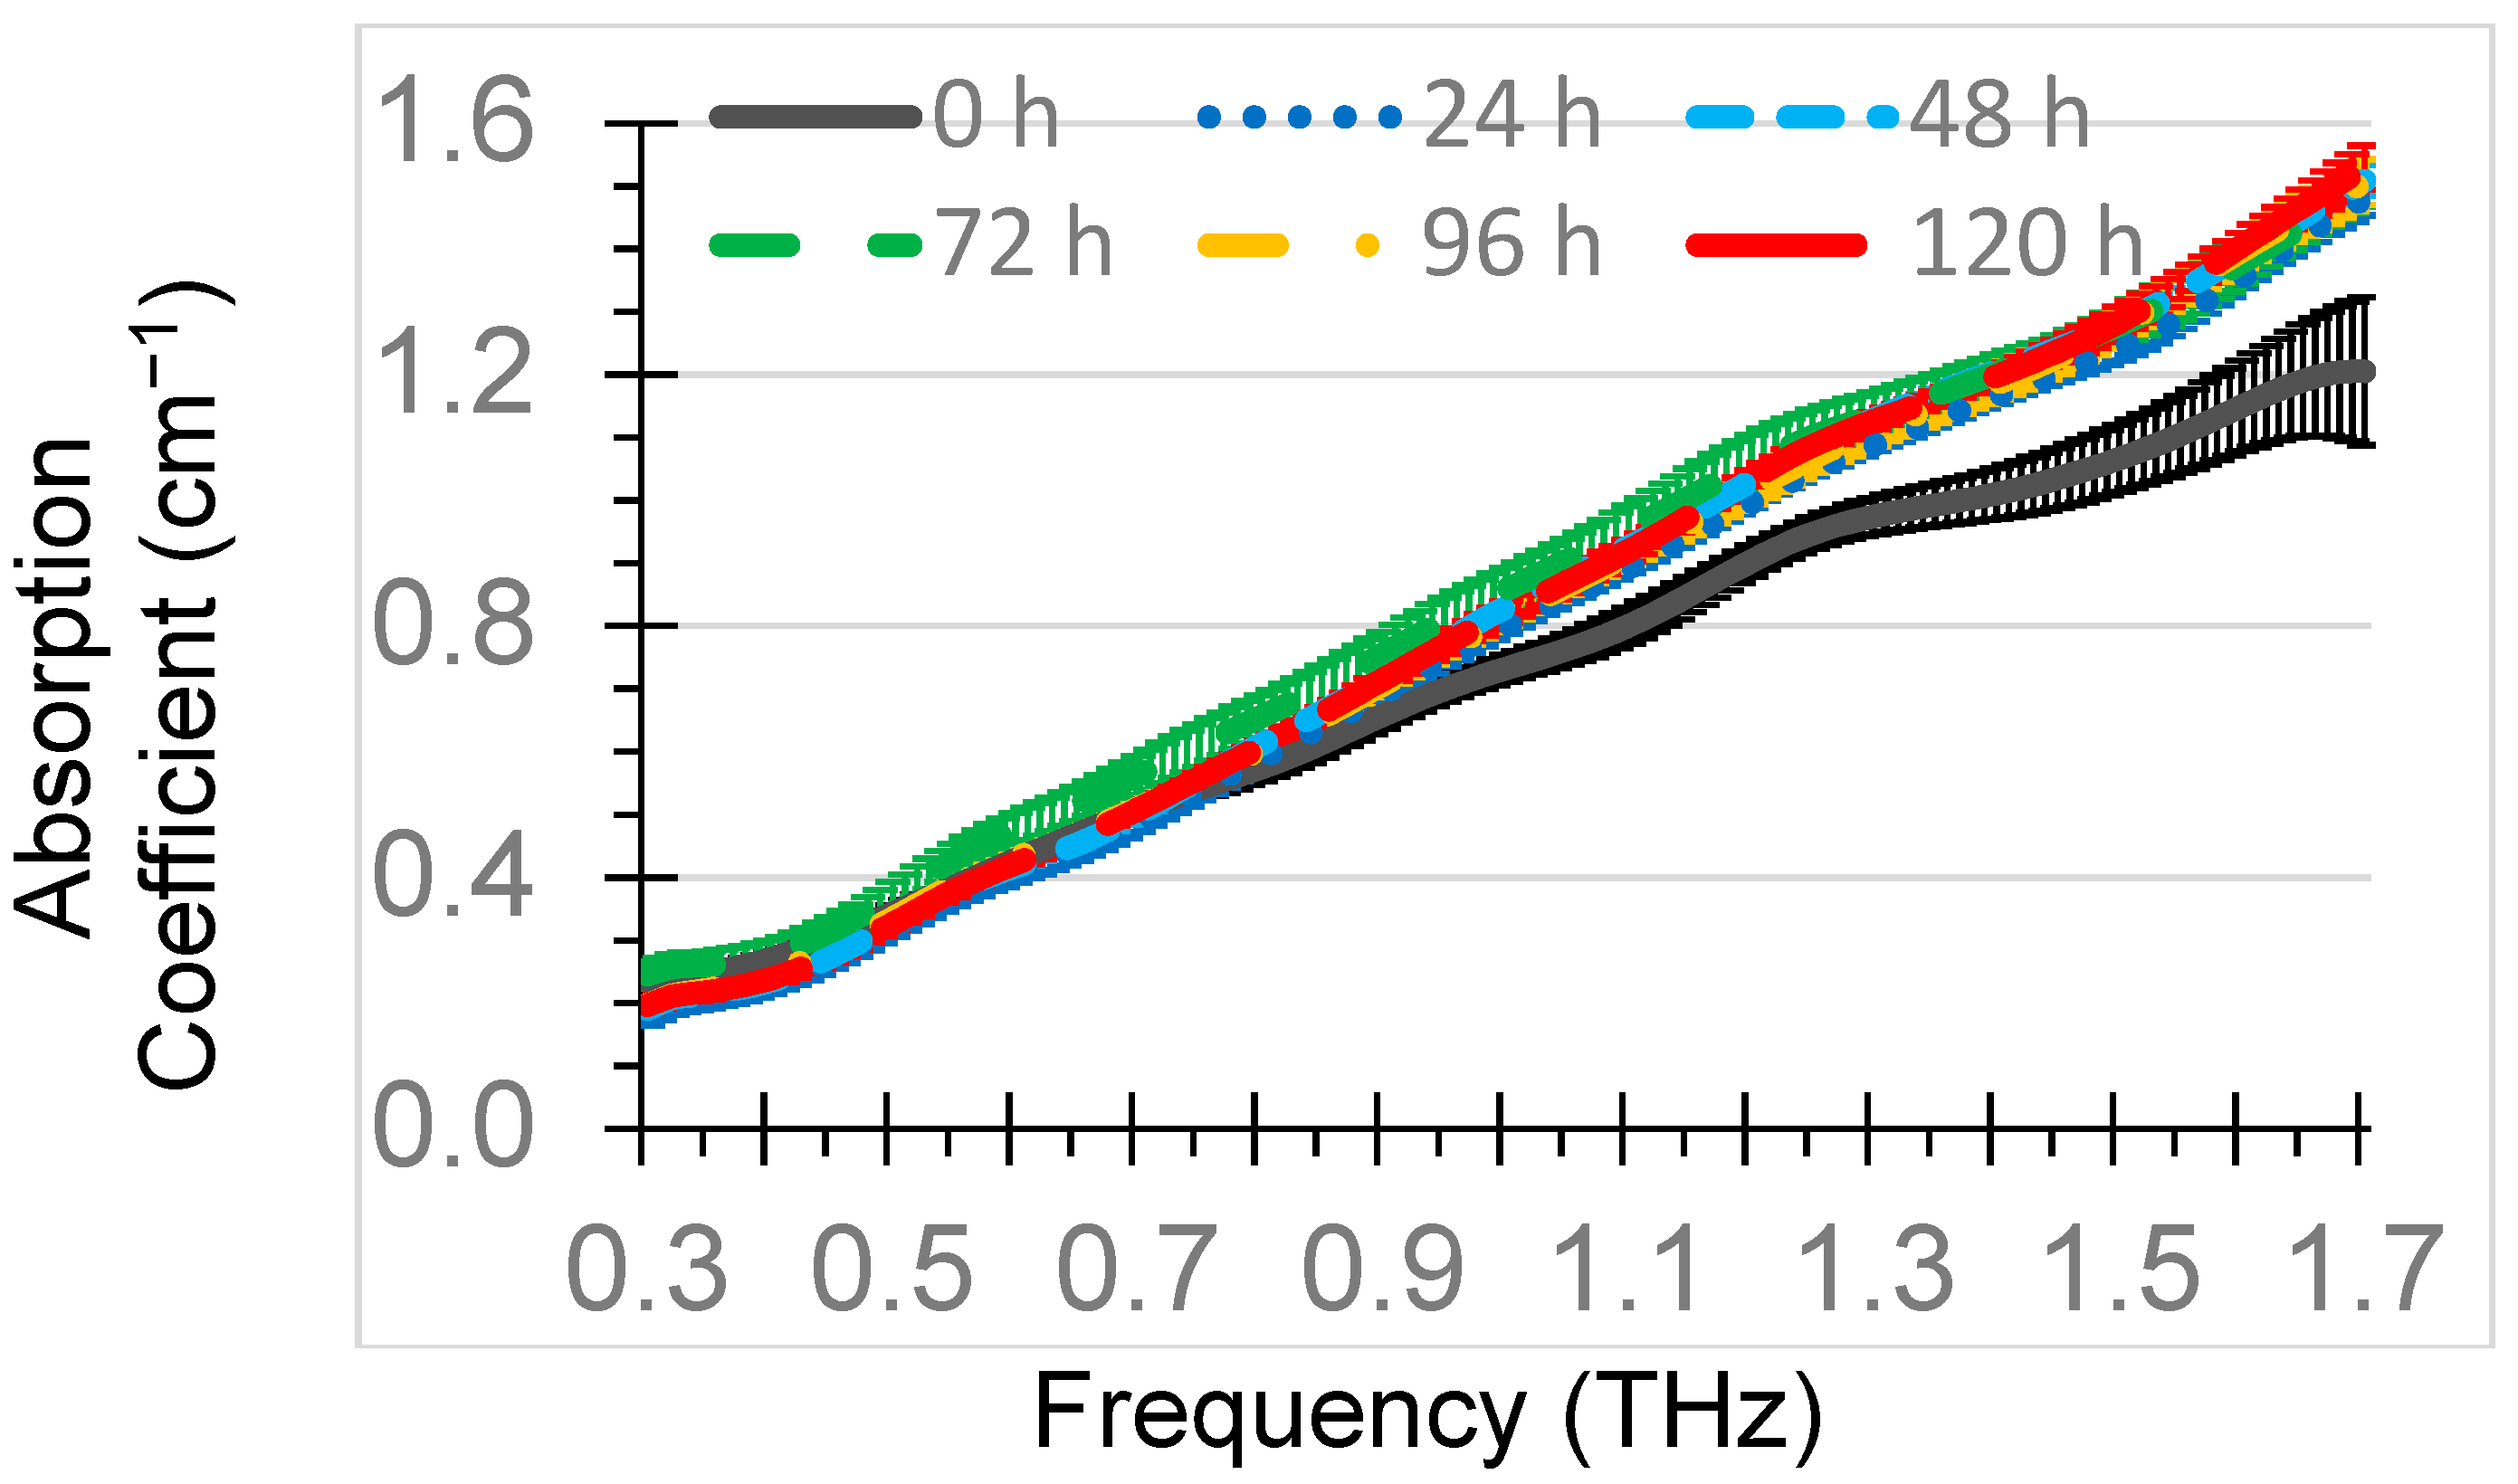
3.2. Absorption Coefficient for Single Cuvette
Mean absorption coefficients of each of the six oxidation times of the diesel engine oil were presented in
Figure 4. The absorption coefficient generally increased with an increase in frequency. Absorption coefficients ranged from 0.2 at 0.3 THz to 1.6 at 1.7 THz. The mean absorption coefficients at 1.0 THz for 0 h, 24 h, 48 h, 72 h, 96 h, and 120 h were 0.73 cm
−1, 0.80 cm
−1, 0.83 cm
−1, 0.86 cm
−1, 0.81 cm
−1, and 0.82 cm
−1, respectively. The highest standard deviation of measurements for the samples at 1.0 THz was 0.035 cm
−1. The absorption coefficients of oxidized diesel engine oil were higher than oxidized gasoline engine absorption coefficients of 0.60–0.63 cm
−1 at 1.0 THz for thermal oxidation times of 0–144 h [
29], attributable to formulation differences between the two types of oil.
While highly significant differences (
p < 0.01) existed among the absorption coefficients of the oxidation times across the entire 0.3–1.7 THz range, only the 0 h and 72 h means were significantly different from the others. Starting at 0.86 THz through 1.7 THz, 0 h had a significantly lower absorption coefficient than the other oxidation times. The absorption coefficient for 72 h was higher than the other oxidation times in the 0.44–0.98 THz range. Absorption coefficient results were unable to discern when TBN levels had reached 50% of the original level by distinguishing 24 h from the longer oxidation times. In this study, the absorption coefficient was not as good as the refractive index at discriminating among oxidation times. This was in contrast to results of oxidation of gasoline engine oil [
29] and may be attributable to formulation differences in diesel and gasoline engine oil and the greater thickness (15 mm) of the oil sample in the gasoline engine oil study.
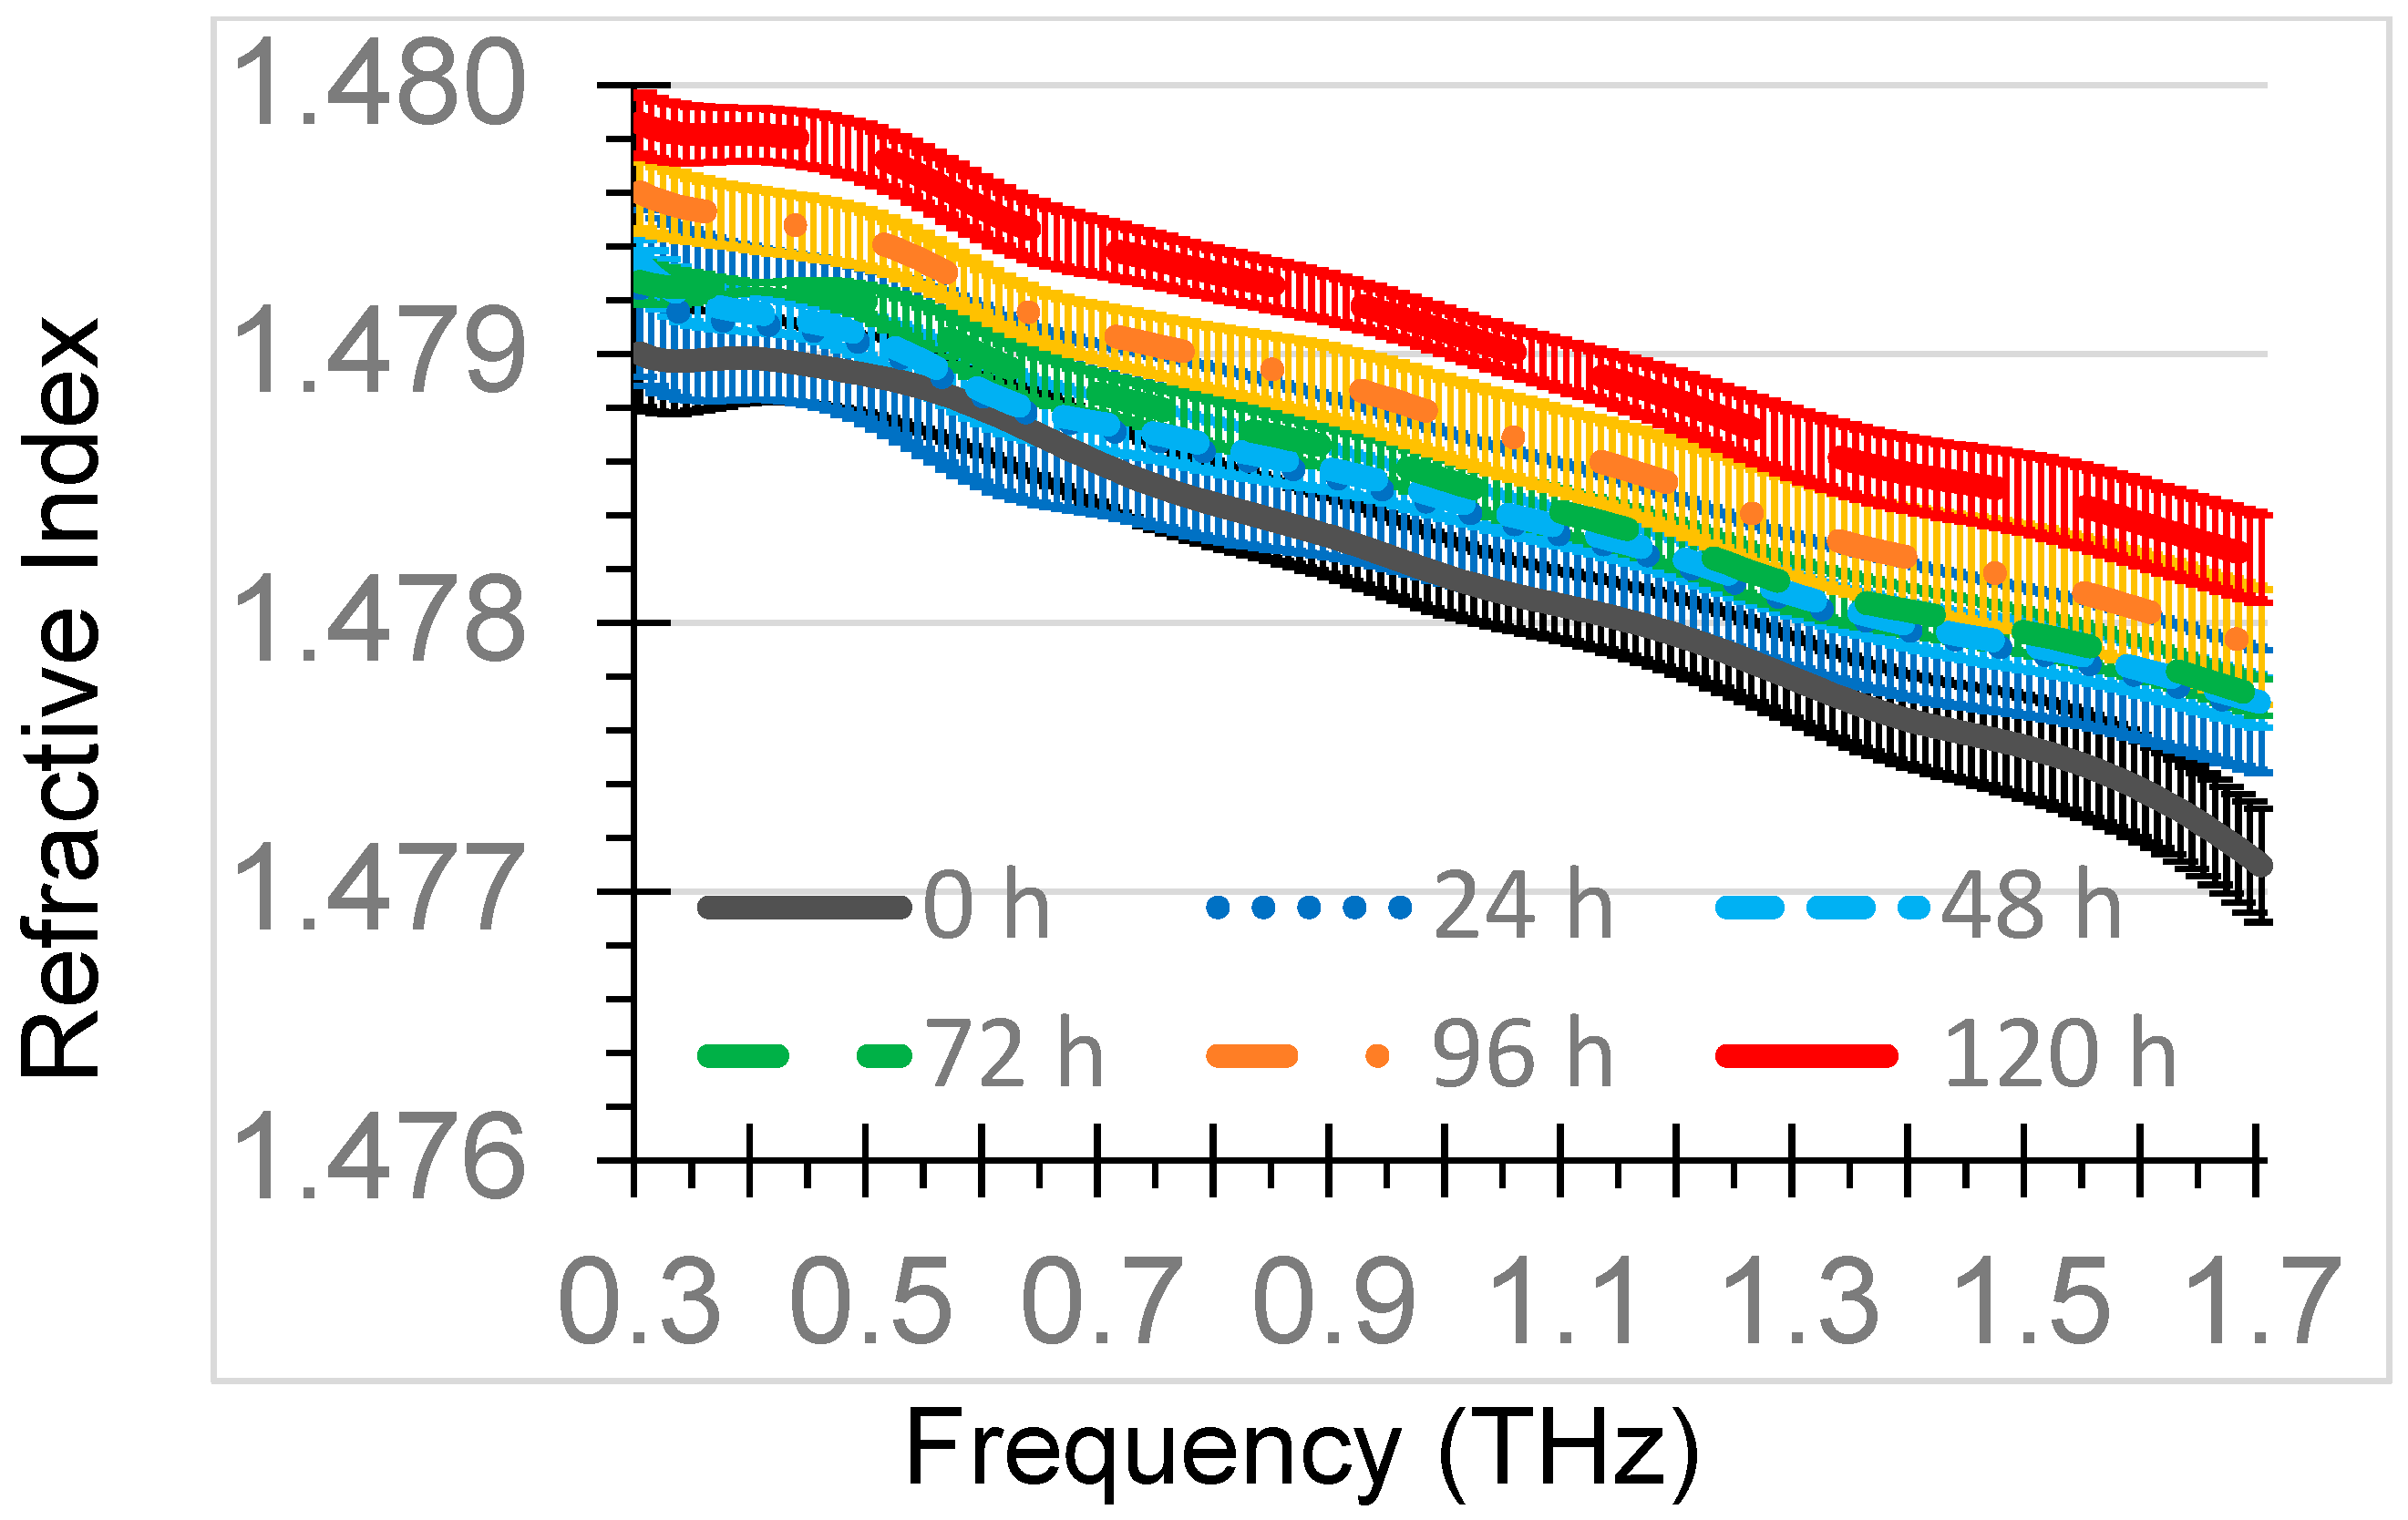
3.3. Refractive Index of Five Cuvettes
For a single cuvette, the refractive index was better than the absorption coefficient at discriminating among oxidation times, so only the refractive index was considered for multiple cuvettes. The mean refractive indices of five cuvettes of the oxidized diesel engine oil samples for each of the six oxidation times (0, 24, 48, 72, 96, 120 h) were summarized in
Figure 5. The results of the five cuvettes were similar to those of the single cuvette. The refractive index only slightly decreased with an increase in frequency, ranging from about 1.480 at 0.3 THz to 1.477 at 1.7 THz. The mean refractive index values were generally unique among the thermal oxidation times with the exception of the 48 h and 72 h curves, which had considerable overlap.
The means of the refractive index at 1.0 THz for 0 h, 24 h, 48 h, 72 h, 96 h, and 120 h were 1.4780, 1.4782, 1.4783, 1.4785, 1.4788, and 1.4791, respectively. The highest standard deviation of measurements for the samples at 1.0 THz was 0.0002. Increased oxidation time resulted in an increase in the refractive index. Some of the mean refractive index curves with 95% confidence interval bars did not overlap, indicating good discrimination among certain oxidation times.
Across the entire 0.3–1.7 THz range, there were highly significant differences (p < 0.0001) among all oxidation times, at each frequency. Fewer oxidation times were significantly different from each other compared to the single cuvette data. The best discrimination of oxidation times was in the 0.92–1.18 THz range with each of 0 h, 96 h, and 120 h significantly different from all other oxidation times. THz-TDS was unable to distinguish among 24 h, 48 h, and 72 h at any frequency in the 0.3–1.7 THz range. In contrast to a fixed THz-TDS setup with a single cuvette, data from multiple cuvettes were unable to distinguish 0 h and 24 h from the longer oxidation times.
The greater measurement variation among five cuvettes compared to multiple measurements of a single cuvette may be attributed to differences in cuvette assembly (potential tilt of the glued plates due to the difference in glue layer thickness), cuvette characterization, uncertainty of the thickness of individual layers and dielectric constants of glass plates, and lack of homogeneity among the oil placed in the different cuvettes. The differences in the refractive index were at the very limit of our “sensing” capabilities. When measuring with a single cuvette in a fixed system, the uncertainty due to the cuvette assembly and its characterization resulted in a systematic offset of the extracted values, which did not hamper the relative comparison of the samples.
4. Conclusions
Diesel engine oil (SAE 15W40) was thermally oxidized for different time periods (0 h, 24 h, 48 h, 72 h, 96 h, and 120 h).
Refractive index measurements using a single cuvette probably had an offset from the actual refractive index, but because the same cuvette was used the offset was consistent. With the single cuvette, the refractive indices for oxidation times of 0 h, 24 h, 48 h, 72 h, 96 h, and 120 h were statistically different from each other and the other times when two ranges of frequencies were considered. THz-TDS was able to differentiate these six oxidation times compared to only four oxidation times in a prior study with a different oil [
29]. Being able to distinguish 24 h from other times was important, because after 24 h the oil had a reduced TBN value that indicated rejection or time for an oil change.
When comparing the results of the five different cuvettes, THz-TDS was able to distinguish 0 h, 96 h, and 120 h from each other and the other oxidation times; however, the 24 h, 48 h, and 72 h oxidation times were indistinguishable. The multiple cuvettes were all assembled and characterized in the same way. Nevertheless, cuvette characterization also contained experimental errors which caused an increase in the confidence interval of the extracted dielectric parameters.
THz-TDS demonstrated potential for distinguishing among differences in engine oil caused by thermal oxidation times when a fixed setup with the same cuvette was used. This would be typical of a futuristic, minimized THz-TDS configuration for real-time evaluation of engine oil life. The system would need to be calibrated for the specific cuvette.
Based on this study, continued exploration of THz-TDS for engine oil contaminants is warranted to determine the extent of the THz-TDS’s potential to distinguish among other engine oil contaminants as well as chemical changes of the oil constituents.


