Abstract
In the analysis of tribological contacts, the focus is often on a singular question or result. However, this entails the potential risk that the overall picture and the relationships could be oversimplified or even that wrong conclusions could be drawn. In this article, a comprehensive consideration of test results including component and lubricant analyses is demonstrated by using the example of rolling contact. For this purpose, thrust cylindrical roller bearings of type 81212 with unadditized base oils were tested in the mixed-friction area. Our study shows that by using an adapted and innovative surface analysis, a deeper dive into the tribo-film is feasible even without highly sophisticated analytical equipment. The characterization of the layers was performed by the three less time-consuming spatially resolved analysis methods of µXRF, ATR FTIR microscopy and Raman spectroscopy adapted by Schaeffler. This represents a bridge between industry and research. The investigations show that especially undocumented and uncontrolled contamination of the test equipment could lead to surprising findings, which would result in the wrong conclusions. Simple substances, like hydrocarbons, are demanding test specimens.
1. Introduction
Due to the complexity of tribological questions, it is often necessary to focus on single aspects. This could cause the risk of losing information and interdependencies and poses the risk of losing sight of the bigger picture. Therefore, we conducted a comprehensive study utilizing complementary surface analysis methods.
By using the example of rolling bearing tests with non-additized base oils, this publication aims to demonstrate the basic procedure and the possibilities of industrial practice. The focus is on the investigation of contacts that are susceptible to the wear of bearing components under mixed-friction conditions. The wear protection behavior of additive-based lubricants and their function has been extensively investigated by several researchers in the past.
The publications report on so-called tribo-films, which form in rolling bearing contacts, especially under mixed-friction conditions [1,2,3]. Sulfur and phosphorus carriers [4] are known as anti-wear or extreme pressure additives. Depending on the test conditions, these show an occupancy of the surface up to a sustainably wear-protecting tribo-film [5]. Burghardt [6] confirmed that lubricating oils which do not contain any additivation could also build up a wear-protecting film. It was shown that under the selected test conditions there were significant differences in tribo-film formation between different base oils, which was ascribed to the chemical structure of the oils. In addition, it was demonstrated [7] that the tribo-film structure on a cylindrical thrust roller bearing is dependent on the slippage conditions of the contact zones. The DIN 51517-3 “Lubricating oils CLP, minimum requirements” [8] outlines the wear test according to DIN 51819-3 [9], the so-called FE8 low-speed wear testing, as an evaluation criterion for wear protection. The operating conditions of this standard test are very demanding; therefore, unadditized or insufficiently additized lubricating oils do not pass this test. This is certainly an extreme case for many applications; thus, considerable power reserves will be available in practice. It can be assumed that not all rolling bearing applications that are operated under mixing conditions have such high demands of the lubricant.
An approach to the bearing- and lubricant-independent evaluation of the rolling contact regarding the risk of surface-initiated damage, such as wear, was presented by Vierneusel [10]. Here, the specific friction energy flowing over the solid-state contact is evaluated by the characteristic value eSID. This characteristic value is readily available in Schaeffler Technologies bearing design software Bearinx [11] for the evaluation of various rolling bearings under different operating and lubrication conditions.
The reported tests below and the analysis of the tested bearings show the correlation between the degree of surface stress and the formation of a stable tribo-film using pure base oils. The handling and recognition of unexpected influences are also considered here. The detailed investigation of the analytical results is discussed. Furthermore, the impact of the test setup on the results are explained in conclusion.
2. Materials and Methods
2.1. Bearings and Lubricants
The bearings used in the tests are cylindrical roller thrust bearings (CRTBs) of type similar to 81212, designed as a test bearing type. These test bearings have a polyamide cage with 15 rolling elements. The rolling elements and both washers are made of 100Cr6 steel, with each martensitic component hardened and stabilized, as shown in Figure 1.
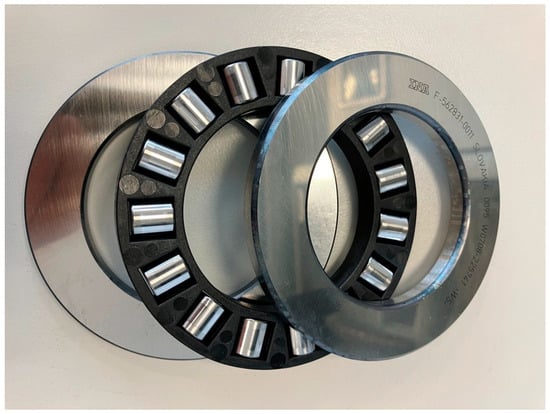
Figure 1.
Cylindrical roller thrust bearing 81212.
The unadditized lubricants used were PAO 6 (OIL A) on the one hand and Dicarboxylic-acid ester (OIL B) on the other. The reference oil (OIL C) was a fully formulated gear oil with anti-wear additive. The data on the lubricating oils are listed in Table 1.

Table 1.
Lubricant properties.
2.2. Testing Procedure
All tests were carried out by an FE8 test rig (Figure 2) according to DIN 51819, under various operating conditions, with different grades of solid body contact.
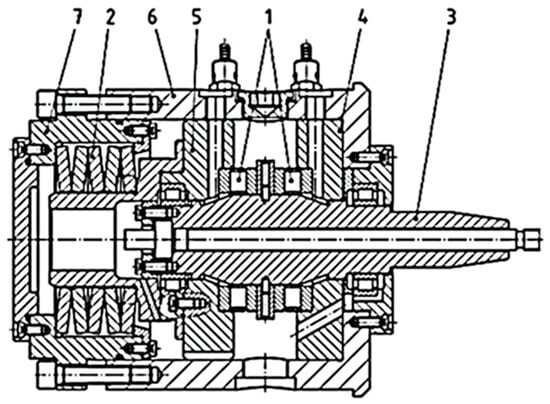
Figure 2.
FE8 test rig setup [10]: 1—test bearing; 2—spring package; 3—shaft; 4—bearing housing drive side; 5—bearing housing spring side; 6—housing; 7—cup.
Each test bearing was weighed before and after the test run, to obtain information of weight loss and thus the resulting rolling bearing wear. For this purpose, the bearings were cleaned according to a standardized process and tested under test conditions, which are listed in Table 2 in detail.

Table 2.
Rolling bearing test conditions.
In addition to the test conditions under the mixed-friction regime, the selected bearing type exhibits special kinematic conditions that lead to different values of frictional energy across the raceway [5,6,7,10]. The expected main failure mechanism of the chosen test setup is wear of the bearing components, which is measured in the form of a weight difference of the bearing components. The selected maximum runtime of 80 h is much shorter than the values of calculated fatigue life regarding ISO 281 [12]. The calculated contact conditions are listed in Section 3.1.
2.3. Surface Analysis
The selected three surface analysis techniques, X-ray fluorescence analysis (µXRF), attenuated total reflection fast Fourier transformation infrared (ATR FTIR) microscopy and Raman microscopy, as methods of so-called correlative spectroscopy, allow the areas of interest to be characterized via mapping in their entirety. All three methods are non-destructive, so it was possible to analyze the specimen generated in the FE8 tests without any mechanical sample preparation. Before the analysis, it was only necessary to clean the sample by rinsing off lubricant residues on the surface with a suitable organic solvent, e.g., n-heptane (CAS No. 142-82-5).
2.3.1. X-ray Fluorescence Analysis
In X-ray fluorescence analysis, high-energy radiation is used to excite the atoms of the sample to be examined. This method makes it possible to identify and determine the concentration of all elements from atomic number 11 (sodium). The physical principle of XRF analysis is based on the principle that the atoms in the sample are excited by high-energy X-rays. In these atoms, electrons from the inner shells are removed from the atom through interaction with the X-rays. In a very short time, these vacancies are filled with electrons from the outer shells. The free energy can be emitted as an AUGER electron or as an X-ray photon. The energy of the emitted X-ray photon depends on the difference of binding energies of both involved electron levels—the vacancy and the level from which the electrons jump into the vacancy. Because this difference is characteristic for every element, the excited specimen emits characteristic radiation (Figure 3). This fluorescence radiation can be used to analyze both the qualitative and quantitative elemental composition of the analyzed sample. µXRF is a special application of ED-XRF (energy-dispersive XRF), and it offers the possibility of a position-sensitive element analysis of non-homogeneous surfaces. The µ-XRF mappings were performed with a M4 Tornado (Bruker Nano GmbH, Berlin, Germany).
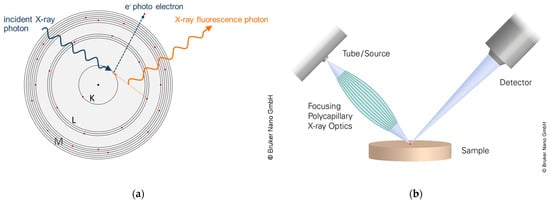
Figure 3.
(a) Excitation of X-ray fluorescence radiation. (b) Schematic diagram of µXRF, M4 Tornado (images courtesy of Bruker Nano GmbH).
2.3.2. Infrared Spectroscopy
FTIR spectroscopy was used to determine the chemical structure of infrared active substances of the generated tribo-films on the washer surface. This method is a type of molecular spectroscopy (vibrational spectroscopy) and is mainly used in structural elucidation and for the identification of unknown, especially organic substances. FTIR spectroscopy is based on the physical effect that most molecules absorb light in the IR range of the electromagnetic spectrum and convert the absorbed energy into molecular vibrations. Vibrational spectroscopy is an energy-sensitive method. It is based on the periodic changes in the dipole moments of molecules or groups of atoms caused by molecular vibrations and the associated discrete energy transfers and frequency changes during the absorption of electromagnetic radiation. These molecular vibrations lead to an IR spectrum that serves as a characteristic “molecular fingerprint”, from which statements about the chemical structure of the sample being examined can be made. In FTIR spectroscopy, the position and intensity of the absorption bands of a substance (structural groups or functional groups) are extremely substance-specific. The possibility of directly analyzing functional groups, which is often much more difficult or impossible with other analytical methods, is the essential feature of FTIR spectroscopy and explains its importance as one of the most important methods of instrumental analysis. In FTIR spectroscopy, there are various methods and recording techniques. Attenuated total reflection (ATR) is a non-destructive surface analysis technique and has become the most popular technique for measuring FTIR spectra. The ATR technique uses the effect that optical absorption spectra can be easily obtained by looking at the interaction of the totally reflected light emerging from the optically dense medium with the optically thin medium. As shown schematically in Figure 4, the sample surface is brought into contact with the ATR crystal, with IR radiation being absorbed by the sample at each reflection point. ATR crystals made of germanium (Ge) are best suited for the characterization of tribo-films, because of their low sample penetration depth of 0.66 µm due to their high refractive index.
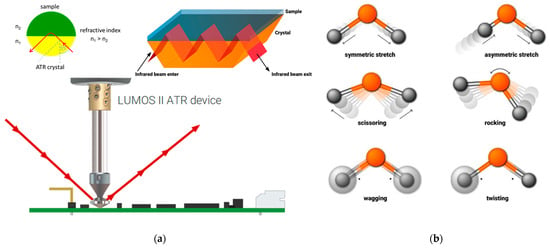
Figure 4.
(a) Schematic diagram of ATR crystal. (b) Example of infrared vibration modes (images courtesy of Bruker Optics GmbH).
ATR FTIR microscopy is a position-sensitive FTIR application which allows for the analysis of the surface of the raceway side of the washer by mapping a grid of 13 × 13 measurement points both circumferentially and transversally to the direction of the raceway of the thrust bearing surface. The 13 measurement points of each row (identical tribological conditions) were used to calculate a sum spectrum.
The ATR FTIR mappings were performed with a LUMOS II (Bruker Optics GmbH). The detailed equipment parameters of both the µXRF and ATR FTIR microscopy were identical to those described in [13].
2.3.3. Raman Spectroscopy
In this publication, we would like to use Raman microscopy as a third analytical method to analyze the IR-inactive compounds of tribo-films. The combination of these three spectroscopic analysis methods thus completes our correlative spectroscopy in industrial applications, which we use to characterize the tribo-films formed on the FE8 washers.
Raman spectroscopy is a molecular spectroscopy (vibrational spectroscopy) method and is mainly used in structure elucidation and for the identification of unknown, IR-inactive substances. Similar to FTIR spectroscopy, it provides information about the vibrational and rotational states of molecules. However, the physical principles and the excitation of the sample are different. The Raman effect is created by the interaction of electromagnetic radiation and the electron shell of the molecules and, in contrast to FTIR spectroscopy, is practically independent of the wavelength of the excitation radiation.
Excitation is achieved by monochromatic laser radiation. The main part of the laser light passes through the sample, while a small part is elastically scattered by the substance (the so-called Rayleigh scattering, same frequency as the laser). The part that is scattered inelastically (the so-called Raman scattering) contains the structural information. This is due to the deformability of the electron shell (polarizability) of the molecule during the oscillation process (periodic displacement of the bonding electrons in the molecule due to the oscillation of the core structure). (Figure 5).
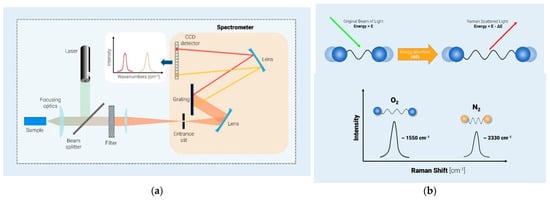
Figure 5.
(a) Schematic diagram of Raman microscopy. (b) Example of Raman shift (images courtesy of Bruker Optics GmbH).
Raman microscopy is a position-sensitive Raman application which allows, analogously to the applied ATR FTIR microscopy, for the analysis of the surface of the raceway side of the washer by mapping a grid of 13 × 13 measurement points both circumferentially and transversally to the direction of the raceway of the thrust bearing surface. The 13 measurement points of each row (identical tribological conditions) were used to calculate a sum spectrum. The Raman mappings were performed with a SENTERRA II (Bruker Optics GmbH). The technical specifications and the selected mapping parameters are shown in Table 3.

Table 3.
Technical specifications and mapping parameters of Raman microscope, SENTERRA II (Bruker Optics GmbH).
2.4. Lubricant Analysis
Analyzing the used lubricant in an adequate manner is as important as analyzing the tested parts. To interpret the used oil values, the analysis of the fresh oil is necessary.
The oil samples were analyzed by infrared spectroscopy (FTIR) in transmission mode—Bruker Tensor 27. The element content of the samples was measured by X-ray fluorescence spectroscopy (XRF)—Bruker AXS, S4 Explorer—and inductively coupled plasma optical emission spectrometry (ICP-OES)—Spectro Arcos eop. The viscosity and density were determined by a Stabinger Viscometer—Anton Paar Stabinger SVM 3000, Anton Paar, Graz, Austria. In addition, the Total Base Number (TBN) and Total Acid Number (TAN) were determined via titration—Metrohm TAN/TBN-Titrator. If necessary, the details of the methods of analysis can be requested from the author.
3. Results
3.1. Contact Conditions
The operating parameters were used to calculate the rolling contact conditions via bearing design software Bearinx [11], the rolling bearing calculation tool of Schaeffler Technologies. In Table 4, the resulting parameters are listed.

Table 4.
Calculated contact parameters for tested oils and conditions *.
The rolling contact conditions at 7.5 rpm (FE8 low-speed wear) are very harsh. The lubrication film parameter Kappa (κ) regarding ISO 281 is with ≤0.01, typical for boundary lubrication conditions. The friction energy is located at the solid-state contact, and no significant lubrication film is present. At 100 rpm, a thicker lubrication film forms, but the operation is in a strong mixed-friction regime. With the increase in bearing speed up to 800 rpm, the lubrication film grows. The surface asperities are still in contact, as shown by the maximal eSID [10] value (eSIDmax), which is slight decreased compared with the 100 rpm operation conditions. So, a mixed-friction regime is still present, but the overall surface strain is reduced, as shown by the eSID value in Figure 6.
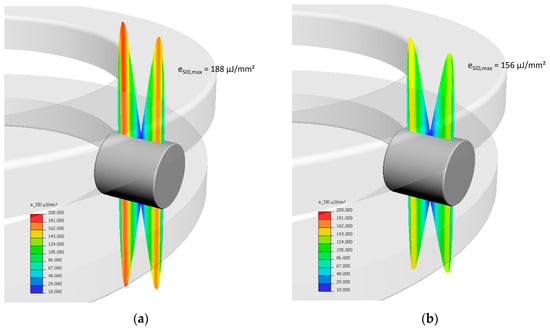
Figure 6.
eSID distribution over rolling contact for OIL B: (a) FE8, 50 kN/100 rpm/80 °C; (b) FE8, 50 kN/800 rpm/80 °C.
3.2. Test Results
The unadditized fluids were not testable under the harsh testing conditions of FE8, 100 kN/7.5 rpm/80 °C. The test rig was unable to examine the specimen because of torque cut-off. Reference OIL C could be tested three times under these conditions without any problems. The roller set wear of all six test bearings was below 10 mg. This was confirmed by the statistical average roller set wear of m50WK = 3 mg. The milder test conditions were only conducted with unadditized OILS A and B. With a load of 50 kN and a speed of 100 rpm, the OIL A test runs produced a torque cut-off after short running times below 1 h. Despite the short service life, there was already considerable wear on the rolling bearing components. The test runs with OIL B fulfilled the test duration of 80 h. The increase in speed to 800 rpm resulted in wear-free test runs with both unadditized oils. To make the data comparable, Table 5 lists the roller set wear rates of the different tests in addition to the wear values.

Table 5.
Test duration, mean roller set wear and roller set wear rate.
3.3. Oil Analysis
The analysis of the used oil samples after the test runs shows nothing really spectacular. Only the iron content of the test run “FE8, 50 kN/100 rpm/80 °C” with OIL A was slightly increased by a mean average of 8.5 ppm. No significant changes in element content were detectable in the other samples. The infrared spectra, TBN, TAN and viscosity data for all oil samples were identical compared to the respective unused oil. In none of the cases was there any recognizable oil degradation.
3.4. Surface Analysis
3.4.1. Optical
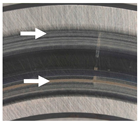
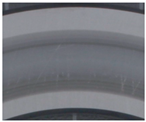
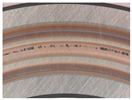
All specimens showed significant signs of use. However, wear tracks on the raceways were not optically visible compared with the unloaded areas, except for the OIL A 100 rpm specimen, where wear tracks could be seen. The discolorations on all other parts were typical of tribo-films. Table 6 displays the optical findings.

Table 6.
Optical surface analysis.
3.4.2. Infrared Spectroscopy (ATR-FTIR)
The infrared spectra of OIL C specimens are identical. Beside the raceways, there is nearly no IR activity. In the area of the raceways, strong absorption at the 1159 cm−1 wavenumber and weak absorption at 1435 cm−1 wavenumber are visible. This indicates carbonate (CO3) and P-O structures on the surface [13].
The surfaces of the specimens tested with OIL A were less IR-active. The raceways of specimens out of test runs at 100 rpm were virtually IR-inactive. Only partial O-H (≈3350 cm−1), X-O (1040 cm−1) and Fe-O (630 cm−1) typical bands are visible. At 800 rpm, a stronger peak at 630 cm−1 dominates. This could be typical of iron oxide but is nearly at the limit of the spectrum scale and can be ambiguous.
This band is also detectable in all raceway spectra of the OIL B specimen. In addition, especially in the 800 rpm specimen spectra, a sharp strong band at 1202 cm−1 is present. This could possibly be, i.e., a C-O or S=O bend; however, a more precise assignment is not possible. An overview is given in Table 7.

Table 7.
ATR-FTIR surface analysis.
Figure 7 illustrates the infrared spectra from the inner raceway (slippage area) of the specimens under the three test conditions. There is a clear differentiation between the oil types used and smaller differences for the same oil under different test conditions.
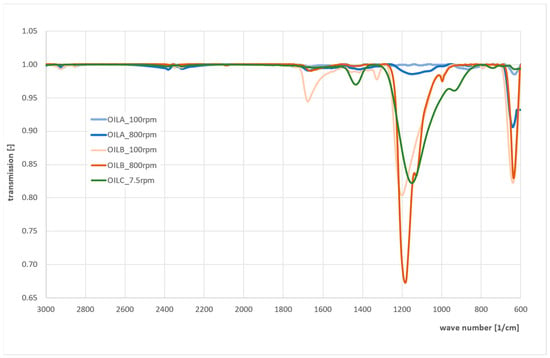
Figure 7.
ATR-FTIR comparison of inner raceway area OIL A (blue), OIL B (orange) and OIL C (green).
3.4.3. Raman Spectroscopy
In contrast to the infrared spectra of OIL C specimens, the Raman spectra are unspecific. There are no differences between the raceways and the unstressed zones.
The OIL A specimens under both test conditions of 100 rpm and 800 rpm show similar spectra in the raceway area. All specimens were treated with an iron oxide layer (Fe2O3) [14] (Figure 8).
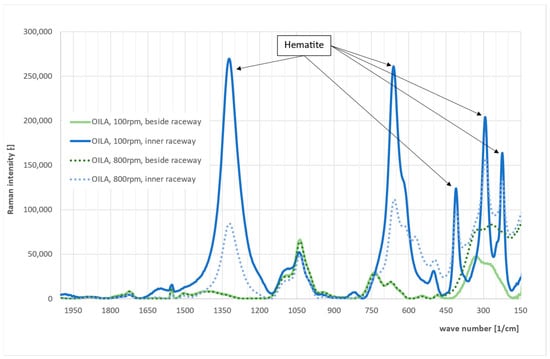
Figure 8.
Raman analysis of OIL A samples: FE8, 50 kN/100 rpm/80 °C (solid line); FE8, 50 kN/800 rpm/80 °C (dotted line).
In addition, typical carbon bands are visible in some spectra taken from the slippage areas (Figure 9). This corresponds to optically visible dark-colored regions. Based on the positions of the D and G peaks, it is assumed that the structure of the carbon black is nano crystalline (NC-graphite) [15].
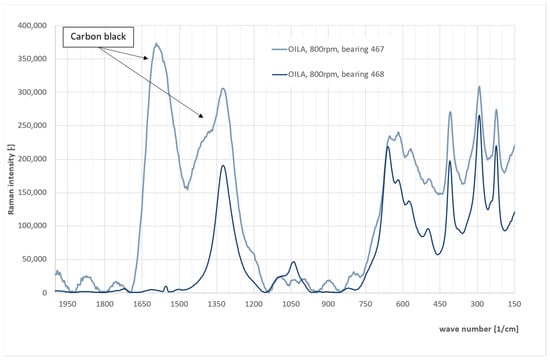
Figure 9.
Raman analysis of OIL A sample. Area with additional carbon deposits.
Table 8 presents an overview of the Raman spectroscopy findings.

Table 8.
Raman surface analysis.
3.4.4. Element Analyses (µXRF and SEM-EDX)
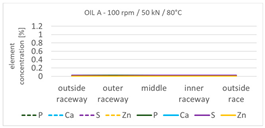
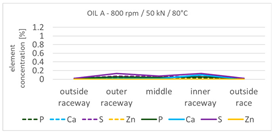
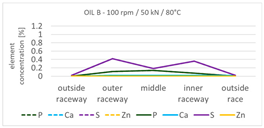
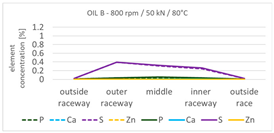
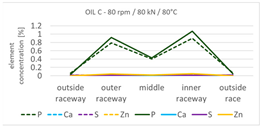
Only in the OIL C specimens, increased phosphorous allocation in the raceway areas was detectable. In these parts, a significant increased phosphorous content, especially in the slippage areas, was visible. The OIL A specimens showed no specific surface deposits. In the “FE8, 50 kN/800 rpm/80 °C” specimens, slight traces of sulfur were detectable in the slippage zones of the raceway. The sulfur element was also detectable in all OIL B specimens at a low but significant concentration. This is surprising, because sulfur is not an intentional part of the OIL B chemistry. A possible origin of sulfur could be minimal oil residue in the test rig, equipment contamination or the bearing itself. Beside the raceways, neither sulfur nor phosphorus deposits were detectable. A short overview is given in Table 9.

Table 9.
µXRF surface analysis; min (dotted) and max (solid) values of elements calcium, phosphor, sulfur and zinc are displayed.
In the supporting SEM-EDX analysis, no spectacular result in element analysis was observed. On the surface layers of the washers, iron was the main element, as expected. Additionally, the OIL C specimen tribo-film contained the phosphorous and oxygen elements in the area of the raceways. On all other raceways, beside steel, only oxygen was present and, in some cases, also additional carbon. There were no additional elements detectable, beside the typical steel accompanying elements. The selected SEM-EDX method seems not to be sensitive enough to measure the sulfur concentration of the tribo-film of OIL B specimens as identified by µXRF analysis. The summary of SEM-EDX analysis is listed in Table 10.

Table 10.
SEM-EDX surface analysis.
4. Discussion
By combining several analysis and measurement methods, it is possible to achieve an overall determination of the main influential factors for the wear test results. The surface analyses showed distinctive signals along with very good differentiability of the resulting tribo-films.
Despite the nominally poorer lubrication conditions, the OIL B specimens were less wear-affected than the OIL A specimens. Neither, however, was as sufficient as reference OIL C. Nevertheless, the respective oil analyses prove that unadditivated oils provide wear protection under medium mixed-friction conditions.
Contrary to the oil analysis, the surface analysis presented a more precise result. It was shown that different tribo-films were formed on the specimens dependent on the oil type used. With OIL A, as expected and like the brown-colored tribo-film regions reported by [7], an iron oxide-based tribo-film was detected. It seems that this kind of tribo-film is stable at ≈124 µJ/mm2 specific friction energy values, as in test “FE8, 50 kN/800 rpm/80 °C”, but obviously not wear-resistant enough for ≈188 µJ/mm2 at 100 rpm.
In contrast, with OIL B, a mixture of an iron oxide-, carbon- and sulfur-containing layer was present. The sulfur in the tribo-films on OIL B specimens is in clear contradiction with the “detected as expected” tribo-films on the OIL A and OIL C specimens. Sulfur is a typical element in lubrication oils and known as a wear protection additive in several chemical structures. But OIL B is a pure dicarboxylic acid ester intentionally free of sulfur, as confirmed by the used oil analysis. It seems that a sulfur content of OIL B below the detection limit of 1 ppm promotes the formation of a sulfur-containing tribo-film. A possible source of sulfur could be minimal oil residue in the test rig, equipment contamination or the bearing itself. Further research is required here.
The identified phosphorous-based tribo-film of the OIL C specimens is in line with expectations.
An open issue is the determination of the high-pressure contact viscosity of the fluids, which was not measured here. The differences between polyalphaolefin and dicarboxylic acid ester published in [16] are not able to fully explain the observed differences in wear behavior. The sulfur exposure also appears to be relevant to the test results.
5. Conclusions
Firstly, the results clearly show that the wear behavior of a lubricated rolling bearing is not only dependent on the operation conditions. Neither the contact nor the nominal lubrication conditions can sufficiently explain the results. Beside the lubricant physics, the lubricant chemistry, including the lubricant additivation, plays a significant role. The analysis of the resulting tribo-film is vital to the investigation of tribological issues. Tribological contact appears to be more sensitive to surface-active substances than the state-of-the-art analysis methods for lubricants. Knowledge of the resulting tribo-films would significantly improve the interpretation of the results in the future.
Secondly, it was demonstrated that slippage including mixed-friction conditions generally does lead to a high wear level. The surfaces (steel substrate including tribo-film) of the rolling bearings are robust enough to tolerate a specific level of “insufficient lubrication”. The specific friction energy flowing over the solid-state contact characterized by the value eSID could be a first approach to quantify this specific level.
The following lists our most important findings:
- -
- Different lubricant formulations lead to different tribo-films under the same test conditions.
- -
- The same lubricant formulation leads to similar tribo-films under different mixed-friction conditions.
- -
- Higher specific friction energy increases the wear risk by using the same oil formulation, as demonstrated with OIL A.
- -
- The tribo-film is more contamination-sensitive than the oil analysis, as demonstrated with OIL B.
By adding a combination of innovative surface analysis techniques to the state-of-the-art analysis methods, the quality of tested and returned part forensic analyses will be significantly improved. This presents an opportunity for development and research in the field of rolling bearing technology.
Author Contributions
Conceptualization, J.W.H.F., J.F. and D.M.; methodology, J.F. and D.M.; validation, D.M., investigation, J.F.; resources, T.K.; data curation, J.W.H.F.; writing—original draft preparation, J.W.H.F.; writing—review and editing, J.F., D.M. and J.W.H.F.; visualization, J.F. and J.W.H.F.; supervision, T.K.; project administration, J.F. All authors have read and agreed to the published version of the manuscript.
Funding
This research received no external funding.
Data Availability Statement
Dataset available on request from the authors.
Acknowledgments
The authors would like to thank Bruker Nano GmbH and Bruker Optics GmbH for their technical support, including the provision of illustrations for this publication.
Conflicts of Interest
The test specimens examined in this study are the property of Schaeffler Technologies AG & Co. KG. The authors are employees of Schaeffler Technologies AG & Co. KG. The results were obtained in the course of their work.
References
- Inacker, O.; Beckmann, P.; Oster, P. Abschlußbericht FVA Nr. 289 I und II Triboschutzschichten. In FVA-Forschungsheft Nr. 595; FVA-Forschungsreporte: Frankfurt, Germany, 1999. [Google Scholar]
- Evans, R.D.; More, K.L.; Darragh, C.V.; Nixon, H.P. Transmission Electron Microscopy of Boundary-Lubricated Bearing Surfaces. Part I: Mineral Oil Lubricant. Tribol. Trans. 2004, 47, 430–439. [Google Scholar] [CrossRef]
- Scherge, M.; Brink, A.; Linsler, D. Tribofilms Forming in Oil-Lubricated Contacts. Lubricants 2016, 4, 27. [Google Scholar] [CrossRef]
- Forbes, E.S. Antiwear and extreme pressure additives for lubricants. Tribology 1970, 3, 145–152. [Google Scholar] [CrossRef]
- Stratmann, A.; Burghardt, G.; Jacobs, G. Influence of Operating Conditions and Additive Concentration on the Formation of Anti-wear Layers in Roller Bearings. In Proceedings of the 20th International Colloquium Tribology, Stuttgart/Ostfildern, Germany, 12–14 January 2016; pp. 109–110. Available online: https://publications.rwth-aachen.de/record/672506 (accessed on 13 April 2024).
- Burghardt, G.; Wächter, F.; Jacobs, G.; Hentschke, C. Influence of run-in procedures and thermal surface treatment on the anti-wear performance of additive-free lubricant oils in rolling bearings. Wear 2015, 328–329, 309–317. [Google Scholar] [CrossRef]
- Gachot, C.; Hsu, C.; Suárez, S.; Grützmacher, P.; Rosenkranz, A.; Stratmann, A.; Jacobs, G. Microstructural and Chemical Characterization of the Tribolayer Formation in Highly Loaded Cylindrical Roller Thrust Bearings. Lubricants 2016, 4, 19. [Google Scholar] [CrossRef]
- DIN 51517-3; Lubricants-Lubricating Oils-Part 3: Lubricating Oils CLP, Minimum Requirements 2018-09. Beuth Verlag: Berlin, Germany, 2018. [CrossRef]
- DIN 51819-1; Testing of Lubricants-Mechanical-Dynamic Testing in the Roller Bearing Test Apparatus FE8-Part 1: General Working Principles 2016-12. Beuth Verlag: Berlin, Germany, 2016. [CrossRef]
- Vierneusel, B.; Koch, O. Fast calculation method for predicting the risk of surface initiated damage in rolling bearings. In Proceedings of the World Tribology Congress, Beijing, China, 17–22 September 2017. [Google Scholar]
- Bearinx High-Level Bearing Design. Available online: https://www.schaeffler-industrial-drives.com/en/news_media/media_library/downloadcenter-detail-page.jsp?id=68304192 (accessed on 16 April 2024).
- ISO 281; Rolling Bearings-Dynamic Load Ratings and Rating Life 2007-02. Beuth Verlag: Berlin, Germany, 2007; ICS 21.100.20.
- Franke, J.W.H.; Fritz, J.; Koenig, T.; Merk, D. Influence of Tribolayer on Rolling Bearing Fatigue Performed on an FE8 Test Rig—A Follow-Up. Lubricants 2023, 11, 123. [Google Scholar] [CrossRef]
- Oh, S.J.; Cook, D.; Townsend, H. Characterization of Iron Oxides Commonly Formed as Corrosion Products on Steel. Hyperfine Interact. 1998, 112, 59–66. [Google Scholar] [CrossRef]
- Ferrari, A.C.; Robertson, J. Resonant Raman spectroscopy of disordered, amorphous, and diamondlike carbon. Phys. Rev. B 2001, 64, 075414. [Google Scholar] [CrossRef]
- Villamayor, A.; Guimarey, M.J.G.; Mariño, F.; Liñeira del Río, J.M.; Urquiola, F.; Urchegui, R.; Comuñas, M.J.P.; Fernández, J. High-Pressure Thermophysical Properties of Eight Paraffinic, Naphthenic, Polyalphaolefin and Ester Base Oils. Lubricants 2023, 11, 55. [Google Scholar] [CrossRef]
Disclaimer/Publisher’s Note: The statements, opinions and data contained in all publications are solely those of the individual author(s) and contributor(s) and not of MDPI and/or the editor(s). MDPI and/or the editor(s) disclaim responsibility for any injury to people or property resulting from any ideas, methods, instructions or products referred to in the content. |
© 2024 by the authors. Licensee MDPI, Basel, Switzerland. This article is an open access article distributed under the terms and conditions of the Creative Commons Attribution (CC BY) license (https://creativecommons.org/licenses/by/4.0/).
