Article

Reconstruction and Intelligent Evaluation of Three-Dimensional Texture of Stone Matrix Asphalt-13 Pavement for Skid Resistance

1
China Railway City Development Investment Group Co., Ltd., Chengdu 610213, China
2
School of Civil Engineering, Southwest Jiaotong University, Chengdu 610031, China
3
China Railway Yibin Investment and Construction Co., Ltd., Yibin 644000, China
*
Author to whom correspondence should be addressed.
Lubricants 2023, 11(12), 535; https://doi.org/10.3390/lubricants11120535
Submission received: 30 November 2023 / Revised: 12 December 2023 / Accepted: 15 December 2023 / Published: 18 December 2023
(This article belongs to the Special Issue Friction Assessment in Pavement Engineering)

Abstract

:
To examine the three-dimensional texture structure of SMA-13 asphalt pavement and assess its anti-skid performance, a light gradient-boosting machine evaluation model was developed using non-contact three-dimensional laser-scanning technology. The study focused on collecting three-dimensional texture data from newly laid SMA-13 asphalt pavement. Subsequently, wavelet transform was employed to reconstruct the pavement’s three-dimensional texture, and discrete Fourier transform was utilized to separate macro- and microtextures, enabling the calculation of their characteristics. The macro- and micro-characteristics of the three-dimensional texture and friction coefficient were input into the model. A comparative analysis with linear regression and a random forest model revealed superior accuracy and efficiency in the model. The training set R2 is 0.948, and the testing set R2 is 0.842, effectively enabling the evaluation of pavement anti-skid performance. An analysis of parameter importance indicated that Rku and MPD are still effective indicators for evaluating skid resistance. Furthermore, diverse texture indexes exhibited varying effects on the anti-skid performance. The established asphalt pavement anti-skid evaluation model serves as a theoretical foundation for understanding the actual influence on pavement anti-skid performance.

1. Introduction

With the rapid economic growth experienced by all countries, the importance of road engineering in infrastructure development has escalated, making it a focal point in countries’ construction endeavors. The evolution of road engineering has been marked by increased intelligence and internationalization. As demands for driving speed, safety, and comfort surge, asphalt pavement has emerged as the predominant choice, constituting over 90% of highway pavement structures [1]. The optimal speed, safety, and comfort of driving on asphalt pavement are intrinsically linked to its anti-skid performance. Consequently, investigating anti-skid performance using innovative technologies and methods stands out as a current imperative.
The term “anti-slip performance” refers to a road’s frictional resistance against a vehicle during tire slippage under braking. The anti-slip coefficient serves as an evaluation index for anti-slip performance, often measured practically using the British Pendulum Number (BPN) using a pendulum tribometer [2]. In recent years, advancements in laser-scanning systems and computer science have prompted scholars to utilize pavement texture systems for data collection. For instance, Ding et al. [3] utilized a laser-scanning system to measure the mean texture depth (MTD) of different pavement levels, validating its feasibility by comparing it to MTD measured through a sand-paving method. Liu et al. [4] extracted three-dimensional texture data of dense-graded AC-13 and AC-16 asphalt concrete pavement via a pavement texture system. They calculated the contour arithmetic mean deviation Ra and contour root-mean-square deviation Rq, affirming their suitability as evaluation indexes for pavement anti-skid performance. Other scholars have leveraged laser-scanning equipment to measure pavement texture data and calculate statistical indicators, such as the root-mean-square roughness (Sq), texture skewness (Ssk), and texture kurtosis (Sku) [5]. Song [6] employed a laser scanner to measure three-dimensional pavement texture, establishing a linear relationship between the mean profile depth (MPD) of asphalt pavement and the friction coefficient BPN. Jiang et al. [7] reconstructed a high-precision digital pavement model with three-dimensional (3D) laser technology, revealing a correlation between macroscopic pavement texture and anti-skid performance. While these studies shed light on the relationship between asphalt pavement texture and skid resistance, challenges persist in the research into skid resistance. These include the limited accuracy of pavement texture testing methods, biased skid resistance evaluation indexes [8], and a predominant focus on linear correlations, neglecting the nonlinear relationship between multi-dimensional features [9]. These limitations impede a comprehensive understanding of the correlation between texture characteristics and skid resistance, warranting further analysis and research.
In the realm of pavement anti-skid performance evaluation models, Peng et al. [10] utilized a dynamic friction coefficient measuring instrument to establish multiple linear regression models for pavement anti-skid performance, incorporating multiple texture features at high and low speeds. Zhan et al. [11] measured friction coefficients and three-dimensional texture data, constructing a random forest model to assess and predict pavement anti-skid performance. However, these models are relatively traditional. With the burgeoning developments in artificial intelligence technology, machine learning evaluation models have gained prominence in road engineering [12,13], offering a novel approach to assessing the anti-skid intelligence of asphalt pavement. Liu et al. [14] utilized a deep neural network encoder to extract features from single-view pavement images and reconstruct the pavement macrotexture in 3D, aiming to evaluate the anti-slip performance of the pavement. Hu [15] proposed a multi-scale texture feature extraction method for asphalt pavement based on point cloud data, and established a fusion model sGBM. Deng [16] conducted an intelligent prediction model study for pavement anti-slip performance using non-contact three-dimensional laser surface testing and machine learning. They also explored the intelligent prediction model of pavement friction performance based on a random forest tree, identifying key parameters influencing pavement skid resistance performance through importance analysis. Currently, the research on asphalt pavement resistance prediction and assessment methods primarily relies on characterization indexes and statistical methods such as linear fitting, multiple regression analysis, or machine learning algorithms to establish pavement skid resistance prediction models [15,16,17]. However, a comprehensive perception model for asphalt pavement skid resistance with high accuracy, robustness, and repeatability is lacking. This paper focuses on 3D texture reconstruction of SMA-13 asphalt pavement, calculating multiple feature indicators of texture parameters, and employing a machine learning light gradient-boosting machine (LightGBM) model to establish an intelligent evaluation model for asphalt pavement skid resistance.
In this paper, the use of 3D laser scanning for studying pavement texture can offer comprehensive insights into the microstructure of the pavement. The anti-skid performance of the pavement can be evaluated through an analysis of its texture characteristics. This technology can assist road managers in accurately assessing the frictional performance of pavements during the maintenance and enhancement of road surfaces, thereby enhancing driving safety.

2. SMA-13 Asphalt Pavement Data Acquisition

All data presented in this study originate from the recently laid SMA-13 asphalt concrete pavement within a specific university institution, with the scope of this research limited to the SMA-13 asphalt pavement.

2.1. Technical Performance Index of Raw Materials

The chosen asphalt is SBS modified asphalt I-D, and the corresponding test results for its main technical indicators are provided in Table 1, below. Additionally, Table 2 displays the test results for the primary technical indicators of the coarse aggregate, while Table 3 details the corresponding results for the fine aggregate. The filler employed is limestone LSIII mineral powder, and Table 4 elucidates the test results for its main technical indicators.

2.2. SMA-13 Asphalt Mixture Grading

The data collected in this paper are all for SMA-13 asphalt concrete, and the grading range of SMA-13 is shown in Table 5, below.

2.3. Data Acquisition

This study gathered test data from five stations. To discern variations in road anti-skid performance influenced by vehicle tire wear, each station was subdivided into wheel track belts and non-wheel track belts. At intervals of 5 m between the wheel track belt and non-wheel track belt, a point was chosen, resulting in a total of 20 test points (10 wheel track belts and 10 non-wheel track belts), as shown in Figure 1.
The LS-40 portable pavement 3D data collector and analyzer (AMES Engineering, Ames City, IA, USA) were utilized for obtaining 3D texture data. The scanning range encompassed 2048 transverse cloud points and 2048 vertical cloud points, with a transverse test accuracy of 0.05 mm and a vertical test accuracy of 0.01 mm. The equipment is depicted in Figure 2, below. Operated on the principles of laser triangulation, the device employs the laser triangulation algorithm to process images for intensity and height measurements. In this context, θ represents the angle between the laser and CCD camera, b is the focal length, D denotes the horizontal distance between the two lenses, a signifies the distance between the receiving lens and the actual measuring point, x represents the true depth change of the object surface, and x′ denotes the displacement change on the corresponding camera plane. Additional parameters are illustrated in Figure 3, below. To begin using the product, connect the LS-40 + 12VDC IN port to the battery + 12VDC OUT port using the provided power cord. Next, connect the LS-40 USB port to a USB 2.0 or USB 3.0 port on a desktop or laptop computer. Finally, turn on the key switch and press the Battery On button to activate the battery power output.
Following the measurement of the road surface texture at each station, it is essential to measure the surface temperature and friction coefficient at the corresponding positions. The friction coefficient, typically assessed using a Pendulum measuring instrument, as depicted in Figure 4, is denoted as BPN. A higher BPN value correlates with an improved anti-skid performance of the road surface. The specific testing process is as follows: first, adjust the level by placing the instrument at the measurement point and aligning the pendulum’s swing direction with the direction of travel. Rotate the leveling bolt to center the level bubble. Next, zero out the reading by adjusting the zero bolt so that the pendulum’s pointer is just below the 0-scale line. Then, adjust the pendulum to achieve a 126 mm sliding distance between the rubber block and the ground. Finally, to determine the friction coefficient, the measurement point must be sprayed with water, and then the pointer is released to obtain the value. The pendulum is then released, and the pointer will indicate the friction coefficient value of the point.
Recognizing the influence of temperature on BPN, as outlined in the “Field Test Methods of Subgrade and Pavement for Highway Engineering” [18], the friction coefficient is adjusted to the standard temperature friction coefficient at 20 °C. The correction formula is presented as follows (Equation (1)), with the temperature correction values detailed in Table 6. In total, 100 sets of data comprising 3D texture data, friction coefficient BPN, and road surface temperature (T) were collected from five stations.
B P N 20 = B P N T + Δ B P N
where BPN20 is the coefficient of friction when converted to the standard temperature of 20 °C; BPNT is the coefficient of friction measured at the asphalt road surface temperature; and ΔBPN is the temperature correction value, the specific correction value shown in Table 6.
Figure 5 below shows the distribution of friction coefficient values at different test points, and it can be seen that most of the friction coefficient values are in the range of 45–70, which is in line with the required domain width for the study.

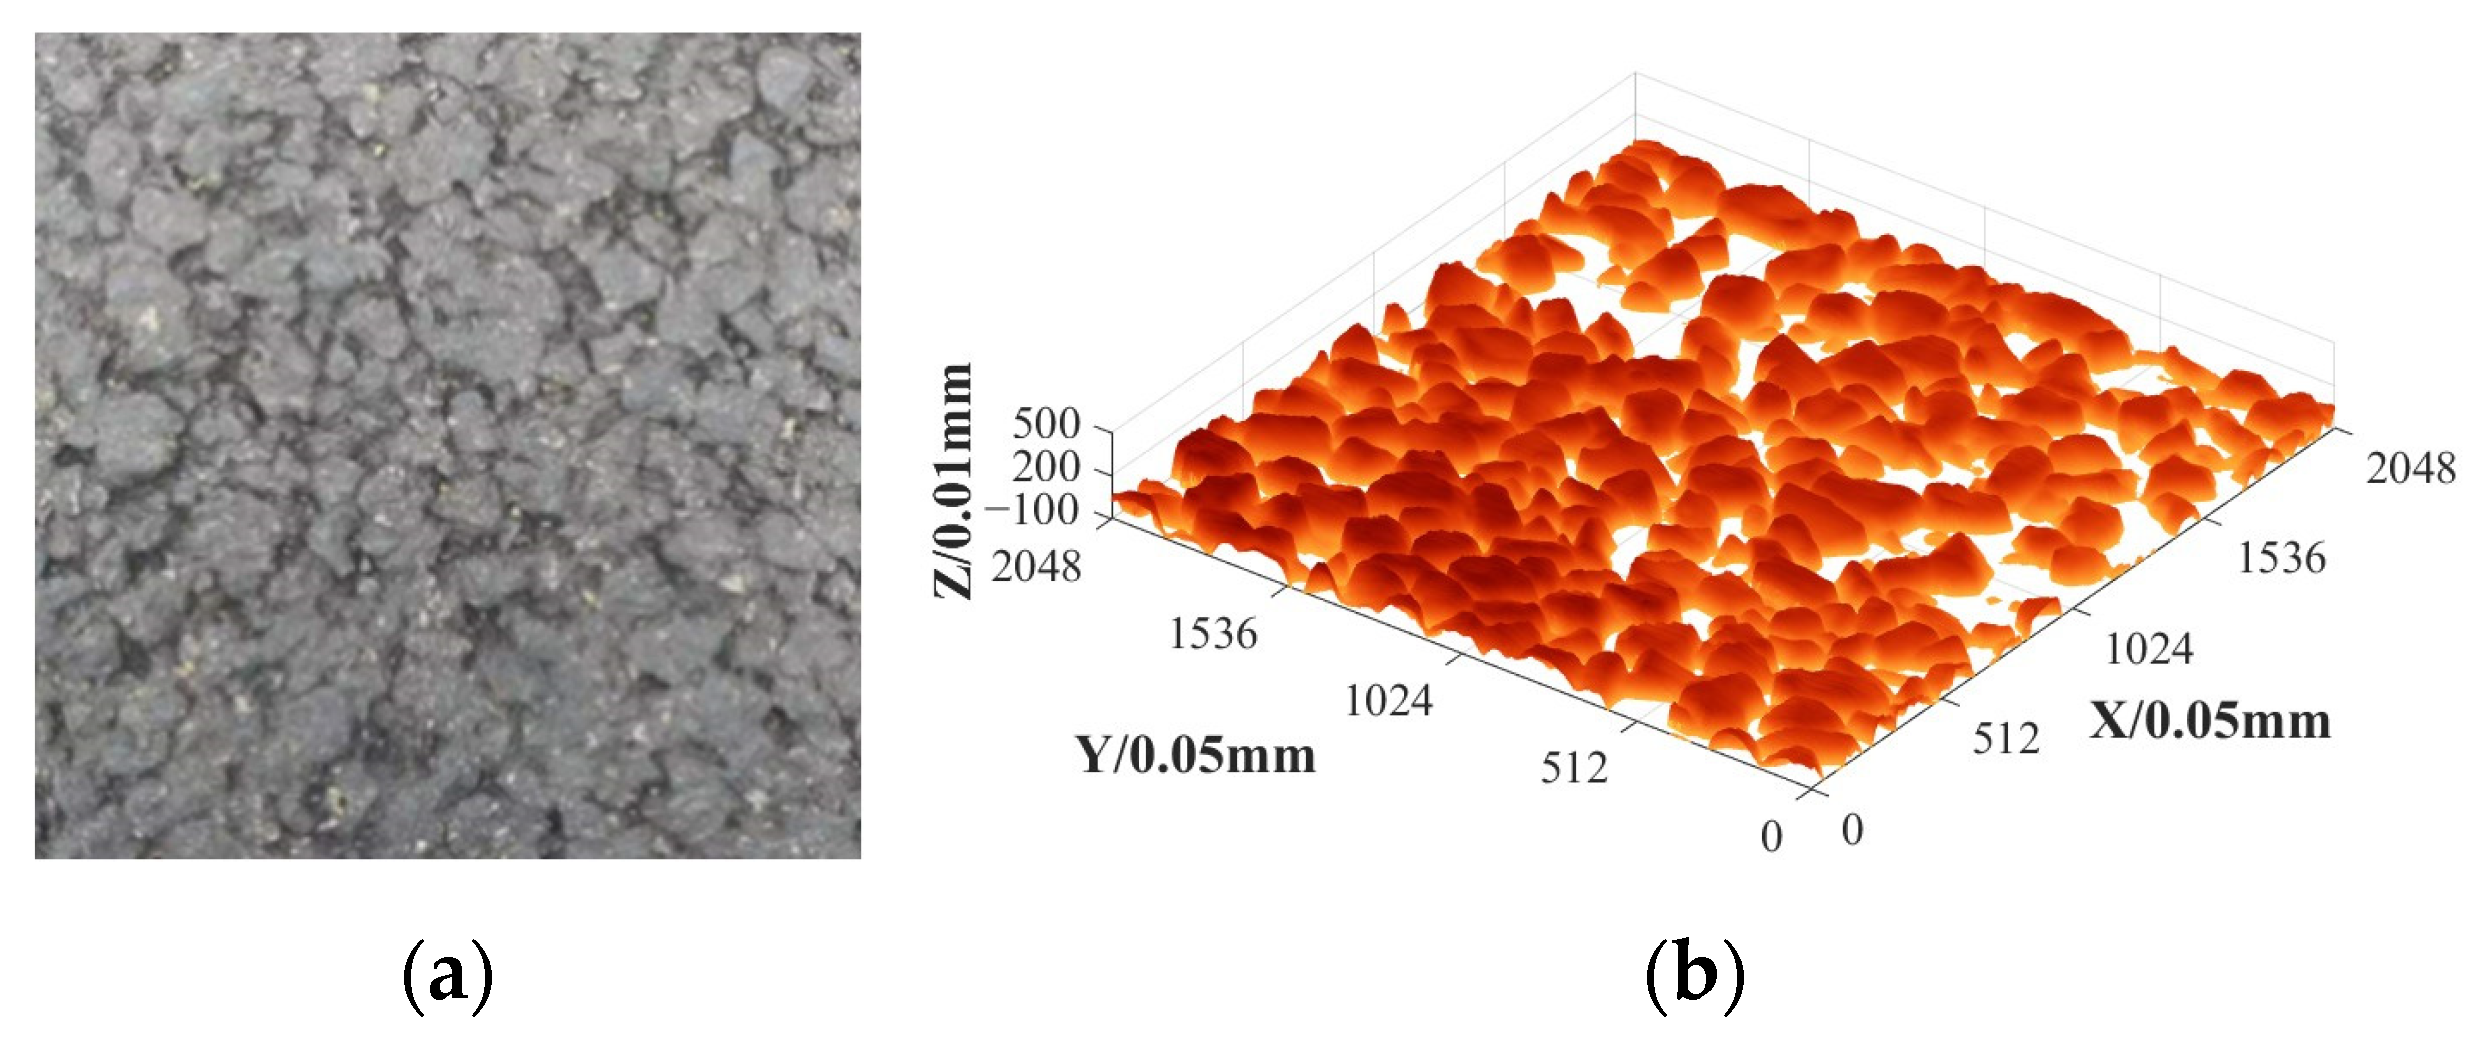
3. Three-Dimensional Reconstruction of Asphalt Pavement Texture

3.1. Slope Correction

In cases where the placement area of the 3D laser-scanning equipment is not sufficiently smooth or experiences unbalanced deflection angles, resulting in tilted measurements [19], corrective measures are essential, as depicted in Figure 6a. The widely employed correction method is the least-squares method, assessing inclination along the scanning direction, as expressed in the formula below:
b 1 = 12 i = 0 N 1 i h i 6 ( N 1 ) i = 0 N 1 h i N ( N + 1 ) ( N 1 )
b 0 = 1 N i = 0 N 1 h i b 1 N 1 2
H i = h i b 1 i b 0     i = 0 , 1 , N 1
where b1 represents the elimination coefficient of inclination, b0 is the elimination coefficient of bias error, hi and Hi, respectively, represent the elevation value of collection point i corresponding to before and after correction, and N is the total number of collection points of a single scan line. By calculating the slope of each scan line and horizontally correcting it, the modified profile data are collected and are shown in Figure 6b.

3.2. Noise Reduction Optimization and Texture Reconstruction

Figure 6 reveals the presence of numerous outliers and noise points in the collected data, often attributed to oil stains on the asphalt pavement surface or 3D laser-scanning equipment’s susceptibility to external light sources and water blockages. Consequently, data elimination and noise reduction are imperative. The noise reduction process comprises the following steps. Initial threshold filtering is conducted for obvious outlier processing, limiting the upper limit of relative elevation data. Points exceeding this limit are replaced via the interpolation of surrounding normal points. Outlier detection is performed using the moving window method, where an appropriately sized window matrix is moved through the original data. Points beyond a set threshold in the window are identified as outlier points and replaced accordingly. This paper employs the standard deviation method (Equation (5)) for outlier elimination, replacing points exceeding three times the standard deviation from the mean with the mean value.
| x i μ | > 3 σ
where xi is the i-th data point in the window, μ is the mean value of the overall data in the window, and σ is the standard deviation of the overall data in the window.
After processing the outliers, additional optimization for noise reduction is imperative. Noise, unlike outliers, typically blurs the signal contour, obscuring the genuine signal and complicating the identification of real information. To mitigate this influence, this paper employs discrete wavelet transform denoising, known for its robust noise reduction stability and mature application, to optimize the noise in the texture data. The processing results are visualized in Figure 7. Following data optimization for noise reduction, the 3D pavement surface was reconstructed, as illustrated in Figure 8. Notably, the reconstructed pavement features closely align with the original pavement texture features.

3.3. Macro- and Microtexture Separation

Texture can be categorized into four types based on wavelength, where the macro texture corresponds to the wavelength range from 0.5 mm to 50 mm, and anything below 0.5 mm is considered microtexture. Both macro- and microtextures influence the skid resistance of asphalt pavement, representing low-frequency and high-frequency information, respectively. The discrete Fourier transform (DFT) is a mathematical technique used to convert a discrete signal, such as a digital signal, into a frequency domain representation. It transforms a series of discrete time-domain samples into a frequency-domain representation that includes magnitude and phase information. The discrete Fourier transform is extensively employed in digital signal processing, communication systems, image processing, and other related fields. It aids in the analysis of a signal’s spectral properties, facilitating operations like filtering, frequency domain processing, and feature extraction. In this study, pavement data are transformed into frequency domain data through DFT. Subsequently, they undergo band-pass filtering using a Butterworth filter, yielding distinct macrotexture and microtexture information, as shown in Figure 9.

4. Intelligent Evaluation of Asphalt Pavement Skid Resistance

4.1. Asphalt Pavement Three-Dimensional Texture Characterization Index

The characteristic index encompasses texture features evaluated and calculated through various methods related to the height information, surface information, and shape information of the pavement topography. These features directly impact the contact between the pavement and the tire, as well as the drainage performance, subsequently influencing the anti-skid performance of the pavement. The main characteristics discussed in this paper include mean profile depth (MPD), skewness (Rsk), kurtosis (Rku), two-point slope elevation difference (SV2pts), contour arithmetic mean deviation (Ra), and root-mean-square roughness (RMS).
(1)
Mean Profile Depth (MPD)
MPD, the most commonly used two-dimensional evaluation index, assesses the roughness of macroscopic texture features of the pavement. Similar to MTD, its calculation expression is as follows (Equation (6)).
M P D = 1 2 [ max ( h 1 , h 2 , , h N / 2 ) + max ( h N / 2 + 1 , h N / 2 + 2 , , h N ) ]
(2)
Skewness (Rsk)
Skewness represents the cubic average of h over a datum length that is dimensionless via the cube of the root-mean-square height, and better reflects the correlation between the peaks and valleys of the texture profile. The calculation expression is as follows (Equation (7)).
R s k = 1 R M S 3 1 M N i = 1 N j = 1 M h i , j 3
(3)
Kurtosis (Rku)
Kurtosis mainly reflects the variation amplitude of the contour surface relative to the datum surface. A larger kurtosis indicates a sharper contour texture distribution and a steeper surface. The calculation expression is as follows (Equation (8)).
R k u = 1 R M S 4 1 M N i = 1 N j = 1 M h i , j 4
(4)
Two-Point Slope Elevation Difference (SV2pts)
SV2pts expresses the change trend of continuous point elevation difference of surface texture. A larger value signifies more pronounced texture changes and a rougher road surface. The calculation expression is as follows (Equation (9)).
S V 2 p t s = 1 N i = 1 N ( h i + h i + 1 Δ x ) 2
(5)
Contour Arithmetic Mean Deviation (Ra)
The arithmetic mean deviation of the contour is the average of the absolute distance between each point on the measured contour and the datum axis within the sampling length. It reflects the deviation degree of texture features relative to the datum plane. The calculation expression is as follows (Equation (10)).
R a = 1 M N i = 1 N j = 1 M | h i , j |
(6)
Root-Mean-Square Roughness (RMS)
The root-mean-square roughness is the deviation distance of the surface texture contour, representing the square root of the mean value of the sum of squares of a set of data. It reflects the deviation degree of the texture relative to the datum plane. The calculation expression is as follows (Equation (11)).
R M S = 1 M N i = 1 N j = 1 M h i , j 2
In Equations (6)–(11), M and N denote the number of sampling points in the horizontal direction, h is the measured elevation value, and Δx is the horizontal distance between sampling points.

4.2. Intelligent Evaluation Method of Asphalt Pavement Anti-Skid Performance

The conventional evaluation methods, rooted in statistical analysis, often rely on linear regression or polynomial regression models. While these models are computationally straightforward and directly reflect the correlation between each index and the target, they fall short in capturing nonlinear relationships among multiple indexes. Earlier support vector machines (SVMs) were employed as regression models, but their complexity, particularly in dealing with multi-class problems, posed challenges. In recent years, many scholars have used the decision tree model for evaluation; the decision tree model adopts a tree structure to represent the decision process, the root node of the tree represents the entire dataset, each internal node represents a feature attribute, and each leaf node represents a class or value. The construction process of a decision tree is carried out in a recursive way. Starting from the root node, a feature attribute and a threshold are selected to divide the dataset into two subsets, such that some condition on this feature is satisfied. The building process is recursive, repeatedly selecting the best split feature and threshold, splitting the dataset until the stop condition is reached. The stop condition can be that the depth of the tree reaches a certain value and the number of data points in the leaf nodes is less than a certain threshold. Once the decision tree is built, it can be used to make classification or regression predictions. Starting from the root node, we traverse down the tree according to the characteristic values of the data, and finally reach a leaf node whose category or numerical value is the prediction result [20]. The most commonly used are integrated models of decision trees, such as the bagging model: random forest (RF), and boosting model: gradient-boosting machine (GBM), etc. Compared with the boosting model, the bagging model cannot improve model deviation or significantly improve performance; the processing of unbalanced datasets is limited [21,22,23,24]. This paper chooses the gradient-boosting machine model in the boosting model, there are mainly gradient-boosting decision trees (GBDTs), extreme gradient-boosting (XGBoost), and light gradient-boosting machines (LightGBMs). In each iteration, GBDT needs to traverse the entire training data many times, the model calculation is complex, and the training process is relatively slow. Especially on large datasets, GBDT needs to build decision trees serially, so the training cannot be parallelized. Before LightGBM was proposed, the most famous GBDT tool was XGBoost, which is a decision tree algorithm based on the pre-ordering method. However, the disadvantages are also obvious. First, it consumes a large amount of space. Such algorithms need to save the eigenvalues of the data, and also save the results of the sorting of the features (for example, to save the sorted index in order to quickly calculate the split points later), which consumes twice the memory of the training data. Secondly, when traversing each split point, it is necessary to calculate the split gain, which is expensive to consume. In addition, the complex parameter tuning of XGBoost, with multiple parameters to be adjusted, may require more parameter tuning work. Therefore, the LightGBM model, with excellent training speed and high memory usage, is selected for the intelligent evaluation of anti-slip performance in this paper. This model has a high performance and low consumption, optimization accuracy, and supports three parallel training [25] modes. In order to avoid the above shortcomings of XGBoost, and to speed up the GBDT model training without compromising the accuracy, lightGBM has carried out the following optimization [26] on the traditional GBDT algorithm.
(1)
Histogram-based Learning
LightGBM adopts a histogram-based learning approach instead of preordering. This reduces memory consumption because there is no need to save the sorted feature index, while also speeding up the process of calculating segmentation points. The basic idea of the histogram algorithm is that when constructing the decision tree, it does not directly use the sorting information of the original data, but divides the value of each feature into several intervals, namely, the histogram columns (bins); as shown in Figure 10, below, the histogram algorithm is actually to convert the continuous floating-point features into discrete features. Then, we count the data and feature label distribution of samples in each interval. This discretization process makes it more efficient to find the best segmentation points. The first advantage of histogram learning is to reduce memory consumption: since there is no need to store the sorting index of the original data, only the histogram information is stored, reducing the memory overhead. The second is to speed up segmentation point calculation: histogram statistics make the calculation to find the best segmentation point more efficient, especially on large-scale datasets.
(2)
Leaf-wise Growth
LightGBM employs the leaf growth mode, which, compared to hierarchical growth, swiftly identifies leaf nodes with higher gain, thereby reducing the depth of the decision tree. Most network models in previous studies adopted the level-wise decision-tree growth strategy (Figure 11), whereas LightGBM utilizes the leaf-wise algorithm with depth restriction (Figure 12). In each iteration, LightGBM identifies the leaf with the greatest splitting gain among all current leaves and subsequently splits. The advantage of the leaf-wise algorithm lies in its smaller error compared to level-wise algorithms when the number of splittings is the same, resulting in higher precision. However, the leaf-wise algorithm may lead to the growth of a deeper decision tree, potentially causing overfitting of the target data. To counter this, LightGBM incorporates a depth threshold into the leaf-wise algorithm to prevent overfitting while maintaining efficiency.
(3)
Gradient-based One-Side Sampling (GOSS):
LightGBM introduces gradient-based one-side sampling, reducing consideration for samples with small gradients while preserving data distribution. This enhancement further accelerates the training speed.
(4)
Exclusive Feature Bundling (EFB):
LightGBM supports feature bundling, enabling the combination of values from different features and reducing computational complexity. The EFB algorithm in LightGBM transforms this challenge into a graph coloring problem and employs a greedy approximation method to address it. Specifically, the EFB algorithm treats each feature as a vertex in the graph, and the edge weight between each vertex (feature) represents the conflict value between the two features (Figure 13 below). The features to be bound are the feature points that are to be painted with the same colour in the graph coloruing problem.

4.3. Established Anti-Skid Intelligent Evaluation Model Based on LightGBM

Following the pavement’s macro- and microtexture separation theory, specific feature indices for macro- and microtextures are individually calculated—namely, Macro_MPD, Micro_MPD, Macro_Ra, Micro_Ra, Macro_RMS, Micro_RMS, Macro_Rsk, Micro_Rsk, Macro_Rku, Micro_Rku, Macro_SV2pts, and Micro_SV2pts, a total of 12 characteristic indicators and the friction coefficient (BPN), are input into the LightGBM model, and the results are presented in Figure 14.
In the LightGBM algorithm, the importance ranking of features can be determined by calculating how much the features reduce the model error when fitting the tree. This calculation principle is based on the concepts of split point selection and information gain of features when fitting the tree. Specifically, the importance of features can be calculated by the following steps:
  • Traversing each feature and selecting split points for each feature. For continuous features, this involves selecting a threshold value for splitting, while for discrete features, each distinct value is selected as a split point.
  • At each split point, the reduction in model error after splitting using the feature is calculated, usually using metrics such as information gain or the reduction in Gini impurity.
  • After selecting the split point for each feature, the error reduction at different split points is summarized to obtain the overall contribution of the feature to the model.
  • Ultimately, the importance of each feature can be ranked through normalization.
This approach allows the importance ranking of features to be determined by calculating their relative importance when fitting the tree. It helps in understanding how much the model depends on different features for feature selection or feature interpretation.
By applying this principle, we are able to determine the impact scores of each pavement texture feature on the pavement friction BPN, as shown in Figure 14. Among the traditional height parameters, Rku and MPD remain effective indicators for assessing skid resistance and have the highest scores in this model. Regarding the macro- and microtexture features, Micro_Rku holds the highest score, followed by Macro_MPD, which exhibits a substantial gap compared to the scores of other features. This indicates that Micro_Rku can effectively capture the micro-level changes in effective contact texture caused by vehicle wear over an extended period, while Macro_MPD can effectively capture the macroscopic changes in effective contact texture resulting from long-term vehicle wear. Additionally, there is a noticeable discrepancy in scores between Micro_Rku and Macro_Rku, highlighting the differing degrees of influence that macro- and microtextures exert on pavement skid resistance. This strongly supports the rationale and necessity of investigating the influence of macro- and microtextures on pavement skid resistance. Conversely, the remaining texture features did not demonstrate significant differences and had minimal impact on the model evaluation, likely due to the inclusion of extraneous texture information and the replacement of the effective component by other features.
Upon further analysis, it is evident that, with the exception of Micro_Rku and Micro_MPD, the top-ranked importance scores are attributed to macro-texture features. This leads to the conclusion that the impact of pavement macrotexture features on the friction coefficient BPN is more significant than that of pavement microtexture features in this model. This outcome is primarily linked to the selected test sites for the study, where both wheel tracks and non-wheel tracks were considered. Moreover, the variability in surface macrotextures among the test sites is greater than that in surface microtextures. For the model feature importance score, a higher score indicates that it has a greater influence in the model on obtaining the target friction coefficient, which is more conducive to improving the computational speed, accuracy, and robustness of the model.
To underscore the model’s superiority, this paper conducts a comparative analysis involving the multiple linear regression (ML) model, the random forest regression model (RF) model, and the LightGBM model. The dataset is divided into training and test sets at a ratio of 7:3, yielding the results outlined in Table 7. Notably, the ML model exhibits the lowest evaluation accuracy, with a training set R2 of only 0.689. In contrast, the LightGBM model outperforms others, achieving a training set R2 of 0.948 (Figure 15a), and a test set R2 of 0.842 (Figure 15b), 22.2% improvement over the established ML model and 10.6% improvement over the RF model. This clearly demonstrates the model’s heightened accuracy compared to traditional models.

5. Conclusions

This paper focused on SMA-13 asphalt pavement, employing three-dimensional scanning equipment to capture pavement texture, and pendulum tribometry for friction coefficient testing, and applying correction methods like the least-squares method for slope correction. Noise reduction and optimization were achieved through the standard deviation method and wavelet transform, facilitating three-dimensional pavement texture reconstruction. Furthermore, discrete Fourier transform enabled the separation of macro- and microtextures. The study calculated characteristic values, including average contour depth, skewness, kurtosis, two-point slope elevation difference, contour arithmetic mean deviation, and root-mean-square roughness for both macro- and microtextures. The LightGBM algorithm was then employed to establish an asphalt pavement anti-skid intelligent evaluation model. Comparisons with traditional multivariate linear and random forest models yielded the following conclusions:
  • The high-precision 3D texture scanning equipment effectively captured the surface texture structure of asphalt concrete pavement.
  • Employing the least-squares method for slope modification and wavelet transform for noise reduction enabled successful three-dimensional texture reconstruction of the pavement.
  • The LightGBM pavement skid resistance intelligent assessment model combines texture characteristics and friction coefficients, and Rku and MPD are still effective indicators for evaluating skid resistance, scoring the highest in this model. This indicates that it can effectively reflect the changes in road surface contact texture caused by long-term vehicle wear.
  • The different effects of Micro_Rku and Macro_Rku on the coefficient of friction emphasize the different effects of macrotexture and microtexture on the anti-skid performance of pavements, and it is also found that the macrotexture features of pavements have a greater effect on the coefficient of friction BPN than the microtexture features of pavements in this model.
  • Comparative analyses revealed the superiority of the LightGBM model over traditional multivariate linear and random forest models, attaining the training set R2 of 0.948, and the testing set R2 of 0.842.
In conclusion, this study contributes valuable insights into pavement texture analysis and anti-skid performance evaluation, showcasing the effectiveness of the LightGBM model in this context.

Author Contributions

Conceptualization, G.D. and Z.L.; methodology, Y.Z.; software, G.D.; validation, Z.L., Y.Z. and M.C.; formal analysis, C.A.; investigation, G.D.; resources, Y.Z.; data curation, Z.L.; writing—original draft preparation, G.D.; writing—review and editing, Z.L.; visualization, M.C.; supervision, C.A.; project administration, Y.Z.; funding acquisition, Y.Z.; All authors have read and agreed to the published version of the manuscript.

Funding

This research was funded by the Science and Technology Project of Sichuan Transportation Department (grant number 2022-ZL-02 and 2021-ZL-16), National Natural Science Foundation of China (grant number 52008354), Natural Science Foundation of Sichuan Province (grant number 2022NSFSC0437) and the China Postdoctoral Science Foundation (grant number 2021T140572).

Data Availability Statement

Due to the nature of this research, participants of this study did not agree for their data to be shared publicly, so supporting data is not available.

Conflicts of Interest

The authors declare that they have no known competing financial interests or personal relationships that could have appeared to influence the work reported in this paper.

References

  1. Li, H. Research on Network Level Decision-Making of Highway Asphalt Pavement Maintenance Based on Matter-Element Model. Ph.D. Thesis, Southeast University, Nanjing, China, 2017. [Google Scholar]
  2. Zhu, H.; Liao, Y. Present Situations of Research on Anti-skid Property of Asphalt Pavement. Highway 2018, 63, 35–46. [Google Scholar]
  3. Ding, S.H.; Zhan, Y.; Yang, E.H.; Wang, C.P. MTD measurement of asphalt pavement based on high precision laser section elevation. J. Southeast Univ. (Nat. Sci. Ed.) 2020, 50, 137–142. [Google Scholar]
  4. Lin, L. Numerical Relation Study on Three-Dimensional Texture Structure and Skid Resistance of Road Surface. Master’s Thesis, Xinjiang University, Xinjiang, China, 2019. [Google Scholar]
  5. Liu, Q.; Shalaby, A. Relating concrete pavement noise and friction to three-dimensional texture parameters. Int. J. Pavement Eng. 2015, 18, 450–458. [Google Scholar] [CrossRef]
  6. Song, H. Research on the Influence of Macro and Micro Texture of Asphalt Pavement on Friction Coefficient. Transp. Sci. Technol. 2022, 3, 22–26. [Google Scholar]
  7. Jiang, T.H.; Ren, W.Y.; Dong, Y.S. Precise Representation of Macro-Texture of Pavement and Effect on Anti-Skidding Performance. J. Munic. Technol. 2022, 40, 1–7+24. [Google Scholar] [CrossRef]
  8. Huang, X.M.; Zheng, B.S. Research Status and Progress for Skid Resistance Performance of Asphalt Pavements. China J. Highw. Transp. 2019, 32, 32–49. [Google Scholar] [CrossRef]
  9. Sun, C.Y.; Han, Y.X.; Hu, Y.J.; Gao, S.; Weng, Y.H. Evaluation of Skid Resistance of Asphalt Pavement Based on IGWO-XGBoost Fusion Model. Comput. Syst. Appl. 2023, 32, 1–11. [Google Scholar] [CrossRef]
  10. Li, Q.J.; Zhan, Y.; Yang, G.; Wang, K.C.P. Pavement skid resistance evaluation based on 3D areal texture characterization. J. Southeast Univ. (Nat. Sci. Ed.) 2020, 50, 667–676. [Google Scholar]
  11. Zhan, Y.; Deng, Q.; Luo, Z.; Liu, C.; Zhang, A.; Qiu, Y. Research on GBDT-based skid resistance perception model for asphalt pavement. China Civ. Eng. J. 2023, 56, 121–132. [Google Scholar] [CrossRef]
  12. Zhang, R.; Hu, J. Production performance forecasting method based on multivariate timeseries and vector autoregressive machine learning model for waterflooding reservoirs. Pet. Explor. Dev. 2021, 48, 175–184. [Google Scholar] [CrossRef]
  13. Kou, W.; Dong, H.; Zhou, M. A hybrid wavelet-machine learning approach for prediction of equivalent thermal conductivity properties of hybrid composites. Acta Phys. Sin. 2021, 70, 63–74. [Google Scholar] [CrossRef]
  14. Liu, C.; Li, J.; Gao, J.; Yuan, D.; Gao, Z.; Chen, Z. Three-dimensional texture measurement using deep learning and multi-view pavement images. Measurement 2021, 172, 108828. [Google Scholar] [CrossRef]
  15. Hu, Y.J. Multi-Scale Texture Feature Extraction and Skid Resistance Performance Evaluation of Asphalt Pavement Based on Point Cloud Data. Ph.D. Thesis, Chang’an University, Xi’an, China, 2023. [Google Scholar]
  16. Deng, Q. Study on Intelligent Pavement Friction EvaluationModel and Maintenance Decision for Optimized Skid Resistance. Master’s Thesis, Southwest Jiaotong University, Chengdu, China, 2022. [Google Scholar]
  17. Liu, C. Resistance and Decay Prediction of Asphalt Pavement Skid Ensemble Learning Models for Non-Contact Evaluation. Master’s Thesis, Southwest Jiaotong University, Chengdu, China, 2022. [Google Scholar]
  18. JTG E60-2008; Field Test Methods of Subgrade and Pavement for Highway Engineering; Volume. Standardization Administration of the People’s Republic of China: Beijing, China, 2008.
  19. Ren, W. Study on the Abrasion Characteristic of Surface Textureand Its Effect on Noise for Asphalt Pavements. Master’s Thesis, Chang’an University, Xi’an, China, 2019. [Google Scholar]
  20. Li, W.; Lin, C.; Liao, H. Simulation Study and Evaluation of Random Effect-Expectation Maximization Regression Tree Model. Chin. J. Health Stat. 2019, 36, 665–668+673. [Google Scholar]
  21. Wei, W.; Du, Y.; Dong, A.; Qin, D.; Zhu, T. An Analysis of Factors Affecting Injury of Electric Two-wheeler Riders Based on CIDAS Data and Ensemble Learning. J. Transp. Inf. Saf. 2022, 40, 45–52. [Google Scholar]
  22. Yoon, H.I.; Lee, H.; Yang, J.-S. Predicting Models for Plant Metabolites Based on PLSR, AdaBoost, XGBoost, and LightGBM Algorithms Using Hyperspectral Imaging of Brassica juncea. Agriculture 2023, 13, 1477. [Google Scholar] [CrossRef]
  23. Bapatla, S.; Harikiran, J. LuNet-LightGBM: An Effective Hybrid Approach for Lesion Segmentation and DR Grading. Comput. Syst. Sci. Eng. 2023, 46, 597–617. [Google Scholar] [CrossRef]
  24. Wang, D.-N.; Li, L.; Zhao, D. Corporate finance risk prediction based on LightGBM. Inf. Sci. 2022, 602, 259–268. [Google Scholar] [CrossRef]
  25. Zhu, X.; Yin, Q.; Zhao, F. Ship speed prediction model based on LightGBM. J. Dalian Marit. Univ. 2023, 49, 56–65. [Google Scholar]
  26. Ke, G.; Meng, Q.; Finley, T.; Wang, T.; Chen, W.; Ma, W.; Ye, Q.; Liu, T.-Y. Lightgbm: A highly efficient gradient boosting decision tree. Adv. Neural Inf. Process. Syst. 2017, 30, 3149–3157. [Google Scholar]
Figure 1. Schematic diagram of the actual measurement points on one side of the road.
Lubricants 11 00535 g001
Figure 2. LS-40 detection device.
Lubricants 11 00535 g002
Figure 3. Laser triangulation.
Lubricants 11 00535 g003
Figure 4. Field pavement data collection. (a) 3D texture data scanning; (b) road friction BPN measurement.
Lubricants 11 00535 g004
Figure 5. Friction coefficient distribution at different test points.
Lubricants 11 00535 g005
Figure 6. Comparison chart before and after correction of inclination: (a) before correction; (b) after correction.
Lubricants 11 00535 g006
Figure 7. Comparison of the data denoised effect.
Lubricants 11 00535 g007
Figure 8. Comparison between the original surface and the 3D reconstructed surface: (a) original pavement texture; (b) reconfigured pavement texture.
Lubricants 11 00535 g008
Figure 9. Macro- and microtexture separation.
Lubricants 11 00535 g009
Figure 10. Histogram algorithm.
Lubricants 11 00535 g010
Figure 11. Level-wise growth decision tree.
Lubricants 11 00535 g011
Figure 12. Leaf-wise growth decision tree.
Lubricants 11 00535 g012
Figure 13. Feature bundling strategy.
Lubricants 11 00535 g013
Figure 14. Bar chart of the importance ratio of each feature index.
Lubricants 11 00535 g014
Figure 15. LightGBM model evaluation results: (a) model training results; (b) model testing results.
Lubricants 11 00535 g015
Table 1. Main technical indicators of SBS modified asphalt I-D.
Test ItemsUnitsTest ResultsTechnical Requirements
Needle penetration (25 °C; 100 g, 5 s)mm5740–60
Softening point°C78≥60
Ductility (5 °C, 5 cm/min)cm29≥20
135 °C dynamic viscositiespa·s2.28≤3
Elastic recovery 25 °C%82≥75
Film heating experimentMass loss%−0.1≤±1
Needle penetration ratio 25 °C%80≥65
5 °C elongationscm17≥15
Table 2. Main technical indicators of coarse aggregate.
Test ItemsUnitsTest ResultsTechnical Requirements
Crush value%15.8≤30
Water absorption%0.57≤3
Needle flake particle content%11.9≤20
Los Angeles wear value%18.6≤35
Table 3. Main technical indicators of fine aggregate.
Test ItemsUnitsTest ResultsTechnical Requirements
Sand equivalent%65>50
Mud content (<0.075 mm portion)%1.8≤3
Table 4. Main technical indicators of mineral powder.
Test ItemsUnitsDetection ResultTechnical Requirements
Moisture content%0.7≤1
Apparent relative densityg/m32.712≥2.5
Percentage through the sieve0.6 mm%100100
0.15 mm%95.790–100
0.075 mm%88.675–100
AppearanceNo clumps
Table 5. Grading range of SMA-13.
GradationPercentage through Different Screen Size (mm)/%
1613.29.54.752.361.180.60.30.150.075
SMA-13
grading range
Upper limit1001007531262420161512
Median1009562.52720.51916131210
Lower limit1009050201514121098
Table 6. Temperature correction standard value of the friction coefficient BPN.
T/°C0510152025303540
ΔBPN−6.0−4.0−3.0−1.002.03.05.07.0
Table 7. Comparison of the scores of each model.
ModelsMLRFLightGBM
R2Training0.7120.8350.948
Testing0.6890.7610.842
Disclaimer/Publisher’s Note: The statements, opinions and data contained in all publications are solely those of the individual author(s) and contributor(s) and not of MDPI and/or the editor(s). MDPI and/or the editor(s) disclaim responsibility for any injury to people or property resulting from any ideas, methods, instructions or products referred to in the content.

