Article

Estimation of Road Wetness from a Passenger Car

1
Laboratory AME-EASE, Gustave Eiffel University, 44344 Bouguenais, France
2
Laboratory TS2-LMA, Gustave Eiffel University, 13300 Salon de Provence, France
*
Author to whom correspondence should be addressed.
Lubricants 2024, 12(1), 2; https://doi.org/10.3390/lubricants12010002
Submission received: 6 November 2023 / Revised: 5 December 2023 / Accepted: 14 December 2023 / Published: 20 December 2023
(This article belongs to the Special Issue Friction Assessment in Pavement Engineering)

Abstract

:
This paper presents an evaluation of a system aiming at estimating water depths on a road surface. Using accelerometers, the system records the vibrations of a wheel arch liner due to impacts of water droplets. The system setup, including the location of the accelerometers on a wheel arch and the data acquisition, is described. Tests were performed with a passenger car on various road surfaces and at different vehicle speeds and water depths. Signals recorded by the accelerometers are filtered and processed. The link between the acceleration amplitude, the water depth, and the vehicle speed is consistent with results from previous studies. The effect of the surface texture is less obvious and needs further investigations. A mathematical model has been developed to relate the acceleration amplitude to the water depth. The potential application of the developed system to on-board evaluation of pavement wetness, and consequently the pavement skid resistance, is discussed. Perspectives for driver assistance, or more generally, for autonomous driving to improve traffic safety, are also highlighted.

1. Introduction

Tests conducted in a laboratory have shown that the coefficient of friction between a rubber slider and a road surface can decrease rapidly in the presence of a water film as thin as 0.2 mm [1]. As it is well known that a vehicle’s braking performance and stability depend on the available tire/road friction [2], this result highlights the need to estimate the road wetness. Mainly, when the water depth is so low—for instance, under a drizzle or after a precipitation—the road has an apparent safe aspect and the driver is tempted to adopt inappropriate maneuvers such as driving fast. The friction reduction and the driver’s biased perception can have dramatic consequences, as indicated by statistics of accidents related to rainfall [3,4,5,6,7] and especially when they occur on just wet roads [5,7].
Within the framework of the French national project ENA (Expérimentations de Navettes Autonomes), research was conducted at Gustave Eiffel University to develop a system for passenger cars aiming at estimating the tire/wet road friction. The adopted approach consists in estimating first the water depth on the road surface and then calculating the tire/road friction using, as inputs, the water depth and other affecting factors. The obtained information—water depth and tire/road friction—can be used to send a warning message to drivers or activate a wet-dedicated driving mode, as illustrated in [8].
This paper reports works on the estimation of water depths using accelerometers (see Section 3.1). It constitutes the continuation of a preliminary study [9] in which tests performed on a trailer equipped with a tire proved the feasibility of the proposed system. The paper presents a study conducted with a Clio 3, which represents a medium-sized car in France. The objectives of the paper are: 1—to show the instrumentation that can be implemented on a passenger car; 2—to present the obtained results with a focus on the relationship between acceleration amplitude and water depth; and 3—to assess the relevance of the obtained results through comparisons with previous studies.

2. Background

2.1. Measurement and Estimation of Water Depth

There is no standardized definition of a water depth. Nevertheless, researchers commonly refer to the following notions [10,11] (Figure 1): the “above asperity” depth (Figure 1a), which expresses the thickness of the water film above the asperities of the road surface, and the “mean” depth (Figure 1b), which corresponds to an average depth obtained by dividing a total volume of water by the surface wetted by this volume. In this paper, the second definition will be used.
Among recent reviews dedicated to technologies that can be applied to roads and runways [10,11,12], it has been found that infrared spectroscopy methods are the most efficient compared to other contactless technologies. Despite their many advantages (high accuracy, reliable recognition of various contaminants, etc.), deployment of infrared spectroscopy methods is still limited for monitoring vehicles because of the high price of the devices and their dimensions, which are not appropriate for passenger cars.
As direct measurement of water depths is still limited by products’ cost and size; research has been conducted to estimate water depths through mechanisms like tire spray. Tire spray, also referred to as splash and spray, has been studied mainly as a nuisance for drivers because of reduced visibility [13,14,15,16]. As tire spray depends on the amount of water on the road surface [13,16], it can also be exploited as an indicator of water depth. Döring and coauthors [17] consider the fact that a capacitive transducer is sensitive to impacts of water droplets and used different designs of the sensor to classify road wetness. Wetness classes are defined from ranges of water depths, for example, a “damp” class corresponds to water depths lower than 0.1 mm [17]. It was shown, for a car rolling at speeds lower than 50 km/h on an asphalt surface, that there is a good correspondence between results provided by a water sensor (Lufft, MARWIS) and the transducers.
Alonso and coauthors [18] stated that tire/road noise depends on the wetness of a road surface: it has a peak at 1 kHz on a dry surface; on a wet surface, it increases in the range of 500 Hz to 8 kHz. These authors developed a noise-based system including a microphone implemented on the front wheel arch line just behind the rolling tire. Noise signals are processed and the extracted features are combined with a machine learning algorithm to provide a classification of wet states [18].
Another exploitation of tire spray is based on vibrations of a wheel arch liner induced by the impacts of water droplets. Schmiedel and coauthors [19,20] used accelerometers to measure these vibrations and studied the effect of their location (wheel arch liner, side skirt, car’s underbody) on the obtained signals. This study has allowed for a better understanding of the link between different water flows resulted from tire spray (see description in Section 2 and Figure 1) and water depths. Recently, Riahi and coauthors [9] developed a similar system and, using a trailer equipped with a passenger car’s tire, found promising relationships between the acceleration amplitude (root mean square of an acceleration-time signal) and the water depth.

2.2. Effect of Water Depth on Skid Resistance

Tire/road friction depends on many factors that can be classified in five families [21]: water, vehicle speed, texture of the road surface, tire (material, design, slip ratio, etc.), and other conditions related to the environment (temperature, contaminants other than water, etc.). Valuable state-of-the-art works on the affecting factors can be found in the literature, for example, in [21,22]. The aim of this section is to focus on the effect of water depth, which represents the main object of the present paper.
The contact area between a tire and a wet road can be seen as being composed of three zones [23]:
-
Ahead of the tire is the “sinkage” zone where the tire floats on a water film.
-
In the rear part, the tread elements are in contact with the road surface. As the full-contact condition is not always fulfilled due to the presence of water pockets trapped between the tread elements and the asperity summits, this zone is called the “mixed-contact” zone.
-
Between the sinkage and the mixed-contact zones is the “transition” zone.
-
The three-zone description is useful because it helps:
-
To understand why friction on a wet road, which is generated only in the mixed-contact zone, is lower than on a dry road;
-
To study the onset of hydroplaning where the tire is entirely supported by the water film. Many researches have been dedicated to this dangerous situation [24,25,26,27] where, locally, a tread element entering the contact area does not have enough time to go through the water film—sinkage—to be in contact with the road surface asperities. One can see the importance of the water depth, which defines the time to sinkage, and the vehicle speed, which defines the time of traversal that a tread element needs to go through the contact area. Moore [23], among many authors, highlights the role of the road surface macrotexture (surface asperities whose dimensions range between 0.1 mm and 20 mm vertically, and between 0.5 mm and 50 mm horizontally [28]) in reducing the water depth ahead of the tire and the time to sinkage; both mechanisms contributing to mitigate the hydroplaning risk.
-
To remind that there can be a loss of contact in the mixed-contact zone if the presence of water pockets is significant. This situation happens when the microtexture (asperities smaller than 0.5 mm in height and in width [28]) is not enough—in terms of height and sharpness—to remove the water pockets. Moore [29] named this situation “viscous” hydroplaning to highlight the fact that the corresponding water depth is low.
The last situation is of particular interest because it involves low water depths, which are not visible and can then induce a safe feeling, as mentioned in the beginning of the introduction. To define an upper limit for low water depths, one can refer to the fact that they can completely cover the microtexture; defining an upper limit of 0.5 mm in thickness for low water depths seems, then, to be acceptable.

2.3. Tire Splash and Spray

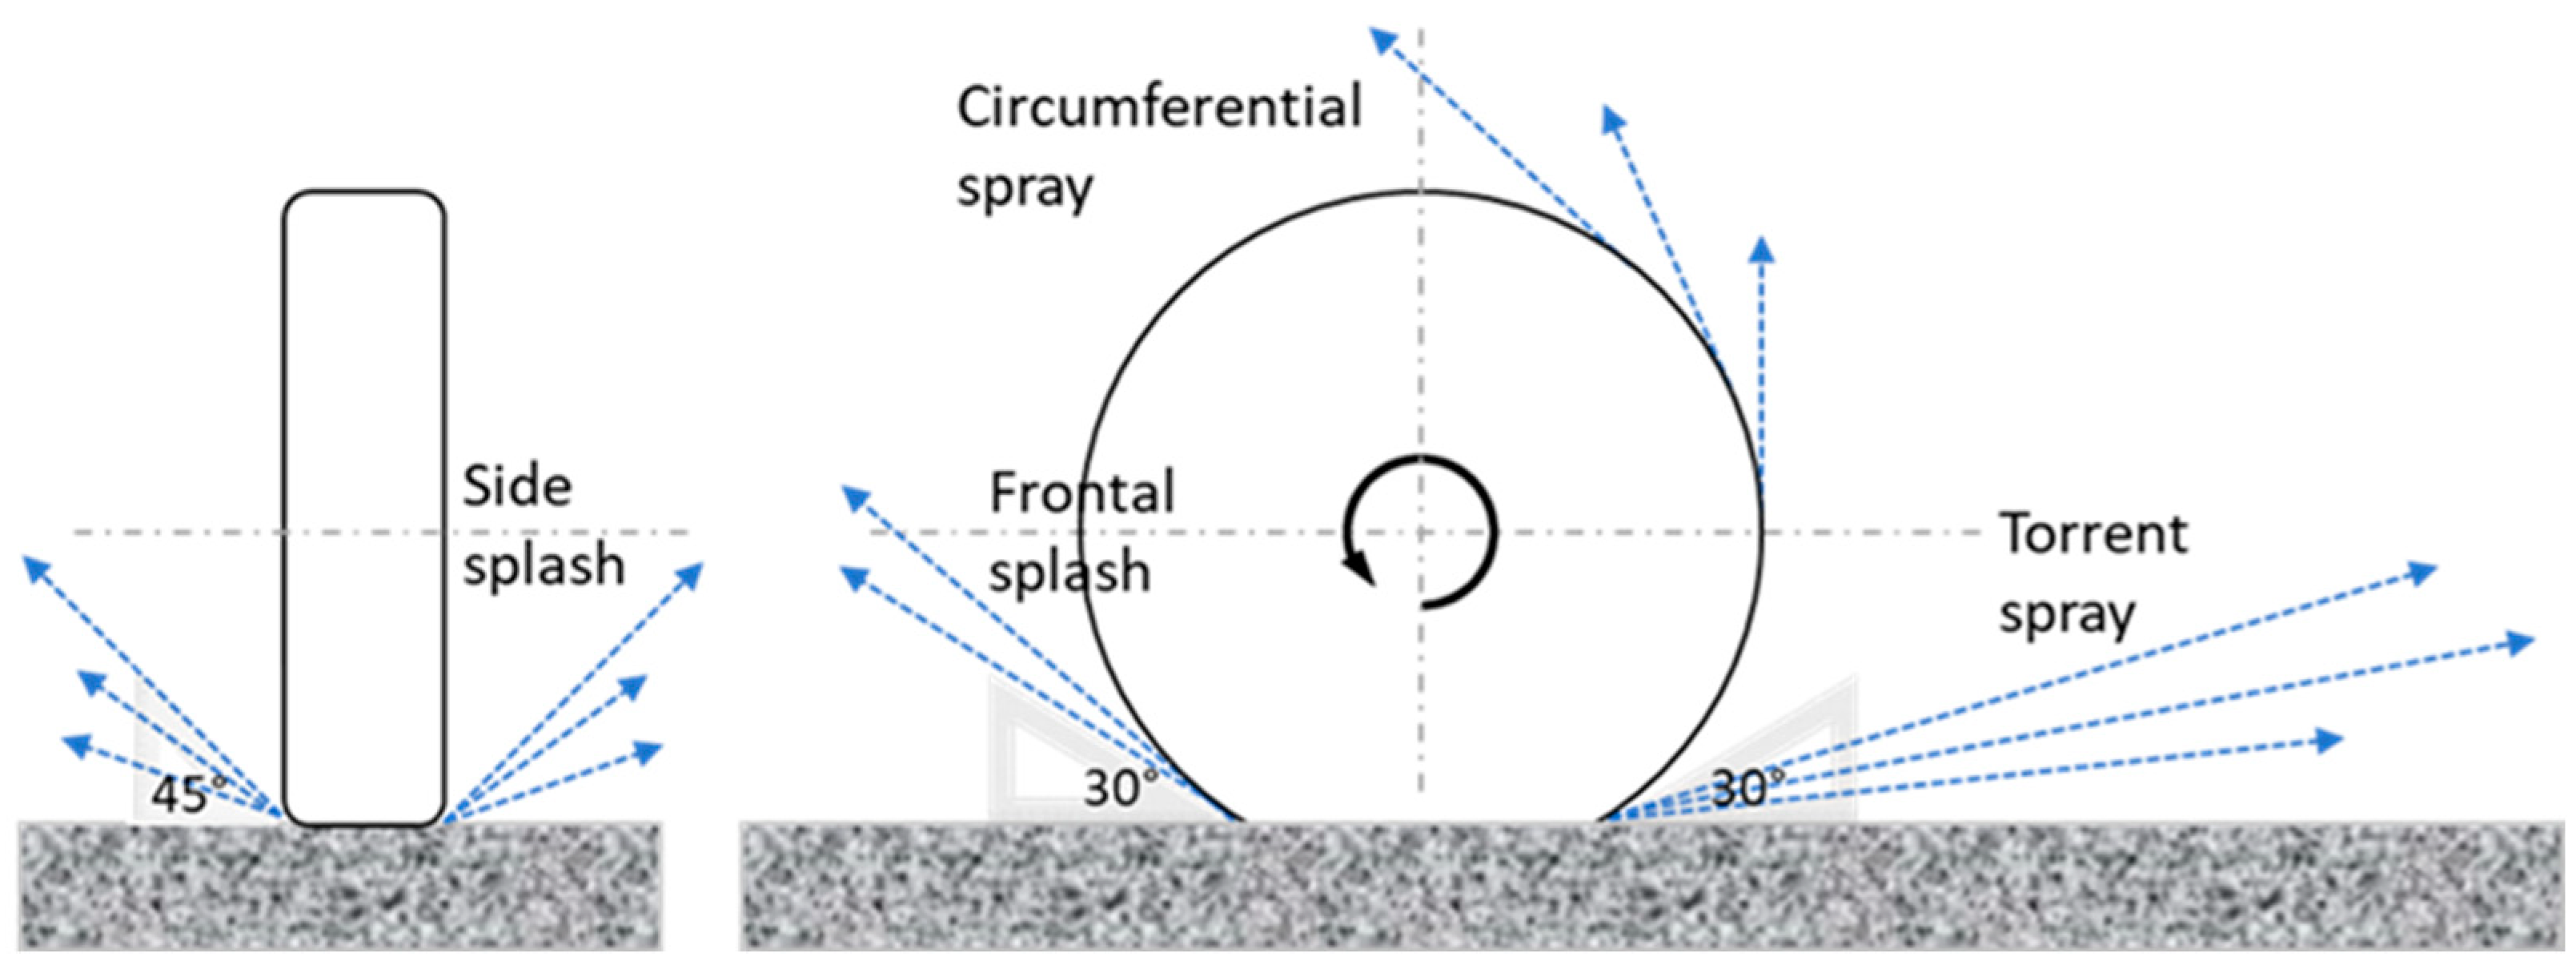
A tire rolling on a wet road displaces the water present on the road surface into three directions: ahead, to either side, and through the tread grooves. Water flows corresponding to the first two directions are called bow (or frontal) and side splash waves, respectively (Figure 2). Water drops forming splash waves are larger than 1 mm in diameter [13].
Water going through the tread grooves is ejected behind the tire or forms a thin film on the tire tread before being detached by airstream. The corresponding flows are called tread pickup (or torrent spray) and capillary adhesion (or circumferential spray), respectively (Figure 2). Water drops forming spray waves are less than 0.5 mm in diameter [13].
In [30], it was found that most water drops produced by trucks are smaller than 0.5 mm. If the water depth decreases, the size distribution of droplets becomes narrower with a higher fraction of small droplets; if the water depth increases, the size distribution of droplets becomes wider with a higher fraction of large droplets [30].
Schmiedel at al. [20] established a link between the four water flows described above and water depths. The circumferential spray is related to water depths below 0.5 mm. Above 0.5 mm in water depth, the torrent spray appears at low speed (40 km/h) and the side splash at higher speeds (up to 120 km/h). The occurrence of side splash can also be related to the onset of hydroplaning.
Coupling the above results to the need for detecting low water depths, one can say that the developed system must characterize mainly spray flows.

3. Experiments

3.1. Instrumentation of a Wheel Arch Liner

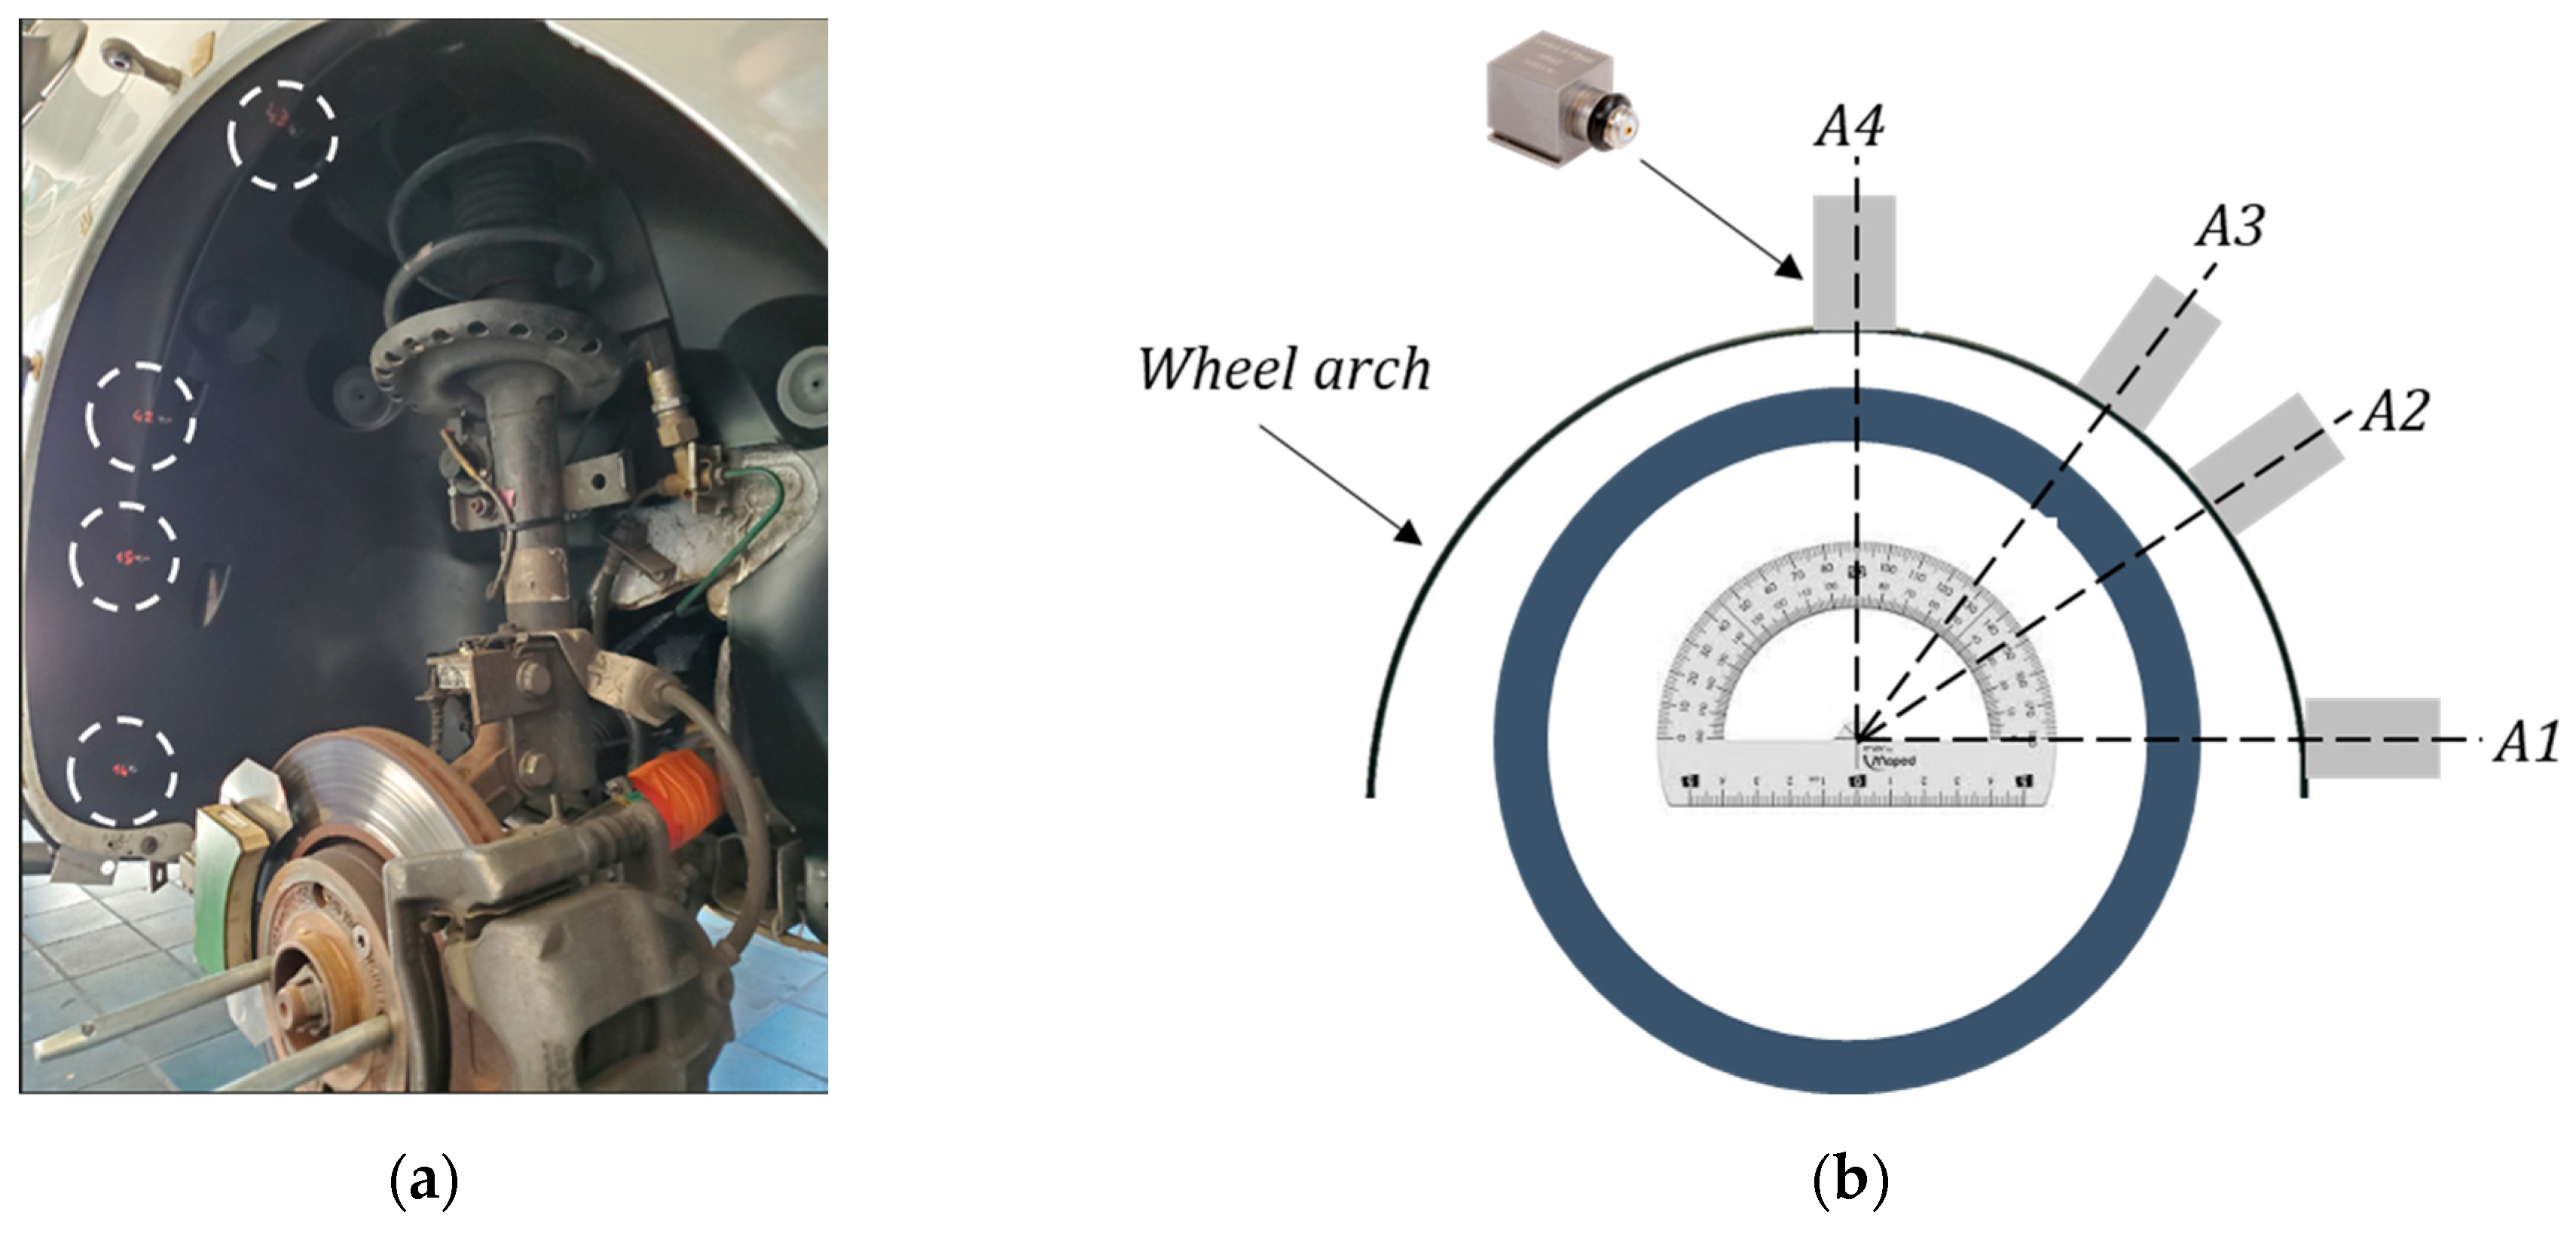
Brüel & Kjær piezoelectric accelerometers (type 4507) are used for the study. Four positions of the accelerometers on the wheel arch are studied (Figure 3a): Accelerometer A1 is at the bottom, defined as 0° position (Figure 3b); A2, A3, and A4 accelerometers are at 36°, 52°, and 90°, respectively (Figure 3b). A HBM system is used for data acquisition at a sampling rate of 38 kHz. Details of the data acquisition system can be found in [9].

3.2. Other Test Equipment

Water depth is measured by the so-called Aquasens sensor. The operating principle (Figure 4a) is based on absorption properties of water for radiations located near the infra-red wavelength region. The device is equipped with a light source and receivers. The road surface is illuminated with white light, which is altered by the water film and then reflected to the receivers. The reflected ray is analyzed to determine the water depth. More details can be found in [31].
The test car is shown in Figure 4b. The Aquasens sensor can be seen on the front of the test car (black box on the right side); it is located at 50 cm above the ground, with an inclination angle of 45°. The accelerometers shown in Figure 3 are implemented on the front right wheel. By this way, the water film is first measured by the Aquasens; the “same” water film is then displaced by the rolling tire and the impact induced by water drops is assessed by the accelerometers (quotation marks are used because the protocol assumes that the water film which induces spray on the wheel arch line has the same thickness as that measured by Aquasens—1.5 m ahead the car—knowing that the physical phenomena—especially water runoff—are more complex).

3.3. Test Tracks and Test Protocol

Three surfaces are tested (Figure 5a): a fine asphalt concrete (high), a sand asphalt (mid), and an asphalt concrete (low). Characteristics of the surfaces are presented in Table 1 and the mix formulations in Table 2. The mean texture depth (MTD) and the mean profile depth (MPD) are defined in [28] and commonly used to characterize the macrotexture of a road surface. The Pendulum Test Value (PTV), defined in [32] and used to characterize the microtexture of a road surface, expresses in a unitless scale the friction energy needed for a rubber pad to slide over the test surface at a predetermined distance (125 ± 1 mm). The Sideway Force Coefficient (SFC), defined in [33] and also used to characterize the microtexture of a road surface, is a coefficient of friction measured by the Sideway force Coefficient Routine Investigation Machine SCRIM®. As SFC is measured by a vehicle, it is used more than the PTV to characterize road networks.
The test track disposes of sprinklers to simulate rainfalls (Figure 5b). Beside the surfaces, the other variables of the test program are the vehicle speed and the water depths. Test speeds are 25 km/h and from 30 to 70 km/h with 10 km/h increments (6 speeds in total).
The test protocol for a configuration (surface, speed) is the following:
-
Passage of the vehicle on the dry surface;
-
Wetting of the test section (100 m long) for 5 min to obtain an evenly wetted (checked visually) surface;
-
Passage of the vehicle during the wetting process;
-
The wetting system is stopped and the vehicle performs successive passages during the drying period.
Water depths are measured continuously and the protocol allows us to obtain different water depths on a given surface at a given speed. The main shortcoming is that the number of wetness levels (as determined by the measured water depths) can vary from one test configuration (surface, speed) to another, depending on the surface texture, weather conditions, etc.

4. Results

4.1. Determination of the Water Depth

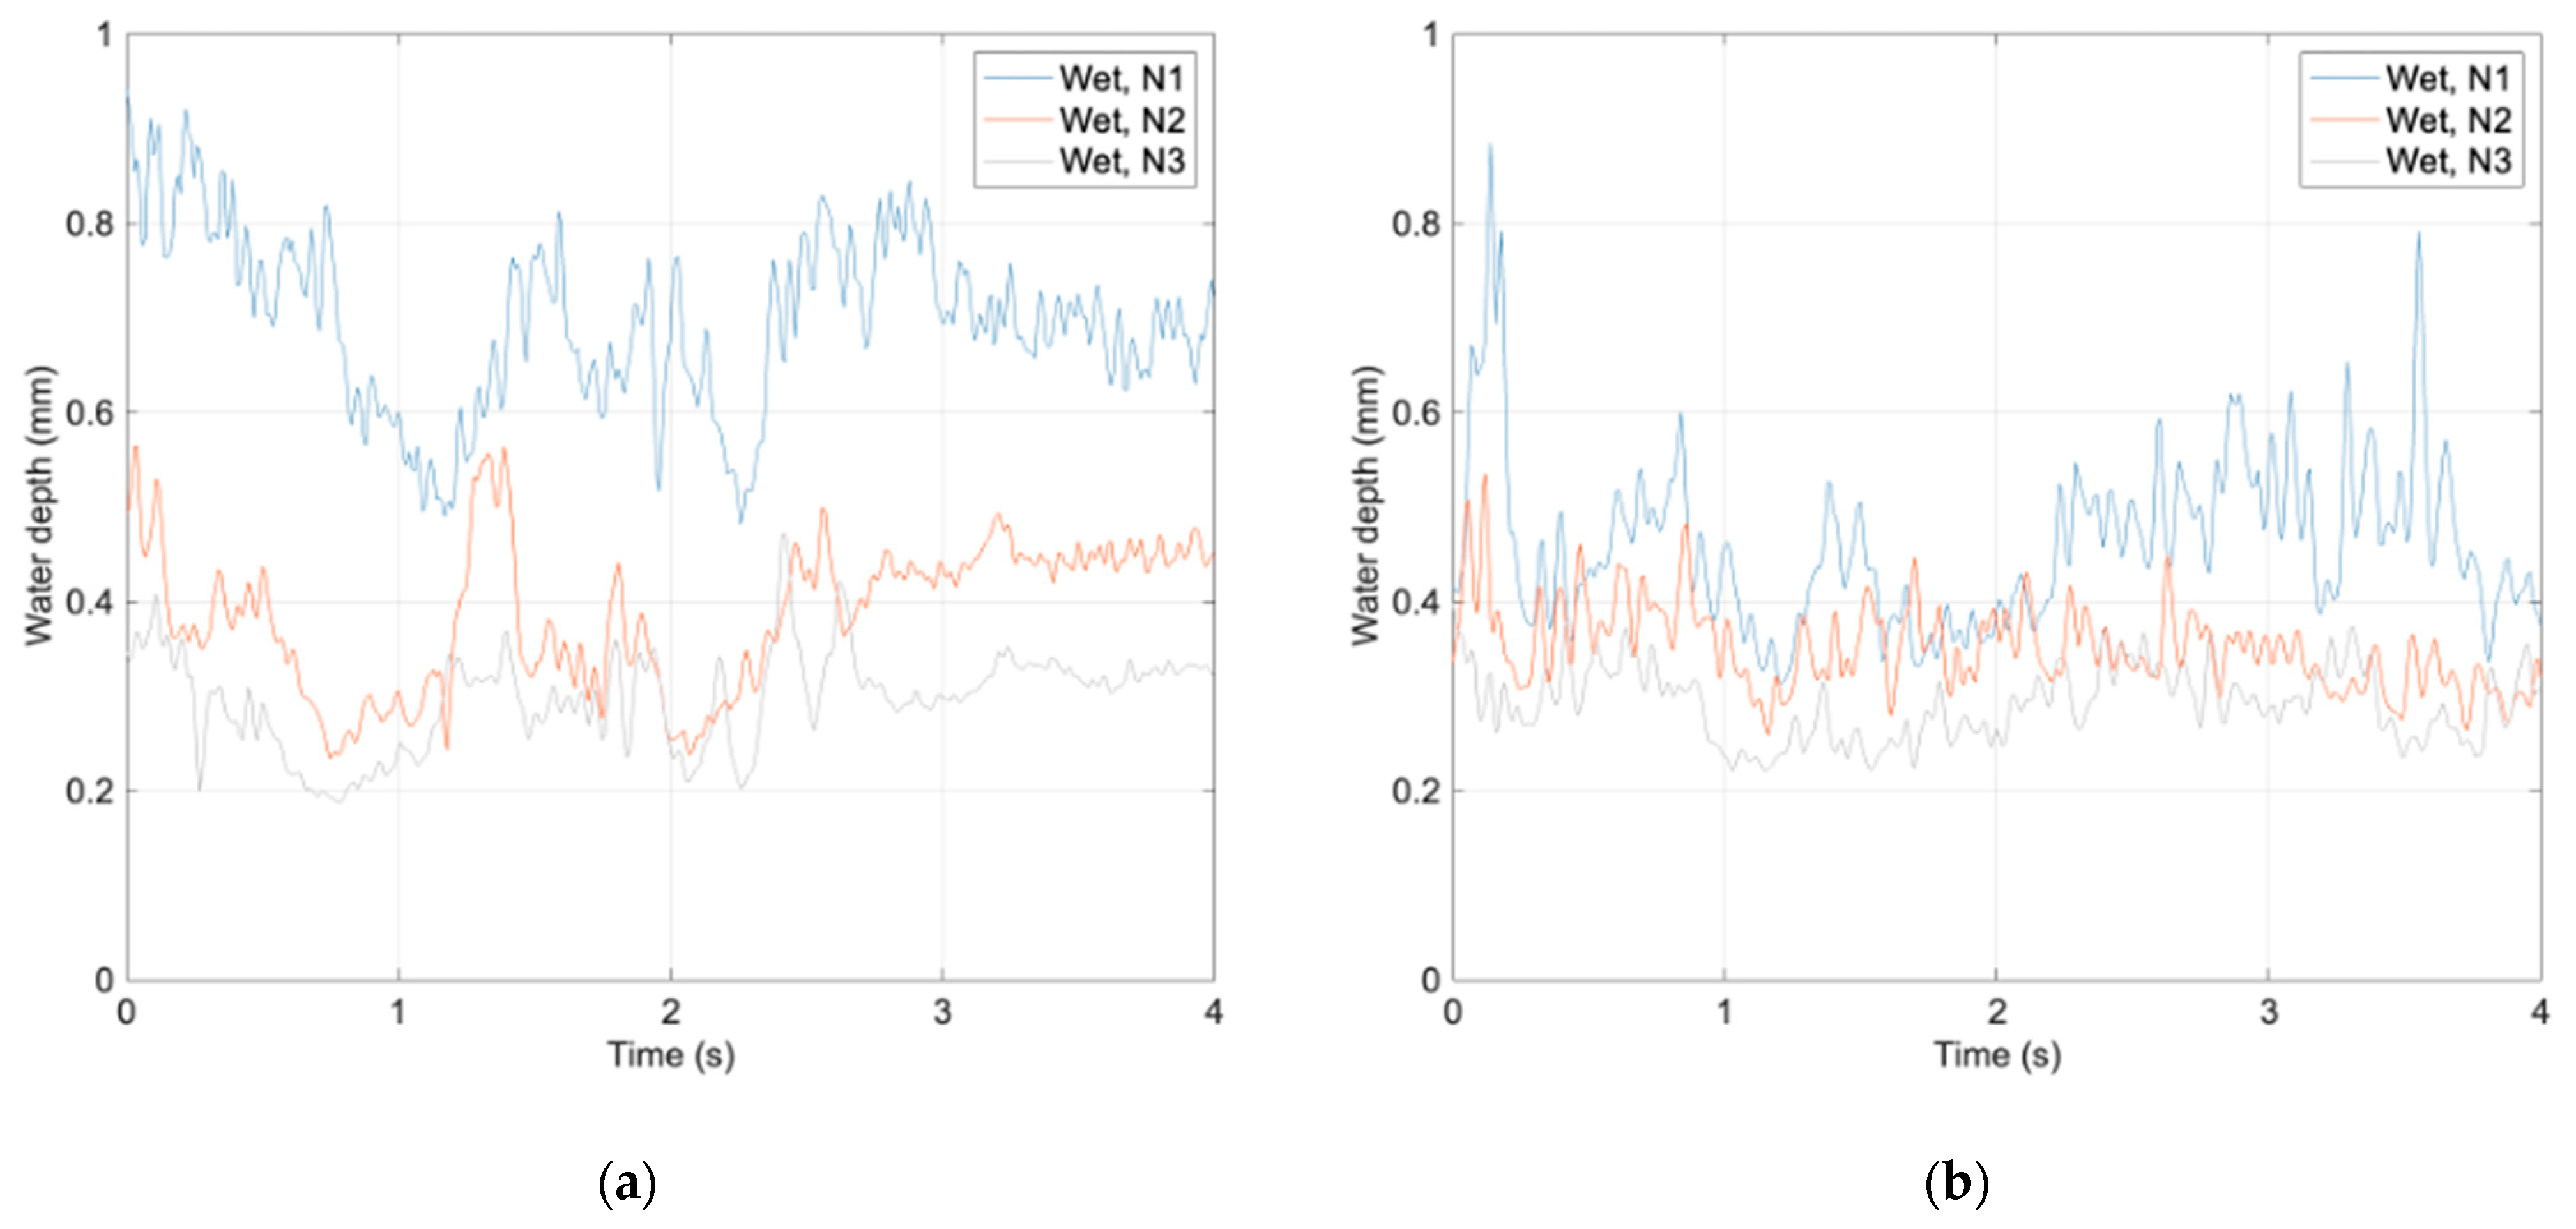
Figure 6 presents the variation in water depth over time when the test car travels over the test sections (examples shown for the fine asphalt concrete and the asphalt concrete, respectively). The three graphs correspond to: a run when the wetting system is still operating (N1); a run when the wetting system has just been stopped (N2); and a run following N2 (N3).
It can be seen that the water depth fluctuates significantly over time and the difference between different passes depends on the surface: on the fine asphalt concrete, a significant difference can be observed between before and after wetting, whereas on the Asphalt Concrete, the difference between the three runs seems to be negligible. These results can be related:
-
To the cross slope of the test sections (2%), which facilitates the water runoff and induces a decrease in water depth once the wetting system is stopped;
-
To the macrotexture of the test surfaces, which can store water in available voids of the surface. On the fine asphalt concrete, the relative low macrotexture leaves most of the water on the surface and, as soon as the surface wetting stops, a large amount of water is evacuated; this explains the difference between data from the N1 run and the following ones. On the asphalt concrete, the relative high macrotexture allows a more important water storage; this explains the smaller difference between the three runs.
Despite the observed fluctuation in water depths over time, it was decided to calculate a mean value of water depths over time. For a given test condition (surface, speed, run), this value is used as the related water depth for further analyses.

4.2. Processing of Accelerometric Signals

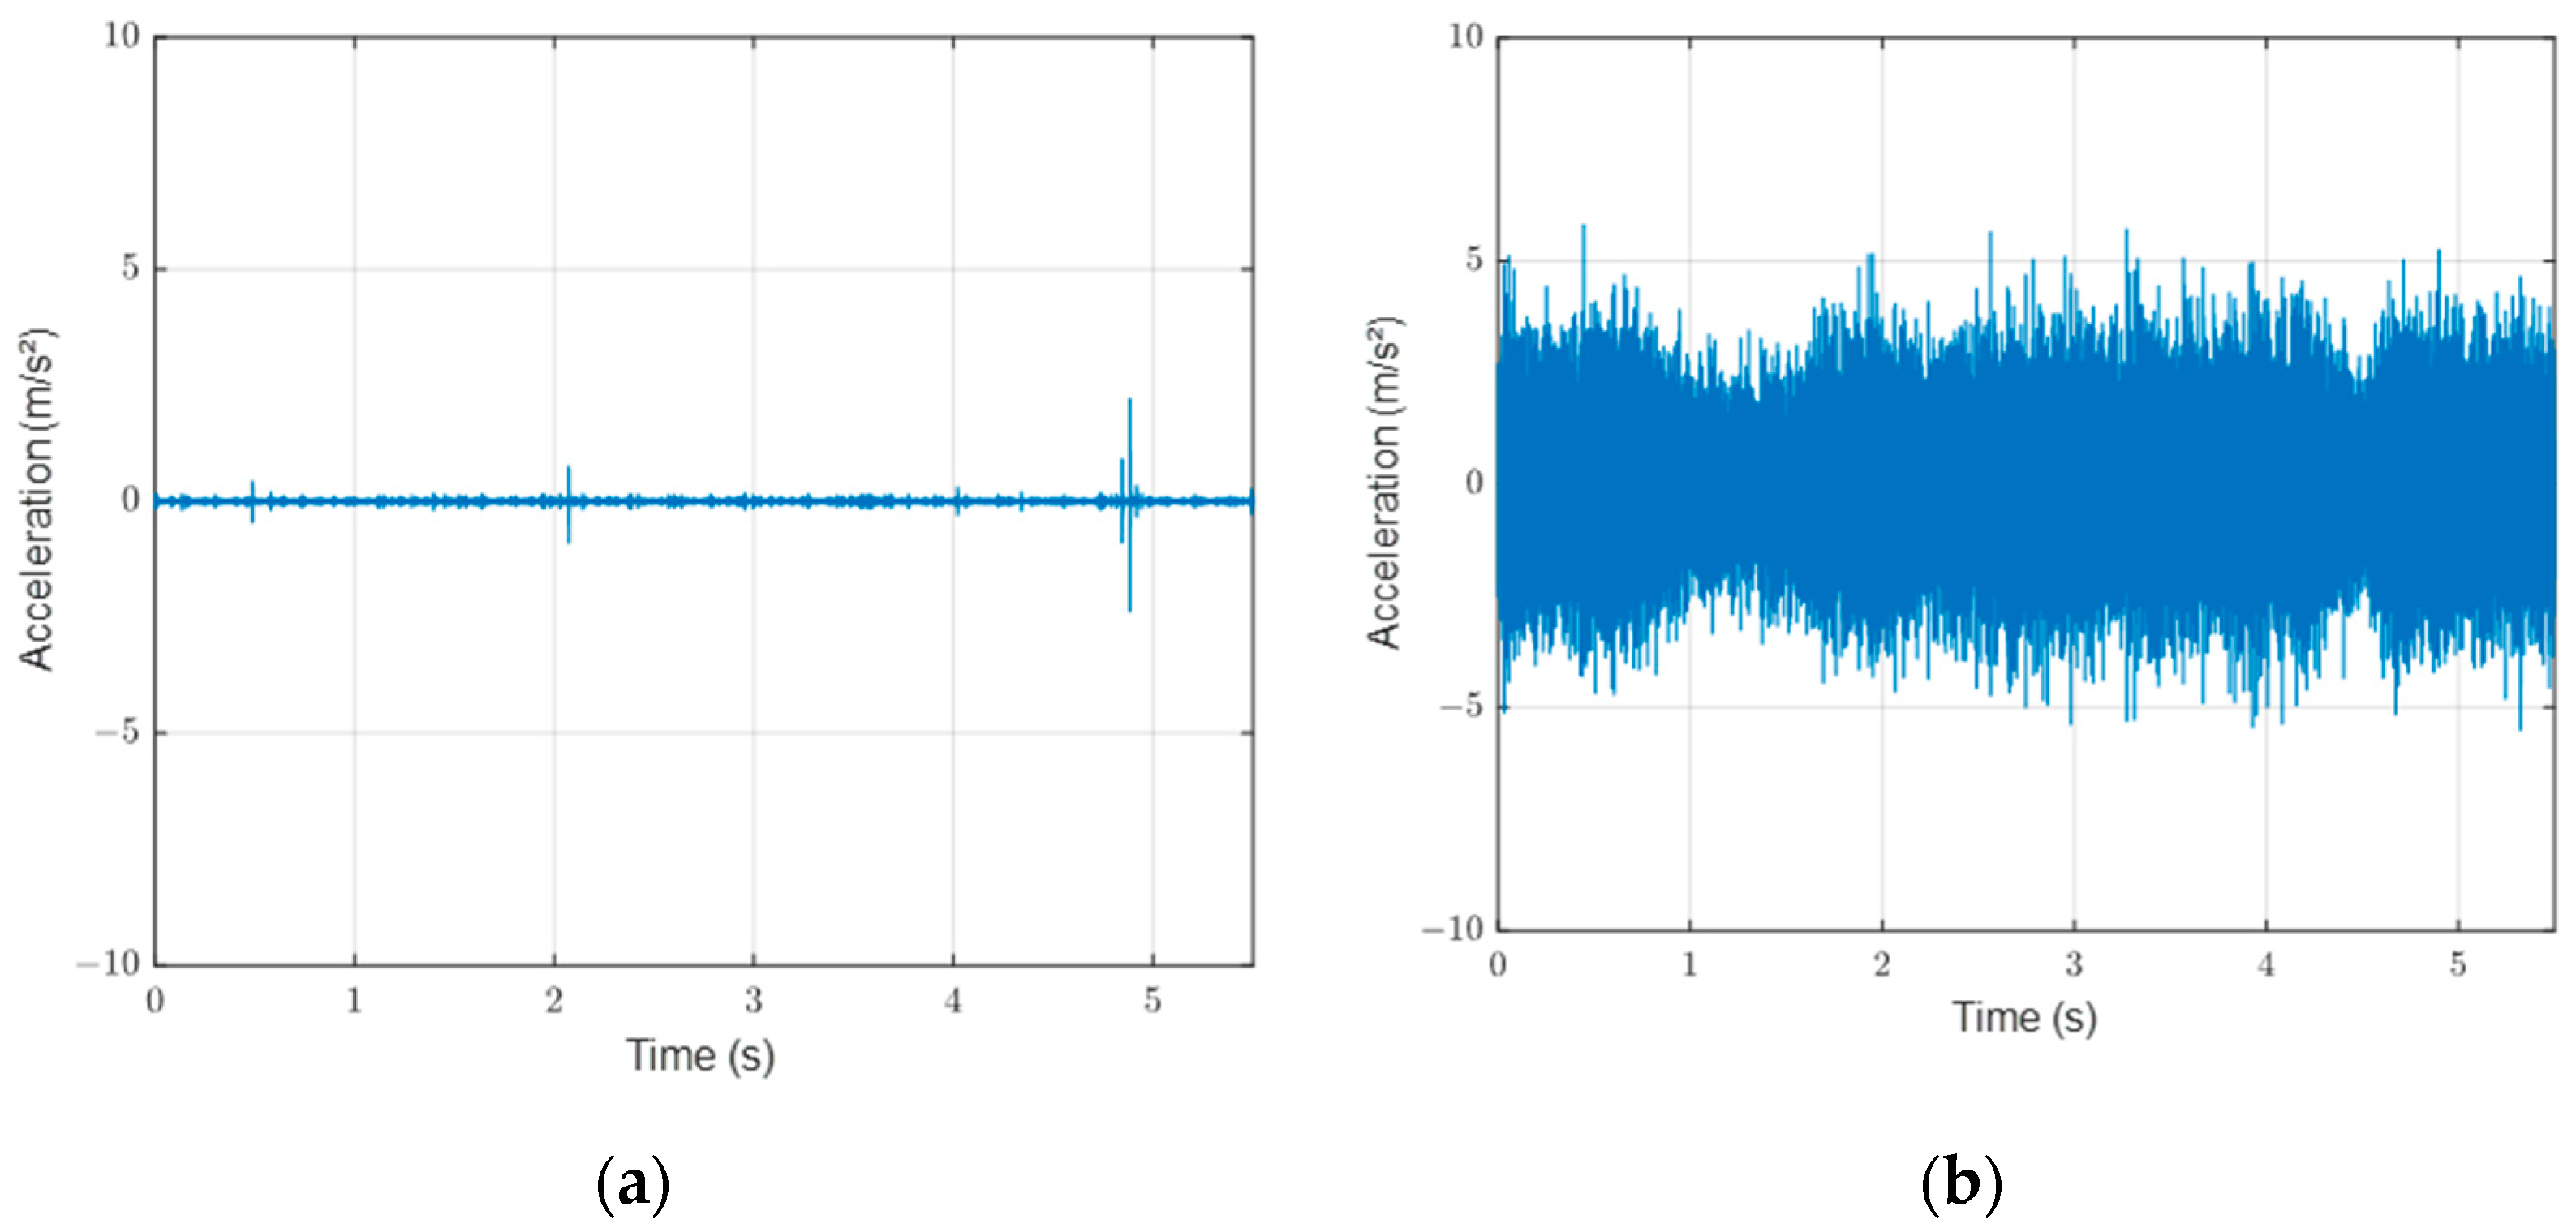
On dry surfaces, the recorded signals express vibrations due to the movement of the vehicle; these vibrations are considered as noise and should be removed. A Chebyshev filter with a passing band of 2–7 kHz (where the difference between wet and dry signals is pronounced) is then used to remove noise from the raw signal. The dry and wet filtered signals are presented in Figure 7a and Figure 7b, respectively.

4.3. Variaton of the Acceleration Amplitude with the Water Depth

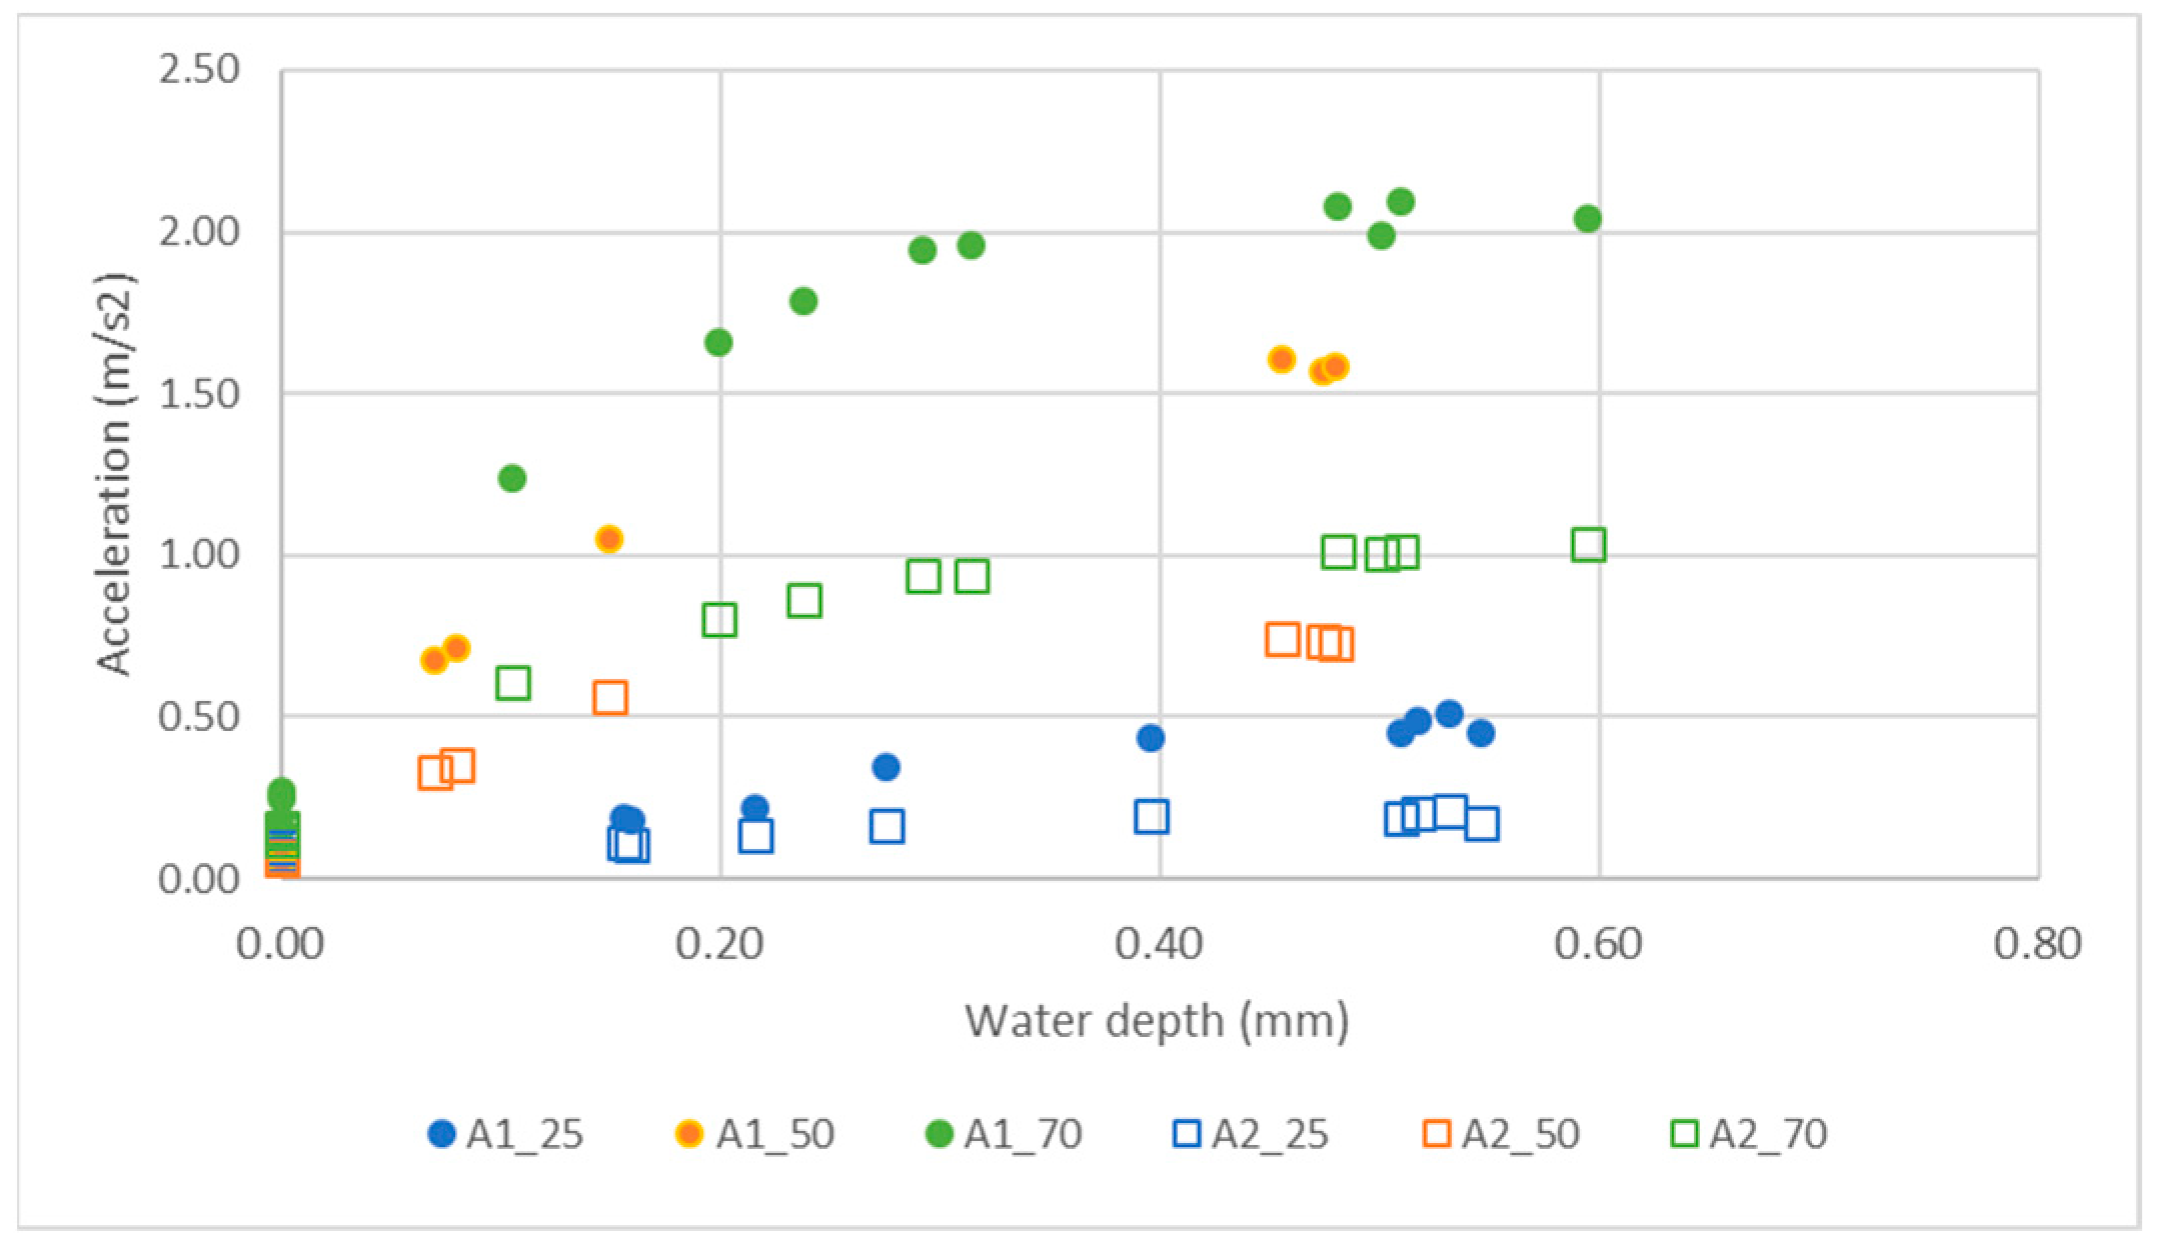
Typical variation in the acceleration amplitude with the water depth is shown in Figure 8 for accelerometers A1 and A2 (see Figure 2b for the location of these accelerometers on the wheel arch). It can be seen that the acceleration amplitude is lessened for the A2 accelerometer; for instance, values at 70 km/h for the A2 accelerometer are lower than those at 50 km/h for the A1 accelerometer. This trend is consistent with the location of the two accelerometers: the A1 accelerometer is at the bottom of the wheel arch liner and should receive more droplets—mainly from the torrent spray, based on Figure 1—and so should record more vibrations. Results from accelerometers A3 and A4 (not shown) confirm the fact that the signal weakens as the accelerometer moves away from the road surface. This is consistent with the fact that circumferential spray’s droplets are smaller than torrent spray’s ones [17], and so they generate less vibration on the accelerometers. For all these reasons, analyses in the rest of the paper focus only on results provided by the A1 accelerometer.
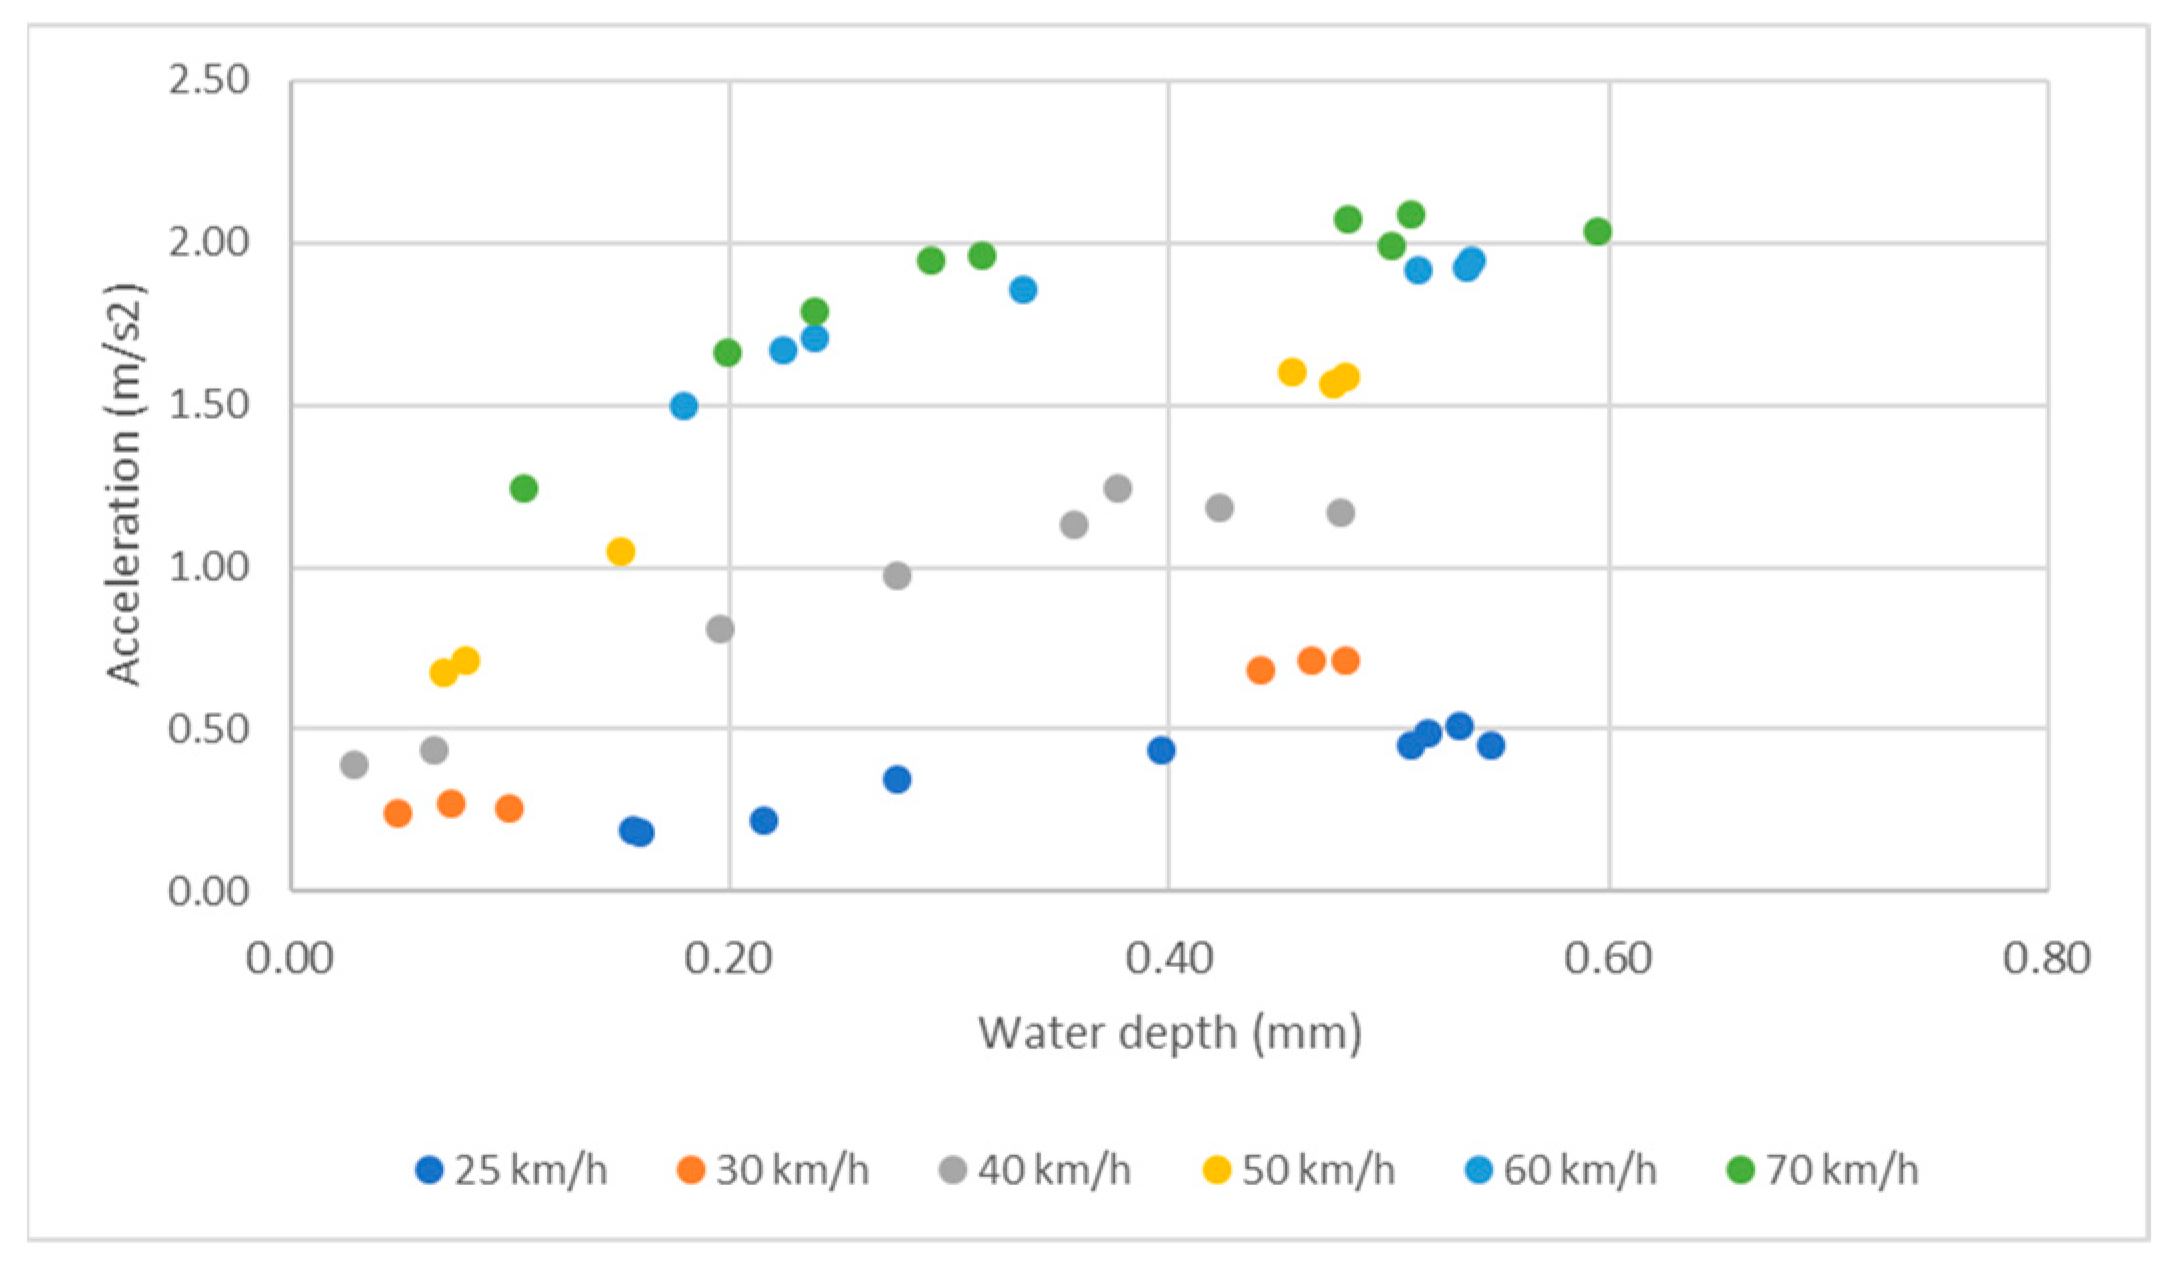
Figure 9 shows that the acceleration amplitude increases with the water depth and, for a given water depth, with the vehicle speed. The variation seems to be linear for speeds of 25 km/h and 30 km/h. For higher speeds (above 40 km/h), the variation is non-linear, with a stabilization of acceleration amplitude for water depths higher than 0.4 mm.
Comparison of the variation in acceleration amplitude–water depth between the three test surfaces shows that:
-
At low speed (Figure 10a), the variation is linear and similar for all surfaces;
-
At high speed (Figure 10b), the variation depends on the surface for water depths lower than 0.4 mm. For a given water depth, the acceleration amplitude is highest for the surface dressing and lowest for the sand asphalt.
-
For water depths higher than 0.4 mm at high speed, there seems to be no difference between the three surfaces. However, as data are limited, this interpretation should be treated with caution.

4.4. Relating Acceleration Amplitude to Water Depth

Based on observations of Figure 10, it was tempted to use two models to represent experimental data: a linear model for 25 km/h and 30 km/h speeds and a non-linear model for speeds higher than 40 km/h. However, there is no physical justification for using two different forms of model. The following model was then proposed to represent the variation in acceleration amplitude with water depth:
a = a 0 1 e x p W D a 1
where a is the acceleration amplitude (in m/s2); W D is the water depth (in mm); and a 0 and a 1 are two parameters to be obtained by fitting (based on the equation, the units of a 0 and a 1 are m/s2 and mm, respectively).
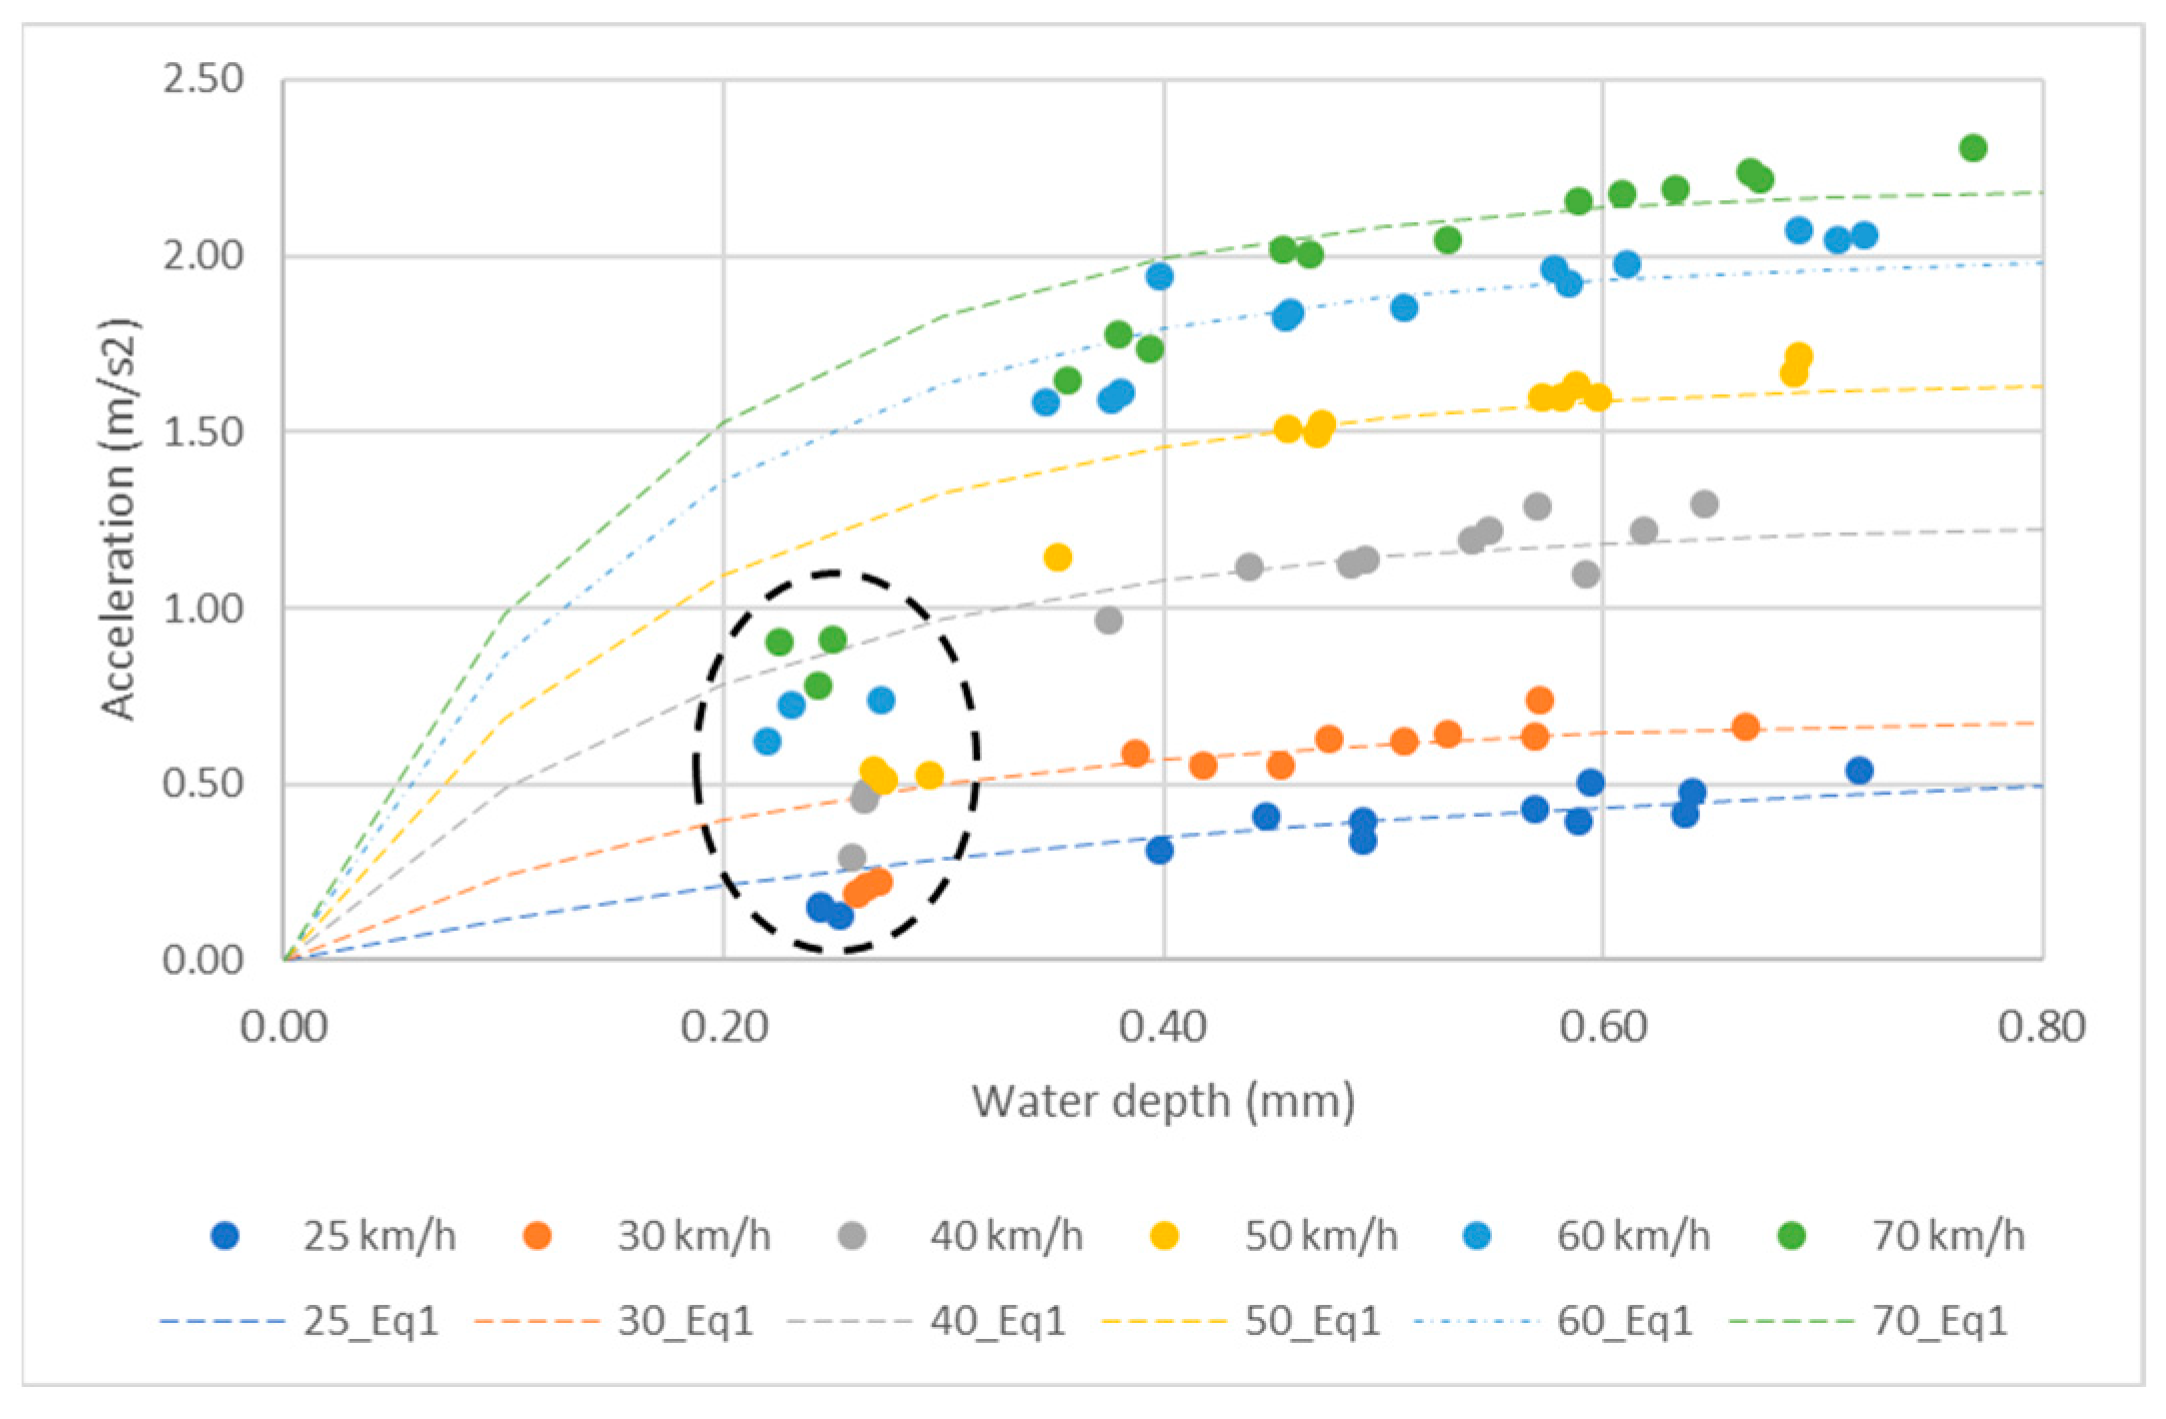
A first glance, Figure 11 seems to show that the proposed model (dotted lines) represents good experimental data. However, a closer look highlights an overestimation of data at water depths lower than 0.4 mm (for example, those identified by the dotted ellipse).
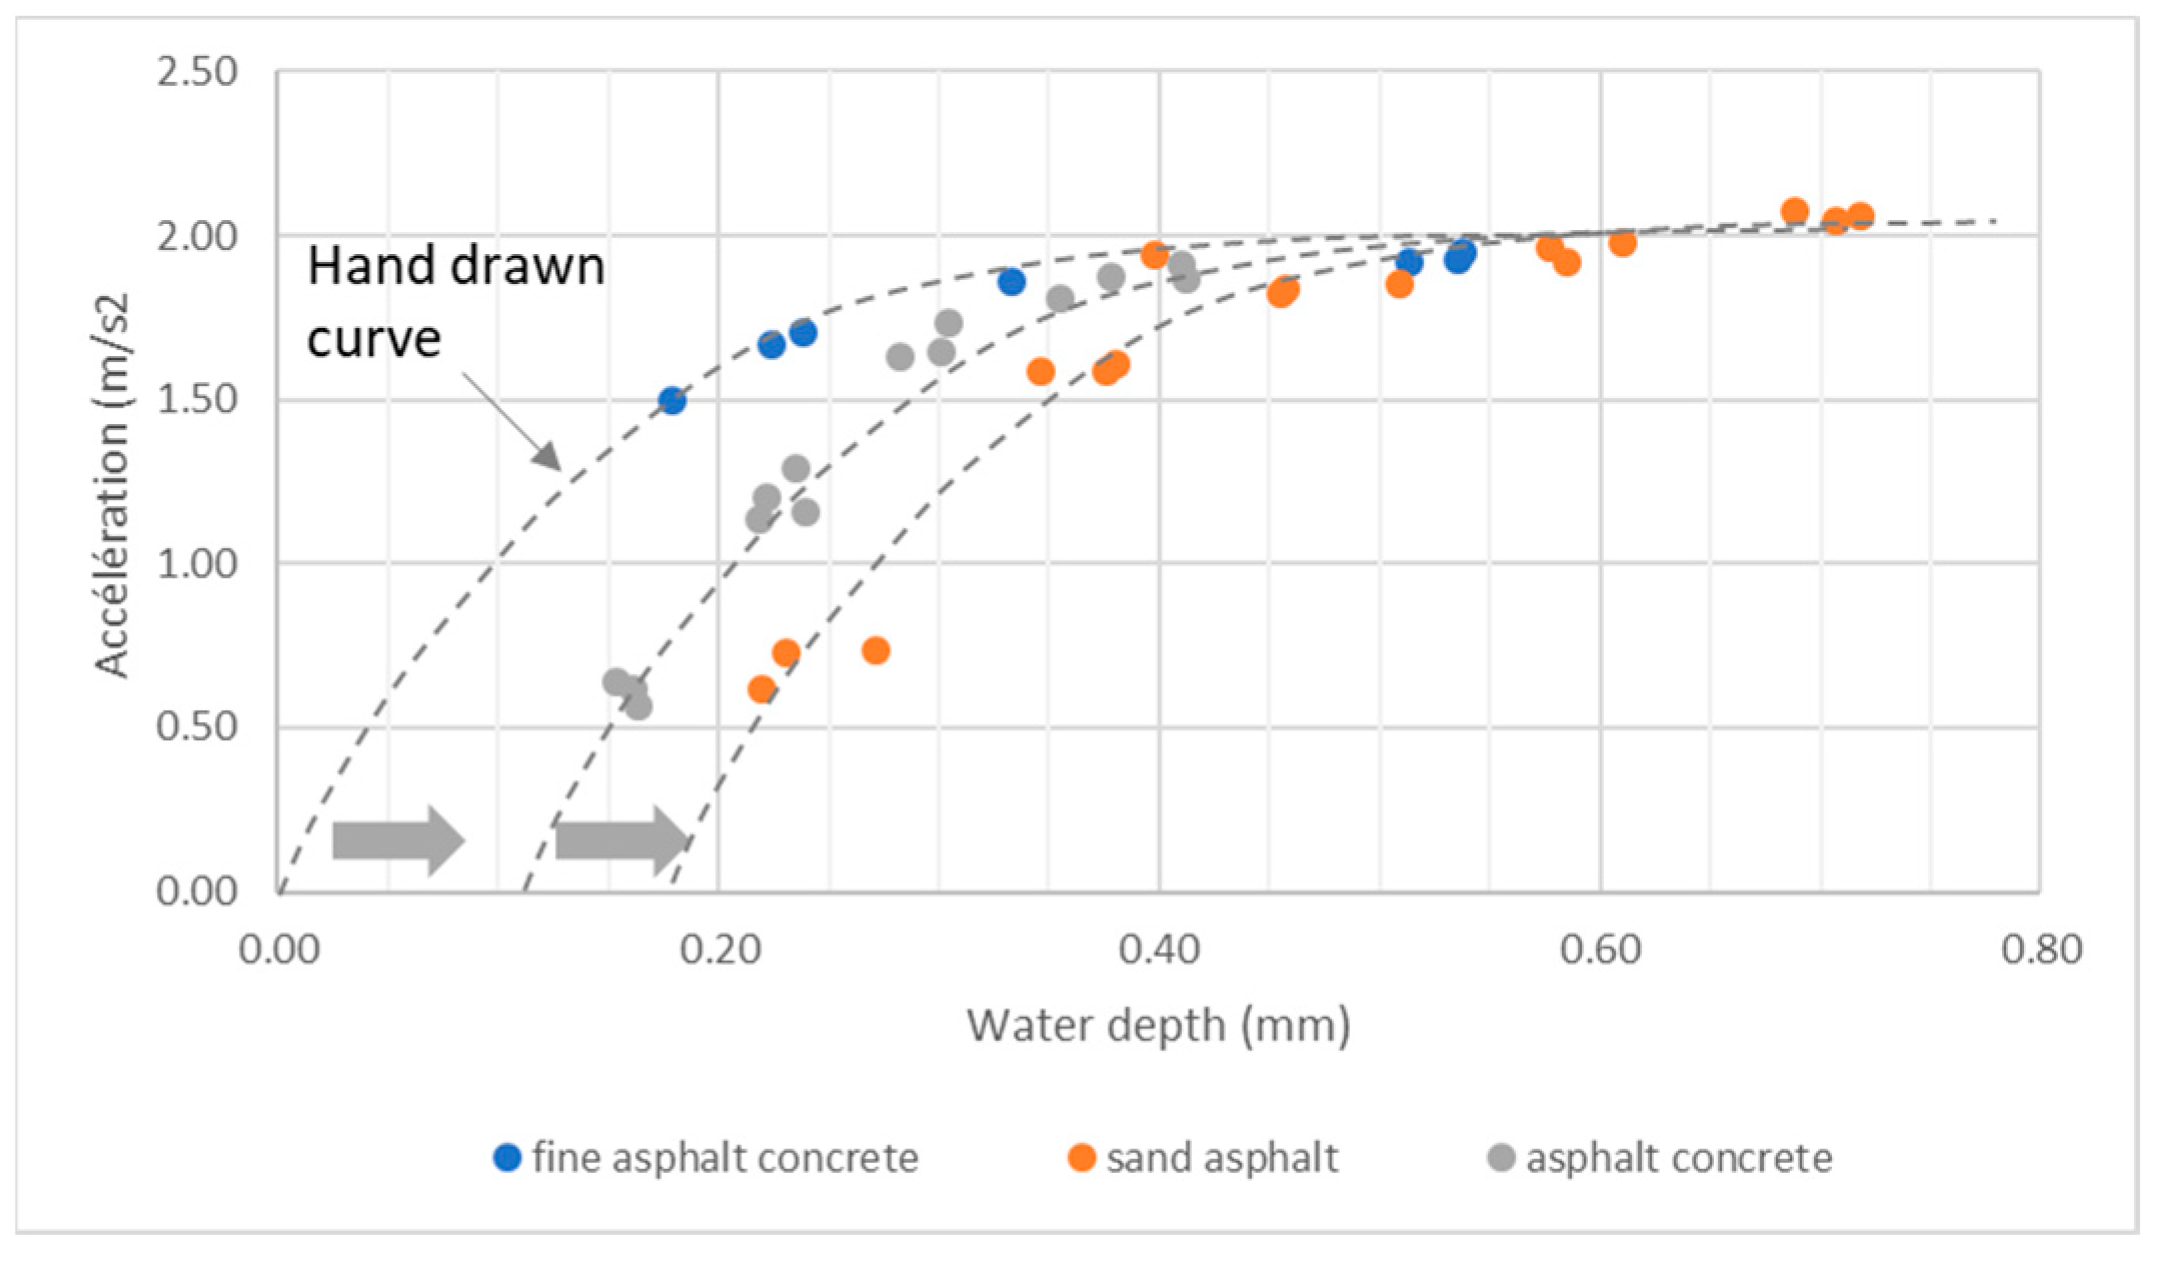
One can wonder whether the mentioned difference is due to experimental reasons (for example, measurements of low water depths), or does it reflect a physical mechanism that is not considered in the proposed model? If one draws by eye a line through the experimental data in Figure 10b, given Figure 12 below (the gray line is first drawn for the fine asphalt concrete surface, then reproduced as is for the two other surfaces), it can be seen that:
-
The same line fits data of all surfaces;
-
The lines cross the X axis at three different values of water depth at approximately 0, 0.1 mm, and 0.2 mm for the fine asphalt concrete, the sand asphalt, and the asphalt concrete, respectively.
The above observations mean that a unique model can be used for the three test surfaces by means of a change in the origin on the abscissa axis.
A modified model is then proposed to integrate the new features revealed in Figure 12:
a = a 01 1 e x p W D a 21 a 11
where a 01 and a 11 have the same meaning as in Equation (1) (the second index 1 has been added to distinguish the new parameters from those of Equation (1)); and a 21 (in mm) is a parameter which expresses the change in the origin on the abscissa axis.
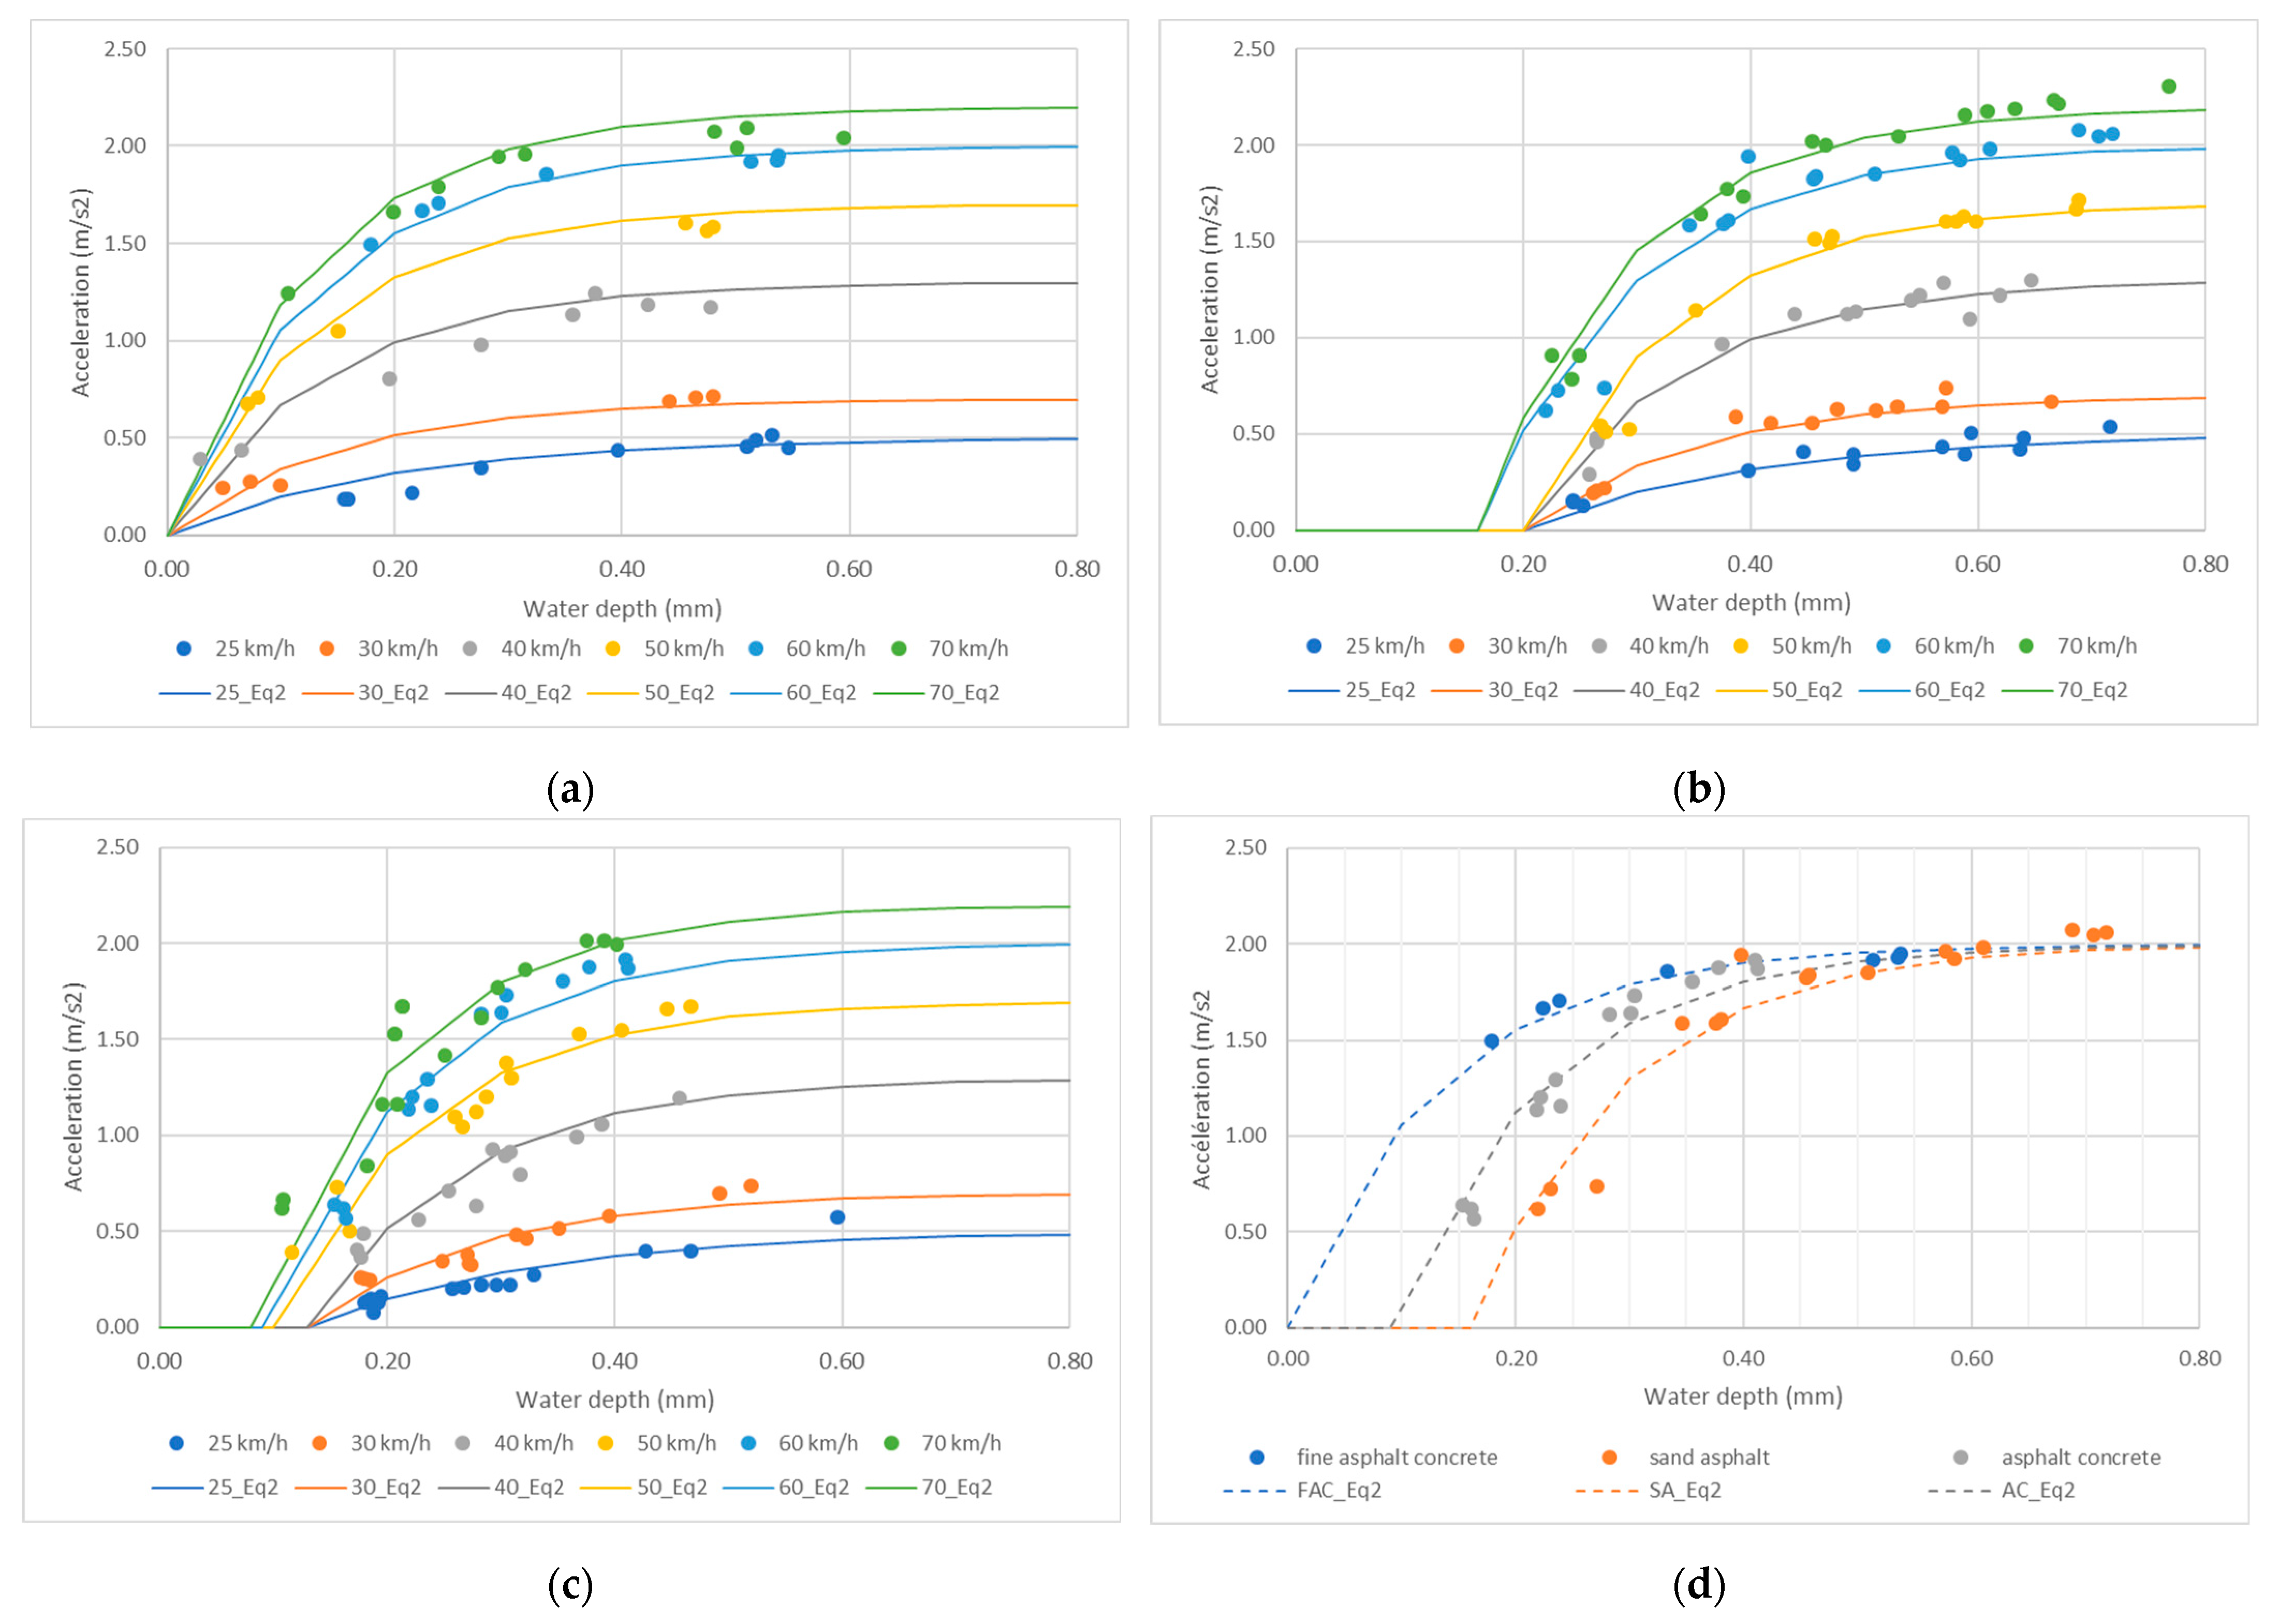
Correspondence between the modified model and experimental data is shown in Figure 13. Figure 13a–c show a better fit of the modified model (compared to Figure 11). The offset (change in the origin on the abscissa axis) depends on the test surface and the test speed. When the offset is not null (in the case of sand asphalt and asphalt concrete surfaces), its value decreases with increasing speed.
Graphs in Figure 13d are extracted from those of Figure 13a–c for a test speed of 60 km/h. It can be seen that Figure 13d confirms the assumption made in Figure 12. Figure 13d also shows that the water depth from which there is no difference, in terms of acceleration amplitude, between the three test surfaces, is at least higher than 0.6 mm; this value is higher than the threshold of 0.4 mm assumed from Figure 10b.
Values of a 01 , a 11 , and a 21 are presented in Table 3. It should be noticed, based on the observation from Figure 11 (following which the same line can be applied to data of the three surfaces) which is confirmed in Figure 13d, that values of a 01 and a 11 parameters at a given speed are the same for the three surfaces.
The variation in parameter a 01 with speed is presented in Figure 14a. It can be seen that a 01 increases linearly with speed and a good correlation can be established. Variation in parameter a 11 with speed is presented in Figure 14b. It can be seen that a 11 decreases first with speed then stabilizes (the mean value of a 11 for speeds varying from 40 km/h to 70 km/h is 0.134 mm).
Adjusted values of a 21 mean that water spray is significant—to be detected by acceleration measurements—for the fine asphalt concrete surface as soon as the surface is wet ( a 21 = 0). For the sand asphalt and asphalt concrete surface, there is a threshold value below which the accelerometers do not detect any wetness. This threshold decreases when the vehicle speed increases, meaning an earlier detection of road wetness when the vehicle speed increases. The hierarchy between the three test surfaces is less clear with respect to their macrotexture: for a given speed, values of a 21 are in an increasing order for fine asphalt concrete, asphalt concrete and sand asphalt surfaces, whereas the mean texture depth is 0.38 mm, 1.14 mm, and 0.84 mm respectively.

5. Discussion

The response of the accelerometers induced by water spray depends on three factors: the water depth, the vehicle speed, and the surface macrotexture. It can be noticed that the first two factors contribute to water accumulation in the tire/road interface and the third one contributes to water drainage. The tire tread depth contributes also to water drainage but, as the same tires are used during the tests, its effect cannot be seen. If one assumes that the acceleration amplitude is proportional to the quantity of spray, some comparisons can be made between results presented in the above sections and conclusions from previous studies.

5.1. On the Influence of Water Depth

Koppa and coauthors [34] studied splash and spray generated by a truck in the presence of water depths varying from 0.5 mm to 1.25 mm. These authors found no significant effect of water depth on the quantity of spray (assessed by means of filming spray clouds with a camera projected against a checkerboard). This result means that the variation in acceleration amplitude is not significant for water depths varying from 0.5 mm to 1.25 mm, which corroborates results from Figure 13d (the minimum speed in tests conducted by Koppa and coauthors was around 55 km/h (35 mph) and corresponds more to the configuration of Figure 13d).

5.2. On the Influence of Speed

In another study, Koppa and coauthors [7] found that the spray density varies linearly with the vehicle speed for speeds between 55 km/h and 95 km/h (35 mph to 60 mph). On the other hand, Maycock [9] found that the spray density varies as a power function of the vehicle speed, i.e., spray density ≈ (speed)2.8, for speeds between 70 km/h and 120 km/h (45 mph to 75 mph). As tests of the two cited references were conducted in the presence of a large amount of water, a 01 parameter, which expresses the acceleration amplitude for when water depths become “infinite”, can be used for the comparison. From Figure 14a, it can be said that results of the present paper correspond more to the conclusion of Koppa’s study.
Maycock [9] also stated that, for vehicle speeds lower than 50 km/h (30 mph), “the bulk of the water displaced by the tyre did not break up into fine spray, but merely fell back to the ground as large drops and failed to reach the collectors”. Results of the present paper show that the accelerometers responded at speeds lower than 50 km/h, meaning that fine spray is produced and water droplets can reach the wheel arch liner. The difference between the present paper and Maycock’s study can be due to the fact that this author collected water splash and spray at a distance of 6.6 m (22 ft) from the rear of the projecting tires, whereas a wheel arch liner is rather in the order of 0.1 m.

5.3. On the Influence of Road Surface Texture

Authors like Maycock [9] and Flintsch [6] have agreed on the fact that the quantity of spray decreases when the drainage capacity of the road surface increases. Based on values of the mean texture depth (MTD) (the same statement can be applied to the MPD, see Table 1), which characterizes the surface macrotexture and so its drainage capacity, the quantity of spray—and so the acceleration amplitude—should be reduced when one moves from the fine asphalt concrete to the sand asphalt then to the asphalt concrete. Figure 13d shows that the assumed hierarchy is respected for the fine asphalt concrete compared to the two other surfaces; however, it is not true for the sand asphalt compared to the asphalt concrete. The same statement can be applied to parameter a 21 . Increasing values of a 21 should be observed for increasing MTD, because less water trapped between the tire and the road surface (high MTD) should entrain later water spray (high a 21 ); again, this statement is valid for the comparison of fine asphalt/(sand asphalt, asphalt concrete) but not for the comparison sand asphalt/asphalt concrete.
A possible explanation is that water splash and spray are complex processes and the mean texture depth (and the mean profile depth as well) cannot be used as the only explanatory parameter. Further investigations to identify other parameters should provide a more satisfactory interpretation of the results.

6. Conclusions

Road wetness induces a reduction in the tire/road friction and contributes to an increase in accidents. Research presented in this paper exploited tire splash and spray mechanisms to determine water depths on a road surface. The developed system makes use of accelerometers implemented on the front wheel arch of a passenger car to record vibrations induced by water spray. Tests using a Clio 3 car were conducted on three road surfaces (range of 0.4–1.1 mm in mean texture depth) at different vehicle speeds (range of 25–70 km/h) and wetness levels (range of 0.1–0.8 mm in water depths). It was found that the acceleration amplitude (root mean square of filtered acceleration time signals) increases with increasing vehicle speeds and increasing water depths on the road surface. An exponential model has been proposed to relate the acceleration amplitude to the water depth. Following this model, for a given surface and a given speed, the acceleration amplitude is null until the water depth exceeds a threshold value. Assuming a link between the acceleration amplitude and the amount of spray, the comparison between findings presented in this paper and results from past studies show consistent trends in terms of influencing factors and physical phenomena.
Further investigations are needed to complete the results summarized above. The first aspect is the effect of the macrotexture. It was seen that the mean texture/profile depth cannot explain the hierarchy between the test surfaces, as revealed by acceleration measurements. A deeper analysis of water projection mechanisms, together with the use of 3D topography maps, would help to better understand the role of the texture and identify more relevant indicators. The second aspect is the test site. Even if a test track provides surfaces with various texture levels, surfaces of trafficked roads contain irregularities such as permanent deformations that can affect the performance of the developed system. Finally, as mentioned in the introduction, the study presented in this paper is a first step toward an estimation of tire/wet road friction. The next step should be the development of this “estimator” to predict either a coefficient of friction or a skid resistance class depending on the wetness level of the road surface. This information, still missing in most vehicles traveling on various itineraries, can be coupled with other driver assistance systems to evaluate the stability of vehicles and preserve driver safety.

Author Contributions

Conceptualization, M.-T.D. and E.R.; methodology, E.R. and W.E.; formal analysis, M.-T.D. and W.E.; writing—original draft preparation, M.-T.D.; writing—review and editing, W.E., V.C. and M.G. All authors have read and agreed to the published version of the manuscript.

Funding

This study was performed in the framework of the ENA project (Autonomous Shuttle Experiments) financed by the French Government as part of the Future Investments Program now integrated into France 2030, and operated by the Environment and Energy Management Agency—ADEME. Project labeled by CARA European Cluster for Mobility Solutions.

Data Availability Statement

Data presented in this study are available on request from the first author. The data are not publicly available due to a confidentiality agreement within the framework of the ENA project.

Acknowledgments

The authors thank Sebastien Buisson, Angelique Guilloux and Samuel Louis for the instrumentation of the vehicle and the testing.

Conflicts of Interest

The authors declare no conflict of interest.

References

  1. Do, M.-T.; Cerezo, V.; Beautru, Y.; Kane, M. Modeling of the connection road surface microtexture/water depth/friction. Wear 2013, 302, 1426–1435. [Google Scholar] [CrossRef]
  2. Warth, G.; Sieberg, P.; Unterreiner, M.; Schramm, D. A Concept for Using Road Wetness Information in an All-Wheel-Drive Control. Energies 2022, 15, 1284. [Google Scholar] [CrossRef]
  3. Salvi, K.A.; Kumar, M. Rainfall-induced hydroplaning risk over road infrastructure of the continental USA. PLoS ONE 2022, 17, e0272993. [Google Scholar] [CrossRef] [PubMed]
  4. D’Apuzzo, M.; Evangelisti, A.; Nicolosi, V. An exploratory step for a general unified approach to labelling of road surface and tyre wet friction. Accid. Anal. Prev. 2020, 138, 105462. [Google Scholar] [CrossRef] [PubMed]
  5. Stevens, S.E.; Schreck, C.J., III; Saha, S.; Bell, J.E.; Kunkel, K. Precipitation and Fatal Motor Vehicle Crashes: Continental Analysis with High-Resolution Radar Data. Bull. Am. Meteorol. Soc. 2019, 100, 1453–1461. [Google Scholar] [CrossRef]
  6. Black, A.W.; Villarini, G.; Mote, T.L. Effects of Rainfall on Vehicle Crashes in Six U.S. States. Weather Clim. Soc. 2017, 9, 53–70. [Google Scholar] [CrossRef]
  7. Eisenberg, D. The mixed effects of precipitation on traffic crashes. Accid. Anal. Prev. 2004, 36, 637–647. [Google Scholar] [CrossRef]
  8. Billet, Y. Detection of wet road conditions in the new generation of the 911. In 10th International Munich Chassis Symposium 2019; Pfeffer, P., Ed.; Springer Vieweg: Wiesbaden, Germany, 2020. [Google Scholar] [CrossRef]
  9. Riahi, E.; Edjeou, W.; Buisson, S.; Gennesseaux, M.; Do, M.-T. Estimation of water depth on road surfaces using accelerometric signals. Sensors 2022, 22, 8940. [Google Scholar] [CrossRef]
  10. Ling, J.; Yang, F.; Zhang, J.; Li, P.; Uddin, M.I.; Cao, T. Water-film depth assessment for pavements of roads and airport runways: A review. Constr. Build. Mater. 2023, 392, 132054. [Google Scholar] [CrossRef]
  11. Xiao, K.; Hui, B.; Qu, X.; Wang, H.; Diab, A.; Cao, M. Asphalt pavement water film thickness detection and prediction model: A review. J. Traffic Transp. Eng. (Engl. Ed.) 2023, 10, 349–367. [Google Scholar] [CrossRef]
  12. Ma, Y.; Wang, M.; Feng, Q.; He, Z.; Tian, M. Current Non-Contact Road Surface Condition Detection Schemes and Technical Challenges. Sensors 2022, 22, 9583. [Google Scholar] [CrossRef] [PubMed]
  13. Flintsch, G.W.; Tang, L.; Katicha, S.W.; de León Izeppi, E.; Viner, H.; Dunford, A.; Nesnas, K.; Coyle, F.; Sanders, P.; Gibbons, R.B.; et al. Splash and Spray Assessment Tool Development Program; Final Report, DTFH61-08-C-00030; FHWA: Washington, DC, USA, 2014; Available online: https://vtechworks.lib.vt.edu/handle/10919/50550 (accessed on 26 July 2019).
  14. Koppa, R.J.; Zimmer, R.A.; Ivey, D.L.; Pendleton, O. Heavy Truck Splash and Spray Testing: Phase I; Texas Transportation Institute, Texas A&M University: College Station, TX, USA, 1984; Available online: https://static.tti.tamu.edu/tti.tamu.edu/documents/TTI-1984-ID19437.pdf (accessed on 9 November 2021).
  15. Weir, D.H.; Strange, J.F.; Heffley, R.K. Reduction of Adverse Aerodynamic Effects of Large Trucks; Report FHWA-RD-79-84; Federal Highway Administration: Washington, DC, USA, 1978. Available online: https://rosap.ntl.bts.gov/view/dot/753 (accessed on 10 November 2021).
  16. Maycock, G. The Problem of Water Thrown Up by Vehicles on Wet Roads; Road Research Laboratory: Wokingham, UK, 1966. [Google Scholar]
  17. Döring, J.; Beering, A.; Scholtyssek, J.; Krieger, K.-L. Road Surface Wetness Quantification Using a Capacitive Sensor System. IEEE Access 2021, 9, 145498–145512. [Google Scholar] [CrossRef]
  18. Alonso, J.; López, J.M.; Pavón, I.; Recuero, M.; Asensio, C.; Arcas, G.; Bravo, A. On-board wet road surface identification using tyre/road noise and Support Vector Machines. Appl. Acoust. 2014, 76, 407–415. [Google Scholar] [CrossRef]
  19. Schmiedel, B.; Gauterin, F.; Unrau, H.-J. Study of System Layouts for Road Wetness Quantification via Tire Spray. Automot. Engine Technol. 2019, 4, 63–73. [Google Scholar] [CrossRef]
  20. Schmiedel, B.; Gauterin, F. Tire Splash and Spray Directly before and during Hydroplaning. Tire Sci. Technol. 2019, 47, 141–159. [Google Scholar] [CrossRef]
  21. Fwa, T.F. Determination and prediction of pavement skid resistance–connecting research and practice. J. Road Eng. 2021, 1, 43–62. [Google Scholar] [CrossRef]
  22. Guo, F.; Pei, J.; Zhang, J.; Li, R.; Zhou, B.; Chen, Z. Study on the skid resistance of asphalt pavement: A state-of-the-art review and future prospective. Constr. Build. Mater. 2021, 303, 124411. [Google Scholar] [CrossRef]
  23. Moore, D.F. A review of squeeze films. Wear 1965, 8, 245–263. [Google Scholar] [CrossRef]
  24. Ong, G.P.; Fwa, T.F. Prediction of Wet-Pavement Skid Resistance and Hydroplaning Potential. Transp. Res. Rec. 2007, 2005, 160–171. [Google Scholar] [CrossRef]
  25. Zhu, X.; Yang, Y.; Zhao, H.; Jelagin, D.; Chen, F.; Gilabert, F.A.; Guarin, A. Effects of surface texture deterioration and wet surface conditions on asphalt runway skid resistance. Tribol. Int. 2021, 153, 106589. [Google Scholar] [CrossRef]
  26. Jiang, B.; Wang, H. An integrated analytical model for friction characteristics of aircraft tire on wet runway pavement. Tribol. Int. 2023, 185, 108501. [Google Scholar] [CrossRef]
  27. Zhao, L.; Zhao, H.; Cai, J. Tire-pavement friction modeling considering pavement texture and water film. Int. J. Transp. Sci. Technol. 2023, in press. [Google Scholar] [CrossRef]
  28. ISO 13473-1; Characterization of Pavement Texture by Use of Surface Profiles—Part 1: Determination of Mean Profile Depth. International Standard Organization: Geneva, Switzerland, 1997.
  29. Moore, D.F. A theory of viscous hydroplaning. Int. J. Mech. Sci. 1967, 9, 797–810. [Google Scholar] [CrossRef]
  30. Otxoterena, A.F.; Drake, P.; Willstrand, O.; Andersson, A.; Biswanger, H. Physical characteristics of splash and spray clouds produced by heavy vehicles (trucks and lorries) driven on wet asphalt. J. Wind. Eng. Ind. Aerodyn. 2021, 217, 104734. [Google Scholar] [CrossRef]
  31. Holzwarth, F.; Eichhorn, U. Non-contact sensors for road conditions. Sens. Actuators A Phys. 1993, 37–38, 121–127. [Google Scholar] [CrossRef]
  32. EN 13036-4:2011; Road and Airfield Surface Characteristics. Test Methods Method for Measurement of Slip/Skid Resistance of a Surface: The Pendulum Test. CENELEC (European Committee for Electrotechnical Standardization): Brussels, Belgium, 2011.
  33. CEN/TS 15901-6:2009; Road and Airfield Surface Characteristics—Part 6: Procedure for Determining the Skid Resistance of a Pavement Surface by Measurement of the Sideway Force Coefficient (SFCS): SCRIM®. CENELEC (European Committee for Electrotechnical Standardization): Brussels, Belgium, 2009.
  34. Koppa, R.J.; Pezoldt, V.J.; Zimmer, R.A.; Deliman, M.N.; Flowers, R. Development of a Recommended Practice for Heavy Truck Splash and Spray Evaluation; Texas Transportation Institute, Texas A&M University: College Station, TX, USA, 1990; Available online: https://static.tti.tamu.edu/tti.tamu.edu/documents/TTI-1990-ID19793.pdf (accessed on 26 October 2023).
Figure 1. Definitions of a water depth: (a) above asperity depth; (b) mean depth.
Lubricants 12 00002 g001
Figure 2. Water flows corresponding to splash and spray (the tire travelling from right to left).
Lubricants 12 00002 g002
Figure 3. Implementation of accelerometers on the wheel arch liner: (a) photo (the white dotted circles indicate the location of the accelerometers; (b) illustration (the travel direction is from the right to the left).
Lubricants 12 00002 g003
Figure 4. Sensors used to measure water depths: (a) principle of the sensor; (b) sensor mounted on the test car.
Lubricants 12 00002 g004
Figure 5. Test tracks: (a) test surfaces (from top to bottom: fine asphalt concrete, sand asphalt, asphalt concrete); (b) wetting system.
Lubricants 12 00002 g005
Figure 6. Variation in water depth with measurement time at 40 km/h: (a) Fine asphalt concrete surface; (b) asphalt concrete surface.
Lubricants 12 00002 g006
Figure 7. Examples of filtered signals (measurements performed on fine asphalt concrete surface at 40 km/h): (a) dry; (b) wet.
Lubricants 12 00002 g007
Figure 8. Variation in acceleration amplitude with water depth for two locations of the accelerometers (measurements performed on fine asphalt concrete surface).
Lubricants 12 00002 g008
Figure 9. Variation in acceleration amplitude with water depth at different speeds (measurements performed on fine asphalt concrete surface).
Lubricants 12 00002 g009
Figure 10. Comparison of the variation in acceleration amplitude–water depth between the three test surfaces: (a) at 25 km/h; (b) at 60 km/h.
Lubricants 12 00002 g010
Figure 11. Fitting of the exponential model on experimental data (measurements performed on sand asphalt surface).
Lubricants 12 00002 g011
Figure 12. Illustration of the possibility to fit the same theoretical model to data of the three test surfaces (example shown for data at 60 km/h).
Lubricants 12 00002 g012
Figure 13. Fitting of the modified exponential model on experimental data: (a) fine asphalt concrete; (b) sand asphalt; (c) asphalt concrete; (d) comparison between the three test surfaces at 60 km/h (acronyms FAC, SA, and AC correspond to initials of the surfaces’ names).
Lubricants 12 00002 g013
Figure 14. Relationship between the modified model’s parameters and the test speed: (a) a01; (b) a11.
Lubricants 12 00002 g014
Table 1. Characteristics of the test surfaces.
SurfaceMTD
(mm)
MPD
(mm)
PTVSFC
Fine asphalt concrete0.380.41620.84
Sand asphalt0.840.97500.70
Asphalt concrete1.141.05450.52
Table 2. Mix composition of the test surfaces (the numbers express percentages of the total mass).
SurfaceAggregatesBitumen
<0/2 mm0/2 mm0/4 mm2/6 mm4/10 mm6/10 mm
Fine asphalt concrete2.456.7 10.4 25.05.5
Sand asphalt 42.2 51.6 6.2
Asphalt concrete0.932.0 28.3 33.05.8
Table 3. Values of parameters a01, a11, and a21.
Speed (km/h)Parameters
a01 (m/s2)a11 (mm)a21 (mm)
All surfacesFine asphalt concreteSand asphaltAsphalt concrete
250.50.19800.20.13
300.70.15200.20.13
401.30.13900.20.13
501.70.13200.20.1
6020.13300.160.09
702.20.13000.160.08
Disclaimer/Publisher’s Note: The statements, opinions and data contained in all publications are solely those of the individual author(s) and contributor(s) and not of MDPI and/or the editor(s). MDPI and/or the editor(s) disclaim responsibility for any injury to people or property resulting from any ideas, methods, instructions or products referred to in the content.